
Stratification: An Entropic View of Society’s Structure
by
 , , ,
, , ,
G.-Fivos Sargentis
* ,
,
Theano Iliopoulou
 ,
,
Panayiotis Dimitriadis
,
Nikolaos Mamassis
and
Demetris Koutsoyiannis

Laboratory of Hydrology and Water Resources Development, School of Civil Engineering, National Technical University of Athens, Heroon Polytechneiou 9, 157 80 Zographou, Greece
*
Author to whom correspondence should be addressed.
World 2021, 2(2), 153-174; https://0-doi-org.brum.beds.ac.uk/10.3390/world2020011
Submission received: 25 February 2021
/
Revised: 23 March 2021
/
Accepted: 26 March 2021
/
Published: 30 March 2021
Abstract
:In human societies, we observe a wide range of types of stratification, i.e., in terms of financial class, political power, level of education, sanctity, and military force. In financial, political, and social sciences, stratification is one of the most important issues and tools as the Lorenz Curve and the Gini Coefficient have been developed to describe some of its aspects. Stratification is greatly dependent on the access of people to wealth. By “wealth”, we mean the quantified prosperity which increases the life expectancy of people. Prosperity is also connected to the water-food-energy nexus which is necessary for human survival. Analyzing proxies of the water-food-energy nexus, we suggest that the best proxy for prosperity is energy, which is closely related to Gross Domestic Product (GDP) per capita and life expectancy. In order to describe the dynamics of social stratification, we formulate an entropic view of wealth in human societies. An entropic approach to income distribution, approximated as available energy in prehistoric societies, till present-day economies, shows that stratification can be viewed as a stochastic process subject to the principle of maximum entropy and occurring when limits to the wealth of society are set, either by the political and economic system and/or by the limits of available technology.
«τῷ γὰρ ἔχοντι παντὶ δοθήσεται καὶ περισσευθήσεται, ἀπὸ δὲ τοῦ μὴ ἔχοντος καὶ ὃ ἔχει ἀρθήσεται ἀπ αὐτοῦ» (Καινή Διαθήκη, Κατά Ματθαίον 25:29) [1]
“For everyone who has, will be given more, and he will have an abundance. Whoever does not have, even what he has will be taken from him.” (New Testament, Matthew 25:29)
1. Introduction
Social stratification in the history of human societies occurs persistently and organically, as if it obeys a natural law. There is a wide range of types of stratification in societies, i.e., in terms of financial class, political power, level of education, sanctity, and military force. In economic, political, and social sciences, stratification is one of the most important issues [2,3].
After the Middle Ages, emblematic approaches examining social stratification were formulated, the most widely known are those of Adam Smith (1723–1890), David Ricardo (1772–1823), Thomas Robert Malthus (1766–1834), Social Darwinists (late 1800s), and Karl Marx (1818–1883).
Smith noted that “wherever there is great property, there is great inequality, for one very rich man, there must be at least five hundred poor”. He also pointed out the important role of morality in social functioning and noted that without the welfare of the laboring classes the prosperity of the nation is both morally unacceptable and practically impossible [4,5].
Unlike Smith, Ricardo supported the iron law of wages [6], according to which working-class wages must be fixed at a “natural price” that would only cover the costs of marginal survival, arguing that, from prehistoric times, most grangers also lived in misery [7]. Exceeding Ricardo’s cynicism, Malthus suggested that the most effective solution would be the abandonment and natural extermination of malnourished people claiming that population growth acted as a deterrent to the progress of a society because the population was supposedly much larger than what the earth could sustain [8].
Herbert Spencer (1820–1903) and Francis Galton (1822–1911), inspired by Charles Darwin’s propositions that are described in “Origin of Species” (1859) [9], advocated the concept of survival of the fittest in the social world, an approach called Social Darwinism (n.b., Galton was also the father of eugenics). According to this, the state should not interfere in the spontaneous processes of society, leaving the ‘strongest’ people to survive and the ‘weak’ to perish, which would presumably lead to ever higher levels of society’s development [10,11].
Subverting the prevailing theories, Marx argued that social classes were formed unnaturally during the historical period of humankind as a result of extreme material inequalities created by the over-exploitation of the working-class labor by the owners of the means of production [12]. Thus, he formulated the rule “From each according to his ability, to each according to his needs” [13,14]. Another influential economic approach of the last century was presented by John Keynes (1883–1946) in “The General Theory of Employment, Interest and Money” [15]. Arguably, the prevailing theory of modern times is neoliberalism, a policy model that emphasizes the value of free market competition. The theory was supported by the Chicago School and notably expressed by the works of Milton Friedman (1912–2006) [16] and Friedrich Hayek (1899–1992) [17]. Critiques on neoliberalism have been expressed pertaining to its relation with inequality, e.g., as described by Zoya Hasan in “Democracy and the crisis of inequality” [18] and Walter Rodney (1942–1980) in “How Europe Underdeveloped Africa” [19].
In economic analysis, common tools to show stratification are the Lorenz Curve [20,21,22] and the Gini Coefficient [23,24,25], which have been developed to describe the income distribution [26,27,28,29]. There are several famous financial approaches and analyses of the world’s income distribution [30,31] which led to new economical-mathematical and philosophical formulations [32]. Perhaps the most famous of the related mathematical inventions is the Pareto distribution, originally formulated by Vilfredo Pareto to describe the power-law type distribution of land-ownership in society [33]. Today, the Pareto distribution has become a standard tool in financial analysis, e.g., [34].
Entropy has also been used in many related books and papers, within various approaches describing society. Ryu [35] presents an information efficient technique to determine the functional forms of income distributions using maximum entropy estimation of income distributions. In another paper by Ryu [36], a bottom poor sensitive Gini coefficient (pgini) is defined by replacing income observations with their reciprocal values in the Gini coefficient using maximum entropy estimation of income shares. Fu et al. [37], using entropy divergence methods, seek a probability density function solution that is as close to a uniform probability distribution of income. Dinga et al. [38] introduce a new concept of social entropy and a new concept of social order, both based on the normative framework of society. From these two concepts, typologies (logical and historical) of societies are inferred and examined in terms of their basic features. Davis [39] brings out how the physical/mathematical notions of entropy can be usefully imported into the social sphere. Mayer et al. [40], based on entropic unit free measures, such as Shannon entropy, provide a theoretical framework for studying the dynamics of coupled human and natural systems. Johansson [41] relates entropy with the complexity of a number of products, as represented by the number of their functional parts, to their actual economic value. Neto et al. [42] describe an elementary process of social interaction exploring a particular concept, “social entropy”, i.e., how social systems deal with uncertainty and unpredictability in the transition from individual actions to systems of interaction. Mavrofides et al. [43] shed light on the notions of entropy and energy as conceived in the theoretical framework of social sciences.
In this paper we make the working hypothesis that the social stratification is related to the principle of maximum entropy. We try to investigate the entropic characteristics of societies and examine whether stratification is a process consistent to the principle of maximum entropy. In order to see this, we investigate the income distribution in prehistory and antiquity, and we validate it from an entropic viewpoint. We choose the entropic view because according to Koutsoyiannis:
Entropy and its ability to increase (as contrasted to energy and other quantities that are conserved) is the driving force of change. This property of entropy has seldom been acknowledged; instead in common perception entropy is typically identified with disorganization and deterioration as if change can only have negative consequences [44].
Social structures are constantly changing, and this property of entropy is essential in order to understand and predict these changes.
For this evaluation we formulate and use the tools of total entropy of income distribution which, as we show, is related to Gross Domestic Product (GDP) per capita (the best-known growth index) and an entropic index of inequality, ΔΦ, which is correlated with the Gini index, but shows more robust performance. Both of them are validated by real-world income data. Note that underlined symbols denote random variables.
In order to study stratification in prehistory and antiquity, we have to define the wealth in these periods in non-monetary values. To this end, we study the water-food-energy nexus, which is necessary for human survival. From these three variables, data show that the best proxy for prosperity is energy, as energy is best correlated with life expectancy and GDP per capita and, on top, can be reliably estimated in the prehistory and antiquity, which, e.g., cannot be done in the case of food.
Anthropologists believe that, in prehistory, humans lived as nomads without stratification [45,46,47,48], or with a faint one [49]. Hunter-Gathers needed a small amount of energy to collect food, but, when they clustered in agricultural societies, energy needs were increased. Therefore, they used animals to cover new needs and produce surplus energy. This signifies a new technology which, however, is limited by a rather low technological limit. Assuming egalitarian society and equal distribution of energy per capita in Hunter-Gatherers, we see that, if we assume more energy and maximize entropy, society’s structure follows an exponential stratification. This fact is consonant to Surplus Theory of Social Stratification [50,51] as “the equal distribution of wealth in societies with surpluses is so rare as to be almost non-existent” [52]. Interestingly, extreme stratification occurs in much later periods of fast-growing technological limit and installation of new energy sources, such as the period of mercantilism and the industrial revolution.
In order to investigate the dynamics of income distribution in entropic terms, we evaluate current economic data. First, we compare data from United Kingdom and Sweden in the period 1970–2010, i.e., from two totally different countries in terms of political orientation (neoliberal-social democratic). Results show characteristic differences and insights which are not derived by the usual financial tools as GDP per capita, Lorenz Curve and Gini coefficient. By another evaluation, we revisit the Greek financial crisis, seeing that, after First Memorandum [53] in 2010, the total entropy reduced abruptly and followed by a new immigration type, known as brain-drain [54], targeting the United Kingdom, a country with much higher entropy.
The remaining of the paper is structured in the following sections. In Section 2, we evaluate the aspects of the water-food-energy nexus as proxies for wealth concluding that the best proxy for wealth in prehistory is energy per capita. In Section 3, we analyze the characteristics of income inequality from prehistory till the present day and formulate two new entropic measures, an index of growth and an index of inequality. In Section 4, we discuss the results of the evaluation in view of the principle of maximum entropy, whereas we draw conclusions and discuss wider scientific reflections in Section 5.
2. Prosperity: The True Wealth
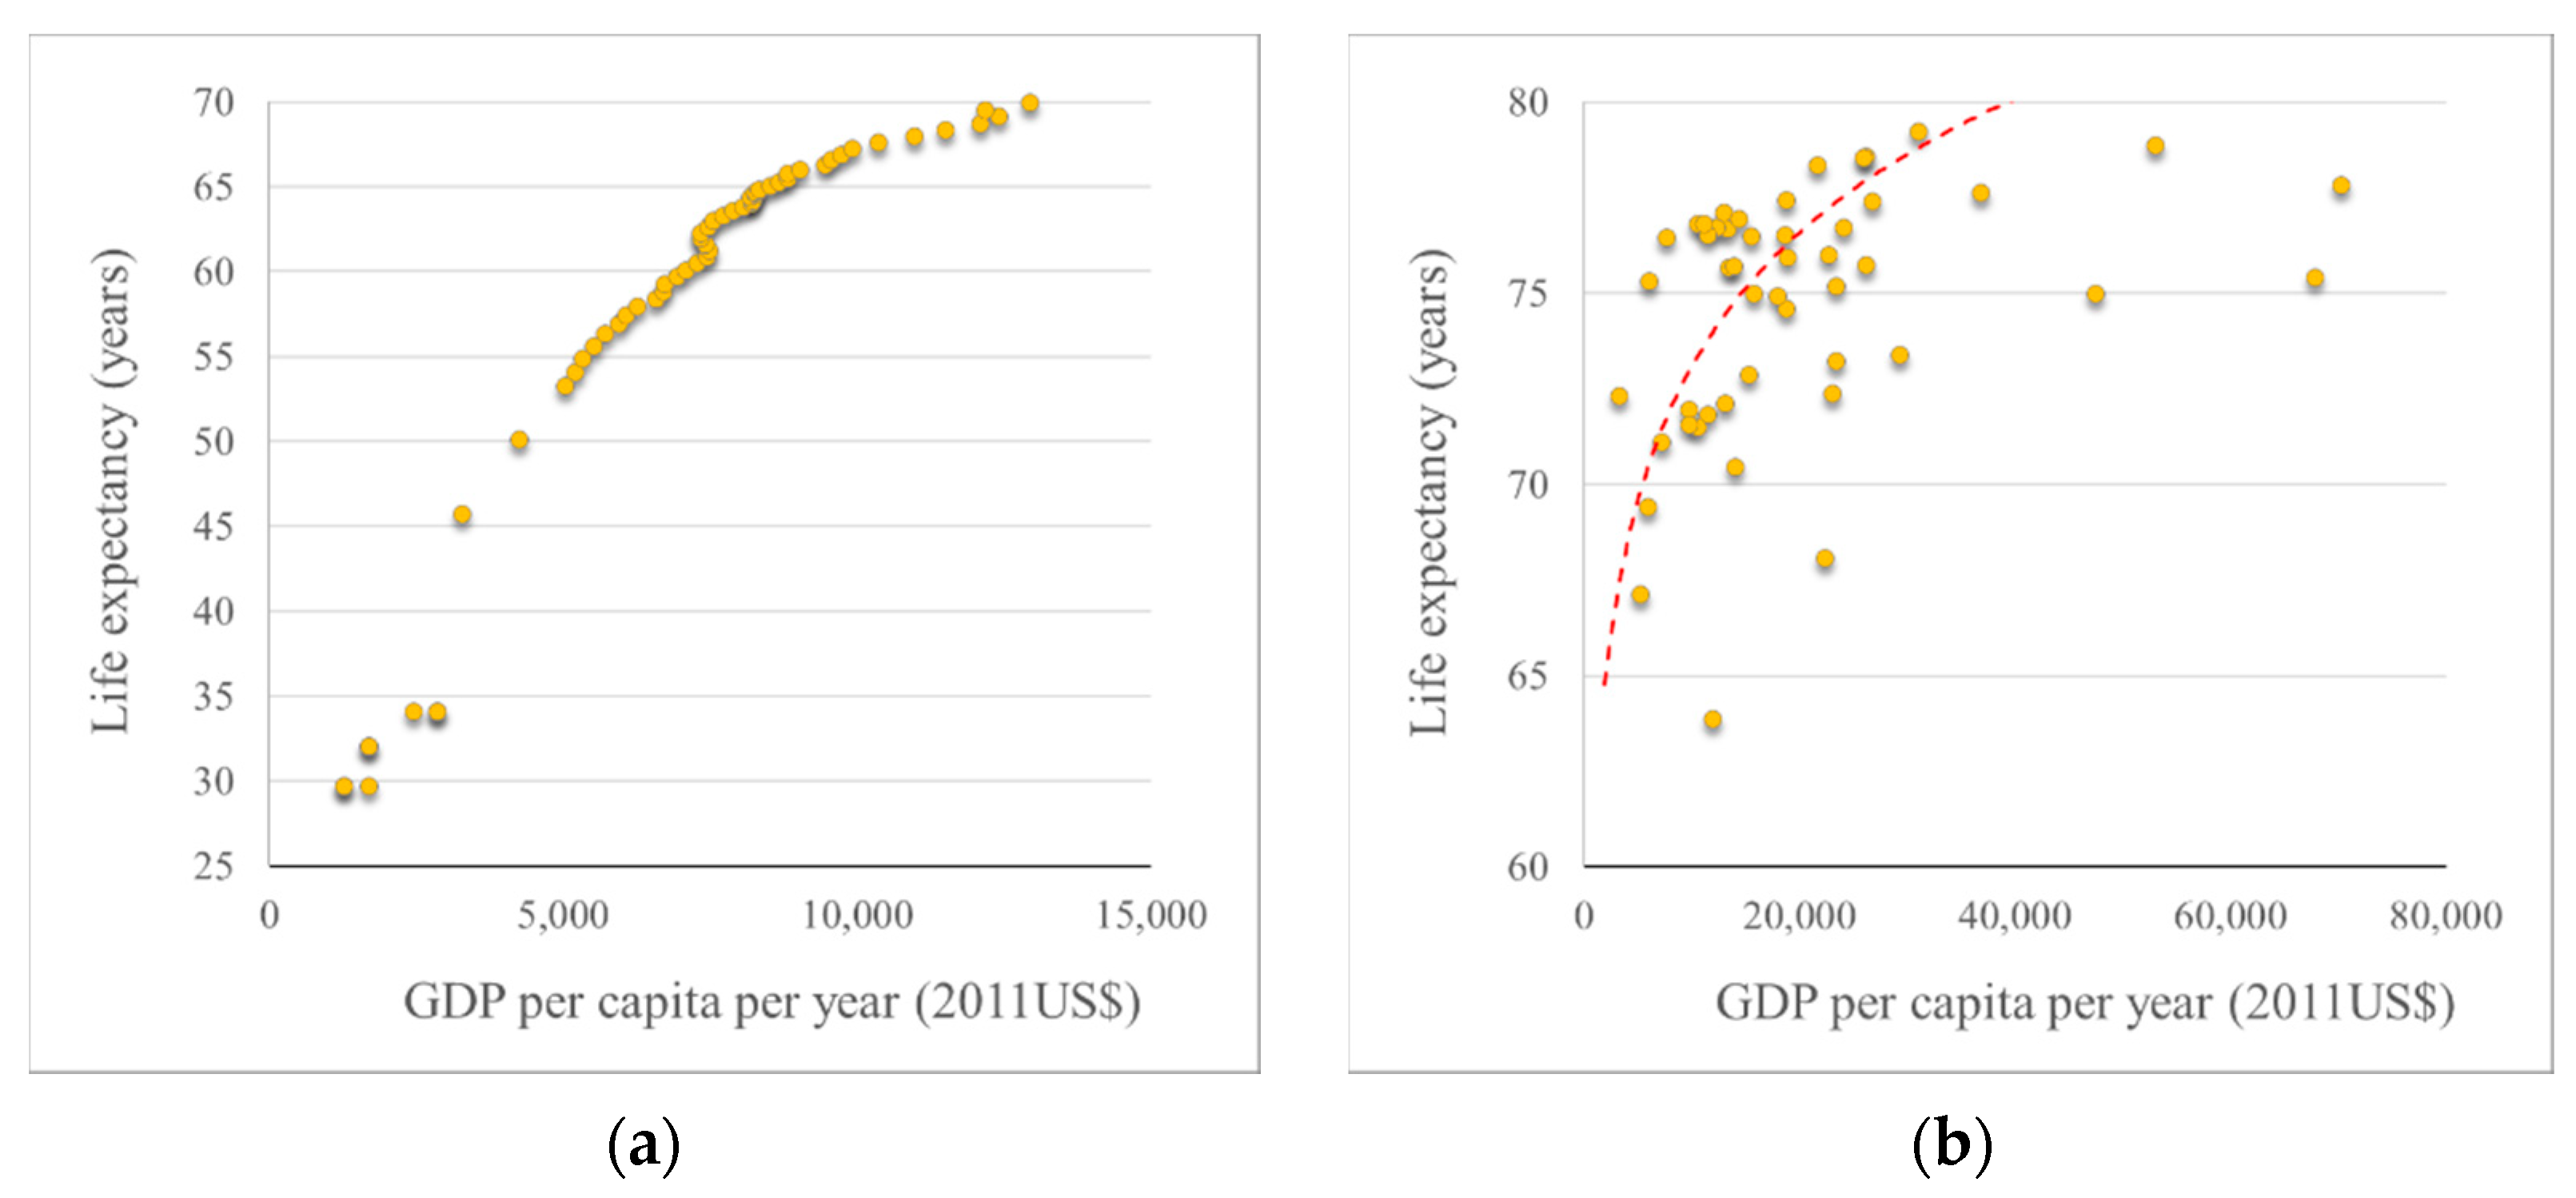
Stratification is dependent on the access of people to wealth. By “wealth”, we mean the quantified prosperity which increases the life expectancy of people, e.g., as seen for GDP (Figure 1a,b). In this regard, Confucius famously said that “the first wealth is health” [55,56].
Prosperity is also connected to the water-food-energy nexus which is necessary for human survival. According to the United Nations report [57], “Agriculture is the largest consumer of the world’s freshwater resources, and more than one-quarter of the energy used globally is expended on food production and supply.” Therefore, we investigate separately each aspect of the nexus to assess its relevance as an index of prosperity, here studied through the GDP per capita.
2.1. Water
Although the withdrawal of water has been globally increased over the last 100 years, since the population is growing just as fast, it appears that the water withdrawal per capita has remained almost stable (Figure 2a). It is also seen that water withdrawal per capita is not a good proxy of the GDP per capita, as the data show a big scatter (Figure 2b). This may be explained considering natural factors, such as the climate and the economical profile, of each country [59].
On the other hand, municipal water withdrawal shows a weak correlation to GDP, as access to water is not evenly distributed and people who live in richer countries with higher technological potential have better access (Figure 3). Still, in this case, as well, the statistical relationship is not very robust, as access to water is also greatly dependent on geographic location and climate. For these reasons, water is not evaluated here as the main indicator of prosperity. Yet, we note that water infrastructure is closely related to life expectancy because proper water supply and sanitation enhance public health.
2.2. Food
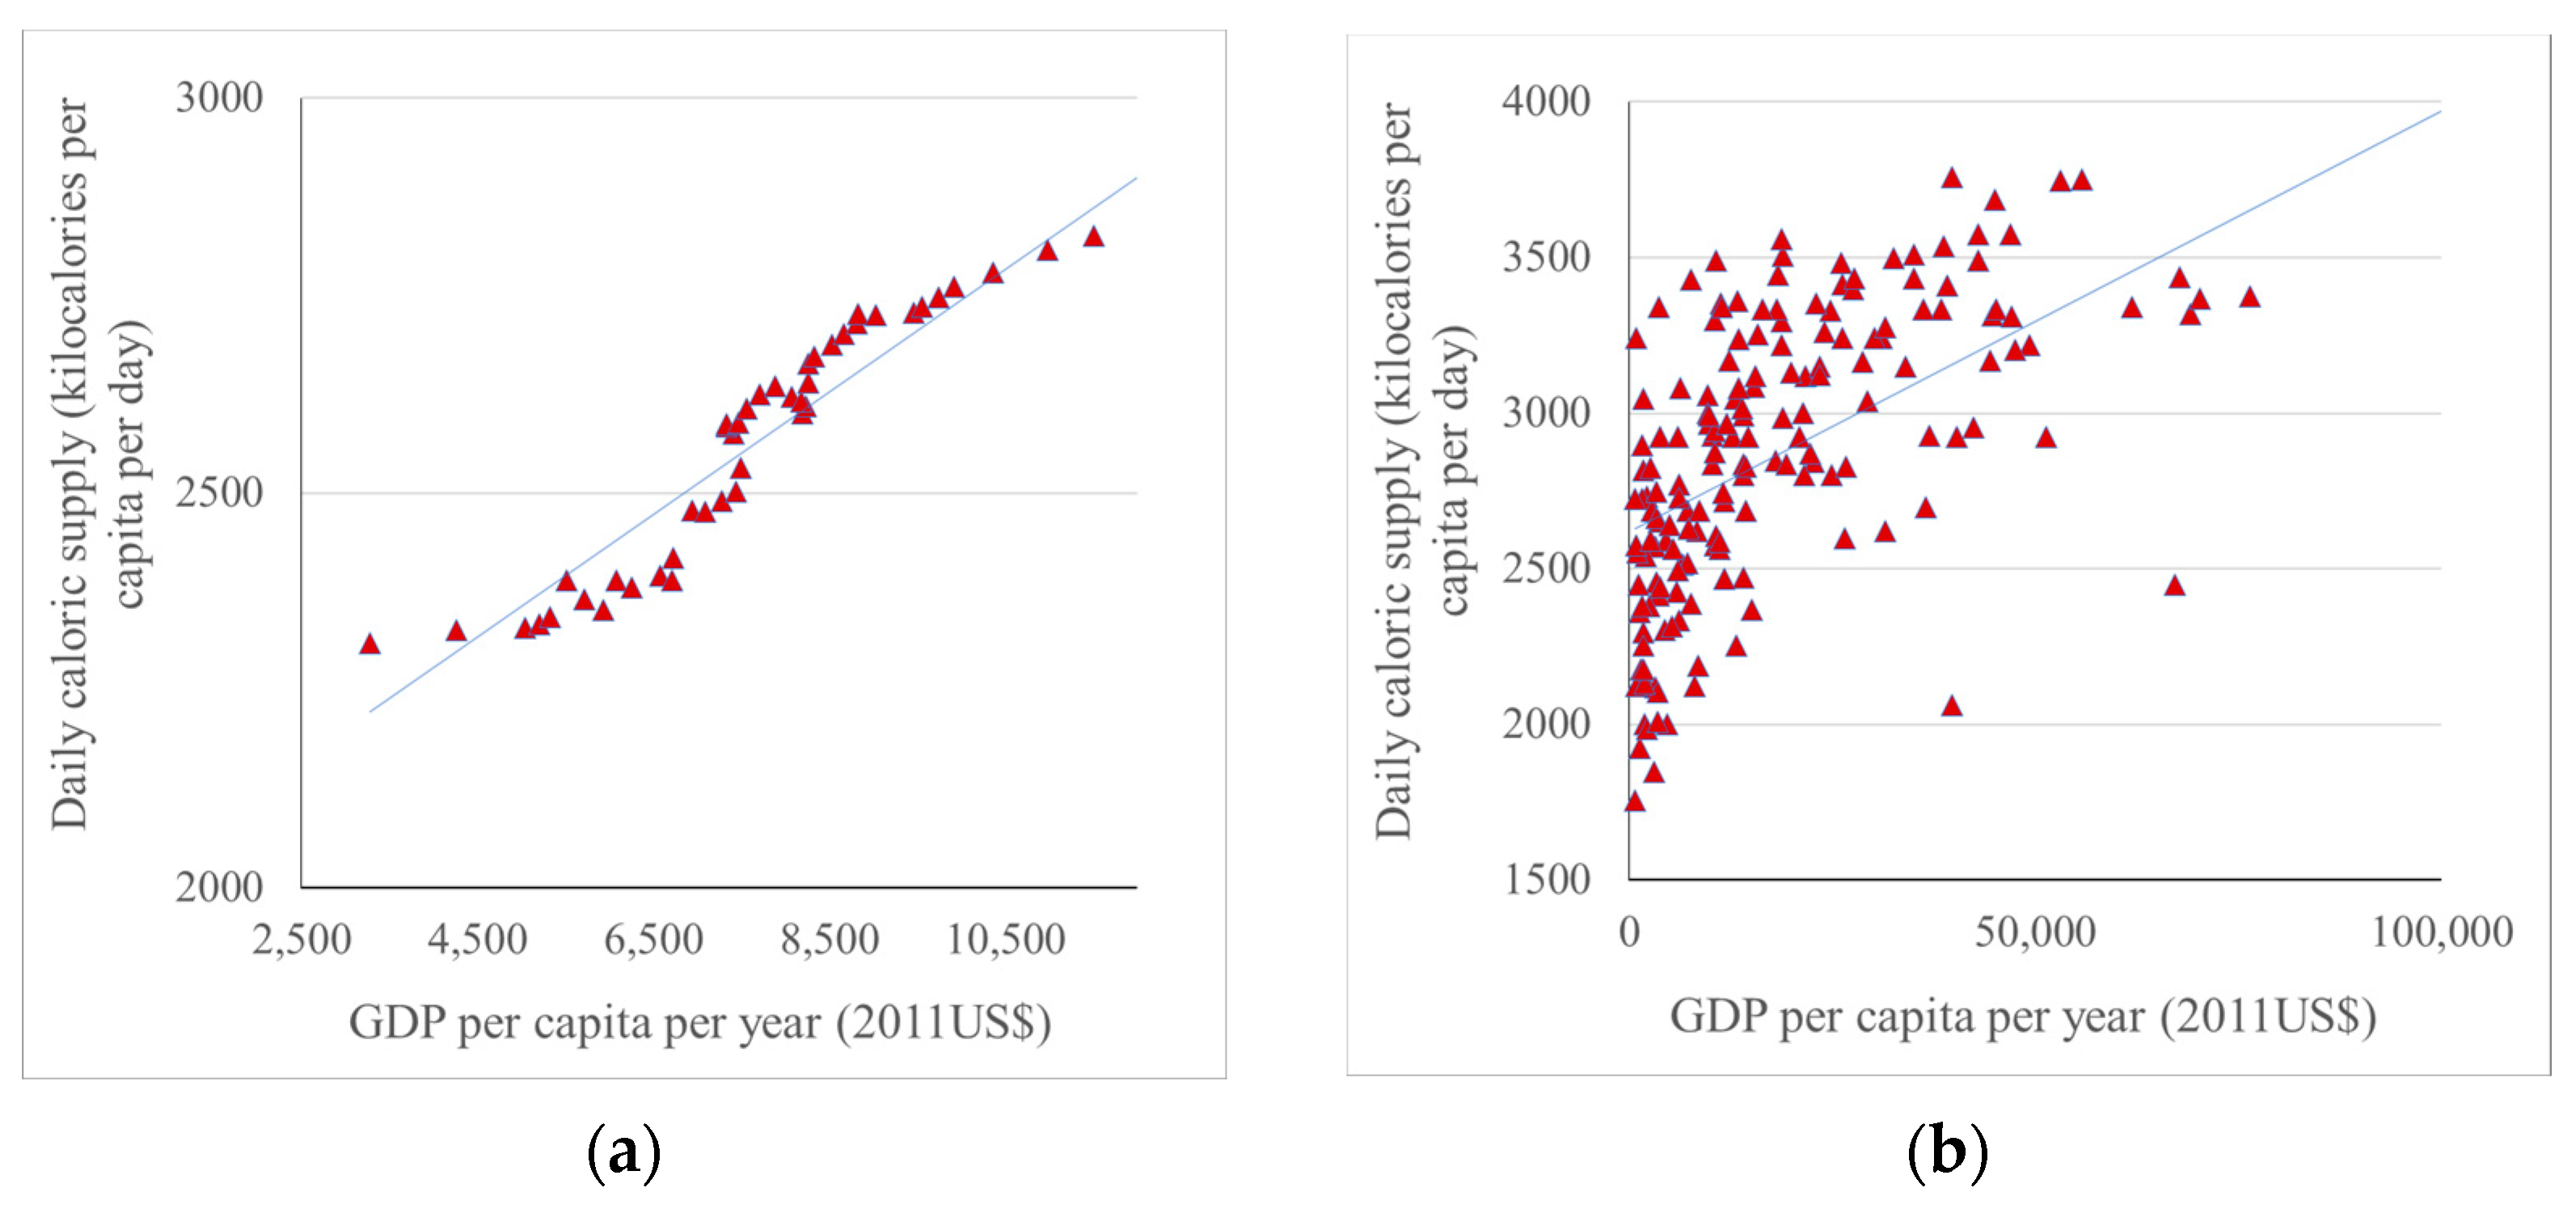
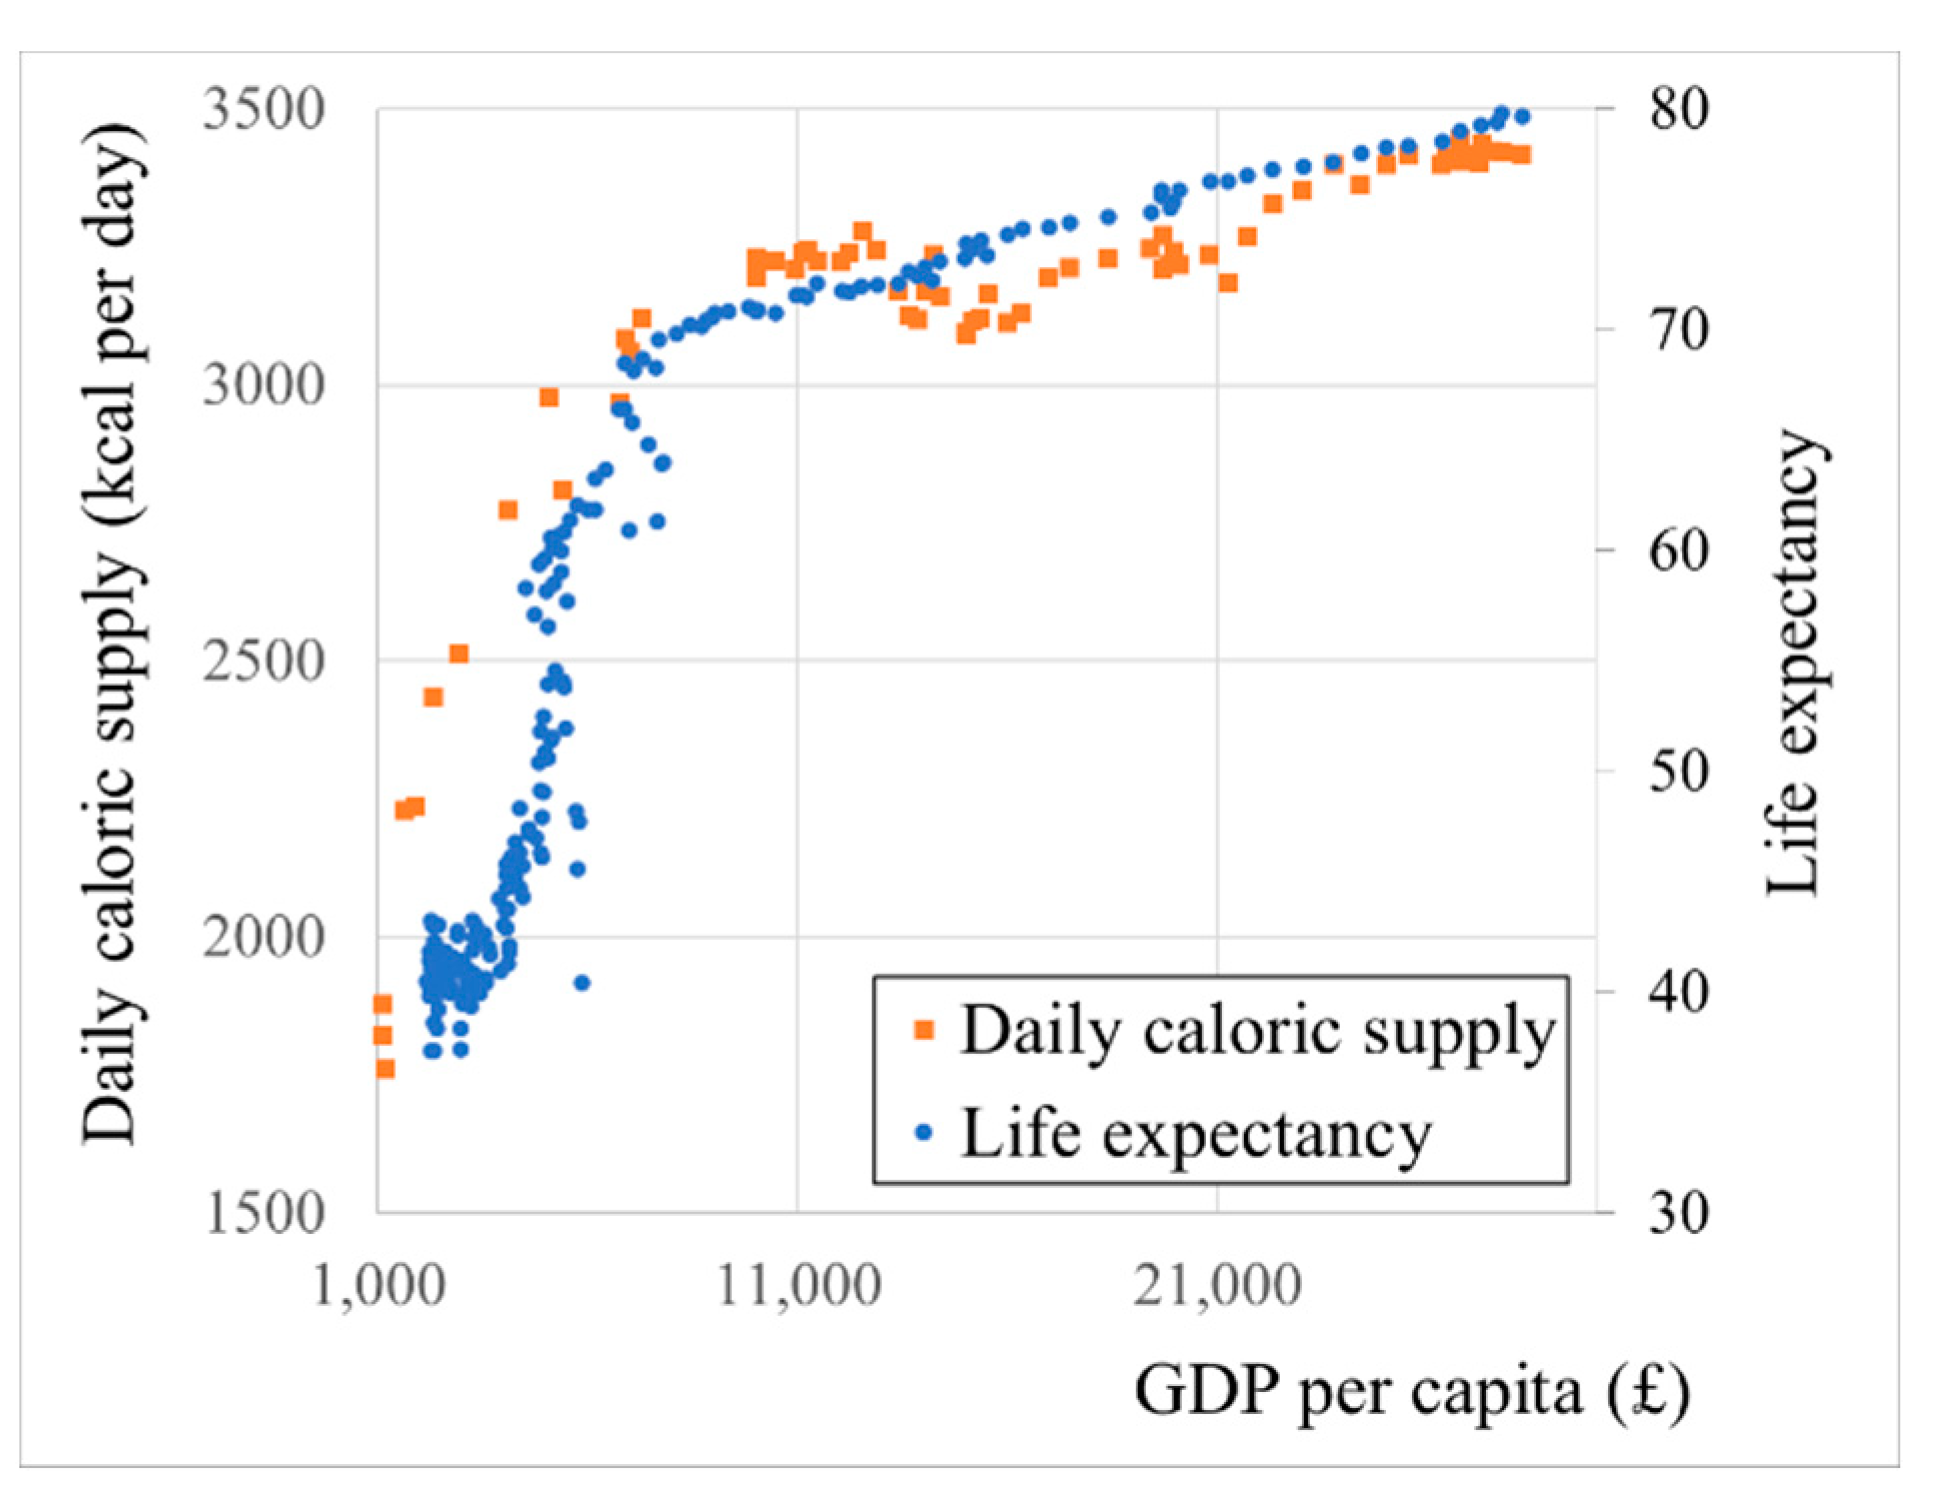
Contrary to water, food seems to be a more robust proxy for prosperity (Figure 4). It is obvious that, living prosperously (in terms of higher GDP) is associated with higher caloric supply, following the same pattern of GDP and life expectancy, as seen in the case of the United Kingdom (Figure 5). Even in this case, in which we have a long series of data, it is difficult to adjust this proxy to prehistory and antiquity as the food was related to the culture of living at the time, and relevant data are not readily available.
2.3. Energy
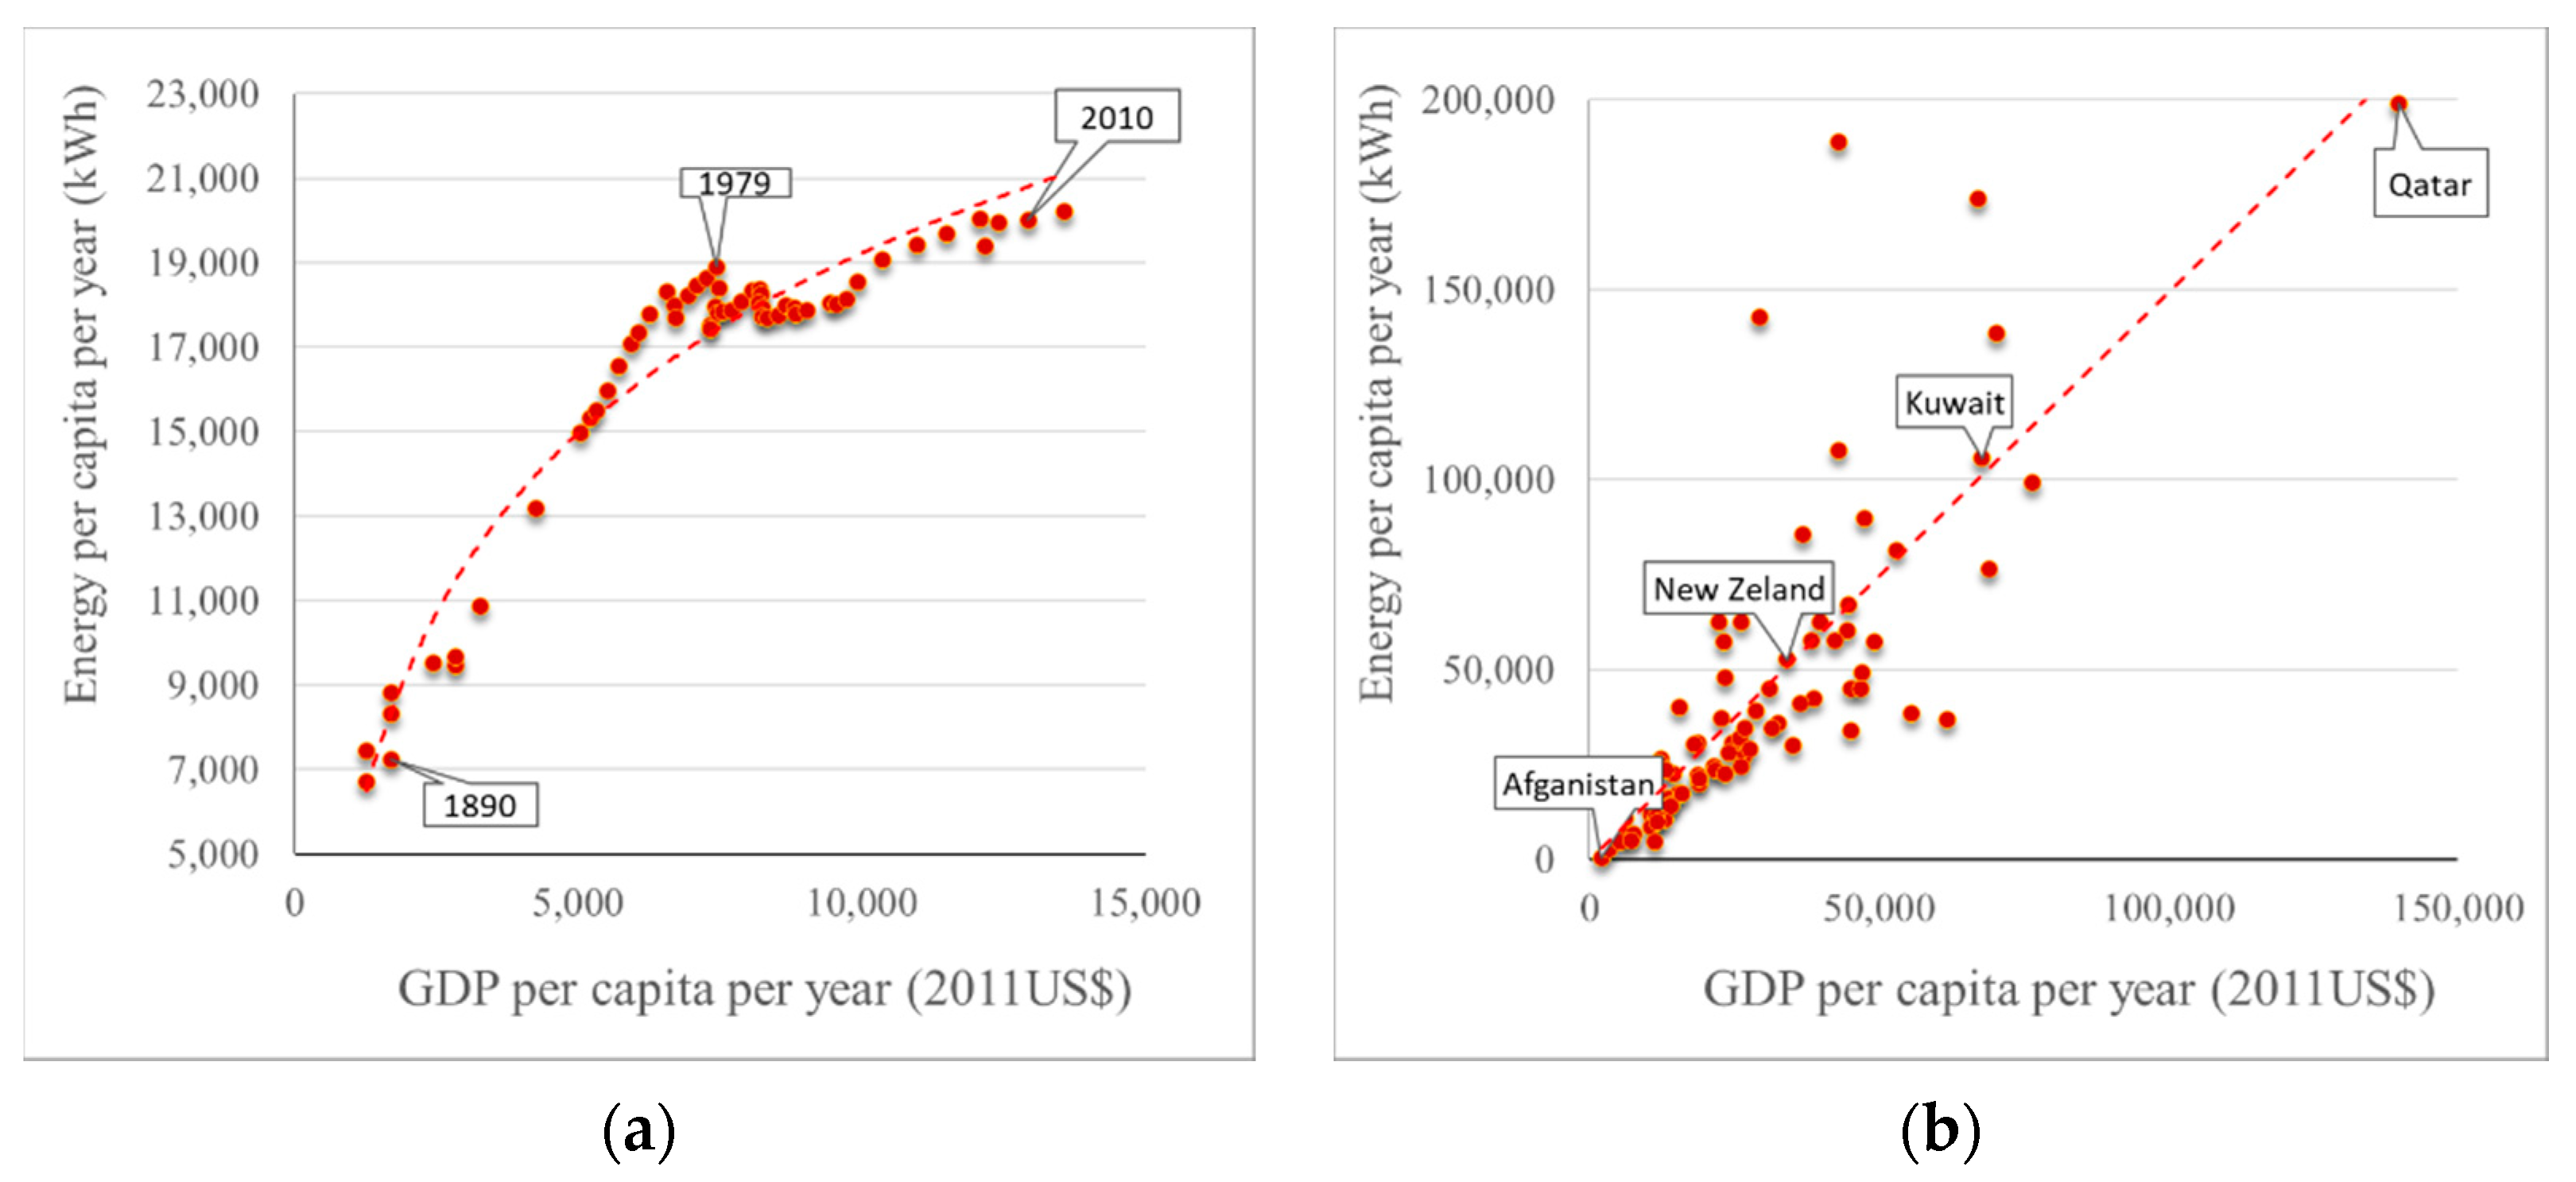
A clear correlation is observed in GDP per capita and energy consumption, as shown in Figure 6. Wilhelm Ostwald was the first who correlated energy consumption with life expectancy in 1909 [68]. As we know energy production and energy consumption in prehistory and antiquity, and we have strong indicators of the way of living [69,70,71,72], we employ the energy per capita as a substitute of income in these periods (Figure 6).
2.4. Validation of Energy as Proxy of Wealth
In the previous paragraphs we saw that, from the water-food-energy nexus, the proxy which is most robustly related to GDP per capital is energy. Thus, for the analysis of social stratification in prehistory and antiquity, instead of GDP per capita, we use energy consumption per capita.
3. Stratification and Entropy
3.1. Prehistorc Societies
In prehistory, humans lived in tribes (Hunter-Gatherers), having almost the same technological limit consisting of their own power (~120 W) and metabolized their food, ~2500 kcal, producing and using ~3 kWh per day to energy. So, energy in Hunter-Gatherers societies was equally distributed. Population was sparse and the natural resources were ample with ~100 ha sufficing to produce food for one human.
Generally, anthropologists assume that Hunter-Gatherers lived without stratification [48,49,50], but some approaches show that there was stratification in prehistory [51]. A related paper estimates average Gini coefficient, an overall measure of wealth inequality, assuming multiple parameters in Hunter-Gatherers, equal to 0.25 [49], which shows a faint stratification.
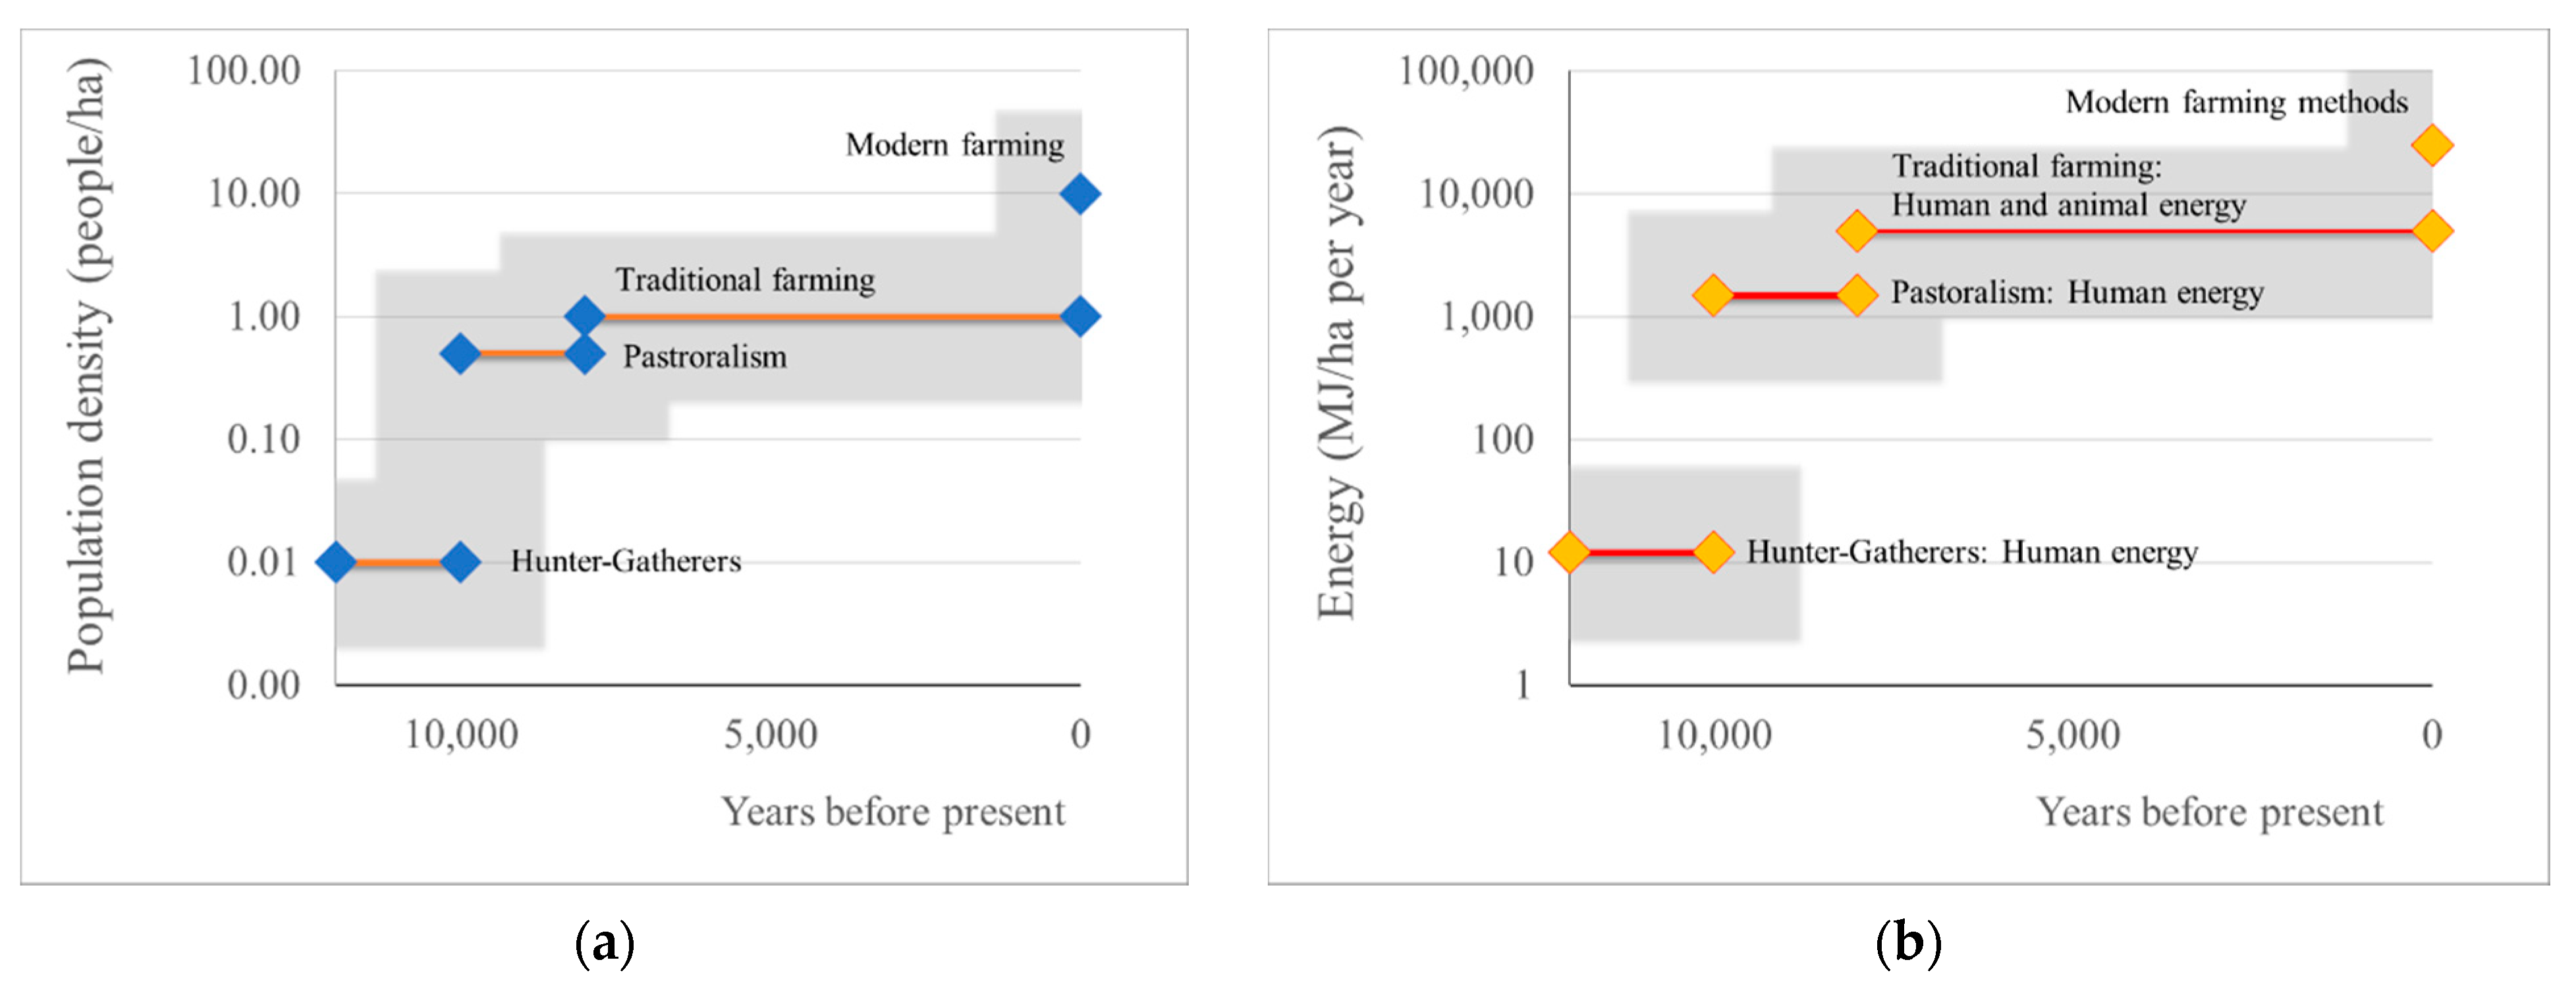
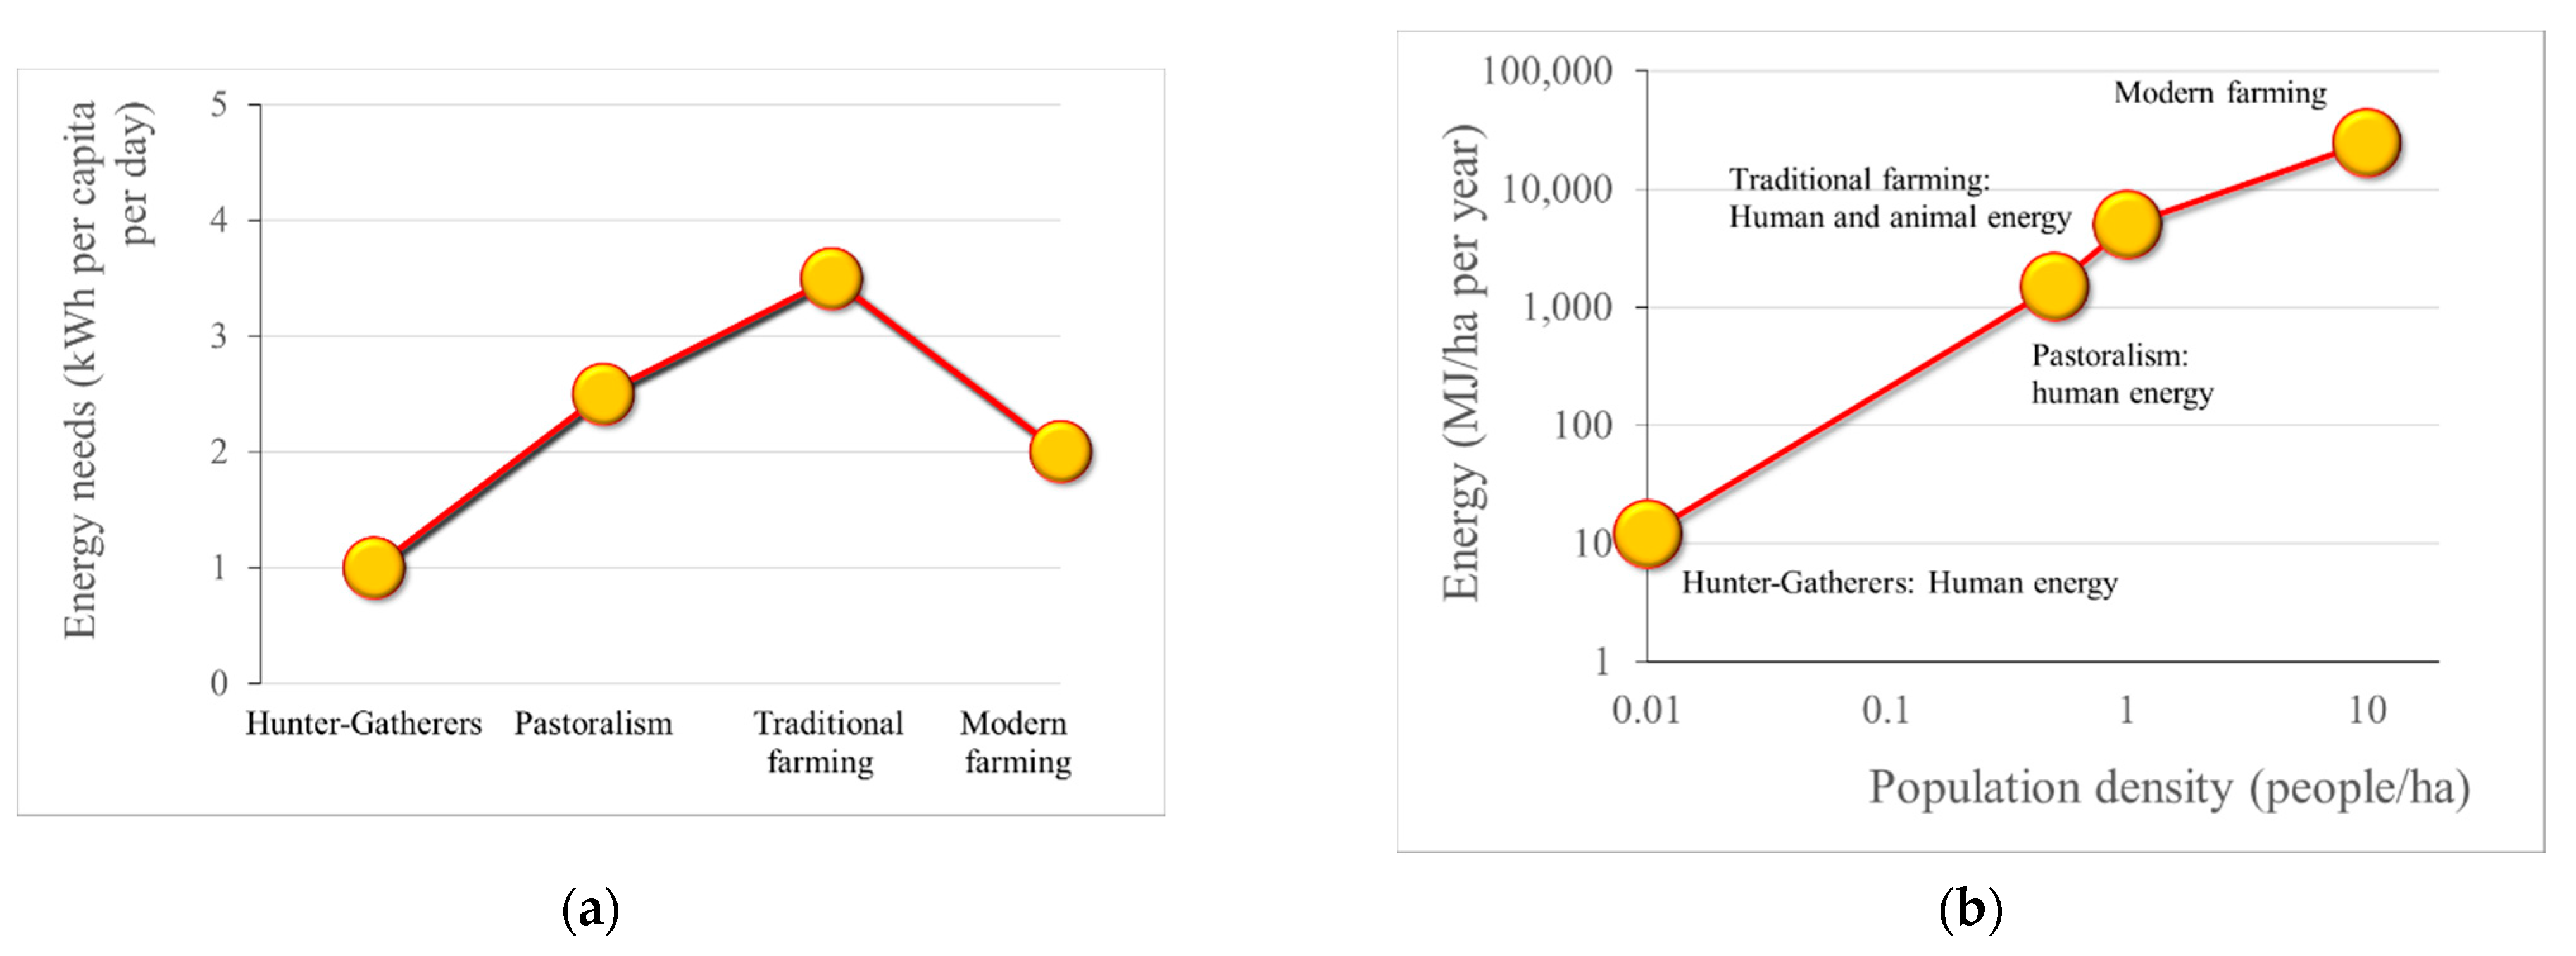
In order to cluster in tribes [77,78], humans had to use smaller areas to collect food. (Figure 8). In the period of pastoralism, humans were clustered 50 times more than Hunter-Gatherers, and, when traditional farming was developed, clustering increased respectively (Table 1). At the same time, energy required per ha was ~100 and ~200 times more (Figure 9) [75,76,79,80,81,82,83,84,85,86,87]. Sackett found that adults in foraging and horticultural societies work, on average, about 6.5 h a day, whereas people in agricultural societies work on average 8.8 h a day [88].
Table 1 shows that Hunter-Gathers needed a relatively small amount of their energy to collect food. Survival needs arising from human clustering are energy intensive, and more powerful means than humans, as horses and oxen (~500 W, ~10 times more) [75,76,89] were employed. The importance of energy becomes clear if we consider that since Homeric times the herd size (oxen or cattle) signified the wealth of a person. The unit of wealth measurement in Roman Empire was the head of an animal (Latin: capis), which bequeathed to us the term capital.
However, the clustering effect is also related to the environment (earth, weather), and its natural resources as different areas need different effort and energy to be cultivated.
3.2. Entropic Analysis
If we regard the energy use of humans as a proxy of income in antiquity, and represent it by a continuous stochastic variable defined in [0, J], we can estimate the income entropy Φ of society (Equation (1)) as:
where is the probability density function of the random variable . Note that the probability density should be scaled by a so-called background measure, h(x), e.g., a uniform probability density, so that the argument of the logarithm function be dimensionless. Here, we assume with dimensions [90]. In the case that the energy is constant, equal to ~3 kWh per day (muscular energy) for every Hunter-Gatherer, the entropy becomes theoretically equal to −∞.
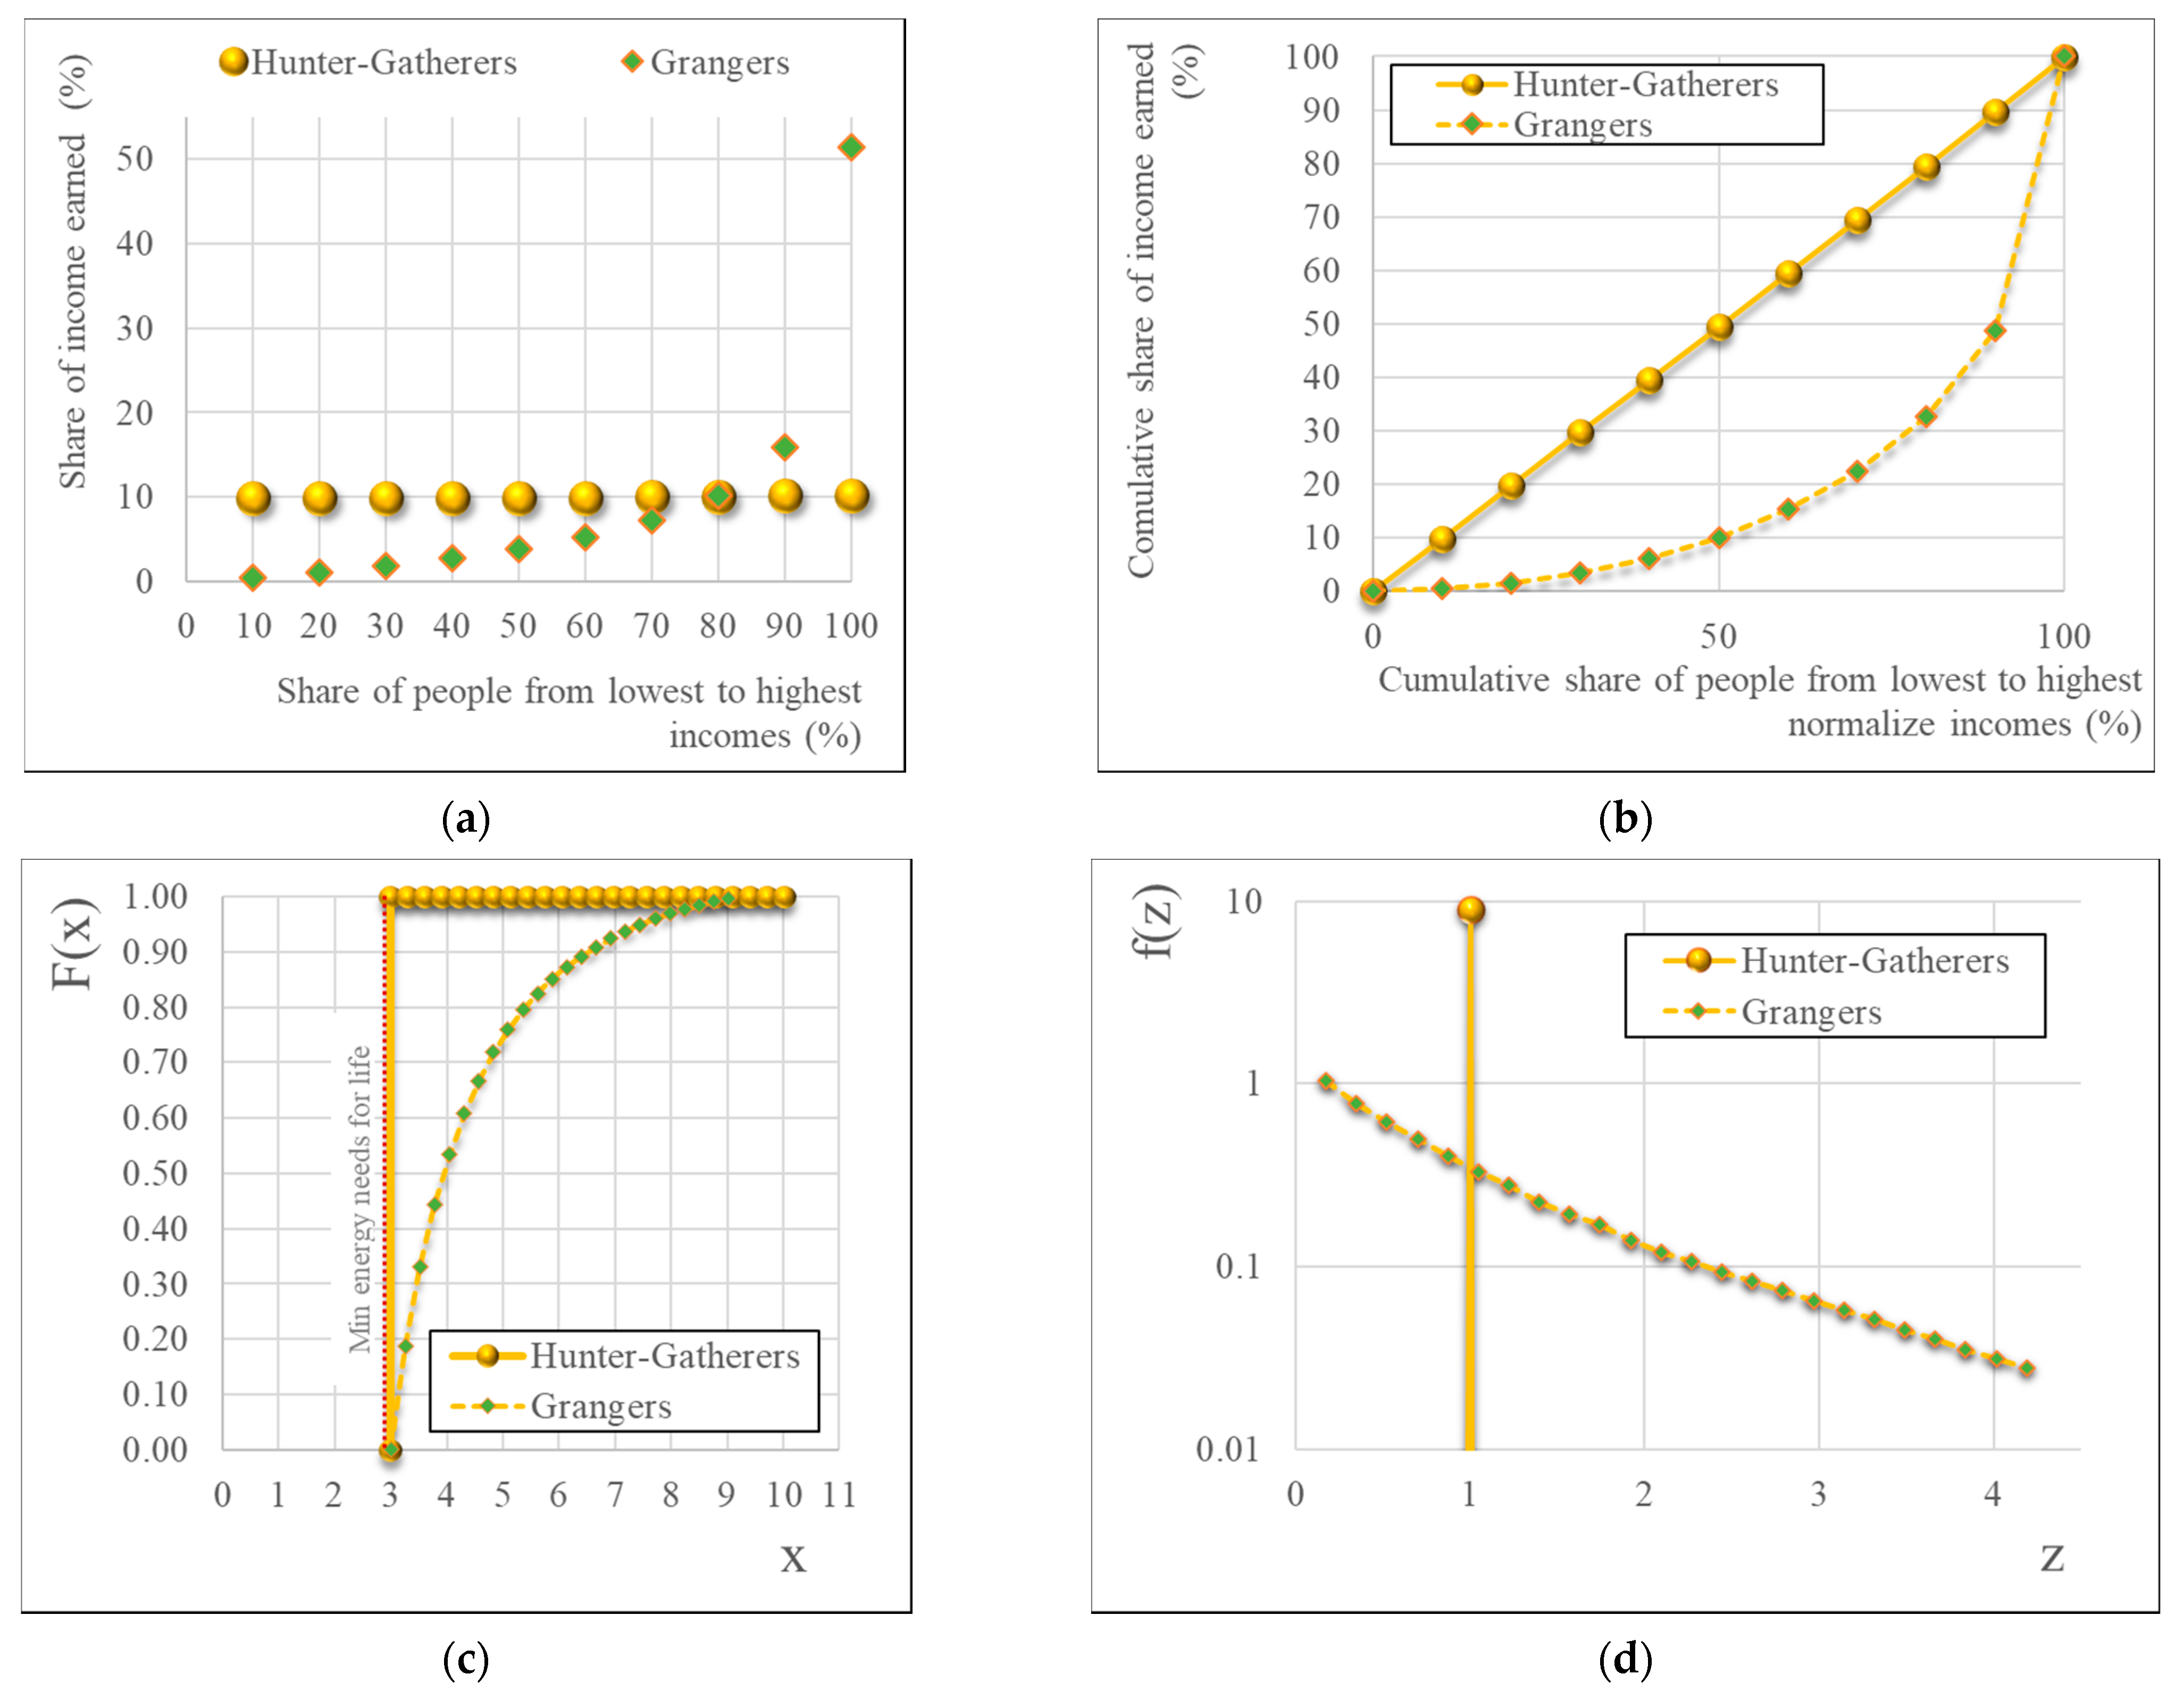
To frame our results within the context of standard economic analysis of the income distribution, we employ two well-known measures of socio-economic inequality, the Lorenz curve and the Gini coefficient [21,22,23,24,25]. As is usual with economic data we follow the convention of expressing income distribution in tenths of the share (%) of people from the lowest to highest income versus share y (%) of income earned. As a first illustration, Figure 10a shows the two cases of the Hunter-Gatherers and granger’s societies constructed with some assumptions. We start with the Hunter-Gatherers case, using the simplest possible assumption, i.e., that all people have the same income, as shown in Figure 10a.
Figure 10b shows the Lorenz curve, which is the plot of the cumulative share of income versus the corresponding cumulative share of the population. In the case of a perfect socio-economic equality, it is a straight line. From the Lorenz curve, we can calculate the Gini coefficient [24,25], which is a measure of socio-economic inequality estimated as: , where A is the area that lies between the line of equality and the Lorenz curve, and B is the area between the Lorenz curve and the horizontal axes. Values of tending to 0 indicate equality, whereas values closer to 1 indicate total inequality. Hence, for the Hunter-Gatherer case, the Gini coefficient is 0.
In addition, Figure 10c shows the probability distribution function of the income , and Figure 10d the standardized income probability density , where , i.e., the income standardized by its mean μ. For the Hunter-Gatherer case, the distribution function is one with a single discontinuity at the value (kWh), and the density is an impulse at the same value of x or at .
The grangers’ society is somewhat more complex. The technological limit has been increased, thanks to the use of tools and animals to cover energy needs. As a result, the average energy per capita is increased, as well. Here, we will assume that the distribution of available energy (income per capita) is obtained by the principle of maximum entropy introduced by Jaynes [91]. While the concept of entropy was much earlier proposed by Clausius [92], it is the latter principle which made the concept very powerful for logical inference. In a related paper [93], Koutsoyiannis notes that:
The entropy retains its probabilistic interpretation as a measure of uncertainty … [T]he tendency of entropy to reach a maximum is the driving force of natural change. This tendency is formalized as the principle of maximum entropy, which can be regarded both as a physical (ontological) principle obeyed by natural systems, as well as a logical (epistemological) principle applicable in making inference about natural systems.
Maximizing entropy from Equation (1) for the granger’s society, given a specified average energy (increased in comparison to the Hunter-Gatherers’ society), we obtain an exponential distribution of the energy per capita, bounded from below to the minimum required energy for survival and from above to the technological limit. This is illustrated in Figure 10c for the energy distribution and Figure 10d for the standardized energy. Accordingly, the latter case corresponds to a Gini coefficient equal to ~0.6 and entropy equal to ~2. This theoretical exercise illustrates how, in the framework of maximum entropy, social stratification emerges as a result of an increase in average wealth [94].
3.3. Antiquity and Medieval Societies
Lenski’s study for inequality in the prehistory and antiquity shows that the level of inequality varied [95,96]. Generally, ancient societies were divided in two social classes, elite (5–10%) and commoners, with small variations inside them [97]. While there have been various spatial and temporal changes in social stratification, the contribution of integrated technology on social stratification is somewhat unclear. For instance, little is known for the technological progress from bronze age to iron age, the invention of new tools, the influence of wind (windmills-navigation), or the use of water (England in 1700: waterwheel ~4 kW, one per 350 people [82]).
On the other hand, education, division of labor, and economic specialization, which are results of societies’ technological progress, are mentioned as causes of stratification [98]. We note that, in periods where the technological limit was increased, and there was available knowledge for large-scale projects (Pyramids, Ancient Egypt; Parthenon, Ancient Greece, Roman infrastructure, etc.), the embodied energy of constructions was covered by numerous crowds of slaves.
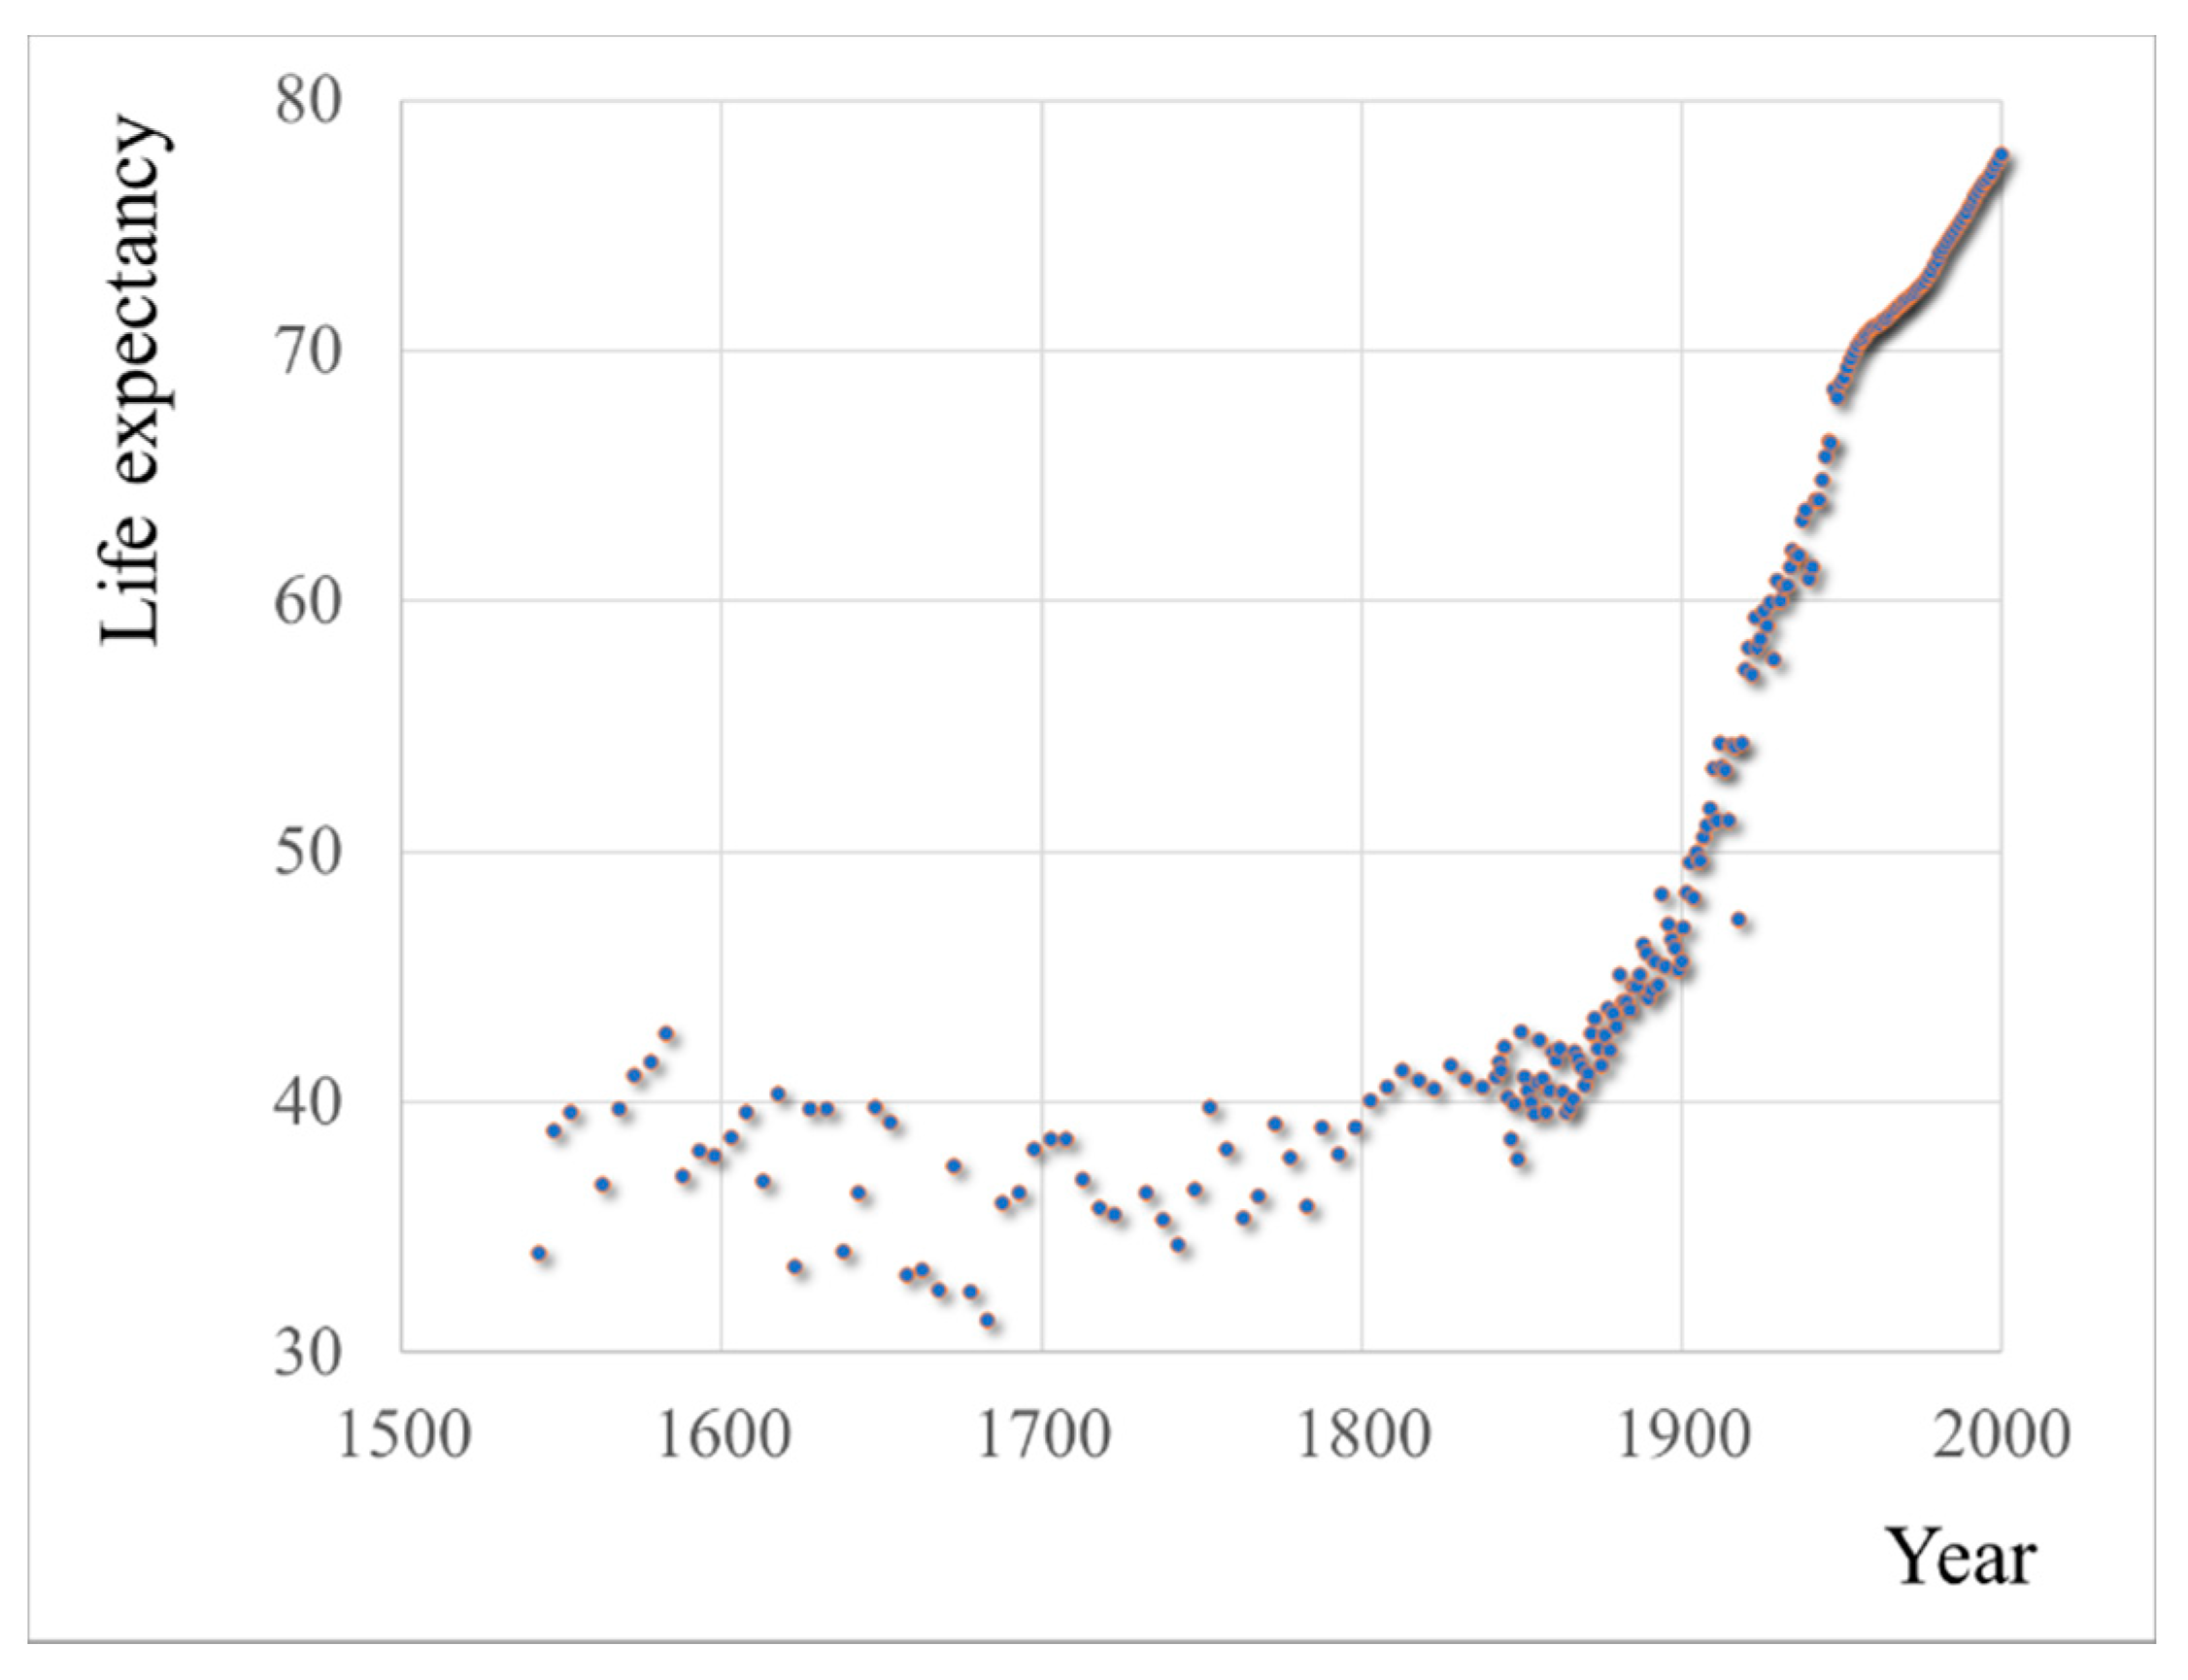
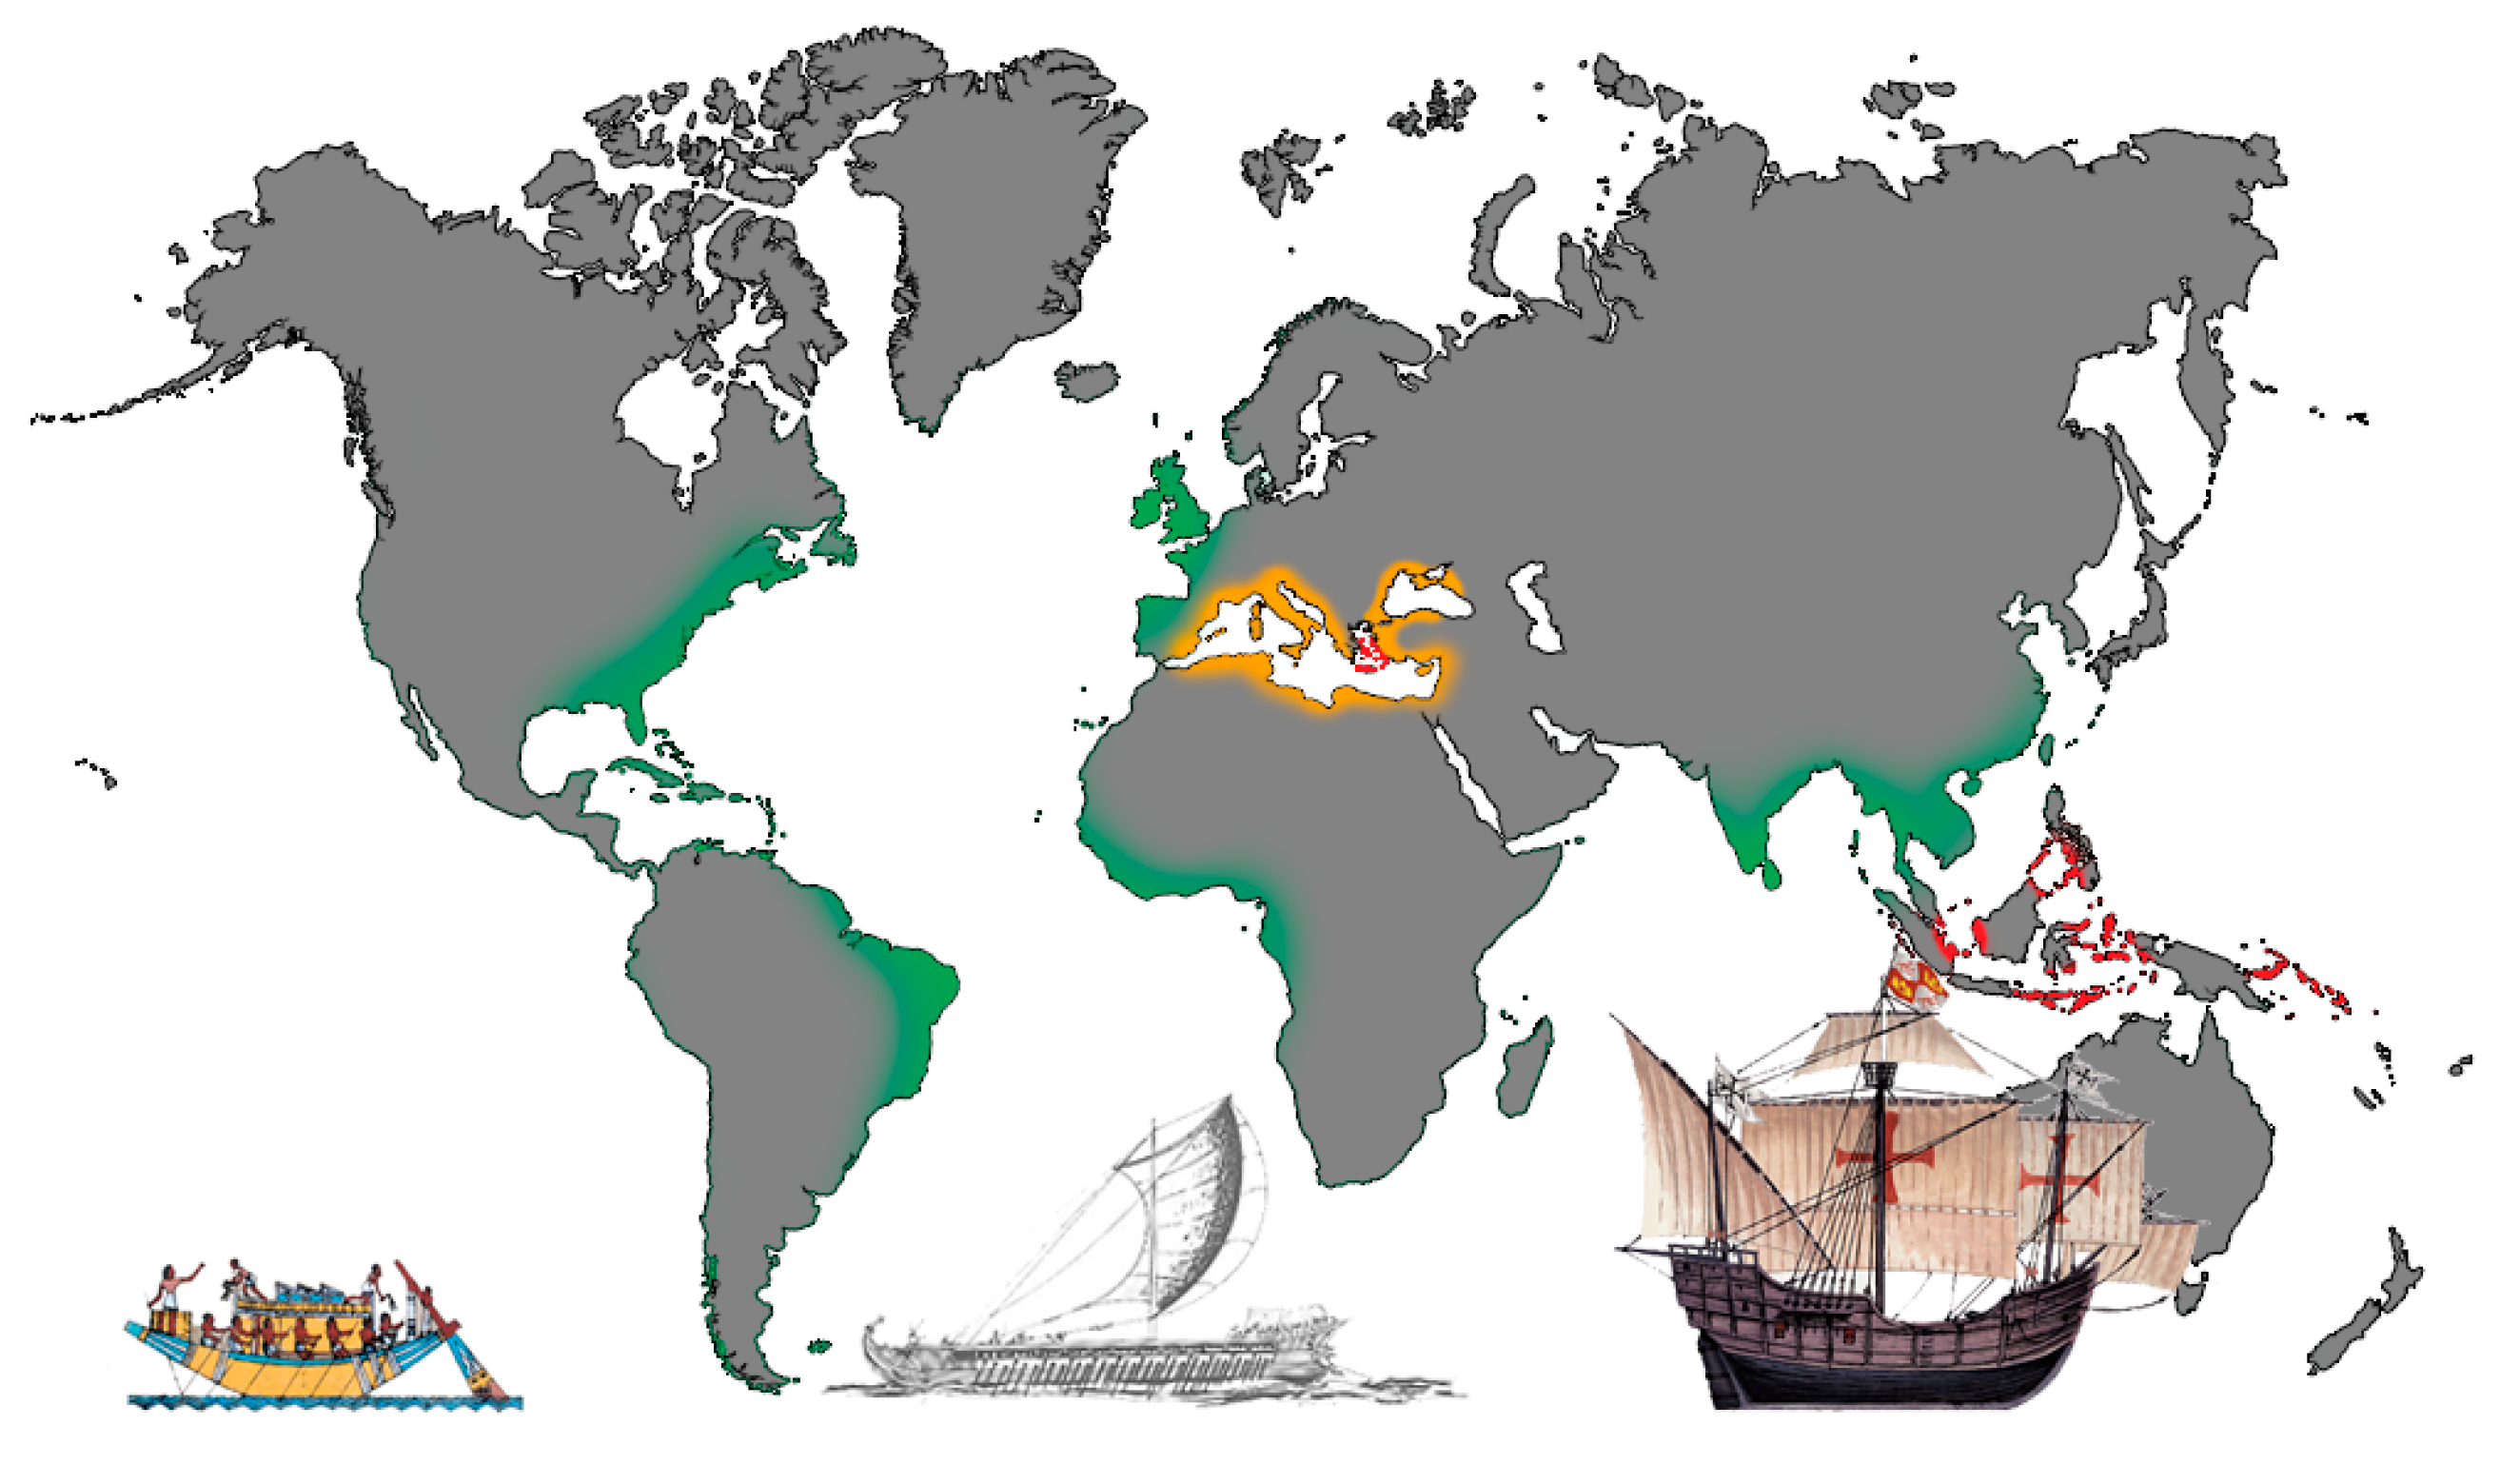
Most of our records show that life expectancy from prehistory until 1400 was till the twenties [99]. In the beginning of industrial revolution, life expectancy in the United Kingdom increased twofold, reaching the forties (Figure 11). This jump of life expectancy in the United Kingdom, in the period between 1400 and 1800, can be associated to the rise of a new socio-economic policy known as mercantilism. The latter policy was sparked by the installation of new techniques using wind power by sailing ships (caravels), which could travel against wind [100], explore new lands, and bring new resources to mainland (Figure 12). However, the period of mercantilism was marked as a period of extreme inequalities (slave trade, colonization) and the beginning of minimum economic intervention (known as “laissez-faire”). In this case, as well, the rise in inequality (accompanied by the rise of the average prosperity) can be justified in entropic terms by the radical expansion of the technological limit of the time.
3.4. Modern Societies
While the invention of money has been a substantial socio-technical evolution, today, only 8 percent of the world’s currency exists as physical cash [101], and an intangible amount of money is created as debt, which is indicative of the current monetary system’s fragility. This fragility is already being discussed in the public discourse. Recently, the Russian President Vladimir Putin, in his speech at Virtual World Economic Forum of 2021, acknowledged that: “The widening gap between the real and virtual economies presents a very real threat and is fraught with serious and unpredictable shocks” [102].
We have already shown that GDP per capita and energy are related (Figure 6). In the previous examples, we have used energy as a proxy for GDP per capita. In order to track the role of energy in society till the present day, we note that average worldwide energy consumption is 21,000 kWh per capita per year, yet with significant variability, as, e.g., in Qatar, the average is ~200,000 kWh per capita per year, and, in Afghanistan, the average is ~600 kWh per capita per year.
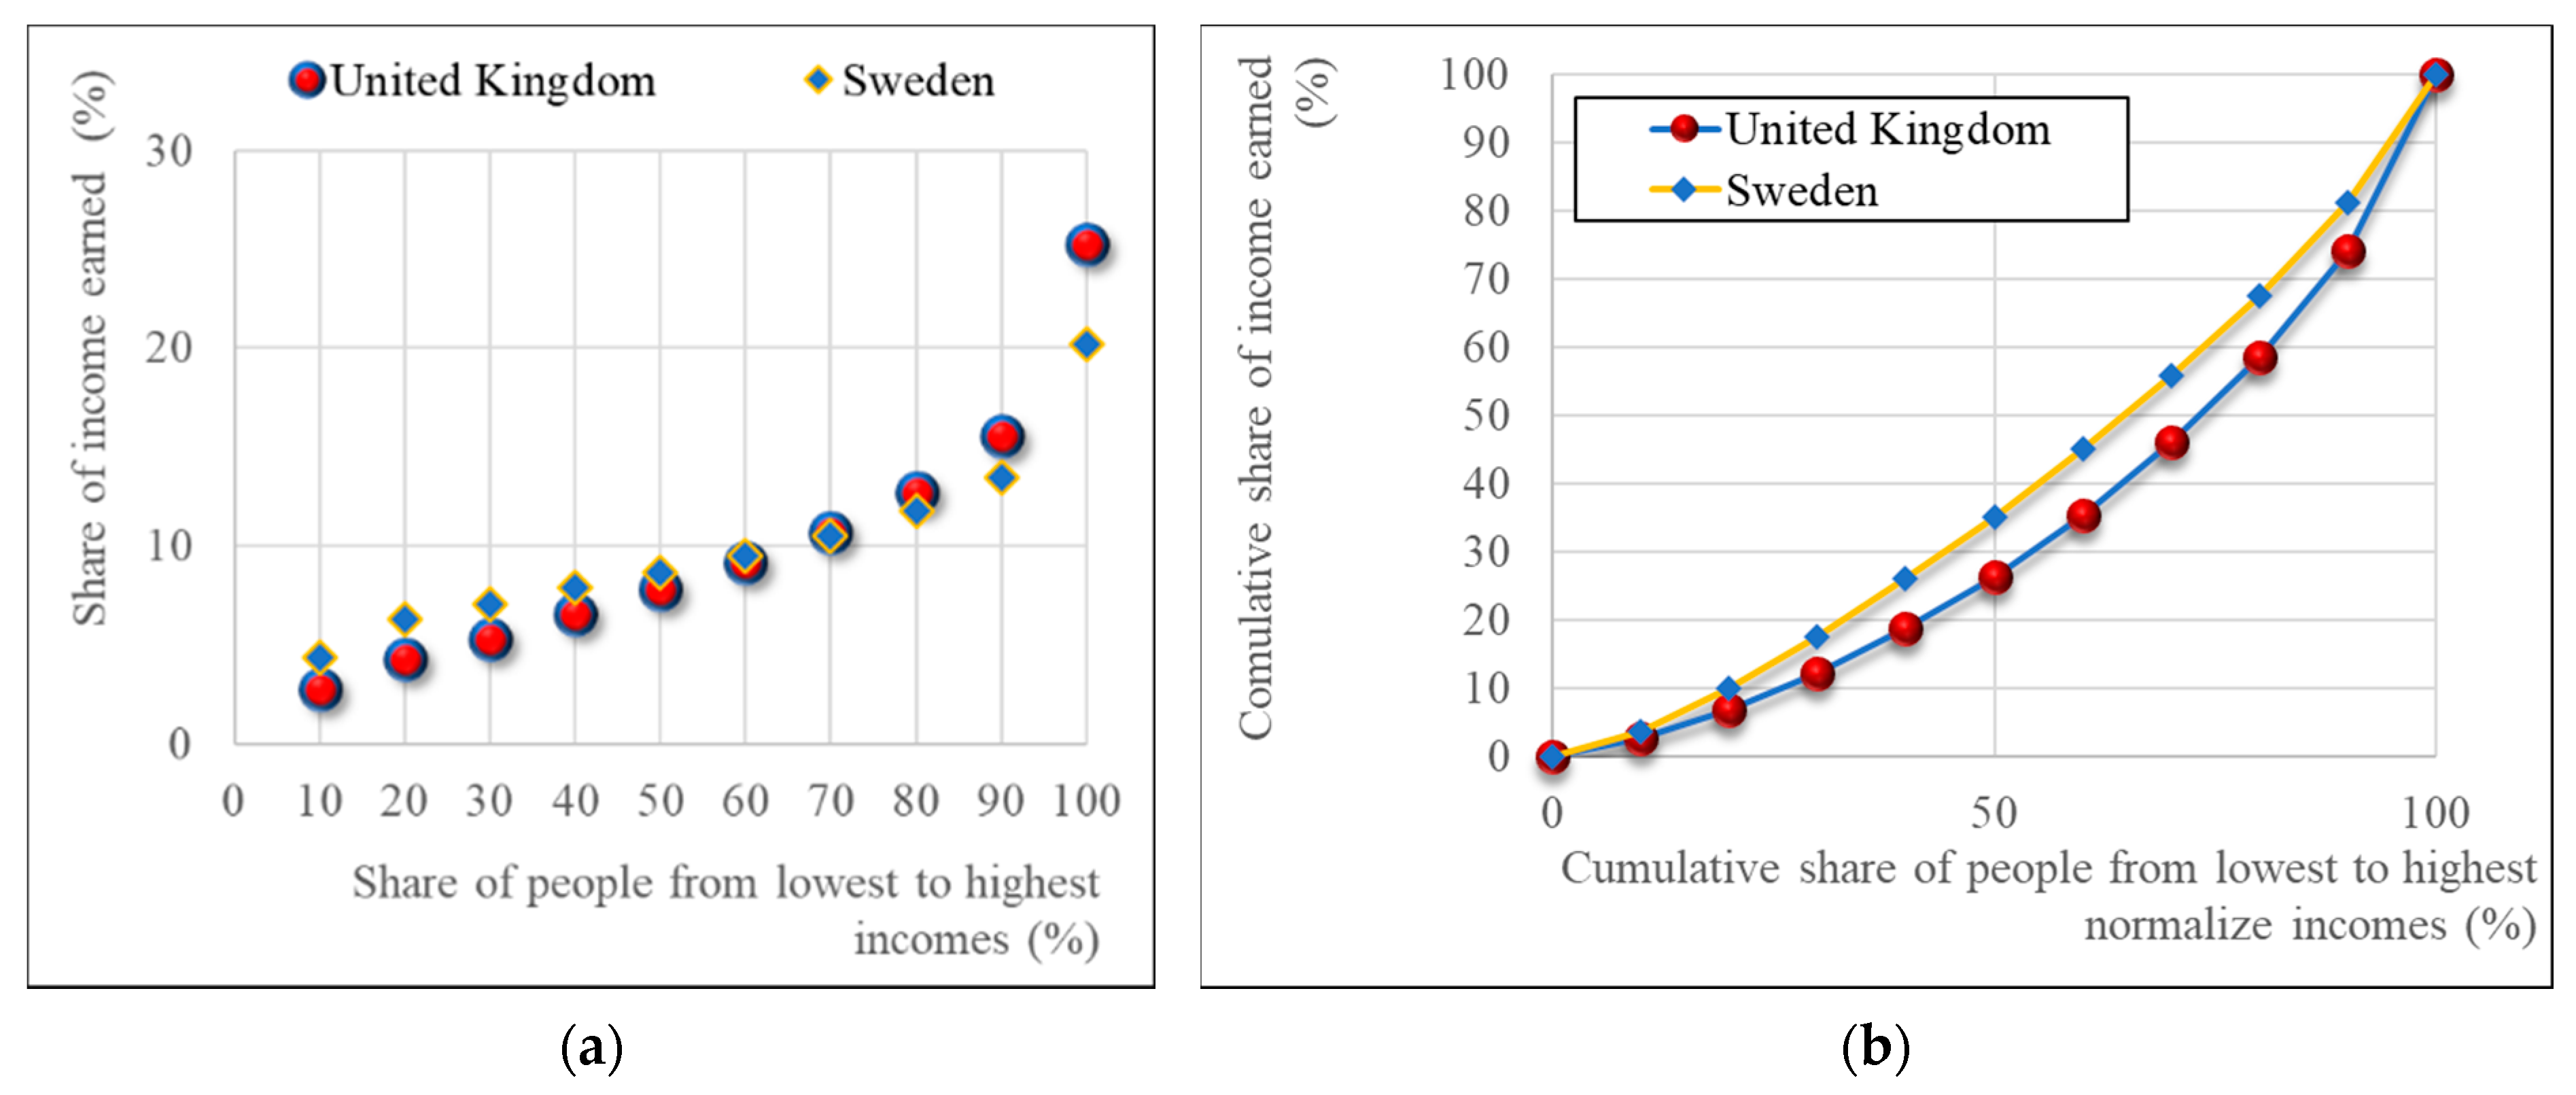
As we have ample economic data regarding GDP for modern societies, in order to study the stratification in this case, we examine economic data for income (instead of energy data), and we discuss the income (net) distribution in different countries [103]. Here, we use GDP data from United Nations University (UNU) World Income Inequality Database (WIID) [104]. As these data cover in detail a period of about 50 years, we select as case studies specific countries that have undergone radical socioeconomic changes during this period. In particular we study economic data from the UK, Sweden, and Greece. These data are available as tenths of the share (%) of people from the lowest to highest income versus share (%) of income earned (y), as shown in Figure 13a. The Lorenz curve is readily calculated as the cumulative share of the people corresponding to the cumulative income (as seen in Figure 13b), while the Gini coefficient is derived as described in Section 3.2. To obtain the distribution of income from the income share data at hand, we first use logarithmic interpolation between the known values of the income share (each corresponding to a tenth of the population) to obtain the full distribution of income share y, and we then transform the latter to actual money x using the following equation: , where C is the ratio of the averages of the distributions of income money and income share: . The average income money is obtained from data in UNU World Income Inequality Database-WIID [100], whereas the average income share is estimated from the income share data.
We also define (Equation (2)) an entropic index of inequality ΔΦ as:
where is the total entropy defined in Equation (1), and is the average income money. We note that, if entropy is maximized, i.e., hence, the income distribution is exponential, then the entropy equals . Therefore, the maximum possible value of is 1 and corresponds to the case where indeed the entropy is maximized. A value of smaller than 1 could correspond to a more equitable distribution of the income.
Thus, the total entropy, being related to the logarithm of the average income, is a measure of prosperity, and is a measure of inequality. For the variable which, by definition, has , and are identical.
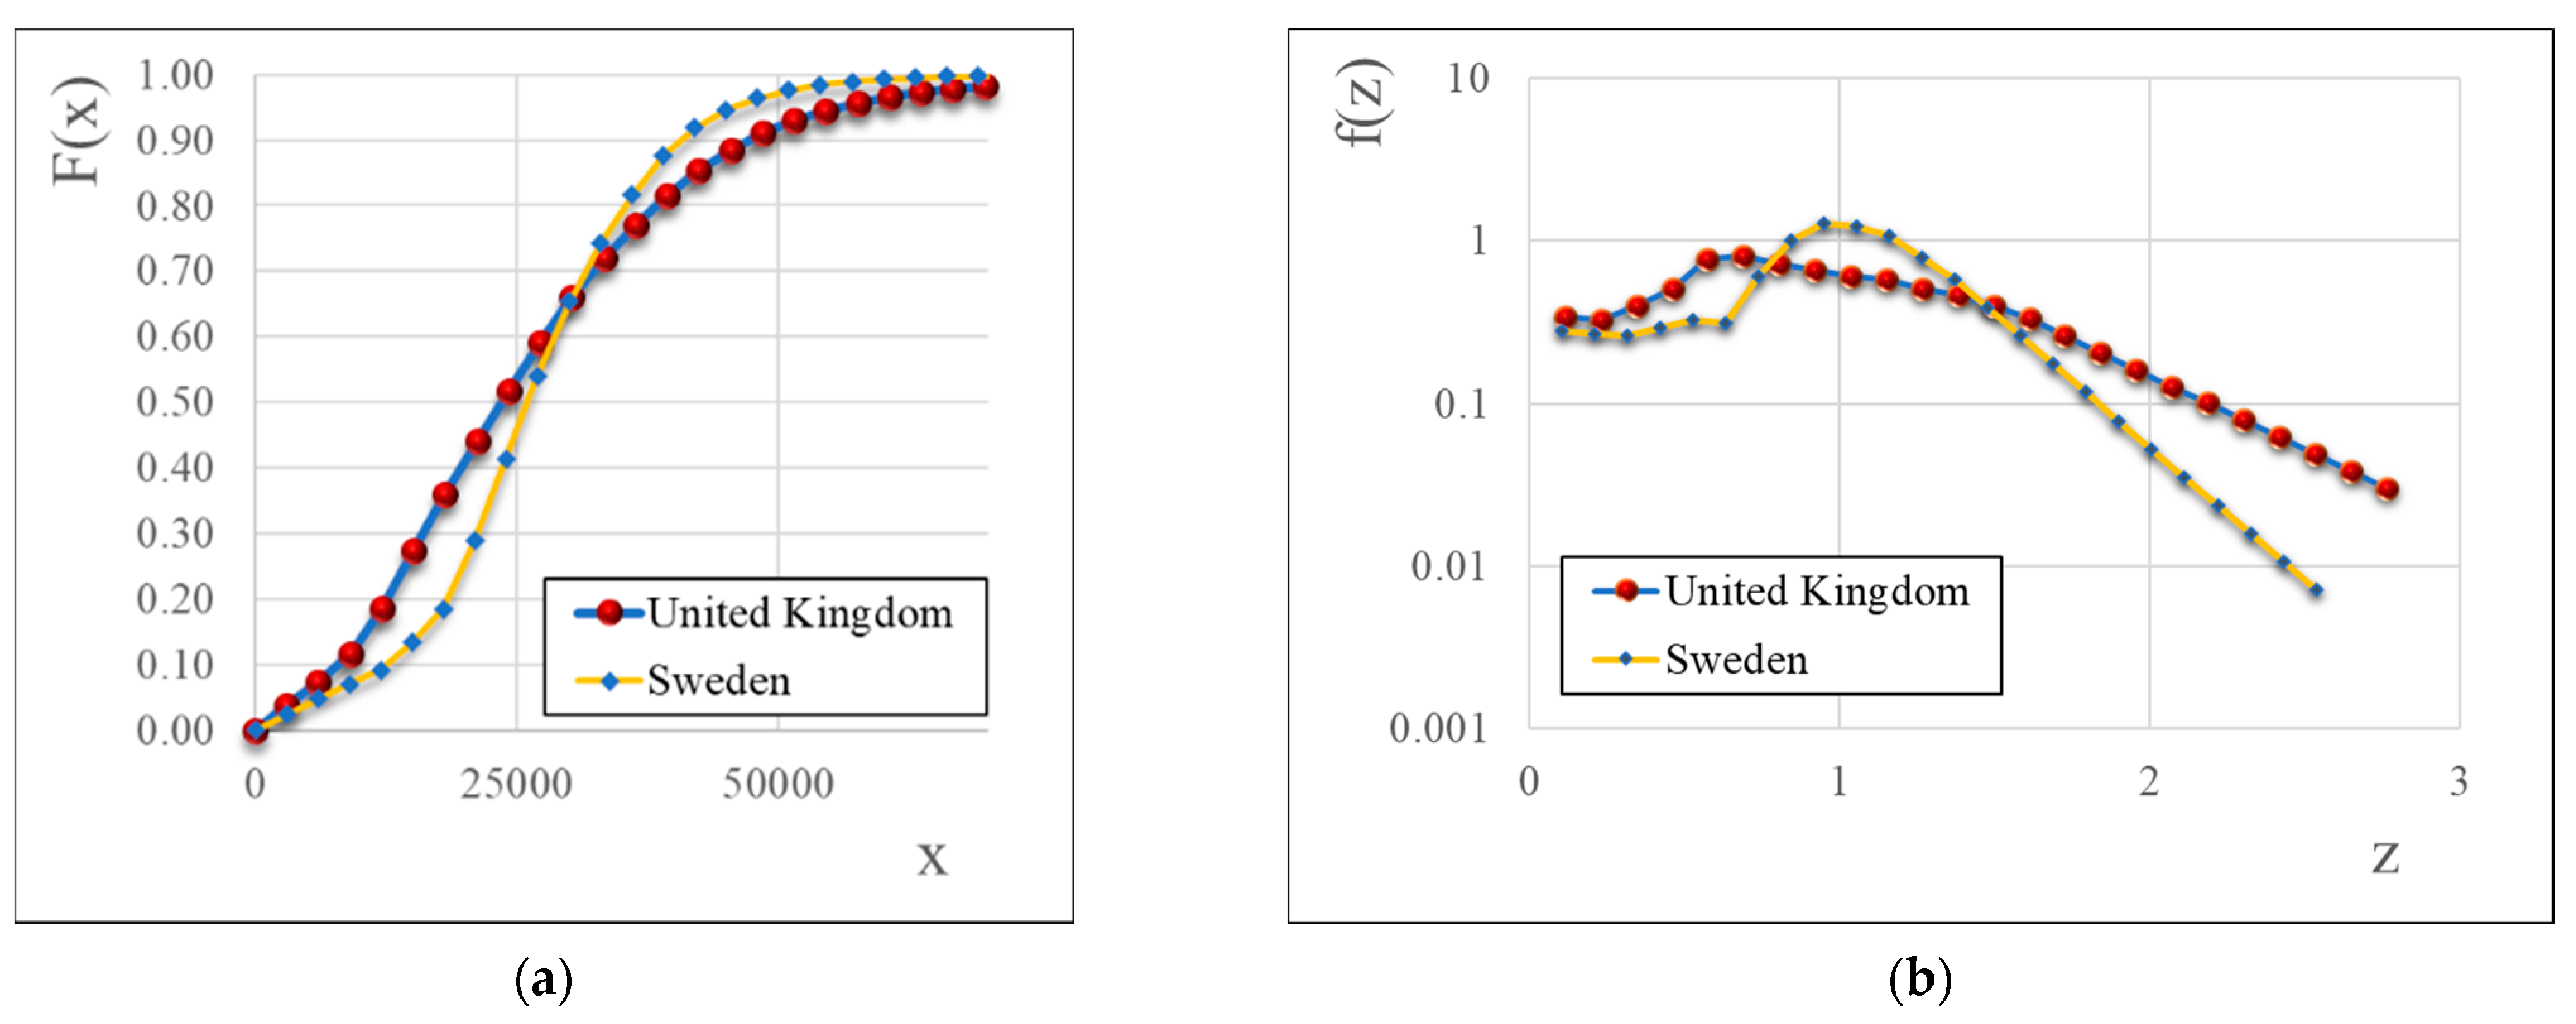
The total entropy and entropic inequality index for the income data defined in Equations (1) and (2), respectively, are easily obtained. We also compare countries by their income probability distribution function (Figure 14a), as well as their standardized income probability density distributions (Figure 14b).
When the wealth is increased, the natural tendency of the stratification is reflected by an exponential distribution, as shown in Figure 10d, for the case of Grangers. Modern societies seem to be following that tendency in part, but with added regulations (using taxing instruments) to support the creation of the middle class, yielding a more bell-shaped distribution. This fact is evident by the comparison of England and Sweden. The ‘bell’ indicates the strength of the middle class and is clearly more pronounced in Sweden (Figure 14b).
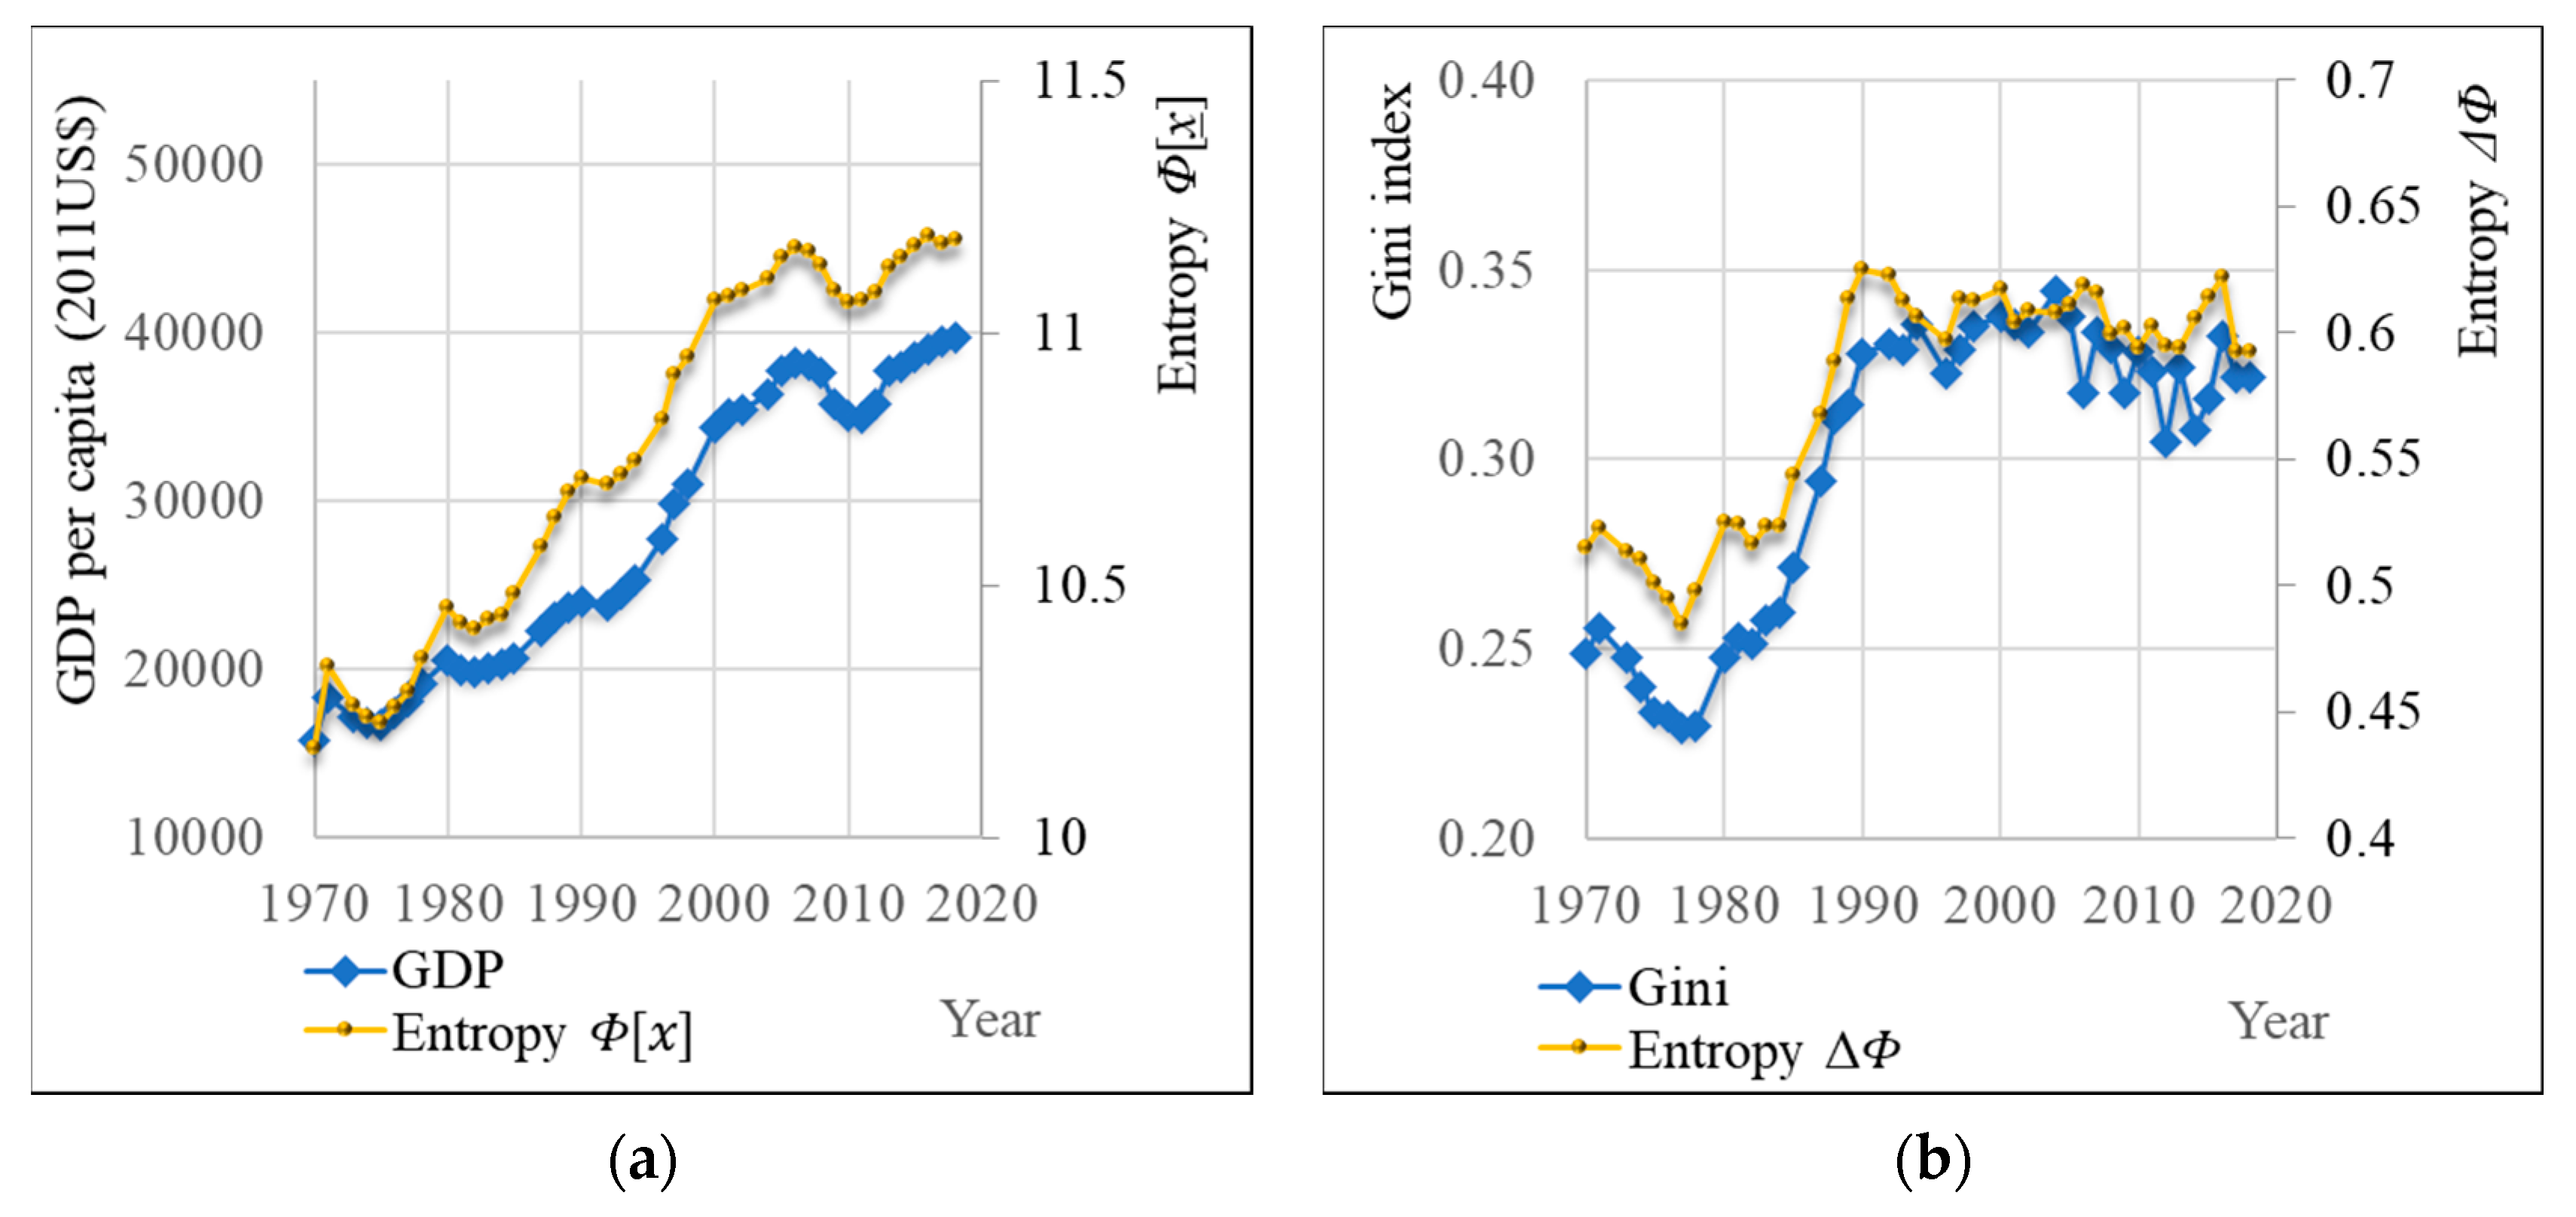
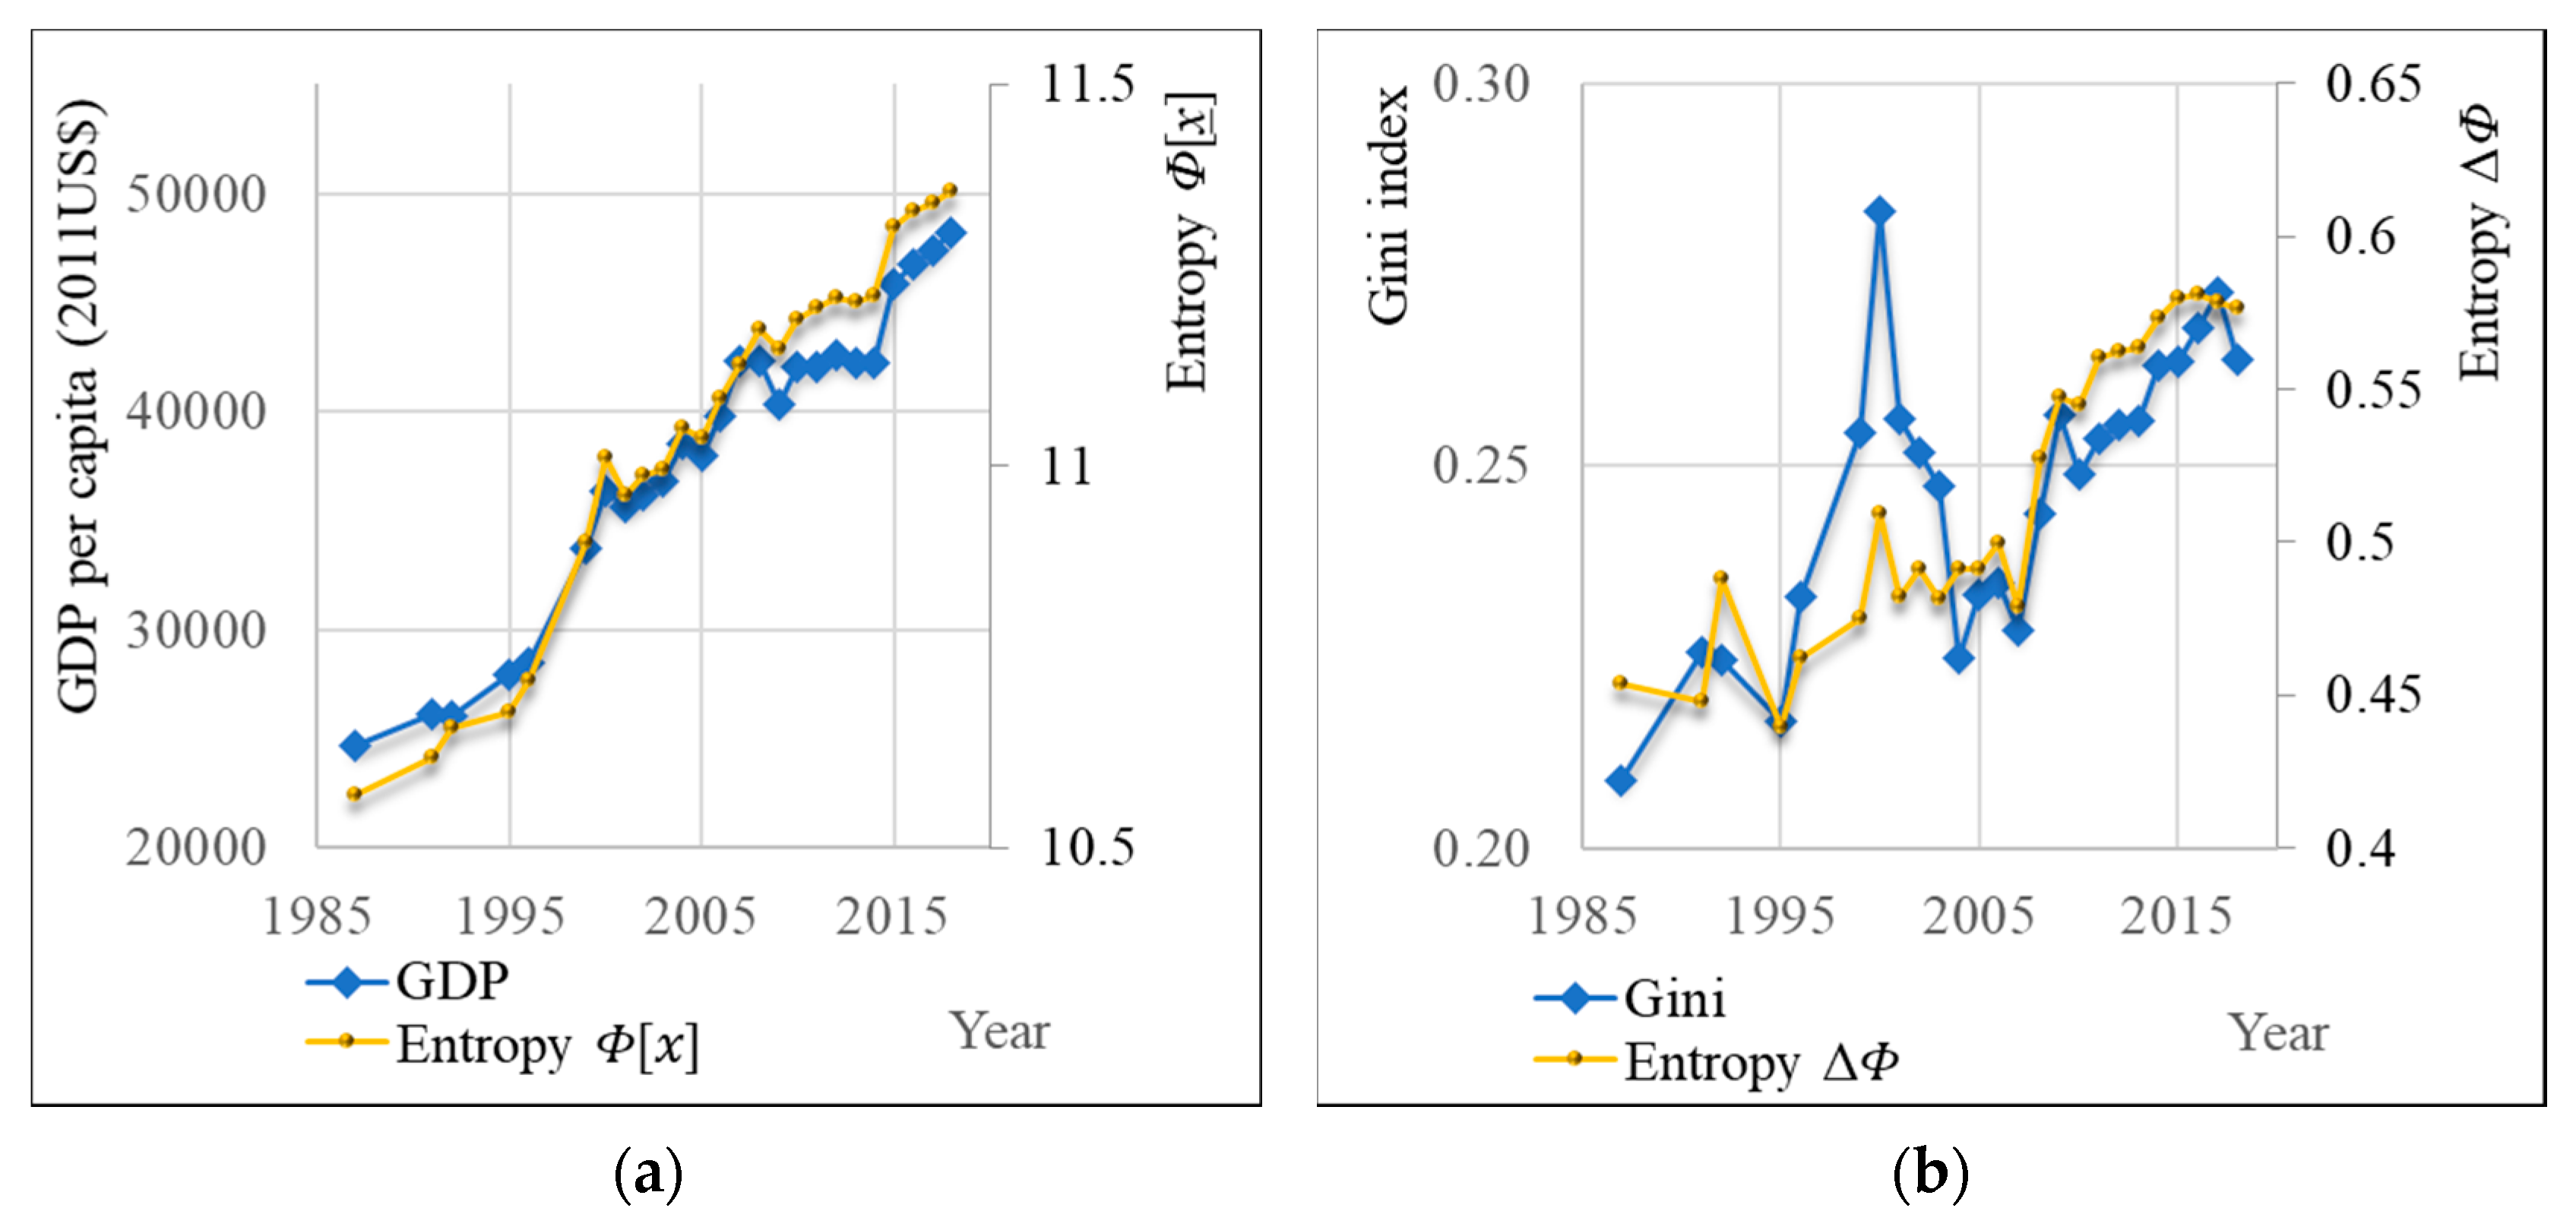
Our analysis also shows that the total entropy is tightly related to GDP per capita which is the best-known growth index, while ΔΦ is correlated with the Gini index which is a common index of inequality (Figure 15 for UK and Figure 16 for Sweden).
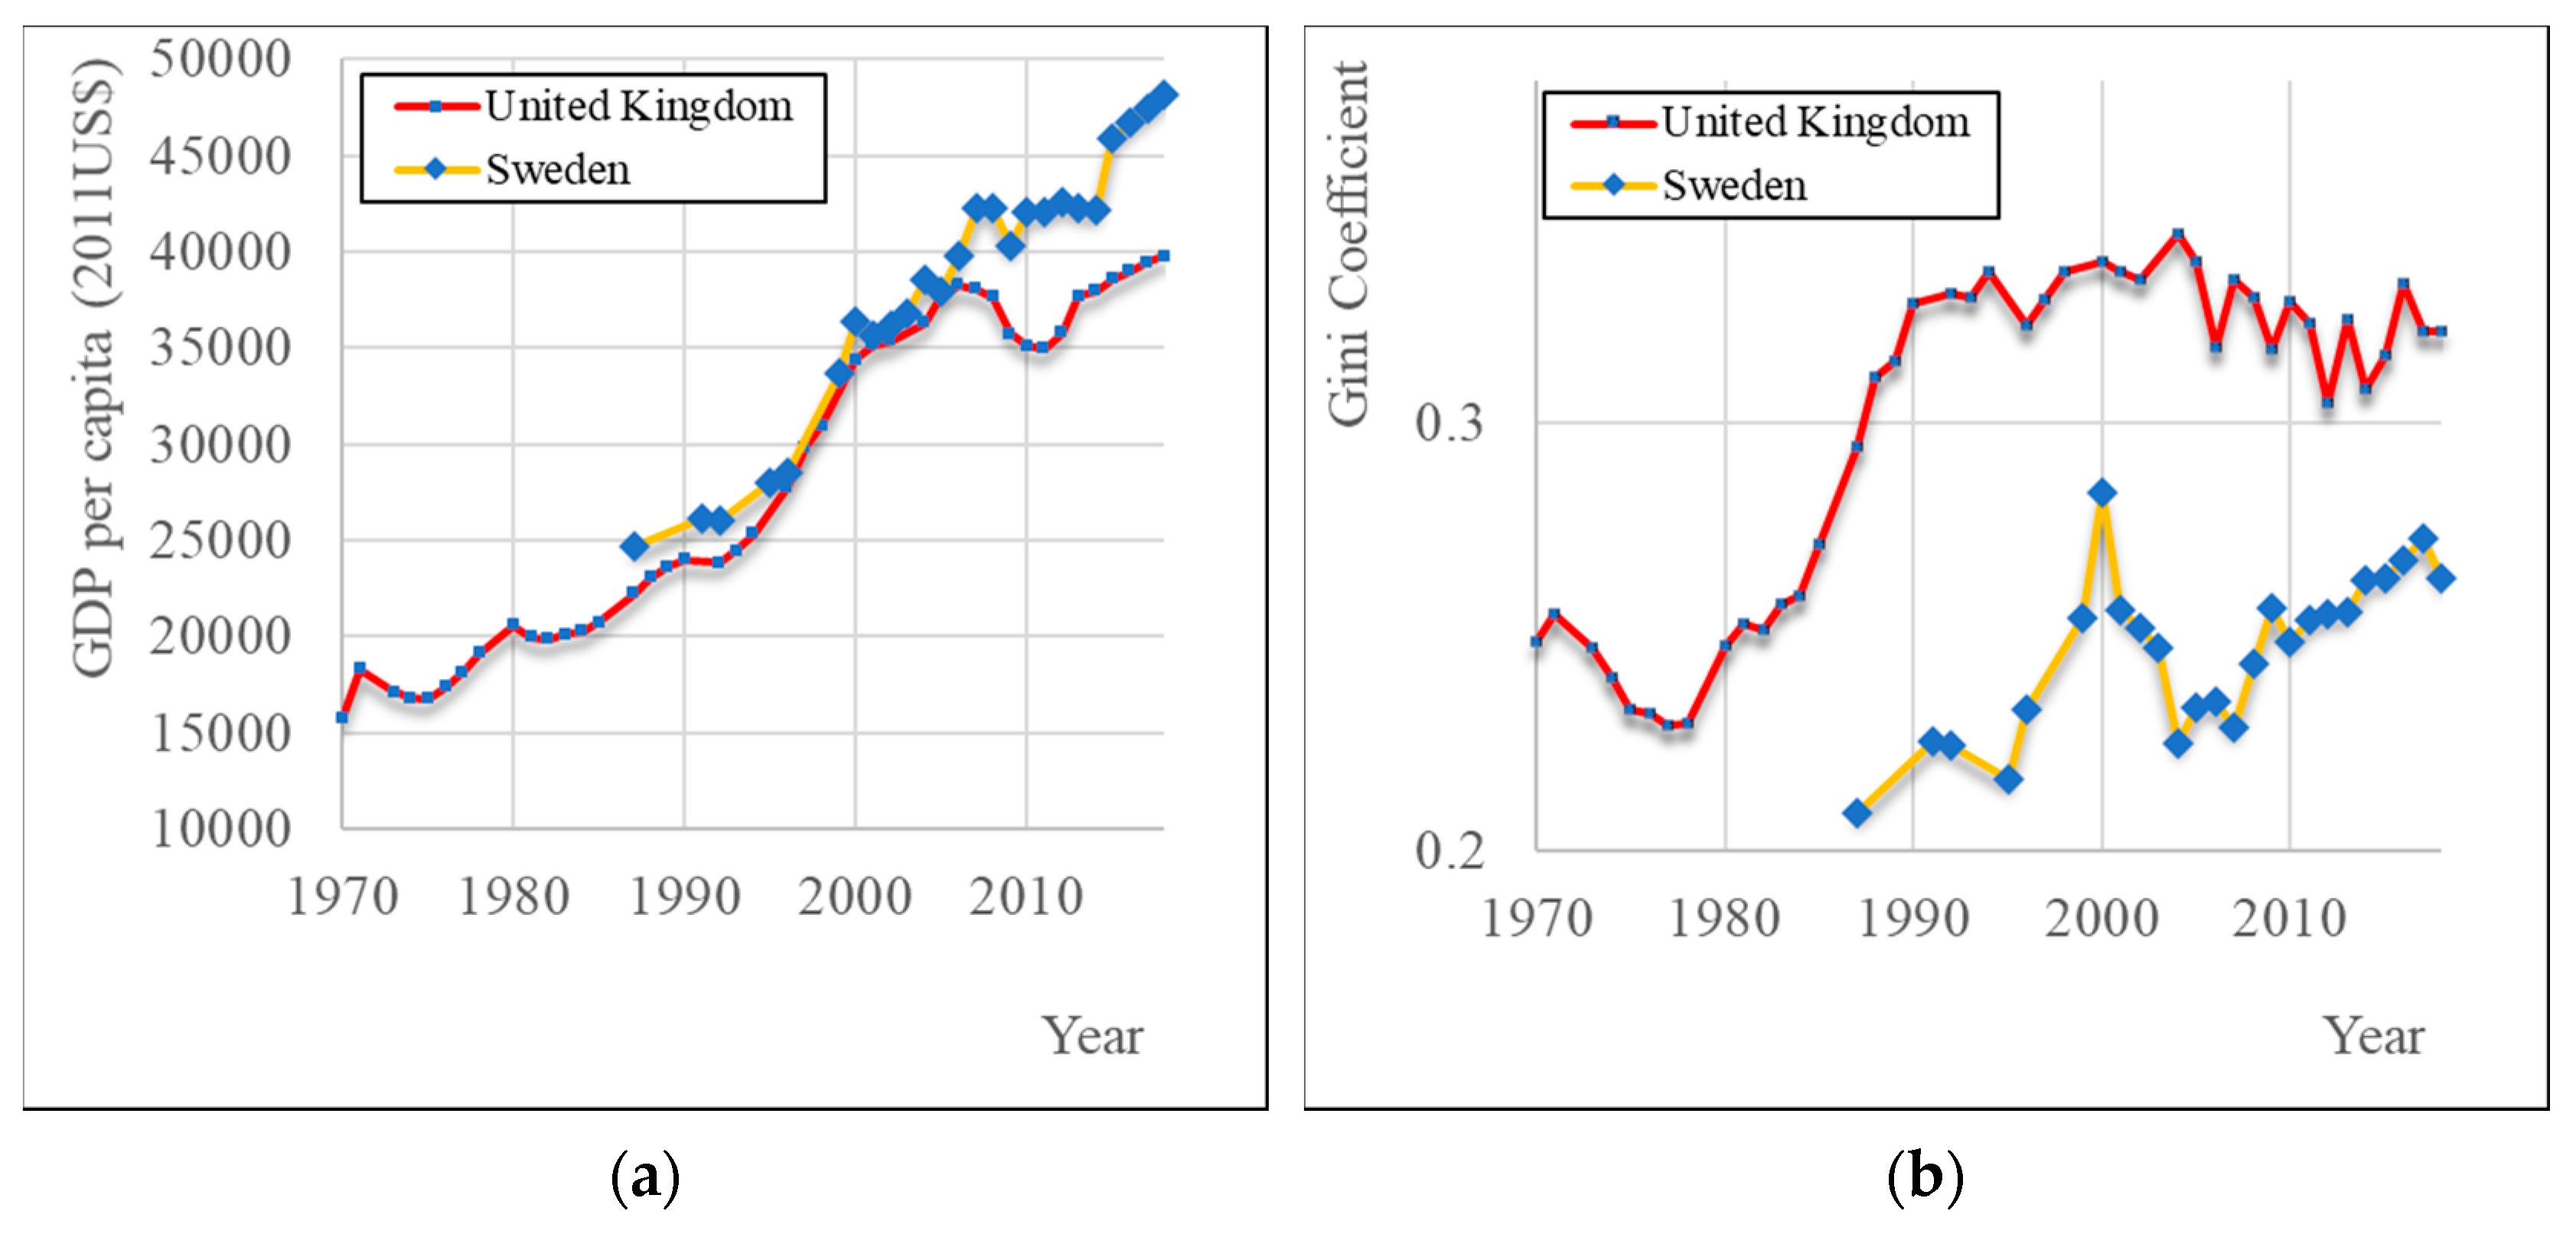
Various interesting insights can be also derived by inspecting the evolution of income inequality in the UK and Sweden, inter-compared in Figure 16. First off, both entropy metrics we have defined, i.e., total entropy and entropic index of inequality ΔΦ, reflect the difference between the neoliberal politics of England’s Prime Minister (1979–1990) Margaret Thatcher (1925–2013) and the Social Democrats in Sweden which exercised political power almost uninterruptedly (except for a short parenthesis 1991–1994) until 2006 [105]. The Social Democrats seem to have succeeded in lowering inequality and strengthening the middle class. Our analysis shows that the short parenthesis of 1991–1994 in Sweden did not affect the inequality as much as it suggested by the Gini coefficient (Figure 17 and Figure 18), and, in this respect, the ΔΦ metric may be a better index of inequality than the Gini coefficient. On the other hand, after the falling of Social Democrats in 2006, ΔΦ shows that, in recent years, both countries are converging to the same inequality state (Figure 17 and Figure 18).
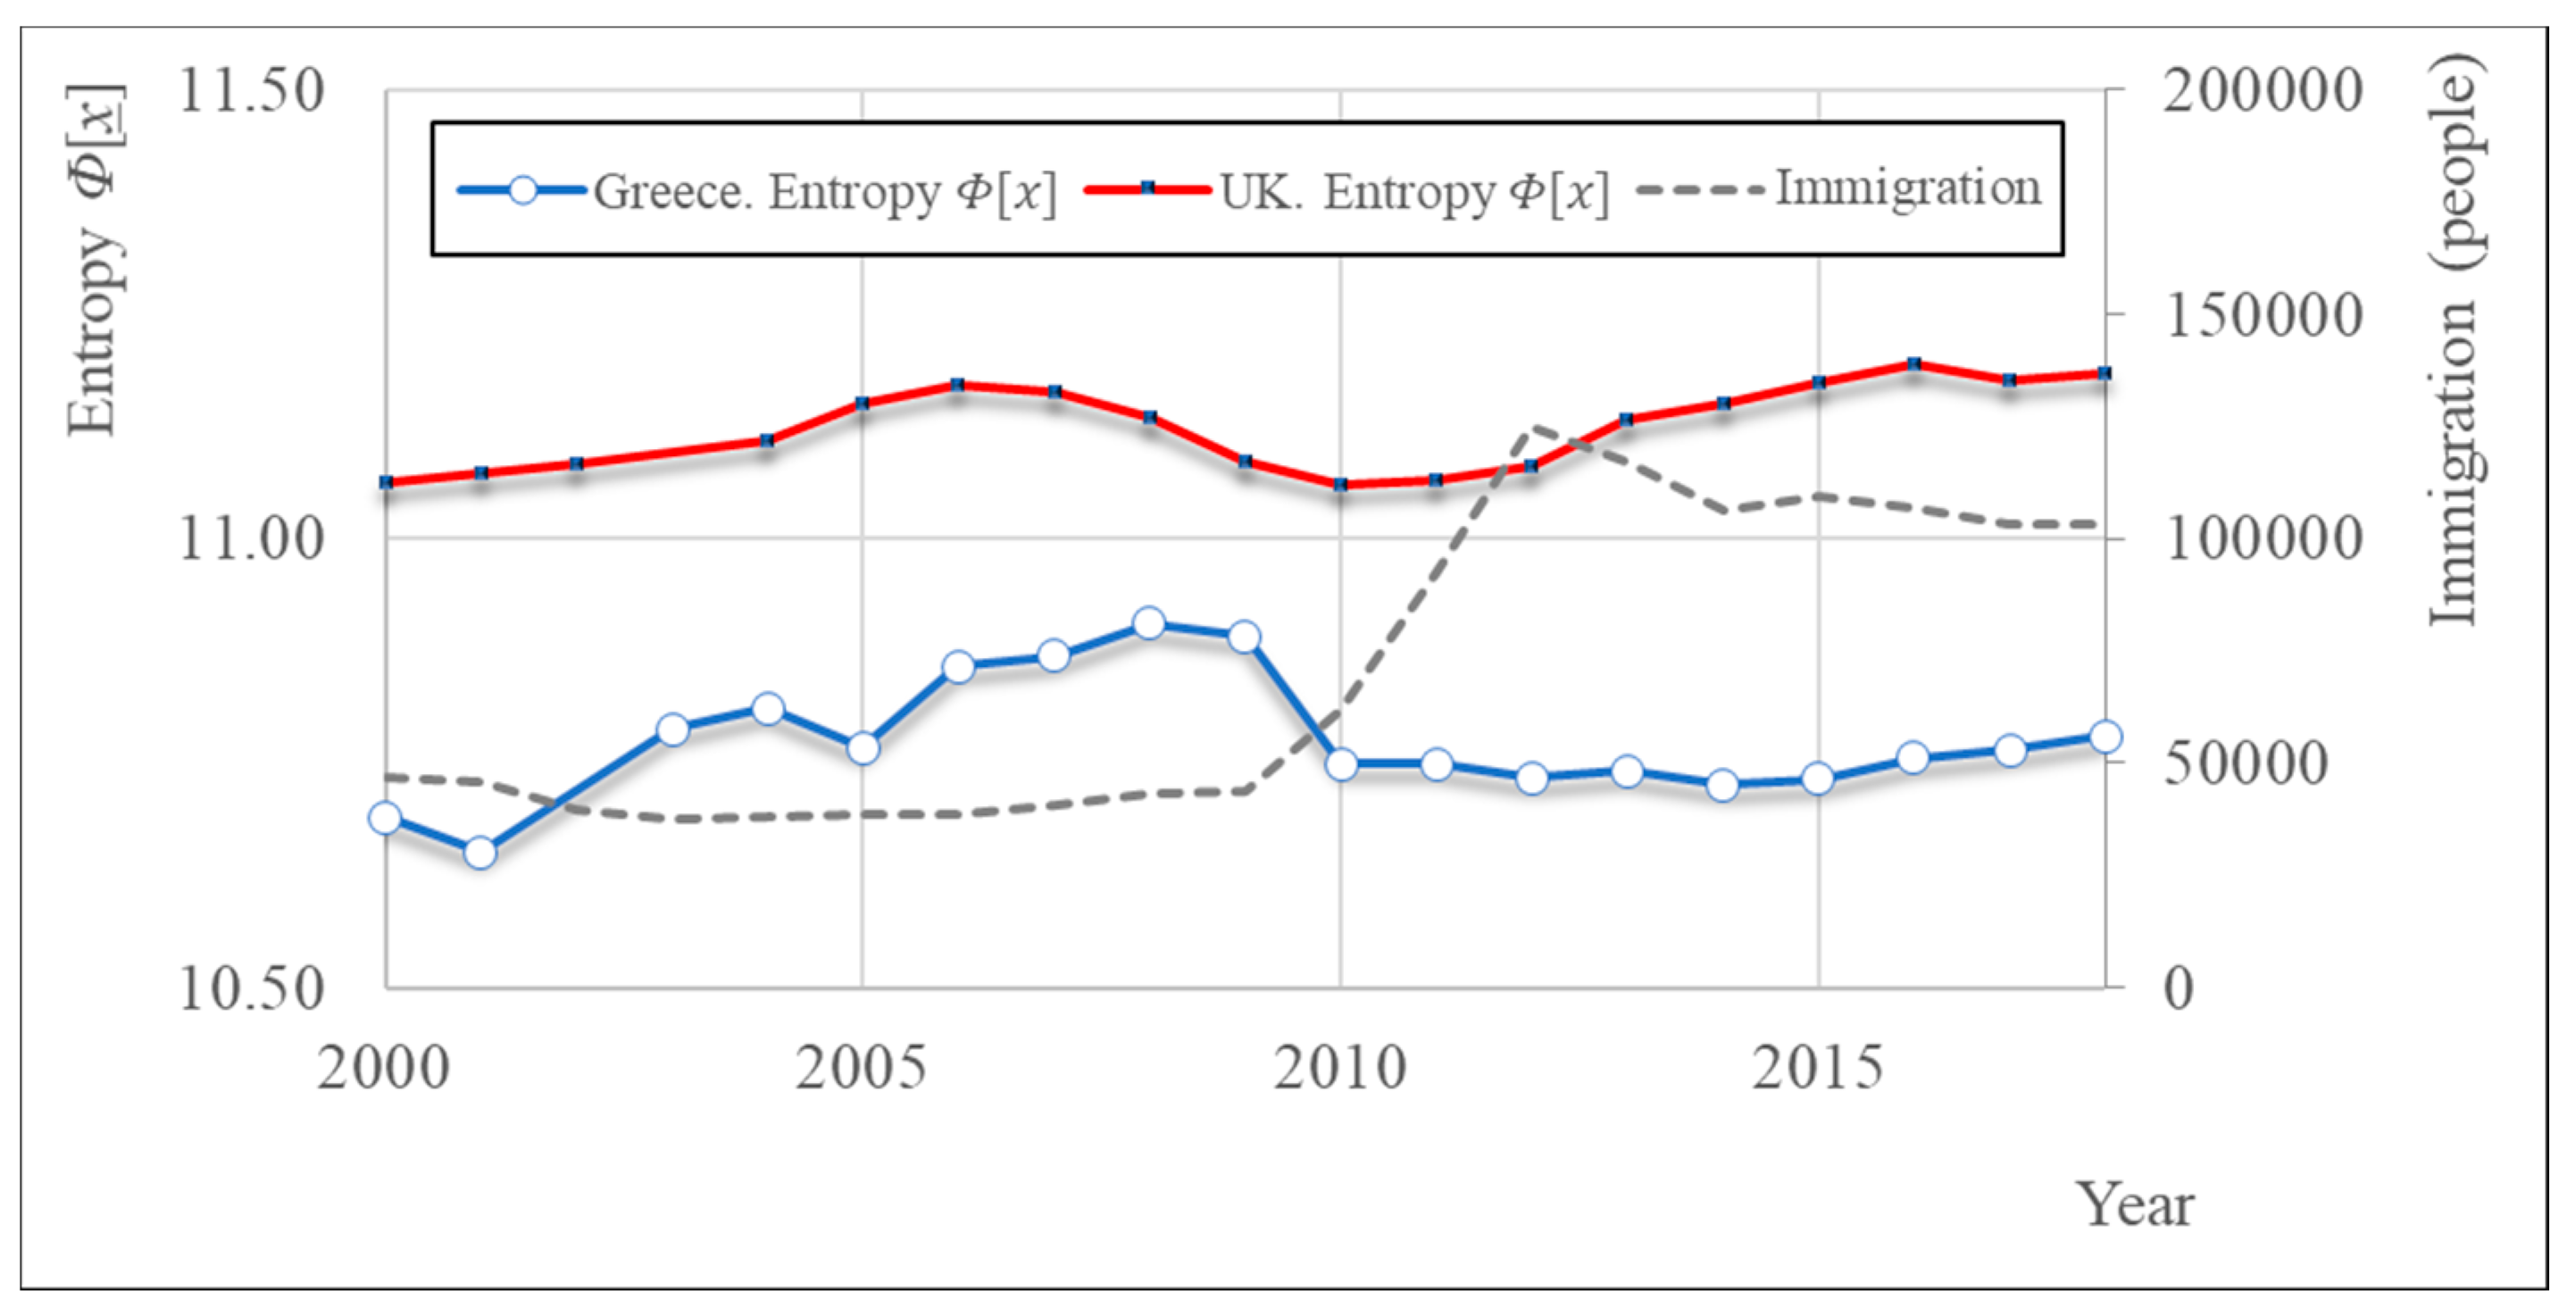
Another interesting example is the assessment of the situation in Greece during the period 2010–2015 [106,107] in comparison to the one in the UK. The Greek financial crisis started in 2010 when the First Memorandum was implemented. In this year there was an abrasive downturn to the GDP per capita. Soon after, in 2012, the GDP per capita seems to have been stabilized (Figure 19). It is interesting that, during this period, the total entropy shows a big gap between the two countries. This was accompanied with a widespread pessimism of the population and a tendency to leave the country after 2010 with main target of immigration the United Kingdom, a country with higher total entropy [108].
4. Discussion
Wider reflections from the entropic view of social stratification may be made. For instance, the expansion of the technological limit during the industrial revolution has caused increased inequality, yet, at the same time, it had a favorable effect to the prosperity of the population. The latter was clearly explained by Hans Rosling [109].
Another interesting fact is how the Coronavirus pandemic made the richest people on the planet richer diminishing the middle class [110]. In other words, it seems that, once the system is shocked by a sharp change, its structural rearrangement follows the tendency to maximize entropy, approaching the entropy-maximizing exponential distribution.
A relevant scientific question would be: How does a state’s policy intervene to regulate the society’s inherent tendency to maximize entropy? Confucius said that “When wealth is concentrated, the people are de-clustered. When wealth is distributed, the people are clustered” [111,112]. In 1776, Adam Smith first pointed out that the economy, must have ethical basis noting that “laissez-faire” led to a behavior of extreme inequality [5]. He pointed out the role of the state is to sustain an ethical basis and redistribute wealth creating the middle class which can be viewed as the “bell” in the distribution (Figure 13d).
In “The General Theory of Employment, Interest and Money” [15], John Keynes (1883–1946) notes the same: when wealth is concentrated, a big share of the wealth is invested in safe and unproductive values which block the function of the economy [113]. Keynes pointed out that the continual redistribution of wealth and the limitation of its unproductive deposits are functional obligations of the state to society to avoid recession.
The historical documentation of the influence of inequality today is pointed out by Robert Reich [114]:
Consider that the two peak years of inequality over the past century—when the top 1 percent garnered more than 23 percent of total income—were 1928 and 2007. Each of these periods was preceded by substantial increases in borrowing, which ended notoriously in the Great Crash of 1929 and the near-meltdown of 2008.
Recently, Russian President Vladimir Putin noted that [102]:
The systemic socioeconomic problems are evoking such social discontent that they require special attention and real solutions. The dangerous illusion that they may be ignored or pushed into the corner is fraught with serious consequences. In this case, society will still be divided politically and socially.
Therefore, it becomes clear that, an indiscriminate restriction of available wealth (as it happens today in finance capitalism [115]) leads to the exponential distribution of wealth eliminating the middle class and creating favorable grounds for a crash of the economy, as happened in the past.
5. Conclusions
This work puts forward an entropic evaluation of social development and economic stratification, instead of the usual economic analysis based on indicators as the GDP per capita, the Gini index and the Lorenz Curve. Indeed, it turns out that the entropic representation can interpret social and economic changes from prehistory to the present day providing a quantitative evaluation of the dynamics of economy. In particular, we have formulated two new measures; total entropy , an entropic index related to economic growth; and an entropic index related to inequality . The indices are validated using extensive case studies from prehistory till modern day economies. Both are readily applicable in economic analysis and have theoretical support by the principle of maximum entropy.
The analysis of long-term social and economic growth shows that the latter are associated with spontaneous social stratification as also suggested by the principle of maximum entropy. However, the reason why social stratification has been disputed as a natural human tendency by most anthropologists relates to the counter-example of the Hunter-Gatherers. For example, Gowdy [48] writes:
Assumptions about human behavior that members of market societies believe to be universal, that humans are naturally competitive and acquisitive, and that social stratification is natural, do not apply to many hunter-gatherer peoples.
In our view, stratification did not arise in the Hunter-Gatherers’ society because their technological limit was constrained by their muscular power and resulting energy barely sufficed to cover survival needs let alone to create surplus. As the technological limit increased (agriculture) and people clustered, available wealth increased creating a surplus. In entropic terms, this translates to the formulation of an exponential distribution, consistent with the maximization of entropy under the constraint of a specified mean. Overall, our analyses suggest that technological development is the force which increases inequality, and at the same time, offers a better and longer life to all the members of the community. This finding is also in agreement with recent approaches on modern economy [116,117].
The analyses of modern-day economies presented herein, particularly of Greece, UK and Sweden, result in interesting findings, consistent to the principle of maximum entropy. Additional applications can be carried out by analyzing data from different countries worldwide. Such analyses would be useful as many countries strive towards equality in terms of living standards and opportunities provided to their people [102,118], yet still great inequalities exist between the richest and the poorest both in the nation-scale and the international scale [119,120]. The presented entropic evaluation may be helpful in understanding and evaluating these aspects. Although the methodology is of general applicability, a potential limitation relates to the difficulty of obtaining long-term economic data worldwide. Nevertheless, entropy can be incorporated in socio-economic analysis by both ways: as a predictive tool, to identify the spontaneous tendency given existing limitations; and as a diagnostic tool, to characterize change in a probabilistically consistent manner.
This paper suggests an understanding of social stratification from an entropic viewpoint, which may help to inform people, so better decisions may be made. Although it may be tempting to draw political conclusions from this analysis, we insist on the separation between politics and science. As pointed out by Koutsoyiannis [121], history teaches that mixing up science with politics (cf. Eugenics and Lysenkoism) or religion (cf. Giordano Bruno and Galileo) has had tragic results both for science and society. For this reason, we would like to stress that we have to be very careful using this concept (and any other scientific concept) to justify political theories and social policies.
Author Contributions
Conceptualization, D.K. and G.-F.S.; methodology, D.K. and G.-F.S.; validation, G.-F.S. and D.K.; formal analysis, G.-F.S. and D.K.; investigation, G.-F.S. and D.K.; data curation, G.-F.S..; writing—original draft preparation, G.-F.S., T.I., and D.K.; writing—review and editing, P.D., N.M.; visualization, G.-F.S.; supervision, D.K.; project administration, G.-F.S. All authors have read and agreed to the published version of the manuscript.
Funding
This research received no external funding.
Institutional Review Board Statement
Not applicable.
Informed Consent Statement
Not applicable.
Data Availability Statement
Life expectancy. Available online: https://ourworldindata.org/life-expectancy (accessed on 5 October 2020). United Nations, 2019 Revision of World Population Prospects. Available online: https://population.un.org/wpp/ (accessed on 30 November 2020). Total Population. Available online: https://clio-infra.eu/Indicators/TotalPopulation.html, (accessed on 30 November 2020). AQUASTAT: Food and agriculture organization of the United Nations. Available online: http://www.fao.org/nr/water/aquastat/data/query/index.html (accessed on 5 November 2020). Gleick P.H. Basic water requirements for human activities: Meeting basic needs, Water International, 21, pp. 83–92, 1996. FAOSTAT, United Nations Food and Agricultural Organization (FAO). Available online: http://www.fao.org/faostat/en/#data/FBS (accessed on 12 October 2020). Bank of England, Home Statistics Research datasets. Available online: https://0-www-bankofengland-co-uk.brum.beds.ac.uk/statistics/research-datasets (accessed on 25 November 2020). Smil, V., Conversion of Energy: People and Animals, Editor(s): Cutler J. Cleveland, Encyclopedia of Energy, Elsevier, 2004, pp. 697–705, ISBN 9780121764807. Available online: https://0-doi-org.brum.beds.ac.uk/10.1016/B0-12-176480-X/00094-2 (accessed on 1 March 2021). Smil, V., World History and Energy, Editor(s): Cutler J. Cleveland, Encyclopedia of Energy, Elsevier, 2004, pp. 549–561, ISBN 9780121764807, Available online: https://0-doi-org.brum.beds.ac.uk/10.1016/B0-12-176480-X/00025-5 (accessed on 1 March 2021). UNU World Income Inequality Database-WIID Available online: https://www.wider.unu.edu/database/wiidhttps://www.wider.unu.edu/database/wiid (accessed on 23 January 2021). Lazaretou, S. The Greek brain drain: the new pattern of Greek emigration during the recent crisis, Economic Bulletin, Bank of Greece, issue 43, pp. 31–53, July 2016. Eurostat: Emigration by age group, sex, and citizenship, Available online: http://appsso.eurostat.ec.europa.eu/nui/show.do?dataset=migr_emi1ctz&lang=en (accessed on 26 January 2021).
Acknowledgments
We thank the editors of World-MDPI for the invitation to contribute with a paper and the processing of the paper, as well as two anonymous reviewers, for comments that helped improve and enrich the manuscript, and a third anonymous reviewer for the enthusiastic review. D.K. and G.F.S. would like to thank T. Xanthopoulos, writer of the book trilogy “Requiem with Crescendo”, for inspiring thoughts on relevant issues presented in the inauguration of the book. G.F.S. also thanks him for his help in delving into political and economic theories, and the endless discussions on relevant philosophical issues. As “Requiem with Crescendo” deals with social inequality, it has been the inspiration of this work.
Conflicts of Interest
The authors declare no conflict of interest.
References
- Holy Bible, New Testament, Mathew 25. pp. 14–30. Available online: http://www.apostoliki-diakonia.gr/bible/bible.asp?contents=new_testament/contents_mathaiou.asp&main=mathaiou&file=1.1.25.htm (accessed on 15 December 2020).
- Milanovic, B. Global Income Inequality by the Numbers: in History and Now, Policy Research Working Paper 6259, The World Bank Development Research Group Poverty and Inequality Team. November 2012. Available online: http://documents1.worldbank.org/curated/en/959251468176687085/pdf/wps6259.pdf (accessed on 5 October 2020).
- Haitovsky, Y. Statistical Analysis, Special Problems of: Grouped Observations. In International Encyclopedia of the Social & Behavioral Sciences; Smelser, N.J., Baltes, P.B., Eds.; Elsevier: Pergamon, Turkey, 2001; pp. 14995–15002. ISBN 9780080430768. [Google Scholar] [CrossRef]
- Smith, A. The Wealth of Nations; W. Strahan and T. Cadell: London, UK, 1776. [Google Scholar]
- Phillipson, N. Adam Smith: An Enlightened Life; Yale University Press: New Haven, CT, USA, 2010. [Google Scholar]
- Gray, A. The Socialist Tradition: Moses to Lenin; Longmans, Green and Co.: New York, NY, USA, 1946; Available online: https://0-doi-org.brum.beds.ac.uk/10.1017/S0022050700053481 (accessed on 1 March 2021).
- Galbraith, J.K. Economics in Perspective: A Critical History; Houghton Mifflin: Boston, MA, USA, 1987. [Google Scholar]
- Malthus, T.R. An Essay on the Principle of Population; J. Johnson: London, UK, 1798. [Google Scholar]
- Darwin, C. On the Origin of Species; John Murray: London, UK, 1859. [Google Scholar]
- Rogers, J.A. Darwinism and social Darwinism. J. Hist. Ideas 1972, 333, 265–280. [Google Scholar] [CrossRef] [Green Version]
- Hawkins, M.; Hawkins, M. Social Darwinism in European and American Thought, 1860–1945: Nature as Model and Nature as Threat; Cambridge University Press: Cambridge, UK, 1997. [Google Scholar]
- Marx, K. Capital. A Critique of Political Economy. In Das Kapital: Kritik der Politischen Oekonomie; Verlag von Otto Meissner: Hamburg, Germany, 1867; Volume 1. [Google Scholar]
- Marx, K. Critique of the Gotha Programme. Available online: https://www.marxists.org/archive/marx/works/1875/gotha/ch01.htm (accessed on 21 January 2021).
- Sitton, J.F. Critique of the Gotha Programme. In Marx Today; Sitton, J.F., Ed.; Palgrave Macmillan: New York, NY, USA, 2010. [Google Scholar] [CrossRef]
- Keynes, J.M. The General Theory of Employment, Interest and Money; Palgrave Macmillan: London, UK, 1936. [Google Scholar]
- Friedman, M. A Program for Monetary Stability; Fordham University Press: New York, NY, USA, 1960. [Google Scholar]
- Hayek, F.A. The Constitution of Liberty; University of Chicago Press: Chicago, IL, USA, 1960. [Google Scholar]
- Hasan, Z. Democracy and the Crisis of Inequality; Primus Books: Delhi, India, 2014. [Google Scholar]
- Rodney, W. How Europe Underdeveloped Africa; Bogle-L’Ouverture Publications: London, UK, 1972. [Google Scholar]
- Richard, W. Tresch, Chapter 4—The Social Welfare Function in Policy Analysis. In Tresch, Public Finance, 3rd ed.; Richard, W., Ed.; Academic Press: Cambridge, MA, USA, 2015; pp. 57–78. ISBN 9780124158344. [Google Scholar] [CrossRef]
- Lorenz Curve. Available online: https://0-www-sciencedirect-com.brum.beds.ac.uk/topics/economics-econometrics-and-finance/lorenz-curve (accessed on 5 October 2020).
- Bellù, L.G.; Liberati, P. Charting Income Inequality. The Lorenz Curve, Food and Agriculture Organization of the United Nations, FAO. 2005. Available online: http://www.fao.org/3/a-am391e.pdf (accessed on 28 December 2020).
- Income Inequality. Available online: https://ourworldindata.org/income-inequality (accessed on 5 October 2020).
- Gini Index. Available online: https://www.investopedia.com/terms/g/gini-index.asp (accessed on 5 October 2020).
- Bellù, L.G.; Liberati, P. Inequality Analysis. The Gini Index, Food and Agriculture Organization of the United Nations, FAO. 2006. Available online: http://www.fao.org/3/a-am352e.pdf (accessed on 28 December 2020).
- Atkinson, A.B.; Bourguignon, F. Income Distribution. In International Encyclopedia of the Social & Behavioral Sciences; Smelser, N.J., Baltes, P.B., Eds.; Elsevier: Amsterdam, The Netherlands, 2001; pp. 7265–7271. ISBN 9780080430768. [Google Scholar] [CrossRef]
- Morelli, S.; Smeeding, T.; Thompson, J. Chapter 8—Post-1970 Trends in Within-Country Inequality and Poverty: Rich and Middle-Income Countries. In Atkinson, François Bourguignon, Handbook of Income Distribution; Anthony, B., Ed.; Elsevier: Amsterdam, The Netherlands, 2015; Volume 2, pp. 593–696. ISSN 1574-0056. ISBN 9780444594303. [Google Scholar] [CrossRef]
- Förster, M.F.; Tóth, I.G. Chapter 19—Cross-Country Evidence of the Multiple Causes of Inequality Changes in the OECD Area. In Atkinson, François Bourguignon, Handbook of Income Distribution; Anthony, B., Ed.; Elsevier: Amsterdam, The Netherlands, 2015; Volume 2, pp. 1729–1843. ISSN 1574-0056. ISBN 9780444594303. [Google Scholar] [CrossRef]
- Income Distribution, Redefining Capitalism in Global Economic Development. 2017. Available online: https://0-www-sciencedirect-com.brum.beds.ac.uk/topics/economics-econometrics-and-finance/income-distribution (accessed on 5 October 2020).
- Roine, J.; Waldenström, D. Chapter 7—Long-Run Trends in the Distribution of Income and Wealth. In Atkinson, François Bourguignon, Handbook of Income Distribution; Anthony, B., Ed.; Elsevier: Amsterdam, The Netherlands, 2015; Volume 2, pp. 469–592. ISSN 1574-0056. ISBN 9780444594303. [Google Scholar] [CrossRef] [Green Version]
- Piketty, T. Theories of Persistent Inequality and Intergenerational Mobility. In Handbook of Income Distribution; Elsevier: Amsterdam, The Netherlands, 2000; pp. 429–476. [Google Scholar]
- Jones, C.I. Simple Models of Pareto Income and Wealth Inequality. 2014. Available online: http://web.stanford.edu/~chadj/SimpleParetoJEP.pdf (accessed on 25 December 2020).
- Pareto, V. Manual of Political Economy, with an Introduction to Social Science (Manuale di Economia Politica, con una Introduzione alla Scienza Sociale); Società Editrice Libraria: Milano, Italy, 1919. [Google Scholar]
- Blanchet, T.; Fournier, J.; Piketty, T. Generalized Pareto Curves: Theory and Applications, WID.World Working Paper, 2017/3. Available online: https://wid.world/document/blanchet-t-fournier-j-piketty-t-generalized-pareto-curves-theory-applications-2017/ (accessed on 7 February 2021).
- Ryu, H.K. Maximum Entropy Estimation of Income Distributions from Bonferroni Indices. In Modeling Income Distributions and Lorenz Curves. Economic Studies in Equality, Social Exclusion and Well-Being; Chotikapanich, D., Ed.; Springer: New York, NY, USA, 2008; Volume 5. [Google Scholar] [CrossRef]
- Ryu, H.K. A bottom poor sensitive Gini coefficient and maximum entropy estimation of income distributions. Econ. Lett. 2013, 118, 370–374. [Google Scholar] [CrossRef] [Green Version]
- Fu, Q.; Villas-Boas, S.B.; Judge, G. Entropy-based China income distributions and inequality measures. China Econ. J. 2019, 12, 352–368. [Google Scholar] [CrossRef] [Green Version]
- Dinga, E.; Tănăsescu, C.-R.; Ionescu, G.-M. Social Entropy and Normative Network. Entropy 2020, 22, 1051. Available online: https://0-www-mdpi-com.brum.beds.ac.uk/1099-4300/22/9/1051 (accessed on 5 October 2020). [CrossRef]
- Davis, P.J. Entropy and Society: Can the Physical/Mathematical Notions of Entropy Be Usefully Imported into the Social Sphere? J. Humanist. Math. 2011, 1, 119–136. Available online: https://scholarship.claremont.edu/jhm/vol1/iss1/9 (accessed on 7 February 2021). [CrossRef]
- Mayer, A.L.; Donovan, R.P.; Pawlowski, C.W. Information and entropy theory for the sustainability of coupled human and natural systems. Ecol. Soc. 2014, 19, 11. [Google Scholar] [CrossRef]
- Johansson, A. Entropy and the cost of complexity in industrial production, Exergy. Int. J. 2002, 2, 295–299. [Google Scholar] [CrossRef]
- Netto, V.M.; Meirelles, J.; Ribeiro, F.L. Social Interaction and the City: The Effect of Space on the Reduction of Entropy. Complexity 2017. [Google Scholar] [CrossRef] [Green Version]
- Mavrofides, T.; Kameas, A.; Papageorgiou, D.; Los, A. On the Entropy of Social Systems: A Revision of the Concepts of Entropy and Energy in the Social Context. Syst. Res. 2011, 28, 353–368. [Google Scholar] [CrossRef]
- Koutsoyiannis, D. Stochastics of Hydroclimatic Extremes—A Cool Look at Risk; National Technical University of Athens: Athens, Greece, 2020; 330p. [Google Scholar]
- Dyble, M.; Salali, G.D.; Chaudhary, N.; Page, A.; Smith, D.; Thompson, J.; Vinicius, L.; Mace, R.; Migliano, A.B. Sex equality can explain the unique social structure of hunter-gatherer bands. Science 2015, 348, 796–798. [Google Scholar] [CrossRef]
- Woodburn, J. Egalitarian Societies, Man. 1982, pp. 431–451. Available online: http://0-links-jstor-org.brum.beds.ac.uk/sici?sici=0025-1496%28198209%292%3A17%3A3%3C431%3AES%3E2.0.CO%3B2-W (accessed on 14 February 2021).
- Lewis, H.; Vinicius, L.; Strods, J.; Ruth, M.; Bamberg Migliano, A. High mobility explains demand sharing and enforced cooperation in egalitarian hunter-gatherers. Nat. Commun. 2014, 5, 5789. [Google Scholar] [CrossRef] [Green Version]
- Gowdy, J. Hunter-Gatherers and the Mythology of the Market. The Cambridge Encyclopedia of Hunters and Gatherers; Cambridge University Press: Cambridge, UK, 2006; pp. 391–393. ISBN 0-521-60919-4. [Google Scholar]
- Smith, E.A.; Hill, K.; Marlowe, F.; Nolin, D.; Wiessner, P.; Gurven, M.; Bowles, S.; Borgerhoff Mulder, M.; Hertz, T.; Bellj, A. Wealth transmission and inequality among hunter-gatherers. Curr. Anthropol. 2010, 51, 19–34. [Google Scholar] [CrossRef] [Green Version]
- Orans, M. Surplus. Hum. Organ. 1966, 25, 24–32. [Google Scholar] [CrossRef]
- Angle, J. The Surplus Theory of Social Stratification and the Size Distribution of Personal Wealth. Soc. Forces 1986, 65, 293–326. [Google Scholar] [CrossRef]
- Herskovits, M.J. The Economic Life of Primitive Peoples; Alfred A. Knopf, Inc.: New York, NY, USA, 1940. [Google Scholar]
- First Economic Adjustment Programme for Greece. Available online: https://en.wikipedia.org/wiki/First_Economic_Adjustment_Programme_for_Greece (accessed on 28 December 2020).
- Labrianidis, L.; Pratsinakis, M. Greece’s New Emigration at Times of Crisis. GreeSE Papers (99). Hellenic Observatory, LSE, London. 2016. Available online: http://eprints.lse.ac.uk/66811/ (accessed on 2 January 2021).
- Bao, X.D. The conception of healthcare in Confucianism. Zhonghua Yi Shi Za Zhi 2003, 33, 24–26. [Google Scholar]
- Guo, Z. Chinese Confucian culture and the medical ethical tradition. J. Med. Ethics 1995, 21, 239–246. [Google Scholar] [CrossRef] [Green Version]
- Water, Food and Energy. Available online: https://www.unwater.org/water-facts/water-food-and-energy (accessed on 2 January 2021).
- Life Expectancy. Available online: https://ourworldindata.org/life-expectancy (accessed on 5 October 2020).
- Mamassis, N.; Efstratiadis, A.; Dimitriadis, P.; Iliopoulou, T.; Ioannidis, R.; Koutsoyiannis, D. Water and Energy, Handbook of Water Resources Management: Discourses, Concepts and Examples; Bo-gardi, J., Wasantha, K.D., Nandalal, R.R.P., van Nooyen, R., Bhaduri, A., Eds.; Springer Nature: Cham, Switzerland, 2020; Chapter 20. [Google Scholar]
- Alcamo, J.; Döll, P.; Henrichs, T.; Kaspar, F.; Lehner, B.; Rösch, T.; Siebert, S. Development and testing of the WaterGAP 2 global model of water use and availability. Hydrol. Sci. J. 2003, 48, 317–337. [Google Scholar] [CrossRef]
- Aus der Beek, T.; Flörke, M.; Lapola, D.M.; Schaldach, R.; Voß, F.; Teichert, E. Modelling historical and current irrigation water demand on the continental scale: Europe. Adv. Geosci. 2010, 27, 79–85. [Google Scholar] [CrossRef] [Green Version]
- United Nations. 2019 Revision of World Population Prospects. Available online: https://population.un.org/wpp/ (accessed on 30 November 2020).
- Total Population. Available online: https://clio-infra.eu/Indicators/TotalPopulation.html (accessed on 30 November 2020).
- AQUASTAT: Food and Agriculture Organization of the United Nations. Available online: http://www.fao.org/nr/water/aquastat/data/query/index.html (accessed on 5 November 2020).
- Gleick, P.H. Basic water requirements for human activities: Meeting basic needs. Water Int. 1996, 21, 83–92. [Google Scholar] [CrossRef]
- FAOSTAT, United Nations Food and Agricultural Organization (FAO). Available online: http://www.fao.org/faostat/en/#data/FBS (accessed on 12 October 2020).
- Bank of England, Home Statistics Research Datasets. Available online: https://0-www-bankofengland-co-uk.brum.beds.ac.uk/statistics/research-datasets (accessed on 25 November 2020).
- Ostwald, W. Energetische Grundlagen der Kulturwissenschaft; Creative Media Partners, LLC.: Sacramento, CA, USA, 2015. [Google Scholar]
- Lévi-Strauss, C. Tristes Tropiques; Atheneum: New York, NY, USA, 1963. [Google Scholar]
- Lévi-Strauss, C. Structural Anthropology; Basic Books: New York, NY, USA, 1963. [Google Scholar]
- Lévi-Strauss, C. Social structure. In Anthropology Today: Selections; Tax, S., Ed.; University of Chicago Press: Chicago, IL, USA, 2021; pp. 321–350. Available online: http://varenne.tc.columbia.edu/bib/info/levstcld062socistru.html (accessed on 25 January 2021).
- Xanthopoulos, T. Requiem with Crescendo, Homo Sapiens the Ultimate Genus of Human; National Technical University of Athens: Athens, Greece, 2020; Volume 1–3. [Google Scholar]
- Maddison Project Database. 2018. Available online: https://www.rug.nl/ggdc/historicaldevelopment/maddison/releases/maddison-project-database-2018 (accessed on 30 November 2020).
- Steam Turbines: How Big Can They Get? Available online: https://www.modernpowersystems.com/features/featuresteam-turbines-how-big-can-they-get/ (accessed on 5 October 2020).
- Smil, V. Conversion of Energy: People and Animals. In Cleveland, Encyclopedia of Energy; Cutler, J., Ed.; Elsevier: Amsterdam, The Netherlands, 2004; pp. 697–705. ISBN 9780121764807. [Google Scholar] [CrossRef]
- Smil, V. World History and Energy. In Cleveland, Encyclopedia of Energy; Cutler, J., Ed.; Elsevier: Amsterdam, The Netherlands, 2004; pp. 549–561. ISBN 9780121764807. [Google Scholar] [CrossRef]
- Sargentis, G.-F.; Iliopoulou, T.; Sigourou, S.; Dimitriadis, P.; Koutsoyiannis, D. Evolution of Clustering Quantified by a Stochastic Method—Case Studies on Natural and Human Social Structures. Sustainability 2020, 12, 7972. [Google Scholar] [CrossRef]
- Goldewijk, K.; Beusen, A.; van Drecht, G.; de Vos, M. The HYDE 3.1 spatially explicit database of human-induced global land-use change over the past 12,000 years. Glob. Ecol. Biogeogr. 2011, 20, 73–86. [Google Scholar] [CrossRef]
- Smith, A. Ancient and Traditional Agriculture, Pastoralism, and Agricultural Societies in Sub-Saharan Africa. Oxf. Res. Encycl. Environ. Sci. 2019. [Google Scholar] [CrossRef]
- Jiang, Y.; Zhang, Q.; Niu, J.; Wu, J. Pastoral Population Growth and Land Use Policy Has Significantly Impacted Livestock Structure in Inner Mongolia—A Case Study in the Xilinhot Region. Sustainability 2019, 11, 7208. [Google Scholar] [CrossRef] [Green Version]
- Davis, J.; Hatfield, R. The economics of mobile pastoralism: a global summary. Nomadic Peoples 2007, 11, 91–116. Available online: www.jstor.org/stable/43123794 (accessed on 12 December 2020). [CrossRef]
- Coughenour, M.B.; Ellis, J.E.; Swift, D.M.; Coppock, D.L.; Galvin, K.; McCabe, J.T.; Hart, T.C. Energy extraction and use in a nomadic pastoral ecosystem. Science 1985, 230, 619–625. [Google Scholar] [CrossRef]
- Singh, H.; Mishra, D.; Nahar, N.M. Energy use pattern in production agriculture of a typical village in arid zone, India. Energy Convers. Manag. 2002, 43, 2275–2286. [Google Scholar] [CrossRef]
- Canakci, M.; Topakci, M.; Akinci, I.; Ozmerzi, A. Energy use pattern of some field crops and vegetable production: Case study for Antalya Region, Turkey. Energy Convers. Manag. 2005, 46, 655–666. [Google Scholar] [CrossRef]
- Kander, A.; Warde, P. Energy Availability from Livestock and Agricultural Productivity in Europe, 1815–1913: A New Comparison. Econ. Hist. Rev. 2011, 64, 1–29. Available online: http://0-www-jstor-org.brum.beds.ac.uk/stable/27919479 (accessed on 30 November 2020). [CrossRef] [PubMed]
- Schnepf, R. Energy Use in Agriculture: Background and Issues, CRS Report for Congress, Received through the CRS Web. 2004. Available online: https://nationalaglawcenter.org/wp-content/uploads/assets/crs/RL32677.pdf (accessed on 5 October 2020).
- Vreni, J.-R.; Crump, L.; Abicho, A.A.; Abakar, A.A.; Mahamat, A., II; Bechir, M.; Eckert, S.; Engesser, M.; Schelling, E.; Zinsstag, J. Estimating population and livestock density of mobile pastoralists and sedentary settlements in the south-eastern Lake Chad area. Geospat. Health 2015, 10. [Google Scholar] [CrossRef] [Green Version]
- Sackett, R. Time, Energy, and the Indolent Savage. A Quantitative Cross-Cultural Test of the Primitive Affluence Hypothesis. Ph.D. Thesis, University of California, Oakland, CA, USA, 1996. [Google Scholar]
- Kander, A.; Warde, P. Number, Size and Energy Consumption of Draught Animals in European Agriculture, Working Paper, March 2009. Available online: https://histecon.fas.harvard.edu/energyhistory/data/warde_kander_working_paper_animals-mar09.pdf (accessed on 5 October 2020).
- Koutsoyiannis, D. Entropy production in stochastics. Entropy 2017, 19, 581. [Google Scholar] [CrossRef] [Green Version]
- Jaynes, E.T. Information theory and statistical mechanics. Phys. Rev. 1957, 106, 620–630. [Google Scholar] [CrossRef]
- Clausius, R. The Mechanical Theory of Heat: with Its Applications to the Steam-Engine and To the Physical Properties of Bodies; J. van Voorst: London, UK, 1867; Available online: http://books.google.gr/books?id=8LIEAAAAYAAJ (accessed on 5 February 2021).
- Koutsoyiannis, D. Entropy: From Thermodynamics to Hydrology. Entropy 2014, 16, 1287–1314. [Google Scholar] [CrossRef] [Green Version]
- Koutsoyiannis, D. On the book “Requiem with Crescendo” by T. Xanthopoulos. In Presentation of the Book “Requiem with Crescendo”; National Technical University of Athens: Athens, Greece, 2018. [Google Scholar] [CrossRef]
- Lenski, G.E. Power and Privilege: A Theory of Social Stratification; McGraw-Hill: New York, NY, USA, 1966. [Google Scholar]
- Collins, R. Theoretical Sociology; Harcourt College Pub: New York, NY, USA, 1988. [Google Scholar]
- Trigger, B.G. Understanding Early Civilizations: A Comparative Study; Cambridge University Press: New York, NY, USA, 2003. [Google Scholar]
- Henrich, J.; Boyd, R. Division of labor, economic specialization, and the evolution of social stratification. Curr. Anthropol. 2008, 49, 715–724. [Google Scholar] [CrossRef]
- Preston, S.H. Human mortality throughout history and prehistory. State Humanit. 1995, 15, 30–36. [Google Scholar]
- Edwards, C. The Impact of European Overseas Discoveries on Ship Design and Construction during the Sixteenth Century. GeoJournal 1992, 26, 443–452. [Google Scholar] [CrossRef]
- How Currency Works. Available online: https://money.howstuffworks.com/currency.htm (accessed on 15 December 2020).
- Russian President Putin Delivers Speech at Virtual World Economic Forum. Available online: http://thesaker.is/russian-president-putin-delivers-speech-at-virtual-world-economic-forum/. (accessed on 28 January 2021).
- Björn, H. Deprivation and Poverty: A Comparative Analysis of Sweden and Great Britain. Acta Sociol. 1996, 39, 141–168. Available online: www.jstor.org/stable/4194815 (accessed on 26 December 2020).
- UNU World Income Inequality Database—WIID. Available online: https://www.wider.unu.edu/database/wiid (accessed on 23 January 2021).
- Sweden. Available online: https://el.wikipedia.org/wiki/Σουηδία (accessed on 26 January 2021).
- Lazaretou, S. The Greek brain drain: the new pattern of Greek emigration during the recent crisis. Econ. Bull. 2016, 43, 31–53. [Google Scholar]
- Eurostat: Emigration by Age Group, Sex and Citizenship. Available online: http://appsso.eurostat.ec.europa.eu/nui/show.do?dataset=migr_emi1ctz&lang=en (accessed on 26 January 2021).
- Kathimerini: Where Are the Greek Immigrants Going? Available online: https://www.kathimerini.gr/society/873724/poy-pane-oi-ellines-metanastes/ (accessed on 26 January 2021).
- Hans Rosling’s 200 Countries, 200 Years, 4 Minutes—The Joy of Stats—BBC Four. Available online: https://youtu.be/jbkSRLYSojo (accessed on 26 January 2021).
- Oxfam, The Inequality Virus. Available online: https://www.oxfam.org/en/research/inequality-virus (accessed on 26 January 2021).
- Hofstede, G.; Bond, M.H. The Confucius connection: From cultural roots to economic growth. Organ. Dyn. 1988, 16, 5–21. [Google Scholar] [CrossRef]
- Pettman, R. Confucian Marxism. In Reason, Culture, Religion. Culture and Religion in International Relations; Palgrave Macmillan: New York, NY, USA, 2004. [Google Scholar] [CrossRef]
- Elliott, J.; Clark, B. Keynes’s “General Theory” and Social Justice. J. Post Keynes. Econ. 1987, 9, 381–394. Available online: http://0-www-jstor-org.brum.beds.ac.uk/stable/4538019 (accessed on 3 February 2021). [CrossRef]
- Reich, R.B. How to Shrink Inequality, The Nation 26 May 2014. Available online: https://www.thenation.com/article/archive/how-shrink-inequality/ (accessed on 3 February 2021).
- Hudson, M. Finance Capitalism vs. Industrial Capitalism, The Unz Review, An Alternative Media Selection, 29 January 2021. Available online: https://www.unz.com/mhudson/finance-capitalism-vs-industrial-capitalism-2/ (accessed on 5 February 2021).
- Roser, M. The Economies that Are Home to the Poorest Billions of People Need to Grow If We Want Global Poverty to Decline, 22 February 2021. Available online: https://ourworldindata.org/poverty-growth-needed (accessed on 25 February 2021).
- Lamper, M.; Inglehart, R.; Metaal, S.; Schoemaker, H.; Papadongonas, P. Covid Pandemic Ignites Fear, but Boosts Progressiveide Alsand Calls for Inclusive Economic Growth, Measuring the Pandemic’s Impact on Social Values, Emotions and Priorities in 24 Countries, Glocalities, 23 February 2021. Available online: https://glocalities.com/latest/reports/valuestrends (accessed on 25 February 2021).
- Xi Jinping’s Speech at the Virtual Davos Agenda Event. Available online: https://news.cgtn.com/news/2021-01-25/Full-text-Xi-Jinping-s-speech-at-the-virtual-Davos-Agenda-event-Xln4hwjO2Q/index.html (accessed on 26 January 2021).
- The IMF and Income Inequality. Available online: https://www.imf.org/en/Topics/Inequality (accessed on 26 January 2021).
- Oxfam, the Power of People against Povery. Available online: https://www.oxfam.org/en (accessed on 26 January 2021).
- Koutsoyiannis, D. Rethinking climate, climate change, and their relationship with water. Water 2021, 13, 849. [Google Scholar] [CrossRef]
Figure 1.
GDP per capita per year related to life expectancy; (a) global average through 1870–2011; (b) average per country in 2018 [58].
Figure 1.
GDP per capita per year related to life expectancy; (a) global average through 1870–2011; (b) average per country in 2018 [58].

Figure 2.
GDP per capita per year related to freshwater withdrawal; (a) global average through 1870–2011; (b) average per country in 2018 [60,61,62,63].

Figure 3.
GDP per capita per year related to: (a) municipal water withdrawal per capita per year, average per country in 2018; (b) access to safe drinking water, average per country in 2018 [64,65].

Figure 4.
GDP per capita per year related to daily caloric supply; (a) global average through 1960–2011; (b) average per country in 2018 [66].
Figure 4.
GDP per capita per year related to daily caloric supply; (a) global average through 1960–2011; (b) average per country in 2018 [66].

Figure 5.
GDP per capita per year related to daily caloric supply and life expectancy; United Kingdom’s, GDP, caloric supply data from: 1270–2016 life expectancy data from: 1800–2016 [66,67].

Figure 6.
GDP per capita per year related to consumption of energy per capita per year; (a) global average data from: 1870–2011; (b) country’s average data from: 2018. [73].
Figure 6.
GDP per capita per year related to consumption of energy per capita per year; (a) global average data from: 1870–2011; (b) country’s average data from: 2018. [73].

Figure 7.
(a) Temperatures created by human actions in different eras. (b) Power of the largest prime movers in different eras [74,75,76] (diagrams present data in logarithmic scale as order of magnitude).

Figure 8.
Typical types of food production in different eras related to: (a) population density; (b) energy needs (diagrams present data as order of magnitude) [75,76,79,80,81,82,83,84,85,86,87].

Figure 9.
(a) Population density related to energy needs. (b) Energy needs per capita per day in different types of societies (diagrams present data as order of magnitude) [75,76,79,80,81,82,83,84,85,86,87].

Figure 10.
(a) Share of wealth, using energy as a proxy, in the Hunter-Gatherers and granger’s society; (b) Lorenz curve. (c) Probability distribution function of energy. (d) Probability density function of the standardized energy.
Figure 10.
(a) Share of wealth, using energy as a proxy, in the Hunter-Gatherers and granger’s society; (b) Lorenz curve. (c) Probability distribution function of energy. (d) Probability density function of the standardized energy.


Figure 12.
Steps of sailing, connected areas with same color; red, ~10,000 BC rowing boat; yellow, ~1500 BC shipping with tailwind; green, ~1500 AD shipping with caravels.
Figure 12.
Steps of sailing, connected areas with same color; red, ~10,000 BC rowing boat; yellow, ~1500 BC shipping with tailwind; green, ~1500 AD shipping with caravels.

Figure 13.
1991 Share of income in Sweden and the United Kingdom; (a) tenths of the share (%) of people from the lowest to highest income versus share (%) of income earned (b) Lorenz curve.
Figure 13.
1991 Share of income in Sweden and the United Kingdom; (a) tenths of the share (%) of people from the lowest to highest income versus share (%) of income earned (b) Lorenz curve.

Figure 14.
1991 Share of income in Sweden and the United Kingdom. (a) Distribution function. (b) Probability density function of the standardized income.
Figure 14.
1991 Share of income in Sweden and the United Kingdom. (a) Distribution function. (b) Probability density function of the standardized income.

Figure 15.
United Kingdom (1970–2018): (a) GDP per capita and Φ[x]; (b) Gini and entropic index of inequality ΔΦ.
Figure 15.
United Kingdom (1970–2018): (a) GDP per capita and Φ[x]; (b) Gini and entropic index of inequality ΔΦ.

Figure 16.
Sweden (1970–2018): (a) GDP per capita and Φ[x]; (b) Gini and entropic index of inequality ΔΦ.
Figure 16.
Sweden (1970–2018): (a) GDP per capita and Φ[x]; (b) Gini and entropic index of inequality ΔΦ.

Figure 17.
Sweden and United Kingdom, timeline of: (a) Gini coefficient; (b) GDP per capita.

Figure 18.
Sweden and United Kingdom, timeline of: (a) entropy Φ[x]; (b) entropic index of inequality ΔΦ.
Figure 18.
Sweden and United Kingdom, timeline of: (a) entropy Φ[x]; (b) entropic index of inequality ΔΦ.

Figure 19.
Greece and United Kingdom, timeline of total entropy Φ[x] and immigration flows from Greece to United Kingdom, over the same period.
Figure 19.
Greece and United Kingdom, timeline of total entropy Φ[x] and immigration flows from Greece to United Kingdom, over the same period.


Table 1.
Prehistoric human, different types of living, minimum area, and energy needs for food production (present data as order of magnitude) [75,76,79,80,81,82,83,84,85,86,87].
| Type of Living | Area (ha) | Energy Per Capita per Day for Food (kWh) |
|---|---|---|
| Hunter-Gatherers | 100 | 1 |
| Pastorals (pastoralism) | 2 | 2.50 |
| Granger (agriculture) | 1 | 3.50 |
Publisher’s Note: MDPI stays neutral with regard to jurisdictional claims in published maps and institutional affiliations. |
© 2021 by the authors. Licensee MDPI, Basel, Switzerland. This article is an open access article distributed under the terms and conditions of the Creative Commons Attribution (CC BY) license (https://creativecommons.org/licenses/by/4.0/).
Share and Cite
MDPI and ACS Style
Sargentis, G.-F.; Iliopoulou, T.; Dimitriadis, P.; Mamassis, N.; Koutsoyiannis, D. Stratification: An Entropic View of Society’s Structure. World 2021, 2, 153-174. https://0-doi-org.brum.beds.ac.uk/10.3390/world2020011
AMA Style
Sargentis G-F, Iliopoulou T, Dimitriadis P, Mamassis N, Koutsoyiannis D. Stratification: An Entropic View of Society’s Structure. World. 2021; 2(2):153-174. https://0-doi-org.brum.beds.ac.uk/10.3390/world2020011
Chicago/Turabian StyleSargentis, G.-Fivos, Theano Iliopoulou, Panayiotis Dimitriadis, Nikolaos Mamassis, and Demetris Koutsoyiannis. 2021. "Stratification: An Entropic View of Society’s Structure" World 2, no. 2: 153-174. https://0-doi-org.brum.beds.ac.uk/10.3390/world2020011