Article

The GASA Gene Family in Cacao (Theobroma cacao, Malvaceae): Genome Wide Identification and Expression Analysis

1
Department of Biochemistry, Faculty of Biological Sciences, Quaid-i-Azam University, Islamabad 45320, Pakistan
2
Department of Plant Breeding, Faculty of Crop Sciences, Sari Agricultural Sciences and Natural Resources University (SANRU), Sari 4818166996, Iran
3
Alpha Genomics Private Limited, Islamabad 45710, Pakistan
4
Faculty of Agriculture, Shahrood University of Technology, Shahrood 3619995161, Iran
5
Finnish Museum of Natural History, University of Helsinki, P.O. Box 7, FI-00014 Helsinki, Finland
6
Faculty of Biological and Environmental Sciences, University of Helsinki, P.O. Box 65, FI-00065 Helsinki, Finland
7
Institute of Advanced Studies Kőszeg (iASK), P.O. Box 4, H-9731 Kőszeg, Hungary
*
Authors to whom correspondence should be addressed.
Submission received: 30 May 2021 / Revised: 6 July 2021 / Accepted: 14 July 2021 / Published: 16 July 2021
(This article belongs to the Special Issue Omics Approaches for Crop Improvement)

Abstract

:
The gibberellic acid-stimulated Arabidopsis (GASA/GAST) gene family is widely distributed in plants and involved in various physiological and biological processes. These genes also provide resistance to abiotic and biotic stresses, including antimicrobial, antiviral, and antifungal. We are interested in characterizing the GASA gene family and determining its role in various physiological and biological process in Theobroma cacao. Here, we report 17 tcGASA genes distributed on six chromosomes in T. cacao. The gene structure, promoter region, protein structure and biochemical properties, expression, and phylogenetics of all tcGASAs were analyzed. Phylogenetic analyses divided tcGASA proteins into five groups. Among 17 tcGASA genes, nine segmentally duplicating genes were identified which formed four pairs and cluster together in phylogenetic tree. Differential expression analyses revealed that most of the tcGASA genes showed elevated expression in the seeds (cacao food), implying their role in seed development. The differential expression of tcGASAs was recorded between the tolerant and susceptible cultivars of cacao, which indicating their possible role as fungal resistant. Our findings provide new insight into the function, evolution, and regulatory system of the GASA family genes in T. cacao and may suggest new target genes for development of fungi-resistant cacao varieties in breeding programs.

1. Introduction

Theobroma cacao L. belongs to the family Malvaceae [1]. This is an economically important tree and grows in up to 50 countries located in the humid tropics [2]. Theobroma cacao L. seeds are enclosed in pods and are used for chocolate production, confectionery, and cosmetics [3]. This plant is adapted to high humidity areas, and is therefore predisposed to various fungal diseases [4,5]. Pod rot, or black rod, is caused by the Phytophthora species of fungus (P. megakarya, P. palmivora, and P. capsici), leading to 20–30% loss in yield and 10% death of trees [4]. The elucidation of the whole genome is helping to understand the genetic bases of biotic and abiotic stresses [2]. The availability of the high-quality chromosome-level genome assembly of Theobroma cacao [2,6] provides quality resources for the characterization of various gene families to elucidate the role of different gene families in cacao development. However, to the best of our knowledge, few gene families such as WRKY [7], sucrose synthase [8], Stearoyl-acyl carrier protein desaturase [9], sucrose transporter [10], and NAC [11] have been elucidated in Theobroma cacao.
The gibberellic acid-stimulated Arabidopsis (GASA/GAST) gene family is widely distributed in plants and performs various functions [12,13]. GAST1 was the first gene identified among the GASA family’s genes in tomato [14]. GASA proteins are comprised of three domains, including a signal peptide of up to 18–29 amino acids at the N-terminal, hydrophilic and high variable regions of up to 7–31 amino acids in the center, and a conserved domain at the C-terminal of up to 60 amino acids which mostly includes 12 cysteine residues [15,16,17]. The C-terminal domain is the characteristics of all identified GASAs [12,15,16,18]. These cysteine-rich peptides play a vital role in various plant processes. Their roles have been stated in organ development [19], lateral root development [20], stem growth [21], cell division [22,23], fruit ripening and development [24], flowering time [12,18,21], seed development [13,22], and bud dormancy [25]. The detailed expression analyses of various tissues of Arabidopsis, tomato, rice, soybean, and apple showed the tissue-specific expression of the GASA genes [12,15,18]. For example, GASA genes in tomato, including Solyc11g011210, Solyc12g089300, and Solyc01g111075, showed high expression at the fruit-ripening stage, whereas Solyc03g113910, Solyc01g111075, Solyc06g069790, and Solyc12g042500 showed high expression level at the flowering stage [15]. Moreover, some studies also showed the contrast effect of GASA proteins. For instance, AtGASA4 promotes flowering [22], while AtGASA5 induces the opposite effect [21].
The GASA genes also play crucial roles in response to various biotic, abiotic, and hormone-related stresses. For instance, a member of the GASA gene family, GmSN1, over-expressed and enhances virus resistance in Arabidopsis and soybean [26]. Similarly, a high expression level of CcGASA4 was reported in citrus leaves after infection with Citrus tristeza virus [27]. The antimicrobial properties of various proteins of the GASA family have also been reported [28,29,30]. The antifungal activity of the GASA proteins has been reported in almost all tissues of potato, including root, tubers, leaves, stem, stolon, axillary bud, and flowers [28,29,30]. Similarly, the antifungal activity of GASA members has been found in Arabidopsis, tomato, Alfalfa, and Jujuba [16,31,32,33]. The GASAs also showed resistance to various abiotic stresses, such as salt and drought [34]. The induction of GASA4 and GASA6 has been reported in Arabidopsis by growth hormones such as auxin, brassinosteroids (BR), gibberellic acid (GA), and cytokinin. In contrast, repression has been stated by stress hormones including salicylic acid (SA), abscisic acid (ABA), and jasmonic acid (JA) [31]. The expression pattern and evolutionary relationships of GASA genes were studied in Arabidopsis [16], apple [12], common wheat [35], grapevine [13], soybean [18], and potato [36].
Here, we are interested in characterizing the GASA gene family and providing data about the expression analyses of this gene family specifically regarding fungus-related diseases. To the best of our knowledge, we are the first to provide data of GASAs related to their distribution in genome, chemical properties, subcellular localization, and cis-regulatory elements of promoter regions in cacao. We also explored the roles of GASA genes in various abiotic and biotic stresses. This helps us to identify GASAs that show high expressions against infections of fungus Phytophthora megakarya.

2. Materials and Methods

2.1. Identification of GASA Genes in the Genome of Theobroma cacao and Analyses for Conserved GASA Domain

We retrieved the GASA family’s protein sequences from The Arabidopsis Information Resource (TAIR10) database (ftp://ftp.arabidopsis.org). We used them as a query in BLAST for the identification of GASA genes in the Theobroma cacao genome, with an expected value of E−10. The GASA genes were identified in the latest version of the Theobroma cacao genome (Theobroma cacao Belizian Criollo B97-61/B2) [6] and retrieved protein sequences, coding DNA sequences (CDS), genomics, and promoter sequence (1500 bp upstream of gene). The retrieved protein sequences were further analyzed for the presence of the GASA domain using the CDD database, available online: https://0-www-ncbi-nlm-nih-gov.brum.beds.ac.uk/Structure/cdd/wrpsb.cgi (accessed on 24 November 2020), of the National Center for Biotechnology Information (NCBI). All the sequences that showed the presence of the conserved GASA domain were selected for further analyses, whereas all the proteins with an absent/truncated domain were discarded.

2.2. Chromosome Mapping and Characterization of Physiochemical Properties

The position of each gene, including chromosome number and position on chromosome, was noted. All the genes were renamed according to the location of the chromosome and their position, as shown in Table 1. The MapChart software [37] through Ensemble was used to show the position of each tcGASA gene along the position of the chromosome. Various physiochemical properties, including length of the protein, molecular weight (MW), isoelectric point (PI), instability index, and the grand average of hydropathy (GRAVY), were determined using the ExPASy tool [38]. The subcellular localization of GASA genes was also predicted using the BUSCA webserver [39].

2.3. Gene Structure and Promoter Region Analyses

We analyzed CDS sequences for exons–introns within all tcGASA genes using the Gene Structure Display Server, available online: http://gsds.cbi.pku.edu.cn (accessed on 26 November 2020). PlantCare [40] was used to study cis-regulatory elements in the 1500 bp promoter region.

2.4. Prediction of Post-Translational Modifications of GASA Proteins

The phosphorylation site of the GASA proteins was predicted by the NetPhos 3.1 server [41] with a potential value >0.5. N-glycosylation sites were predicted using the NetNGlyc 1.0 server [42] with default parameters.

2.5. Phylogenetic and Conserved Motif Analyses

The phylogenetic relationship of the GASA genes of T. cacao was inferred with GASA genes of six other species, including Arabidopsis thaliana, Gossypium raimondii, Vitis vinifera, Oryza sativa, Brachypodium distachyon, and Zea mays. A similar approach, which was given for the identification of GASA genes in Theobroma cacao, was employed for the identification of the genes of all other species. Clustal Omega [43] was used for multiple alignment of the protein sequences of all species. The unrooted neighbor-joining tree was drawn using MEGA X [44] and visualization of the tree was improved by using an interactive tree of life (iTOL) [45]. The conserved motif distribution into GASA proteins was performed using MEME v5.3.0 server [46]. We searched for a maximum number of five motifs with a minimum width of motif 6 and a maximum width of motif 30.

2.6. Gene Duplications and Estimation of Ka/Ks Values

The identity of >85% in nucleotide sequences of genes is considered a sign of duplication [47]. Hence, we aligned DNA coding sequences using Clustal Omega [43], and the extent of the identity of the genes with each other was determined using Geneious R8.1 [48]. Gene duplication events, as compared to other species, were determined using the MCScan v0.8 program [49] through the Plant Genome Duplication Database.
The selection pressure on GASA genes was determined by calculating non-synonymous (Ka) and synonymous (Ks) substitutions and the ratio of non-synonymous to synonymous substitutions (Ka/Ks) using DnaSP v6 software [50]. The time divergence and duplication were assessed by a synonymous mutation rate of λ substitutions per synonymous site per year as T = (Ks/2λ) (λ = 6.5 × 10−9) × 10−6 [51]. The synteny relationships of GASA genes among the orthologous pairs of T. cacao-O. sativa, T. cacao-A. thaliana, T. cacao-Zea mays, T. cacao-B. distachyon, T. cacao-G. raimondii, and T. cacao-Vitis vinifera at both gene and chromosome levels were visualized using Circos software [52].

2.7. Three-Dimensional Protein Modeling and Molecular Docking

We used iterative template-based fragment assembly simulations in I-TASSER [53] to build three-dimensional protein structures of GASAs after selection of best models by the 3D-refine program [54]. We also used P2Rank in the PrankWeb software [55] and the CASTp tool [56] to analyze the refined structure of GASA proteins to predict protein pockets and cavities. Finally, PyMOL [57] was used to visualize results.

2.8. In Silico Expression Analysis of GASA Genes through RNA-seq Data

The publicly available RNA-seq data related to the cacao genome were employed for expression assays to measure GASA family members in multiple tissues and during various biotic and abiotic stimuli exposure. The RNA-seq data of cacao inoculated with Phytophthora megakarya for 0 h (0 h), 6 h, 24 h, and 72 h in susceptible cultivar Nanay (NA32) and fungal resistant cultivar Scavina (SCA6) were downloaded from GEO DataSets under accession number GSE116041 [58]. The comparison of susceptible cultivar NA32 and fungal resistant cultivar SCA6 was performed to determine differentially expressed genes within both cultivars and to identify those genes that are specifically induced in fungal resistant cultivar SCA6. These data were log2 transformed to generate heatmaps via the TBtools package [59]. Furthermore, the expression levels of GASA genes for tissue specific expression and under multiple abiotic stresses, including cold, osmotic, salt, drought, UV, wounding, and heat, have been detected in the Arabidopsis orthologous genes for tcGASAs (SAMEA5755003 and PRJEB33339).

3. Results

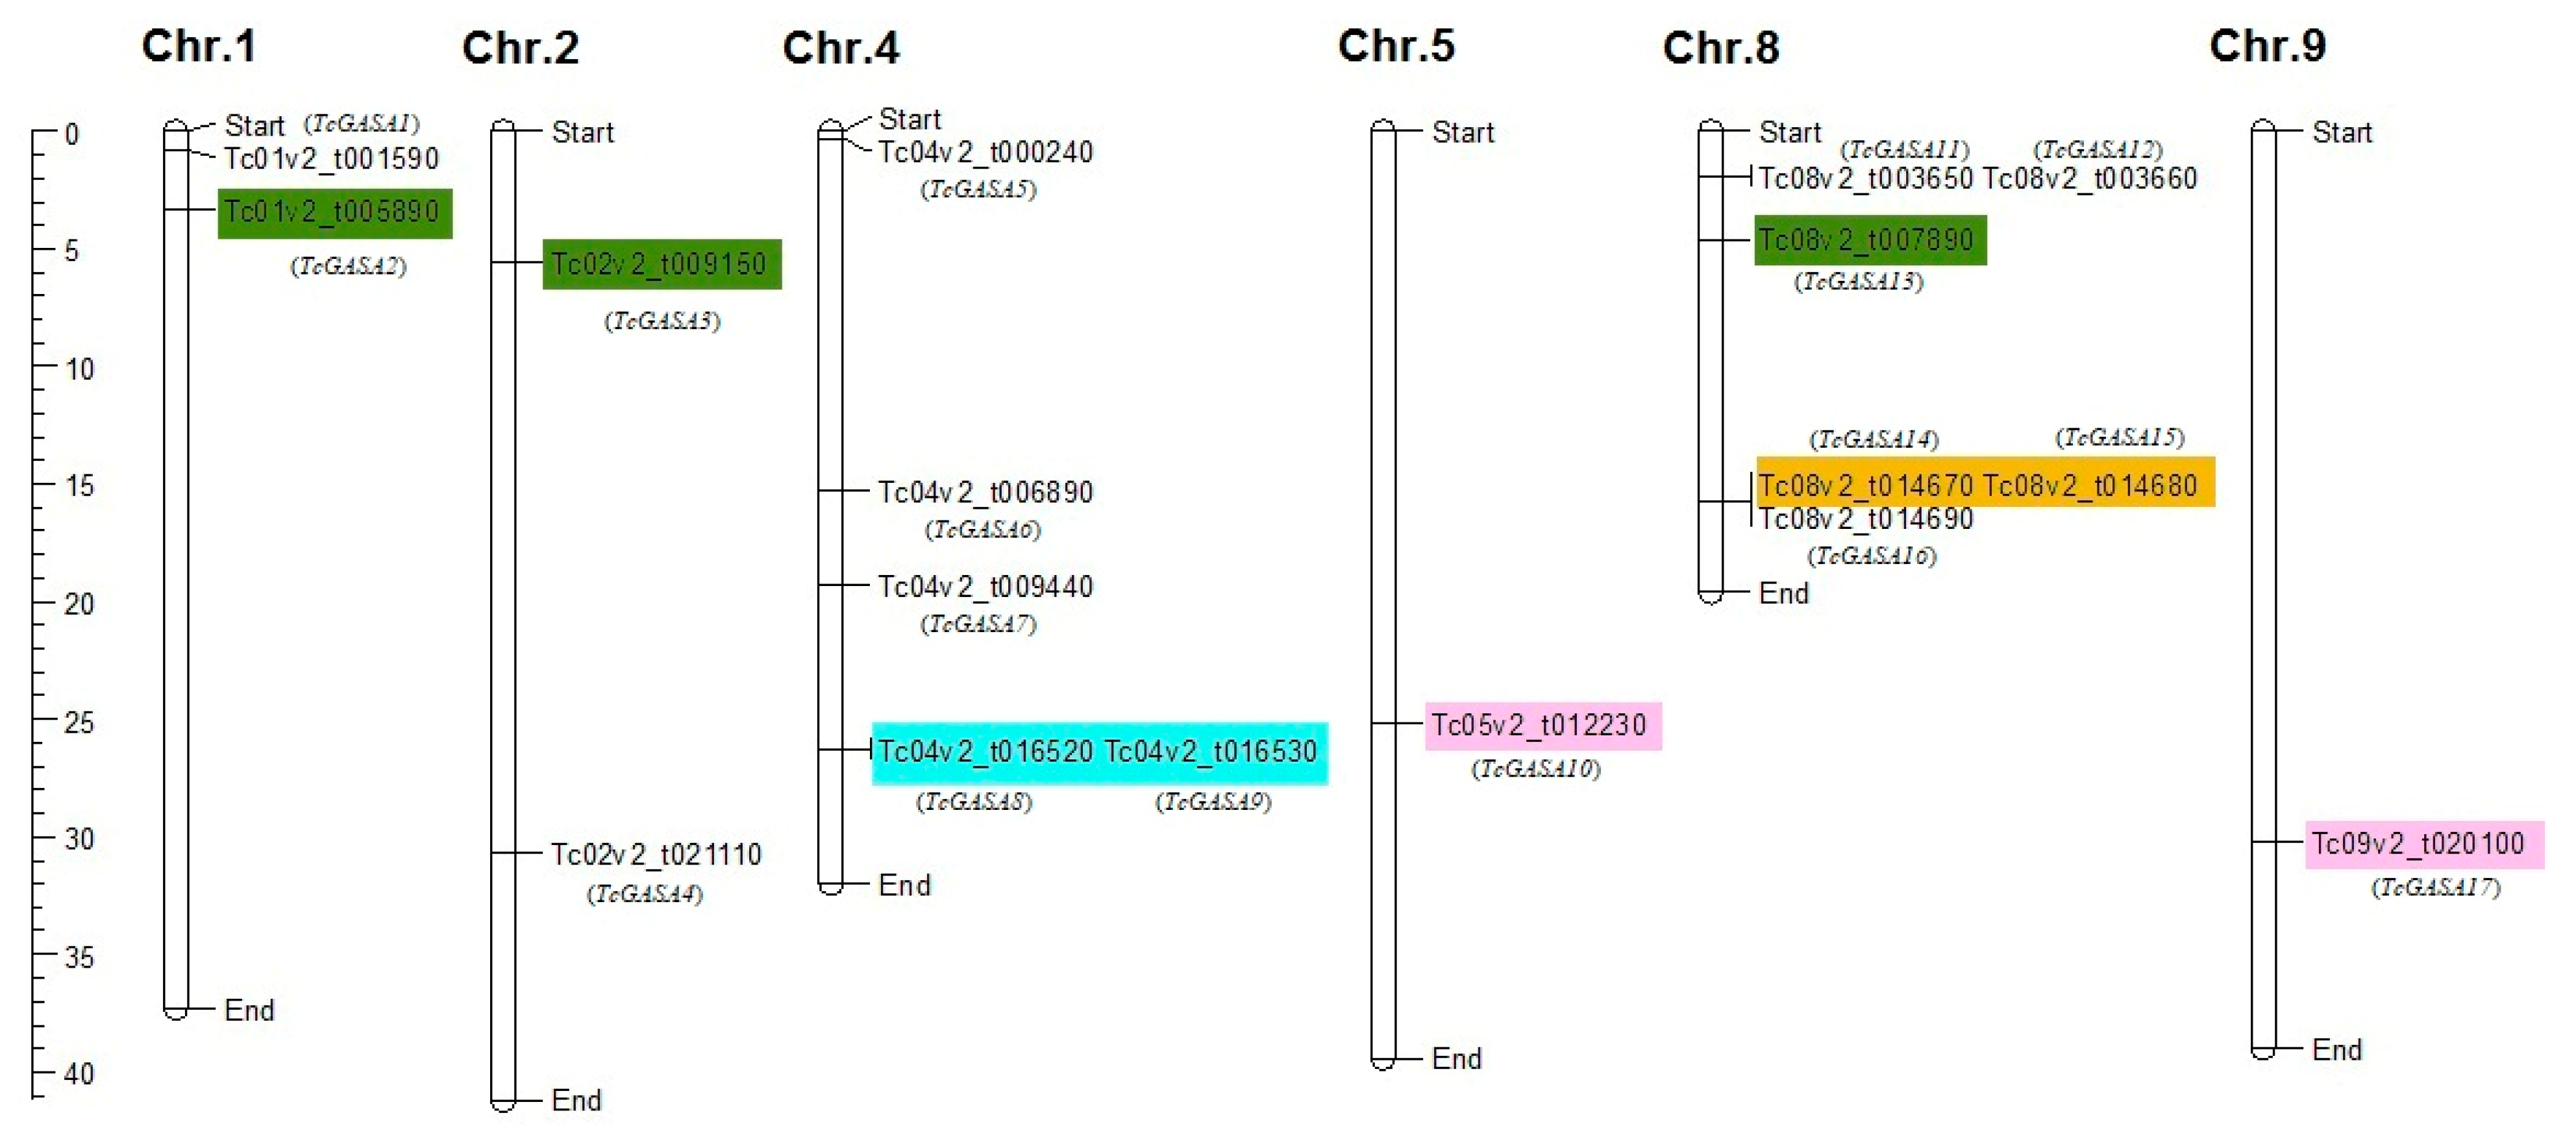
3.1. Identification of GASA Genes and Their Distributions on Chromosomes within Genomes

We detected 17 GASA genes in the genome of T. cacao distributed on six chromosomes out of ten. These genes were named from tcGASA1 to tcGASA17 based on their distribution on chromosomes starting from chromosome 1. When two or more genes were present on the same chromosome, then the gene present at the start of a chromosome was named first (Table 1 and Figure 1). Six genes were distributed on chromosome 8 and five genes were distributed on chromosome 4. Chromosome 1 and chromosome 2 each contained two genes, whereas chromosome 5 and chromosome 9 contained one gene each. These data showed the unequal distribution of tcGASA genes within the cacao genome. The location of each gene on the chromosome is mentioned in Table 1, as well as the start and end. Moreover, the sequences of genes, proteins, coding regions, and promoter regions are provided in Table S1.

3.2. Protein Length, Molecular Weight, and Isoelectric Point of tcGASA Proteins

In the current study, tcGASAs were characterized based on their physiochemical properties (Table 1). The identified tcGASA proteins were low molecular weight proteins ranging in length from 88 (tcGASA13) to 320 (tcGASA05) amino acids with molecular weight (MW) ranging from 9.64 to 33.92 kDa. Except for tcGASA05 and tcGASA08, with molecular weights of 13.42 kDa and 33.92 kDa, respectively, the MW of all other tcGASAs was found to be less than 13 kDa. The isoelectric point also showed similarities among tcGASA and suggested the alkaline nature of the proteins. Except for tcGASA11, which has an isoelectric point of 6.67, all other tcGASA proteins have isoelectric points of more than 8, ranging from 8.27 to 9.83.

3.3. Analyses of Instability Index, GRAVY, and Subcellular Localization of tcGASA Proteins

The instability index provides information about the stable and non-stable features of proteins in the various biochemical processes. The instability index indicated 4 stable tcGASAs including tcGASA03, tcGASA11, tcGASA13, and tcGASA15, as well as 13 unstable tcGASAs (Table 1). The positive value of GRAVY indicates its hydrophobic nature, whereas the negative value indicates the hydrophilic nature of proteins. The GRAVY value was recorded as negative for sixteen tcGASA proteins ranging from −0.75 to −0.023, but as positive (0.004) for tcGASA12 (Table 1). Hence, the data indicate the hydrophilic nature of most tcGASA proteins. Subcellular localization provides information about the function of proteins. Based on BUSCA, we predicted extracellular localization of tcGASA proteins, except for tcGASA08, which localized in the plasma membrane (Table 1).

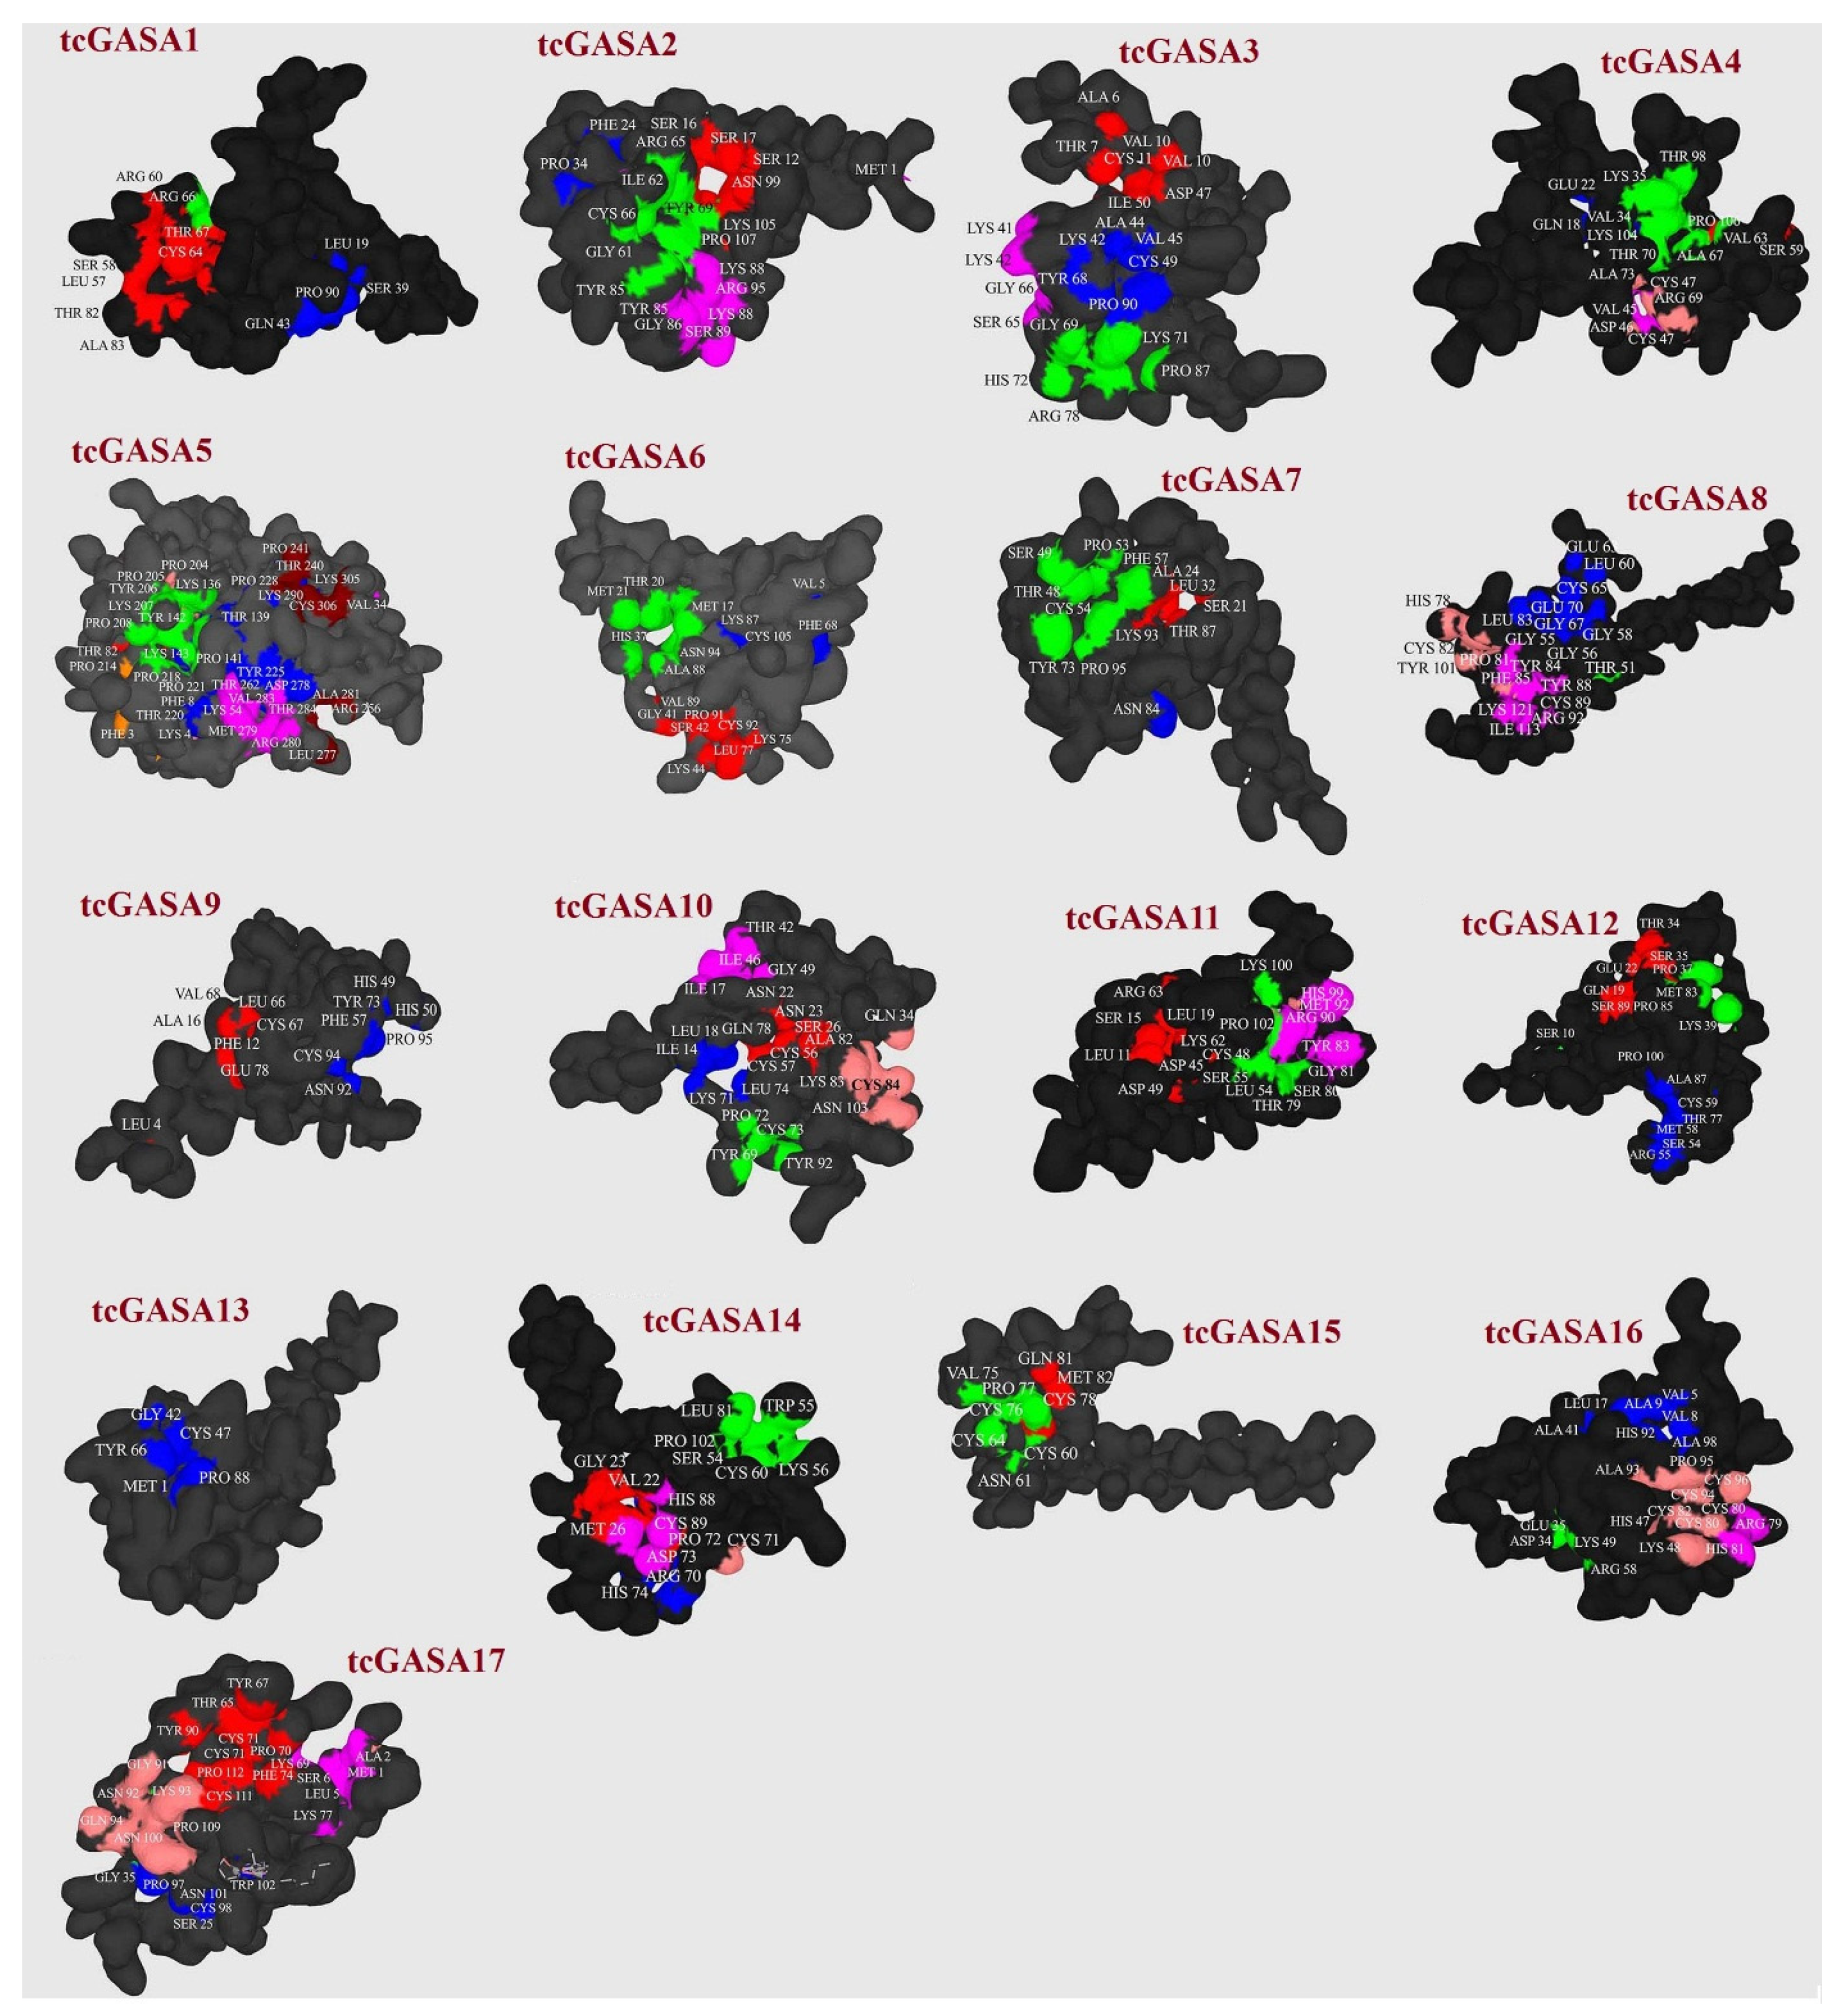
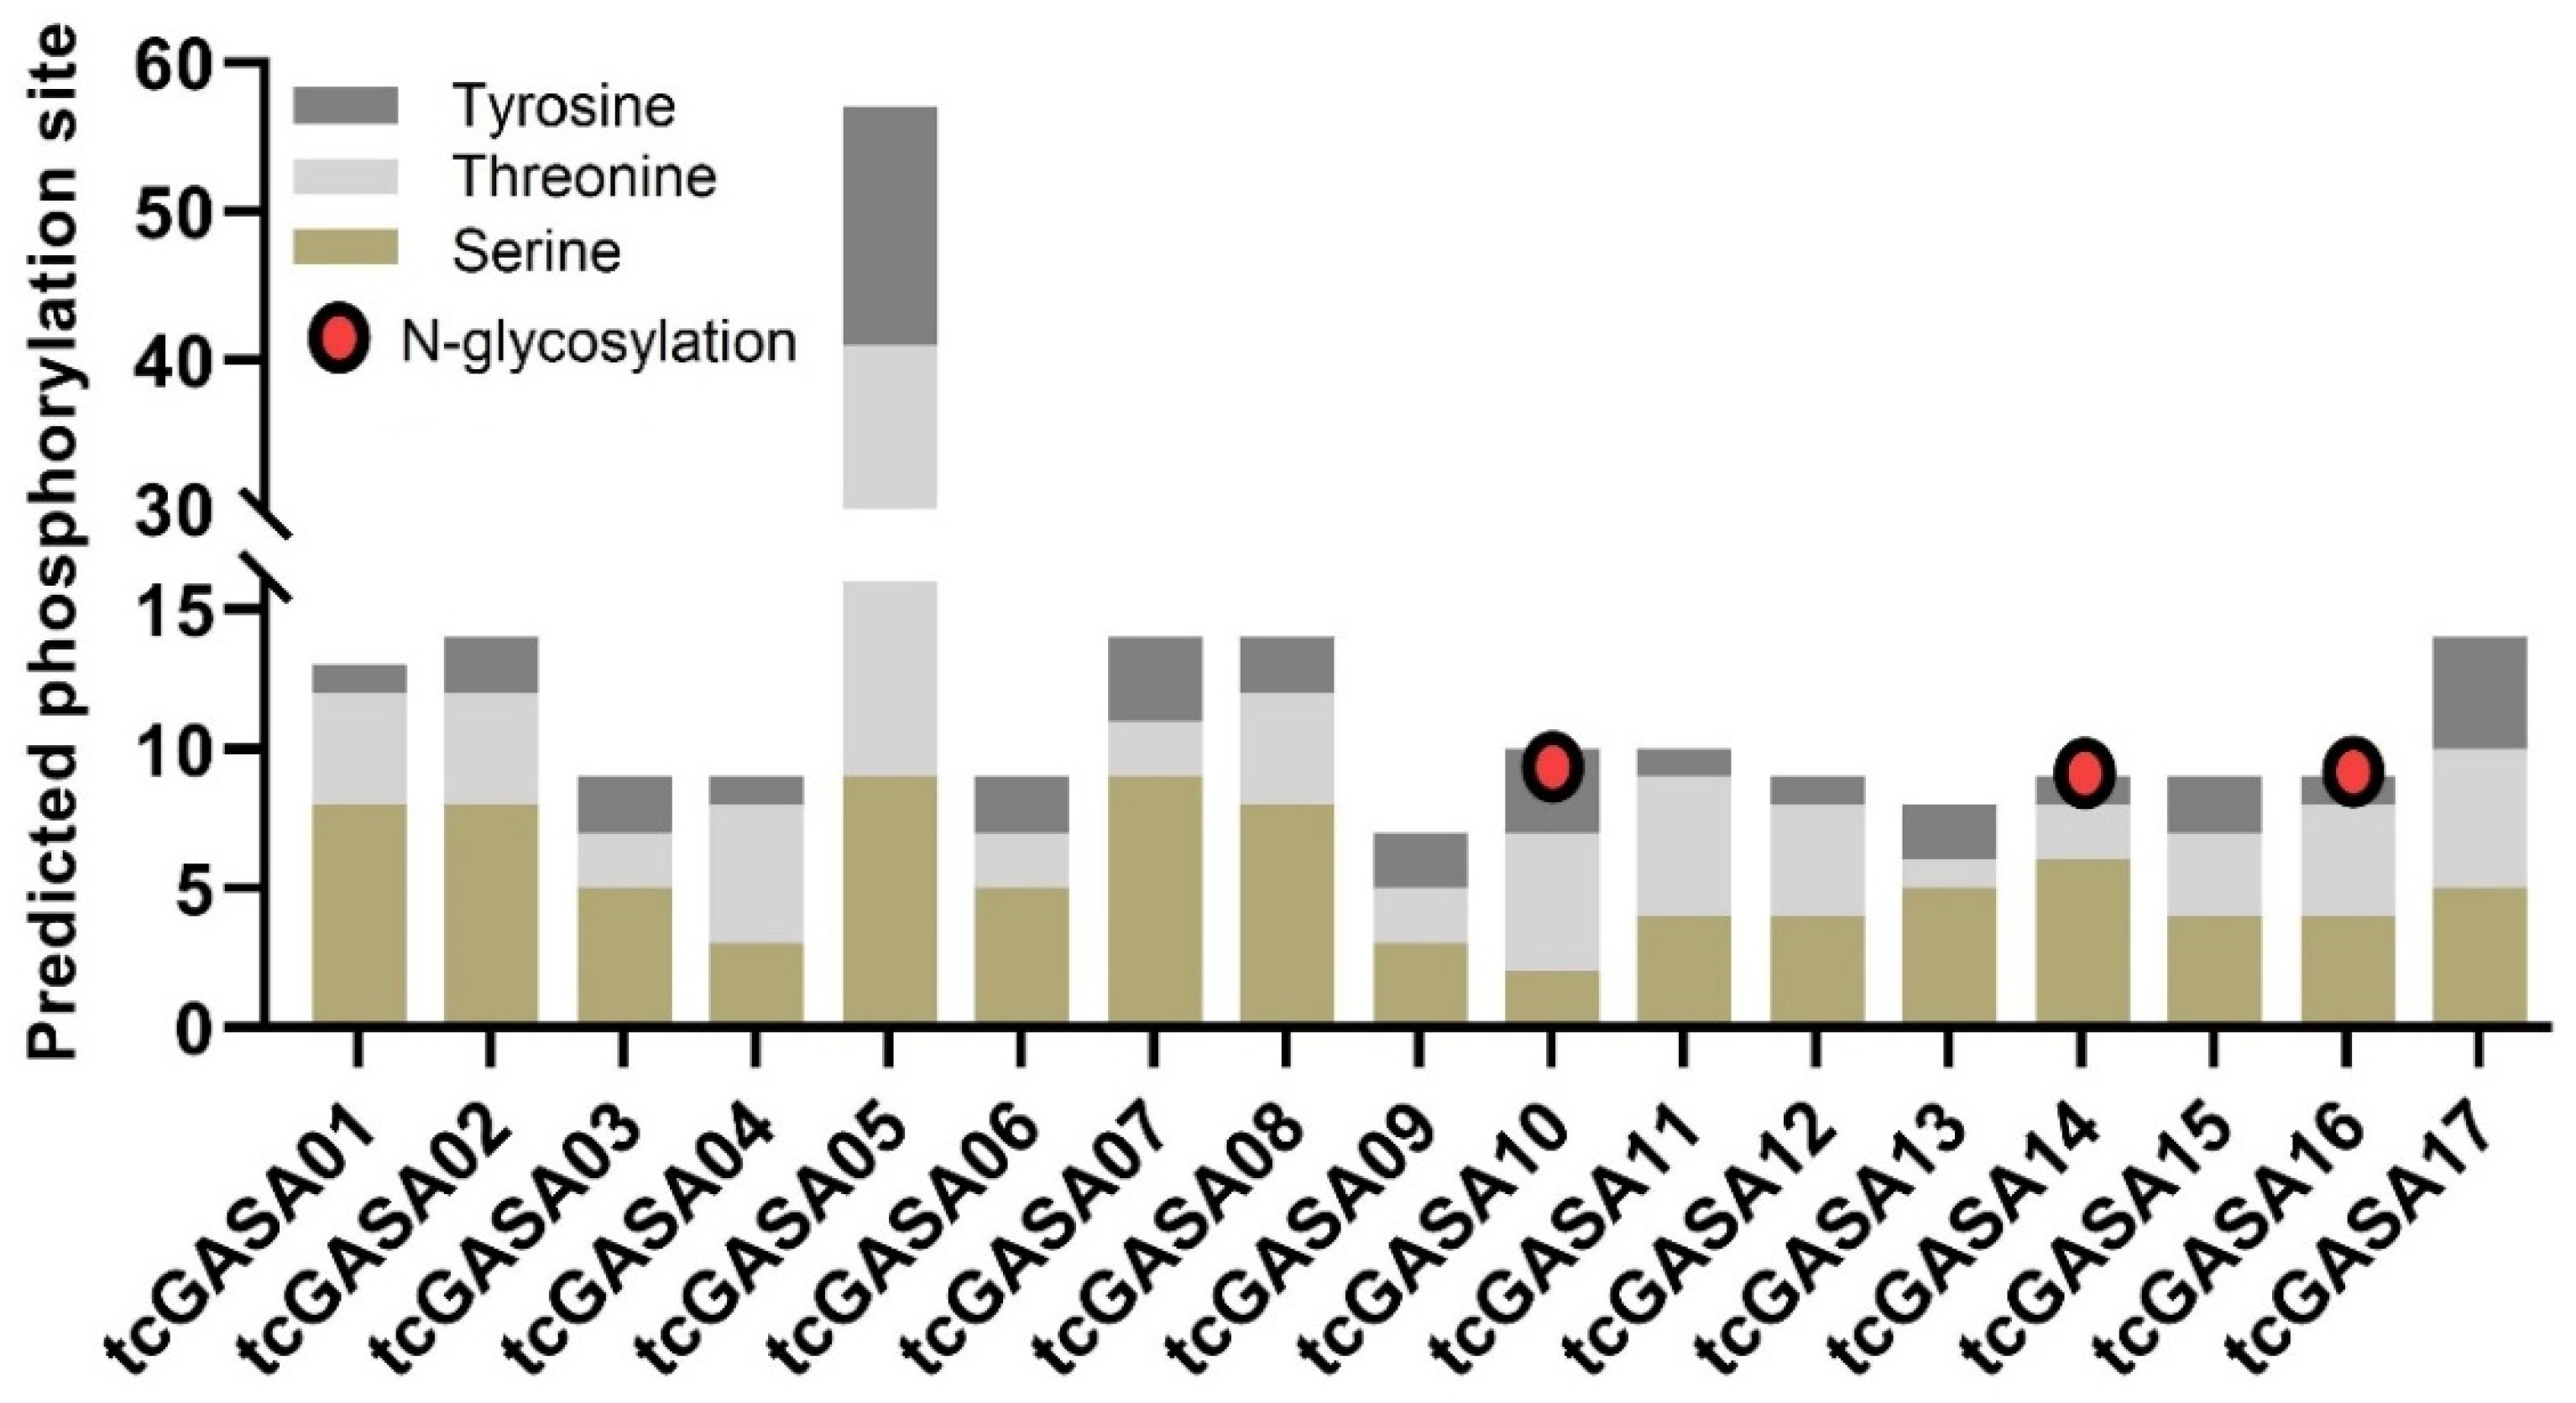
3.4. tcGASA Proteins 3D Structure Analyses and Post-Translational Modifications

The predicted 3D structure of all tcGASA proteins showed that these proteins contain β sheets, α helices, random coils, and extended strands. The random coils were the most abundant and were more extensive than α helices, while the β sheets were the least (Figure 2). In addition, the active sites of GASA proteins were predicted in their structure. The proline, cysteine, lysine, serine, and threonine amino acids were more predicted, as the binding sites in all candidate GASA proteins in cacao (Figure 2). GASAs were diverse based on predicted 3D structure and pocket sites, indicating that they could have various functions. In the present study, the post-translational modifications of tcGASAs were predicted in terms of phosphorylation and glycosylation (Figure 3, Table S2). We predicted a total of 224 potential phosphorylation events on amino acids serine, threonine, and tyrosine within tcGASA proteins. Most of the phosphorylation events were predicted related to serine (92) followed by threonine (86) and then by tyrosine (46). Among tcGASA proteins, most of the phosphorylation sites (57 sites) were predicted in tcGASA05, whereas in other proteins, phosphorylation events ranged from 9 to 14 sites. Three tcGASA, including tcGASA10, tcGASA15, and tcGASA17, were also identified with a potential glycosylation site (Table S2).

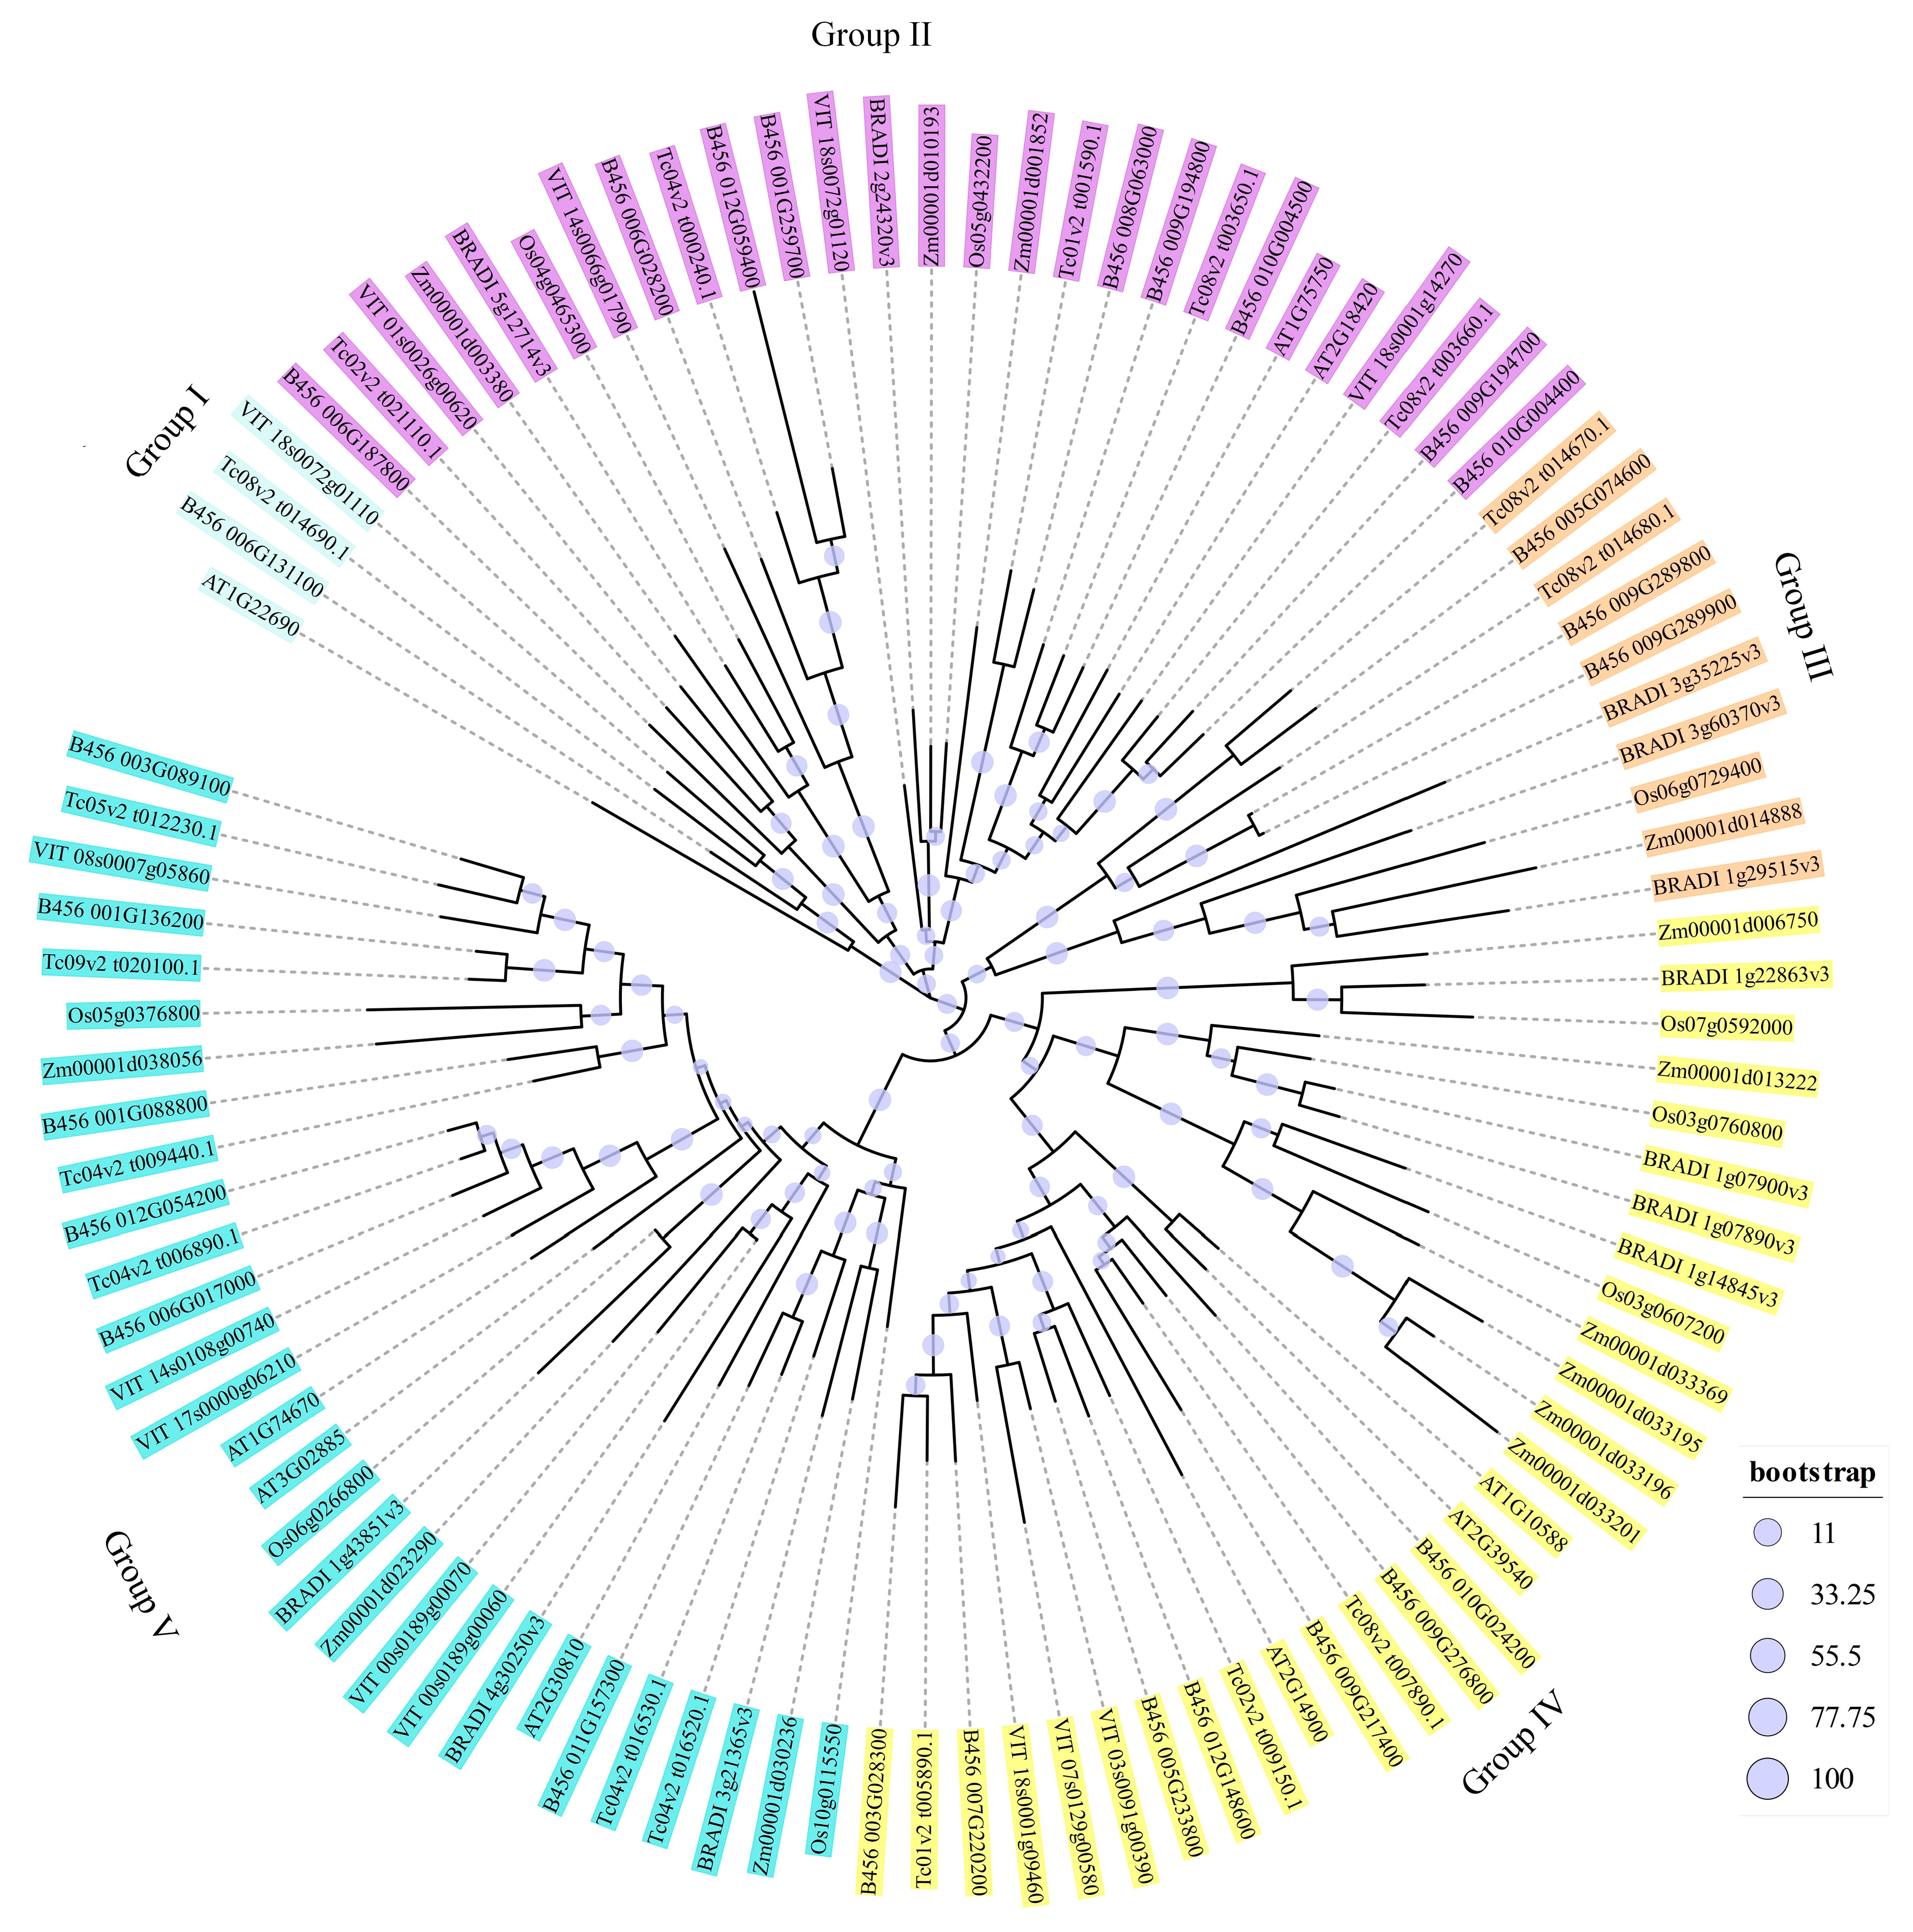
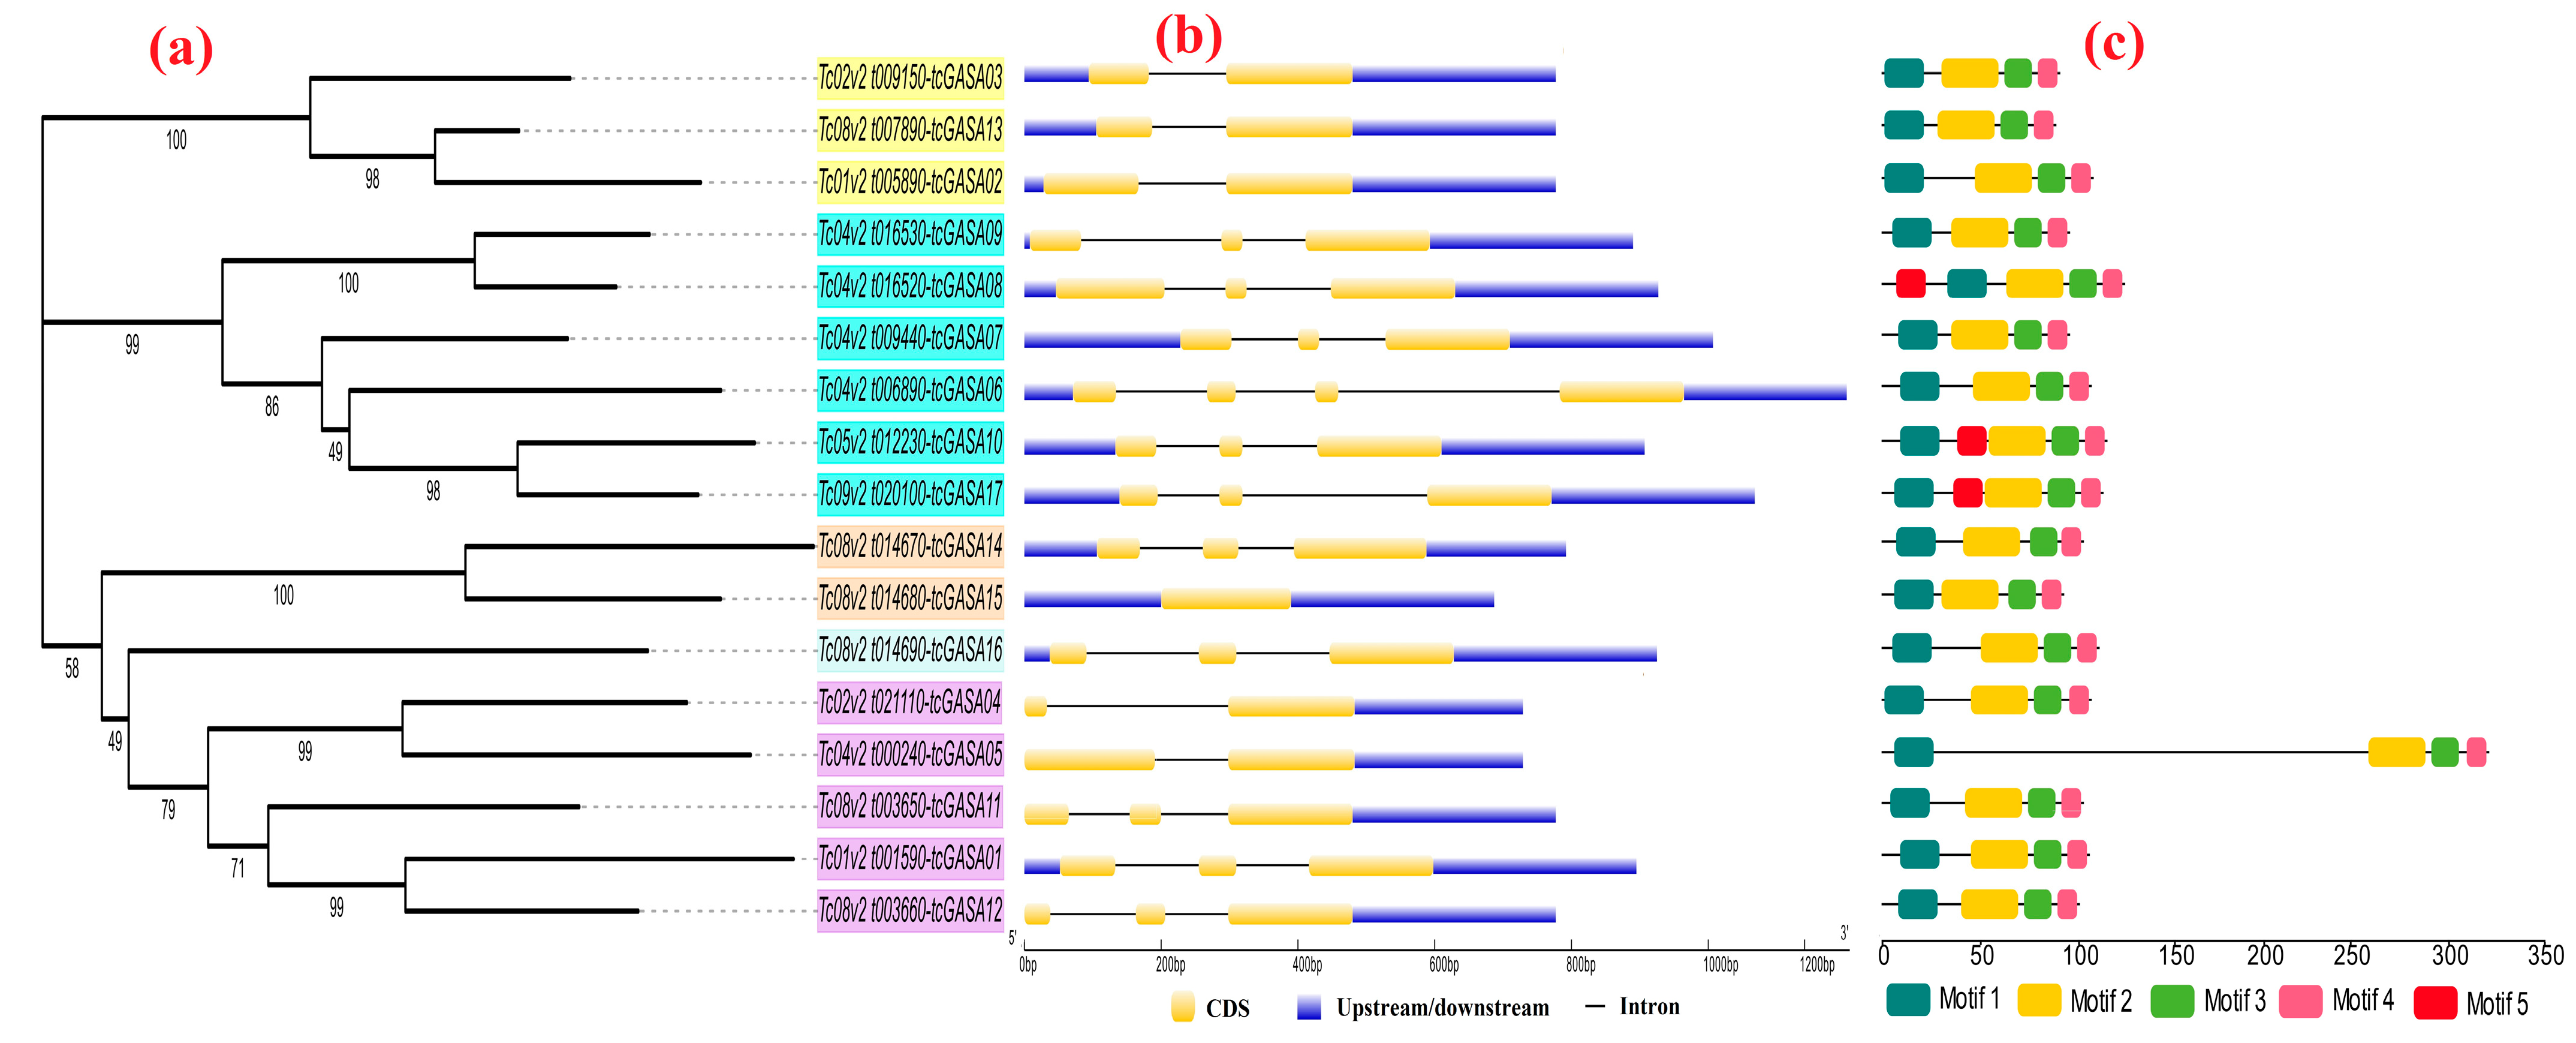
3.5. Phylogenetic Analyses of tcGASA Proteins

The phylogenetic inference of ninety-nine GASA-protein sequences from seven species (mentioned in methodology), including 17 sequences of tcGASA, resolved into five groups (Figure 4). The GASA proteins of cacao showed high variations and were distributed into all five groups. Group I include only one sequence tcGASA16 (Tc08v2_t014690). Group II was confined to five protein sequences including tcGASA01 (Gene ID: Tc01v2_t001590), tcGASA04 (Tc02v2_t021110), tcGASA05 (Tc04v2_t000240), tcGASA11 (Tc08v2_t003650), and tcGASA12 (Tc08v2_t003660). Group III comprised two sequences—tcGASA14 (Tc08v2_t014670) and tcGASA15 (Tc08v2_t014680). Group IV included tcGASA02 (Tc01v2_t005890), tcGASA03 (Tc02v2_t009150), and tcGASA13 (Tc08v2_t007890). Group V consisted of six protein sequences, including tcGASA06 (Tc04v2_t006890), tcGASA07 (Tc04v2_t009440), tcGASA08 (Tc04v2_t016520), tcGASA09 (Tc04v2_t016530), tcGASA10 (Tc05v2_t012230), and tcGASA17 (Tc09v2_t020100). The tcGASA04 (Tc02v2_t021110) shared a node with one of the protein sequences of Vitis vinifera, whereas the other 16 proteins showed close relationships with the sequences of another species of family Malvaceae (Gossypium raimondii).

3.6. Gain and Loss of Intron(s) and Conserved Motifs

We also determined numbers of introns–exons within the genes and motifs in protein sequences. We drew a separate phylogeny of the tcGASA genes of T. cacao to find out the extent to which genes that cluster together are similar in term of introns numbers and pattern, and in terms of protein number and pattern. Each phylogenetic group was shown with different colors for clarity (Figure 5a). The analyses of genomic sequences showed the absence of intron in one gene, presence of one intron in five genes, two introns in eleven genes, and three introns in one gene (Figure 5b). Genes clustered together showed differences in their number and in intron–exon distributions (Figure 5a,b). Five motifs were revealed in tcGASA. Four motifs (1–4) were distributed in all tcGASAs, whereas a fifth motif was limited to Tc04v2_t016520 (tcGASA08), Tc05v2_t012230 (tcGASA10), and Tc09v2_t020100 (tcGASA17) (Figure 5c). The motifs of proteins that clustered together within the phylogenetic tree presented similarities in the distribution of motifs to some extent (Figure 5a,c).

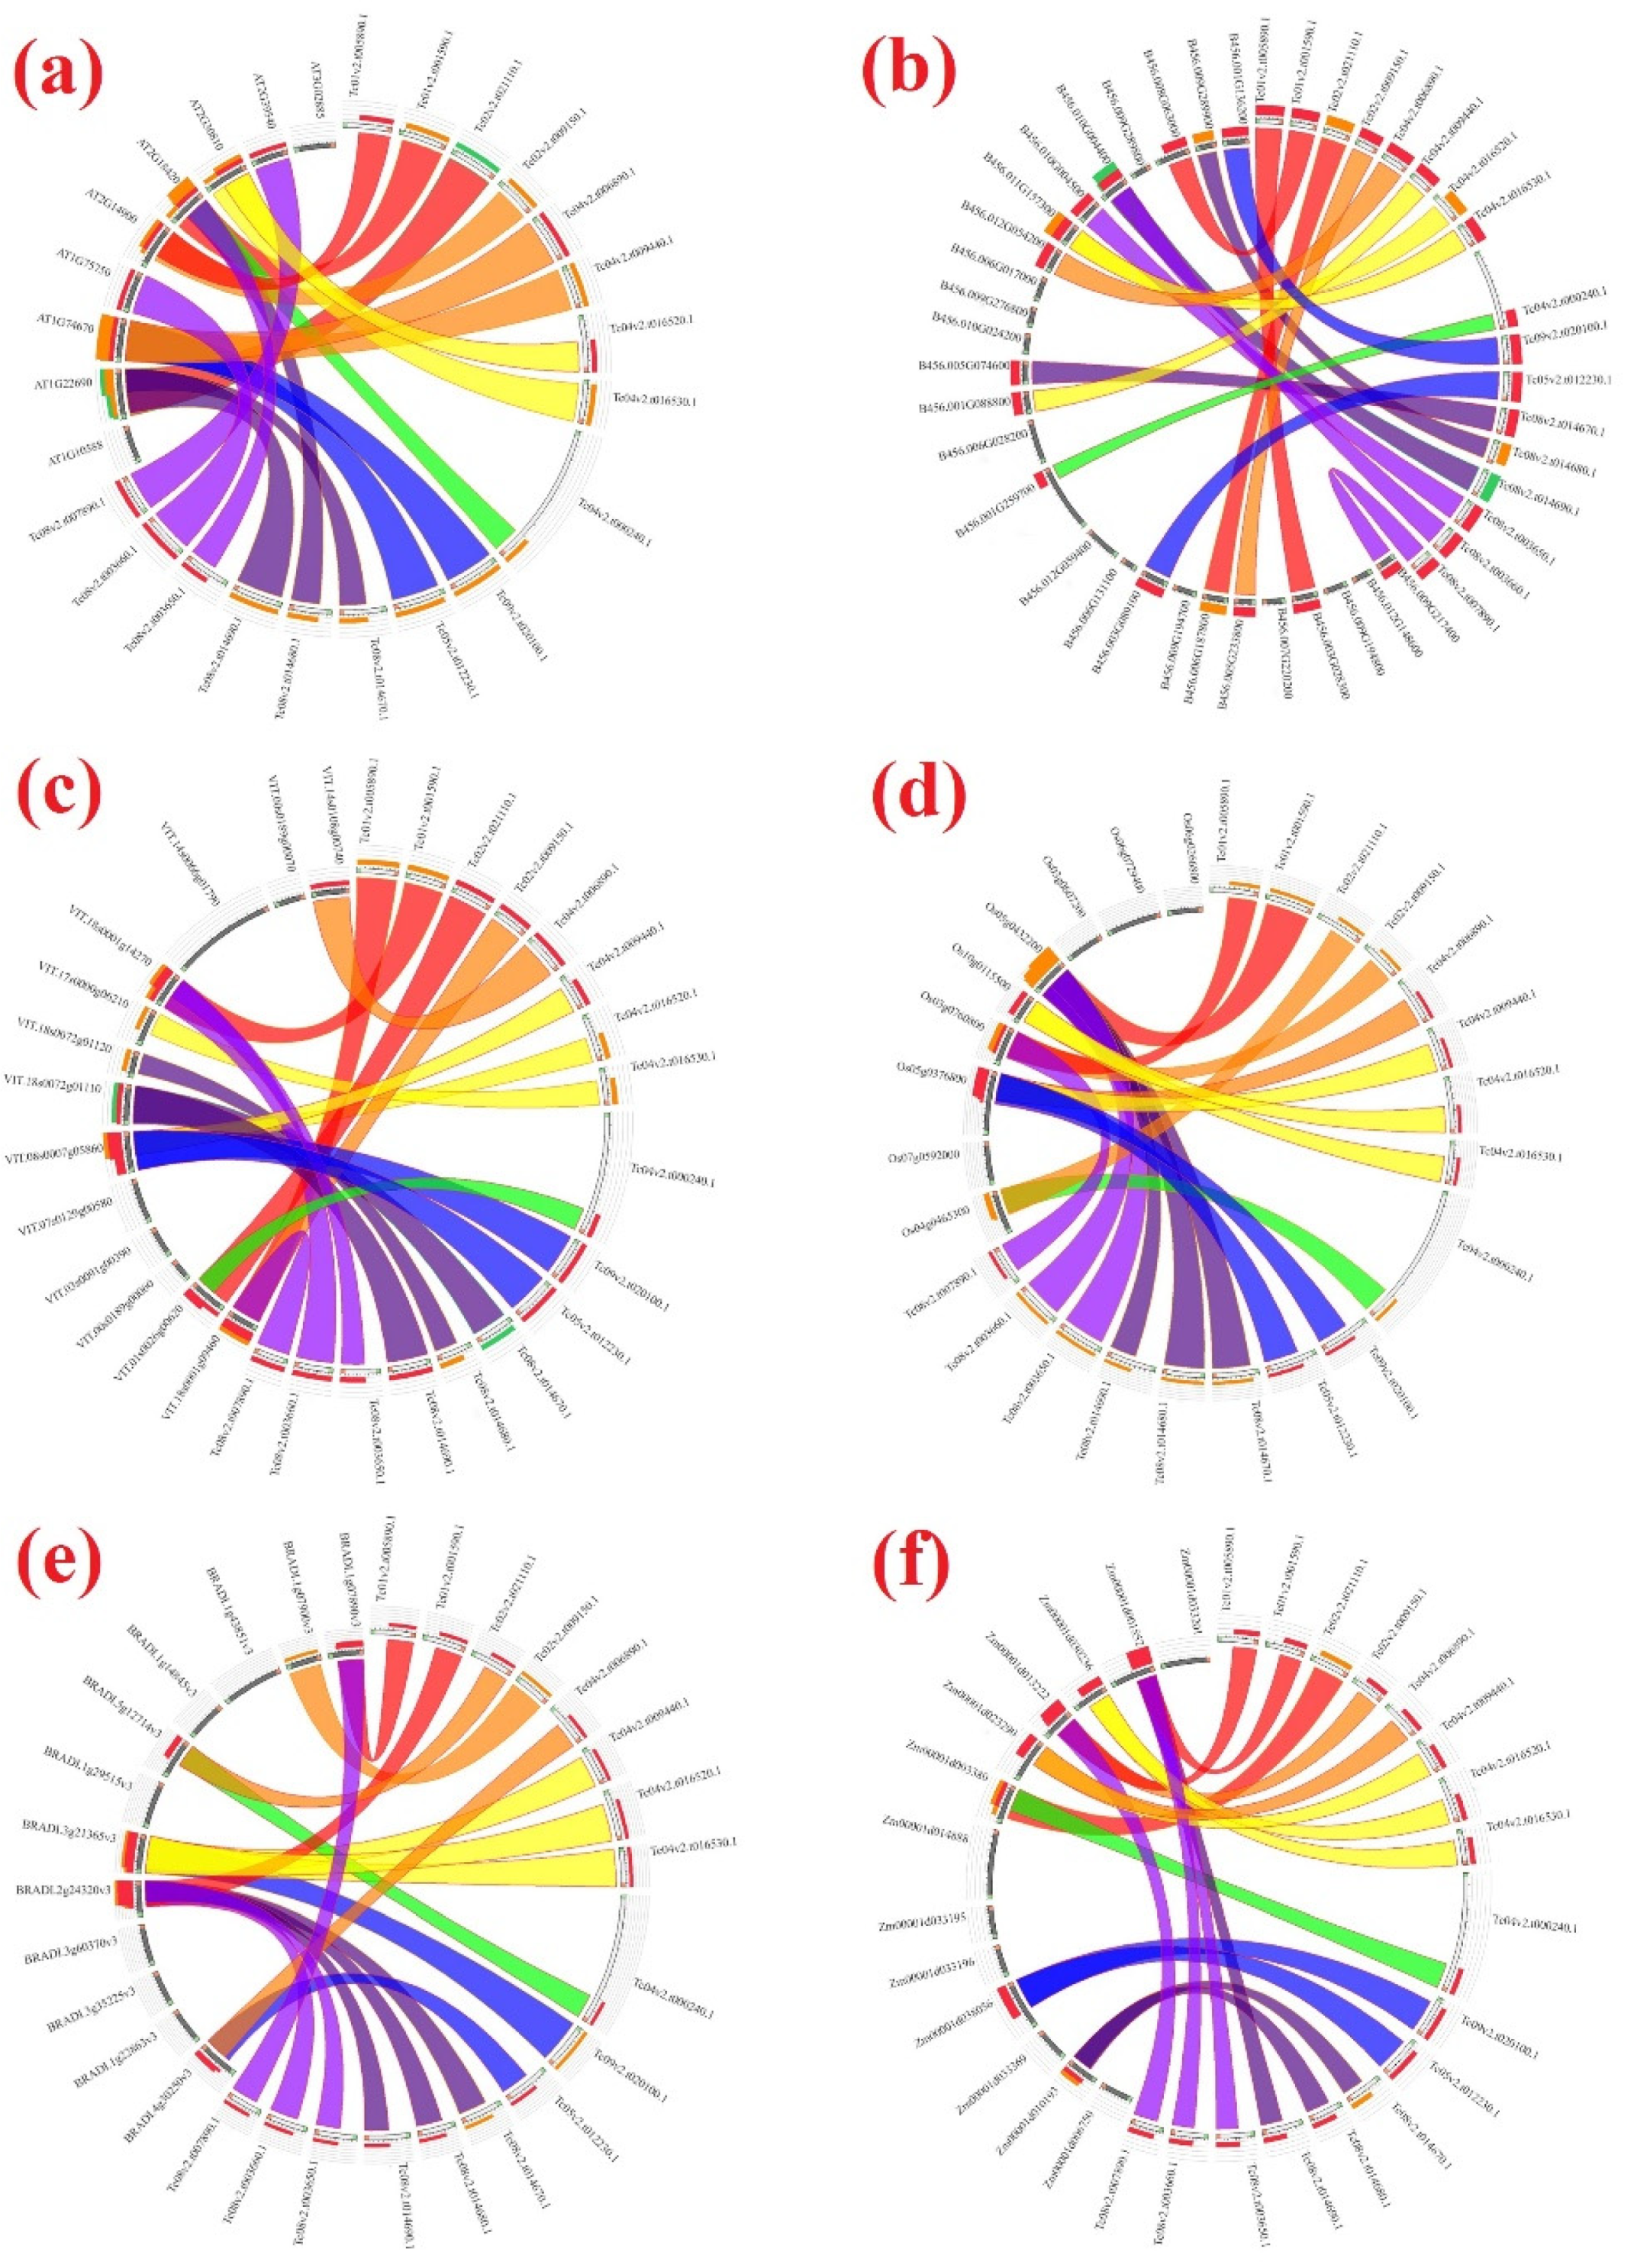
3.7. Duplications, Divergence, and Synteny among GASA Genes

We analyzed the paralogous relationships among the GASA genes within cacao and analyzed the orthologous relationships of GASA genes by comparing them with the other six species (mentioned in methodology). Segmental duplications were found in nine GASA genes that were paired into four groups as: tcGASA02-tcGASA03-tcGASA13; tcGASA08-tcGASA09; tcGASA10-tcGASA17; and tcGASA14-tcGASA15 (Table 2) (as shown with similar colors in Figure 1). The analyses of synonymous and non-synonymous substitutions revealed that high purifying selection pressure exists on these genes after duplication. The analyses of divergence time indicated that the event of duplication of these pairs occurred 50 MYA to 204 MYA (Table 2). The synteny analyses with GASAs of other species showed high resemblance and identified orthologous genes among T. cacao and compared species (Figure 6). The 17 GASA genes in cacao showed the syntenic relationship with 7 and 11 ortholog genes in the Arabidopsis and Gossypium raimondii, respectively (Figure 6a,b). Moreover, tcGASAs had the syntenic relationship with 7, 5, 4, and 7 GASA genes from Vitis vinifera, Oryza sativa, Brachypodium distachyon, and Zea mays, respectively (Figure 6c–f). Interestingly, Os05g0432200, as a rice-GASA, and a GASA gene of Brachypodium, BRADI.2g24320v3, showed most syntenic blocks with tcGASAs.

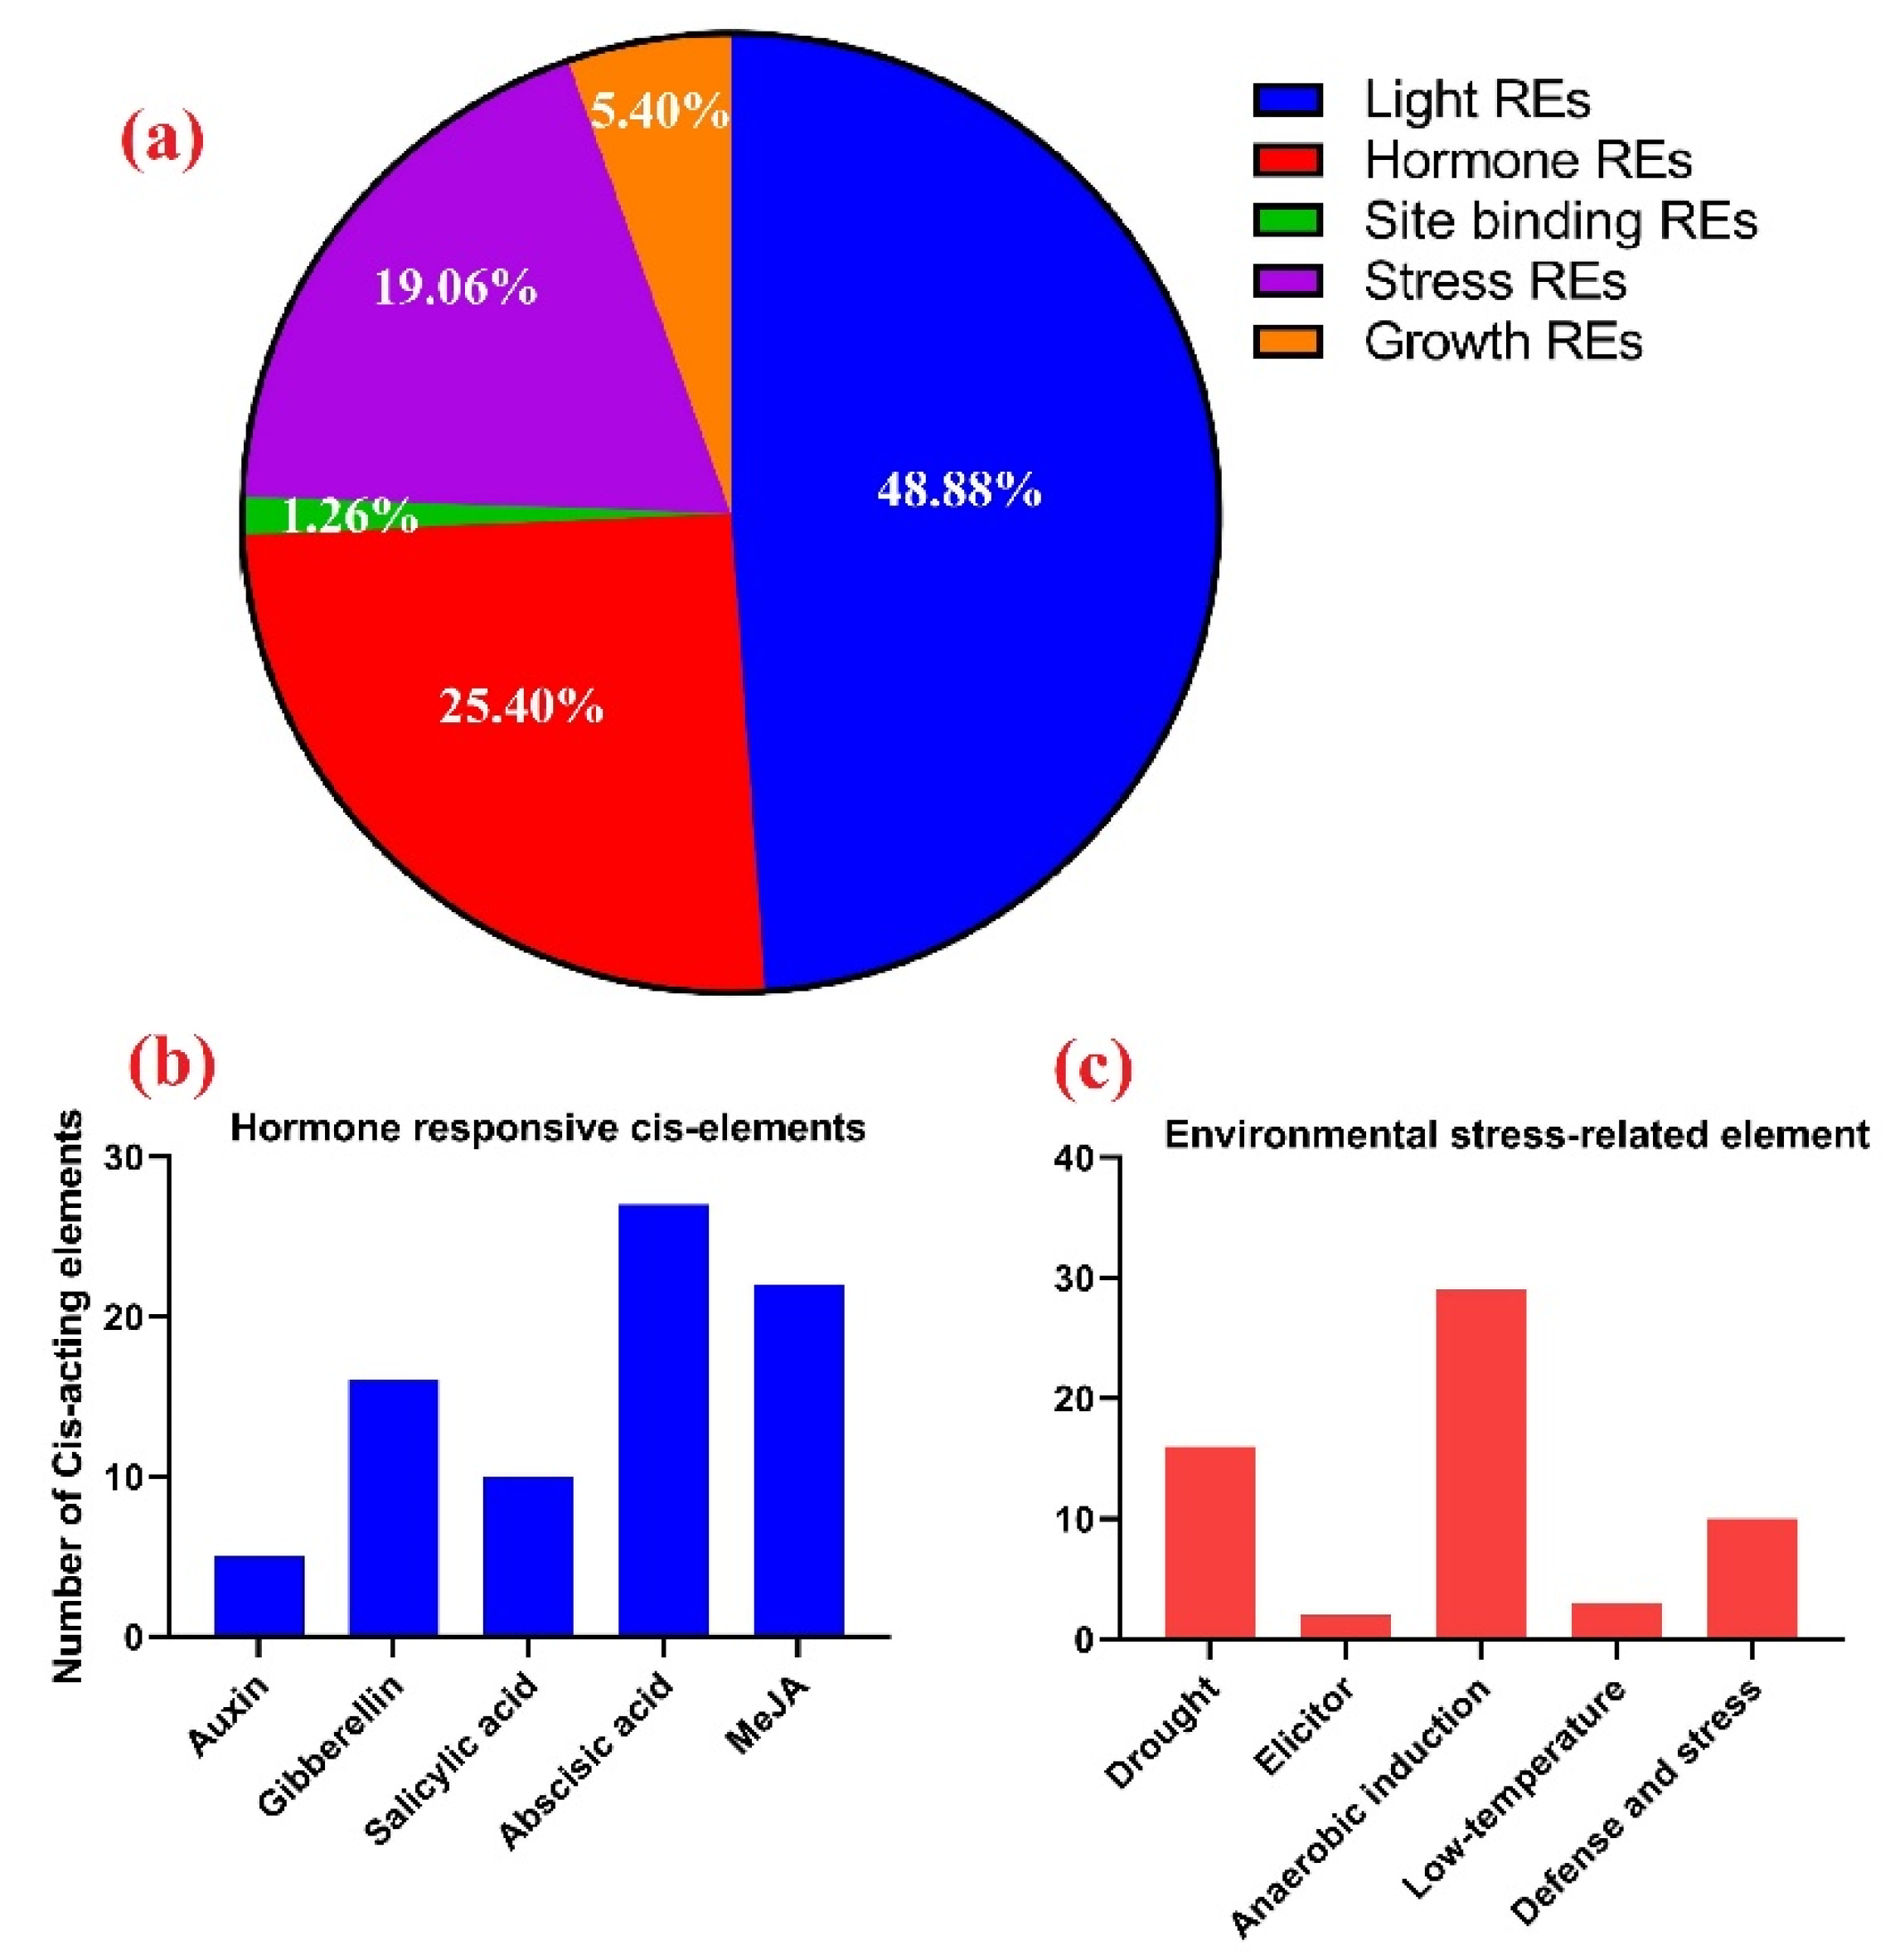
3.8. Promoter Regions Analysis

The analyses of cis-regulatory elements in promoter regions revealed the presence of binding sites for key transcription factors related to light-responsive elements (48.88%), hormone-responsive elements (25.40%), stress-related elements (19.06%), growth-response elements (5.40%), and DNA- and protein-related binding sites (1.26) (Figure 7a). Regulatory sides were found for various hormones such as auxin, salicylic acid, abscisic acid, gibberellin, and methyl jasmonate (MeJA) (Figure 7b). Similarly, regulatory elements were identified for drought, elicitor, anaerobic induction, low temperature, and plant defense/stress (Figure 7c). The complete detail of each element, along with sequence and function is provided in Table S3.

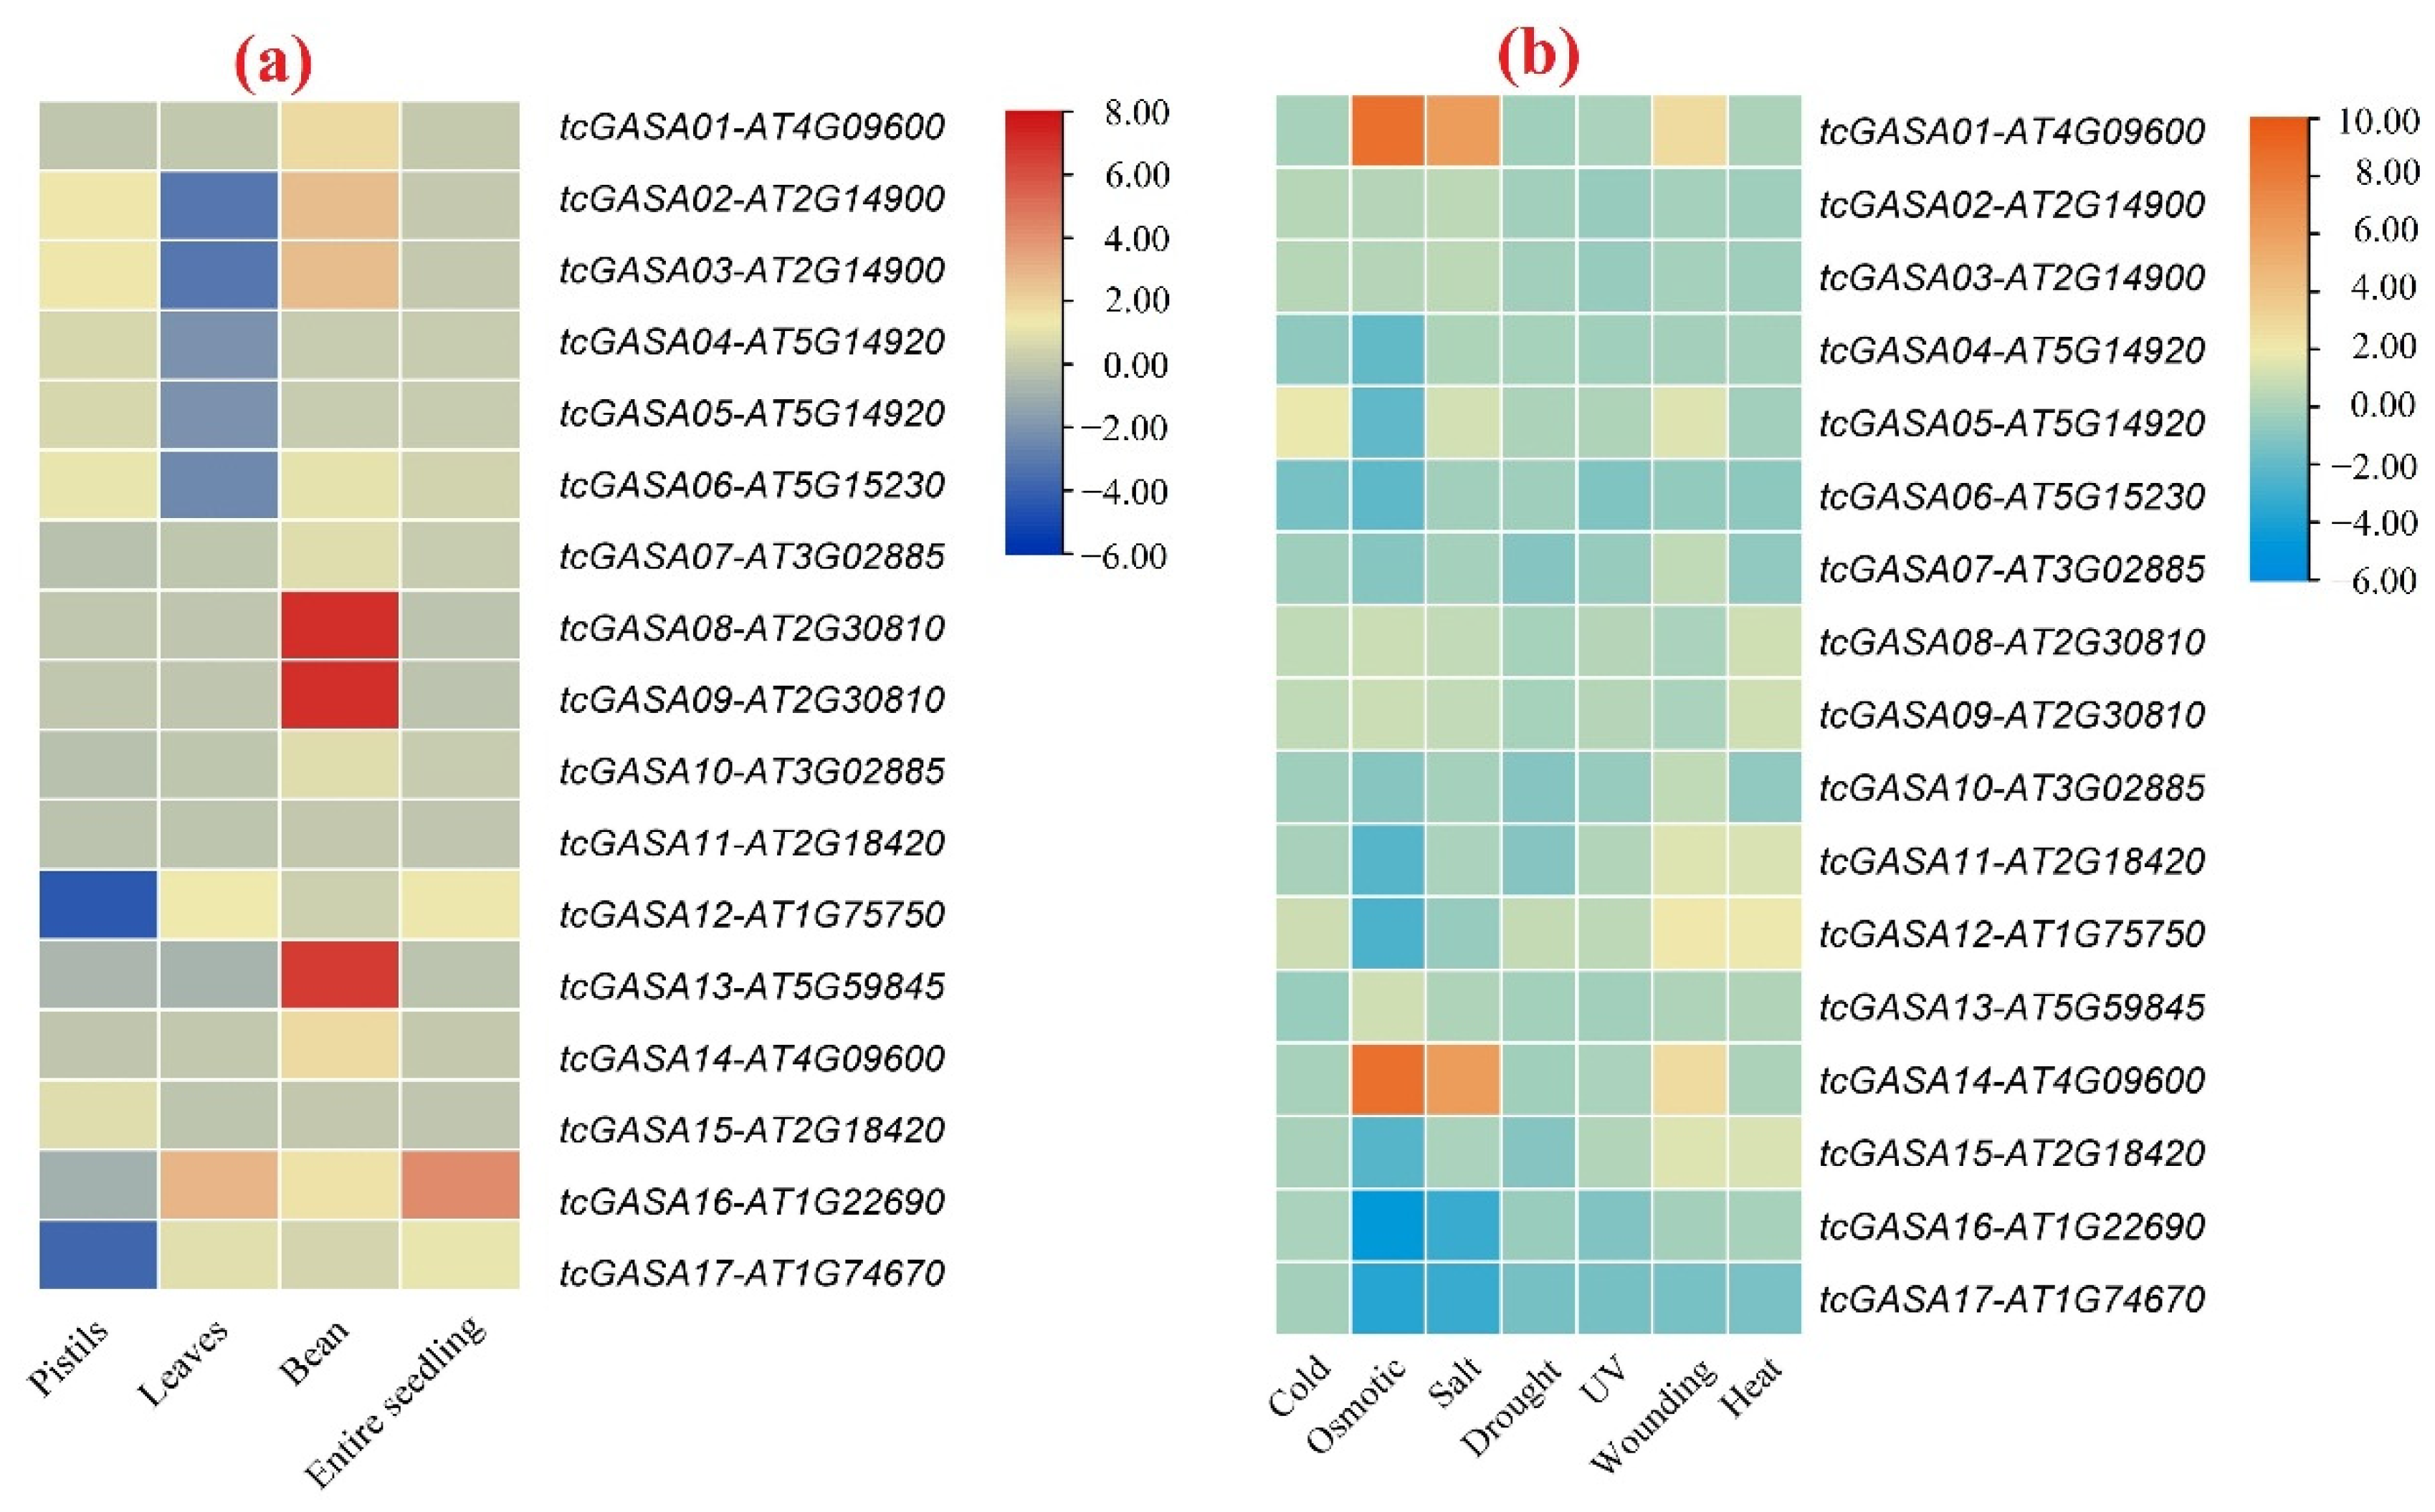
3.9. In-Silico Tissue-Specific Expression of tcGASA Genes

We evaluated the expression of orthologous tcGASAs in various tissues to evaluate their role in the functions of T. cacao (Figure 8a). Differential expression was noted for tcGASA genes in various tissues of cacao. Five genes, including tcGASA02, tcGASA03, tcGASA08, tcGASA09, and tcGASA13, showed high expression in the beans (food part of cacao). In addition, tcGASA16 showed a high expression in leaves and entire seedlings. However, tcGASA02 and tcGASA03 were significantly downregulated in leaves compared to beans. In-silico expression results showed that tcGASA12 and tcGASA17 were less induced in pistil tissues.

3.10. Expression Analyses of tcGASAs in Abiotic and Biotic Stresses

We explicated the role of tcGASAs under various abiotic stress by analyzing orthologous genes of Arabidopsis (Figure 8b). The orthologous genes of tcGASA01, tcGASA05, tcGASA12, and tcGASA14 showed an upregulation in response to wound healing and the orthologs of tcGASA05 were more expressed in response to cold stress. The expression of orthologous GASA genes in Arabidopsis was less induced in response to drought and UV stresses. The tcGASA01 and tcGASA14 were highly upregulated in response to osmotic pressure and salt stress, while tcGASA016 and tcGASA17 were downregulated.

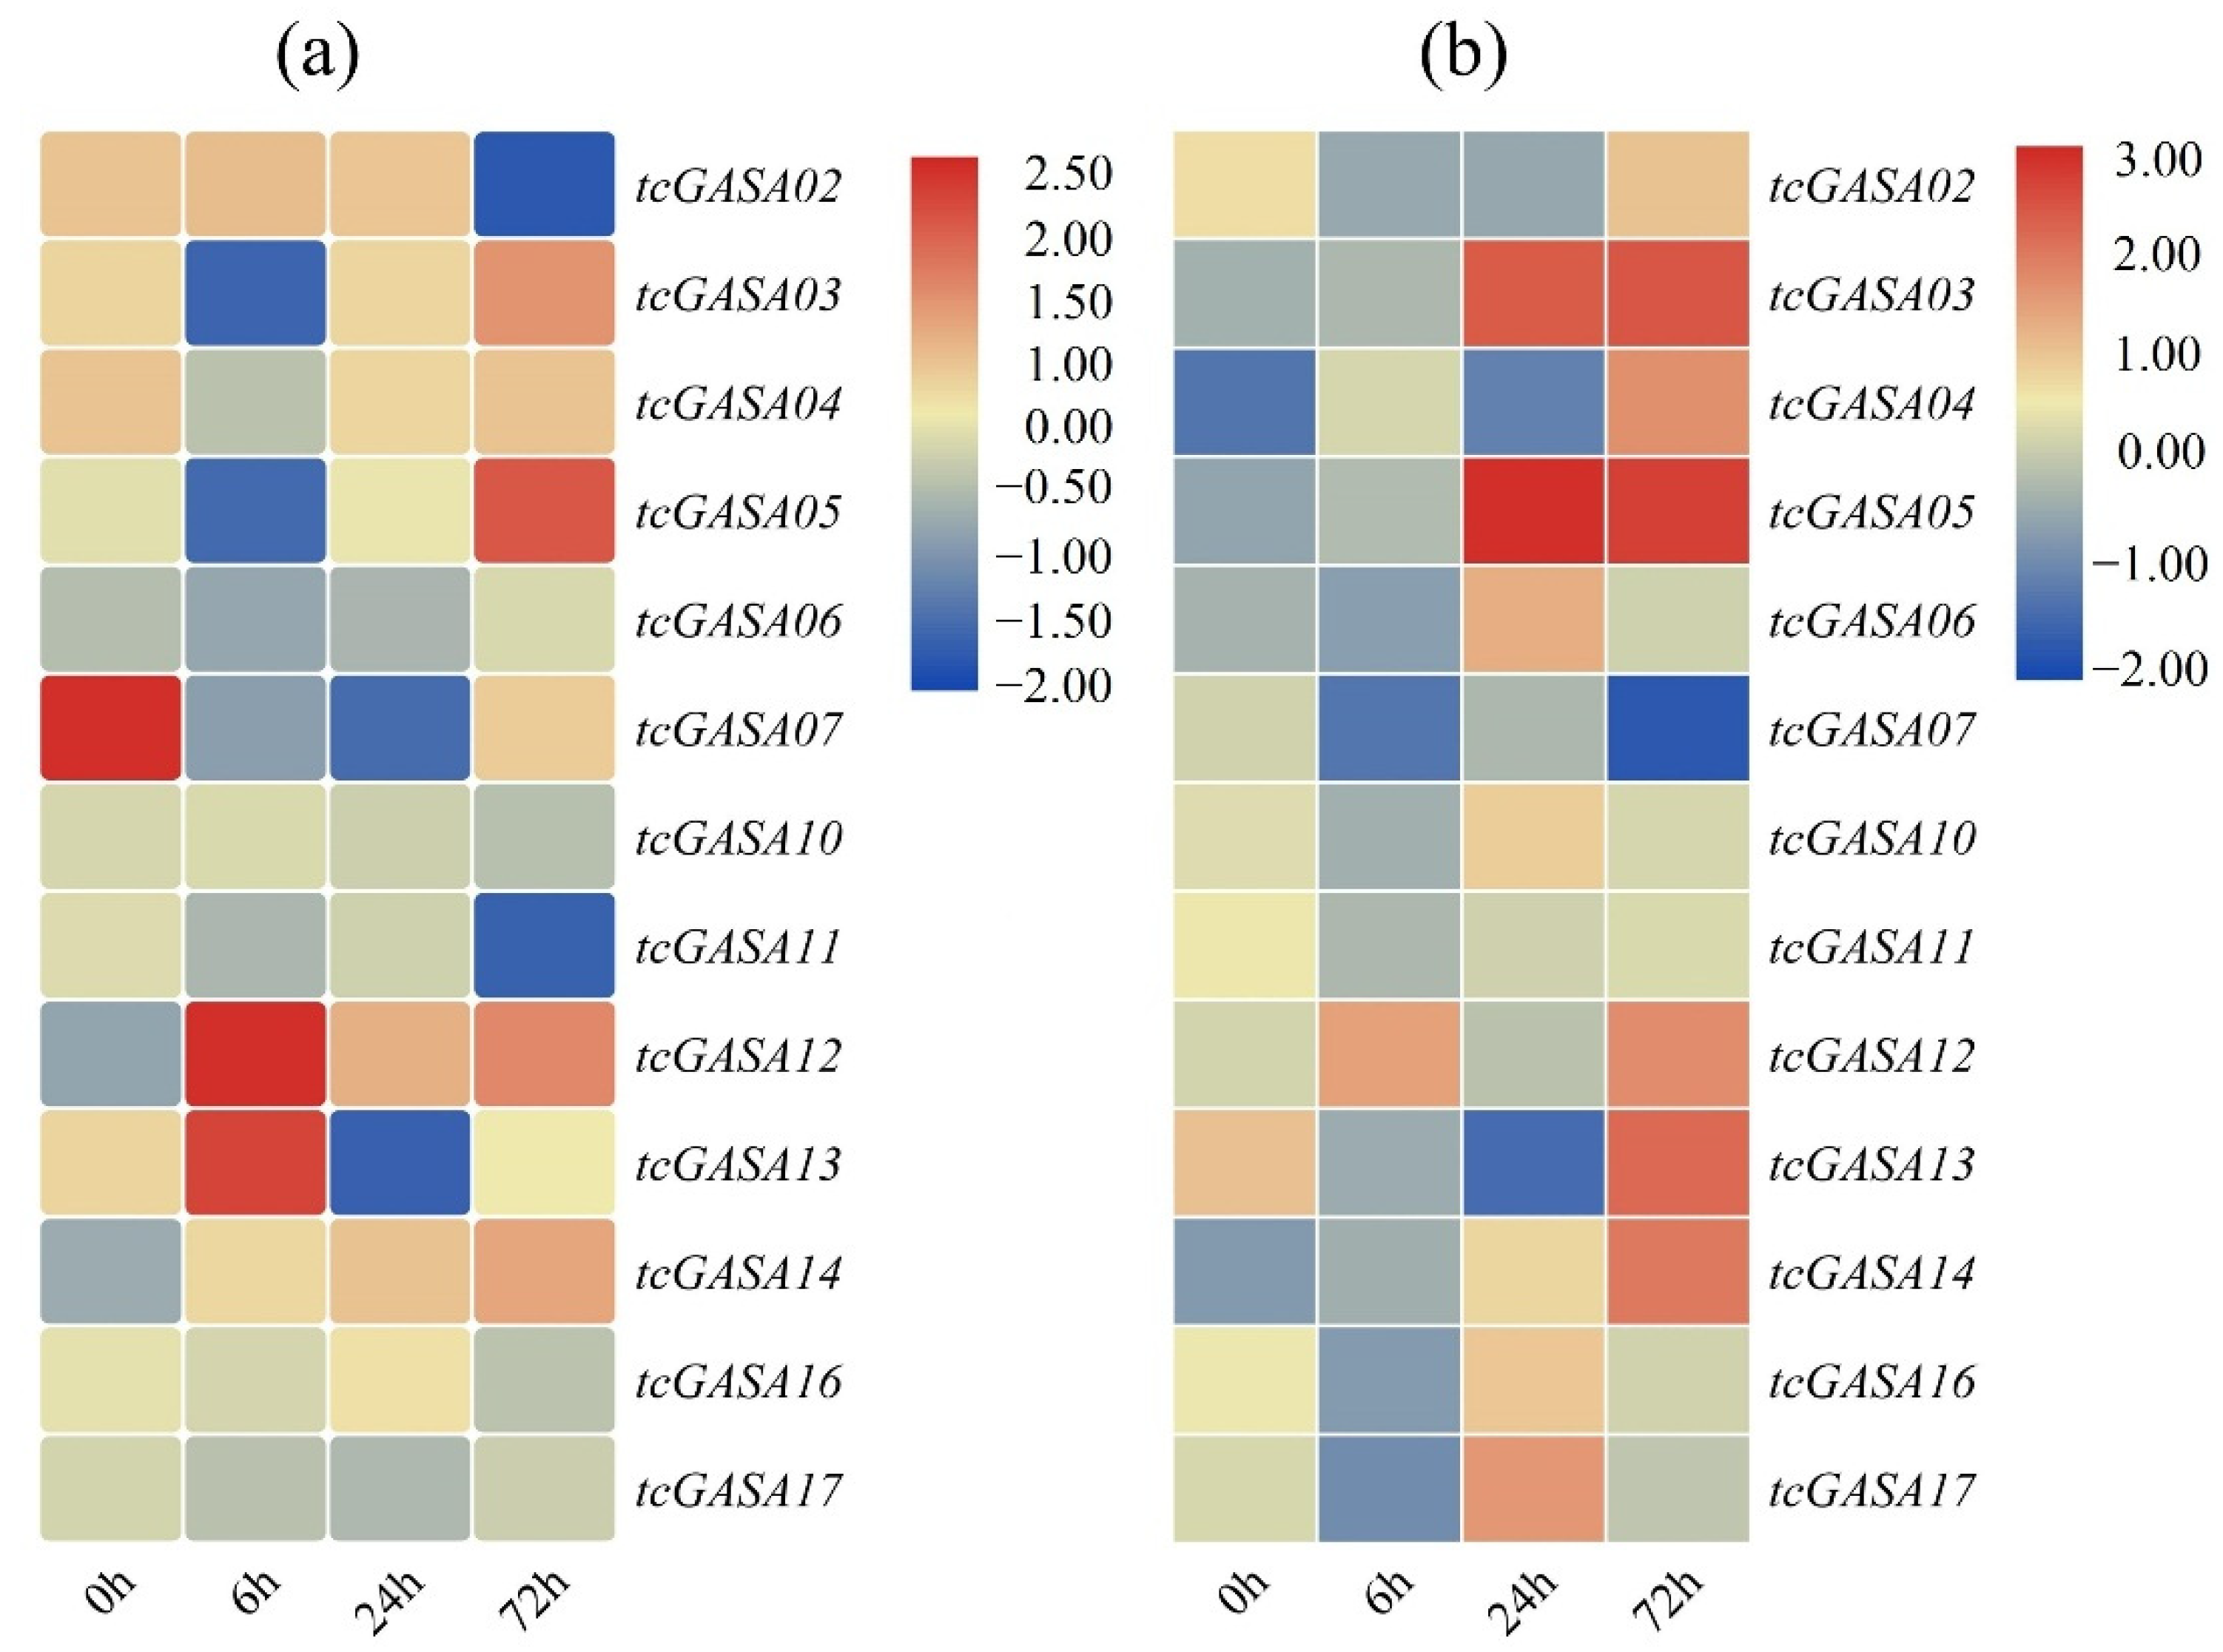
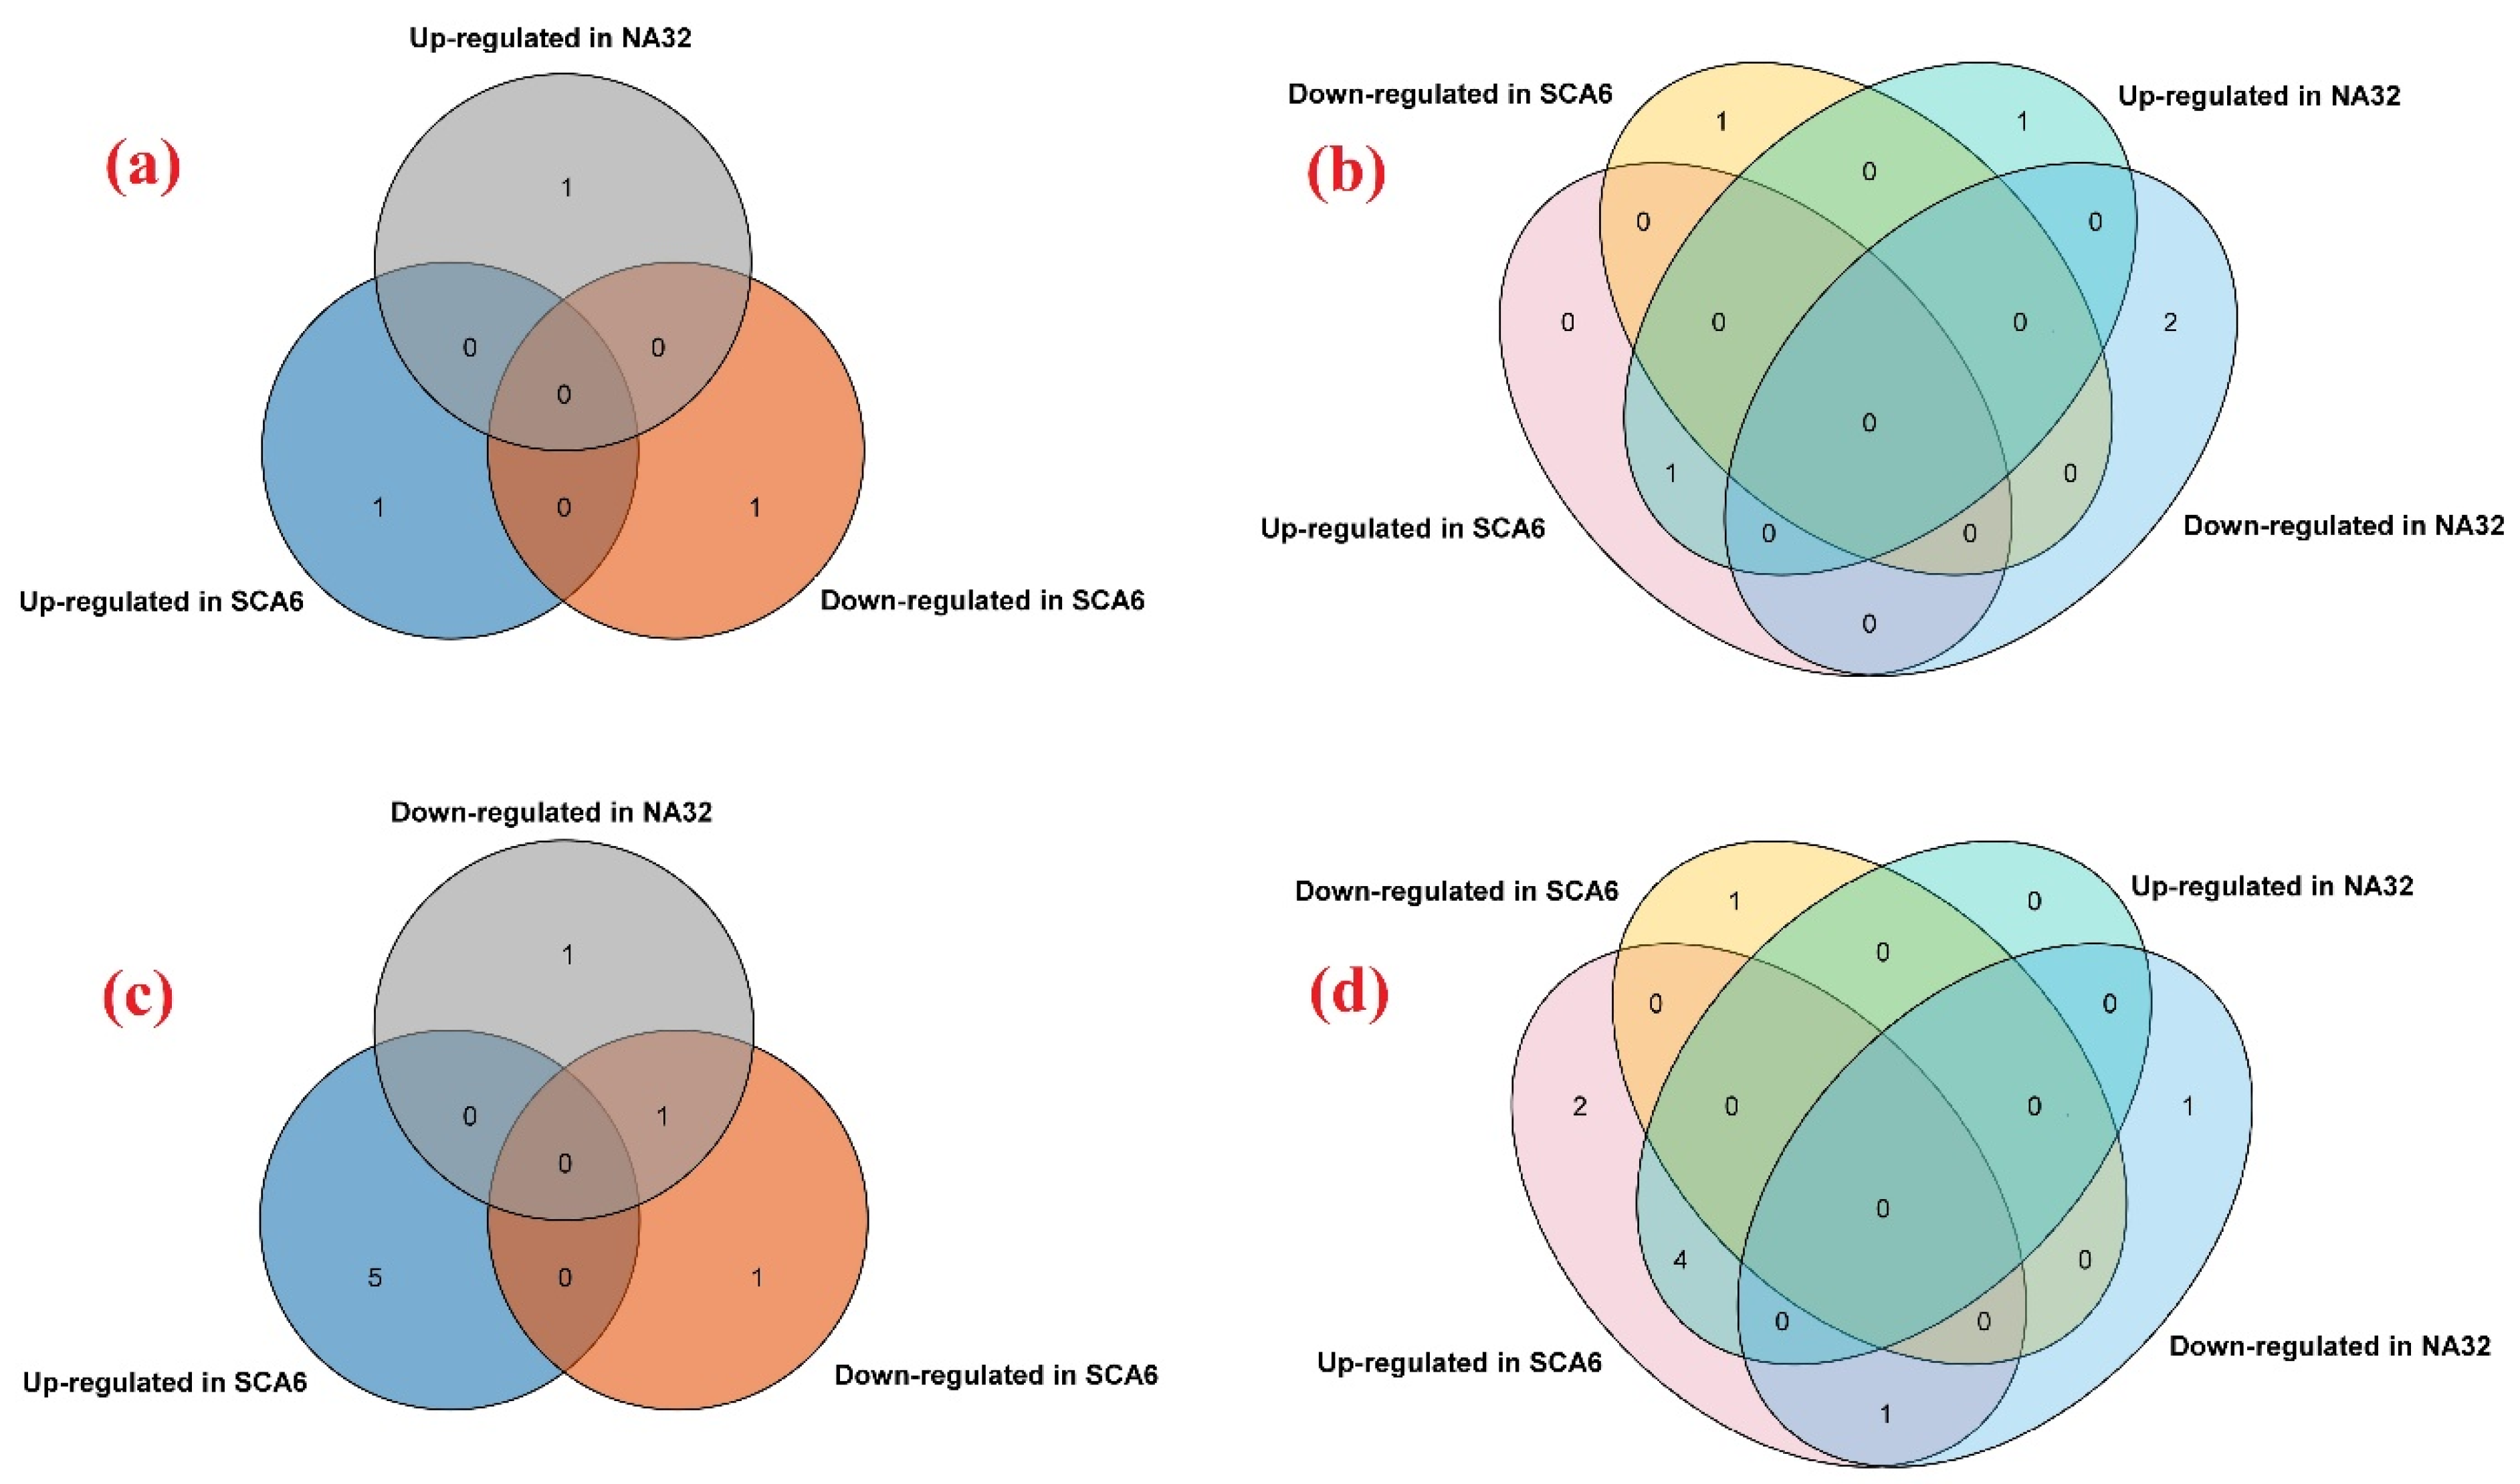
3.11. Expression Analyses of tcGASAs in Biotic Stress (P. megakarya)

The role of tcGASAs against P. megakarya was accessed using RNA-seq data of cacao inoculated with P. megakarya for 0 h, 6 h, 24 h, and 72 h in susceptible cultivar Nanay (NA32) and fungal resistant cultivar Scavina (SCA6) (Figure 9a,b). In susceptible cultivar, tcGASA12 and tcGASA13 as early responses were upregulated after 6 h of inoculation while tcGASA12 was more expressed after 72 h (Figure 9a). The expression patterns of tcGASAs were different in fungal resistant cultivar Scavina, whereas most genes were induced after 72 h of incubation of P. megakarya (Figure 9b). Moreover, tcGASA03, tcGASA05, and tcGASA13 were more upregulated in response to fungi treatment after 72 h of incubation in resistant cultivar Scavina (Figure 9b). Four genes, tcGASA01, tcGASA08, tcGASA09, tcGASA15, were not expressed. Probably, they are induced at specific conditions or at a specific step of growth and development. The analyses showed differential expression of tcGASAs expression under biotic stress of fungus P. megakarya in SCA6 and NA32 (Figure 10). The tcGASA03, tcGASA05, tcGASA06, tcGASA16, and tcGASA17 showed high expression after 24 h of inoculation and tcGASA03, tcGASA04, and tcGASA13 more expressed after 72 h in SCA6. This showed their possible role for fungal resistance. The tcGASA05, tcGASA12, and tcGASA14 also showed high expression in SCA6 but these genes also showed high expression in NA32. Hence, these may not be involved in resistance to fungus.

4. Discussion

In the current study, we identified 17 tcGASAs and analyzed their genomic distributions and chemical properties. RNAseq data analyses explicated their possible roles in bean development (food of cacao), various abiotic stresses, and the biotic stress of P. megakarya.
Cacao is an economically important plant, and its seeds are used for chocolate, and it is also the main source of income for 40–50 million farmers [2,3]. Despite this importance, up to the best of our knowledge, five gene families, WRKY [7], sucrose synthase [8], Stearoyl-acyl carrier protein desaturase [9], sucrose transporter [10], and NAC [11] are studied in cacao. The role of the NAC family was not explained in abiotic and biotic stresses. The GASA family’s role was reported in plant development, function regulation, and biotic and abiotic stresses, as mentioned in the introduction (vide infra). Cacao production is also affected by various biotic and abiotic stresses. In the current study, we focused on the GASA gene family in cacao. We identified 17 GASA genes, which were unequally distributed on six chromosomes among ten. The GASA proteins have low molecular weight with conserved GASA and cysteine domains. Our findings are in agreement with previous studies that revealed that GASA genes mostly exist in lower numbers, have low molecular weight, and are unequally distributed on chromosomes within genomes as reported for rice, 9 GASA genes [15], 14 genes in Grapevine [13], 15 genes in Arabidopsis [12], and 19 genes in tomato [15]. However, a somewhat high number of GASA have also reported, such as in apple, 26 genes [12], and 37 genes in soybean [18]. The number of introns were variable in tcGASA within genes that cluster together in phylogeny. The loss and gain of introns occurs in the course of evolution within protein-coding genes of the plants and is also reported within the GASA of other plant species [13,18,60,61,62].
The tcGASAs were predicted to be alkaline, hydrophilic, and mostly unstable proteins. However, we also detected four stable proteins: tcGASA03, tcGASA11, tcGASA13, and tcGASA15. The stability demonstrates the lifetime of proteins related to cellular enzymatic reactions [62]. Hence, these four proteins may play extensive roles in various enzymatic activities. The data of subcellular localization also provide insight into the function of proteins [63]. Apart from tcGASA08 (which localizes to the plasma membrane), other proteins locate in the extracellular space. Extracellular localization of GASA proteins in several plants has also been reported previously [15,18,21]. Localization of GASA proteins in the plasma membrane, cytoplasm, and the nucleus has also been described. The variations in subcellular localization may occur due to various factors, such as protein–protein interaction and post-translational modifications [36,64]. The prediction of 3D structure and pocket site of proteins can provide valuable information about protein function based on ligand-binding sites [65,66]. In the present study, the cysteine, proline, lysine, leucine, serine, and threonine were frequently predicted as the key binding residues in the structure of GASA proteins, in which proline, serine, and leucine are known as the amino acid residues associated with responses to environmental stimuli [65,67].
Post-translational modifications are processes of chemical modifications of proteins and they produce diversity in structure and function, including subcellular localization, protein–protein interaction, and regulating enzyme activity by allosteric phenomena [36,68,69]. We predicted phosphorylation sites in all tcGASA, ranging in number from 7 to 57. The phosphorylation of proteins is also vital for cell signaling, regulation of various protein mechanisms, and as a substrate for various kinases [70,71,72]. It could be of interest to further study the function and structure of tcGASA proteins using tandem mass spectrometry (MS/MS), and CRISPR/Cas9 genome editing along with transcriptomic analysis of transgenic lines. Similarly, glycosylation is also an abundant and varied modification that plays an essential role in the biological and physiological functions of a living organism [73]. We detected glycosylation sites on the N-terminal of tcGASA10, tcGASA14, and tcGASA16. These tcGASAs may play significant roles in plant function and regulations.
We performed the phylogenetic analyses of tcGASAs with GASA of 6 other species. We also included Gossypium raimondii, a closely related species from the plant family Malvaceae. The phylogenetic analyses distributed GASA proteins into 5 groups and the tcGASAs were also distributed into all five groups. Tc08v2_t01469 (tcGASA16) was the only protein which grouped with Arabidopsis, while other tcGASAs showed sister relationships with GASA of Gossypium. The cacao belongs to the basal group, whereas Gossypium belongs to the crown group of the family Malvaceae [74,75], but the close phylogenetic relationships of proteins of these two species support their family-level relationship. The motifs and exon–intron analyses showed variations within proteins that cluster together in phylogeny. This shows that GASA of some groups may have evolved during evolution, which led to variations in motifs and introns in some groups. The same was observed in GASA of other species and has also been reported for other gene families [13,18,76,77]. GASAs in a phylogenetic group showed different expression patterns, indicating that GASAs are controlled by various regulatory systems. These findings also show that some other processes are related to the function of proteins instead of their close phylogenetic relationships. A similar observation was reported in Nicotiana tabacum L. [72]. However, some studies also proposed that the closely related proteins on a phylogenetic tree have a similar function [78,79].
The tandem and segmental duplicated genes play an important role in evolution, domestication, functional regulation, and biotic and abiotic stresses [80,81,82,83,84]. We determined segmental duplication of nine genes that form four groups as: tcGASA02-tcGASA03-tcGASA13, tcGASA08-tcGASA09, tcGASA14-tcGASA15, and tcGASA10-tcGASA17. These gene pairs were present in the same group within the phylogenetic tree. Similar results were reported in genome-wide analyses of GASAs in soybean [18]. A previous study also proposed that segmentally duplicated genes also showed similar functions and stable expressions. [18,85]. In the current study, each pair of segmentally duplicated genes did not agree with the previous finding. In biotic stress of fungus (P. megakarya), tcGASA08-tcGASA09 and tcGASA10-tcGASA17 showed similar expression that tcGASA08 and tcGASA09 both did not express while tcGASA10-tcGASA17 both are less regulated/down-regulated genes. The other two pairs tcGASA02-tcGASA03-tcGASA13 and tcGASA14-tcGASA15 showed a different expression, as some genes were found down-regulated while some genes were found up-regulated (Figure 9). These findings suggest that segmentally duplicated pairs may also perform different functions, and functional analyses of each segmentally duplicated gene can provide authentic information about their roles in various physiological and biochemical processes. Moreover, our study, along with the previous report [18], suggests that genes within the same groups have more chances of segmental duplication events among them. The Ka/Ks < 1 indicates that purifying selection pressure exists on the GASA genes after duplication, as reported previously [13]. We also observed mostly purifying selection pressure on tcGASAs, including duplicating genes (Table S1).
The cis-acting regulatory elements involved in transcription of regulation genes are induced through independent signal transduction pathways under biotic and abiotic stresses [72,86]. We observed several key cis-regulating elements in response to light, hormones, stresses, and growth in the promoter site of tcGASAs. The cis-regulating elements for drought, anerobic induction, low temperature, and plant defense were also evident. The existence of diverse cis-regulating elements in promoter regions indicates their roles in the regulation of the tcGASAs and different pathways of cacao. Further study such as using the CRISPR/Cas genome-editing system and T-DNA can shed light on the roles of these cis-regulating elements.
Different strategies are used to develop cacao cultivars that produce food in high quantities and are resistant to abiotic and biotic stresses [4]. Here, we studied the role of GASA genes in cacao development and in protection against biotic and abiotic stresses. Tissue-specific expression was observed for tcGASAs, which showed their role in the development and functional regulation of cacao. Up to eight tcGASAs were highly expressed in the cacao bean, which is the food part used for making chocolate. This high expression may reveal the conserved function of these genes in the development of the bean and cacao flavor. Gene expression analysis of tcGASA genes in cacao beans in disease resistance (bulk) and disease susceptibility (fine flavor cacao) could be of interest [87,88]. The role of tcGASAs was also stated in the development of grapevine seeds [13]. Further data based on cloning can provide new insight into their roles in bean development. Expression analyses of the orthologous genes of Arabidopsis also indicated the role of GASA genes in various abiotic stresses, including drought, which significantly affects the growth of cacao [89]. Hence, these genes may also be important to produce drought-resistant cultivars. Expression analyses also provide insight into the gene’s function in response to biotic stresses [72]. The black rod disease of genus Phytophthora caused up to 20–25% loss (700,000 metric tons) to the world cacao production annually. In some regions, the Phytophthora caused losses of 30–90% of the crops [90]. Here, we explored the function of tcGASAs based on RNAseq data against black rod causing pathogen P. megakarya and observed highly expressed tcGASA genes in plants inoculated at 24 h and 72 h in the tolerant cultivar SCA6 as compared to susceptible cultivar NA32. These data indicate that tcGASAs respond to fungus. Hence, the complete characterization of these upregulated genes can provide target genes for the development of resistant cultivars to the disease of genus Phytophthora to enhance the production of cacao for the welfare of not only farmers involved in cacao cultivation, but also for the welfare of all humanity to provide high-quality delicious chocolate with quality nutrition.
In conclusion, our study provides new insight into the identification, characterization, and expression of the GASA genes in the Theobroma cacao plant. Expression analyses revealed the role of the GASA genes in seed development. Our findings reveal that tcGASAs are diverse based on their structure and regulatory systems, indicating that they are involved in various cellular pathways related to development and stress responses. Furthermore, our result indicates that the GASA genes could be related to resistance against the fungus Phytophthora megakarya, which causes significant losses to cacao production each year. Our study may be helpful for the generation of cultivars that are resistant to the fungus of the genus Phytophthora. The present work, as an in-silico study, revealed many aspects of structural, regulatory systems, and expression of GASA gene family members in cacao. However, it is necessary to evaluate the expression of these genes in different tissues of sensitive and fungus-resistant clones of cacao. We also suggest using new techniques such as CRISPR/Cas genome-editing to determine the function and interactions of cacao-GASAs.

Supplementary Materials

The following are available online at https://0-www-mdpi-com.brum.beds.ac.uk/article/10.3390/agronomy11071425/s1, Table S1: The complete detail of each sequence of Theobroma cacao analyzed in current study including protein sequences, coding sequences, genomic sequences, and promoter regions, Table S2. Phosphorylation and glycosylation sites in GASA proteins, Table S3. Cis-regulatory elements in promoter regions of tcGASA.

Author Contributions

Manuscript drafting: A.; Data analyses: A.; P.H.; H.M.T.M.; S.F.; Data curation: A.; Data interpretation: A.; P.H.; F.M.; P.P.; Conceptualization: A.; P.P.; I.A.; P.H.; Review and editing of first draft: P.H.; P.P.; I.A.; Supervision: P.P.; P.H. All authors have read and agreed to the published version of the manuscript.

Funding

This research received no external funding while the APC was funded by University of Helsinki.

Institutional Review Board Statement

Not applicable.

Informed Consent Statement

Not applicable.

Data Availability Statement

The public data set is analyzed in the manuscript. All the analyzed data are available in the main manuscript or as Supplementary Materials.

Conflicts of Interest

The authors declare no competing financial interests. Author Ibrar Ahmed and Hafiz Muhammad Talha Malik were employed by the company Alpha Genomics Private limited. The remaining authors declare that the research was conducted in the absence of any commercial or financial relationships that could be construed as a potential conflict of interest.

References

  1. Purseglove, J.W. Tropical Crops: Dicotyledons 1 and 2; Longmans, Green and Co. Ltd.: London, UK, 1968. [Google Scholar]
  2. Motamayor, J.C.; Mockaitis, K.; Schmutz, J.; Haiminen, N.; Livingstone, D.; Cornejo, O.; Findley, S.D.; Zheng, P.; Utro, F.; Royaert, S.; et al. The genome sequence of the most widely cultivated cacao type and its use to identify candidate genes regulating pod color. Genome Biol. 2013, 14, 1–25. [Google Scholar] [CrossRef] [Green Version]
  3. Litz, R. Theobroma Cacao. In Biotechnology of Fruit and Nut Crops; CABI: Wallingford, UK, 2005; pp. 639–669. [Google Scholar]
  4. Bridgemohan, P.; Mohammed, M. The Ecophysiology of Abiotic and Biotic Stress on the Pollination and Fertilization of Cacao (Theobroma cacao L.; formerly Sterculiaceae family). In Abiotic and Biotic Stress in Plants; IntechOpen: London, UK, 2019. [Google Scholar] [CrossRef] [Green Version]
  5. McElroy, M.S.; Navarro, A.J.R.; Mustiga, G.; Stack, C.; Gezan, S.; Peña, G.; Sarabia, W.; Saquicela, D.; Sotomayor, I.; Douglas, G.M.; et al. Prediction of Cacao (Theobroma cacao) Resistance to Moniliophthora spp. Diseases via Genome-Wide Association Analysis and Genomic Selection. Front. Plant Sci. 2018, 9, 343. [Google Scholar] [CrossRef]
  6. Argout, X.; Martin, G.; Droc, G.; Fouet, O.; Labadie, K.; Rivals, E.; Aury, J.M.; Lanaud, C. The cacao Criollo genome v2.0: An improved version of the genome for genetic and functional genomic studies. BMC Genom. 2017, 18, 1–9. [Google Scholar] [CrossRef]
  7. Dayanne, S.M.D.A.; Oliveira Jordão Do Amaral, D.; Del-Bem, L.E.; Bronze Dos Santos, E.; Santana Silva Raner, J.; Peres Gramacho, K.; Vincentz, M.; Micheli, F. Genome-wide identification and characterization of cacao WRKY transcription factors and analysis of their expression in response to witches’ broom disease. PLoS ONE 2017, 12, e0187346. [Google Scholar]
  8. Li, F.; Hao, C.; Yan, L.; Wu, B.; Qin, X.; Lai, J.; Song, Y. Gene structure, phylogeny and expression profile of the sucrose synthase gene family in cacao (Theobroma cacao L.). J. Genet. 2015, 94, 461–472. [Google Scholar] [CrossRef]
  9. Zhang, Y.; Maximova, S.N.; Guiltinan, M.J. Characterization of a stearoyl-acyl carrier protein desaturase gene family from chocolate tree, Theobroma cacao L. Front. Plant Sci. 2015, 6, 239. [Google Scholar] [CrossRef] [PubMed] [Green Version]
  10. Li, F.; Wu, B.; Qin, X.; Yan, L.; Hao, C.; Tan, L.; Lai, J. Molecular cloning and expression analysis of the sucrose transporter gene family from Theobroma cacao L. Gene 2014, 546, 336–341. [Google Scholar] [CrossRef]
  11. Shen, S.; Zhang, Q.; Shi, Y.; Sun, Z.; Zhang, Q.; Hou, S.; Wu, R.; Jiang, L.; Zhao, X.; Guo, Y. Genome-wide analysis of the NAC domain transcription factor gene family in Theobroma cacao. Genes 2020, 11, 35. [Google Scholar] [CrossRef] [PubMed] [Green Version]
  12. Fan, S.; Zhang, D.; Zhang, L.; Gao, C.; Xin, M.; Tahir, M.M.; Li, Y.; Ma, J.; Han, M. Comprehensive analysis of GASA family members in the Malus domestica genome: Identification, characterization, and their expressions in response to apple flower induction. BMC Genom. 2017, 18, 827. [Google Scholar] [CrossRef] [PubMed]
  13. Ahmad, B.; Yao, J.; Zhang, S.; Li, X.; Zhang, X.; Yadav, V.; Wang, X. Genome-Wide Characterization and Expression Profiling of GASA Genes during Different Stages of Seed Development in Grapevine (Vitis vinifera L.) Predict Their Involvement in Seed Development. Int. J. Mol. Sci. 2020, 21, 1088. [Google Scholar] [CrossRef] [PubMed] [Green Version]
  14. Shi, L.; Gast, R.T.; Gopalraj, M.; Olszewski, N.E. Characterization of a shoot-specific, GA3- and ABA-Regulated gene from tomato. Plant J. 1992, 2, 153–159. [Google Scholar]
  15. Rezaee, S.; Ahmadizadeh, M.; Heidari, P. Genome-wide characterization, expression profiling, and post-transcriptional study of GASA gene family. Gene Rep. 2020, 20, 100795. [Google Scholar] [CrossRef]
  16. Zhang, S.; Wang, X. Expression pattern of GASA, downstream genes of DELLA, in Arabidopsis. Chin. Sci. Bull. 2008, 53, 3839–3846. [Google Scholar] [CrossRef] [Green Version]
  17. Silverstein, K.A.T.; Moskal, W.A.; Wu, H.C.; Underwood, B.A.; Graham, M.A.; Town, C.D.; VandenBosch, K.A. Small cysteine-rich peptides resembling antimicrobial peptides have been under-predicted in plants. Plant J. 2007, 51, 262–280. [Google Scholar] [CrossRef] [PubMed]
  18. Ahmad, M.Z.; Sana, A.; Jamil, A.; Nasir, J.A.; Ahmed, S.; Hameed, M.U. A genome-wide approach to the comprehensive analysis of GASA gene family in Glycine max. Plant Mol. Biol. 2019, 100, 607–620. [Google Scholar] [CrossRef]
  19. de la Fuente, J.I.; Amaya, I.; Castillejo, C.; Sánchez-Sevilla, J.F.; Quesada, M.A.; Botella, M.A.; Valpuesta, V. The strawberry gene FaGAST affects plant growth through inhibition of cell elongation. J. Exp. Bot. 2006, 57, 2401–2411. [Google Scholar] [CrossRef]
  20. Zimmermann, R.; Sakai, H.; Hochholdinger, F. The Gibberellic Acid Stimulated-Like gene family in maize and its role in lateral root development. Plant Physiol. 2010, 152, 356–365. [Google Scholar] [CrossRef] [PubMed] [Green Version]
  21. Zhang, S.; Yang, C.; Peng, J.; Sun, S.; Wang, X. GASA5, a regulator of flowering time and stem growth in Arabidopsis thaliana. Plant Mol. Biol. 2009, 69, 745–759. [Google Scholar] [CrossRef] [PubMed]
  22. Roxrud, I.; Lid, S.E.; Fletcher, J.C.; Schmidt, E.D.L.; Opsahl-Sorteberg, H.-G. GASA4, one of the 14-member Arabidopsis GASA family of small polypeptides, regulates flowering and seed development. Plant Cell Physiol. 2007, 48, 471–483. [Google Scholar] [CrossRef]
  23. Nahirñak, V.; Almasia, N.I.; Hopp, H.E.; Vazquez-Rovere, C. Snakin/GASA proteins: Involvement in hormone crosstalk and redox homeostasis. Plant Signal. Behav. 2012, 7, 1004–1008. [Google Scholar] [CrossRef] [Green Version]
  24. Moyano-Canete, E.; Bellido, M.L.; García-Caparrós, N.; Medina-Puche, L.; Amil-Ruiz, F.; González-Reyes, J.A.; Caballero, J.L.; Munoz-Blanco, J.; Blanco-Portales, R. FaGAST2, a strawberry ripening-related gene, acts together with FaGAST1 to determine cell size of the fruit receptacle. Plant Cell Physiol. 2013, 54, 218–236. [Google Scholar] [CrossRef] [Green Version]
  25. Yang, Q.; Niu, Q.; Tang, Y.; Ma, Y.; Yan, X.; Li, J.; Tian, J.; Bai, S.; Teng, Y. PpyGAST1 is potentially involved in bud dormancy release by integrating the GA biosynthesis and ABA signaling in ‘Suli’pear (Pyrus pyrifolia White Pear Group). Environ. Exp. Bot. 2019, 162, 302–312. [Google Scholar] [CrossRef]
  26. He, H.; Yang, X.; Xun, H.; Lou, X.; Li, S.; Zhang, Z.; Jiang, L.; Dong, Y.; Wang, S.; Pang, J. Over-expression of GmSN1 enhances virus resistance in Arabidopsis and soybean. Plant Cell Rep. 2017, 36, 1441–1455. [Google Scholar] [CrossRef] [PubMed]
  27. Wu, T.; Cheng, C.; Zhong, Y.; Lv, Y.; Ma, Y.; Zhong, G. Molecular characterization of the gibberellin-stimulated transcript of GASA4 in Citrus. Plant Growth Regul. 2020, 91, 1–11. [Google Scholar] [CrossRef] [Green Version]
  28. Kovalskaya, N.; Hammond, R.W. Expression and functional characterization of the plant antimicrobial snakin-1 and defensin recombinant proteins. Protein Expr. Purif. 2009, 63, 12–17. [Google Scholar] [CrossRef] [Green Version]
  29. Almasia, N.I.; Bazzini, A.A.; Hopp, H.E.; Vazquez-Rovere, C. Overexpression of snakin-1 gene enhances resistance to Rhizoctonia solani and Erwinia carotovora in transgenic potato plants. Mol. Plant Pathol. 2008, 9, 329–338. [Google Scholar] [CrossRef] [PubMed]
  30. Berrocal-Lobo, M.; Segura, A.; Moreno, M.; López, G.; Garcıa-Olmedo, F.; Molina, A. Snakin-2, an antimicrobial peptide from potato whose gene is locally induced by wounding and responds to pathogen infection. Plant Physiol. 2002, 128, 951–961. [Google Scholar] [CrossRef] [Green Version]
  31. Qu, J.; Kang, S.G.; Hah, C.; Jang, J.-C. Molecular and cellular characterization of GA-Stimulated Transcripts GASA4 and GASA6 in Arabidopsis thaliana. Plant Sci. 2016, 246, 1–10. [Google Scholar] [CrossRef] [PubMed]
  32. García, A.N.; Ayub, N.D.; Fox, A.R.; Gómez, M.C.; Diéguez, M.J.; Pagano, E.M.; Berini, C.A.; Muschietti, J.P.; Soto, G. Alfalfa snakin-1 prevents fungal colonization and probably coevolved with rhizobia. BMC Plant Biol. 2014, 14, 248. [Google Scholar] [CrossRef] [Green Version]
  33. Balaji, V.; Smart, C.D. Over-expression of snakin-2 and extensin-like protein genes restricts pathogen invasiveness and enhances tolerance to Clavibacter michiganensis subsp. michiganensis in transgenic tomato (Solanum lycopersicum). Transgenic Res. 2012, 21, 23–37. [Google Scholar] [CrossRef] [PubMed] [Green Version]
  34. Wang, H.; Wei, T.; Wang, X.; Zhang, L.; Yang, M.; Chen, L.; Song, W.; Wang, C.; Chen, C. Transcriptome Analyses from Mutant Salvia miltiorrhiza Reveals Important Roles for SmGASA4 during Plant Development. Int. J. Mol. Sci. 2018, 19, 2088. [Google Scholar] [CrossRef]
  35. Cheng, X.; Wang, S.; Xu, D.; Liu, X.; Li, X.; Xiao, W.; Cao, J.; Jiang, H.; Min, X.; Wang, J.; et al. Identification and Analysis of the GASR Gene Family in Common Wheat (Triticum aestivum L.) and Characterization of TaGASR34, a Gene Associated With Seed Dormancy and Germination. Front. Genet. 2019, 10, 1–20. [Google Scholar] [CrossRef] [PubMed]
  36. Nahirñak, V.; Rivarola, M.; De Urreta, M.G.; Paniego, N.; Hopp, H.E.; Almasia, N.I.; Vazquez-Rovere, C. Genome-wide analysis of the Snakin/GASA gene family in Solanum Tuberosum cv. Kennebec. Am. J. Potato Res. 2016, 93, 172–188. [Google Scholar] [CrossRef]
  37. Voorrips, R.E. MapChart: Software for the graphical presentation of linkage maps and QTLs. J. Hered. 2002, 93, 77–78. [Google Scholar] [CrossRef] [PubMed] [Green Version]
  38. Gasteiger, E.; Hoogland, C.; Gattiker, A.; Duvaud, S.; Wilkins, M.R.; Appel, R.D.; Bairoch, A. Protein identification and analysis tools on the ExPASy server. In The Proteomics Protocols Handbook; Humana Press: Totowa, NJ, USA, 2005; pp. 571–607. [Google Scholar]
  39. Savojardo, C.; Martelli, P.L.; Fariselli, P.; Profiti, G.; Casadio, R. BUSCA: An integrative web server to predict subcellular localization of proteins. Nucleic Acids Res. 2018, 46, W459–W466. [Google Scholar] [CrossRef]
  40. Lescot, M.; Déhais, P.; Thijs, G.; Marchal, K.; Moreau, Y.; Van de Peer, Y.; Rouzé, P.; Rombauts, S. PlantCARE, a database of plant cis-acting regulatory elements and a portal to tools for in silico analysis of promoter sequences. Nucleic Acids Res. 2002, 30, 325–327. [Google Scholar] [CrossRef] [PubMed]
  41. Blom, N.; Sicheritz-Pontén, T.; Gupta, R.; Gammeltoft, S.; Brunak, S. Prediction of post-translational glycosylation and phosphorylation of proteins from the amino acid sequence. Proteomics 2004, 4, 1633–1649. [Google Scholar] [CrossRef] [PubMed]
  42. Gupta, R.; Brunak, S. Prediction of glycosylation across the human proteome and the correlation to protein function—PubMed. Pac. Symp. Biocomput. 2002, 7, 310–322. [Google Scholar]
  43. Sievers, F.; Wilm, A.; Dineen, D.; Gibson, T.J.; Karplus, K.; Li, W.; Lopez, R.; McWilliam, H.; Remmert, M.; Söding, J.; et al. Fast, scalable generation of high-quality protein multiple sequence alignments using Clustal Omega. Mol. Syst. Biol. 2011, 7, 539. [Google Scholar] [CrossRef]
  44. Kumar, S.; Stecher, G.; Li, M.; Knyaz, C.; Tamura, K. MEGA X: Molecular evolutionary genetics analysis across computing platforms. Mol. Biol. Evol. 2018, 35, 1547–1549. [Google Scholar] [CrossRef]
  45. Letunic, I.; Bork, P. Interactive Tree of Life (iTOL) v4: Recent updates and new developments. Nucleic Acids Res. 2019, 47, W256–W259. [Google Scholar] [CrossRef] [PubMed] [Green Version]
  46. Bailey, T.L.; Boden, M.; Buske, F.A.; Frith, M.; Grant, C.E.; Clementi, L.; Ren, J.; Li, W.W.; Noble, W.S. MEME SUITE: Tools for motif discovery and searching. Nucleic Acids Res. 2009, 37, W202–W208. [Google Scholar] [CrossRef] [PubMed]
  47. Zheng, L.; Ying, Y.; Wang, L.; Wang, F.; Whelan, J.; Shou, H. Identification of a novel iron regulated basic helix-loop-helix protein involved in Fe homeostasis in Oryza sativa. BMC Plant Biol. 2010, 10, 166. [Google Scholar] [CrossRef] [Green Version]
  48. Kearse, M.; Moir, R.; Wilson, A.; Stones-Havas, S.; Cheung, M.; Sturrock, S.; Buxton, S.; Cooper, A.; Markowitz, S.; Duran, C.; et al. Geneious Basic: An integrated and extendable desktop software platform for the organization and analysis of sequence data. Bioinformatics 2012, 28, 1647–1649. [Google Scholar] [CrossRef]
  49. Wang, Y.; Tang, H.; DeBarry, J.D.; Tan, X.; Li, J.; Wang, X.; Lee, T.; Jin, H.; Marler, B.; Guo, H. MCScanX: A toolkit for detection and evolutionary analysis of gene synteny and collinearity. Nucleic Acids Res. 2012, 40, e49. [Google Scholar] [CrossRef] [Green Version]
  50. Rozas, J.; Ferrer-Mata, A.; Sánchez-DelBarrio, J.C.; Guirao-Rico, S.; Librado, P.; Ramos-Onsins, S.E.; Sánchez-Gracia, A. DnaSP 6: DNA sequence polymorphism analysis of large data sets. Mol. Biol. Evol. 2017, 34, 3299–3302. [Google Scholar] [CrossRef]
  51. Yang, S.; Zhang, X.; Yue, J.-X.; Tian, D.; Chen, J.-Q. Recent duplications dominate NBS-encoding gene expansion in two woody species. Mol. Genet. Genom. 2008, 280, 187–198. [Google Scholar] [CrossRef]
  52. Krzywinski, M.; Schein, J.; Birol, I.; Connors, J.; Gascoyne, R.; Horsman, D.; Jones, S.J.; Marra, M.A. Circos: An information aesthetic for comparative genomics. Genome Res. 2009, 19, 1639–1645. [Google Scholar] [CrossRef] [Green Version]
  53. Yang, J.; Yan, R.; Roy, A.; Xu, D.; Poisson, J.; Zhang, Y. The I-TASSER Suite: Protein structure and function prediction. Nat. Methods 2015, 12, 7–8. [Google Scholar] [CrossRef] [Green Version]
  54. Bhattacharya, D.; Nowotny, J.; Cao, R.; Cheng, J. 3Drefine: An interactive web server for efficient protein structure refinement. Nucleic Acids Res. 2016, 44, W406–W409. [Google Scholar] [CrossRef]
  55. Jendele, L.; Krivak, R.; Skoda, P.; Novotny, M.; Hoksza, D. PrankWeb: A web server for ligand binding site prediction and visualization. Nucleic Acids Res. 2019, 47, W345–W349. [Google Scholar] [CrossRef] [PubMed] [Green Version]
  56. Tian, W.; Chen, C.; Lei, X.; Zhao, J.; Liang, J. CASTp 3.0: Computed atlas of surface topography of proteins. Nucleic Acids Res. 2018, 46, W363–W367. [Google Scholar] [CrossRef] [Green Version]
  57. DeLano, W.L. Pymol: An open-source molecular graphics tool. CCP4 Newsl. Protein Crystallogr. 2002, 40, 82–92. [Google Scholar]
  58. Pokou, D.N.; Fister, A.S.; Winters, N.; Tahi, M.; Klotioloma, C.; Sebastian, A.; Marden, J.H.; Maximova, S.N.; Guiltinan, M.J. Resistant and susceptible cacao genotypes exhibit defense gene polymorphism and unique early responses to Phytophthora megakarya inoculation. Plant Mol. Biol. 2019, 99, 499–516. [Google Scholar] [CrossRef]
  59. Chen, C.; Chen, H.; Zhang, Y.; Thomas, H.R.; Frank, M.H.; He, Y.; Xia, R. TBtools: An Integrative Toolkit Developed for Interactive Analyses of Big Biological Data. Mol. Plant 2020, 13, 1194–1202. [Google Scholar] [CrossRef]
  60. Ding, Q.; Yang, X.; Pi, Y.; Li, Z.; Xue, J.; Chen, H.; Li, Y.; Wu, H. Genome-wide identification and expression analysis of extensin genes in tomato. Genomics 2020, 112, 4348–4360. [Google Scholar] [CrossRef] [PubMed]
  61. Ahmadizadeh, M.; Rezaee, S.; Heidari, P. Genome-wide characterization and expression analysis of fatty acid desaturase gene family in Camelina sativa. Gene Rep. 2020, 21, 100894. [Google Scholar] [CrossRef]
  62. Heidari, P.; Ahmadizadeh, M.; Izanlo, F.; Nussbaumer, T. In silico study of the CESA and CSL gene family in Arabidopsis thaliana and Oryza sativa: Focus on post-translation modifications. Plant Gene 2019, 19, 100189. [Google Scholar] [CrossRef]
  63. Zhang, S.; Wang, X. Overexpression of GASA5 increases the sensitivity of Arabidopsis to heat stress. J. Plant Physiol. 2011, 168, 2093–2101. [Google Scholar] [CrossRef] [PubMed]
  64. Wang, L.; Wang, Z.; Xu, Y.; Joo, S.; Kim, S.; Xue, Z.; Xu, Z.; Wang, Z.; Chong, K. OsGSR1 is involved in crosstalk between gibberellins and brassinosteroids in rice. Plant J. 2009, 57, 498–510. [Google Scholar] [CrossRef] [PubMed]
  65. Heidari, P.; Faraji, S.; Ahmadizadeh, M.; Ahmar, S.; Mora-Poblete, F. New insights into structure and function of TIFY genes in Zea mays and Solanum lycopersicum: A genome-wide comprehensive analysis. Front. Genet. 2021, 12, 534. [Google Scholar] [CrossRef]
  66. Musavizadeh, Z.; Najafi-Zarrini, H.; Kazemitabar, S.K.; Hashemi, S.H.; Faraji, S.; Barcaccia, G.; Heidari, P. Genome-Wide Analysis of Potassium Channel Genes in Rice: Expression of the OsAKT and OsKAT Genes under Salt Stress. Genes 2021, 12, 784. [Google Scholar] [CrossRef]
  67. Beauregard, M.; Hefford, M.A. Enhancement of essential amino acid contents in crops by genetic engineering and protein design. Plant Biotechnol. J. 2006, 4, 561–574. [Google Scholar] [CrossRef] [PubMed]
  68. Webster, D.E.; Thomas, M.C. Post-translational modification of plant-made foreign proteins; glycosylation and beyond. Biotechnol. Adv. 2012, 30, 410–418. [Google Scholar] [CrossRef]
  69. Duan, G.; Walther, D. The Roles of Post-translational Modifications in the Context of Protein Interaction Networks. PLoS Comput. Biol. 2015, 11, 1004049. [Google Scholar] [CrossRef] [PubMed]
  70. Silva-Sanchez, C.; Li, H.; Chen, S. Recent advances and challenges in plant phosphoproteomics. Proteomics 2015, 15, 1127–1141. [Google Scholar] [CrossRef]
  71. Heidari, P.; Mazloomi, F.; Nussbaumer, T.; Barcaccia, G. Insights into the SAM synthetase gene family and its roles in tomato seedlings under abiotic stresses and hormone treatments. Plants 2020, 9, 586. [Google Scholar] [CrossRef] [PubMed]
  72. Nawaz, Z.; Kakar, K.U.; Ullah, R.; Yu, S.; Zhang, J.; Shu, Q.Y.; Ren, X. liang Genome-wide identification, evolution and expression analysis of cyclic nucleotide-gated channels in tobacco (Nicotiana tabacum L.). Genomics 2019, 111, 142–158. [Google Scholar] [CrossRef]
  73. Yang, S.; Höti, N.; Yang, W.; Liu, Y.; Chen, L.; Li, S.; Zhang, H. Simultaneous analyses of N-linked and O-linked glycans of ovarian cancer cells using solid-phase chemoenzymatic method. Clin. Proteom. 2017, 14, 3. [Google Scholar] [CrossRef] [Green Version]
  74. Abdullah; Mehmood, F.; Shahzadi, I.; Ali, Z.; Islam, M.; Naeem, M.; Mirza, B.; Lockhart, P.; Ahmed, I.; Waheed, M.T. Correlations among oligonucleotide repeats, nucleotide substitutions and insertion-deletion mutations in chloroplast genomes of plant family Malvaceae. J. Syst. Evol. 2020, 59, 388–402. [Google Scholar] [CrossRef]
  75. Conover, J.L.; Karimi, N.; Stenz, N.; Ané, C.; Grover, C.E.; Skema, C.; Tate, J.A.; Wolff, K.; Logan, S.A.; Wendel, J.F.; et al. A Malvaceae mystery: A mallow maelstrom of genome multiplications and maybe misleading methods? J. Integr. Plant Biol. 2019, 61, 12–31. [Google Scholar] [CrossRef] [PubMed]
  76. Chattha, W.S.; Atif, R.M.; Iqbal, M.; Shafqat, W.; Farooq, M.A.; Shakeel, A. Genome-wide identification and evolution of Dof transcription factor family in cultivated and ancestral cotton species. Genomics 2020, 112, 4155–4170. [Google Scholar] [CrossRef] [PubMed]
  77. Lei, P.; Wei, X.; Gao, R.; Huo, F.; Nie, X.; Tong, W.; Song, W. Genome-wide identification of PYL gene family in wheat: Evolution, expression and 3D structure analysis. Genomics 2020, 113, 854–866. [Google Scholar] [CrossRef]
  78. Nawaz, Z.; Kakar, K.U.; Saand, M.A.; Shu, Q.Y. Cyclic nucleotide-gated ion channel gene family in rice, identification, characterization and experimental analysis of expression response to plant hormones, biotic and abiotic stresses. BMC Genom. 2014, 15, 1–18. [Google Scholar] [CrossRef] [Green Version]
  79. Nuruzzaman, M.; Manimekalai, R.; Sharoni, A.M.; Satoh, K.; Kondoh, H.; Ooka, H.; Kikuchi, S. Genome-wide analysis of NAC transcription factor family in rice. Gene 2010, 465, 30–44. [Google Scholar] [CrossRef] [PubMed]
  80. Liu, C.; Wu, Y.; Liu, Y.; Yang, L.; Dong, R.; Jiang, L.; Liu, P.; Liu, G.; Wang, Z.; Luo, L. Genome-wide analysis of tandem duplicated genes and their contribution to stress resistance in pigeonpea (Cajanus cajan). Genomics 2020, 113, 728–735. [Google Scholar] [CrossRef]
  81. Ahmad, B.; Azeem, F.; Ali, M.A.; Nawaz, M.A.; Nadeem, H.; Abbas, A.; Batool, R.; Atif, R.M.; Ijaz, U.; Nieves-Cordones, M.; et al. Genome-wide identification and expression analysis of two component system genes in Cicer arietinum. Genomics 2020, 112, 1371–1383. [Google Scholar] [CrossRef]
  82. Li, Z.; Gao, Z.; Li, R.; Xu, Y.; Kong, Y.; Zhou, G.; Meng, C.; Hu, R. Genome-wide identification and expression profiling of HD-ZIP gene family in Medicago truncatula. Genomics 2020, 112, 3624–3635. [Google Scholar] [CrossRef] [PubMed]
  83. Piégu, B.; Arensburger, P.; Beauclair, L.; Chabault, M.; Raynaud, E.; Coustham, V.; Brard, S.; Guizard, S.; Burlot, T.; Le Bihan-Duval, E.; et al. Variations in genome size between wild and domesticated lineages of fowls belonging to the Gallus gallus species. Genomics 2020, 112, 1660–1673. [Google Scholar] [CrossRef]
  84. Song, X.; Li, E.; Song, H.; Du, G.; Li, S.; Zhu, H.; Chen, G.; Zhao, C.; Qiao, L.; Wang, J.; et al. Genome-wide identification and characterization of nonspecific lipid transfer protein (nsLTP) genes in Arachis duranensis. Genomics 2020, 112, 4332–4341. [Google Scholar] [CrossRef]
  85. Faraji, S.; Filiz, E.; Kazemitabar, S.K.; Vannozzi, A.; Palumbo, F.; Barcaccia, G.; Heidari, P. The AP2/ERF Gene Family in Triticum durum: Genome-Wide Identification and Expression Analysis under Drought and Salinity Stresses. Genes 2020, 11, 1464. [Google Scholar] [CrossRef]
  86. Ahmadizadeh, M.; Chen, J.-T.; Hasanzadeh, S.; Ahmar, S.; Heidari, P. Insights into the genes involved in the ethylene biosynthesis pathway in Arabidopsis thaliana and Oryza sativa. J. Genet. Eng. Biotechnol. 2020, 18, 1–20. [Google Scholar] [CrossRef] [PubMed]
  87. De Wever, J.; Tulkens, D.; Verwaeren, J.; Everaert, H.; Rottiers, H.; Dewettinck, K.; Lefever, S.; Messens, K. A combined RNA preservation and extraction protocol for gene expression studies in cacao beans. Front. Plant Sci. 2020, 11, 992. [Google Scholar] [CrossRef] [PubMed]
  88. De Wever, J.; De Coninck, T.; Everaert, H.; Afoakwa, E.O.; Coppieters, F.; Rottiers, H.; Opoku, S.Y.; Lowor, S.; Dewettinck, K.; Vandesompele, J. Selection and validation of reference genes for accurate RT-qPCR gene expression normalization in cacao beans during fermentation. Tree Genet. Genomes 2021, 17, 1–14. [Google Scholar] [CrossRef]
  89. Medina, V.; Laliberte, B. A Review of Research on the Effects of Drought and Temperature Stress and Increased CO2 on Theobroma cacao L., and the Role of Genetic Diversity to Address Climate Change; Bioversity: Turrialba, Costa Rica, 2017; ISBN 9789292550745. [Google Scholar]
  90. Adeniyi, D. Diversity of Cacao Pathogens and Impact on Yield and Global Production. In Theobroma Cacao—Deploying Science for Sustainability of Global Cocoa Economy; IntechOpen: London, UK, 2019. [Google Scholar] [CrossRef] [Green Version]
Figure 1. Location of tcGASA genes on the chromosome in Theobroma cacao. Each gene is shown with a gene identification number along with the number given to each gene in the current study. The pairs of segmentally duplicated genes are shown with same color.
Agronomy 11 01425 g001
Figure 2. Distribution of ligand-binding sites in predicted 3D structure of tcGASA proteins. The distribution of the major protein pocket sites in ligand regions are highlighted in the predicted 3D structure of tcGASA proteins.
Agronomy 11 01425 g002
Figure 3. Prediction of post translational modifications based on phosphorylation and glycosylation site of tcGASA proteins. The red circle indicates the predicted glycosylation sites, and one glycosylation site was predicted each in tcGASA10, tcGASA14, and tcGASA16.
Agronomy 11 01425 g003
Figure 4. The phylogenetic inference of tcGASA proteins along with protein sequences of six other species. Each sequence is presented with its gene number. The start of each sequence contained code for the species as: Tc: Theobroma cacao; AT: Arabidopsis thaliana; B456: Gossypium raimondii; VIT: Vitis vinifera; Os: Oryza sativa; BRADI: Brachypodium distachyon; Zm: Zea mays.
Agronomy 11 01425 g004
Figure 5. The phylogenetic analyses in comparison to introns–exons in genes and motifs in the protein sequence of tcGASAs. Phylogeny tree of tcGASAs (a), introns–exons distribution in tcGASA genes (b), and conserved motifs distribution in tcGASA proteins (c).
Agronomy 11 01425 g005
Figure 6. Synteny analysis of GASA genes. The syntenic blocks of cacao GASA genes are compared with six other species, including Arabidopsis thaliana (a), Gossypium raimondii (b), Vitis vinifera (c), Oryza sativa (d), Brachypodium distachyon (e), and Zea mays (f).
Agronomy 11 01425 g006
Figure 7. Distribution of cis-regulatory elements into promoter regions of tcGASA genes. Classification of identified regulatory elements based on function, such as light, hormone, growth, stress, and binding domain excluding the TATA box and CAAT box (a). Distribution of different types of hormone-related cis-regulatory elements (b). Distribution of cis-regulatory elements related to various types of environmental stresses (c).
Agronomy 11 01425 g007
Figure 8. Expression analyses of orthologous tcGASA genes in Arabidopsis. Expression profile in different types of tissues (a), and in response to various abiotic stresses (b).
Agronomy 11 01425 g008
Figure 9. Expression analyses of tcGASA genes in cacao plants under inoculation with P. megakarya after 0 h, 6 h, 24 h, and 72 h. Nanay (NA-32) susceptible cultivar (a), Scavina (SCA6) tolerant cultivar (b). The expression analysis is presented after log2 transformation. The strong appearance of the blue color is linked to downregulation of genes whereas the strong red color indicates upregulation of genes.
Agronomy 11 01425 g009
Figure 10. Venn diagram to represent differential expression in susceptible cultivar Nanay (32) and tolerant Cultivar (SCA6) of cacao under inoculation with P. megakarya after 0 h (a), 6 h (b), 24 h (c), 72 h (d). The downregulated genes are missing after 0 h (a) and up-regulated genes are missing after 24 h (c). Thus, the data are not shown.
Agronomy 11 01425 g010
Table 1. List of the identified GASA genes and their characteristics in Theobroma cacao.
Gene Locus IDGene IDLocationLength (Amino Acid)MW (kDa)PIInstability IndexGRAVYSubcellular
Localization
Tc01v2_t001590tcGASA011: 830,757–831,46610511.188.93Unstable−0.023Extracellular space
Tc01v2_t005890tcGASA021: 3,268,900–3,269,68710711.448.98Unstable−0.057Extracellular space
Tc02v2_t009150tcGASA032: 5,635,674–5,636,363909.909.01Stable−0.054Extracellular space
Tc02v2_t021110tcGASA042: 30,717,916–30,719,01310611.919.21Unstable−0.195Extracellular space
Tc04v2_t000240tcGASA054: 270,172–272,30432033.929.83Unstable−0.750Extracellular space
Tc04v2_t006890tcGASA064: 15,324,400–15,325,64810611.839.32Unstable−0.343Extracellular space
Tc04v2_t009440tcGASA074: 19,321,294–19,322,0379510.379.26Unstable−0.072Extracellular space
Tc04v2_t016520tcGASA084: 26,297,870–26,298,74312313.428.27Unstable−0.026Plasma membrane
Tc04v2_t016530tcGASA094: 26,301,782–26,302,6479510.628.88Unstable−0.251Extracellular space
Tc05v2_t012230tcGASA105: 25,218,365–25,220,14111412.769.46Unstable0.327Extracellular space
Tc08v2_t003650tcGASA118: 1,941,175–1,942,03610210.926.67Stable−0.031Extracellular space
Tc08v2_t003660tcGASA128: 1,943,144–1,944,20110010.578.66Unstable0.004Extracellular space
Tc08v2_t007890tcGASA138: 4,555,655–4,556,418889.649.32Stable−0.062Extracellular space
Tc08v2_t014670tcGASA148: 15,650,553–15,651,43810210.988.72Unstable−0.164Extracellular space
Tc08v2_t014680tcGASA158: 15,651,664–15,652,8929210.018.90Stable−0.148Extracellular space
Tc08v2_t014690tcGASA168: 15,653,408–15,654,37811012.139.64Unstable−0.263Extracellular space
Tc09v2_t020100tcGASA179: 30,243,952–30,245,43211212.329.46Unstable−0.252Extracellular space
Table 2. Gene duplications, synonymous and non-synonymous substitutions and time of divergence.
Gene 1Gene 2Duplication TypeKaKsKa/Ksp-ValueDivergence Time (MYA)
tcGASA02tcGASA03Segmental0.26792.66070.10071.04 × 10−6204.67
tcGASA02tcGASA13Segmental0.17082.24950.07592.52 × 10−8173.04
tcGASA08tcGASA09Segmental0.15150.65140.23251.30 × 10−650.11
tcGASA10tcGASA17Segmental0.2831.02830.27523.28 × 10−579.1
tcGASA14tcGASA15Segmental0.32340.79710.40581.46 × 10−861.32
Publisher’s Note: MDPI stays neutral with regard to jurisdictional claims in published maps and institutional affiliations.

