Article

Changes in Soil Organic Carbon and Its Labile Fractions after Land Conversion from Paddy Fields to Woodlands or Corn Fields

1
Institute of Environment and Resource & Soil Fertilizer, Zhejiang Academy of Agricultural Sciences, Hangzhou 310021, China
2
Department of Resources and Environment Science, College of Environmental Science and Engineering, Yangzhou University, Yangzhou 225127, China
3
State Key Laboratory of Eco-Hydraulics in Northwest Arid Region of China, Xi’an University of Technology, Xi’an 710048, China
*
Author to whom correspondence should be addressed.
Submission received: 2 November 2021 / Revised: 11 December 2021 / Accepted: 20 December 2021 / Published: 24 December 2021
(This article belongs to the Special Issue Applied Research and Extension in Agronomic Soil Fertility)

Abstract

:
Land use change could significantly affect soil organic carbon (SOC) and other soil chemical properties. However, the responses of soil labile C fractions at different soil depths to land-use change are not still clear. The aim of this study was to investigate the effect of paddy field conversion on woodlands or corn fields on total soil organic C (TOC) and its labile C fractions including particulate organic C (POC), microbial biomass C (MBC), and potassium permanganate-oxidizable C (KMnO4–C) along a 0–100 cm soil profile. Our results indicate that soil TOC concentrations increased by 3.88 g kg−1 and 3.47 g kg−1 in the 0–5 cm soil layer and 5.33 g kg−1 and 4.68 g kg−1 in the 5–20 cm soil layer during 13 years after the conversion from paddy fields to woodlands and corn fields, respectively. In the 20–40 cm soil layer, the woodlands had the highest TOC concentration (12.3 g kg−1), which was 5.13 g kg−1 and 3.5 g kg−1 higher than that of the paddy and corn fields, respectively. The increase in TOC was probably due to the absence of soil disturbance and greater root residue input into the woodland soil. In corn fields, pig manure addition contributed to the increase in soil organic C concentrations. In addition, the proportion of soil KMnO4–C increased after conversion from paddy fields to woodlands or corn fields in the 0–40 cm soil layer, ranging from 39.9–56.6% for the woodlands and 24.6–32.9% for the corn fields. The soil POC content was significantly higher in woodland and corn field soils than in paddy field soils at lower soil depths (5–40 cm). However, there were no differences in MBC contents in the whole soil profile between the woodlands and paddy fields. The KMnO4–C and MBC was the most important factor affecting the CMI values through the whole 0–100 cm soil profile. Overall, converting paddy fields to woodlands or corn fields increased the TOC and labile C fractions in the 0–40 cm soil layer. Future studies should focus on the response of the deeper soil C pool to land-use change.

1. Introduction

Rice (Oryza sativa L.) is one of the most important food crops in the world. It is cultivated in areas covering 31 million ha in China [1]. The hot and humid subtropical climate in the Zhejiang province of southern China provides suitable growing conditions for rice, making the region a traditional rice cultivation area. However, the area used for rice cultivation in the Zhejiang province has gradually declined over the past two decades [2]. This is attributed to the development of urbanization and large numbers of farmers choosing to work in cities instead of working in rural areas. Therefore, because of labor shortages [3], an increasing number of farmers chose to switch from rice cultivation to the cultivation of trees or other crops such as corn (Zea mays L.). Land-use conversion is accompanied by changes in management practices (e.g., tillage or fertilization) that will directly affect the soil quality [4,5].
Soil organic carbon (SOC) is a key indicator of soil quality because it is related to many physical, chemical, and biological indicators of soil [6,7]. The soil organic C pool is the largest C pool in terrestrial ecosystems, and soil stores twice as much C as the atmosphere [8]. Therefore, land-use change might affect the soil C pool [9,10], and subsequently affect global climate change through greenhouse gas emissions. Many previous studies have focused on changes in the SOC after the conversion of grasslands or forests into croplands. For example, Don et al. (2011) [11] used a meta-analysis to evaluate the changes in SOC stocks with land-use change and found that conversion forests into croplands reduced SOC stocks by 25%. By contrast, the conversion of croplands into forestlands might increase the SOC stock because of a reduction in soil disturbance. However, most previous studies on this topic focused on the Loess Plateau [12] and little attention has been paid to paddy fields in southern China.
Soil organic C is composed of a series of fractions varying with regards to recalcitrance and turnover times [13]. Owing to the large background of relatively stable C in soil, it is not easy to measure changes in soil total organic C (TOC) in the short term. Soil labile organic C, which is characterized by rapid turnover times and responds quickly, could be regarded as an early indicator of changes in SOC [14,15]. It generally includes particulate organic C (POC), microbial biomass C (MBC), and potassium permanganate-oxidizable C (KMnO4–C) [16]. Furthermore, the carbon management index (CMI) proposed by Blair et al. (1995) [14] is a useful tool for assessing soil quality responses to land-use change. Previous studies have reported the effect of land-use change on the SOC in aggregate fractions in topsoil. However, the effect of land-use change on the SOC is not restricted to the topsoil. It is necessary to evaluate the SOC and its labile fractions in subsoil because subsoil contains more than half of the total SOC globally [17,18]. In addition, the responses of soil labile carbon fractions in the subsoil to land-use change are still unclear.
Therefore, our aim was to assess the changes in TOC and its labile fractions including MBC, POC, and KMnO4–C along a 0–100 cm soil profile after the conversion of paddy fields to woodlands and corn fields. The CMI was used to evaluate the soil quality in different soil layers under different land-use types.

2. Materials and Methods

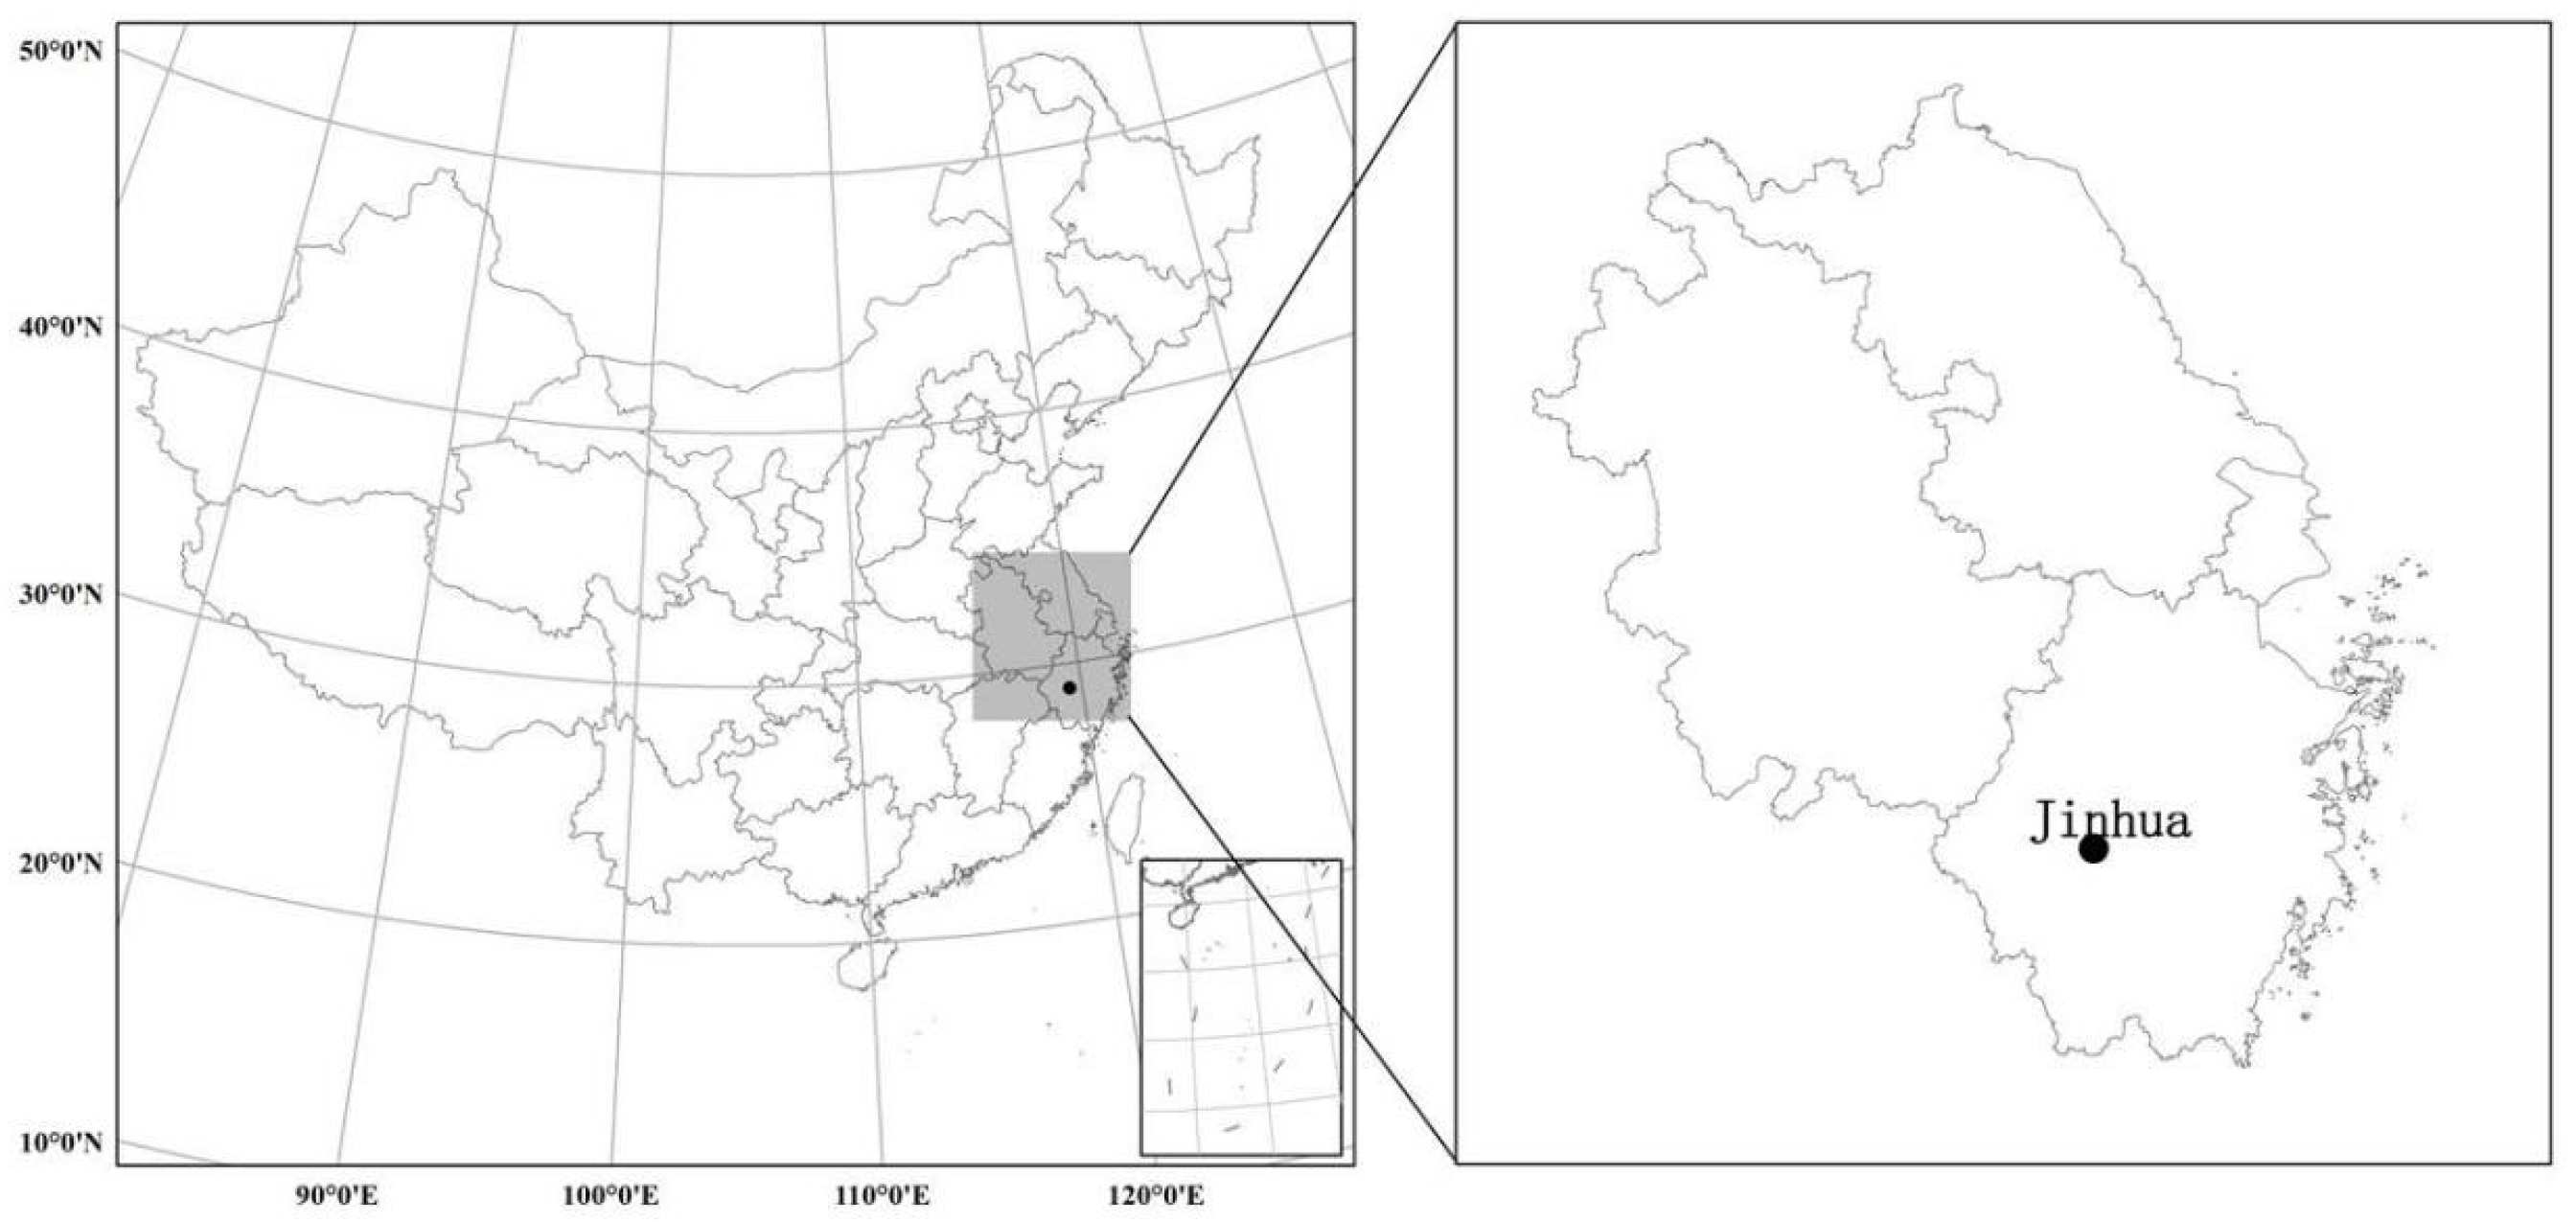
2.1. Experimental Site

The study site was located in the Jinqu basin, 15 km from Jinhua city (latitude 29°1′ N and longitude 119°28′ E), Zhejiang province, China (Figure 1). The prevailing climate of the study site is a subtropical monsoon climate, with an average annual precipitation of 1424 mm and an annual mean temperature of 17.5 °C. The soil in the sampling site is classified as Ultisols according to the US Soil Taxonomy. Paddy soils have been cultivated since the 1970s. With the development of the local economy, the agricultural land-use structure has changed dramatically in the last 15 years. The paddy fields were previously used for rice cultivation, but since 2005, they have been used to plant trees and other crops. The paddy fields, woodlands, and corn fields were located adjacent to each other. The sizes of the areas used as paddy fields, woodlands, and corn fields were approximately 1320 m2, 270 m2, and 225 m2, respectively. In December 2017, surface soils were collected from 15 points at a depth of 0–20 cm from paddy fields, woodlands, and corn fields. The soils of the paddy fields, woodlands, and corn fields contained 23.3, 30.4, and 27.4 g kg−1 of organic matter; 1.58, 1.52, and 1.86 g kg−1 of total nitrogen; 23.8, 40.4, and 36.3 mg kg−1 of available P, 50, 95.7, and 67.4 mg kg−1 of available K, and had pH of 5.0, 5.21, and 5.3, respectively. In the rice paddy system, a double rice cropping system was adopted. Paddy soil was plowed to a depth of 15–20 cm once a year in April. In the corn system, 4500 kg ha−1 fresh pig manure (270 kg C ha−1 and 18 kg N ha−1) was applied to the surface soil every year. Rice and maize straw were both removed at harvest.

2.2. Soil Sampling and Analysis

Before sampling, we divided the paddy fields, woodlands, and corn fields into three subplots. In each subplot, soil samples were taken from five points with an auger (5 cm diameter) at several soil depths (0–5 cm, 5–20 cm, 20–40 cm, 40–60 cm, 60–80 cm, and 80–100 cm) in January 2018. The five soil samples from each depth from each plot were combined to form a composite soil sample. One portion was stored in a refrigerator at 4 °C for subsequent MBC analysis. The other portion was air-dried for TOC, POC, KMnO4–C, and total nitrogen (TN) analyses.
MBC was determined by the chloroform fumigation method [19]. Total SOC was determined using the potassium dichromate oxidation method [20]. Soil TN was measured using the Kjeldahl method. POC was determined using the method described by Cambardella and Elliott (1992) [21]. Air-dried soil (20 g) was mixed with 100 mL of 5 g L−1 sodium hexametaphosphate. Then, the mixed soil solution was shaken for 18 h at 100 revolution per minute (r.p.m.) and passed through a 0.053 mm sieve with distilled water rinses. The materials left on the sieve were oven-dried at 60 °C for 48 h, weighed, and ground for C analysis. The proportion of KMnO4–C was determined following the procedure of Blair et al. (1995) [14]. Soil samples (equivalent to 15 mg of SOC) were oxidized with 25 mL of 333 mM KMnO4 by shaking for 1 h. The tubes were then centrifuged at 3500 r.p.m. for 5 min. The supernatants were diluted 1:500 and their absorbances were measured at a wavelength of 565 nm using a spectrophotometer. The change in the KMnO4 concentration was used to estimate the amount of C oxidized in the soil sample.
The CMI was calculated following the method described in a study by Blair et al. (1995) [14].
First, the C pool index (CPI) was determined as follows:
CPI = t o t a l   o r g a n i c   C   c o n t e n t   i n   t h e   s a m p l e   ( g / k g ) t o t a l   o r g a n i c   C   c o n t e n t   i n   t h e   r e f e r e n c e   s a m p l e   ( g / k g )
In this study, the reference sample was paddy soil.
Second, a lability index (LI) was determined as follows:
LI = l a b i l i t y   o f   C   i n   t h e   s a m p l e l a b i l i t y   o f   C   i n   t h e   r e f e r e n c e   s a m p l e
The lability of C (L) was calculated as follows:
L = K M n O 4 C   c o n t e n t t o t a l   o r g a n i c   C K M n O 4 C   c o n t e n t
Lastly, the CMI was calculated as follows:
CMI= CPI × LI × 100

2.3. Statistical Analysis

All statistical analyses were carried out using the Statistica 5.5 program. The data were analyzed using a mixed-effect analysis of variance (ANOVA) with fixed factors (depth and soil types) and random factors (block). At each depth, a one-way ANOVA was used to assess the effect of different soil types on the TOC and its labile fractions. When the ANOVA results were significant, differences were compared using the Duncan multiple range test at a 5% level of significance.

3. Results

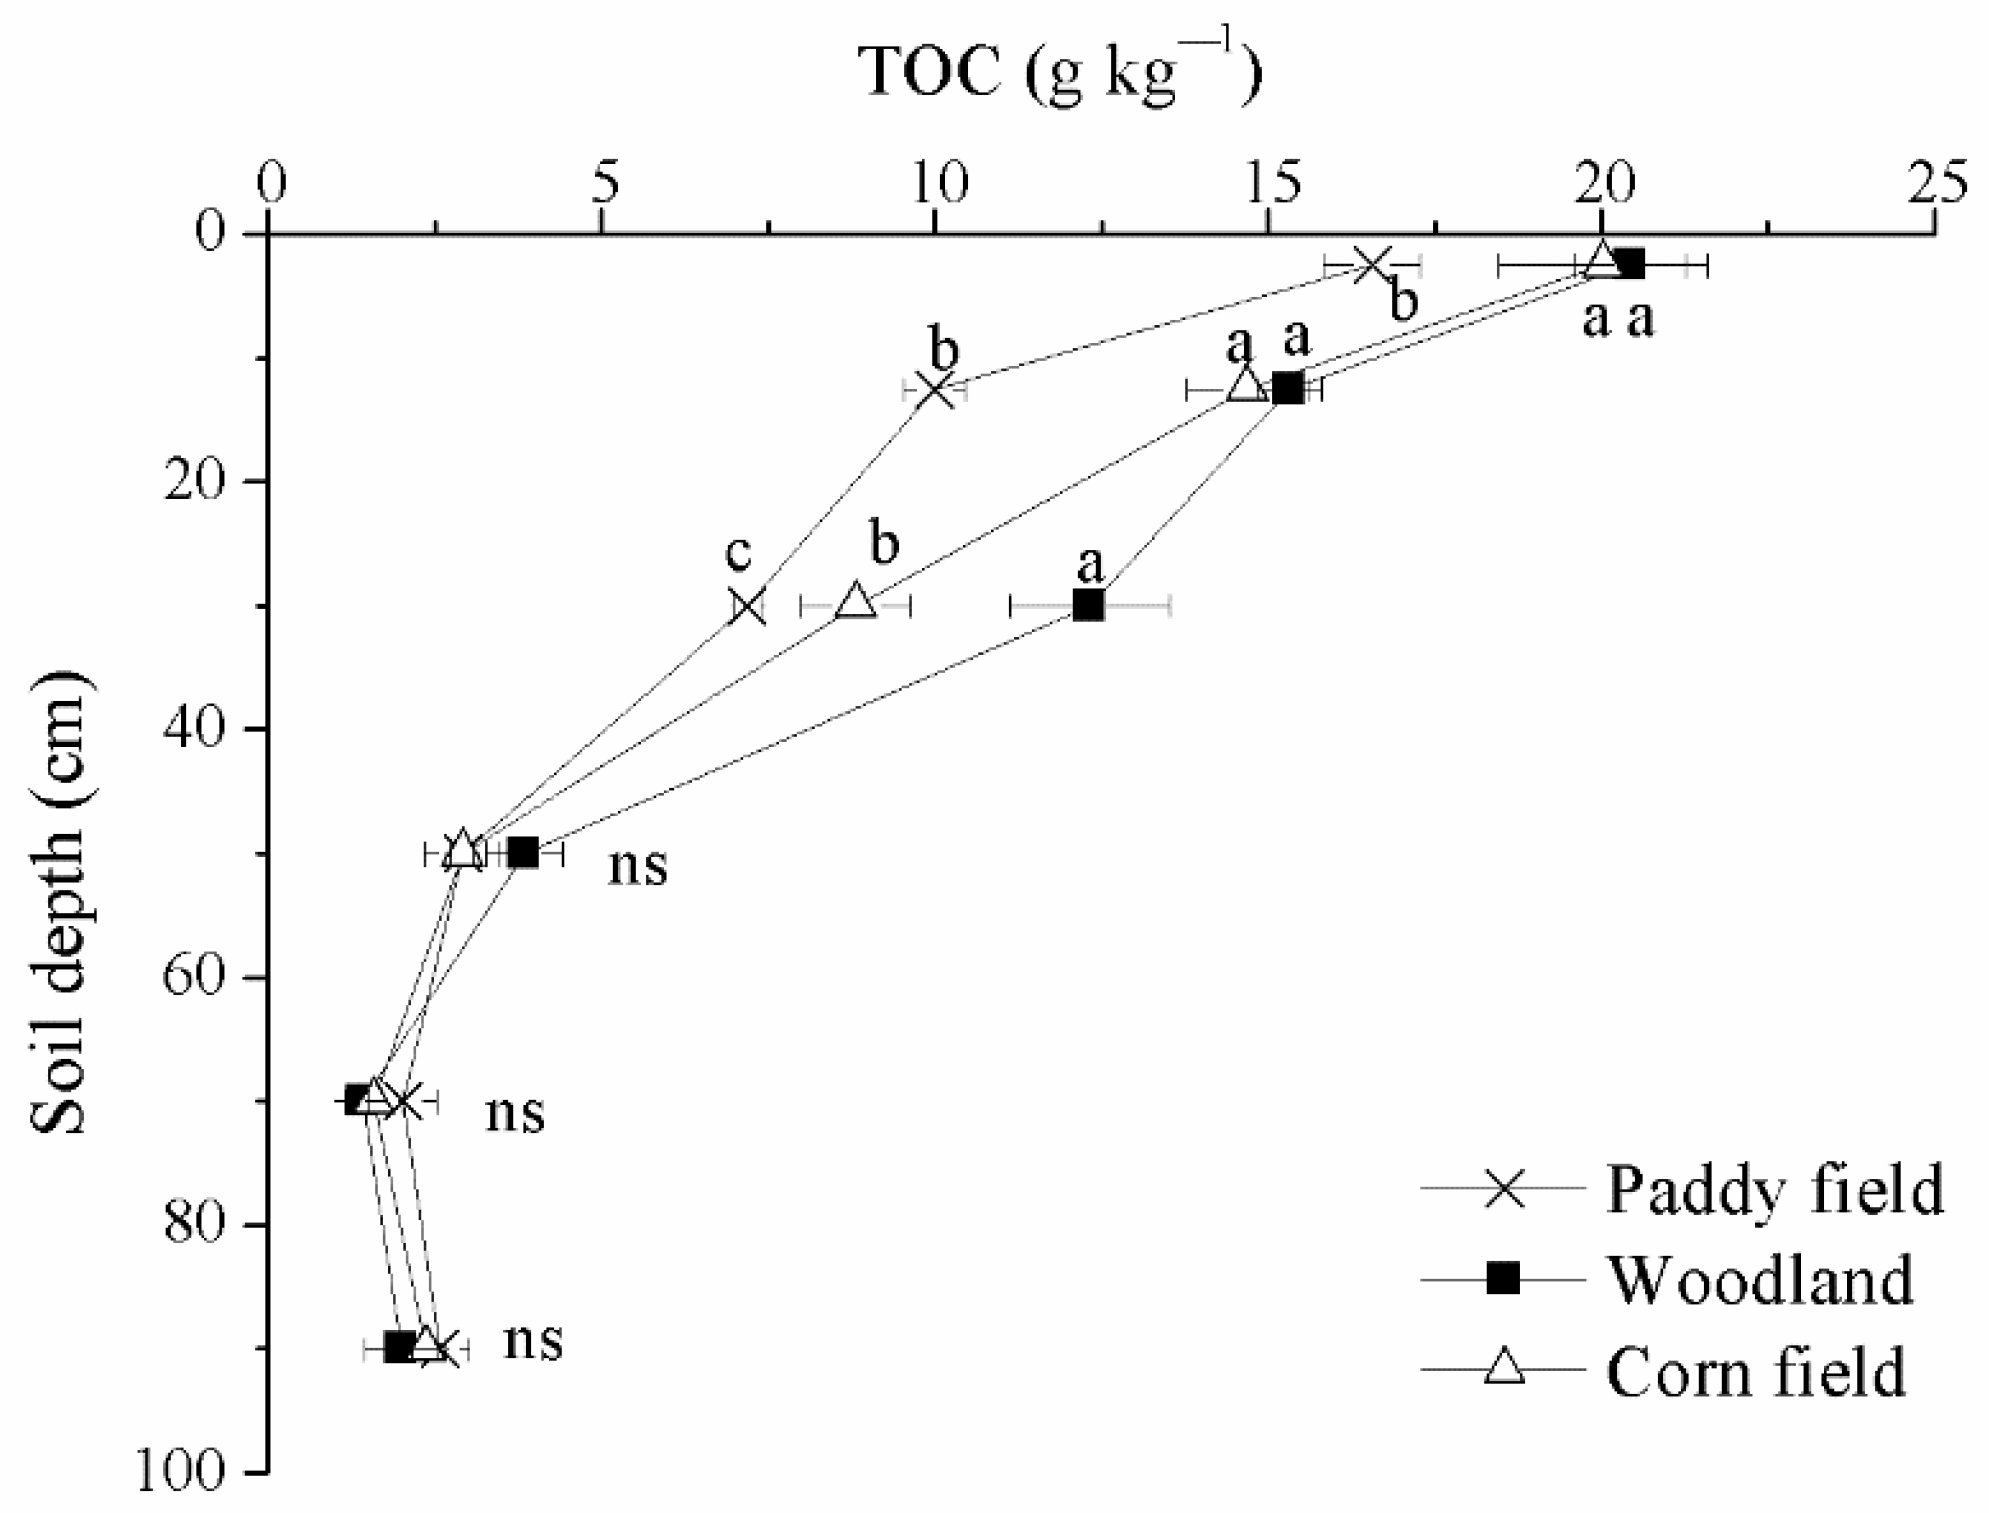
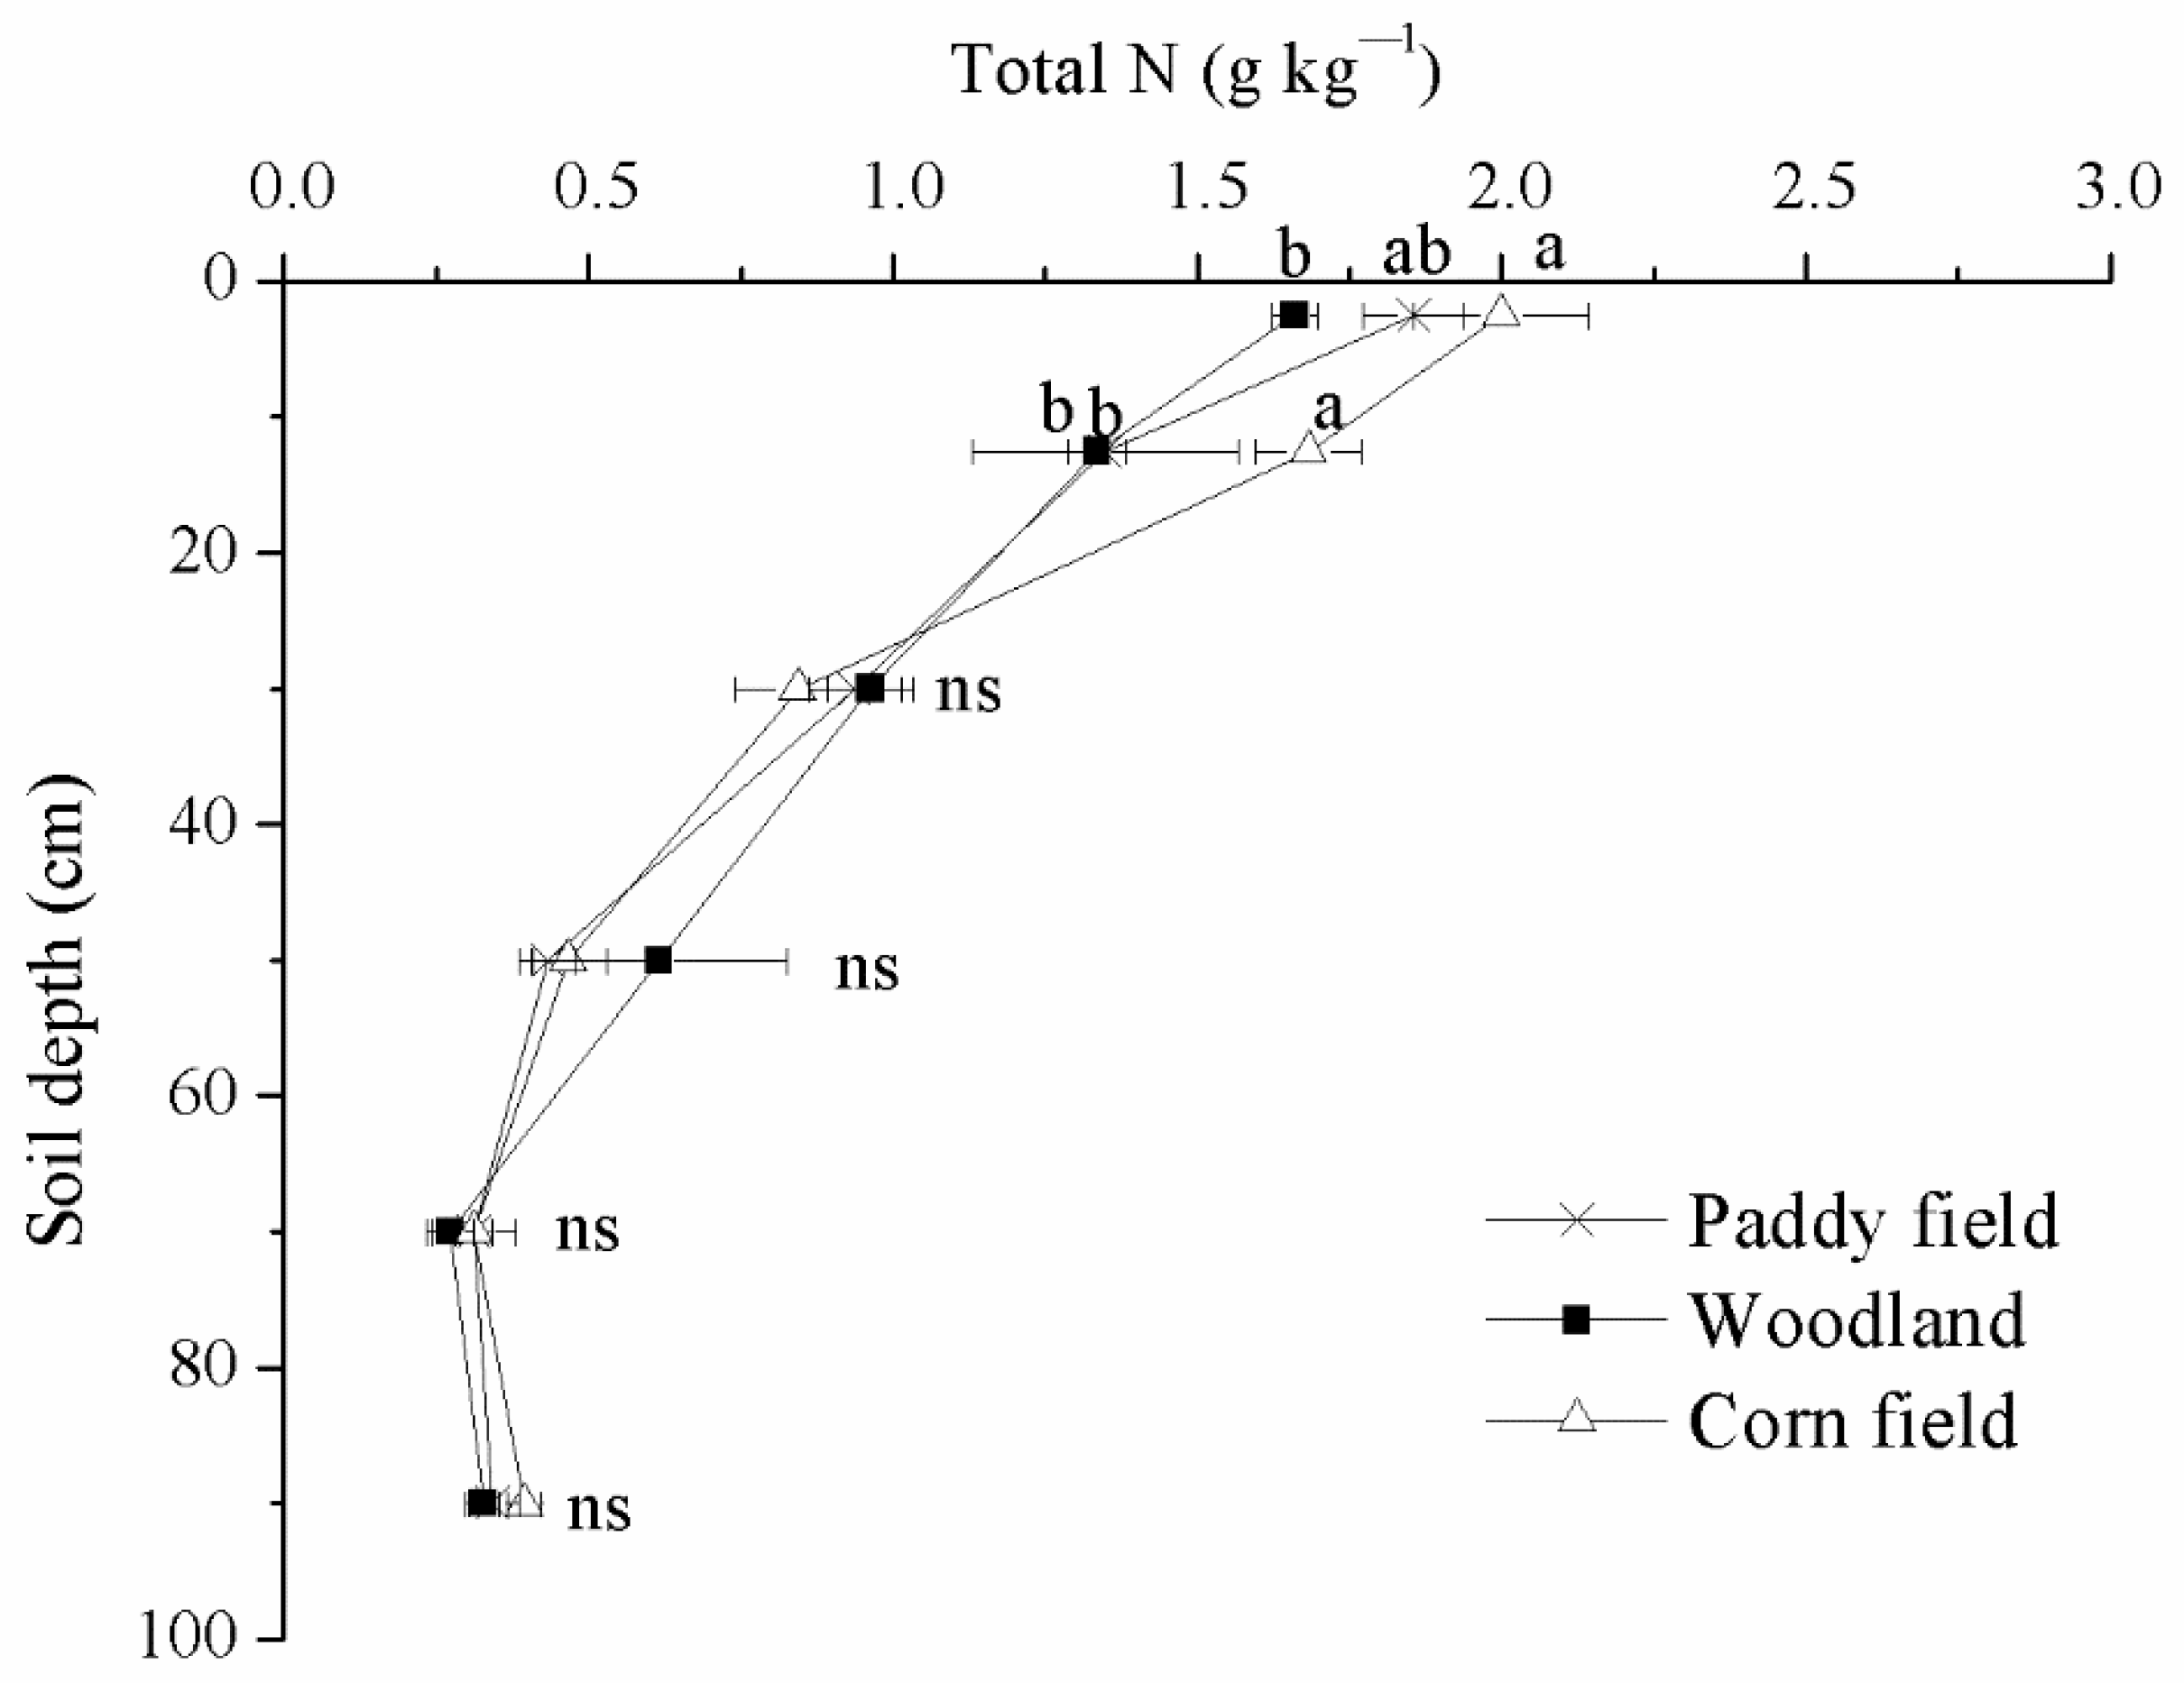
3.1. Soil TOC and TN Levels

Soil TOC concentrations in the 0–20 cm layer increased significantly after the conversion of paddy fields to woodlands or corn fields (Figure 2). Specifically, soil TOC concentrations increased by 3.88 g kg−1 and 3.47 g kg−1 in the 0–5 cm layer and 5.33 g kg−1 and 4.68 g kg−1 in the 5–20 cm layer 13 years after conversion from paddy fields to woodlands and corn fields, respectively (Figure 2). In the 20–40 cm layer, the woodland soil had the greatest TOC concentrations (12.3 g kg−1), which were 5.13 g kg−1 and 3.5 g kg−1 higher than the TOC concentrations in the paddy and corn field soils, respectively. This is possibly attributed to more root residue input and labile carbon leaching. No significant differences in TOC concentrations were observed in the 40–100 cm soil layers among the three land-use systems.
Soil TN concentrations in the 0–5 cm and 5–20 cm soil layers were the highest in the corn fields, where the TN concentrations increased by 0.14 g kg−1 in the 0–5 cm layer of the paddy fields, and by 0.33 g kg−1 in the 5–20 cm layer of the paddy field (Figure 3). However, no significant differences in soil TN concentrations were observed among the three land-use types in the 20–100 cm soil layers.

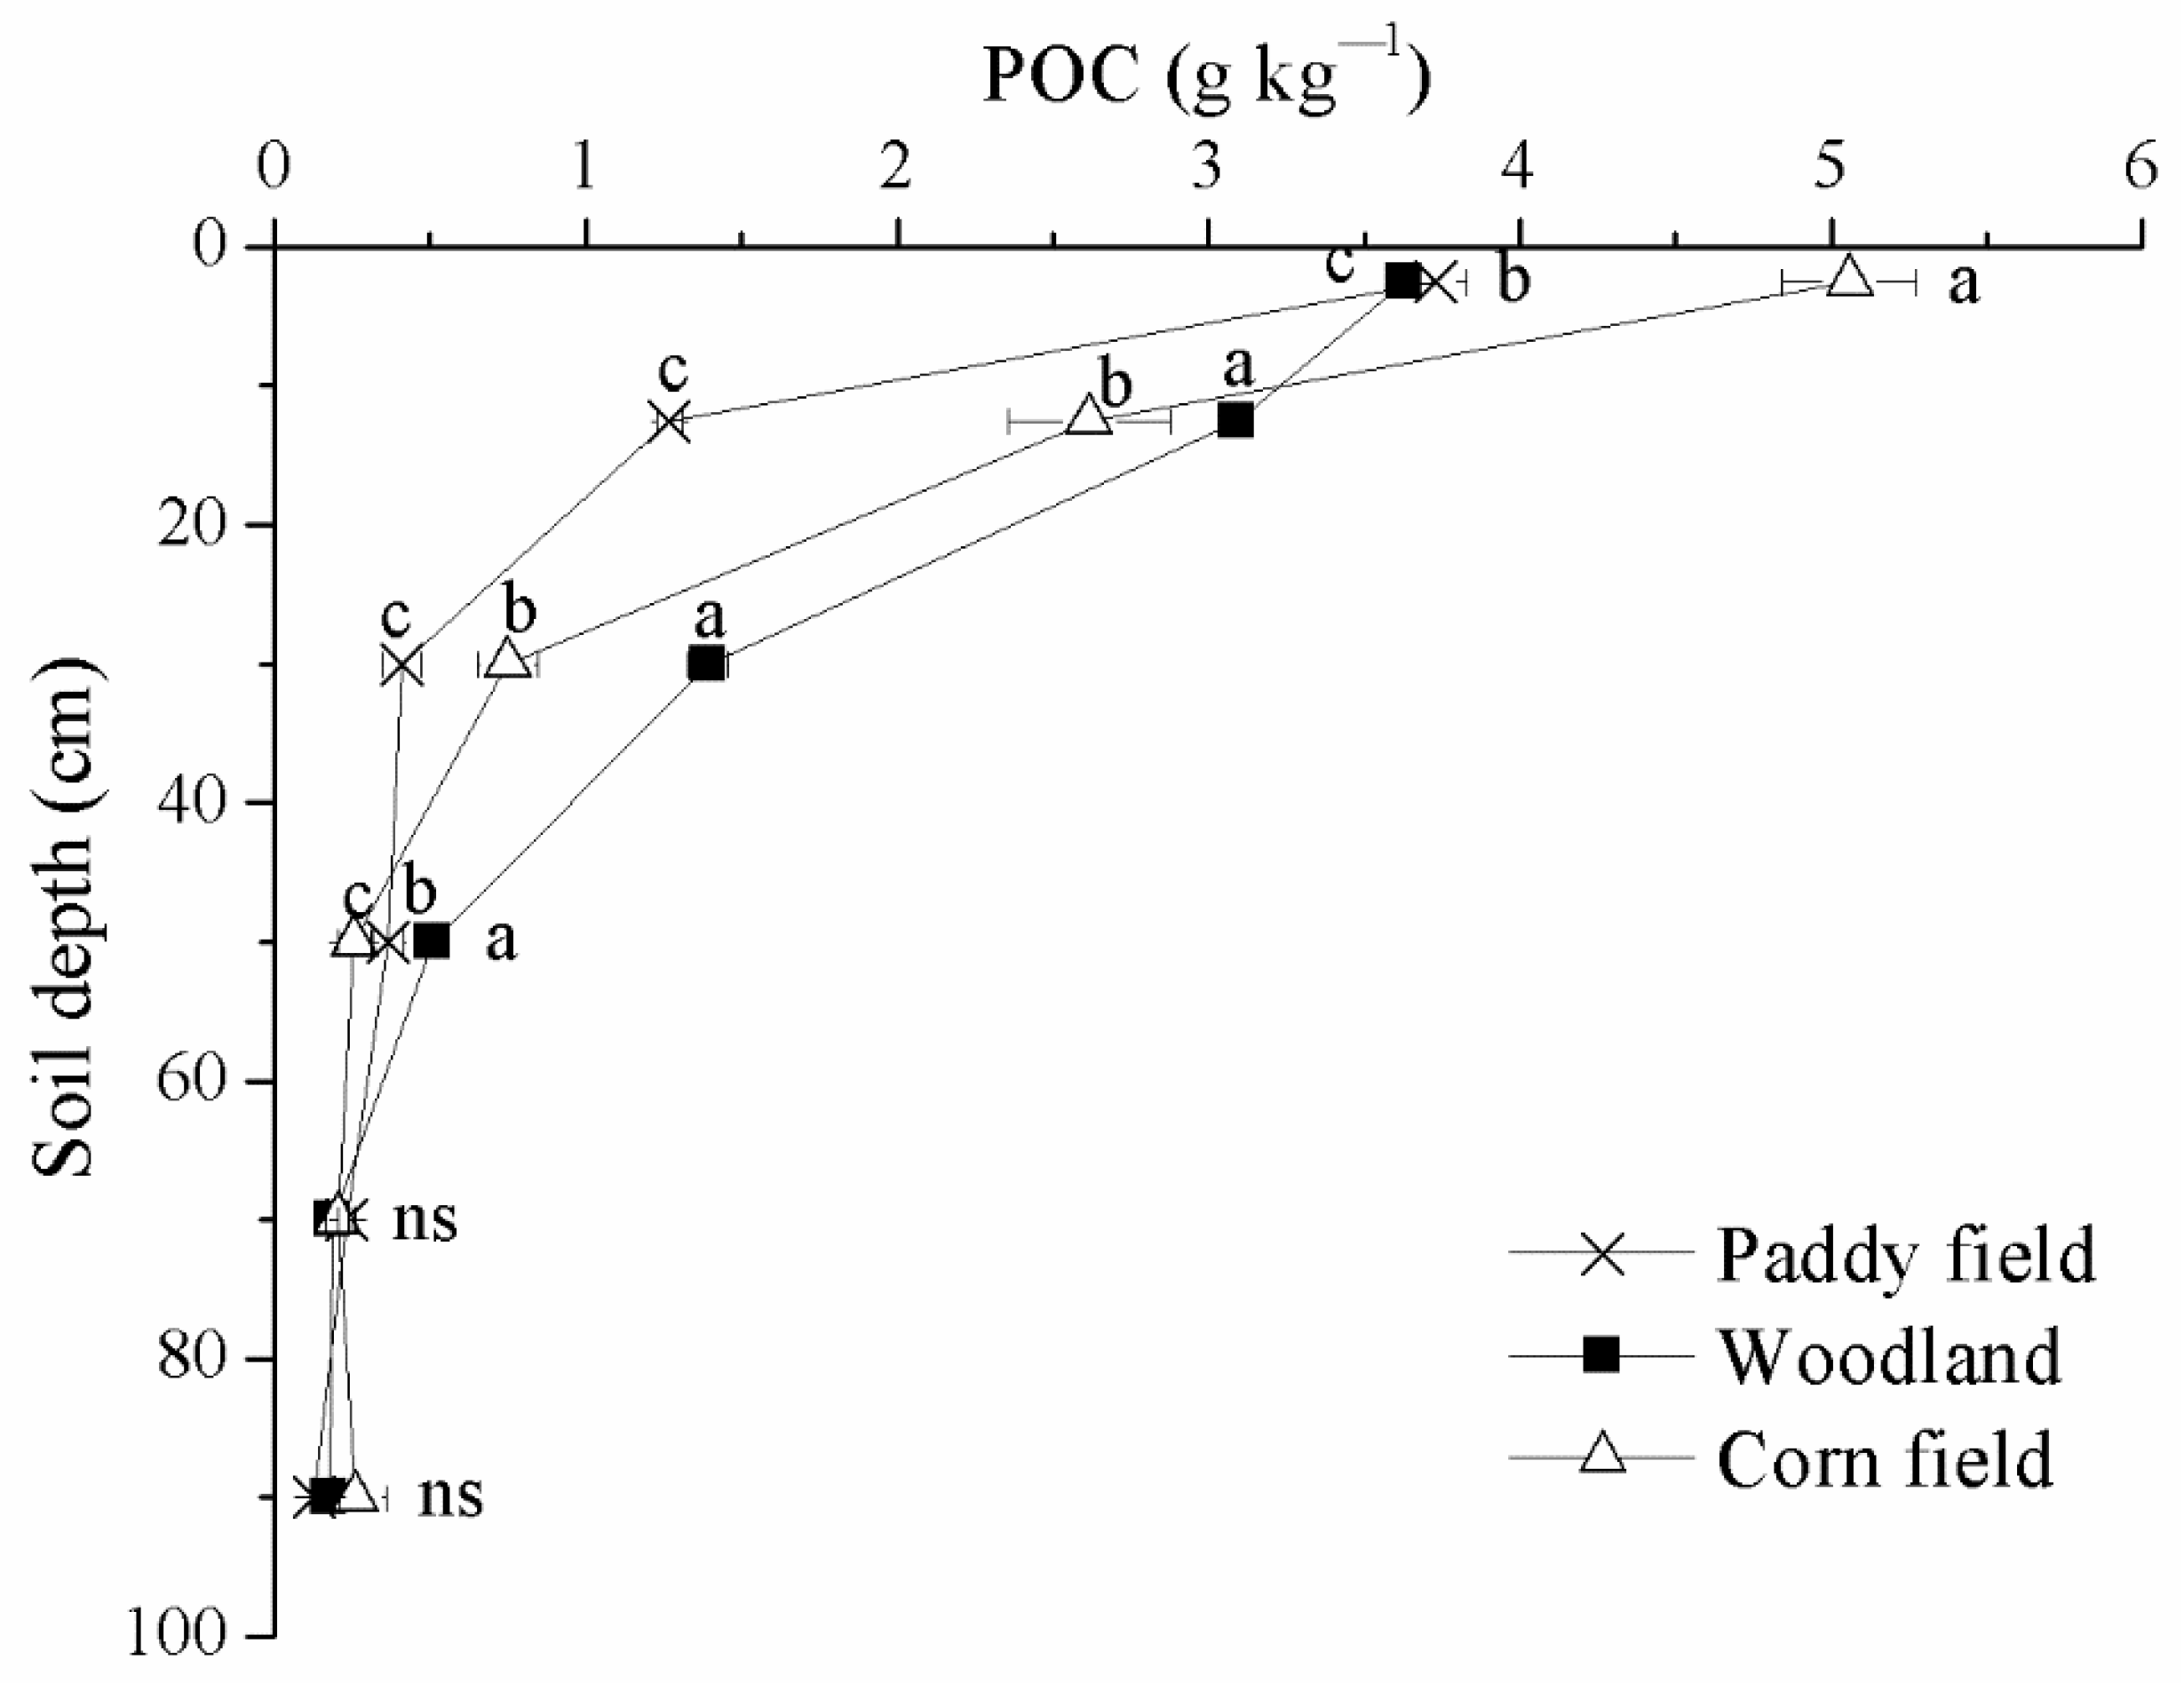
3.2. Soil POC Levels

Soil POC concentrations were significantly higher in the corn fields than in the 0–40 cm layer of the paddy fields (Figure 4). Specifically, the POC contents in the corn field soils were higher by 1.33 g kg−1, 1.35 g kg−1, and 0.34 g kg−1 than those in the paddy field soils in the 0–5 cm, 5–20 cm, and 20–40 cm layers, respectively (Figure 4). This was mainly because corn fields received a large amount of external organic manure every year, thereby increasing the POC content. Similarly, POC contents in the 5–40 cm layer increased after the conversion of the paddy fields to woodlands.

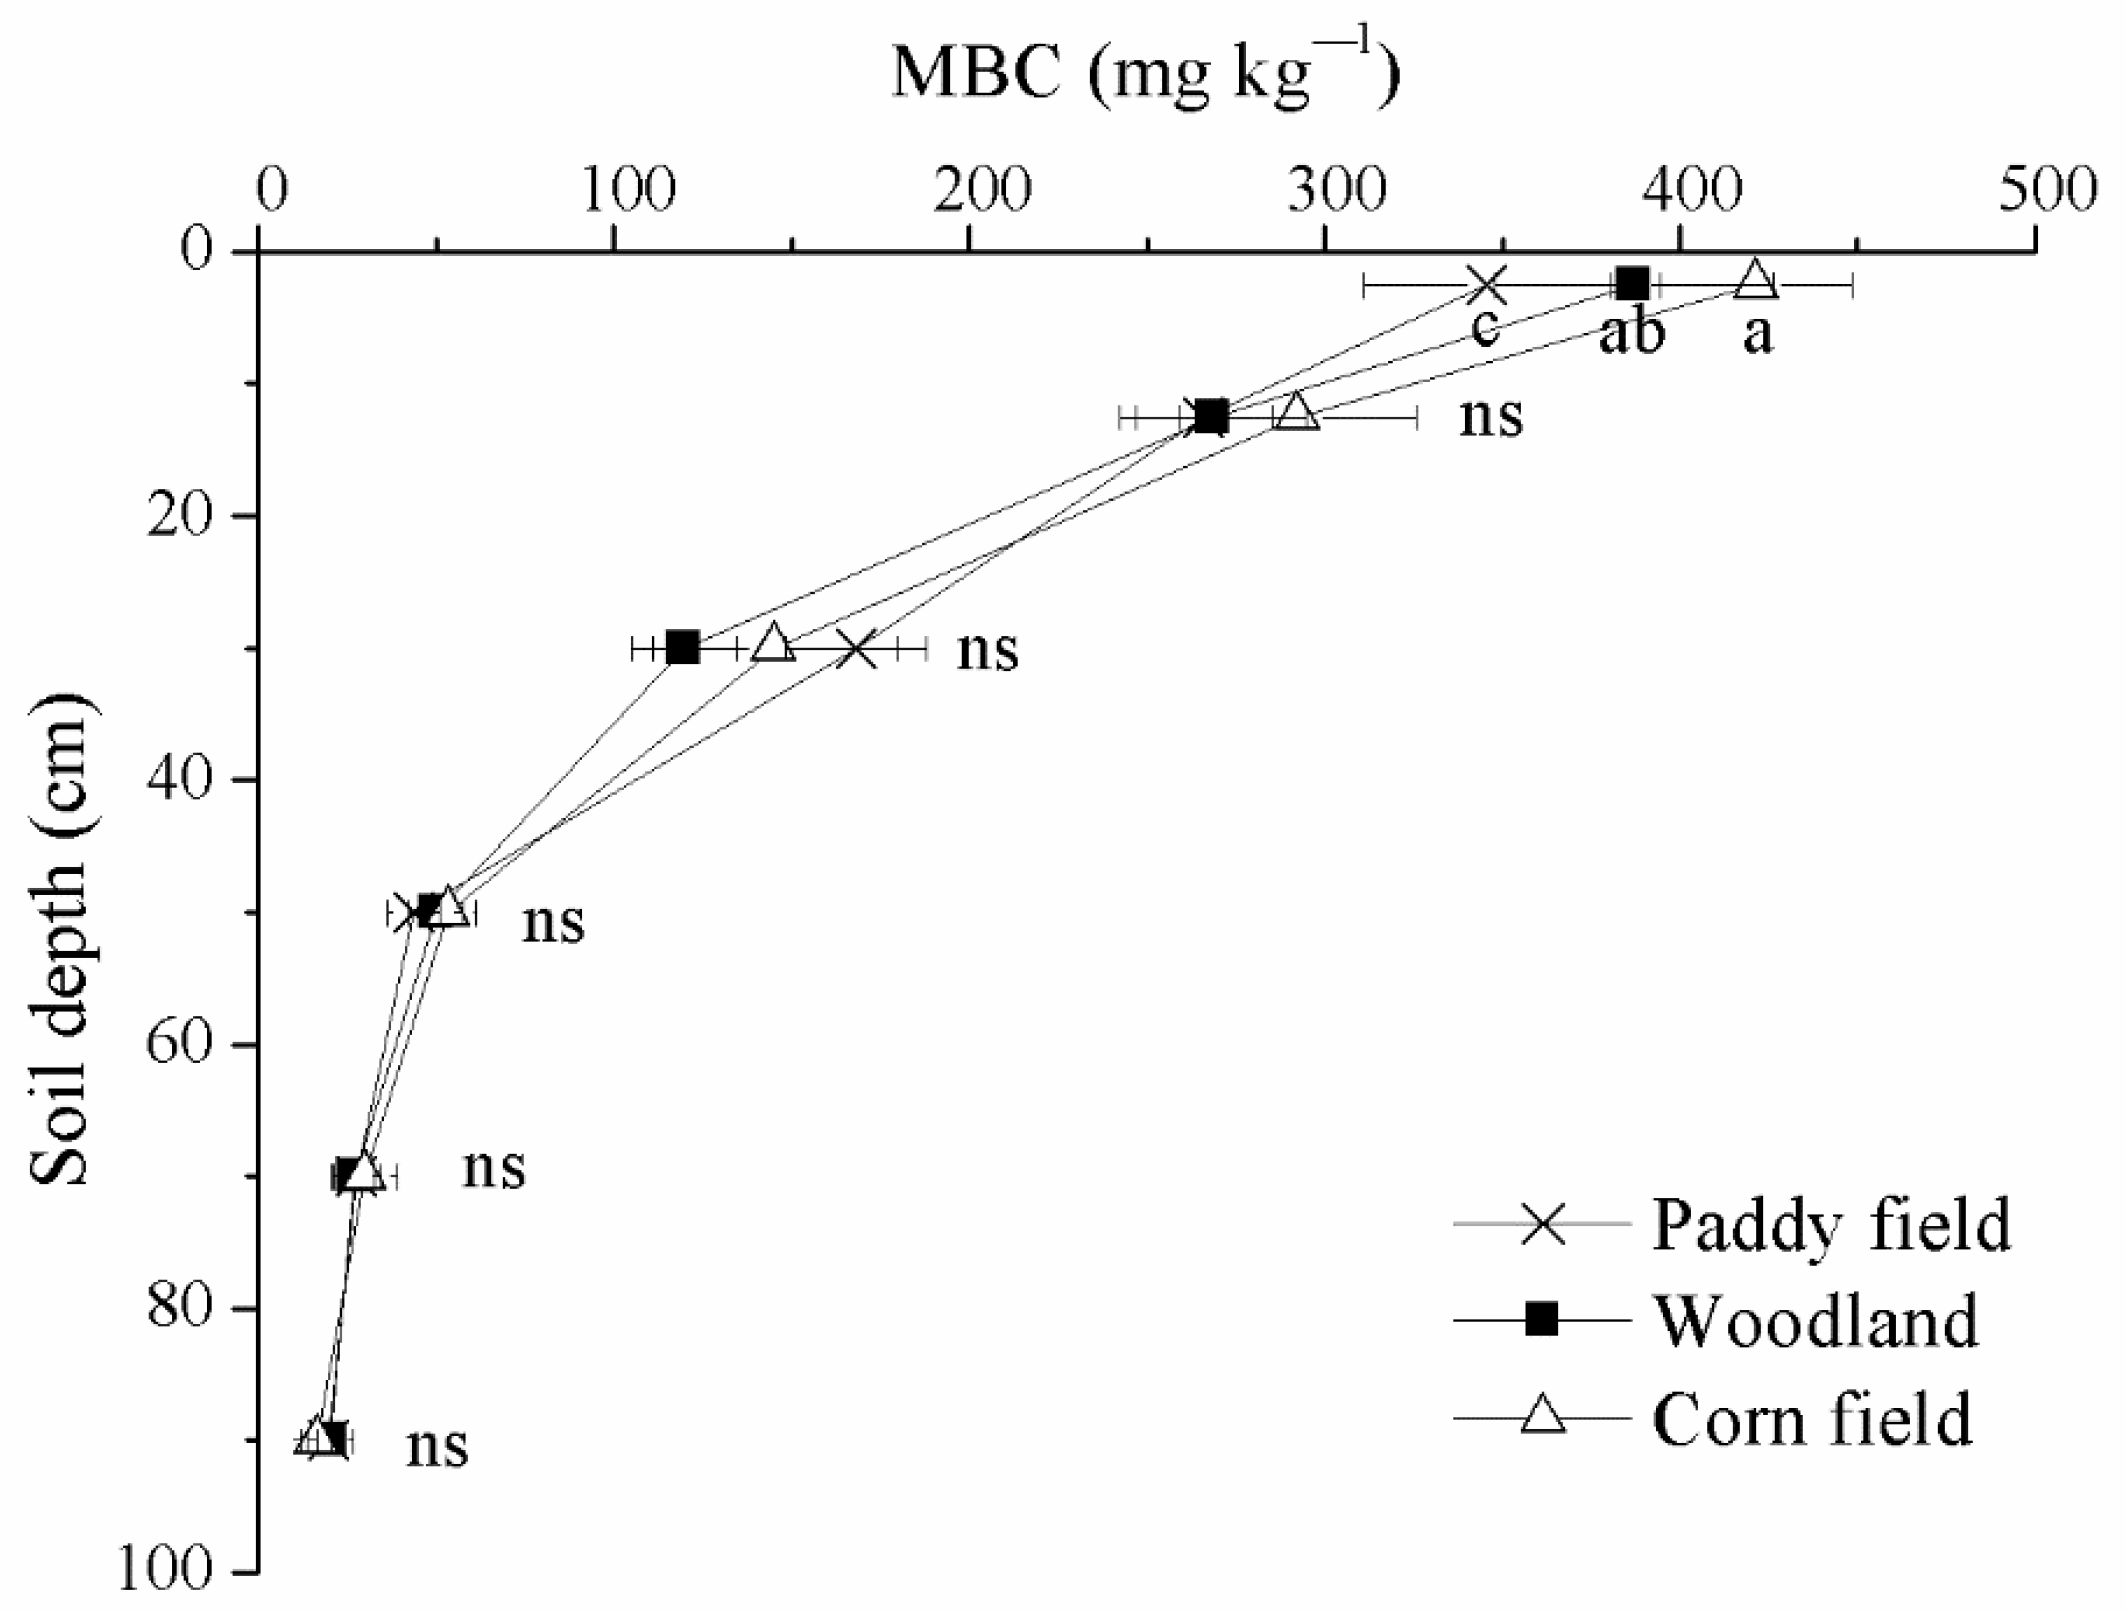
3.3. Soil MBC Levels

Soil MBC concentrations decreased sharply with increasing soil depth for the three different land-use soils (Figure 5). Significant differences in soil MBC levels were only observed in the surface soil layer (0–5 cm). Corn field soils had the highest MBC concentration (421 mg kg−1), followed by that of the woodland and paddy field soils (Figure 5).

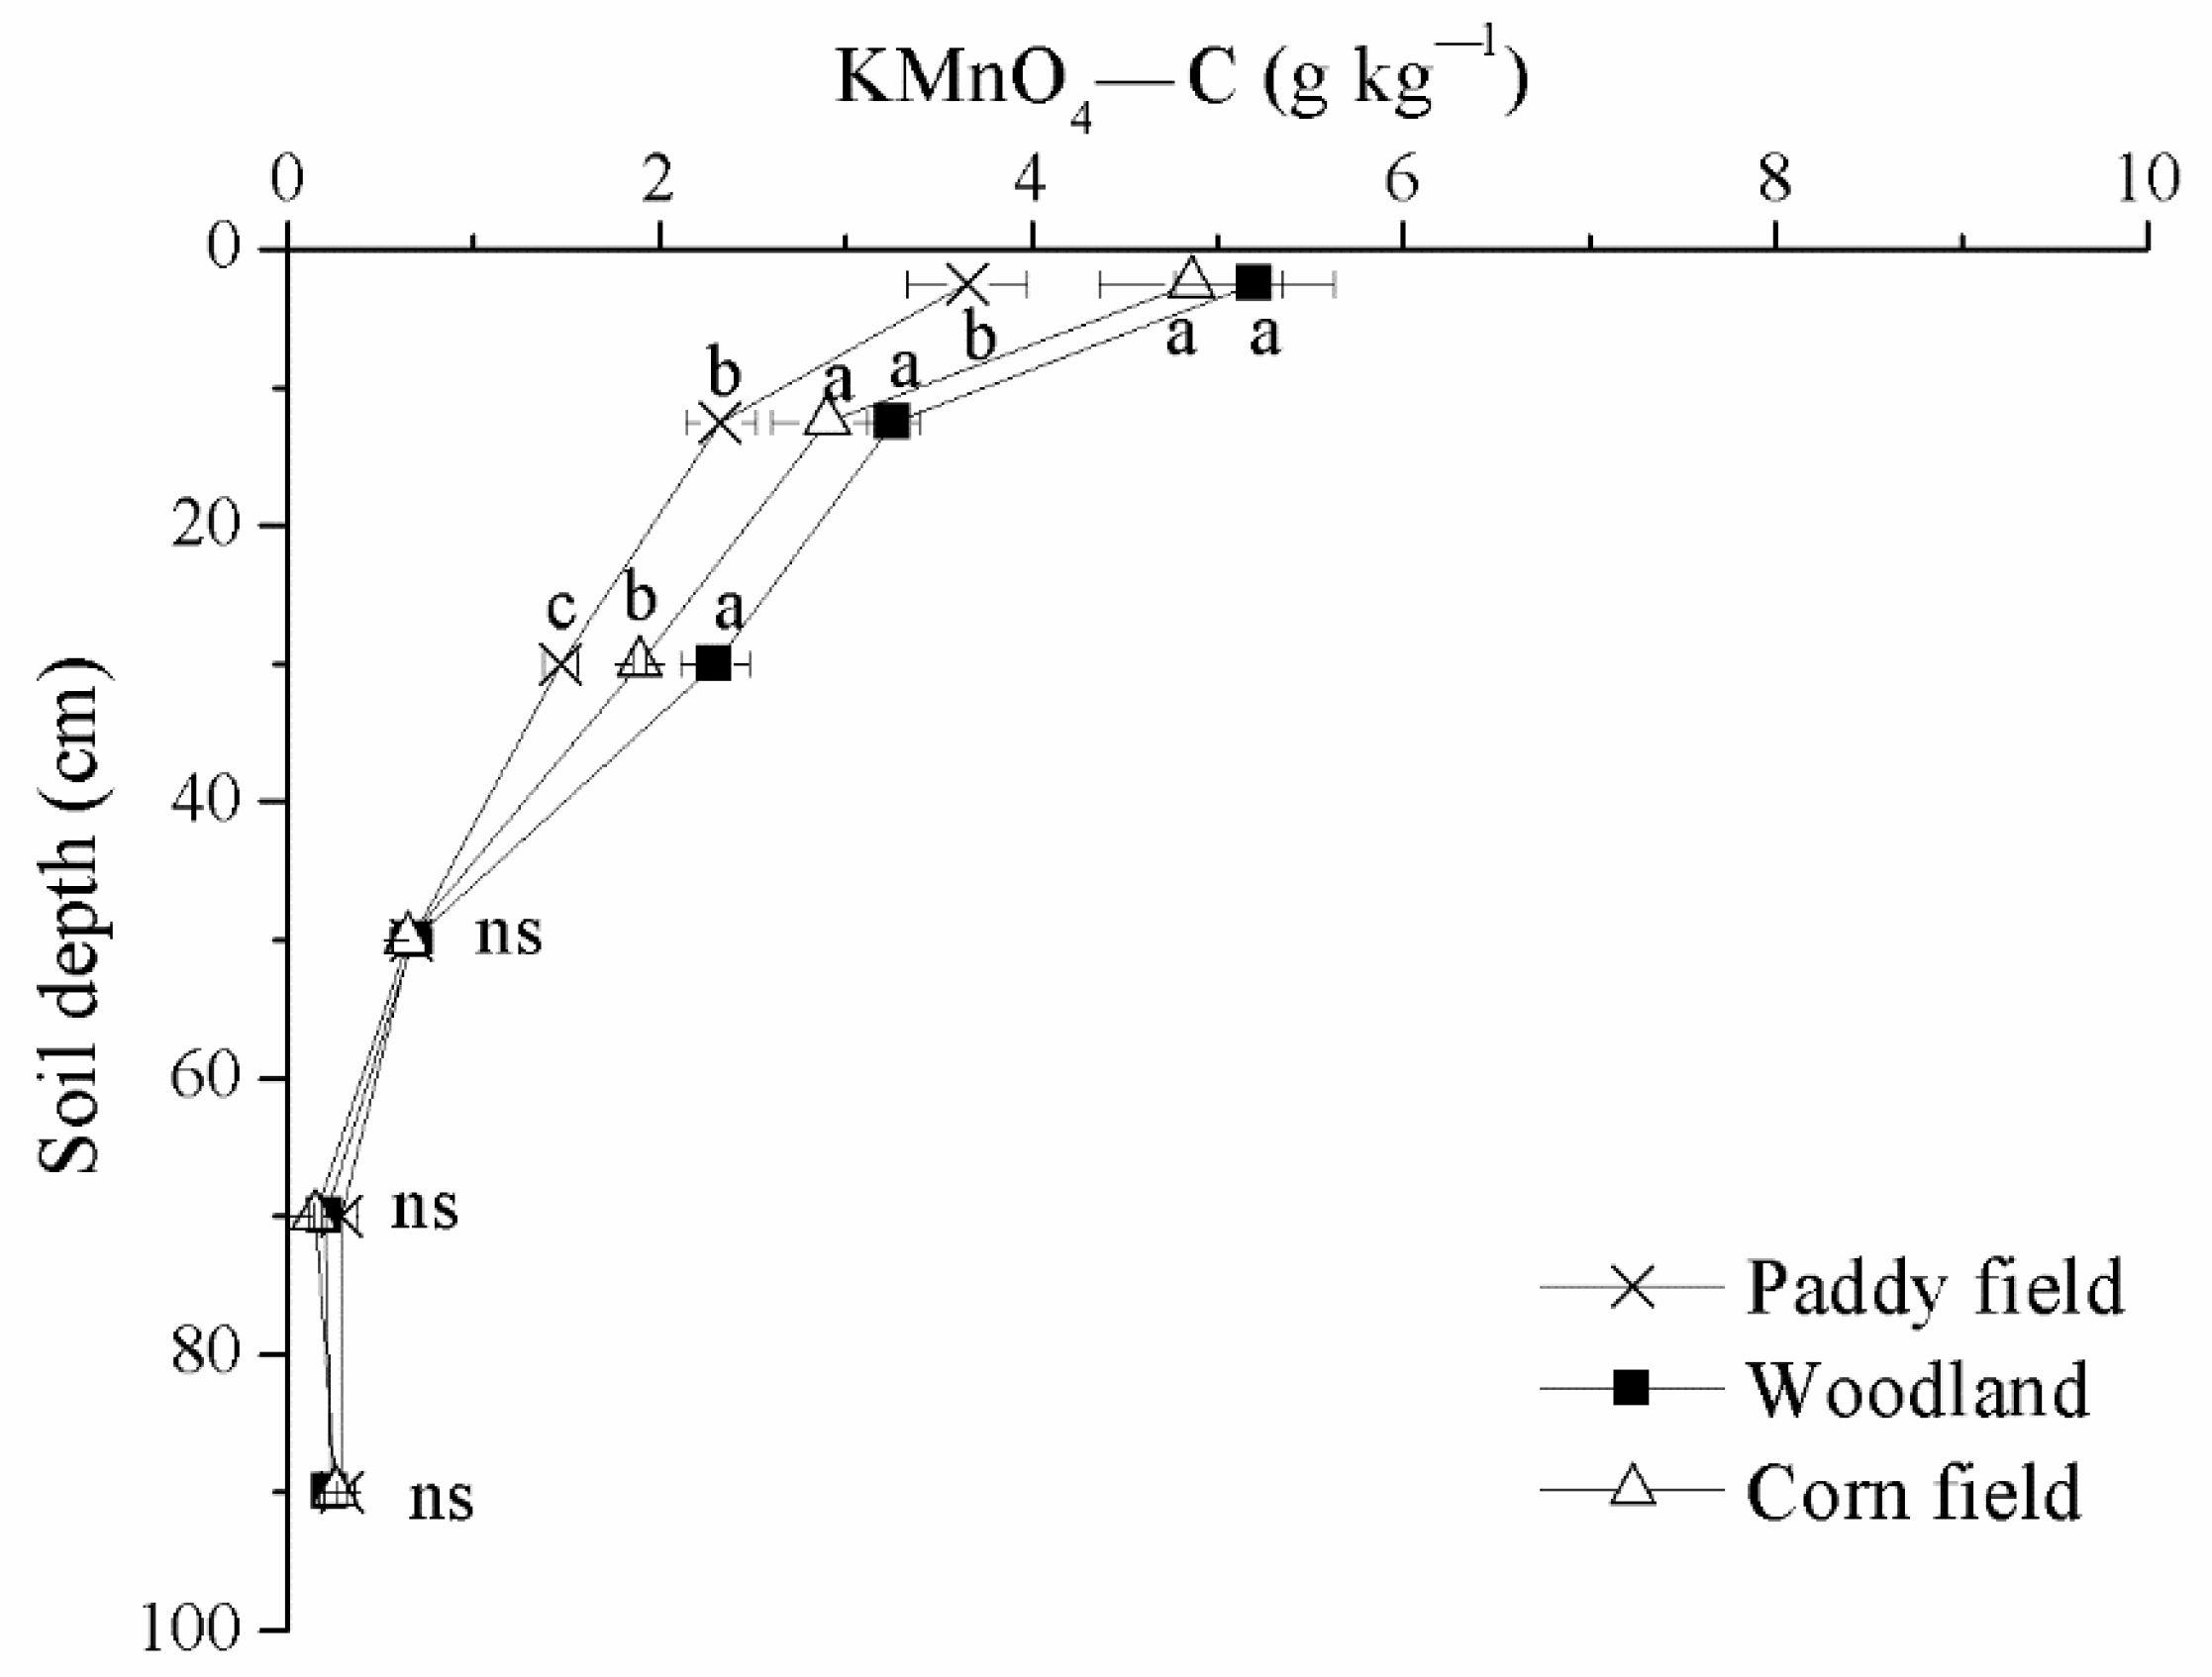
3.4. Soil KMnO4–C and CMI Levels

The proportion of soil KMnO4–C increased after conversion from paddy fields to woodlands or corn fields in the 0–40 cm layer, ranging from 39.9–56.6% for the woodlands and 24.6–32.9% for the corn fields (Figure 6).
Woodland soils had the highest CPI values in the 0–40 cm layers, which were 24–71% higher than those in the paddy fields (Table 1). However, no differences in LI were found among the three land-use types. Similarly, CMI values in the 0–40 cm soil layers showed the following trend: woodland > corn field > paddy field (Table 1). The higher value of CMI in woodland was attributed to the higher CPI value.

3.5. Multiple Linear Regression between CMI and SOC Fractions

The multiple linear regression (MLR) model showed that the parameters for the constant, TOC, POC, TN, KMnO4–C, and MBC were 96.9, 3.73, −5.09, −7.27, 21.6, and −0.25, respectively (Table 2). In addition, the estimated parameters KMnO4–C and MBC were significant at a level of p < 0.01. The adjusted coefficient of determination (adjusted R2) of the MLR model was 0.6 (Table 2), which indicated that the MLR model could explain 60% of the variance in CMI.

4. Discussion

Our results suggest that land-use change significantly affected TOC and its labile C fractions in the 0–40 cm soil layer as well as the TN in the 0–20 cm soil layer. In the deeper soil layer (40–100 cm), no significant differences were observed among the three land-use types. However, Qiu et al. (2015) [22] reported that the concentrations of SOC and TN decreased by more than 50% in the 20–80 cm soil layer 30 years after the grasslands were converted into croplands or shrublands. The inconsistent changes in the subsoil layer affected by land-use change can probably be attributed to differences in the conversion duration and soil parent material [23,24,25]. Therefore, it is necessary to dynamically monitor the changes in SOC in the subsoil in future studies.
In this study, converting paddy fields into woodlands increased the soil TOC concentrations, possibly because of the absence of soil disturbance and larger organic C input. In the paddy field ecosystem, the removal of straw residue after harvesting, deep plowing, and multiple fertilization will accelerate the mineralization of SOC. Similarly, Saha et al. (2010) [26] observed that forest soils had higher SOC contents than rice-paddy field soils at a soil depth of 1 m. At lower soil depths (20–40 cm), the TOC contents were significantly higher in woodland soils than in paddy field soils, possibly because of the root exudates with deeper roots, thereby further increasing the C input in deep soil. Furthermore, woodland soils had overall higher concentrations of POC and KMnO4–C than paddy soil, which was ascribed to the larger annual input of litterfall. This was similar to the study by Niaz et al. (2017) [27], which also found that forest soil had a higher POC concentration than rangeland and cropland in 0–30 cm depth. However, our results showed that the differences in POC concentrations were inconsistent among soil depths. In the surface soil, there were no differences in POC concentrations between woodlands and paddy fields. This might be explained by the fact that after the paddy fields were converted into woodlands, the soil flooding conditions disappeared, soil aeration increased, and soil microbial activity increased, leading to accelerated utilization of the soil labile C fractions. At lower soil depths (5–40 cm), the higher POC concentrations and proportions of KMnO4–C in woodland soils were due to the larger input of root residue and root secretions [28]. By contrast, the lower MBC concentrations in woodland soils were possibly due to the lack of available N, which may limit microbe growth. In the paddy fields, the leaching of N, which is affected by N fertilization, provided an effective N source for the growth of microorganisms in the deeper soil.
Many previous studies [29,30] have reported that the SOC concentrations of paddy soils are higher than those of upland cropland soils. However, our results indicate that the contents of soil TOC and its labile C fractions increased after paddy fields were converted to corn fields. These inconsistent findings indicate that soil management practices have a strong effect on SOC concentrations in agricultural systems. The annual application of pig manure to corn fields significantly increased the SOC and its labile C fractions, although the absence of soil flooding conditions resulted in an aerobic environment. Therefore, in order to avoid the loss of SOC in the process of converting rice fields into other upland croplands in the future, the combined application of organic fertilizer is a sustainable soil C pool management practice [31,32]. However, excessive use of animal manure will increase the costs, risk of heavy metals [33], and susceptibility of soils to wind erosion [34]. Thus, using an appropriate application rate is crucial.
The CMI provides an indication of changes in soil C dynamics [35,36]. Our results suggest that converting paddy fields into woodlands or corn fields both increased the CMI in the topsoil and subsoil layers (30–40 cm). The changes in the deep soil C pool in response to land-use change should be further evaluated in the future. This result should also be interpreted with some caution, as our study included a few sampling points in a local region. Future studies should collect more data from different sampling locations in a larger area to monitor the changes in SOC after land-use conversion.

5. Conclusions

The soil CMI value and TOC and KMnO4–C concentrations in the 0–40 cm soil layer were higher in woodlands or corn fields than in paddy fields. Samplings at different time scales were needed to prove the changes in soil organic carbon pool after land-use change in the future. Application of organic fertilizer is a recommended way to maintain the soil C pool when flooded paddy fields are converted into upland croplands. However, organic fertilizer application should also comprehensively consider the possible nutrient leaching, heavy metal risks, and other issues.

Author Contributions

Conceptualization, Y.S.; methodology, W.M and J.Z.; software, L.S. (Lijun Su); validation, W.T.; formal analysis, W.T. and L.S. (Lijun Su); investigation, Y.S.; resources, Y.S.; data curation, L.S. (Lijun Su); writing—original draft preparation, L.S. (Linlin Si) and W.M.; writing—review and editing, L.S. (Linlin Si) and W.M.; visualization, J.Z.; supervision, Y.S.; project administration, Y.S.; funding acquisition, Y.S. and L.S. (Linlin Si). All authors have read and agreed to the published version of the manuscript.

Funding

This research was funded by the Shaanxi Province Postdoctoral Science Foundation (2018BSHEDZZ26), Department of Science and Technology of Zhejiang Province, China (2019C02008).

Conflicts of Interest

The authors declare no conflict of interest.

References

  1. Xu, J.; Peng, S.; Yang, S.; Wang, W. Ammonia volatilization losses from a rice paddy with different irrigation and nitrogen managements. Agric. Water Manag. 2012, 104, 184–192. [Google Scholar] [CrossRef]
  2. Yang, D.; Zhang, M. Effects of land-use conversion from paddy field to orchard farm on soil microbial genetic diversity and community structure. Eur. J. Soil Biol. 2014, 64, 30–39. [Google Scholar] [CrossRef]
  3. Guo, J.M.; Wang, Y.H.; Blaylock, A.D.; Chen, X.P. Mixture of controlled release and normal urea to optimize nitrogen man-agement for high-yielding (>15 Mg ha−1) maize. Field Crops Res. 2017, 204, 23–30. [Google Scholar] [CrossRef]
  4. Kunlanit, B.; Butnan, S.; Vityakon, P. Land–Use Changes Influencing C Sequestration and Quality in Topsoil and Subsoil. Agronomy 2019, 9, 520. [Google Scholar] [CrossRef] [Green Version]
  5. Antisari, L.V.; Trenti, W.; De Feudis, M.; Bianchini, G.; Falsone, G. Soil Quality and Organic Matter Pools in a Temperate Climate (Northern Italy) under Different Land Uses. Agronomy 2021, 11, 1815. [Google Scholar] [CrossRef]
  6. Zou, X.; Ruan, H.; Fu, Y.; Yang, X.; Sha, L. Estimating soil labile organic carbon and potential turnover rates using a sequential fumigation–incubation procedure. Soil Biol. Biochem. 2005, 37, 1923–1928. [Google Scholar] [CrossRef]
  7. Valani, G.P.; Vezzani, F.M.; Cavalieri-Polizeli, K.M.V. Soil quality: Evaluation of on-farm assessments in relation to analytical index. Soil Tillage Res. 2019, 198, 104565. [Google Scholar] [CrossRef]
  8. Wang, H.; Guan, D.; Zhang, R.; Chen, Y.; Hu, Y.; Xiao, L. Soil aggregates and organic carbon affected by the land use change from rice paddy to vegetable field. Ecol. Eng. 2014, 70, 206–211. [Google Scholar] [CrossRef]
  9. Shrestha, B.M.; Bork, E.W.; Chang, S.X.; Carlyle, C.N.; Ma, Z.L.; Döbert, T.F.; Kaliaskar, D.; Boyce, M.S. Adaptive multi-paddock grazing lowers soil greenhouse gas emission potential by altering extracellular enzyme activity. Agronomy 2020, 10, 1781. [Google Scholar] [CrossRef]
  10. Liu, X.; Chen, D.T.; Yang, T.; Huang, F.R.; Fu, S.; Li, L.H. Changes in soil labile and recalcitrant carbon pools after land-sue change in a semi-arid agro-pastoral ecotone in Central Asia. Ecol. Indiac. 2020, 110, 105925. [Google Scholar] [CrossRef]
  11. Don, A.; Schumacher, J.; Freibauer, A. Impact of tropical land-use change on soil organic carbon stocks—A meta-analysis. Glob. Chang. Biol. 2011, 17, 1658–1670. [Google Scholar] [CrossRef] [Green Version]
  12. Li, G.-L.; Pang, X.-M. Effect of land-use conversion on C and N distribution in aggregate fractions of soils in the southern Loess Plateau, China. Land Use Policy 2010, 27, 706–712. [Google Scholar] [CrossRef]
  13. Mi, W.; Sun, Y.; Gao, Q.; Liu, M.; Wu, L. Changes in humus carbon fractions in paddy soil given different organic amendments and mineral fertilizers. Soil Tillage Res. 2019, 195, 104421. [Google Scholar] [CrossRef]
  14. Blair, G.J.; Lefroy, R.D.B.; Lisle, L. Soil carbon fractions based on their degree of oxidation, and the development of a carbon management index for agriculture systems. Aust. J. Agric. Res. 1995, 46, 1459–1466. [Google Scholar] [CrossRef]
  15. Abdelrahman, H.M.; Olk, D.C.; Dinnes, D.; Ventrella, D.; Miano, T.; Cocozza, C. Occurrence and abundance of carbohydrates and amino compounds in sequentially extracted labile soil organic matter fractions. J. Soils Sediments 2016, 16, 2375–2384. [Google Scholar] [CrossRef]
  16. Haynes, R. Labile Organic Matter Fractions as Central Components of the Quality of Agricultural Soils: An Overview. Adv. Agron. 2005, 5, 221–268. [Google Scholar] [CrossRef]
  17. Wei, X.; Shao, M.; Gale, W.J.; Zhang, X.; Li, L. Dynamics of aggregate-associated organic carbon following conversion of forest to cropland. Soil Biol. Biochem. 2013, 57, 876–883. [Google Scholar] [CrossRef]
  18. Jia, J.; Cao, Z.; Liu, C.; Zhang, Z.; Lin, L.; Wang, Y.; Haghipour, N.; Wacker, L.; Bao, H.; Dittmar, T.; et al. Climate warming alters subsoil but not topsoil carbon dynamics in alpine grassland. Glob. Chang. Biol. 2019, 25, 4383–4393. [Google Scholar] [CrossRef] [PubMed]
  19. Vance, E.D.; Brookes, P.C.; Jenkinson, D.S. An extraction method for measuring soil microbial biomass C. Soil Biol. Biochem. 1987, 19, 703–707. [Google Scholar] [CrossRef]
  20. Walkley, A.E.; Black, C.A. An examination of the Degtjareff method for determining soil organic matter and a proposed modification of the chromic acid titration method. Soil Sci. 1934, 37, 29–38. [Google Scholar] [CrossRef]
  21. Cambardella, C.A.; Elliott, E.T. Particulate Soil Organic-Matter Changes across a Grassland Cultivation Sequence. Soil Sci. Soc. Am. J. 1992, 56, 777–783. [Google Scholar] [CrossRef]
  22. Qiu, L.; Wei, X.; Ma, T.; Wei, Y.; Horton, R.; Zhang, X.; Cheng, J. Effects of land-use change on soil organic carbon and nitrogen in density fractions and soil δ13C and δ15N in semiarid grasslands. Plant Soil 2015, 390, 419–430. [Google Scholar] [CrossRef]
  23. Alvarez, R.; Alvarez, C.R.; Lorenzo, G.A. Carbon dioxide fluxes following tillage from a mollisol in the Argentine Rolling Pampa. Eur. J. Soil Biol. 2001, 37, 161–166. [Google Scholar] [CrossRef]
  24. Raiesi, F.; Kabiri, V. Carbon and nitrogen mineralization kinetics as affected by tillage systems in a calcareous loam soil. Ecol. Eng. 2017, 106, 24–34. [Google Scholar] [CrossRef]
  25. Hobley, E.; Baldock, J.; Hua, Q.; Wilson, B. Land-use contrasts reveal instability of subsoil organic carbon. Glob. Chang. Biol. 2016, 23, 955–965. [Google Scholar] [CrossRef] [PubMed] [Green Version]
  26. Saha, S.K.; Nair, P.K.R.; Nair, V.D.; Kumar, B.M. Carbon storage in relation to soil size-fractions under tropical tree-based land-use systems. Plant Soil 2009, 328, 433–446. [Google Scholar] [CrossRef]
  27. Niaz, S.; Ijaz, S.S.; Hassan, A.; Sharif, M. Landuse impacts on soil organic carbon fractions in different rainfall areas of a sub-tropical dryland. Arch. Agron. Soil Sci. 2017, 63, 1337–1345. [Google Scholar] [CrossRef]
  28. Wu, Q.C.; Jiang, X.H.; Lu, Q.W.; Li, J.B.; Chen, J.L. Changes in soil organic carbon and aggregate stability following a chronosequence of Liriodendron chinense plantations. J. For. Res. 2021, 32, 355–362. [Google Scholar] [CrossRef]
  29. Song, G.; Li, L.; Pan, G.; Zhang, Q. Topsoil organic carbon storage of China and its loss by cultivation. Biodegradation 2005, 74, 47–62. [Google Scholar] [CrossRef]
  30. Shi, X.-Z.; Yang, R.-W.; Weindorf, D.C.; Wang, H.-J.; Yu, D.-S.; Huang, Y.; Pan, X.-Z.; Sun, W.-X.; Zhang, L.-M. Simulation of organic carbon dynamics at regional scale for paddy soils in China. Clim. Chang. 2009, 102, 579–593. [Google Scholar] [CrossRef]
  31. Xu, E.; Zhang, H.; Xu, Y. Effect of Large-Scale Cultivated Land Expansion on the Balance of Soil Carbon and Nitrogen in the Tarim Basin. Agronomy 2019, 9, 86. [Google Scholar] [CrossRef] [Green Version]
  32. Liu, M.; Ussiri, D.A.N.; Lal, R. Soil Organic Carbon and Nitrogen Fractions under Different Land Uses and Tillage Practices. Commun. Soil Sci. Plant Anal. 2016, 47, 1528–1541. [Google Scholar] [CrossRef]
  33. Li, F.; Li, Z.; Mao, P.; Li, Y.; Li, Y.; McBride, M.B.; Wu, J.; Zhuang, P. Heavy metal availability, bioaccessibility, and leachability in contaminated soil: Effects of pig manure and earthworms. Environ. Sci. Pollut. Res. 2018, 26, 20030–20039. [Google Scholar] [CrossRef]
  34. Munch, S.; Papke, N.; Leue, M.; Faust, M.; Schepanski, K.; Siller, P.; Roesler, U.; Nubel, U.; Kabelitz, T.; Amon, T.; et al. Differences in the sediment composition of wind eroded sandy soils before and after fertilization with poultry manure. Soil Tillage Res. 2022, 215, 105205. [Google Scholar] [CrossRef]
  35. Kalambukattu, J.G.; Singh, R.; Patra, A.K.; Arunkumar, K. Soil carbon pools and carbon management index under different land use systems in the Central Himalayan region. Acta Agric. Scand. Sect. B Plant Soil Sci. 2013, 63, 200–205. [Google Scholar] [CrossRef]
  36. Vieira, F.; Bayer, C.; Zanatta, J.; Dieckow, J.; Mielniczuk, J.; He, Z. Carbon management index based on physical fractionation of soil organic matter in an Acrisol under long-term no-till cropping systems. Soil Tillage Res. 2007, 96, 195–204. [Google Scholar] [CrossRef]
Figure 1. Location of experiment site.
Agronomy 12 00029 g001
Figure 2. Soil total organic carbon (TOC) content at different soil depths under different soil types. Horizontal bars represent standard deviations. Different lower-case letters in the same soil depth indicate the significant differences at the 5% level of probability. NS indicates no significant differences at the 5% level of probability.
Agronomy 12 00029 g002
Figure 3. Soil total nitrogen (TN) content at different soil depths under different soil types. Horizontal bars represent standard deviations. Different lower-case letters in the same soil depth indicate the significant differences at the 5% level of probability. NS indicates no significant differences at the 5% level of probability.
Agronomy 12 00029 g003
Figure 4. Soil particulate organic carbon (POC) content at different soil depths under different soil types. Horizontal bars represent standard deviations. Different lower-case letters in the same soil depth indicate the significant differences at the 5% level of probability. NS indicates no significant differences at the 5% level of probability.
Agronomy 12 00029 g004
Figure 5. Soil microbial biomass carbon (MBC) content at different soil depths under different soil types. Horizontal bars represent standard deviations. Different lower-case letters in the same soil depth indicate the significant differences at the 5% level of probability. NS indicates no significant differences at the 5% level of probability.
Agronomy 12 00029 g005
Figure 6. Soil potassium permanganate organic carbon (KMnO4–C) content at different soil depths under different soil types. Horizontal bars represent standard deviations. Different lower-case letters in the same soil depth indicate the significant differences at the 5% level of probability. NS indicates no significant differences at the 5% level of probability.
Agronomy 12 00029 g006
Table 1. CMI values in different soil types at different soil depths.
Soil DepthCPILICMI
Paddy FieldWoodlandCorn FieldPaddy FieldWoodlandCorn FieldPaddy FieldWoodlandCorn Field
0–5 cm1.00 b1.24 a1.21 a1.00 a1.21 a1.15 a100 b149 a137 a
5–20 cm1.00 b1.54 a1.47 a1.00 a0.90 a0.82 a100 b137 a120 ab
20–40 cm1.00 b1.71 a1.23 b1.00 a0.90 a1.08 a100 b154 a131 a
40–60 cm1.00 a1.32 a1.01 a1.00 a0.88 a1.20 a100 a116 a115 a
60–80 cm1.00 a0.75 a0.86 a1.00 a1.37 a1.25 a100 a98 a93 a
80–100 cm1.00 a0.81 a0.93 a1.00 a1.19 a1.12 a100 a86 a104 a
Different lower-case letters in the same soil depth represent significant differences at the 5% level. CPI, carbon pool index; LI, lability index; CMI, carbon management index.
Table 2. Estimated parameters of the multiple linear regression model for carbon management index (n = 54).
VariableParameterStd. Errort-Valuep-Value
Constant96.855.0619.150.00
TOC3.731.971.90.06
POC−5.094.25−1.20.24
TN−7.2716.9−0.430.67
KMnO4–C21.68.342.590.01
MBC−0.250.08−3.260.002
TOC, soil total organic carbon; POC, particulate organic carbon; TN, soil total nitrogen; KMnO4–C, potassium permanganate-oxidizable C; MBC, microbial biomass carbon.
Publisher’s Note: MDPI stays neutral with regard to jurisdictional claims in published maps and institutional affiliations.

