Article

Characterization of Mollisols after Long-Term N Fertilization at Successive Rates in Continuous and Rotated Corn Systems

Department of Crop Sciences, University of Illinois, 1102 S. Goodwin Ave., Urbana, IL 61801, USA
*
Author to whom correspondence should be addressed.
Submission received: 4 February 2022 / Revised: 28 February 2022 / Accepted: 1 March 2022 / Published: 3 March 2022

Abstract

:
Modern agricultural systems rely on inorganic nitrogen (N) fertilization to enhance crop yields, but its overuse may negatively impact soil properties. Soil properties to a depth of 90 cm were studied after 36 years of inorganic N fertilization at successive rates of 0, 202, and 269 kg N ha−1 (N0, N202, and N269) in continuous corn production [Zea mays L.] (CCC), and the corn (Cs) and soybean [Glycine max (L.) Merr.] (Sc) phases of a corn-soybean (CS) rotation. Experimental plots were arranged as a split-plot in a randomized complete block design with three replications. High levels of N fertilization under CCC acidified the topsoil (N0 pH 6.6 vs. N269 pH 4.9), and increased the nitrate level eight-fold compared to unfertilized controls. Under CCC, N0 had more than twice the available phosphorus level (P) and 40% more potassium (K) than the fertilized soils. Though treatments did not impact the soil organic carbon (SOC) content, water aggregate stability (WAS) decreased during the soybean phase of the rotated treatment (Sc) when compared to CCC. Fertilization affected soil bulk density (BD), which decreased by 5% from N0 to N269 across rotations. Averaged since the start of the study, corn yields increased by 60% with N fertilizer use compared to the unfertilized controls (N0). The corn grain yield benefited from the rotation with soybeans rendering 17% more grain yield in Cs than in CCC. Yet this benefit rose to 45% more grain yield on average, when no N fertilizer was used in Cs. Our results showed that there are important trade-offs with N fertilization and long-term use of corn monocultures, as its long-term use, even in the fertile and resilient soils on the Midwestern U.S., has led to P and K depletion, soil acidification, and potentially exacerbated N losses to the environment.

1. Introduction

As the most limiting crop nutrient worldwide, nitrogen (N) fertilization use exceeds 100 Tg N yr−1, leading to an estimated loss of 67 Tg N yr−1, or roughly two-thirds of all synthetic N applied [1,2,3]. Despite this inefficiency, modern N fertilization feeds 48% of the world’s population and is responsible for 30–50% of all crop yield increases [4]. In the US Midwest region (Iowa, Illinois, Nebraska, Minnesota, Indiana, Kansas, South Dakota, Ohio, Missouri, Wisconsin, Michigan, and North Dakota), a prime agricultural region that provides more than 86% of the US corn crop [5], the average annual N fertilization rate for corn production in 2018 was 167 kg N ha−1, which amounts to over four Tg N yr−1 [6]. Also, in the US Midwest, corn [Zea mays L.] and soybean [Glycine max (L.) Merr.] are the dominant crops cultivated continuously or in short rotation of each other, occasionally including other crops like wheat, alfalfa, and increasingly, cover crops [7]. The use of corn following corn is one of the common cropping systems in the region that typically receives N fertilizers at high rates each year [8]. Although this intense annual N fertilization to corn monoculture accompanies high crop productivity within the region, it has been a critical source of N loss leading to contamination and hypoxia of water bodies [9] and increased nitrous oxide (N2O) emissions [10]. These N losses are the symptoms of deteriorating soil health via chemical imbalances [11]. Thus, important soil properties like soil pH, soil organic matter (SOM), and nutrient availability are widely employed as indicators used to assess the impacts of agricultural management on soil health [12]. Yet, the long-term effects of inorganic N fertilization on the chemical and physical properties of the deep and fertile soils of the Midwest region have not been thoroughly documented.
Baseline characterization of agricultural systems is vital to gain an understanding of the inherent dynamics and overall sustainability of agricultural lands. Several long-term studies in the region have characterized various soil properties following different N fertilization rates [13,14,15,16]. Likewise, some have also compared the soil properties between different crop rotations based on corn and soybean [17,18,19,20]. Soil pH is a crucial property that closely interacts with other aspects of soil health like soil fertility, toxicity, and the soil microbiome. So far, past studies reported decreased surface soil pH with increasing N fertilization rates regardless of the form of N applied [14,15,16,21]. For example, Barak, et al. [21] reported decreasing soil pH with higher N rates after 12 years of N fertilization from a site initially cropped with tobacco and soybean, then corn. Another study in Kansas by Obour, et al. [22] also detected notable soil acidification following 50 years of ammonium nitrate application. Moreover, this trend is particularly evident for soils under corn monocultures as they receive N more frequently. Liebig, et al. [14] observed that the soil pH decreased under continuous corn compared to a corn-soybean rotation after 17 years. However, because most of these experiments did not span more than two decades, the magnitude of soil acidification from N fertilization and corn monoculture in the longer term remains unknown.
Meanwhile, reports have been equivocal on the effects of N fertilization and crop rotation on cation exchange capacity (CEC), an important parameter of soil fertility [13,18,19,21]. On one hand, Barak, et al. [21] reported decreasing CEC with higher N rates, while Jagadamma, et al. [23] found that CEC did not differ significantly by N rates nor between continuous corn and corn-soybean rotations in Mollisols. Similarly, reports on the effect of N fertilization on SOM and related physical properties like bulk density (BD) and water aggregate stability (WAS) also remain ambiguous. For example, in Illinois, Jagadamma, et al. [13], following 23 years of N fertilization on continuous corn and corn-soybean rotations, reported that higher N rates increased soil organic carbon (SOC) and reduced BD in the surface soil. Yet a study in Iowa by Russell, et al. [24] showed that N application increased organic matter decay rate and shortened its turnover time, resulting in generally no change in SOC by fertilization rates. On the other hand, Obour, et al. [22] observed that the topsoil SOC increased after 50 years of N fertilization at moderate rate (67 kg N ha−1), showing that SOC may nonetheless accumulate given enough time. Furthermore, WAS, a proxy for soil erosion potential, and BD responded differentially to N rate and cropping system. Jagadamma, et al. [23] showed that WAS increased with higher N rates in continuous corn rotation, which they attributed to the differences in the quantity and chemical properties of the residues returned to the soil by treatments. Conversely, Hoss, et al. [19] did not find any differences in WAS or BD from 12 years of rotated or continuous corn. In addition, Zuber, et al. [20] found notable differences between WAS of corn monoculture and that of soybean monoculture, but not corn-soybean short rotation. Therefore, more reports on the N rate and crop rotation effects on these soil properties should accumulate to resolve these conflicting results.
As introduced earlier, N losses from agricultural systems are widely reported, and they greatly impact the environment. Numerous factors play into N loss, including asynchrony between fertilizer application and crop uptake, excess fertilizer N beyond crop needs, low N retention in managed soils, and soil N mineralization uncertainty [25]. Behnke, et al. [17] demonstrated that fertilization strategies associated with crop rotation alter soil N dynamics. They observed that N2O emissions and soil inorganic N levels were the greatest under continuous corn due to the greater N fertilizer use for maintaining yields. Moreover, N fertilization directly or indirectly affects phosphorus (P) and potassium (K) dynamics, which are major crop nutrients. For example, Congreves, et al. [18] found that soil P and K depleted differently under various crop rotations, leading to greater soil P and K levels under continuous corn and corn-soybean rotations than under continuous soybean. Furthermore, Jagadamma, et al. [23] reported greater soil K levels under continuous corn than under corn-soybean rotations. They attributed this K dynamics to differences in nutrients returned as crop residues, dictated by either the innate crop biomass production and chemical properties, or the amount of fertilizer applied in a cropping system. Thus, crop rotations and their yields dictate soil nutrient cycling as each crop phase may differ in nutrient requirements and the amount and composition of the residues returned to the soil [26,27]. However, long-term studies on soil nutrients are still scarce, especially those focusing on the effects of N fertilization in simple cropping systems.
The studies introduced so far have provided valuable information on the effects of different N fertilization rates and crop rotations on the soil properties of highly productive soils. However, knowledge on this relationship remains fragmented as most studies seldom assessed N rates and crop rotation together, or they were limited to certain soil properties or soil processes only at the soil surface. Moreover, results are often confounded by additional practices such as tillage systems and manure additions or by changes in management and cropping systems during the life of the long-term experimental plots. Therefore, our goal was to evaluate the soil chemical and physical properties to a depth of 90 cm, following 36 years of consistent management of N fertilization on corn monocultures and rotations with soybean crops. We hypothesized that the annual addition of N fertilizer in continuous corn will decrease soil pH, potentially due to nitrification and nutrient extraction by the crop, an effect that could be more pronounced on the surface soil and under the highest N rate. However, these fertilized corn monocultures could potentially increase soil organic matter and improve physical properties because of the greater volume of residue returned to the soil. Our results from this consistently managed long-term experiment will contribute to a better understanding of how innately fertile soils respond to the long-term use of conventional management practices typical of production-scale agriculture.

2. Materials and Methods

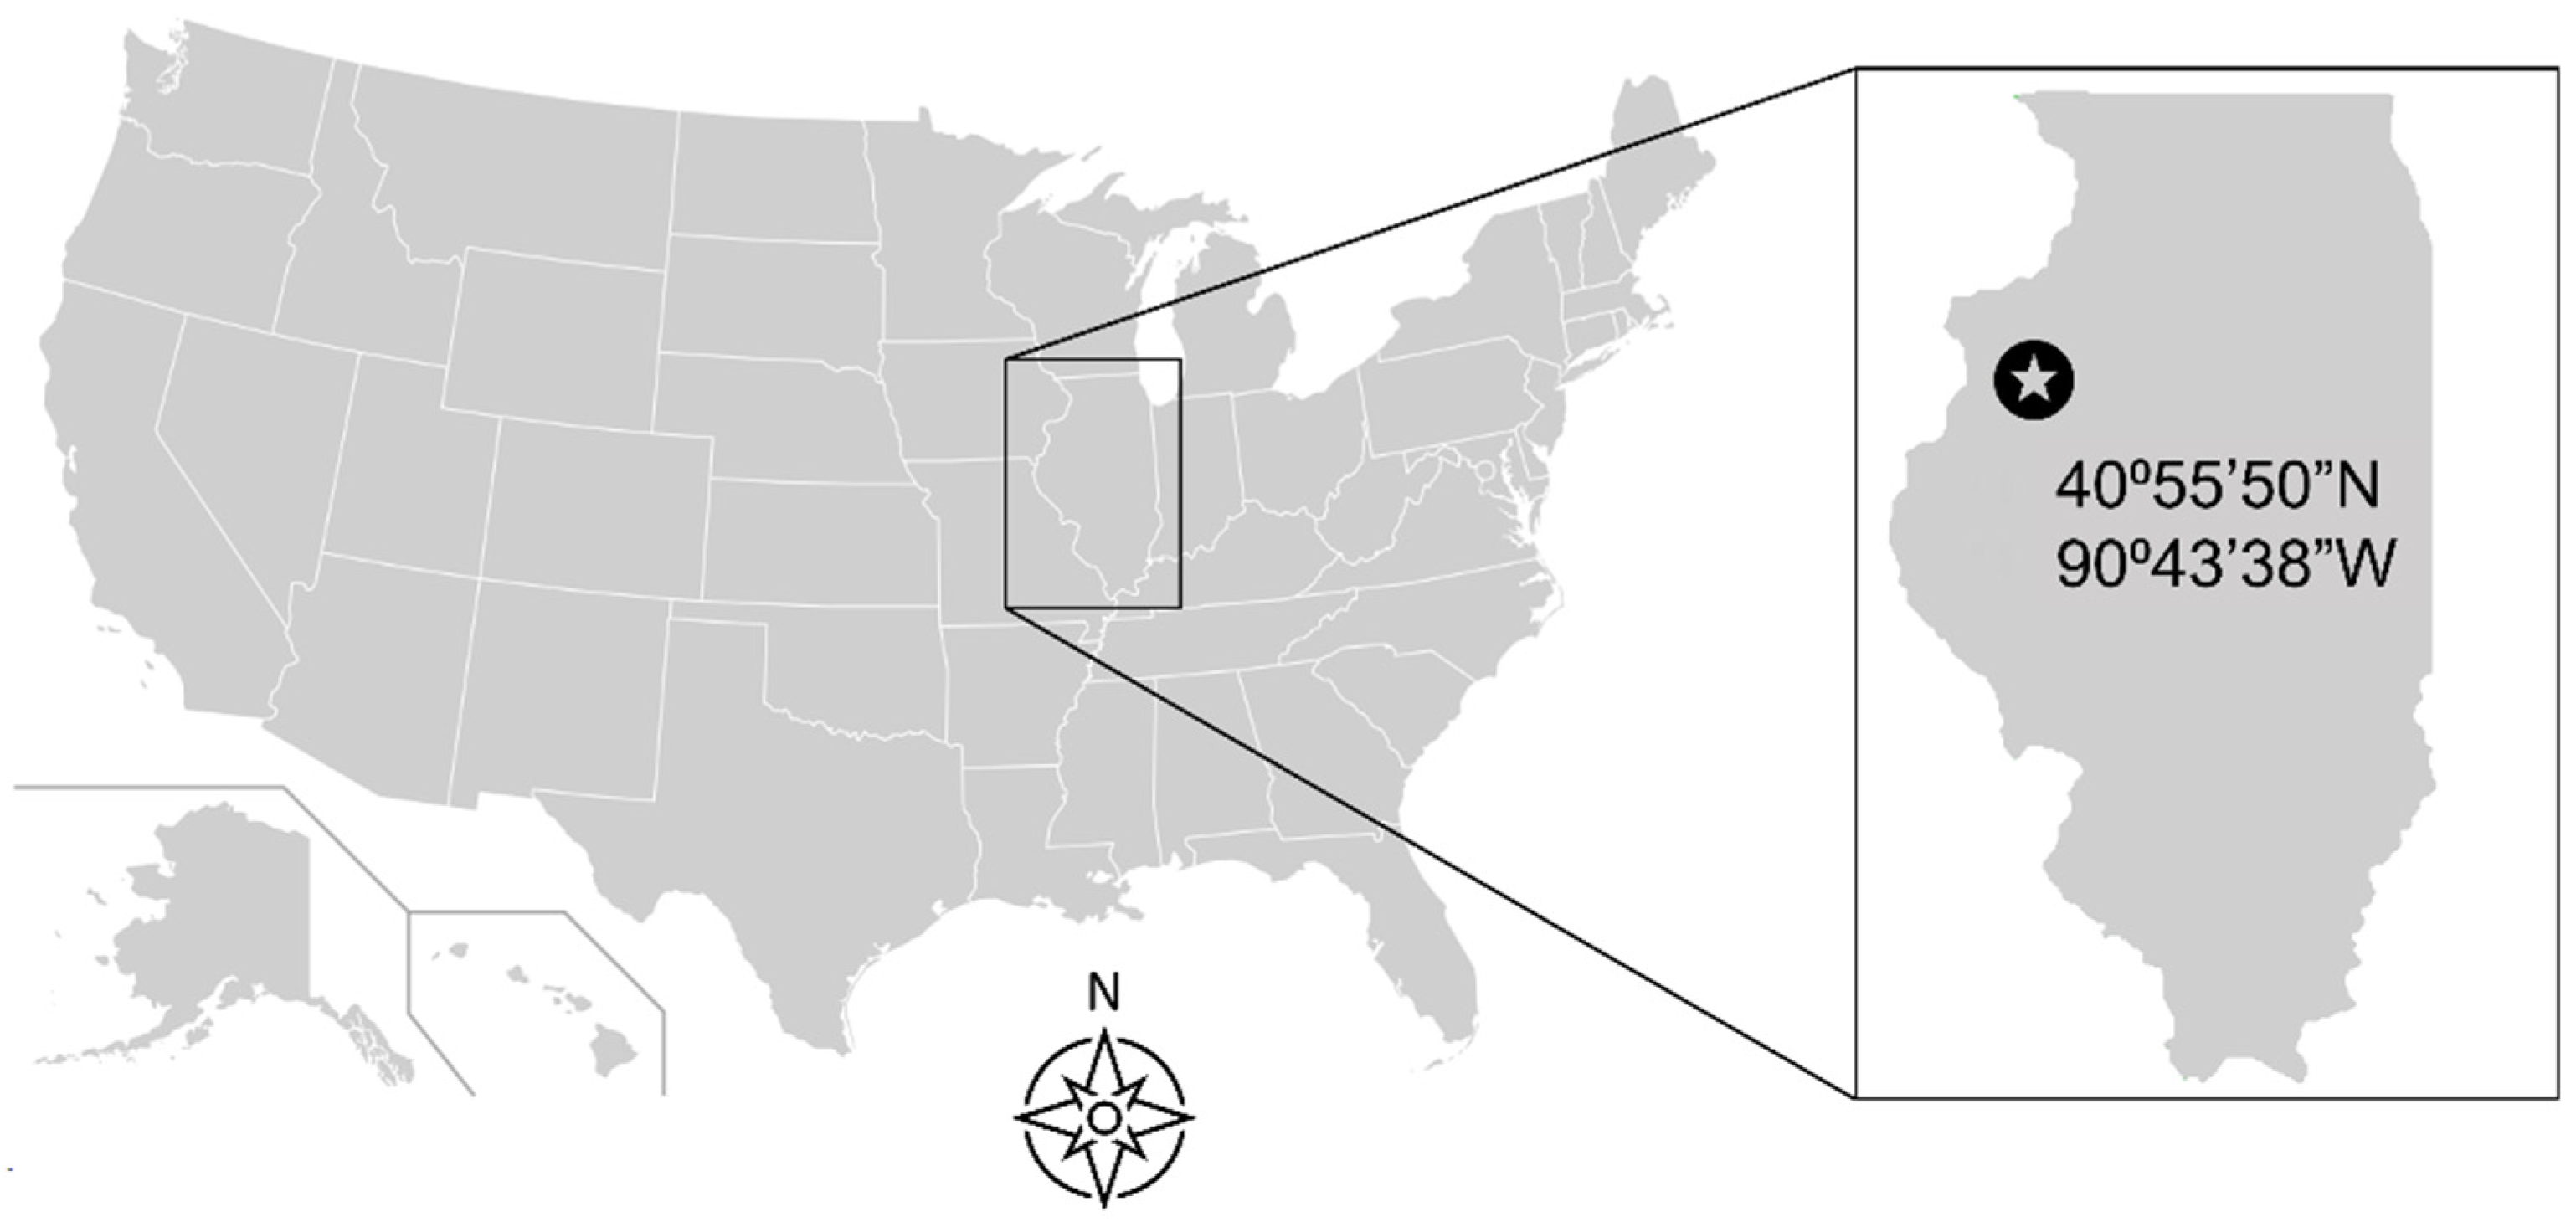
2.1. Experimental Site Description

The experimental plots were established in 1981 at the Northwestern Illinois Agricultural Research and Demonstration Center (40°55′50″ N, 90°43′38″ W), approximately 8 km northwest of Monmouth, Illinois (Figure 1). The location has a mean annual precipitation of 914 mm with a mean, maximum, and minimum annual temperatures of 10.6, 29.3, and −9.6 °C, respectively [28]. The experimental site was on Muscatune silt loam series (fine-silty, mixed, mesic Aquic Argiudoll) of nearly flat topography [29]. This soil series is dark-colored and very deep; it has moderate permeability and low surface runoff potential. This soil developed under the prairie vegetation in a layer of loess 2–3 m thick over glacial till [29].

2.2. Treatments and Field Management Practices

Research plots were initially designed to study the effects of N fertilization on corn yields under a monoculture (CCC) and short rotation with soybeans, with each phase present every year (Cs: Corn phase within corn-soybean rotation; Sc: Soybean phase within corn-soybean rotation). The site was set up in a split-plot arrangement of rotation (CCC, Cs, and Sc) and N fertilization rates (N0, N202, and N269; kg N ha−1) in a randomized complete block design with three replicates. Main plots were 18 m long by 30 m wide, and subplots were 18 m long by 6 m wide. Conventional tillage was used, which comprised of primary tillage with a chisel plow 20 to 25 cm deep in the fall after harvest, and secondary tillage with a field cultivator before planting in the spring. Corn and soybeans were planted in April or May each year in 76 and 38 cm rows, respectively, at the rate of 75,000 to 85,000 seeds ha−1 for corn, and at 340,000 to 350,000 seeds ha−1 for soybean. Fertilizer and pest management decisions followed the best practices for the site based on the Illinois Agronomy Handbook [30]. Urea (46% N) was applied until 1996 to corn in the spring at or before planting, which switched to urea ammonium nitrate solution (UAN 28%) thereafter. No N fertilizer was applied during soybean phases. Occasionally, P and K fertilizers and lime were applied to the entire field, when necessary, based on soil test results (the last application occurred in 2011). Historical yield data for corn from both CCC (from 1982 to 2017) and CS systems (in alternate years from 1983 to 2017), and for soybean from CS system (in alternate years from 1984 to 2017) were obtained from records at the Northwestern Illinois Agricultural Research and Demonstration Center. Every year, crop yields were harvested with a plot combine (Almaco, Nevada, IA, USA) and adjusted with 15.5 and 13% moisture for corn and soybean, respectively.

2.3. Soil Sampling and Determinations

Soil samples were collected in the fall of 2017, following harvest and 36 years after the initiation of the experiment. Within each experimental unit, three individual soil cores (4.3 cm diameter) to a depth of 90 cm were taken with a tractor-mounted soil sampler with soil sleeve inserts to keep the soil intact (Amity Tech, Fargo, ND, USA) and divided into four sections in the lab: 0–15 cm, 15–30 cm, 30–60, and 60–90 cm. Field-moist subsamples were analyzed for available N (NO3 and NH4+ in mg kg−1) using KCl extraction (1:5 ratio of soil to solution) followed by flow injection analysis with a SmartChem 200 (Westco Scientific Instruments, Inc., Danbury, CN, USA). Total inorganic N (TIN) was calculated as the sum of NO3 and NH4+. The Amity Tech soil sleeves allowed accurate measurement of the soil bulk density (BD, Mg m−3) by keeping the soil volume exact. Thus, about 10 g of soil per subsample was oven-dried at 105 °C in DKN-810 Mechanical Convection Oven (Yamato Scientific America Inc., Santa Clara, CA, USA) to measure gravimetric water content at each depth, and obtain BD using the core method [31]. An additional 4 g of soil per subsample was ground to measure the water soil aggregate stability (WAS, %) using West Sieving Apparatus (Eijelkamp, Giesbeek, The Netherlands) as the fraction of dry weight of stable aggregate separated with NaOH solution (1 M) from the total soil aggregate dry weight. The remaining soil of each subsample was sent to a commercial laboratory (Brookside Laboratories, Inc., New Bremen, OH, USA) for the determination of rest of the soil properties through standard procedures for the US North Central region (https://www.blinc.com/resources/testing-methods (accessed on 20 February 2022)). Thus, soil organic matter (SOM, %) was determined by loss-on-ignition [32], later converted to soil organic C content (SOC, g kg−1) using the equation developed by Konen, et al. [33] for Illinois soils. Soil pH (1:1 soil:water) was determined via potentiometry [34], available phosphorus (P, mg kg−1) with Bray I extraction [35], and the extractable elements including sulfur (S, mg kg−1), calcium (Ca, mg kg−1), magnesium (Mg, mg kg−1), potassium (K, mg kg−1), sodium (Na, mg kg−1), and aluminum (mg kg−1) were measured using Mehlich 150 III procedures [36]. Cation exchange capacity (CEC, cmolc kg−1) was estimated by the summation method [37].

2.4. Statistical Analyses
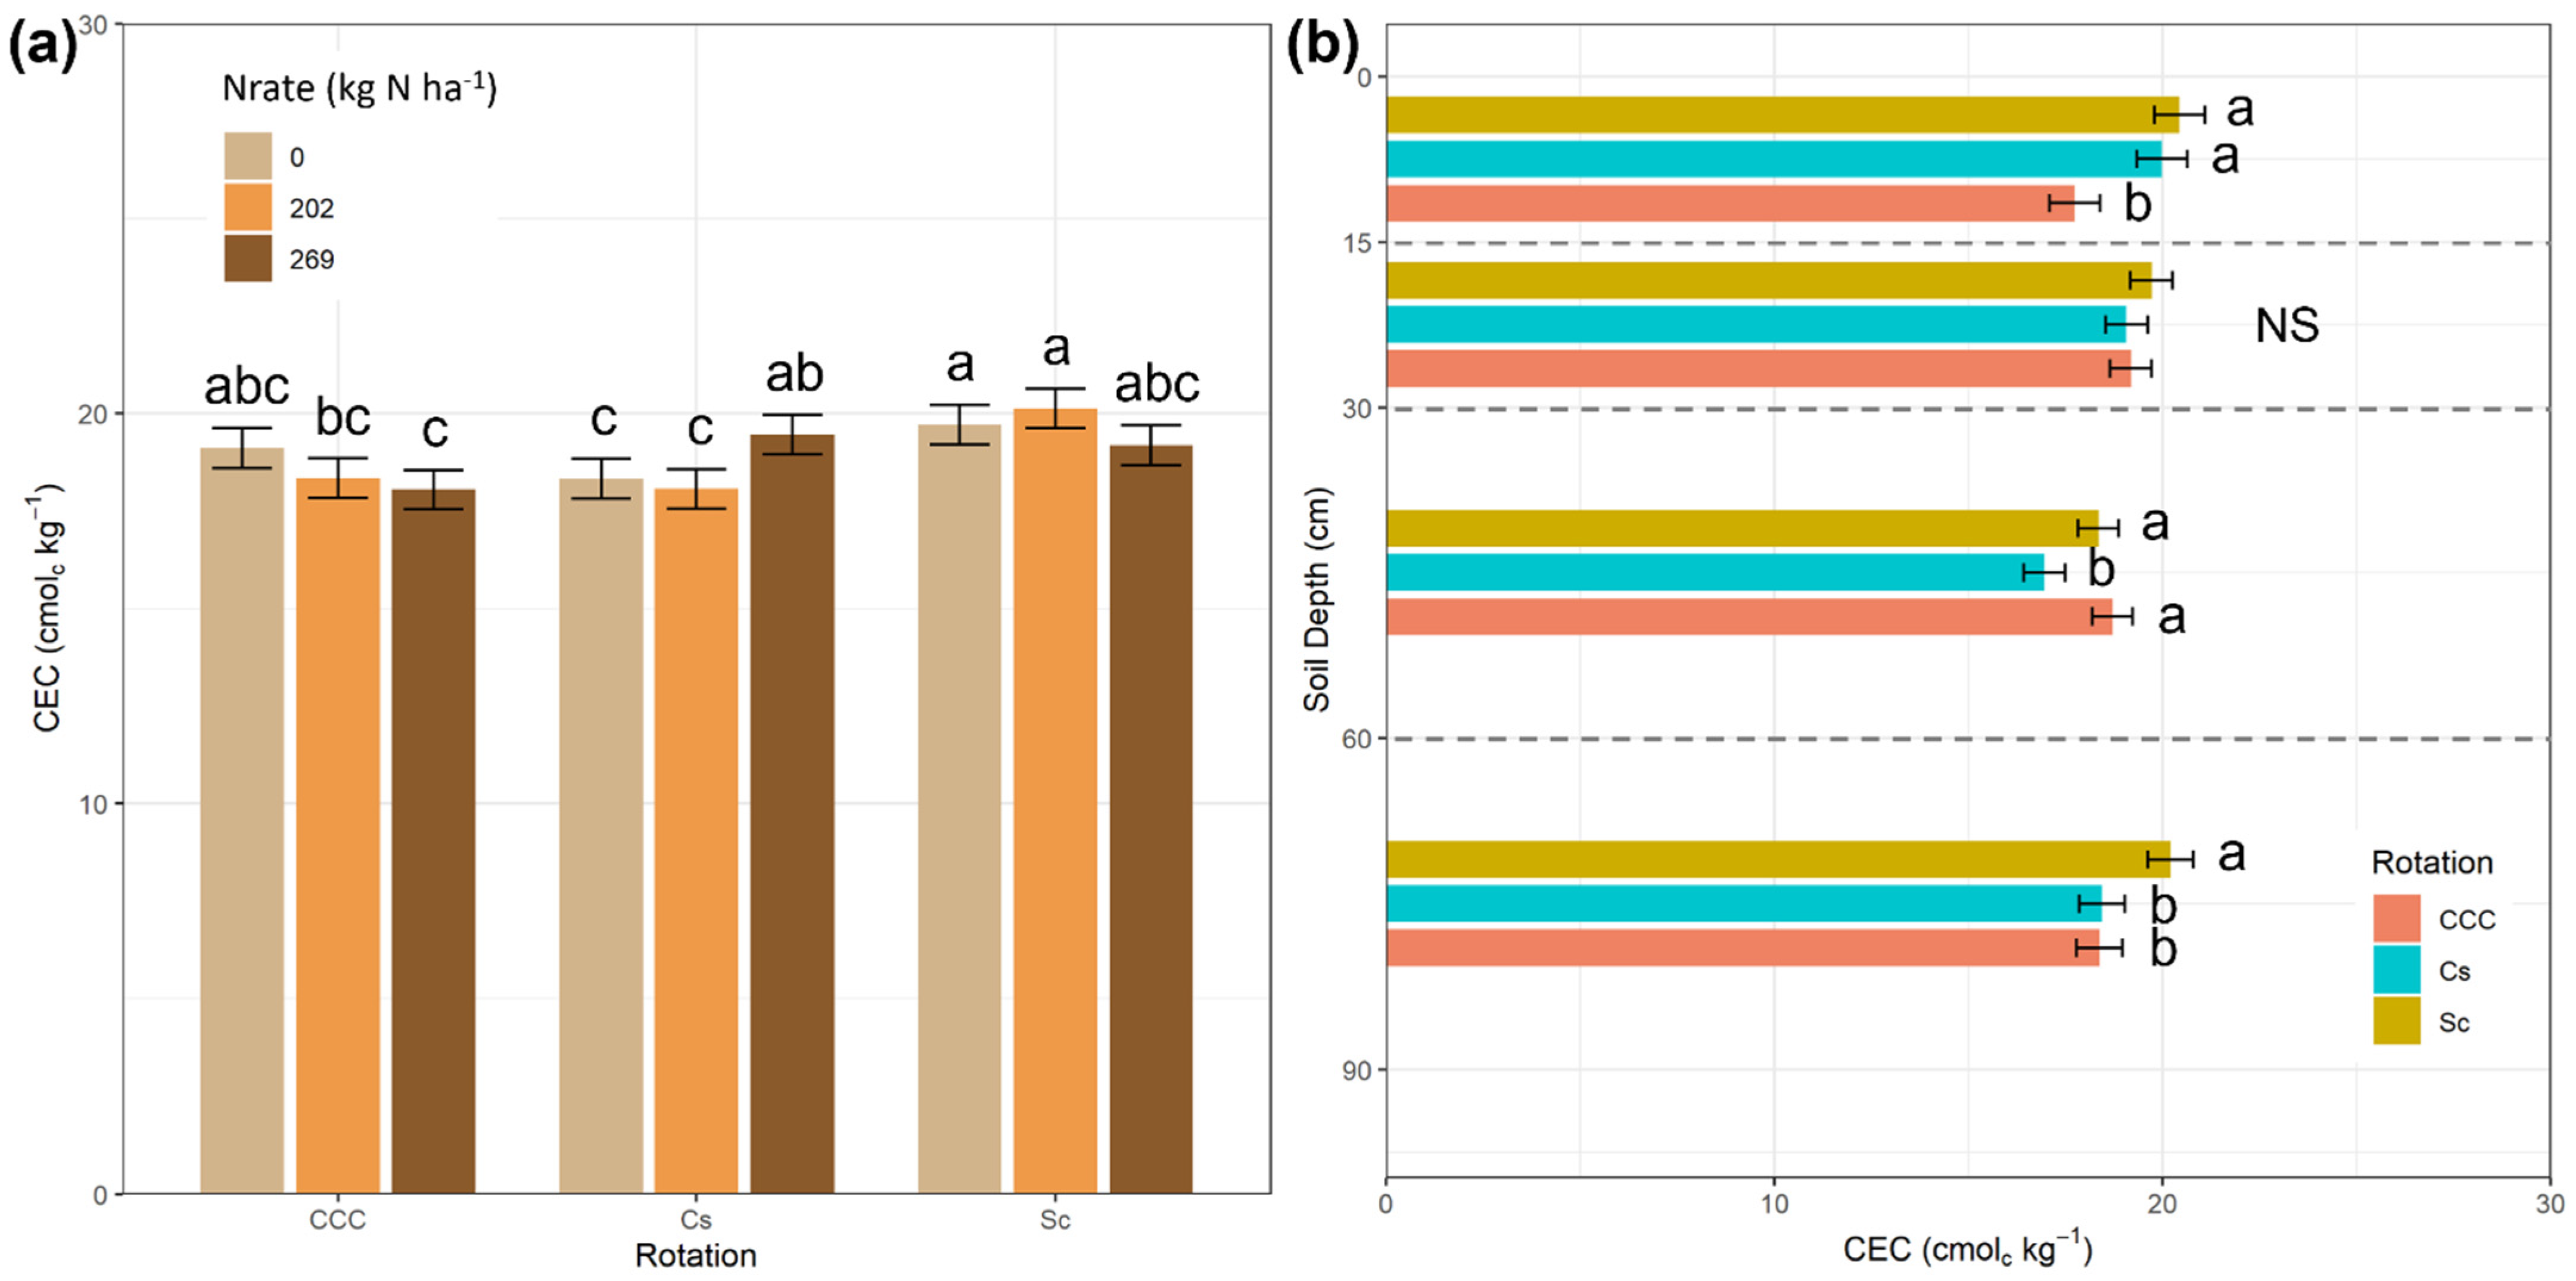
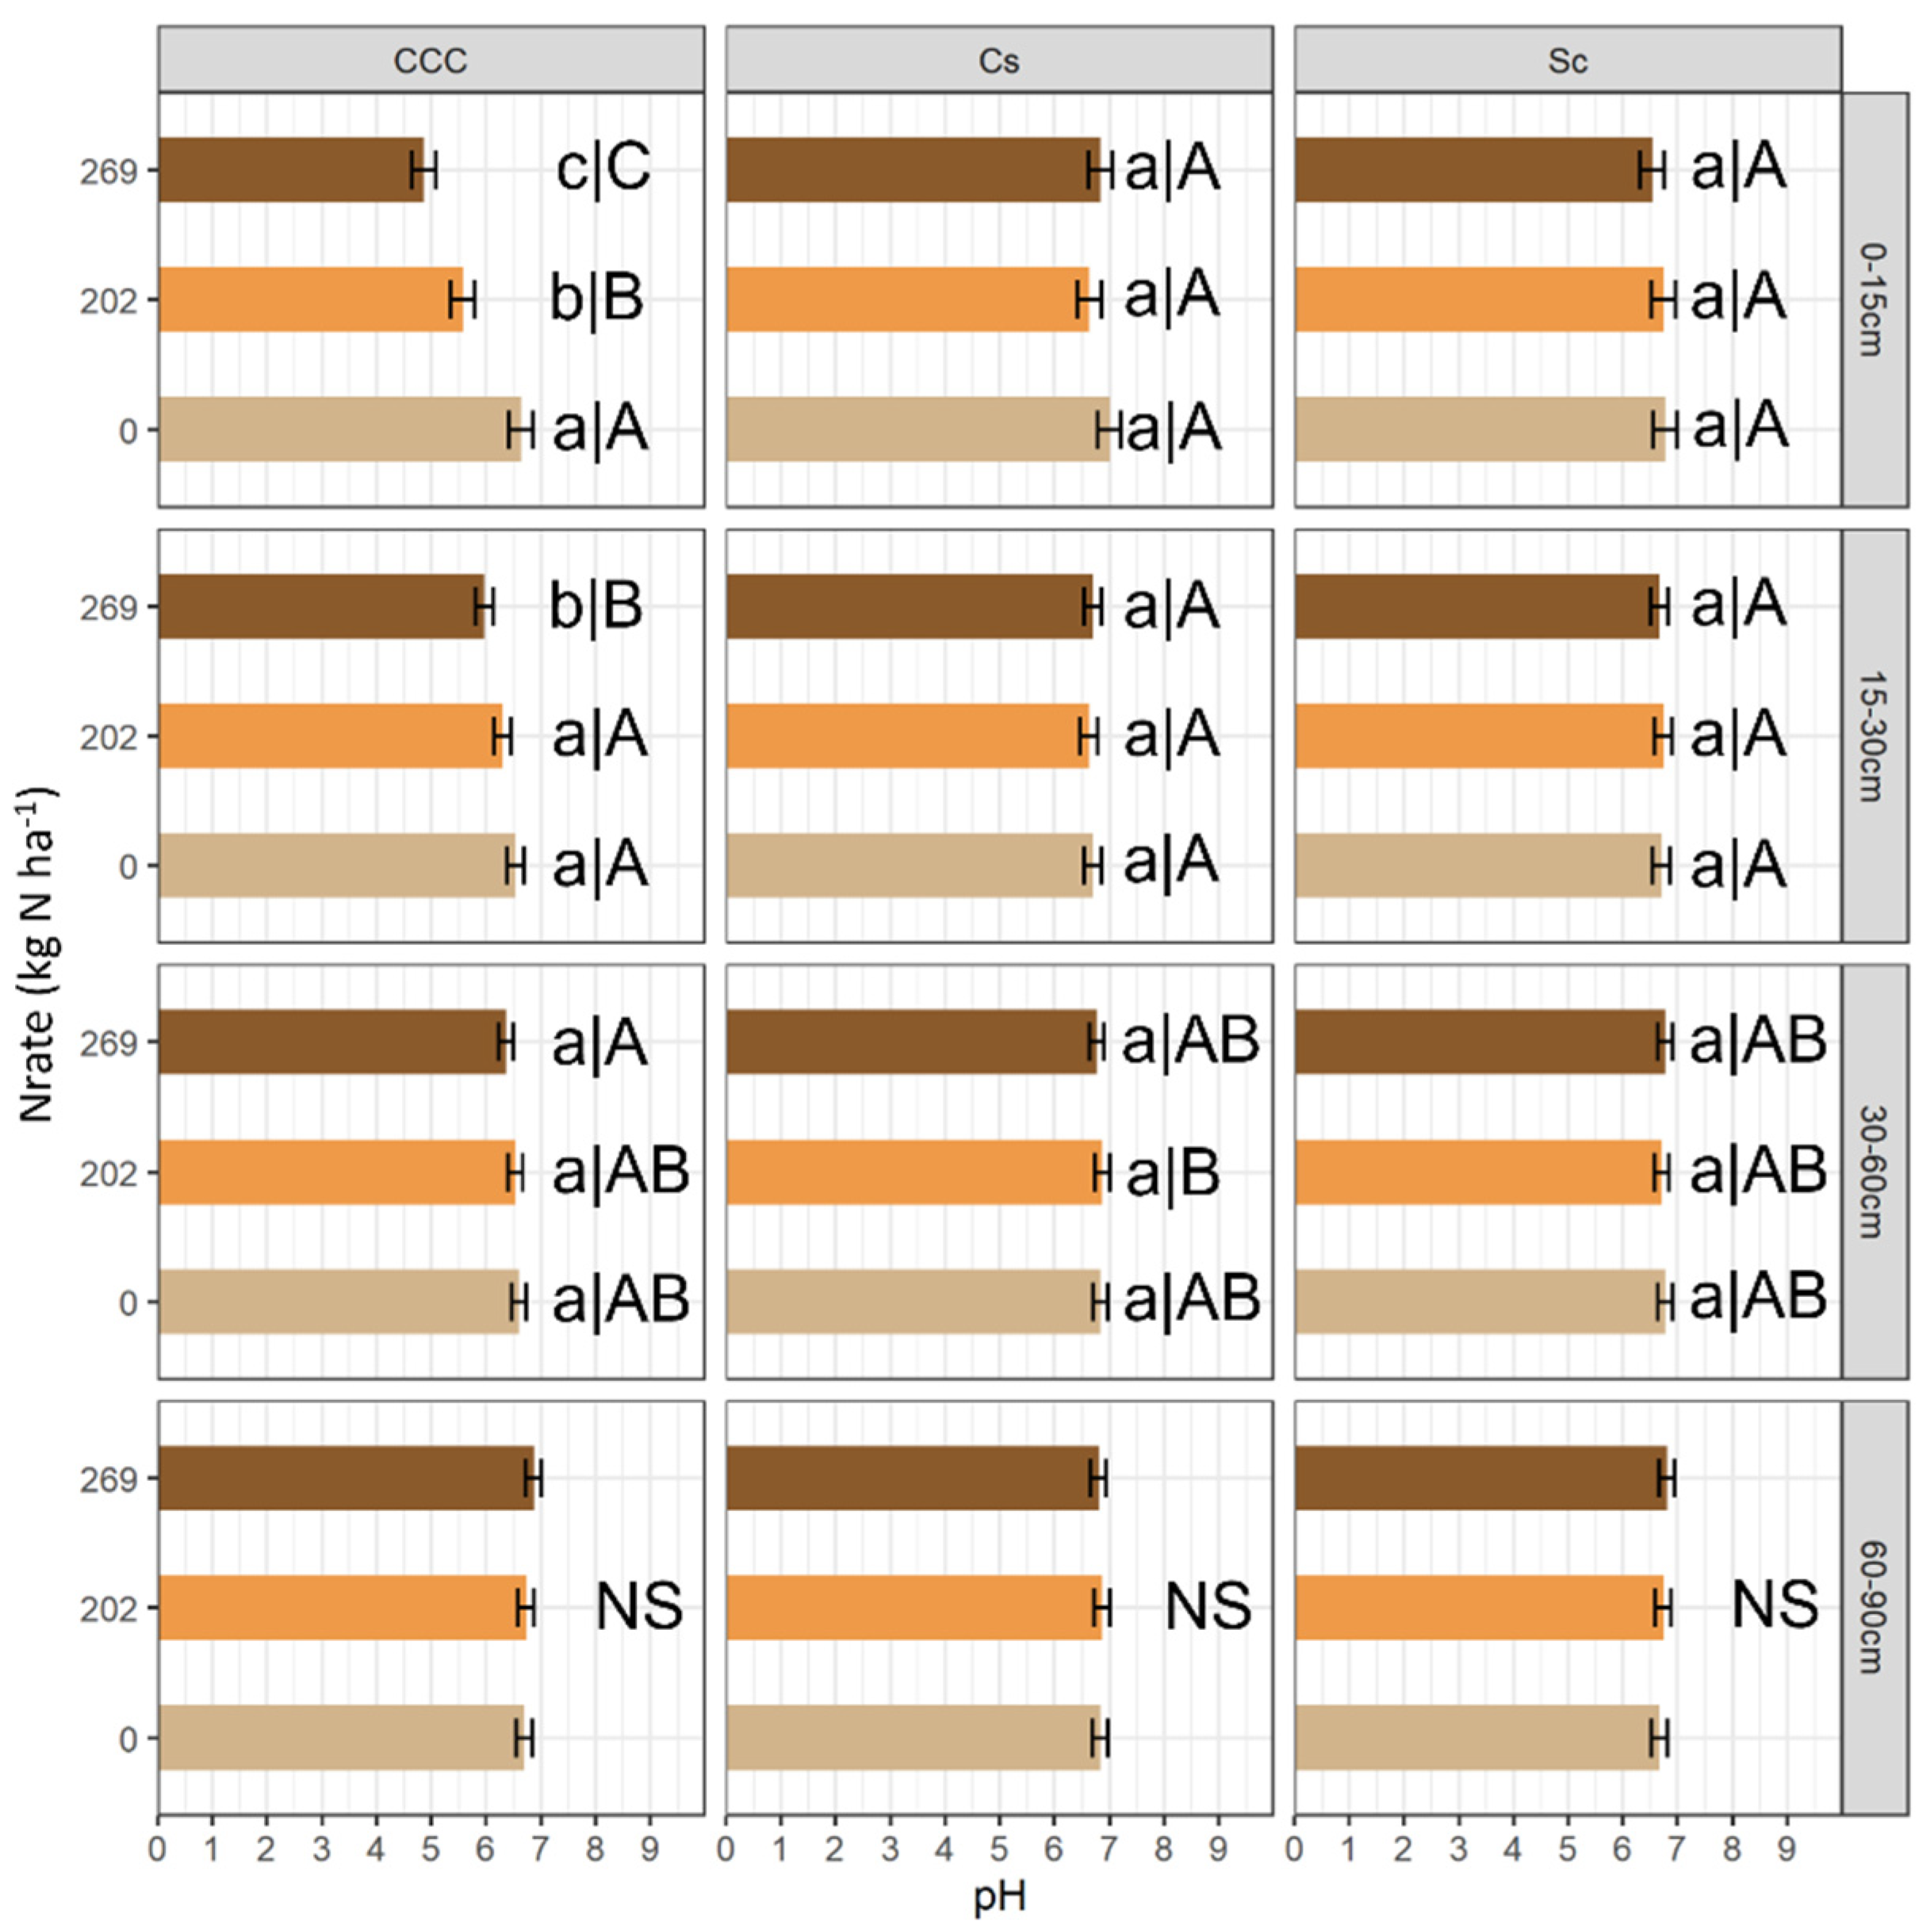
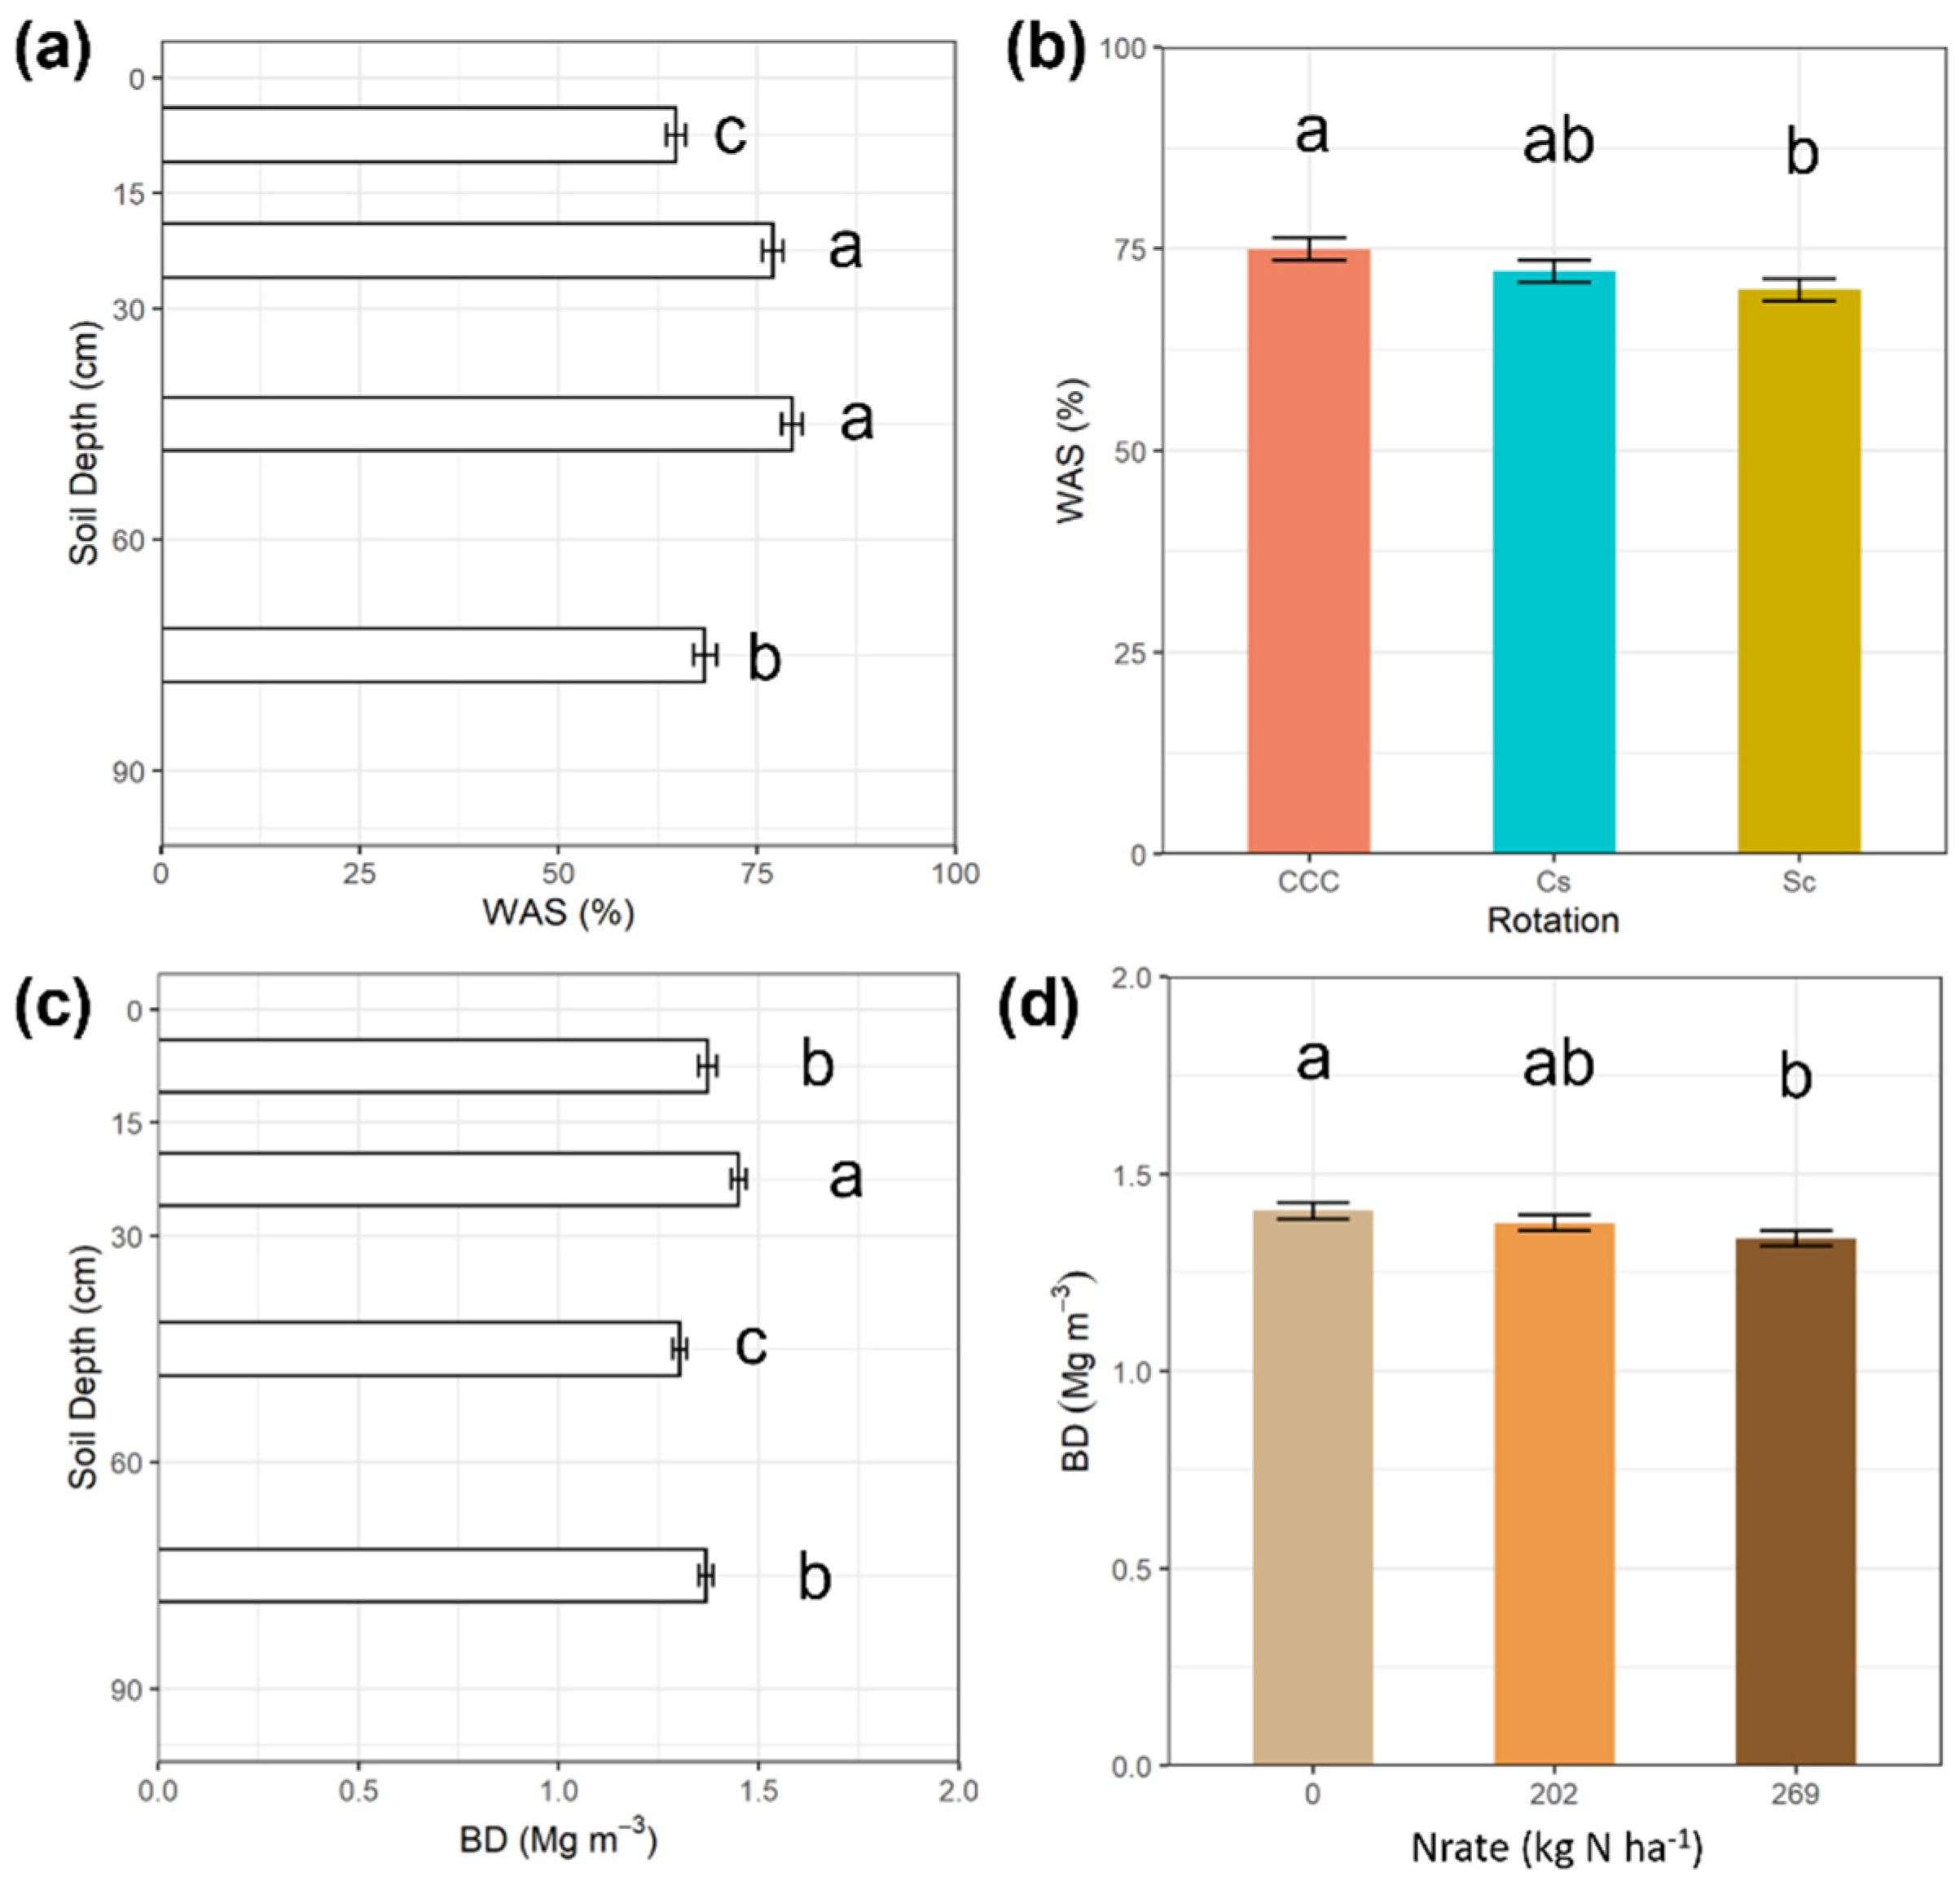
Linear mixed models were fit to each soil property using PROC GLIMMIX of SAS software version 9.4 (SAS Institute, Cary, NC, USA). Factors Rotation (Rot), N fertilizer rate (Nrate), and sampling depth (D) were considered fixed effects in the analyses of variance, while replicates (blocks) were considered random effects. Depth (D) was analyzed using a repeated-measures approach with the variance-covariance structure of heterogeneous autoregressive [type = arh(1)] for each soil variable consistently selected based on the lowest Akaike’s Information Criteria [38]. When appropriate, least-square means were separated using the lines option of the lsmeans statement, setting the probability of Type I error (α) at 0.05, and using a Tukey correction (adjust = Tukey). All plots were created within the R environment, version 4.1.0 [39], using the package ggplot2 [40].

3. Results

Table 1 shows the mean values, and standard error of the treatment mean (SEM) values for the soil properties of CEC, soil pH, SOC, WAS, and BD, while Table 2 shows the corresponding estimates for the nutrients, including N (as TIN comprised of NO3 and NH4+), available P, and K determined under each level of crop rotation (Rot), N fertilization rate (Nrate), and soil depth (D). Table 2 also includes the observed response of mean corn yields to crop rotation and fertilization for the duration of the experiment. Both tables display the probability values (p-values) and degrees of freedom (df) associated with the different sources of variation in the analysis of variance (ANOVA) of the effects of Nrate, Rot, D, and their interactions on the soil properties under study and the corn crop yields. A complete set of treatment means for all the treatment interactions, their SEM, df, and p-values, are provided in Supplementary Table S1.
Two-way interaction effects of Rot × Nrate (p = 0.002) and Rot × D (p = 0.003) were detected for CEC. For the Rot × Nrate effect, CEC was higher under N269 than other rates within Cs phase, but it did not differ significantly by Nrate within Sc and CCC. It was higher under N0 and N202 within Sc rotation than those of N0 and N202 within Cs rotation, and N202 and N269 within CCC rotation (Figure 2a). As for the Rot × D effect, CEC was lower within CCC than other rotation at 0–15 cm, lower within Cs than other rotations at 30–60 cm, and higher within Sc rotation than others at 60–90 cm; CEC did not differ significantly by rotation at 15–30 cm depth (Figure 2b). A three-way interaction effect of Rot × Nrate × D was detected for soil pH (p = 0.0351). The interaction indicates a differential response of both variables to fertilization for each rotation at successive depths. Within the CCC rotation, soil pH decreased significantly within the 0–15 cm depth as N rates increased, while it decreased with N269 at 15–30 cm (Figure 3).
All soil variables showed a statistically significant main effect from soil depth (p < 0.05). Soil depth was the only source of variation for SOC; SOC decreased consistently with depth. In turn, WAS was greater at intermediate depths (15–30, 30–60 cm) than within the top and lower layers (Figure 4a). There was a significant main effect of rotation on WAS, which was greater under CCC compared to Sc, with the Cs showing intermediate values (Figure 4b). Soil BD values were also affected by depth and a higher BD was recorded at the 15–30 cm of depth (Figure 4c). A statistically significant effect of N fertilization was determined for BD (p < 0.05) with the highest BD values associated with N0, and the lowest BD registered under N269 (Figure 4d).
There were marginally significant (p < 0.1) two-way interaction effects of Rot × D and Nrate × D on the TIN, the inorganic N, a summation of NO3 and NH4+. As shown in Figure 5a,b, TIN generally decreased with depth, but did not differ by N rate nor crop rotation within each depth. Unlike TIN, soil NO3 showed significant responses to both N rates and crop rotation, while NH4+ did not respond to them (Table 2). Thus, soil NO3 had significant (p < 0.05) interaction effects from Rot × Nrate and Rot × D, and marginally significant (p < 0.1) effects from Nrate × D. At 0–15 cm, NO3 was significantly greater with N269 than N0, while it did so for both N202 and N269 compared to N0 at 15–30 cm; NO3 did not differ by N rate at 30–60 cm and 60–90 cm depths (Figure 5c). Soil NO3 was significantly greater under CCC than Cs and Sc at 0–15 cm (Figure 5d). It was also greater under CCC than Sc at 15–30 cm; yet at the lower depths, NO3 did not differ by crop rotation (Figure 5d). Within CCC, NO3 increased significantly with higher N rates, but it did not respond to N rate under Cs and Sc (Figure 5e). On the other hand, soil depth was the only source of variation for NH4+, which decreased with depth (Figure 5f).
Soil available P had marginally significant (p < 0.1) Rot × Nrate interaction effect and a statistically significant (p < 0.05) Nrate × D interaction effect. Thus, under CCC, soil available P decreased with N application and with the inclusion of soybean, thereby being the greatest with N0 from CCC than all other Rot × Nrate combinations (Figure 6a). Likewise, soil P was greater with N0 than other N rates within the topmost depth, and greater than N202 at 15–30 cm (Figure 6b). Extractable soil K showed a statistically significant effect of the Rot × Nrate (p < 0.05) interaction term and a marginally significant effect of the Rot × D (p < 0.1) interaction. As with soil P, soil K was greater with N0 under CCC than under all other N rate × Rot combinations (Figure 6c). Soil extractable K was greater under CCC than Cs and Sc at depths 0–15 cm and 30–60 cm. The K levels were the lowest within 30–60 cm of depth (Figure 6d).
The average corn crop yield over the 36 years differed significantly (p < 0.0001) between rotations, N rate, and their interaction (Table 2). Overall, the mean corn grain yield over the experimental period was significantly (p < 0.0001) greater with N fertilization compared to N0, and following soybean in the corn-soybean rotation (CS) instead of after corn in the CCC (Figure 7). There were no significant yield increases between the top N levels, N202 and N269, over the study period. On average, corn yields increased 60% with N fertilization, and they increased the most when N was added into the unfertilized systems. Averaged across N rates, CS resulted in 31% higher average corn grain yield (11.07 Mg ha−1) than under CCC (8.44 Mg ha−1) (p < 0.0001) management. Increasing the rate of N application resulted in greater corn grain yield for both CCC and CS systems (Figure 7), with values ranging from 4.90 (N0) to 10.34 (N269) Mg ha−1 for CCC and 8.88 (N0) to 12.16 (N269) Mg ha−1 for CS (p < 0.0001). Compared to the unfertilized controls, the averaged corn grain yield in treatments was 45% higher in the CCC system and 37% higher in the CS system, indicating a greater response to N fertilizer in the CCC system. Likewise, within N0, rotated corn yielded 45% more than CCC. Yet, once N was supplied, the additional gain from soybean decreased to 17%. Because the experiment was originally set up to study corn yields, soybean yields were not collected by N rate and rotation, and were only reported as an average for the year. The mean crop yield for soybean through the study period was 3.83 Mg ha−1 (Figure 7).

4. Discussion

This study characterized the key soil properties after 36 years of N fertilization in continuous corn and corn-soybean rotation. Long-term, replicated, and consistently managed research plots are uncommon, and offer a unique opportunity to determine the long-term effects of these practices. Among the soil properties assessed, soil pH, CEC, and the levels of NO3, available P and K responded to both high N fertilization rates and crop rotation. As hypothesized, annual N fertilization to continuous corn greatly acidified the topsoil, from a pH of 6.5~7 with no fertilizer to a pH of 4.9 under the highest N rate (N269). Similarly, Barak, et al. [21] demonstrated soil acidification (from pH 5.6 to 4.8) from the increased concentration of H+ in the soil associated with the use of inorganic N fertilizer (0 to 156 kg N ha−1). Partially, greater crop yield from these practices may have contributed to the soil acidity as more crop roots excrete H+ during nutrient uptake [41]. Also, the present study showed that soil NO3 levels increased eight-fold in the top 15 cm soil with more N fertilizer added within the continuous corn rotation. Conversely, NH4+ levels remained unchanged despite the direct urea and NH4+ inputs, suggesting that they readily nitrified and translated into NO3 levels [42,43,44]. Thus, the H+ from nitrification would have contributed greatly to the observed soil acidification due to N input within corn monoculture. Yet, soil acidification from N fertilization was not evidenced within any phase of the corn-soybean rotation. A study by Behnke, et al. [45] explored the effects of 20 years of crop rotation and tillage on greenhouse gas (GHG) emissions, yields, and soil properties on similar soil. The authors reported soil acidification by pH 1.1 in the topsoil under continuous corn than corn–soybean rotation, similar to our results. Liebig, et al. [14] also showed more soil acidification under continuous corn than a corn–soybean rotation with increasing N rate up to 180 kg N ha−1. Thus, the effects of N fertilization on soil pH and NO3 may have not been pronounced within the corn-soybean rotation because it received N at half the frequency than corn monoculture. This may also explain why CEC tended to increase slightly during the soybean phase of the rotated corn. Soil acidification can lower CEC by decreasing the negatively charged sites in SOM, weathering the clay mineral interlayer, and replacing it with non-exchangeable hydroxyl-Al complexes [21]. Without N fertilizers during the soybean phase, these effects on CEC may have been minimized. Meanwhile, Huang, et al. [46] observed that the ammonia-oxidizing gene, amoA, increased with higher N rates under continuous corn within our experimental site, thereby providing the genomic evidence that such practices promote nitrification, subsequently acidifying the soil. Therefore, our results demonstrated that prolonged N fertilization to corn monoculture at above-optimal rates could greatly acidify even the fertile and resilient soils of the US Midwest, from which other symptoms of soil health degradation like iron toxicity and loss of soil fertility may arise [47]. The fact that our site had been limed across treatments further accentuates the impacts of these practices. Villamil, et al. [48] on the microbial signatures of our site have reported that the microbial indicators of acidophilic guilds became more abundant with N fertilization. Our results, together with theirs, suggested that soil acidification from frequent and high rate N fertilization may substantially disturb the soil microbial community.
Over the 36 years of experiment, N fertilization significantly increased crop yield and its residue returns (Figure 7). Also, as corn returns much more residue than soybean [49], corn monoculture typically produces more crop residues than a corn–soybean rotation in total. Based on this, we had hypothesized that SOC would increase with N fertilization and continuous corn. However, SOC responses to N rates and crop rotation were not statistically significant (Table 1). A study by Necpálová, et al. [50] compiled the SOC data from multiple long-term experimental sites in North Central USA (Wisconsin, Missouri, Iowa, Ohio, Michigan, Illinois, and Minnesota) to estimate the minimum detectable differences (MDDs) of SOC between treatments and time. The authors reported that the SOC should differ at least by 5.32 g C kg−1 to detect the statistically significant treatment effect in an experimental design with five replicates, based on the silt loam data from a site near ours. Their SOC dynamics modeling estimated that this much MDD would require about eighty years of experiments. Furthermore, they observed that soils with high SOC required greater MDD, which would be the case for SOC-rich Mollisols. On the contrary, at 0–15 cm depth, the present study observed that the highest N rate increased mean SOC only by 0.30 g kg−1 compared to unfertilized control (p = 0.313; Table 1); continuous corn rotation increased SOC only by 2.28 g kg−1 compared to the soybean phase of corn-soybean rotation (p = 0.284; Table 1). Thus, finding no statistically significant differences in SOC between treatments despite 36 years of history is unsurprising, and it affirmed the high productivity of this region’s soils.
The SOC of the Midwest region that this study’s experimental site represents is resilient to change, as demonstrated by Necpálová, et al. [50]. This SOC resilience may also result from the positive priming effect that offsets the labile SOC from continuous corn rotation and N fertilization after SOC has saturated the protected SOM fractions [51]. A comparable study by Brown, et al. [52], with similar N rates on continuous corn over Mollisols in Iowa for 12 years, also reported no significant N fertilization effects on mean SOC. The authors further observed no significant N rate impact on the protected SOC fraction, which is a factor of SOC saturation level. Therefore, the excess SOC unprotected by the soil aggregates is prone to mineralization. Chen, et al. [53] described two positive priming effect theories that could explain increased SOC mineralization with continuous corn rotation and N fertilization: the microbial N mining theory and the microbial stoichiometry theory. With the N-mining theory, the addition of residues of high C:N ratio deprives the soil microbes of readily-available N, thereby prompting them to procure N by decomposing SOM [53]. Thus, although corn monoculture returns more crop residues in total than corn-soybean rotation, its corn residues higher in C:N would trigger rapid decomposition of SOM and mineralize SOC in the process, thereby offsetting the differences in SOC between crop rotations. Meanwhile, the stoichiometry theory holds that soil with a stoichiometric balance between rich C from greater residue return and N from fertilizers would trigger accelerated SOM decomposition. This then results in a faster turnover between fresh residue input and SOM, which can offset the SOC input from increased residue return from N fertilization. This was indeed observed by Poffenbarger, et al. [54], who found faster C mineralization with above-optimal N input.
Crop rotation and high N rates also had some impacts on the physical soil properties. Though WAS was not affected by N rate, it decreased by 6.7% under the soybean phase of the corn-soybean rotation compared to continuous corn (Figure 4b). Soybean residues have lower C:N and decompose faster than corn residues [26]. Also, soybean residues have a lower phenolic acid content [27], leading to less stable soil aggregates that may explain the decreased WAS during the soybean phase. On the contrary, shorter experiments in similar cropping systems by Hoss, et al. [19] (12 years) and Zuber, et al. [20] (15 years) found no significant changes in WAS between corn monoculture and rotated corn. Perhaps, changes in WAS from different crop residues may have to accumulate over the years. Since the soil aggregate is a complex unit of soil mineral particles, microbes, and organic matter, higher WAS implies that the soil microbial community may better withstand the stresses from physical disturbance and wetting cycles [55]. An Australian study by Trivedi, et al. [56] on the relationships between crop rotation, soil aggregates, and the microbiome reported that agricultural practices with greater residue returns enhanced the soil aggregation and richer microbial inhabitants. Their results agree with ours where WAS increased under continuous corn due to greater residue return than rotated corn. Further analysis of the soil microbiome may uncover whether changes in WAS enhance agriculturally beneficial microbial guilds. Moreover, stable soil aggregates become a long-term source of SOM by securing it in their structure [55,57,58]. Unlike WAS, which was unaffected by N fertilization, soil BD decreased with higher N rate as a direct result of the increased level of residues returned to the soil, an effect that, in turn, increases the porosity of the soil, favoring crop root growth [23]. A similar decrease in BD with higher N rates has been reported by Halvorson, et al. [59], who compared the effects of N fertilization after ten years in a Colorado Mollisol and reported that BD decreased by 7.4% from 0 kg N ha−1 to 90 kg N ha−1. Also, Jagadamma, et al. [23] reported 6.7% decrease in BD from unfertilized soils to the highest N rate. Overall, the findings of the present study on the soil physical properties of WAS and BD showed the benefits of returning corn residues to the soil, compared to soybean residues, while N fertilization enhances this effect by increasing the volume of such residues.
As hypothesized, the soil nutrients were sensitive to N fertilization and crop rotation. Higher N rates and corn monoculture that received them more frequently increased the total surface inorganic N (Figure 5a,b). As discussed above, a significant increase in NO3 directly from fertilizers and from nitrification of NH4+ input drove this change. Increased levels of NO3 in the soil under corn monoculture have been related to increased N2O emissions as more substrates for denitrification become available [17]. For example, Behnke, et al. [60] on the effects of crop rotation and tillage on soil properties and N-cycling functional genes observed that both amoA and denitrifying nirK increased with corn monoculture, which indicated a greater potential for microbial NO3 and N2O production. Thus, in addition to significant soil acidification discussed earlier, cropping systems receiving excessive N increase the risk of nutrient loss via not only NO3 leaching, but also N2O emission. As for soil P and K, Congreves, et al. [18] found that soil nutrients, including P and K, depleted differently under various crop rotations, leading to greater soil P and K levels under continuous corn (44 and 202 mg kg−1, respectively) and corn-soybean rotations (40 and 202 mg kg−1, respectively) than under continuous soybean (34 and 172 mg kg−1, respectively). The authors attributed these changes in soil P and K dynamics to the differences in nutrients returned as crop residues, dictated by either the innate crop biomass production and quality, or the amount of N fertilizer applied in a cropping system. Likewise, the results of the present study showed that the available levels of soil P and K were significantly greater with no fertilizer and under continuous corn management (23.08 and 147.50 mg kg−1, respectively) than all other treatment level combinations (12.40 and 99.58 mg kg−1, respectively, on average) (Figure 6a,c). As the corn yield increased with higher N rates, the crop uptake of P and K would increase accordingly [17,20]. The highest P and K levels were also found within the topsoil where residues accumulate (Figure 6b,d). While these nutrients decreased in the intermediate depths that are primarily explored by the crop root system, they slightly increased in the deeper layers that are closer to the parent materials [61,62]. Given the importance of P levels in these intensively managed systems that trigger environmental consequences due to unintentional P losses via runoff from agricultural fields, further studies should explore how N fertilization and rotation practices influence soil P dynamics and stocks throughout the soil profile, informing P budgets for comprehensive agroecosystem P management.
In 2004, Jagadamma, et al. [13,23] characterized the top 30 cm of the soil at the same experimental site as this study and used a multivariate approach to select soil properties that can predict crop yields. Jagadamma, et al. [23] showed that higher N rates acidified the soil from around pH 7 down to pH 5.5 within corn monoculture, and decreased BD by up to 9.1% and K+ levels by around 25%, similar to our findings. They also found greater soil N with higher N rates, although their report did not separate the contributions of NO3 and NH4+. Meanwhile, Jagadamma, et al. [23] reported that WAS increased by up to 25% with higher N rates under continuous corn rotation, but not within corn–soybean rotation. Therefore, the comparison between this study and Jagadamma et al. (2008) suggests that this agricultural system generally remained stable in the 13 years since this first report. Furthermore, although this study characterized the soils under typical cropping systems of the US Midwest, its implications extend to similar highly productive regions in the world, like the Northeast China and Argentinian Pampas. Corn is a major part of the cropping systems of the Northeast region of China, which often receives heavy N rates up to 600 kg N ha−1 [63,64]. Since reports from long-term field experiments are also uncommon in other parts of the world, the results from this study can provide valuable outlooks on the extent of soil acidification and N loss risks that excessive N fertilization on corn monoculture may have in other productive agricultural regions.

5. Conclusions

The assessment of soil physical and chemical properties to a depth of 90 cm, following 36 years of crop rotation and N fertilization, highlighted the unique resilience of Mollisols of the US Midwest region. While this study detected important changes in pH and nutrients as hypothesized following nearly four decades of treatments, the modifications measured for most other variables, including SOC, were minimal. Long-term management practices that reduce soil pH via accelerated nitrification are known to pose a significant threat to the environment through increased GHG emissions and nitrate leaching. Within the topsoil of continuous corn system, soil pH had nearly a two-unit reduction in soil pH and an eight-fold increase in soil NO3 from the highest fertilizer rate compared to those of unfertilized controls, implying substantial nitrification in this system. A decrease in soil aggregate stability during the soybean phase of the rotated corn system, points to the differences in tissue composition between the corn and soybean plants. Increased yields with fertilization within the continuous corn system improved the bulk density of the soil, likely associated with the volume of residues returned. On the other hand, SOC remained unaffected by the treatments, further demonstrating the stability of these soils. These Mollisols are resilient, yet the measured extents of soil acidification and N pollution flag the possibility of substantial soil health degradation that warrants further scrutiny on the practices that triggered them. The results of this study suggest that a deeper understanding of the microbial nutrient cycling dynamics within these highly productive agroecosystems should complement the typical chemical and physical properties studied here. Likewise, exploring management practices that encourage temporal and spatial diversification to alleviate nutrient losses, such as cover cropping or split N application, would help answer questions on the sustainability of current practices.

Supplementary Materials

The following supporting information can be downloaded at: https://0-www-mdpi-com.brum.beds.ac.uk/article/10.3390/agronomy12030625/s1, Table S1: Mean values, standard error of the means (SEM), degrees of freedom (df), and probability value (p-value) for the interaction effects of N fertilization rate (N rate), crop rotation, and depth for cation exchange capacity (CEC, cmolc kg−1), soil pH, soil organic matter (SOM, %), soil organic C (SOC, g kg−1), water aggregate stability (WAS, %), bulk density (BD, Mg m−3), nitrate (NO3, mg kg−1), ammonium (NH4+, mg kg−1), total inorganic nitrogen (TIN, mg kg−1), available phosphorus (P, mg kg−1), and potassium (K, mg kg−1).

Author Contributions

Conceptualization, M.B.V.; Methodology, N.K. and G.D.B.; Formal analysis, M.B.V. and N.K.; Resources, M.B.V.; Data curation, M.B.V.; Writing—original draft preparation, N.K. and M.B.V.; Visualization, N.K.; Writing—review and editing, G.D.B. and M.B.V.; Supervision, project administration, and funding acquisition, M.B.V. All authors have read and agreed to the published version of the manuscript.

Funding

This research was funded by USDA National Institute of Food and Agriculture, with a HATCH Grant No. ILLU-802-978, and award No. AG2018-67019-27807.

Institutional Review Board Statement

Not applicable.

Informed Consent Statement

Not applicable.

Data Availability Statement

Data is available via the Mendeley Data repository, v2, https://data.mendeley.com/datasets/2j5hs3xs96/2. Accessed on 7 February 2022.

Acknowledgments

We are thankful to Marty Johnson and Greg Steckel for their contribution in setting up and managing the experimental plots, and to Emerson Nafziger for sharing the historic corn yield data from records collected at the Northwestern Illinois Agricultural Research and Demonstration Center. We acknowledge the valuable assistance of Samuel Kato for his everyday help with field and lab activities.

Conflicts of Interest

The authors declare that they have no conflict of interest.

References

  1. Datnoff, L.E.; Elmer, W.H.; Huber, D.M. Mineral Nutrition and Plant Disease; American Phytopathological Society: St. Paul, MN, USA, 2007; p. 278. [Google Scholar]
  2. FAO. World Fertilizer Trends and Outlook to 2022; FAO: Rome, Italy, 2019. [Google Scholar]
  3. Liu, J.; You, L.; Amini, M.; Obersteiner, M.; Herrero, M.; Zehnder, A.J.; Yang, H. A high-resolution assessment on global nitrogen flows in cropland. Proc. Natl. Acad. Sci. USA 2010, 107, 8035–8040. [Google Scholar] [CrossRef] [PubMed] [Green Version]
  4. Erisman, J.W.; Sutton, M.A.; Galloway, J.; Klimont, Z.; Winiwarter, W. How a century of ammonia synthesis changed the world. Nat. Geosci. 2008, 1, 636–639. [Google Scholar] [CrossRef]
  5. USDA-NASS. Crop Production; USDA-NASS: Washington, DC, USA, 2020.
  6. USDA-ERS (Ed.) Fertilizer Use and Price; USDA-ERS: Washington, DC, USA, 2020.
  7. Hatfield, J.L.; Wright-Morton, L.; Hall, B. Vulnerability of grain crops and croplands in the Midwest to climatic variability and adaptation strategies. Clim. Change 2018, 146, 263–275. [Google Scholar] [CrossRef] [Green Version]
  8. Socolar, Y.; Goldstein, B.R.; de Valpine, P.; Bowles, T.M. Biophysical and policy factors predict simplified crop rotations in the US Midwest. Environ. Res. Lett. 2021, 16, 054045. [Google Scholar] [CrossRef]
  9. Khan, M.N.; Mohammad, F. Eutrophication: Challenges and Solutions. In Eutrophication: Causes, Consequences and Control; Ansari, A.A., Gill, S.S., Eds.; Springer: Dordrecht, The Netherlands, 2014; Volume 2, pp. 1–15. [Google Scholar]
  10. Davidson, E.A.; Kanter, D. Inventories and scenarios of nitrous oxide emissions. Environ. Res. Lett. 2014, 9, 105012. [Google Scholar] [CrossRef]
  11. Baumhardt, R.L.; Stewart, B.A.; Sainju, U.M. North American Soil Degradation: Processes, Practices, and Mitigating Strategies. Sustainability 2015, 7, 2936–2960. [Google Scholar] [CrossRef] [Green Version]
  12. Karlen, D.L.; Veum, K.S.; Sudduth, K.A.; Obrycki, J.F.; Nunes, M.R. Soil health assessment: Past accomplishments, current activities, and future opportunities. Soil Till. Res. 2019, 195, 104365. [Google Scholar] [CrossRef]
  13. Jagadamma, S.; Lal, R.; Hoeft, R.G.; Nafziger, E.D.; Adee, E.A. Nitrogen fertilization and cropping systems effects on soil organic carbon and total nitrogen pools under chisel-plow tillage in Illinois. Soil Till. Res. 2007, 95, 348–356. [Google Scholar] [CrossRef]
  14. Liebig, M.A.; Varvel, G.E.; Doran, J.W.; Wienhold, B.J. Crop sequence and nitrogen fertilization effects on soil properties in the Western Corn Belt. Soil Sci. Soc. Am. J. 2002, 66, 596–601. [Google Scholar] [CrossRef] [Green Version]
  15. Russell, A.E.; Laird, D.A.; Mallarino, A.P. Nitrogen fertilization and cropping system impacts on soil quality in Midwestern Mollisols. Soil Sci. Soc. Am. J. 2006, 70, 249–255. [Google Scholar] [CrossRef] [Green Version]
  16. Stone, D.L.R.; Whitney, D.A.; Janssen, K.A.; Long, J.H. Soil properties after twenty years of fertilization with different nitrogen sources. Soil Sci. Soc. Am. J. 1991, 55, 1097–1100. [Google Scholar] [CrossRef]
  17. Behnke, G.D.; Zuber, S.M.; Pittelkow, C.M.; Nafziger, E.D.; Villamil, M.B. Long-term crop rotation and tillage effects on soil greenhouse gas emissions and crop production in Illinois, USA. Agric. Ecosyst. Environ. 2018, 261, 62–70. [Google Scholar] [CrossRef]
  18. Congreves, K.A.; Hayes, A.; Verhallen, E.A.; Van Eerd, L.L. Long-term impact of tillage and crop rotation on soil health at four temperate agroecosystems. Soil Till. Res. 2015, 152, 17–28. [Google Scholar] [CrossRef]
  19. Hoss, M.; Behnke, G.D.; Davis, A.S.; Nafziger, E.D.; Villamil, M.B. Short corn rotations do not improve soil quality, compared with corn monocultures. Agron. J. 2018, 110, 1274–1288. [Google Scholar] [CrossRef] [Green Version]
  20. Zuber, S.M.; Behnke, G.D.; Nafziger, E.D.; Villamil, M.B. Crop rotation and tillage effects on soil physical and chemical properties in Illinois. Agron. J. 2015, 107, 971–978. [Google Scholar] [CrossRef] [Green Version]
  21. Barak, P.; Jobe, B.O.; Krueger, A.R.; Peterson, L.A.; Laird, D.A. Effects of long-term soil acidification due to nitrogen fertilizer inputs in Wisconsin. Plant Soil 1997, 197, 61–69. [Google Scholar] [CrossRef]
  22. Obour, A.K.; Mikha, M.M.; Holman, J.D.; Stahlman, P.W. Changes in soil surface chemistry after fifty years of tillage and nitrogen fertilization. Geoderma 2017, 308, 46–53. [Google Scholar] [CrossRef]
  23. Jagadamma, S.; Lal, R.; Hoeft, R.G.; Nafziger, E.D.; Adee, E.A. Nitrogen fertilization and cropping system impacts on soil properties and their relationship to crop yield in the central Corn Belt, USA. Soil Till. Res. 2008, 98, 120–129. [Google Scholar] [CrossRef]
  24. Russell, A.E.; Cambardella, C.A.; Laird, D.A.; Jaynes, D.B.; Meek, D.W. Nitrogen fertilizer effects on soil carbon balances in Midwestern U.S. agricultural systems. Ecol. Appl. 2009, 19, 1102–1113. [Google Scholar] [CrossRef] [Green Version]
  25. Bowles, T.M.; Atallah, S.S.; Campbell, E.E.; Gaudin, A.C.; Wieder, W.R.; Grandy, A.S. Addressing agricultural nitrogen losses in a changing climate. Nat. Sustain. 2018, 1, 399–408. [Google Scholar] [CrossRef]
  26. Ajwa, H.A.; Tabatabai, M.A. Decomposition of different organic materials in soils. Biol. Fertil. Soils 1994, 18, 175–182. [Google Scholar] [CrossRef]
  27. Martens, D.A. Management and crop residue influence soil aggregate stability. J. Environ. Qual. 2000, 29, 723–727. [Google Scholar] [CrossRef] [Green Version]
  28. Illinois State Water Survey. Illinois Climate Normals; Illinois State Water Survey: Champaign, IL, USA, 2010. [Google Scholar]
  29. Soil Survey Staff; NRCS; USDA. Web Soil Survey. Available online: http://websoilsurvey.sc.egov.usda.gov/ (accessed on 10 November 2020).
  30. Nafziger, E. Illinois Agronomy Handbook; University of Illinois Extension: Urbana, IL, USA, 2009; Volume 224. [Google Scholar]
  31. Blake, G.R.; Hartge, K.H. Bulk Density. In Methods of Soil Analysis: Part 1 Physical and Mineralogical Methods, 2nd ed.; Klute, A., Ed.; American Society of Agronomy: Madison, WI, USA, 1986; Volume 5, pp. 363–375. [Google Scholar]
  32. Schulte, E.; Hopkins, B. Estimation of soil organic matter by weight loss-on-ignition. Soil Org. Matter Anal. Interpret. 1996, 46, 21–31. [Google Scholar]
  33. Konen, M.E.; Jacobs, P.M.; Burras, C.L.; Talaga, B.J.; Mason, J.A. Equations for predicting soil organic carbon using loss-on-ignition for north central US soils. Soil Sci. Soc. Am. J. 2002, 66, 1878–1881. [Google Scholar] [CrossRef]
  34. McLean, E. Soil pH and lime requirement. In Methods of Soil Analysis: Part 2 Chemical and Microbiological Properties; American Society of Agronomy: Madison, WI, USA, 1983; Volume 9, pp. 199–224. [Google Scholar]
  35. Bray, R.H.; Kurtz, L.T. Determination of total, organic, and available forms of phosphorus in soils. Soil Sci. 1945, 59, 39–46. [Google Scholar] [CrossRef]
  36. Mehlich, A. Mehlich 3 soil test extractant: A modification of Mehlich 2 extractant. Commun. Soil Sci. Plant Anal. 1984, 15, 1409–1416. [Google Scholar] [CrossRef]
  37. Ross, D.S.; Ketterings, Q. Recommended methods for determining soil cation exchange capacity. Recomm. Soil Test. Proced. Northeast. USA 1995, 493, 62. [Google Scholar]
  38. Littell, R.C.; Milliken, G.A.; Stroup, W.W.; Wolfinger, R.D.; Oliver, S. SAS for Mixed Models; SAS Institute: Cary, NC, USA, 2006. [Google Scholar]
  39. R Core Team. R: A Language and Environment for Statistical Computing; 4.1.0; R Foundation for Statistical Computing: Vienna, Austria, 2019. [Google Scholar]
  40. Wickham, H. Ggplot2: Elegant Graphics for Data Analysis; Springer: New York, NY, USA, 2016. [Google Scholar] [CrossRef]
  41. Tang, C.; Rengel, Z. Role of plant cation/anion uptake ratio in soil acidification. In Handbook of Soil Acidity, 1st ed.; Rengel, Z., Ed.; CEC Press: New York, NY, USA, 2003. [Google Scholar] [CrossRef]
  42. Coskun, D.; Britto, D.T.; Shi, W.; Kronzucker, H.J. Nitrogen transformations in modern agriculture and the role of biological nitrification inhibition. Nat. Plants 2017, 3, 17074. [Google Scholar] [CrossRef]
  43. Di, H.J.; Cameron, K.C. Nitrate leaching in temperate agroecosystems: Sources, factors and mitigating strategies. Nutr. Cycl. Agroecosystems 2002, 64, 237–256. [Google Scholar] [CrossRef]
  44. Lin, B.; Sakoda, A.; Shibasaki, R.; Suzuki, M. A modelling approach to global nitrate leaching caused by anthropogenic fertilisation. Water Res. 2001, 35, 1961–1968. [Google Scholar] [CrossRef]
  45. Behnke, G.D.; Pittelkow, C.; Nafziger, E.; Villamil, M.B. Exploring the relationships between greenhouse gas emissions, yields, and soil properties in cropping systems. Agriculture 2018, 8, 62. [Google Scholar] [CrossRef] [Green Version]
  46. Huang, L.; Riggins, C.W.; Rodríguez-Zas, S.; Zabaloy, M.C.; Villamil, M.B. Long-term N fertilization imbalances potential N acquisition and transformations by soil microbes. Sci. Total Environ. 2019, 691, 562–571. [Google Scholar] [CrossRef]
  47. Rengel, Z. Soil pH, Soil Health and Climate Change. In Soil Health and Climate Change; Singh, B.P., Cowie, A.L., Chan, K.Y., Eds.; Springer: Berlin, Germany; Heidelberg, Germany, 2011; pp. 69–85. [Google Scholar]
  48. Villamil, M.B.; Kim, N.; Riggins, C.W.; Zabaloy, M.C.; Allegrini, M.; Rodríguez-Zas, S.L. Microbial Signatures in Fertile Soils Under Long-Term N Management. Front. Soil Sci. 2021, 1, 24. [Google Scholar] [CrossRef]
  49. Lal, R. World crop residues production and implications of its use as a biofuel. Environ. Int. 2005, 31, 575–584. [Google Scholar] [CrossRef] [PubMed]
  50. Necpálová, M.; Anex, R.P.; Kravchenko, A.N.; Abendroth, L.J.; Del Grosso, S.J.; Dick, W.A.; Helmers, M.J.; Herzmann, D.; Lauer, J.G.; Nafziger, E.D.; et al. What does it take to detect a change in soil carbon stock? A regional comparison of minimum detectable difference and experiment duration in the north central United States. J. Soil. Water. Conserv. 2014, 69, 517–531. [Google Scholar] [CrossRef] [Green Version]
  51. Lal, R. Soil carbon dynamics in cropland and rangeland. Environ. Pollut. 2002, 116, 353–362. [Google Scholar] [CrossRef]
  52. Brown, K.H.; Bach, E.M.; Drijber, R.A.; Hofmockel, K.S.; Jeske, E.S.; Sawyer, J.E.; Castellano, M.J. A long-term nitrogen fertilizer gradient has little effect on soil organic matter in a high-intensity maize production system. Glob. Change Biol. 2014, 20, 1339–1350. [Google Scholar] [CrossRef]
  53. Chen, R.; Senbayram, M.; Blagodatsky, S.; Myachina, O.; Dittert, K.; Lin, X.; Blagodatskaya, E.; Kuzyakov, Y. Soil C and N availability determine the priming effect: Microbial N mining and stoichiometric decomposition theories. Glob. Change Biol. 2014, 20, 2356–2367. [Google Scholar] [CrossRef]
  54. Poffenbarger, H.J.; Barker, D.W.; Helmers, M.J.; Miguez, F.E.; Olk, D.C.; Sawyer, J.E.; Six, J.; Castellano, M.J. Maximum soil organic carbon storage in Midwest US cropping systems when crops are optimally nitrogen-fertilized. PLoS ONE 2017, 12, e0172293. [Google Scholar] [CrossRef]
  55. Wilpiszeski, R.L.; Aufrecht, J.A.; Retterer, S.T.; Sullivan, M.B.; Graham, D.E.; Pierce, E.M.; Zablocki, O.D.; Palumbo, A.V.; Elias, D.A. Soil aggregate microbial communities: Towards understanding microbiome interactions at biologically relevant scales. Appl. Environ. Microbiol. 2019, 85, e00324-19. [Google Scholar] [CrossRef] [Green Version]
  56. Trivedi, P.; Delgado-Baquerizo, M.; Jeffries, T.C.; Trivedi, C.; Anderson, I.C.; Lai, K.; McNee, M.; Flower, K.; Pal Singh, B.; Minkey, D.; et al. Soil aggregation and associated microbial communities modify the impact of agricultural management on carbon content. Environ. Microbiol. 2017, 19, 3070–3086. [Google Scholar] [CrossRef]
  57. Lynch, J.M.; Bragg, E. Microorganisms and Soil Aggregate Stability; Springer: New York, NY, USA, 1985; Volume 2, pp. 133–171. [Google Scholar]
  58. Trivedi, P.; Rochester, I.J.; Trivedi, C.; Van Nostrand, J.D.; Zhou, J.; Karunaratne, S.; Anderson, I.C.; Singh, B.K. Soil aggregate size mediates the impacts of cropping regimes on soil carbon and microbial communities. Soil Biol. Biochem. 2015, 91, 169–181. [Google Scholar] [CrossRef]
  59. Halvorson, A.D.; Reule, C.A.; Follett, R.F. Nitrogen fertilization effects on soil carbon and nitrogen in a dryland cropping system. Soil Sci. Soc. Am. J. 1999, 63, 912–917. [Google Scholar] [CrossRef]
  60. Behnke, G.D.; Zabaloy, M.C.; Riggins, C.W.; Rodríguez-Zas, S.; Huang, L.; Villamil, M.B. Acidification in corn monocultures favor fungi, ammonia oxidizing bacteria, and nirK-denitrifier groups. Sci. Total Environ. 2020, 720, 137514. [Google Scholar] [CrossRef] [PubMed]
  61. Anderson, D.W. The effect of parent material and soil development on nutrient cycling in temperate ecosystems. Biogeochemistry 1988, 5, 71–97. [Google Scholar] [CrossRef]
  62. Simonsson, M.; Andersson, S.; Andrist-Rangel, Y.; Hillier, S.; Mattsson, L.; Öborn, I. Potassium release and fixation as a function of fertilizer application rate and soil parent material. Geoderma 2007, 140, 188–198. [Google Scholar] [CrossRef]
  63. Yu, Q.; Wu, W.; Verburg, P.H.; van Vliet, J.; Yang, P.; Zhou, Q.; Tang, H. A survey-based exploration of land-system dynamics in an agricultural region of Northeast China. Agric. Syst. 2013, 121, 106–116. [Google Scholar] [CrossRef]
  64. Ju, X.-T.; Xing, G.-X.; Chen, X.-P.; Zhang, S.-L.; Zhang, L.-J.; Liu, X.-J.; Cui, Z.-L.; Yin, B.; Christie, P.; Zhu, Z.-L.; et al. Reducing environmental risk by improving N management in intensive Chinese agricultural systems. Proc. Natl. Acad. Sci. USA 2009, 106, 3041–3046. [Google Scholar] [CrossRef] [Green Version]
Figure 1. Reference map of the long-term experimental site at Monmouth, Illinois, U.S.A. with its coordinates.
Agronomy 12 00625 g001
Figure 2. (a) Mean values of cation exchange capacity (CEC, cmolc kg−1) by crop rotation and N fertilization rate, and (b) by crop rotation and depth. In all cases, bars show the mean values and error bars represent the standard error of the treatment means. The placement of bars within each depth range (0–15, 15–30, 30–60, and 60–90; cm) does not signify differences in sampling depth. Crop rotations are continuous corn (CCC), and the corn-soybean rotation (CS) as corn Cs and soybean (Sc) phase, respectively. The N fertilization rates were 0, 202, and 269 (kg N ha−1). Within each panel and a given depth, means followed by the same lowercase letters are not statistically different (α = 0.05). Lack of statistically significant differences among treatment means within a given depth is indicated by “NS”.
Agronomy 12 00625 g002
Figure 3. Mean soil pH under each crop rotation (panel columns), N fertilization rate (Y-axis), and depth (panel rows). Bars show the mean values and the error bars represent the standard error of the treatment means. Crop rotations are continuous corn (CCC), and the corn-soybean rotation (CS) as corn Cs and soybean (Sc) phase, respectively. The N fertilization rates were 0, 202, and 269 (kg N ha−1). For a given depth and within each rotation, mean pH values for each N rate followed by the same lowercase letter are not statistically different (α = 0.05). Within each depth and across rotations, mean pH values followed by the same uppercase letter are not statistically different (α = 0.05). Lack of statistically significant differences among treatment means within a given depth is indicated by “NS”.
Agronomy 12 00625 g003
Figure 4. Mean water aggregate stability of the soil aggregates (WAS, %) determined for each (a) depth and (b) crop rotation. Mean soil bulk density (BD, Mg m−3) determined for each (c) depth and (d) N fertilization rate. In both plots, bars show the mean values and the error bars represent the standard error of the treatment means. Crop rotations are continuous corn (CCC), and the corn-soybean rotation (CS) as corn Cs and soybean (Sc) phase, respectively. The N fertilization rates were 0, 202, and 269 (kg N ha−1). Within each panel, means followed by the same lowercase letters are not statistically different (α = 0.05).
Agronomy 12 00625 g004
Figure 5. Averaged total inorganic N (TIN, mg kg−1) determined at different depths of soils under different (a) N fertilization rates and different (b) crop rotations. Mean values of soil NO3 (mg kg−1) separated by (c) N fertilization rate at each successive depth, and by (d) rotation at each depth. (e) The interaction effect of N fertilization rate and crop rotation on NO3 levels. (f) The mean NH4+ values measured at each depth. In all cases, bars show the mean values and error bars represent the standard error of the treatment means. The placement of bars within each depth range (0–15, 15–30, 30–60, and 60–90; cm) do not signify differences in sampling depth. Crop rotations are continuous corn (CCC), and the corn-soybean rotation (CS) as corn Cs and soybean (Sc) phase, respectively. The N fertilization rates were 0, 202, and 269 (kg N ha−1). Within each panel and a given depth, means followed by the same lowercase letters are not statistically different (α = 0.05). Lack of statistically significant differences among treatment means within a given depth is indicated by “NS”.
Agronomy 12 00625 g005
Figure 6. (a) Mean soil available P (mg kg−1) by crop rotation and N fertilization rate, and (b) by depth and N fertilization rate, and (c) mean soil K (mg kg−1) by crop rotation and N fertilization rate, and (d) by depth and crop rotation. In all cases, bars show the mean values and error bars represent the standard error of the treatment means. The placement of bars within each depth range (0–15, 15–30, 30–60, and 60–90; cm) does not signify differences in sampling depth. The N fertilization rates were 0, 202, and 269 (kg N ha−1). Crop rotations are continuous corn (CCC), and the corn-soybean rotation (CS) as corn Cs and soybean (Sc) phase, respectively. Within each panel and depth, means followed by the same lowercase letters are not statistically different (α = 0.05). Lack of statistically significant differences among treatment means within the same depth is indicated by “NS”.
Agronomy 12 00625 g006
Figure 7. Average corn yield (Mg ha−1) during the 36 years of the study for each cropping system and for each level of N fertilization. Average soybean yield (Mg ha−1) is included as reference (dashed line). Error bars represent the standard error of the treatment means. Crop rotations are continuous corn (CCC), and the corn-soybean rotation (CS) as corn Cs and soybean (Sc) phase, respectively. The N fertilization rates were 0, 202, and 269 (kg N ha−1).
Agronomy 12 00625 g007
Table 1. The treatment mean values (Mean) and standard error of the means (SEM) of the soil properties: cation exchange capacity (CEC, cmolc kg−1), soil pH, soil organic matter (SOC, g kg−1), water aggregate stability (WAS, %), and bulk density (BD, Mg m−3) determined by the main effects of crop rotation [Rot, continuous CCC; corn phase of corn-soybean rotation (Cs), and soybean phase of corn-soybean rotation (Sc)], N fertilization rate (Nrate, 0, 202, and 269 in kg N ha−1), and soil depth (D, cm). Probability values (p-values) and degrees of freedom (df) associated with the different sources of variation in the analysis of variance are shown below.
Treatments CEC pH SOC WAS BD
MeanSEMMeanSEMMeanSEMMeanSEMMeanSEM
Rot
CCC 18.510.446.310.1220.080.6374.991.381.340.03
Cs 18.62 6.79 19.14 72.22 1.38
Sc 19.68 6.71 18.17 69.95 1.40
Nrate
0 19.060.386.730.0818.900.5871.421.381.410.02
202 18.85 6.59 19.08 73.26 1.38
269 18.90 6.49 19.41 72.49 1.34
D
0–15 19.390.456.400.0925.560.4864.801.211.370.02
15–30 19.330.406.550.0823.280.4976.961.301.450.02
30–60 18.010.396.690.0717.370.4479.391.321.300.02
60–90 19.010.426.780.0710.310.2268.401.481.370.02
Source of VariationdfCEC pH SOC WAS BD
Rot20.108 0.0616 0.1250 0.0167 0.3104
Nrate20.709 0.0057 0.8108 0.5158 0.0240
Rot × Nrate40.002 0.0124 0.9789 0.2068 0.9287
D30.001 <0.0001 <0.0001 <0.0001 <0.0001
Rot × D60.003 <0.0001 0.2840 0.8282 0.3100
Nrate × D60.414 0.0033 0.3125 0.3743 0.5247
Rot × Nrate × D120.914 0.0351 0.3482 0.5991 0.9474
Table 2. The treatment mean values (Mean) and standard error of the means (SEM) of the soil nitrate (NO3, mg kg−1), ammonium (NH4+, mg kg−1), total inorganic nitrogen (TIN, mg kg−1), available phosphorus (P, mg kg−1), and potassium (K, mg kg−1) determined by the main effects of crop rotation [Rot, continuous CCC; corn phase of corn-soybean rotation (Cs), and soybean phase of corn-soybean rotation (Sc)], N fertilization rate (Nrate, 0, 202, and 269 in kg N ha−1), and soil depth (D, cm). Average corn phase yield (Mg ha−1, 1981–2017) determined for each N rate and rotation are included in the last column. Probability values (p-values) and degrees of freedom (df) associated with the different sources of variation in the analysis of variance are shown below.
Treatments NO3 NH4+ TIN P K Yield
MeanSEMMeanSEMMeanSEMMeanSEMMeanSEM MeanSEM
Rot
CCC 7.650.846.154.7413.724.1614.191.56119.864.62 8.440.40
Cs 3.15 5.54 8.73 14.14 99.11 11.05
Sc 2.78 11.86 14.65 12.42 95.75
Nrate
0 2.240.848.423.0510.703.0617.471.56113.394.57 6.890.41
202 5.12 8.39 13.52 11.42 99.22 11.10
269 6.21 6.74 12.88 11.86 102.11 11.25
D
0–15 8.621.3514.382.8623.062.9926.441.96188.707.92
15–30 5.190.568.582.8013.772.6510.701.2893.812.39
30–60 2.610.304.852.877.462.686.040.4459.932.41
60–90 1.690.213.592.925.172.7211.150.5777.193.05
Source of VariationdfNO3 NH4+ TIN P K dfYield
Rot20.0005 0.6122 0.5638 0.6632 0.0047 1<0.0001
Nrate20.0075 0.6428 0.5520 0.0207 0.0908 2<0.0001
Rot × Nrate40.0055 0.4296 0.2296 0.0973 0.0171 2<0.0001
D3<0.0001 <0.0001 <0.0001 <0.0001 <0.0001
Rot × D60.0097 0.8515 0.0972 0.6705 0.0870
Nrate × D60.0643 0.2630 0.0547 0.0029 0.3401
Rot × Nrate × D120.1996 0.7622 0.6334 0.1265 0.2185
Publisher’s Note: MDPI stays neutral with regard to jurisdictional claims in published maps and institutional affiliations.

