Vitamin D Regulation of a SOD1-to-SOD2 Antioxidative Switch to Prevent Bone Cancer


1
Biology Department 1301 Memorial Drive, Cox Science Center, University of Miami, Coral Gables, FL 33146, USA
2
Sylvester Comprehensive Cancer Center, Miller School of Medicine, University of Miami, Miami, FL 33136, USA
Appl. Sci. 2020, 10(7), 2554; https://0-doi-org.brum.beds.ac.uk/10.3390/app10072554
Submission received: 3 March 2020
/
Revised: 26 March 2020
/
Accepted: 3 April 2020
/
Published: 8 April 2020
(This article belongs to the Special Issue Vitamin D in Human Health and Disease)
Abstract
:Superoxide, a form of reactive oxygen species (ROS), is catabolized by superoxide dismutase (SOD) and contributes to carcinogenesis via the oxidative damage it inflicts on cells. The aim of this research was to analyze the potential vitamin D-mediated regulation of the antioxidative “SOD1-to-SOD2 switch” within the human MG-63 osteosarcoma model. For this study, real-time PCR analysis was performed using MG-63 cells exposed to metabolically active 1,25(OH)2D3. First, a sustained statistically significant >2-fold suppression of proliferating cell nuclear antigen (PCNA) transcripts was observed after 10 nM but not at 100 nM of 1,25(OH)2D3 treatment, suggesting a cytostatic effect. In order to assess regulators of mitochondrial oxidative phosphorylation, gene expression of COX2 and COX4l1 of the mitochondrial complex IV and antioxidative enzymes (SOD1, SOD2 and Catalase (CAT)) were monitored. For COX2 and COX4l1, no changes in gene expression were observed. However, a concomitant decrease in CAT and SOD1 mRNA, and increase in SOD2 mRNA after 24 h of 10 nM 1,25(OH)2D3 treatment were observed. A ~8-fold increase in SOD2 mRNA was apparent after 48 ours. The significant increase in SOD2 activity in the presence of vitamin D indicates an antioxidant potential and sensitization of vitamin D during osteosarcoma transformation and mitochondrial detoxification over time.
Keywords:
osteosarcoma; cancer; tumor; vitamin D; vitamin D deficiency; vitamin D receptor; VDR; ROS; mitochondria; MG-63; SOD; SOD1; SOD2; stress; bone; osteoblast1. Introduction
Vitamin D is a steroid hormone produced in the skin, or obtained in varying quantities through dietary or supplementary means [1]. Vitamin D is metabolized through two subsequent hydroxylation steps that occur in the liver and kidney, resulting in its metabolically active form, 1,25(OH)2D3 (also known as calcitriol or 1,25D3). 1,25D3 exerts its genomic effects by binding to the vitamin D receptor (VDR), a member of the nuclear receptor super family [2,3,4,5,6,7,8,9,10,11,12,13,14,15,16]. Importantly, calcitriol is not only synthesized from its precursor in the kidney but as well as in certain tissues including bone, prostate and breast through expression of its hydroxylases, to maintain local non-endocrine-mediated cellular responses [17].
Vitamin D is essential for proper bone health [17]. Vitamin D deficiency causes metabolic bone diseases like osteomalacia and can exacerbate osteoporosis [17]. Vitamin D and certain analogues can regulate growth and differentiation among human and murine bone cells within in vitro culture systems [18,19]. In animal studies, vitamin D has anabolic effects to stimulate bone and bone precursor cell formation in order to inhibit bone mineral loss and osteoporosis due to ovarian dysfunction [20]. Past studies using primary human bone cells have shown that 1,25D3 prevents TNFꭤ and ceramide-induced apoptosis [21]. Thus, suppression of apoptosis might be a way in which vitamin D promotes its cytoprotective and anabolic effects in normal bone cells.
The effects of vitamin D within the context of bone cancer (osteosarcoma) has also been reported. Osteosarcoma is the most common type of cancer in bones occurring predominantly in children and young adults that lead to both destruction of the local bone environment as well as metastasis. The worldwide incidence of osteosarcoma is 3.4 million people per year, whereby the survival rate is approximately 65% [22,23]. Vitamin D and its analogues can reduce growth of certain osteosarcoma cell lines, while concomitantly promoting the elongated, spindle and fibroblast-like morphology [24] and certain differentiation markers such as alkaline phosphatase, and type I procollagen; hence bone nodule formation [25,26]. Importantly, vitamin D metabolites within a concentration range can turn human malignant bone cells into normal-like differentiating bone cells, thus acting as a potential therapy against pediatric bone cancer [27]. Interestingly, in the same study, higher levels of vitamin D metabolites were able to induce apoptosis of osteosarcomas, highlighting the importance of dosage of treatment. In a more clinical setting, 83% of all vitamin D deficient patients investigated were found to harbor malignant bone tumors [28]. And most recently, a novel doxorubicin-conjugated vitamin D delivery approach inhibited proliferation of the human MG-63 osteosarcoma cell line by inducing apoptosis [29].
It is widely accepted that oxidative damage is one among several key factors that limits lifespan, for example by promoting cancer. Superoxide (O2−) anions are produced as a free radical reactive oxygen species (ROS) by-product of oxygen metabolism and mitochondrial respiration, and can damage cells at high concentrations if left unchecked [30]. Superoxide anions are produced and accumulate in the matrix and the intermembrane space of the mitochondria, and are also produced from the enzymes NOX/DUOX localized at the plasma membrane [31]. Excessive superoxide in the cell results in damage to mitochondrial DNA, proteins and lipids, and ultimately leads to irreversible damage to organelles. To counter the effects of elevated superoxide anions, cells express superoxide-scavenging enzymes superoxide dismutase (SOD) [32]. SOD catalyzes the disproportionation of superoxide into either molecular oxygen or hydrogen peroxide as part of its antioxidant defense mechanism. Hence, SOD enzymes maintain a range of ROS in order to control potential toxicity, as well as downstream cellular and signaling functions [33]. There are three forms of SODs, and the localization of the SODs reflect their antioxidative roles within cells. SOD1 is mostly sequestered in the cytosol but can also localize to the mitochondria, SOD2 in the matrix of mitochondria [34], and SOD3 is in the extracellular space [32]. Several regulators of SODs have been characterized. For example, SOD2 is regulated by SIRT3-mediated deacetylation that can attenuate excessive production of mitochondrial ROS under disease conditions [35].
Vitamin D exerts its anti-cancer effects by a variety of mechanisms [7,10,36,37,38]. However, only a few studies have looked at the role of vitamin D on ROS production and detoxification. For example, a recent paper has shown that supraphysiological levels of calcitriol exerts its anti-tumor effects in a mouse cell model of osteosarcoma via induction of the endoplasmic reticulum stress response with a concomitant increase in intracellular ROS [39]. In addition, cDNA microarray analysis using human prostate epithelial cells revealed that calcitriol (50 nM) can promote SOD2 expression (2.01-fold increase, 24 h) [40], as well as the early expression of the antioxidant thioredoxin reductase 1 (TXNRD1; 2.8-fold increase, 6 h) [41]. Another cDNA microarray study using androgen-sensitive prostate cancer cells identified a 2.6-fold increase in SOD1 at 10 nM of 1,25D3 treatment for 24 h [41]. Calcitriol was also found to induce glucose-6-phosphate dehydrogenase (G6PD) transcription in a VDR-dependent manner within non-malignant prostate cancer cells to maintain NADPH levels for the production the ROS scavenger glutathione [42]. To compliment these studies, the aim of this research was to analyze the potential vitamin D-mediated regulation of the “SOD1-to-SOD2 switch” within the MG-63 osteosarcoma model that was recently characterized between non-tumorigenic and tumorigenic breast cancer cells [43]. This work provides insights into mechanisms that govern the anti-neoplastic actions of vitamin D.
2. Results
2.1. Effects of 1,25D3 on MG-63 Osteosarcoma Cell Viability Using the 3-(4,5-Dimethylthiazol-2-yl)-2,5 Diphenyl Tetrazolium Bromide (MTT) Assay
In order to establish the in vitro conditions to investigate the mechanism of action toward mitochondrial dynamics, MG-63 cellular response to a 10-fold serial dilution of 1,25D3 was assessed using the 3-(4,5-dimethylthiazol-2-yl)-2,5 diphenyl tetrazolium bromide (MTT) assay (Figure 1). MG-63 cells were treated with 1,25D3 at concentrations ranging from 1 pM to 1 µM, and cell viability was assessed at 24 and 48 h post treatment. In addition, two different media conditions were compared to access the synergistic effects of liganded VDR signaling. For one, a charcoal-stripped fetal bovine serum (FBS)-based media was applied to assess the singular role of VDR signaling within MG-63 osteosarcoma cells. For the other, a standard complete media with normal FBS was applied to study the synergistic effects of VDR signaling with other hormone ligands in the system. Interestingly, when cultured with charcoal-stripped media, 1,25D3 was unable to inhibit viability of MG-63 cells even at the highest concentration of 1 µM for both 24 and 48 h after treatment (Figure 1A). However, in complete media a mild suppression of cell viability was observed only after 24 h of 1,25D3 treatment at the higher concentration range of 10–1000 nM (p < 0.05–0.001) (Figure 1A). This suppression in cell viability became even more pronounced after 48 h of 1,25D3 treatment within the lower 0.1–1000 nM range (Figure 1A; p < 0.05–0.001). Based on these studies, it appears that 1,25D3 treatment over time has a significant suppressive effect on MG-63 cell viability within human serum levels down to the pmol/L range [44].
Based on our dose curve for MG-63 cells, the IC50 value (i.e., the concentration that provides a response halfway between the maximal and the minimally inhibited response) for 1,25D3 was determined (Figure 1A). The 1,25D3 concentrations were transformed to log value, whereby the model assumes that the response curve has a standard slope equal to a Hill slope (or slope factor) of −1.0. As there were no maximal responses for the 24-hour complete media and 24/48-hour charcoal-stripped media treated samples, the IC50 values could not be determined in these cases. For the 48-hour complete media condition, the best-fit IC50 value based on non-linear regression was 55.43 nM (logIC50 = 1.74), whereby the goodness of fit R2 value was 0.8773, and correlated with the transformed percentinhibition data (Figure 1C). In order to study the involvement and regulatory mechanisms of 1,25D3 on mitochondrial dynamics, 10 nM and 100 nM concentrations were further investigated which encapsulates the determined IC50 value.
2.2. Characterization of 1,25D3-Mediated Cell Cycle and Vitamin D Catabolic and Osteogenic Genes in MG-63 Osteosarcoma Cells
To acquire further insight into the molecular mechanisms underlying the increased inhibition of MG-63 osteosarcoma cell viability by 1,25D3, gene expression analysis was performed of cell cycle, vitamin D signaling and osteogenic-related genes. For this part, MG-63 cells were treated with 10 nM and 100 nM 1,25D3, or vehicle (equi-volume ethanol) for 24 and 48 h in complete media. First, proliferating cell nuclear antigen (PCNA) mRNA was appraised by real-time PCR to assess the level of DNA replication in the samples. After 1,25D3 treatment at 10 nM, a statistically significant >2-fold suppression of PCNA transcripts was observed compared to vehicle-treated samples for both the 24- and 48-hour time points (Figure 2A). However, no large difference in PCNA transcript levels was observed at the higher 100 nM of 1,25D3 at both time points, which was also confirmed upon vitamin D antagonist ZK159222 (VAZ) treatment that blocks VDR genomic actions [45] (Figure 2A). These results suggest that 1,25D3 suppresses DNA replication (i.e., cell division) only at 10 nM in the system.
In order to monitor the control of vitamin D signaling, cytochrome P450 family 24 subfamily A member 1 (CYP24A1) and VDR transcript levels were monitored. CYP24A1 is a vitamin D3 24-hydroxylase and a VDR target gene that is involved in the catabolism of calcitriol. After treatment of MG-63 cells with 10 nM 1,25D3 for both 24 and 48 h, there was a significant reduction in the level of CYP24A1 compared to vehicle-treated controls (Figure 2B). However, after 100 nM 1,25D3 treatment, there was a significant increase in CYP24A1 mRNA compared to 10 nM-treated samples. This response was mediated by genomic VDR signaling, as a significant decrease in CYP24A1 mRNA was observed after VAZ co-treatment. This observation suggests a vitamin D-dependency at the 100 nM concentration, and an overall suppression of vitamin D signaling through 1,25D3 catabolism. VDR mRNA level was measured and shown to be significantly decreased after 10 nM 1,25D3 treatment that was more striking after 48 h (Figure 2C). However, there was no change in VDR mRNA levels after 100 nM 1,25D3 treatment at both time points. Furthermore, the VDR mRNA level was not altered after VAZ treatment confirming the presence of receptorin the system and limited autoregulation [7]. Although CYP24A1 is commonly upregulated in cancers and thought to be one mode for vitamin D resistance [46], this appears not to be the case for MG-63 cells treated with 100 nM 1,25D3 based on the MTT results (Figure 1A). This suggests other anti-cancer strategies upon high levels of vitamin D, including apoptosis [47] and/or induction of other stress pathways such as those involving the endoplasmic reticulum [39].
In addition, osteocalcin (encoded by BGLAP) mRNA levels were monitored. Osteocalcin is a secreted non-collagenous protein hormone often used to assess osteoblast activity, which is under direct VDR regulation [48]. At 10 nM 1,25D3 treatment for both 24 and 48 h, a significant and drastic decrease in BGLAP mRNA levels was observed (Figure 2D). However, an increase to near baseline levels of BGLAP mRNA was observed after 100 nM 1,25D3 treatment, which was abrogated upon VAZ treatment confirming VDR dependency. As increased osteocalcin production can cause endoplasmic reticulum stress coupled with elevated oxygen consumption [49], the differences between 10 nM and 100 nM 1,25D3 may further represent a switch from cytostatic to cytotoxic metabolism, respectively.
2.3. Vitamin D Treatment Does Not Inhibit the Transcription of Respiratory Chain Genes Cytochrome C Oxidase Subunit 2 (COXII) and Subunit 4 Isoform 1 (COX4I1) in MG-63 Cells
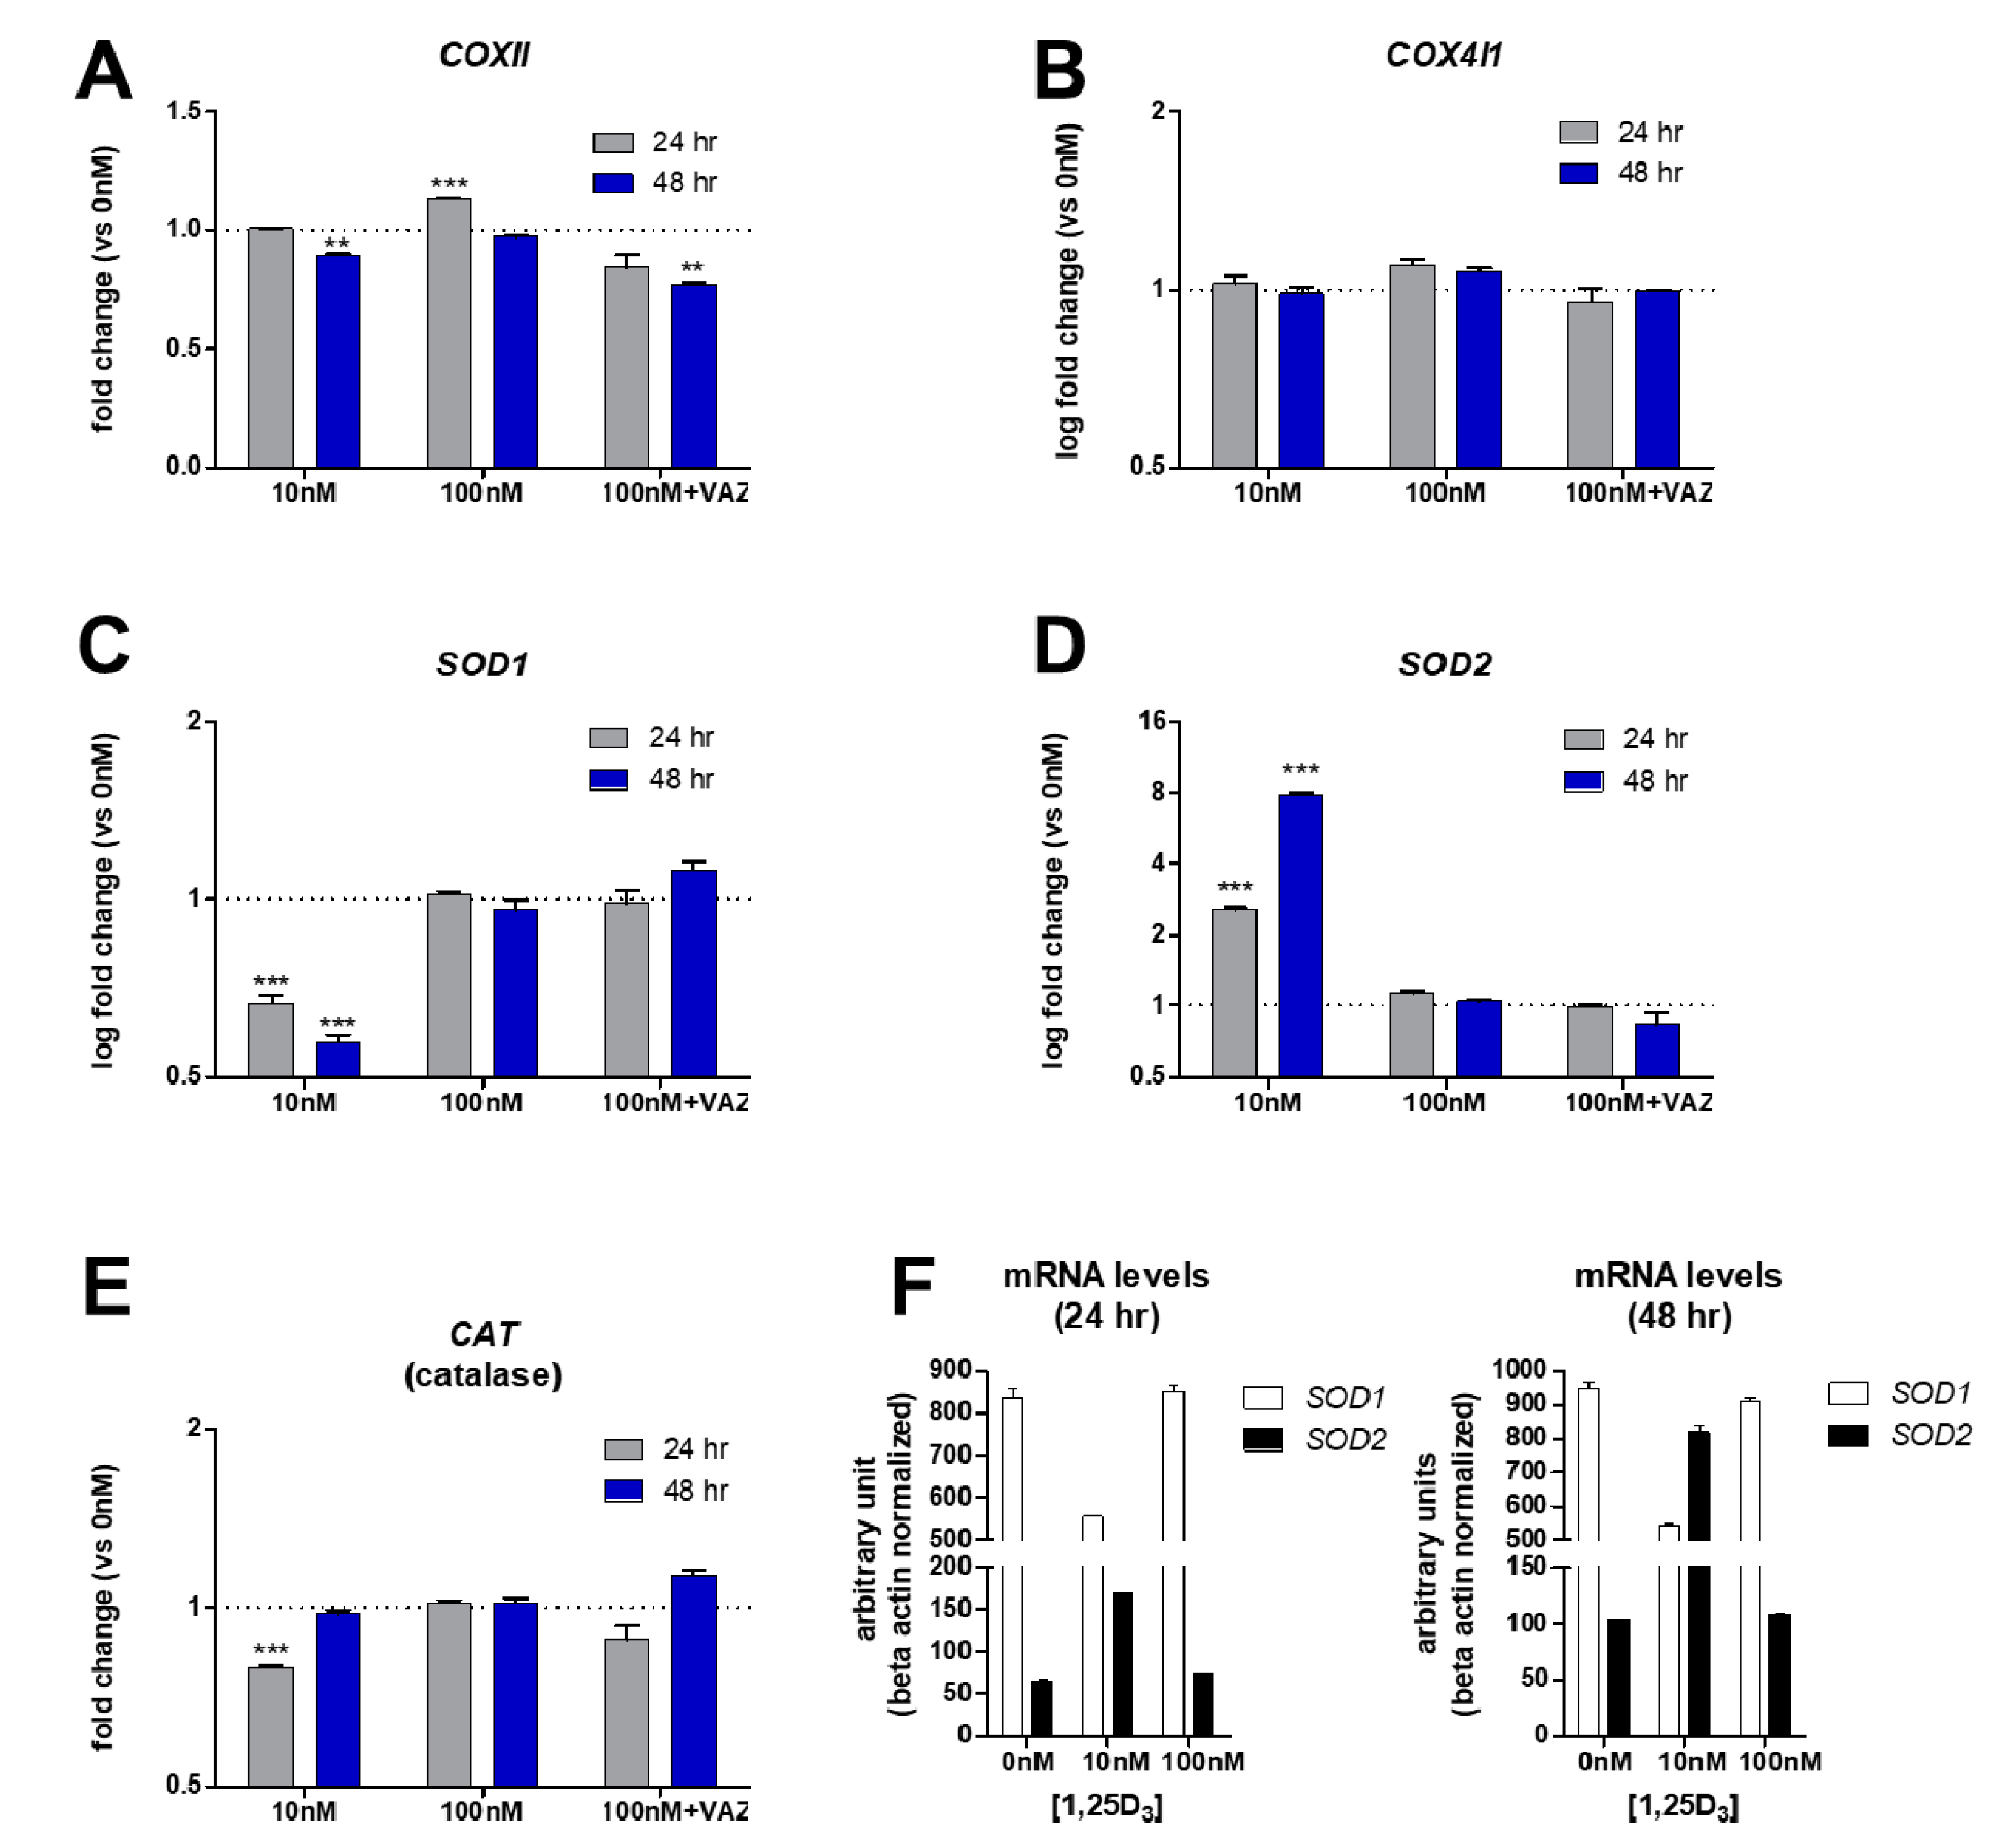
Recent studies have shown that vitamin D can suppress the production of cellular ROS in MG-63 cells [39], however the mode of action is unknown. First mitochondrial and nuclear transcription of cytochrome c oxidase subunit 2 (COXII) and subunit 4 isoform 1 (COX4I1) mRNA, respectively, were characterized after 1,25D3 treatment over time as potential players in ROS regulation. These proteins are subunits of cytochrome c oxidase complex IV part of the active mitochondrial respiratory chain and contribute to the proton electrochemical gradient across the inner mitochondrial membrane. Previous studies have shown that both of these subunits were inhibited after 1,25D3 treatment in skin keratinocyte models [50], and may be involved in osteosarcoma. However, after both 10 nM and 100 nM 1,25D3 and VAZ co-treatments of MG-63 cells for 24 and 48 h, no striking differences in the gene expression of both COXII and COX4I1 were observed (Figure 3A,B). These results suggest that 1,25D3 does not modulate active cytochrome c oxidase via COXII and COX4I1 subunits at the transcriptional level. These results point to alternative mitochondrial regulators, including perhaps other components of the electron transport chain, in the regulation of ROS by vitamin D [39].
2.4. SOD1-to-SOD2 Antioxidative Switch after Vitamin D Treatment of MG-63 Osteosarcoma Cells
Given the known increase in ROS among MG-63 osteosarcoma cells [39], it was hypothesized that antioxidant defense mechanisms may be involved in vitamin D-dependent suppression of ROS production. Specific SOD activities are correlated with tumorigenicty [30,43], therefore the transcription of the SOD genes within 1,25D3-treated MG-63 cells was monitored over time. A significant and dramatic decrease in the level of SOD1 transcript was observed only after 24 and 48 h of 10 nM 1,25D3 treatment (Figure 3C). At 100 nM of 1,25D3 there was no change in SOD1 levels with or without VAZ, suggesting no direct VDR-dependent regulatory role at higher concentrations of ligand. Interestingly, a dramatic >2.5-8-fold time-dependent persistent increase in SOD2 mRNA levels was observed only with the lower 10 nM 1,25D3 concentration at both time points (Figure 3D). Once again, at the higher 100 nM 1,25D3 concentration the regulatory role of VDR toward SOD2 activity was abrogated. Catalase is a peroxisomal enzyme that rapidly degrades hydrogen peroxide (H2O2) to O2 and H2O. As SODs may yield H2O2, the mRNA levels of the H2O2 antioxidant catalase (CAT) were monitored, and a moderate and statistically significant decrease was observed only after 10 nM 1,25D3 treatment at the 24-hour time point (Figure 3E). However, a steady increase following another 24 h back toward baseline was also observed (Figure 3E). This suggests the protective role of vitamin D treatment relying less on CAT antioxidant production during the early stages of treatment, and the potential decrease in H2O2 efflux from the mitochondria. Lastly, the real-time PCR results were arranged using arbitrary units in order to compare amounts of transcripts across experiments. In this way, it became more evident that after 1,25D3 treatment there was a clear shift from SOD1 to SOD2 initiated at the 24-hour time point (Figure 3F). However, by the 48-hour time point SOD2 levels exceeded SOD1 levels to complete the “switch” (Figure 3F). The switch from SOD1 to SOD2 may signify the importance of the cellular distribution and actions of each SOD enzyme, cytosol versus mitochondria, respectively. Overall, these findings suggest an active time- and concentration-dependent mitochondrial reparative process involving specific SOD enzymes engaged after vitamin D treatment within MG-63 osteosarcoma cells as part of vitamin D’s anti-cancer effects (Figure 4).
3. Discussion
It has long been recognized that vitamin D has non-calcemic functions in controlling the cell cycle, differentiation and apoptosis, and its analogues are used in cancer treatment [17,51,52]. The anti-neoplastic mechanisms of vitamin D at the cellular and molecular levels are becoming clearer, yet not fully understood. For example, the tumor suppressor protein p53 upregulates the VDR in certain cancer types to inhibit cancer progression [53]. In contrast, many cancers harbor mutated p53 proteins that can physically interact with the VDR and convert it into an anti-apoptotic agent [54]. Although p53 is a major regulator of cancer transformation, it appears to not be a factor in terms of how vitamin D regulates MG-63 osteosarcoma progression since these cells lack p53 [55]. Understanding how vitamin D can regulate dynamic cancer-related processes is central to applications toward specialized cancer treatment [51].
The major finding of this paper is that MG-63 osteosarcoma cells can respond to adaptive signals such as vitamin D to suppress the transformation process by upregulation of SOD2.
The degree to which the vitamin D-SOD network offers specific cytoprotective and antioxidative effects is unclear and should be the focus of future studies. Importantly, this form of regulation is tightly controlled in a 1,25D3 concentration and time dependent manner which argues for maintenance of proper vitamin D levels in the body. The importance of SODs are reflected in mice either lacking mitochondrial or cytosolic SODs that die around 21 days after birth or exhibit milder phenotypes, respectively, such as the development of cancer in time [56]. It appears if SOD levels and distributions are unchecked, this can contribute to mitochondrial damage and eventual cancer transformation [30]. Recent studies using both human and murine cancer models indicate that the expression of SOD2 is rapidly reduced upon activation of various oncogenes [43], thus compromising it’s cytoprotective and antioxidative roles, presumably within the mitochondria. Thus, strategies to induce SOD2 may be an effective way to limit cancer transformation. On the other hand, SOD1 is overexpressed in a majority of mammary tumor models driven by various oncogenes [43]. It is possible that mitochondrial SOD1 may be necessary to maintain the integrity of the organelle when the levels of SOD2 are compromised during transformation. Indeed, after 10 nM 1,25D3 treatment for 48 h there was a cumulative increase in the combined SOD1 and SOD2 transcript amounts compared to untreated MG-63 cells (Figure 3F). Nevertheless, the consensus is that, in non-tumorigenic cells, SOD2 levels are elevated while SOD1 levels are kept low [43], suggesting that mitochondrial protection from ROS is critical in the natural high respiratory state. It was recently shown that pharmacological inhibition of SOD1 results in fragmented and dilated cristae of mitochondria in a breast cancer cell line (MDA-MB-231) [43], suggesting the critical role of SOD1 protection from mitochondrial ROS toxic effects during transformation. However, SOD1 inhibition within non-tumorigenic cells did not alter morphological features of the mitochondria [43], presumably due to protection from the known increased endogenous levels of SOD2. These findings correlate with the long recognized understanding that cancer cells are characterized by elevated levels of ROS [57]. Furthermore, it has been reported that SIRT3—a major regulator of SOD2—expression is decreased in 87% of breast cancers implying a key role of SOD2 in cancer transformation [58]. Based on the findings presented here, vitamin D-mediatesprotection from ROS-induced damage by increasing expression of the ROS detoxifier SOD2. Importantly, it appears that vitamin D has the potential to shift the SOD profile from one that represents a tumorigenic towards a non-tumorigenic state.
It is unclear how SOD1 and SOD2 expression is regulated by vitamin D and its receptor through cis and/or trans regulatory elements and factors. It is clear from the MTT data that other serum ligands work in synergy to support vitamin D’s anti-cancer effects (Figure 1A). The other ligands may include the fat-soluble vitamin K, as vitamin D induces the synthesis of vitamin K-dependent proteins, including the VDR, that are required for post-translational carboxylation to support calcium binding in bone [59,60]. It is surmised that without this synergistic relationship, the anti-tumor effects of vitamin D may also be impaired. It is possible that vitamin D regulates SOD1 and SOD2 expression via indirect mechanisms. For example, vitamin D can activate NRF2, which is a transcription factor that plays an important role in redox homeostasis and protection against oxidative damage [61]. Upon induction, NRF2 translocate to the nucleus and binds DNA antioxidant response elements (AREs) that leads to coordinated activation of gene expression [62]. Thus, vitamin D signaling may promote expression of NRF2 that then regulates antioxidant genes such as SOD1 and SOD2, which remains to be tested [62]. Although the VDR mRNA levels were decreased after 1,25D3 treatment, it is possible that addition of the ligand can stabilize the receptor to improve anti-neoplastic gene targeting effects [63].
Previous studies using either VDR ablation or 1,25D3 treatment approaches have made associations between VDR actions and mitochondrial respiratory activity along with the production of intracellular ROS within several cell lines [64]. In all cell types it was found that, upon VDR ablation, there was an increase in respiration and ROS production associated with elevations in both mitochondrial COX2 and nuclear COX4I1 [64]. On the other hand, 1,25D3 treatment of skin keratinocytes resulted in decreased COX2 and COX4I1 mRNA levels, suggesting a concomitant reduction in intracellular ROS production [50]. Although in this study, evidence was provided for a mitochondrial-specific antioxidant effect of vitamin D within MG-63 cells, no change in either COX2 or COX4I1 transcript levels was found (Figure 3A,B). This would suggest that within MG-63 cells other vitamin D-dependent electron transport chain enzyme complexes may be involved, as ROS are sourced from Complex I and III enzymes, while Complex IV converts molecular oxygen to two molecules of water and activates ATP synthase to synthesize ATP [65]. It is well-known that the maintenance of proper vitamin D levels for the long term will have beneficial cancer survival effects across demographics [51], and in this paper, vitamin D was shown to significantly induce mitochondrial SOD2, and was presumed to be part of the antioxidant mechanism to limit the proliferation and cellular damage of MG-63 osteoblastoma cells. Future studies will focus on other non-calcemic vitamin D analogues and their effects on the SOD1-to-SOD2 switch and their role in cancer biology.
4. Experimental Procedures
4.1. Reagents and Cell Culture
Crystalline 1,25(OH)2D3 (Biomol, Plymouth Meeting, PA, USA) was reconstituted in ethanol and kept at −80 °C. The vitamin D receptor antagonist ZK159222 (VAZ, Toronto Research Chemicals) was reconstituted in ethanol and kept at 80 °C (Ochiai E et al. 2005).Human MG-63 osteosarcoma cells (CRL-1427; American Type Culture Collection, Manassas, VA, USA) were cultured in complete media containing Eagle’s Minimum Essential Medium (ATCC, 30-2003), 10% heat inactivated fetal bovine serum, and 1X penicillin and streptomycin. For some experiments, the cells were cultured in charcoal-stripped FBS (35-072-CV, Corning). For assays, cells were treated with 0 (vehicle) to 1 µM 1,25(OH)2D3 incubated in tissue culture plates (CytoOne).
4.2. Quantitative Real-Time RT-PCR (qPCR) Analyses
RNA was prepared using the PureLink RNA Mini kit (ThermoFisher Scientific). cDNA was synthesized using 200 ng total RNA with the ProtoScript® First Strand cDNA Synthesis kit (New England Biolabs) utilizing random hexamers. All cDNAs were amplified under the following conditions: 95 °C for 10 min to activate AmpliTaq Gold® Polymerase; followed by 40 cycles of 95 °C for 15 s and 60 °C for 1 min with an internal ROX reference dye.
qPCR analysis was performed on a QuantStudio 3 Real-Time instrument (ThermoFisher Scientific) utilizing the Power SYBR™ Green PCR Master mix (ThermoFisher Scientific; primer list, Supplemental Table S1). Target genes were normalized to beta actin mRNA expression.
For the primer design, the human genome sequence coverage assembly GRCh38.p13 was utilized from the Genome Reference Consortium.
4.3. MTT Assay Protocol for Measuring Cell Viability
All experiments were performed using 2.4 × 10⁴ cells/well in 96-well plates. Cells were seeded and then left to incubate at 37 °C (5%CO2) overnight. The following day, cells were carefully washed with 1X PBS, and then treated with 1,25D3 and the cellular status was assessed at both 24 and 48 h post treatment. The MTT (3-[4,5-dimethylthiazol-2-yl]-2,5 diphenyl tetrazolium bromide) assay was performed according to the manufacturer´s recommendation (10009365, Cayman Chemicals). After incubation with the MTT reagent, the cells and salt were solubilized using the provided sodium dodecyl sulfate-based lysis buffer. The optical density absorbance was determined using a Molecular Devices EMax microplate spectrophotometer at 550 nm absorbance minus a 650 nm reference. Data is represented as the mean of 5 replicate wells ± SD, with analysis using the two-way ANOVA with Bonferroni post-hoc test (GraphPad Prism). In order to approximate the IC50 value, GraphPad was used and applied nonlinear regression after log transformation of the 1,25D3 dose assessed by the model: Y = Bottom + (Top − Bottom)/(1 + 10 ^ ((X − LogIC50))).
4.4. Real-Time PCR Data Analysis
Data are presented as fold induction of treatments compared to 0 nM (vehicle) samples normalized to beta actin mRNA levels (i.e., the comparative CT Livak method (Livak, Schmittgen 2001) [66]. Melting curve analysis was performed for all primers to eliminate those that yielded primer-dimers. The p-values reflect the log fold-change compared to the vehicle (0 nM) condition (n = 3 experimental samples ± SD). As the delta Ct (dCT) values are measures that are proportional to log expression, a t-test using two groups of dCT values was used to generate the p-values.
Supplementary Materials
The following are available online at https://0-www-mdpi-com.brum.beds.ac.uk/2076-3417/10/7/2554/s1, Table S1: Real-time PCR primer set (human).
Author Contributions
T.S.L. designed and performed the experiments, analyzed the data, and wrote the manuscript. All authors have read and agreed to the published version of the manuscript.
Funding
Supported by start-up funds from the College of Arts and Sciences, Biology Department, University of Miami, Coral Gables, Florida; Supported by Grant # IRG-17-183-16 from the American Cancer Society, and from the Sylvester Comprehensive Cancer Center at the Miller School of Medicine, University of Miami.
Acknowledgments
Special acknowledgments to Neda Vishlaghi (University of Miami) and Karen Di Lauro (University of Miami) for providing critiques to the manuscript. Supported by Grant # IRG-17-183-16 from the American Cancer Society, and from the Sylvester Comprehensive Cancer Center at the Miller School of Medicine, University of Miami.
Conflicts of Interest
The author has no competing interests to declare.
Data Availability Statement
All data generated during and/or analyzed during the current study are available from the corresponding author on reasonable request.
References
- Tian, X.Q.; Chen, T.C.; Matsuoka, L.Y.; Wortsman, J.; Holick, M.F. Kinetic and thermodynamic studies of the conversion of previtamin D3 to vitamin D3 in human skin. J. Biol. Chem. 1993, 268, 14888–14892. [Google Scholar] [PubMed]
- Lagishetty, V.; Misharin, A.V.; Liu, N.Q.; Lisse, T.S.; Chun, R.F.; Ouyang, Y.; McLachlan, S.M.; Adams, J.S.; Hewison, M. Vitamin D deficiency in mice impairs colonic antibacterial activity and predisposes to colitis. Endocrinology 2010, 151, 2423–2432. [Google Scholar] [CrossRef] [PubMed] [Green Version]
- Lisse, T.S.; Adams, J.S.; Hewison, M. Vitamin D and microRNAs in bone. Crit. Rev. Eukaryot. Gene Expr. 2013, 23, 195–214. [Google Scholar] [CrossRef] [PubMed] [Green Version]
- Lisse, T.S.; Chun, R.F.; Rieger, S.; Adams, J.S.; Hewison, M. Vitamin D activation of functionally distinct regulatory miRNAs in primary human osteoblasts. J. Bone Miner. Res. Off. J. Am. Soc. Bone Miner. Res. 2013, 28, 1478–1488. [Google Scholar] [CrossRef] [Green Version]
- Lisse, T.S.; Hewison, M. Vitamin D: A new player in the world of mTOR signaling. Cell Cycle 2011, 10, 1888–1889. [Google Scholar] [CrossRef] [Green Version]
- Lisse, T.S.; Hewison, M.; Adams, J.S. Hormone response element binding proteins: Novel regulators of vitamin D and estrogen signaling. Steroids 2011, 76, 331–339. [Google Scholar] [CrossRef] [Green Version]
- Lisse, T.S.; Liu, T.; Irmler, M.; Beckers, J.; Chen, H.; Adams, J.S.; Hewison, M. Gene targeting by the vitamin D response element binding protein reveals a role for vitamin D in osteoblast mTOR signaling. FASEB J. Off. Publ. Fed. Am. Soc. Exp. Biol. 2011, 25, 937–947. [Google Scholar] [CrossRef] [Green Version]
- Lisse, T.S.; Saini, V.; Zhao, H.; Luderer, H.F.; Gori, F.; Demay, M.B. The vitamin D receptor is required for activation of cWnt and hedgehog signaling in keratinocytes. Mol. Endocrinol. 2014, 28, 1698–1706. [Google Scholar] [CrossRef] [Green Version]
- Lisse, T.S.; Vadivel, K.; Bajaj, S.P.; Chun, R.F.; Hewison, M.; Adams, J.S. The heterodimeric structure of heterogeneous nuclear ribonucleoprotein C1/C2 dictates 1,25-dihydroxyvitamin D-directed transcriptional events in osteoblasts. Bone Res. 2014, 2. [Google Scholar] [CrossRef] [Green Version]
- Zhang, X.; Luo, F.; Li, J.; Wan, J.; Zhang, L.; Li, H.; Chen, A.; Chen, J.; Cai, T.; He, X.; et al. DNA damage-inducible transcript 4 is an innate guardian for human squamous cell carcinoma and an molecular vector for anti-carcinoma effect of 1,25(OH)2 D3. Exp. Dermatol. 2019, 28, 45–52. [Google Scholar] [CrossRef]
- Zhao, H.; Rieger, S.; Abe, K.; Hewison, M.; Lisse, T.S. DNA Damage-Inducible Transcript 4 Is an Innate Surveillant of Hair Follicular Stress in Vitamin D Receptor Knockout Mice and a Regulator of Wound Re-Epithelialization. Int. J. Mol. Sci. 2016, 17, 1984. [Google Scholar] [CrossRef] [PubMed] [Green Version]
- Zhou, R.; Chun, R.F.; Lisse, T.S.; Garcia, A.J.; Xu, J.; Adams, J.S.; Hewison, M. Vitamin D and alternative splicing of RNA. J. Steroid Biochem. Mol. Biol. 2015, 148, 310–317. [Google Scholar] [CrossRef] [PubMed] [Green Version]
- Zhou, R.; Park, J.W.; Chun, R.F.; Lisse, T.S.; Garcia, A.J.; Zavala, K.; Sea, J.L.; Lu, Z.X.; Xu, J.; Adams, J.S.; et al. Concerted effects of heterogeneous nuclear ribonucleoprotein C1/C2 to control vitamin D-directed gene transcription and RNA splicing in human bone cells. Nucleic Acids Res. 2017, 45, 606–618. [Google Scholar] [CrossRef]
- Bacchetta, J.; Sea, J.L.; Chun, R.F.; Lisse, T.S.; Wesseling-Perry, K.; Gales, B.; Adams, J.S.; Salusky, I.B.; Hewison, M. Fibroblast growth factor 23 inhibits extrarenal synthesis of 1,25-dihydroxyvitamin D in human monocytes. J. Bone Miner. Res. Off. J. Am. Soc. Bone Miner. Res. 2013, 28, 46–55. [Google Scholar] [CrossRef] [Green Version]
- Bacchetta, J.; Zaritsky, J.J.; Sea, J.L.; Chun, R.F.; Lisse, T.S.; Zavala, K.; Nayak, A.; Wesseling-Perry, K.; Westerman, M.; Hollis, B.W.; et al. Suppression of iron-regulatory hepcidin by vitamin D. J. Am. Soc. Nephrol. JASN 2014, 25, 564–572. [Google Scholar] [CrossRef] [PubMed] [Green Version]
- Lagishetty, V.; Chun, R.F.; Liu, N.Q.; Lisse, T.S.; Adams, J.S.; Hewison, M. 1alpha-hydroxylase and innate immune responses to 25-hydroxyvitamin D in colonic cell lines. J. Steroid Biochem. Mol. Biol. 2010, 121, 228–233. [Google Scholar] [CrossRef] [Green Version]
- Bouillon, R.; Carmeliet, G.; Verlinden, L.; van Etten, E.; Verstuyf, A.; Luderer, H.F.; Lieben, L.; Mathieu, C.; Demay, M. Vitamin D and human health: Lessons from vitamin D receptor null mice. Endocr. Rev. 2008, 29, 726–776. [Google Scholar] [CrossRef]
- Ryhanen, S.; Jaaskelainen, T.; Saarela, J.T.; Maenpaa, P.H. Inhibition of proliferation and induction of differentiation of osteoblastic cells by a novel 1,25-dihydroxyvitamin D3 analog with an extensively modified side chain (CB1093). J. Cell. Biochem. 1998, 70, 414–424. [Google Scholar] [CrossRef]
- Van den Bemd, G.J.; Pols, H.A.; Birkenhager, J.C.; Kleinekoort, W.M.; van Leeuwen, J.P. Differential effects of 1,25-dihydroxyvitamin D3-analogs on osteoblast-like cells and on in vitro bone resorption. J. Steroid Biochem. Mol. Biol. 1995, 55, 337–346. [Google Scholar] [CrossRef]
- Erben, R.G.; Bante, U.; Birner, H.; Stangassinger, M. 1alpha-hydroxyvitamin D2 partially dissociates between preservation of cancellous bone mass and effects on calcium homeostasis in ovariectomized rats. Calcif Tissue Int. 1997, 60, 449–456. [Google Scholar] [CrossRef]
- Pascher, E.; Perniok, A.; Becker, A.; Feldkamp, J. Effect of 1alpha,25(OH)2-vitamin D3 on TNF alpha-mediated apoptosis of human primary osteoblast-like cells in vitro. Horm. Metab. Res. 1999, 31, 653–656. [Google Scholar] [CrossRef] [PubMed]
- Mirabello, L.; Troisi, R.J.; Savage, S.A. International osteosarcoma incidence patterns in children and adolescents, middle ages and elderly persons. Int. J. Cancer 2009, 125, 229–234. [Google Scholar] [CrossRef] [Green Version]
- Simon, M.A.; Aschliman, M.A.; Thomas, N.; Mankin, H.J. Limb-salvage treatment versus amputation for osteosarcoma of the distal end of the femur. J. Bone Joint Surg. Am. 1986, 68, 1331–1337. [Google Scholar] [CrossRef] [PubMed]
- Barroga, E.F.; Kadosawa, T.; Asano, K.; Okumura, M.; Fujinaga, T. Apoptosis induction of POS canine osteosarcoma cells by vitamin D and retinoids. J. Vet. Med. Sci. 1998, 60, 1269–1272. [Google Scholar] [CrossRef] [PubMed] [Green Version]
- Rao, L.G.; Sutherland, M.K.; Reddy, G.S.; Siu-Caldera, M.L.; Uskokovic, M.R.; Murray, T.M. Effects of 1alpha,25-dihydroxy-16ene, 23yne-vitamin D3 on osteoblastic function in human osteosarcoma SaOS-2 cells: Differentiation-stage dependence and modulation by 17-beta estradiol. Bone 1996, 19, 621–627. [Google Scholar] [CrossRef]
- Choi, Y.S.; Hong, Y.J.; Hur, J.; Kim, M.Y.; Jung, J.Y.; Lee, W.K.; Jeong, S. Bone nodule formation of Mg63 cells is increased by the interplay of signaling pathways cultured on vitamin D3-entrapped calcium phosphate films. Anim. Cells Syst. 2009, 13, 363–370. [Google Scholar] [CrossRef]
- Thompson, L.; Wang, S.; Tawfik, O.; Templeton, K.; Tancabelic, J.; Pinson, D.; Anderson, H.C.; Keighley, J.; Garimella, R. Effect of 25-hydroxyvitamin D3 and 1 alpha,25 dihydroxyvitamin D3 on differentiation and apoptosis of human osteosarcoma cell lines. J. Orthop. Res. 2012, 30, 831–844. [Google Scholar] [CrossRef]
- Horas, K.; Maier, G.; Jakob, F.; Maus, U.; Kurth, A.; Jakuscheit, A.; Rudert, M.; Holzapfel, B.M. High Prevalence of Vitamin D Deficiency in Patients with Bone Tumors. Cancer Investig. 2017, 35, 562–568. [Google Scholar] [CrossRef]
- Maayah, Z.H.; Zhang, T.; Forrest, M.L.; Alrushaid, S.; Doschak, M.R.; Davies, N.M.; El-Kadi, A.O.S. DOX-Vit D, a Novel Doxorubicin Delivery Approach, Inhibits Human Osteosarcoma Cell Proliferation by Inducing Apoptosis While Inhibiting Akt and mTOR Signaling Pathways. Pharmaceutics 2018, 10, 144. [Google Scholar] [CrossRef] [Green Version]
- Sheng, Y.; Abreu, I.A.; Cabelli, D.E.; Maroney, M.J.; Miller, A.F.; Teixeira, M.; Valentine, J.S. Superoxide dismutases and superoxide reductases. Chem. Rev. 2014, 114, 3854–3918. [Google Scholar] [CrossRef]
- Berridge, M.J. Vitamin D, reactive oxygen species and calcium signalling in ageing and disease. Philos. Trans. R. Soc. Lond. B Biol. Sci. 2016, 371. [Google Scholar] [CrossRef] [PubMed] [Green Version]
- Wang, Y.; Branicky, R.; Noe, A.; Hekimi, S. Superoxide dismutases: Dual roles in controlling ROS damage and regulating ROS signaling. J. Cell Biol. 2018, 217, 1915–1928. [Google Scholar] [CrossRef]
- Lisse, T.S.; Rieger, S. IKKalpha regulates human keratinocyte migration by surveillance of the redox environment. J. Cell Sci. 2017. [Google Scholar] [CrossRef] [PubMed] [Green Version]
- Tao, R.; Coleman, M.C.; Pennington, J.D.; Ozden, O.; Park, S.H.; Jiang, H.; Kim, H.S.; Flynn, C.R.; Hill, S.; Hayes McDonald, W.; et al. Sirt3-mediated deacetylation of evolutionarily conserved lysine 122 regulates MnSOD activity in response to stress. Mol. Cell 2010, 40, 893–904. [Google Scholar] [CrossRef] [PubMed] [Green Version]
- Liu, X.; Zhang, L.; Wang, P.; Li, X.; Qiu, D.; Li, L.; Zhang, J.; Hou, X.; Han, L.; Ge, J.; et al. Sirt3-dependent deacetylation of SOD2 plays a protective role against oxidative stress in oocytes from diabetic mice. Cell Cycle 2017, 16, 1302–1308. [Google Scholar] [CrossRef] [Green Version]
- Zenmyo, M.; Komiya, S.; Hamada, T.; Hiraoka, K.; Kato, S.; Fujii, T.; Yano, H.; Irie, K.; Nagata, K. Transcriptional activation of p21 by vitamin D(3) or vitamin K(2) leads to differentiation of p53-deficient MG-63 osteosarcoma cells. Hum. Pathol. 2001, 32, 410–416. [Google Scholar] [CrossRef]
- Ryhanen, S.; Jaaskelainen, T.; Mahonen, A.; Maenpaa, P.H. Inhibition of MG-63 cell cycle progression by synthetic vitamin D3 analogs mediated by p27, Cdk2, cyclin E, and the retinoblastoma protein. Biochem. Pharm. 2003, 66, 495–504. [Google Scholar] [CrossRef]
- Vishlaghi, N.; Lisse, T.S. Exploring vitamin D signalling within skin cancer. Clin. Endocrinol. 2019. [Google Scholar] [CrossRef]
- Shimizu, T.; Kamel, W.A.; Yamaguchi-Iwai, S.; Fukuchi, Y.; Muto, A.; Saya, H. Calcitriol exerts an anti-tumor effect in osteosarcoma by inducing the endoplasmic reticulum stress response. Cancer Sci. 2017, 108, 1793–1802. [Google Scholar] [CrossRef] [Green Version]
- Peehl, D.M.; Shinghal, R.; Nonn, L.; Seto, E.; Krishnan, A.V.; Brooks, J.D.; Feldman, D. Molecular activity of 1,25-dihydroxyvitamin D3 in primary cultures of human prostatic epithelial cells revealed by cDNA microarray analysis. J. Steroid Biochem. Mol. Biol. 2004, 92, 131–141. [Google Scholar] [CrossRef]
- Lambert, J.R.; Kelly, J.A.; Shim, M.; Huffer, W.E.; Nordeen, S.K.; Baek, S.J.; Eling, T.E.; Lucia, M.S. Prostate derived factor in human prostate cancer cells: Gene induction by vitamin D via a p53-dependent mechanism and inhibition of prostate cancer cell growth. J. Cell. Physiol. 2006, 208, 566–574. [Google Scholar] [CrossRef] [PubMed]
- Bao, B.Y.; Ting, H.J.; Hsu, J.W.; Lee, Y.F. Protective role of 1 alpha, 25-dihydroxyvitamin D3 against oxidative stress in nonmalignant human prostate epithelial cells. Int. J. Cancer 2008, 122, 2699–2706. [Google Scholar] [CrossRef] [PubMed]
- Papa, L.; Hahn, M.; Marsh, E.L.; Evans, B.S.; Germain, D. SOD2 to SOD1 switch in breast cancer. J. Biol. Chem. 2014, 289, 5412–5416. [Google Scholar] [CrossRef] [PubMed] [Green Version]
- Muindi, J.R.; Modzelewski, R.A.; Peng, Y.; Trump, D.L.; Johnson, C.S. Pharmacokinetics of 1alpha,25-dihydroxyvitamin D3 in normal mice after systemic exposure to effective and safe antitumor doses. Oncology 2004, 66, 62–66. [Google Scholar] [CrossRef]
- Mizwicki, M.T.; Bula, C.M.; Mahinthichaichan, P.; Henry, H.L.; Ishizuka, S.; Norman, A.W. On the mechanism underlying (23S)-25-dehydro-1alpha(OH)-vitamin D3-26,23-lactone antagonism of hVDRwt gene activation and its switch to a superagonist. J. Biol. Chem. 2009, 284, 36292–36301. [Google Scholar] [CrossRef] [Green Version]
- Parise, R.A.; Egorin, M.J.; Kanterewicz, B.; Taimi, M.; Petkovich, M.; Lew, A.M.; Chuang, S.S.; Nichols, M.; El-Hefnawy, T.; Hershberger, P.A. CYP24, the enzyme that catabolizes the antiproliferative agent vitamin D, is increased in lung cancer. Int. J. Cancer 2006, 119, 1819–1828. [Google Scholar] [CrossRef]
- Sergeev, I.N. Vitamin D-mediated apoptosis in cancer and obesity. Horm. Mol. Biol. Clin. Investig. 2014, 20, 43–49. [Google Scholar] [CrossRef]
- Patti, A.; Gennari, L.; Merlotti, D.; Dotta, F.; Nuti, R. Endocrine actions of osteocalcin. Int. J. Endocrinol. 2013, 2013, 846480. [Google Scholar] [CrossRef] [Green Version]
- Gao, J.; Feng, Z.; Wang, X.; Zeng, M.; Liu, J.; Han, S.; Xu, J.; Chen, L.; Cao, K.; Long, J.; et al. SIRT3/SOD2 maintains osteoblast differentiation and bone formation by regulating mitochondrial stress. Cell Death Differ. 2018, 25, 229–240. [Google Scholar] [CrossRef] [Green Version]
- Consiglio, M.; Viano, M.; Casarin, S.; Castagnoli, C.; Pescarmona, G.; Silvagno, F. Mitochondrial and lipogenic effects of vitamin D on differentiating and proliferating human keratinocytes. Exp. Dermatol. 2015, 24, 748–753. [Google Scholar] [CrossRef]
- Manson, J.E.; Cook, N.R.; Lee, I.M.; Christen, W.; Bassuk, S.S.; Mora, S.; Gibson, H.; Gordon, D.; Copeland, T.; D’Agostino, D.; et al. Vitamin D Supplements and Prevention of Cancer and Cardiovascular Disease. N. Engl. J. Med. 2019, 380, 33–44. [Google Scholar] [CrossRef] [PubMed]
- Vaughan-Shaw, P.G.; O’Sullivan, F.; Farrington, S.M.; Theodoratou, E.; Campbell, H.; Dunlop, M.G.; Zgaga, L. The impact of vitamin D pathway genetic variation and circulating 25-hydroxyvitamin D on cancer outcome: Systematic review and meta-analysis. Br. J. Cancer 2017, 116, 1092–1110. [Google Scholar] [CrossRef] [PubMed]
- Chakraborti, C.K. Vitamin D as a promising anticancer agent. Indian J. Pharmacol. 2011, 43, 113–120. [Google Scholar] [CrossRef] [PubMed] [Green Version]
- Stambolsky, P.; Tabach, Y.; Fontemaggi, G.; Weisz, L.; Maor-Aloni, R.; Siegfried, Z.; Shiff, I.; Kogan, I.; Shay, M.; Kalo, E.; et al. Modulation of the vitamin D3 response by cancer-associated mutant p53. Cancer Cell 2010, 17, 273–285. [Google Scholar] [CrossRef] [PubMed] [Green Version]
- Chandar, N.; Billig, B.; McMaster, J.; Novak, J. Inactivation of p53 gene in human and murine osteosarcoma cells. Br. J. Cancer 1992, 65, 208–214. [Google Scholar] [CrossRef] [Green Version]
- Sentman, M.L.; Granstrom, M.; Jakobson, H.; Reaume, A.; Basu, S.; Marklund, S.L. Phenotypes of mice lacking extracellular superoxide dismutase and copper- and zinc-containing superoxide dismutase. J. Biol. Chem. 2006, 281, 6904–6909. [Google Scholar] [CrossRef] [Green Version]
- Lu, W.; Ogasawara, M.A.; Huang, P. Models of reactive oxygen species in cancer. Drug. Discov. Today Dis. Models 2007, 4, 67–73. [Google Scholar] [CrossRef]
- Finley, L.W.; Carracedo, A.; Lee, J.; Souza, A.; Egia, A.; Zhang, J.; Teruya-Feldstein, J.; Moreira, P.I.; Cardoso, S.M.; Clish, C.B.; et al. SIRT3 opposes reprogramming of cancer cell metabolism through HIF1alpha destabilization. Cancer Cell 2011, 19, 416–428. [Google Scholar] [CrossRef] [Green Version]
- Price, P.A.; Baukol, S.A. 1,25-Dihydroxyvitamin D3 increases synthesis of the vitamin K-dependent bone protein by osteosarcoma cells. J. Biol. Chem. 1980, 255, 11660–11663. [Google Scholar]
- Sergeev, I.N.; Norman, A.W. Vitamin K-dependent gamma-carboxylation of the 1,25-dihydroxyvitamin D3 receptor. Biochem. Biophys. Res. Commun. 1992, 189, 1543–1547. [Google Scholar] [CrossRef]
- Nakai, K.; Fujii, H.; Kono, K.; Goto, S.; Kitazawa, R.; Kitazawa, S.; Hirata, M.; Shinohara, M.; Fukagawa, M.; Nishi, S. Vitamin D activates the Nrf2-Keap1 antioxidant pathway and ameliorates nephropathy in diabetic rats. Am. J. Hypertens 2014, 27, 586–595. [Google Scholar] [CrossRef] [PubMed] [Green Version]
- Lisse, T.S.; King, B.L.; Rieger, S. Comparative transcriptomic profiling of hydrogen peroxide signaling networks in zebrafish and human keratinocytes: Implications toward conservation, migration and wound healing. Sci. Rep. 2016, 6, 20328. [Google Scholar] [CrossRef] [Green Version]
- Arbour, N.C.; Prahl, J.M.; DeLuca, H.F. Stabilization of the vitamin D receptor in rat osteosarcoma cells through the action of 1,25-dihydroxyvitamin D3. Mol. Endocrinol. 1993, 7, 1307–1312. [Google Scholar] [CrossRef] [Green Version]
- Ricca, C.; Aillon, A.; Bergandi, L.; Alotto, D.; Castagnoli, C.; Silvagno, F. Vitamin D Receptor Is Necessary for Mitochondrial Function and Cell Health. Int. J. Mol. Sci. 2018, 19, 1672. [Google Scholar] [CrossRef] [PubMed] [Green Version]
- Murphy, M.P. How mitochondria produce reactive oxygen species. Biochem. J. 2009, 417, 1–13. [Google Scholar] [CrossRef] [Green Version]
- Livak, K.J.; Schmittgen, T.D. Analysis of relative gene expression data using real-time quantitative PCR and the 2(-Delta Delta C(T)) Method. Methods 2001, 25, 402–408. [Google Scholar] [CrossRef] [PubMed]
Figure 1.
(A) The impact of 1,25D3 on MG-63 cell viability using the 3-(4,5-dimethylthiazol-2-yl)-2,5 diphenyl tetrazolium bromide (MTT) assay. The MTT (3-(4,5-dimethylthiazol-2-yl)-2,5-diphenyltetrazolium bromide) assay was performed in experiments with complete serum or charcoal-stripped serum supplementation for 24 and 48 h of incubation. The cells were treated with one addition of 1 pM to 1 µM 1,25D3 before the determination of cell viability. p ≤ 0.05 *, 0.01 **, 0.001 *** using the 2-way ANOVA with Bonferroni post hoc test (n = 5; error bars represent the SD). (B) Logarithmic dose vs. response graph (MTT assay 24–48 h). The calculated logIC50 for 1,25D3 in 48 h was 1.74 and the IC50 was 55.43 nM. In this figure the Hill slope is 1.0, which describes the steepness of the curve. The value R2 (R square) quantifies goodness of fit. It is a fraction between 0.0 and 1.0 and has no units. Higher values indicate that the model fits the data better. In this graph, R square is 0.8773 and degree of freedom = 34. (C) Degree of inhibition by 1,25D3 on MG-63 osteosarcoma cells after 48 h of treatment. The maximal inhibition value was obtained with 1 µM 1,25D3 and arbitrarily set to 100%.

Figure 2.
(A) Dose-dependent suppression of proliferating cell nuclear antigen (PCNA) transcript levels by vitamin D. Real-time PCR analysis of PCNA (proliferating cell nuclear antigen) transcript levels in MG-63 cells in complete media. (B) Dose- and time-dependent suppression of cytochrome P450 family 24 subfamily A member 1 (CYP24A1) transcript levels by vitamin D. Real-time PCR analysis of CYP24A1 (cytochrome P450 family 24 subfamily A member 1) transcript levels in MG-63 cells in complete media. (C) Dose- and time-dependent suppression of vitamin D receptor (VDR) transcript levels by vitamin D. Real-time PCR analysis of VDR (vitamin D receptor) transcript levels in MG-63 cells in complete media. (D) Dose- and time-dependent suppression of bone Gamma-Carboxyglutamate Protein, or osteocalcin (BGLAP) transcript levels by vitamin D. Real-time PCR analysis of BGLAP (bone Gamma-Carboxyglutamate Protein, or osteocalcin) transcript levels in MG-63 cells in complete media. p ≤ 0.05*, 0.01**, 0.001*** using the 2-way ANOVA with Bonferroni post hoc test (n = 3; error bars represent the SD). VAZ (vitamin D receptor antagonist ZK159222).

Figure 3.
(A) Minimal effects on cytochrome c oxidase subunit 2 (COXII) transcript levels by vitamin D. Real-time PCR analysis of COXII (cytochrome c oxidase subunit 2) transcript levels in MG-63 cells in complete media. (B) Minimal effects on subunit 4 isoform 1 (COX4I1) transcript levels by vitamin D. Real-time PCR analysis of COX4I1 (subunit 4 isoform 1) transcript levels in MG-63 cells in complete media. (C) Dose-dependent suppression of superoxide dismutase 1 (SOD1) transcript levels by vitamin D. Real-time PCR analysis of SOD1 (superoxide dismutase 1) transcript levels in MG-63 cells in complete media. (D) Dose- and time-dependent upregulation of superoxide dismutase 2 (SOD2) transcript levels by vitamin D. Real-time PCR analysis of SOD2 (superoxide dismutase 2) transcript levels in MG-63 cells in complete media. (E) Dose- and time-dependent suppression of catalase (CAT) transcript levels by vitamin D. Real-time PCR analysis of CAT (catalase) transcript levels in MG-63 cells in complete media. (F) Transcript levels presented as arbitrary units normalized to beta actin amounts. p ≤ 0.05*, 0.01**, 0.001*** using the 2-way ANOVA with Bonferroni post hoc test (n = 3; error bars represent the SD). VAZ (vitamin D receptor antagonist ZK159222).

Figure 4.
Schema representing the SOD1-to-SOD2 switch in MG-63 osteosarcoma cells after vitamin D treatment. Cancer cells generally express elevated levels of SOD1 (superoxide dismutase 1) compared to SOD2 (superoxide dismutase 2) with respect to non-tumorigenic cells. This indicates a higher reactive oxygen species (ROS) burden in the cancer cells. Vitamin D treatment in a dose- and time-dependent manner promotes an increase in SOD2 levels, with concomitant decreases in antioxidant CAT (catalase) and SOD1 levels, indicative of mitochondrial stress relief via enhanced SOD2 activity.

© 2020 by the author. Licensee MDPI, Basel, Switzerland. This article is an open access article distributed under the terms and conditions of the Creative Commons Attribution (CC BY) license (http://creativecommons.org/licenses/by/4.0/).
Share and Cite
MDPI and ACS Style
Lisse, T.S. Vitamin D Regulation of a SOD1-to-SOD2 Antioxidative Switch to Prevent Bone Cancer. Appl. Sci. 2020, 10, 2554. https://0-doi-org.brum.beds.ac.uk/10.3390/app10072554
AMA Style
Lisse TS. Vitamin D Regulation of a SOD1-to-SOD2 Antioxidative Switch to Prevent Bone Cancer. Applied Sciences. 2020; 10(7):2554. https://0-doi-org.brum.beds.ac.uk/10.3390/app10072554
Chicago/Turabian StyleLisse, Thomas S. 2020. "Vitamin D Regulation of a SOD1-to-SOD2 Antioxidative Switch to Prevent Bone Cancer" Applied Sciences 10, no. 7: 2554. https://0-doi-org.brum.beds.ac.uk/10.3390/app10072554
Note that from the first issue of 2016, this journal uses article numbers instead of page numbers. See further details here.