A Learning-Based Image Fusion for High-Resolution SAR and Panchromatic Imagery


1
Department of Advanced Technology Fusion, Konkuk University, Seoul 05029, Korea
2
Department of Civil & Environmental Engineering, Konkuk University, Seoul 05029, Korea
*
Author to whom correspondence should be addressed.
Appl. Sci. 2020, 10(9), 3298; https://0-doi-org.brum.beds.ac.uk/10.3390/app10093298
Submission received: 31 March 2020
/
Revised: 29 April 2020
/
Accepted: 7 May 2020
/
Published: 9 May 2020
(This article belongs to the Special Issue Image Simulation in Remote Sensing)
Abstract
:Image fusion is an effective complementary method to obtain information from multi-source data. In particular, the fusion of synthetic aperture radar (SAR) and panchromatic images contributes to the better visual perception of objects and compensates for spatial information. However, conventional fusion methods fail to address the differences in imaging mechanism and, therefore, they cannot fully consider all information. Thus, this paper proposes a novel fusion method that both considers the differences in imaging mechanisms and sufficiently provides spatial information. The proposed method is learning-based; it first selects data to be used for learning. Then, to reduce the complexity, classification is performed on the stacked image, and the learning is performed independently for each class. Subsequently, to consider sufficient information, various features are extracted from the SAR image. Learning is performed based on the model’s ability to establish non-linear relationships, minimizing the differences in imaging mechanisms. It uses a representative non-linear regression model, random forest regression. Finally, the performance of the proposed method is evaluated by comparison with conventional methods. The experimental results show that the proposed method is superior in terms of visual and quantitative aspects, thus verifying its applicability.
1. Introduction
Recently, various high-resolution satellite sensors have increasingly been developed, especially the synthetic aperture radar (SAR) imaging sensor, which has an important advantage in Earth observations [1,2]. It is an active sensor that provides its own source of illumination, which is independent of solar illumination and is not affected by daylight or night darkness [3]. It can also penetrate through atmospheric effects, allowing for Earth observation regardless of weather conditions such as rain, fog, smoke, or clouds [4,5]. Information contained in a SAR image depends on the backscattering characteristics of the surface targets and is sensitive to the geometry of the targets [6]. The image provides information on surface roughness, object shape, orientation, or moisture content [7,8]. Furthermore, the SAR image can highlight objects that have a low contrast in optical images. However, interpreting the details in SAR images is a challenging task for several reasons: (1) SAR images inherently contain geometric distortions due to distance-dependence along the range axis and signatures related to radar signal wavelengths [9]; (2) the human eye is familiar with the visible part of the electromagnetic spectrum and is not adapted to the microwave-scattering phenomenon [10]; (3) the reflectance properties of objects in the microwave range depend on the frequency band used and may significantly differ from the usual assumption of diffuse reflection at the Earth’s surface [11]; (4) since SAR images are inherently coherent during the process of their generation, speckle noise is inevitable in the resulting images, rendering the images unintuitive [12]; and (5) such images also contain the after-effects caused by foreshortening, slant-range scale distortion, layover, and shadows [13,14]. Thus, the SAR image can be visually difficult to interpret and, ultimately, this data improvement approach is designed at the end to be implemented in the monitoring and analyzing earth surface issues that offering an advanced solution for many applications including environmental studies [15].
To improve the quality and interpretability of SAR images, image fusion with optical images, which contain information regarding reflective and emissive characteristics, can be a good alternative [16,17,18]. In particular, the panchromatic image can be utilized because it is physically sensitive to ground objects and reflects the objects’ contour information with high spatial resolution and abundant textural features [19]. The overall concept of image fusion between the SAR and panchromatic images is to incorporate spatial details extracted from the panchromatic image into the SAR image by using an appropriate algorithm [20]. Therefore, the fusion of the SAR and panchromatic images makes it possible to use complementary information and contributes to a better understanding of the objects in target areas [21]. Furthermore, the fusion of SAR and panchromatic images has additional benefits, such as the sharpening of image quality, enhancement of certain features that are invisible with either data set in the non-combined state, complementation of data sets for improved classification, detection of changes using multi-temporal data, and substitution of missing information in one image with signals from another sensor image [1].
However, because of the significant differences between the imaging mechanisms of the SAR and optical sensors, the generation of surface features of the same object are different in SAR and panchromatic images [5]. Conventional image-fusion methods such as principal component analysis (PCA) and high-pass filtering are not appropriate because they do not consider the differences in imaging mechanisms and the spectrum characteristics between the two image types [22]. An alternative approach is multiscale decomposition, based on which various methods have been proposed for the fusion of SAR and panchromatic images; however, these methods have some limitations [19,20,22,23]. For image fusion based on these methods, the SAR and panchromatic images are represented by the fixed orthogonal basis function, and the image fusion is performed by the fusion of the coefficients of different sub-bands in the transform domain [24]. Because some features cannot be represented sparsely, this fusion cannot represent all useful features accurately due to limited fixed transforms [20]. In particular, the discrete wavelet transforms (DWT) fusion method only uses features of single pixels to make decisions, and it is not shift-invariant [25]. Similarly, the contourlet transform (CT)-based fusion method lacks shift-invariance, which results in pseudo-Gibbs phenomena around singularities, and it has difficulty in preserving edge information. The non-subsampled contourlet transform (NSCT)-based method, which is a fully shift-invariant form of the CT, leads to better frequency selectivity and regularity [26]. However, this method still fails to fuse the features of physically heterogenous images [5]. Another approach is the sparse representation method, in which the generation of dictionary and sparse coding is crucial [24]. This method can extract potential information from input images in addition to representing them sparsely; however, this method does have limitations. Firstly, the advanced sparse coefficients fusion rule may cause spatial inconsistency, and secondly, the trained dictionary cannot accurately reflect the complex structure and detail of the input images [27].
To overcome these limitations, this study proposes a new image-fusion method that utilizes useful features as much as possible and considers the differences in imaging mechanisms. Instead of directly fusing pixels or decomposing them to perform fusion in a limited transform, this algorithm aims to extract sufficient features and establish relationships to fuse the SAR and panchromatic images. This makes it possible to contain the structural and detailed information of panchromatic images and increase the overall interpretability of SAR images [28]. Furthermore, a learning-based approach is used to account for the differences in imaging mechanisms of the SAR and panchromatic images. Random forest (RF) regression, which can model non-linear relationships, is utilized, and learning is performed for each class to reduce the complexity of the algorithm and for better predictions [29,30]. Then, experiments are performed on multiple scenes to demonstrate the capability and performance of the proposed method. The results are comprehensively compared with those of conventional image-fusion methods. The main contributions of this study can be summarized as follows: (1) this is the first learning-based approach for fusing single high-resolution SAR and panchromatic images; (2) to consider the differences in imaging mechanisms, this method uses RF regression, which can model non-linear patterns, avoids overfitting, and is relatively robust to the presence of noise; (3) this method performs classification of the image, where the complexity is reduced by establishing relationships for each class.; and (4) this method extracts various features to consider sufficient information.
The rest of this paper is organized as follows: Section 2 describes materials used in detail and the proposed algorithm in detail. In Section 3, the results of the proposed method are presented, and they are compared with those of the conventional image-fusion methods and discussed. Finally, Section 4 concludes the paper.
2. Materials and Methods
2.1. Study Site and Dataset
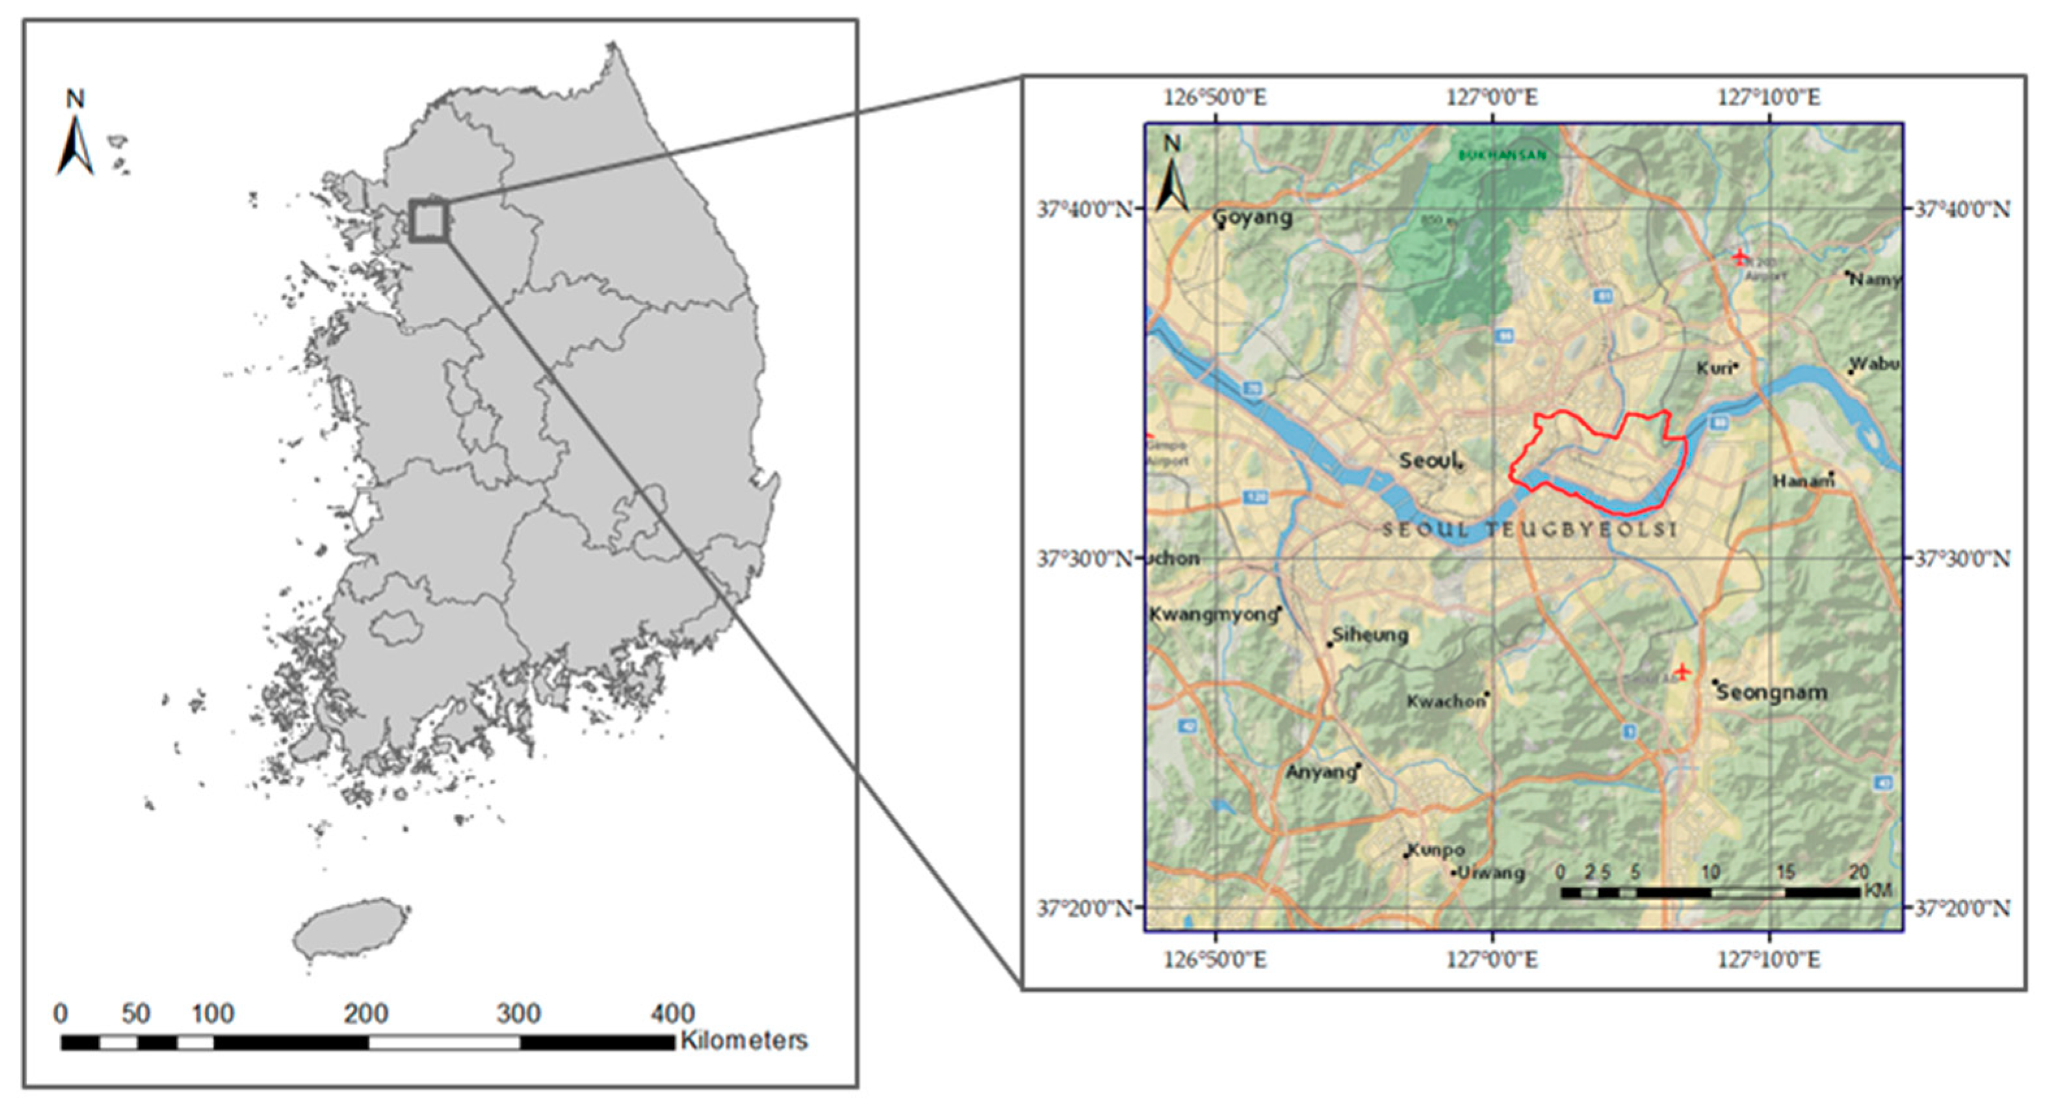
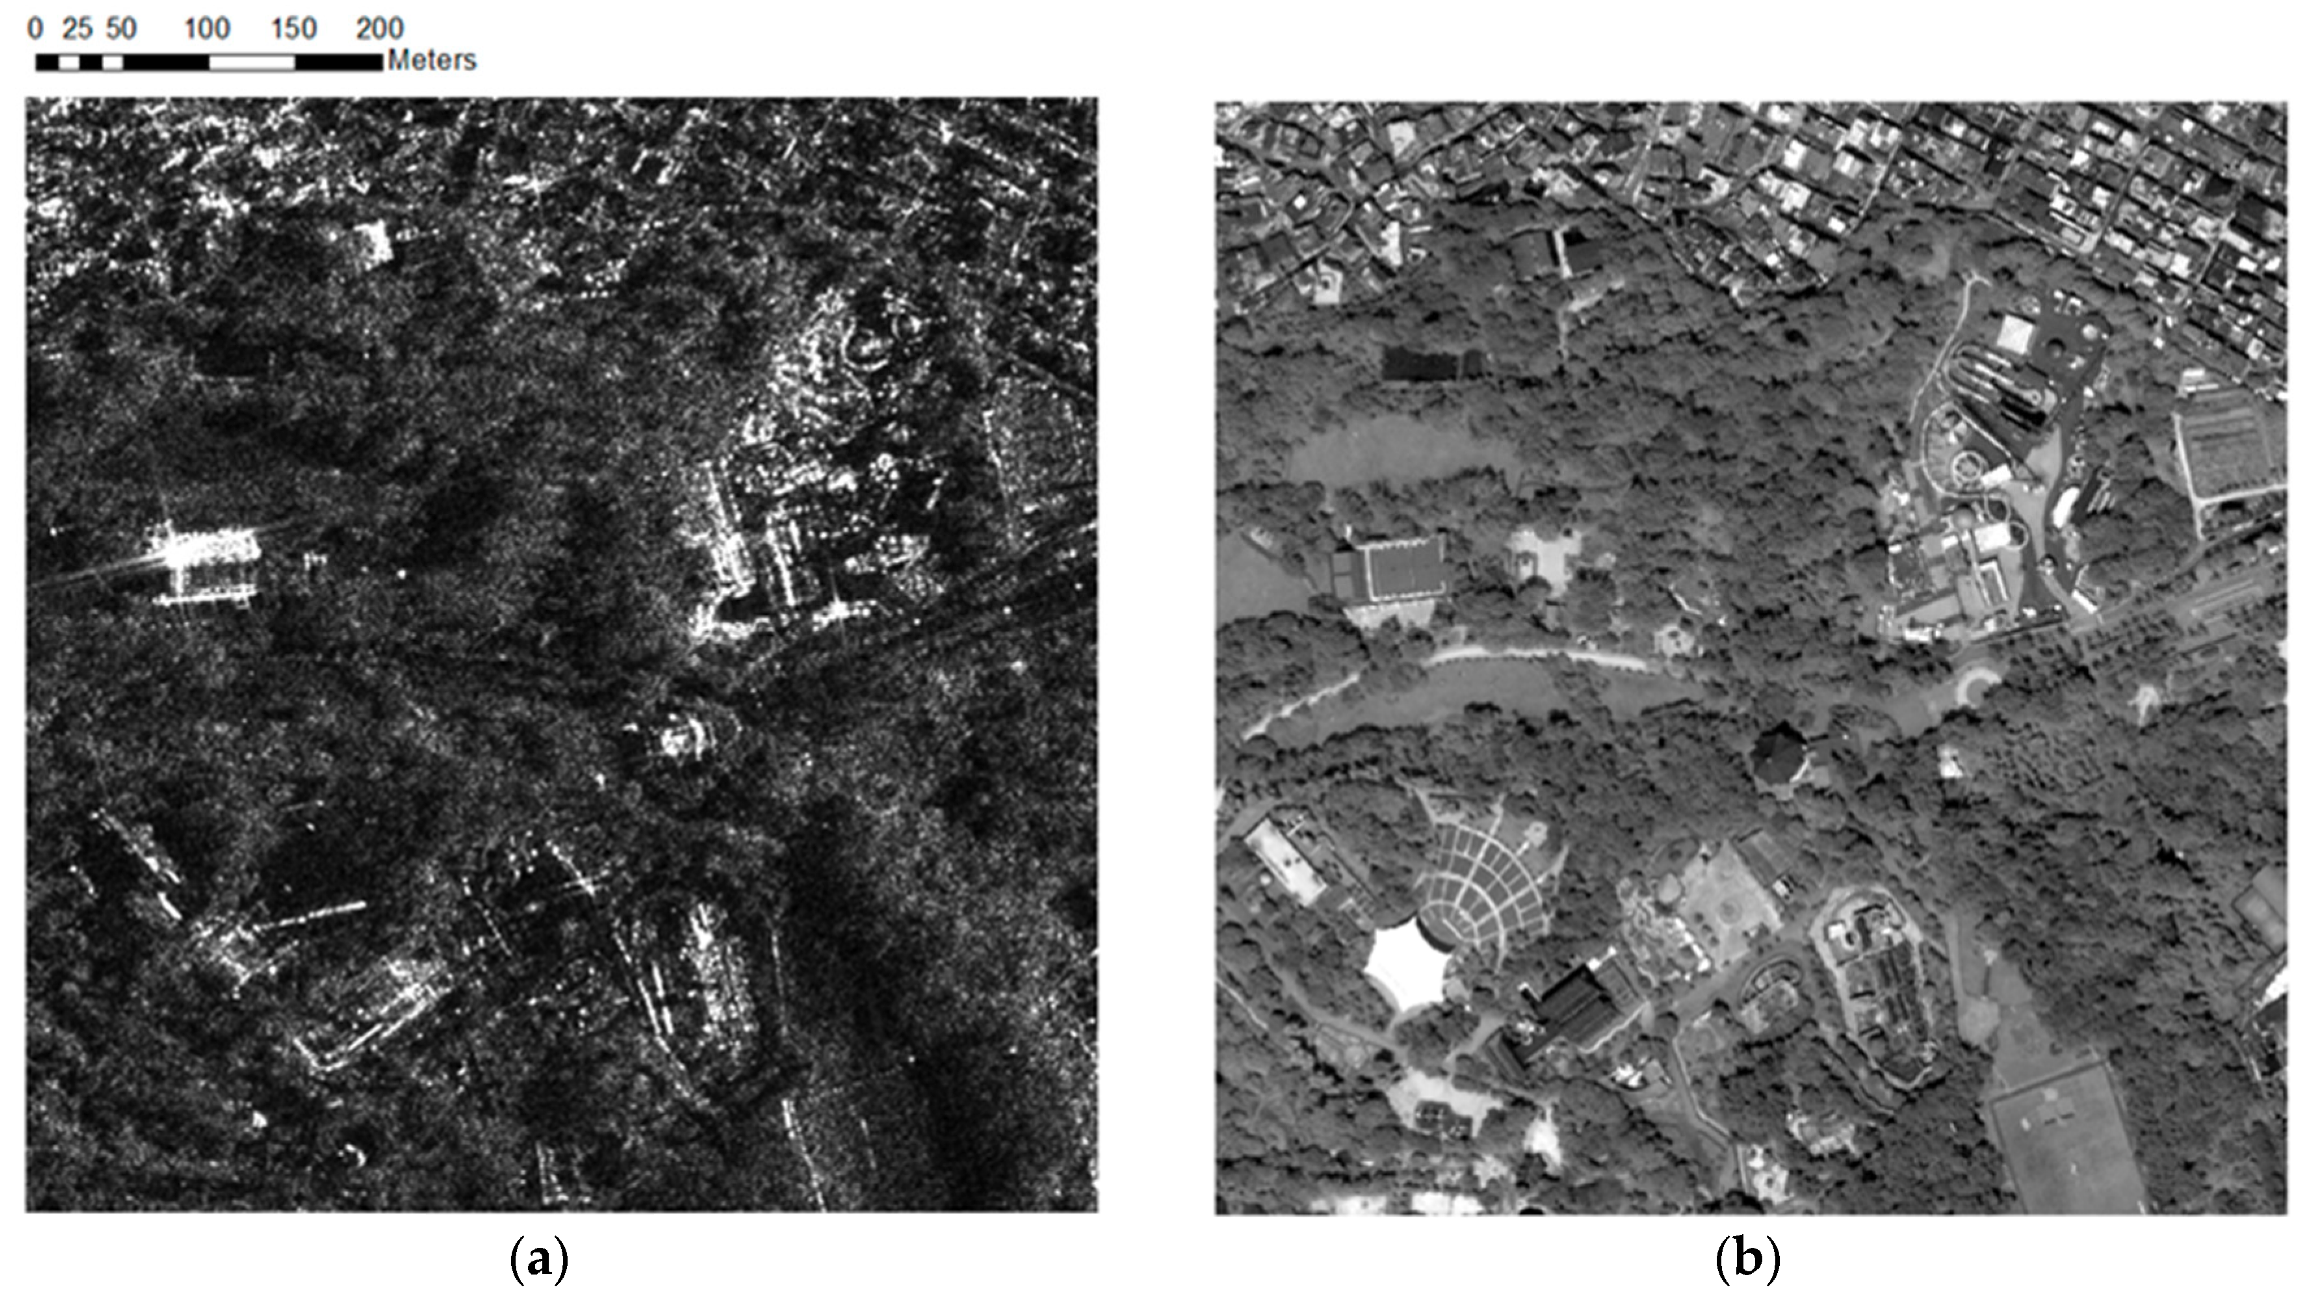
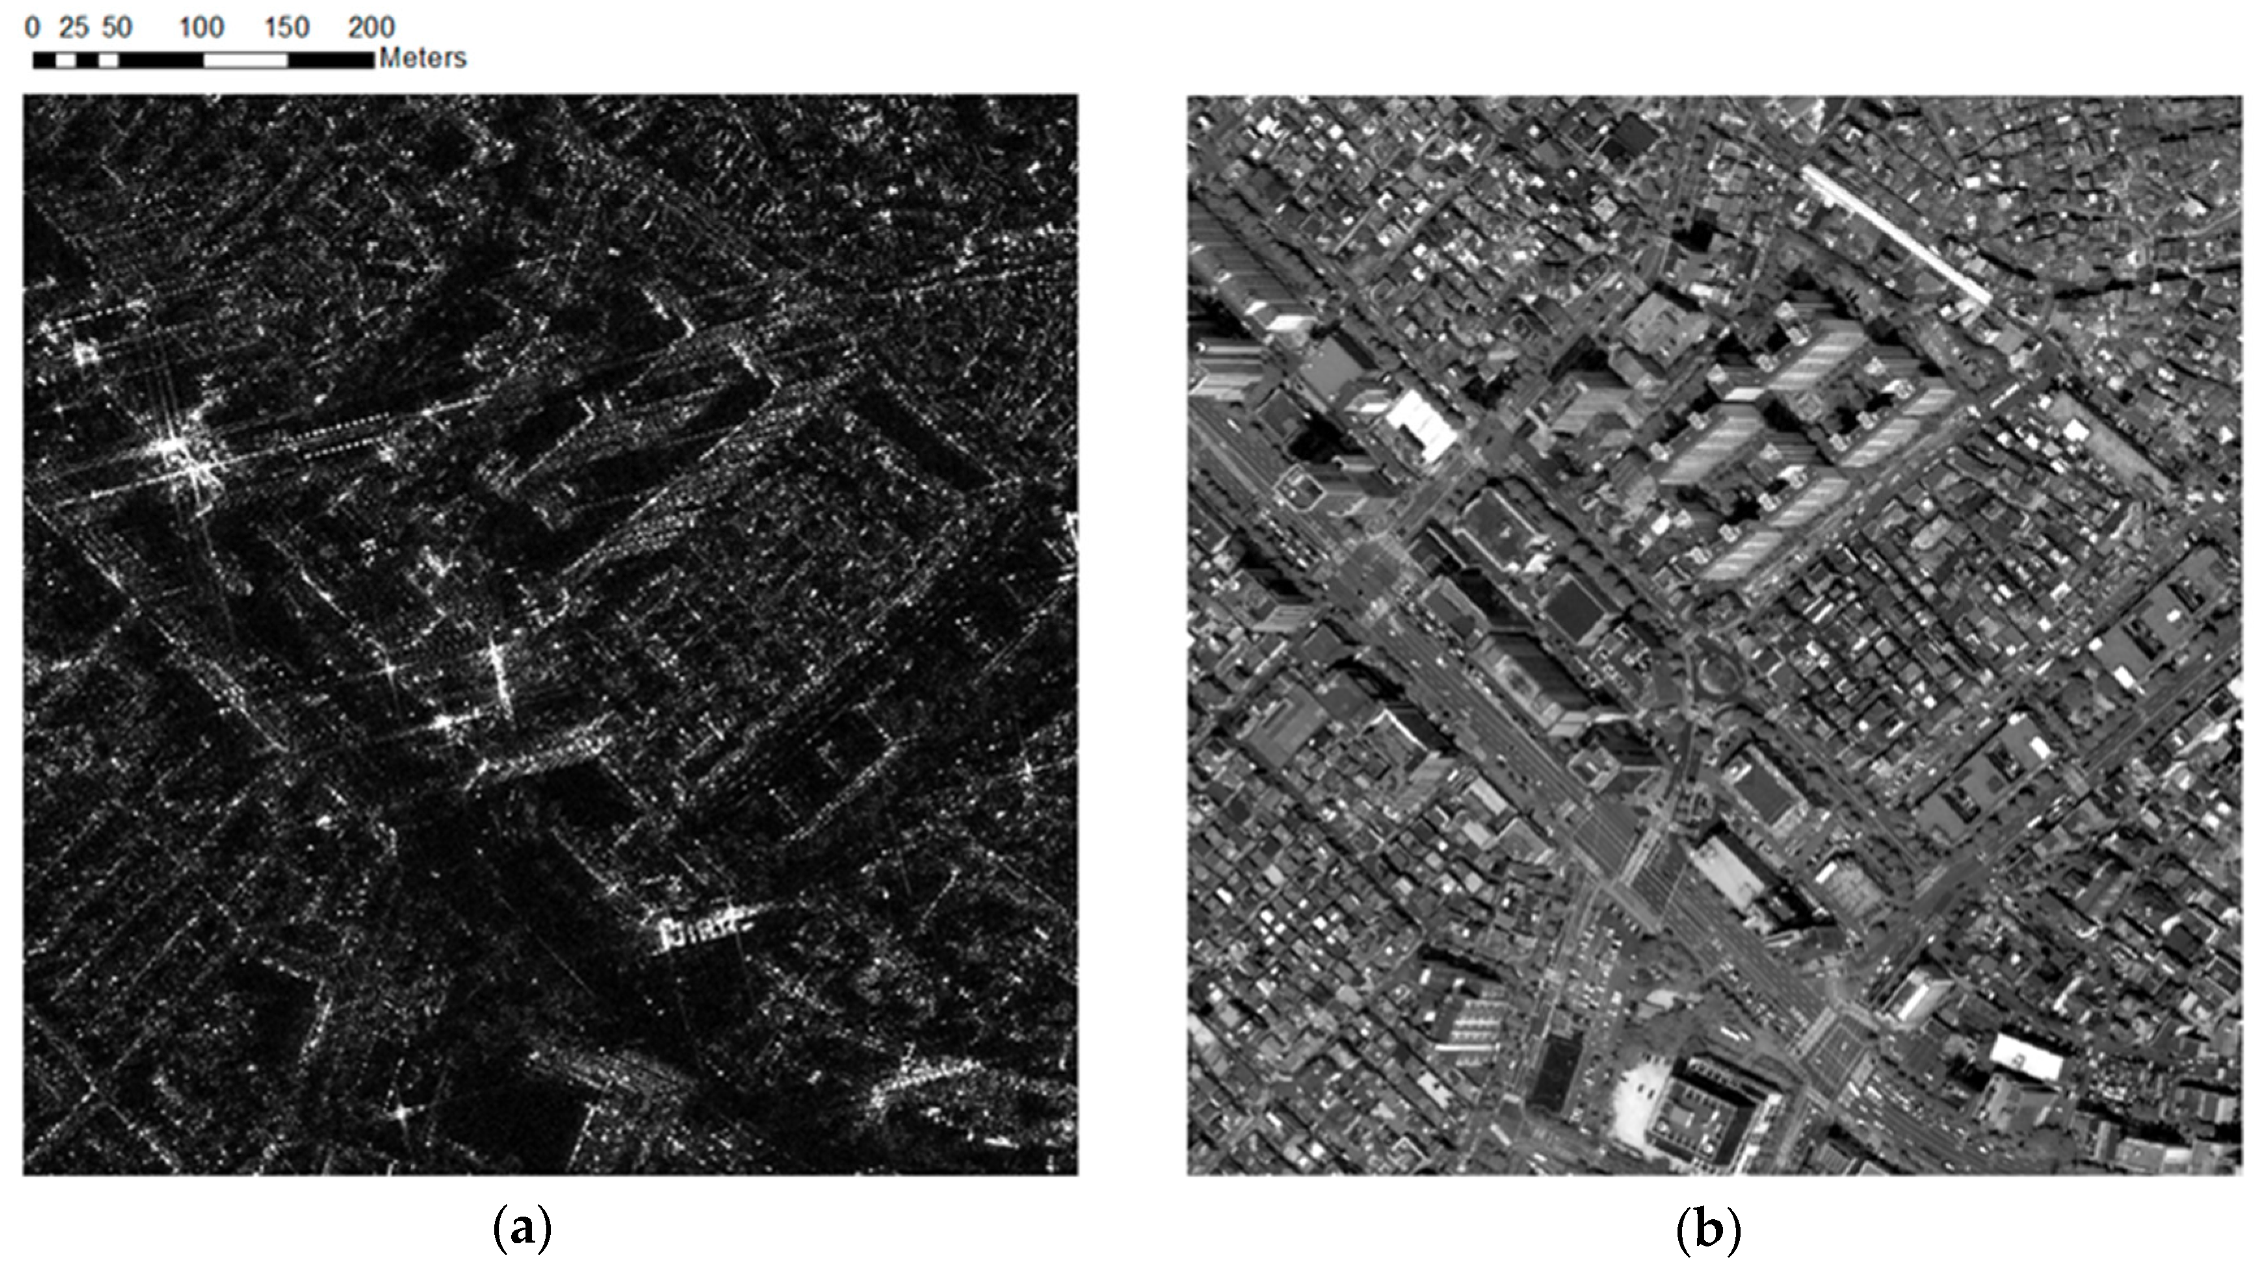
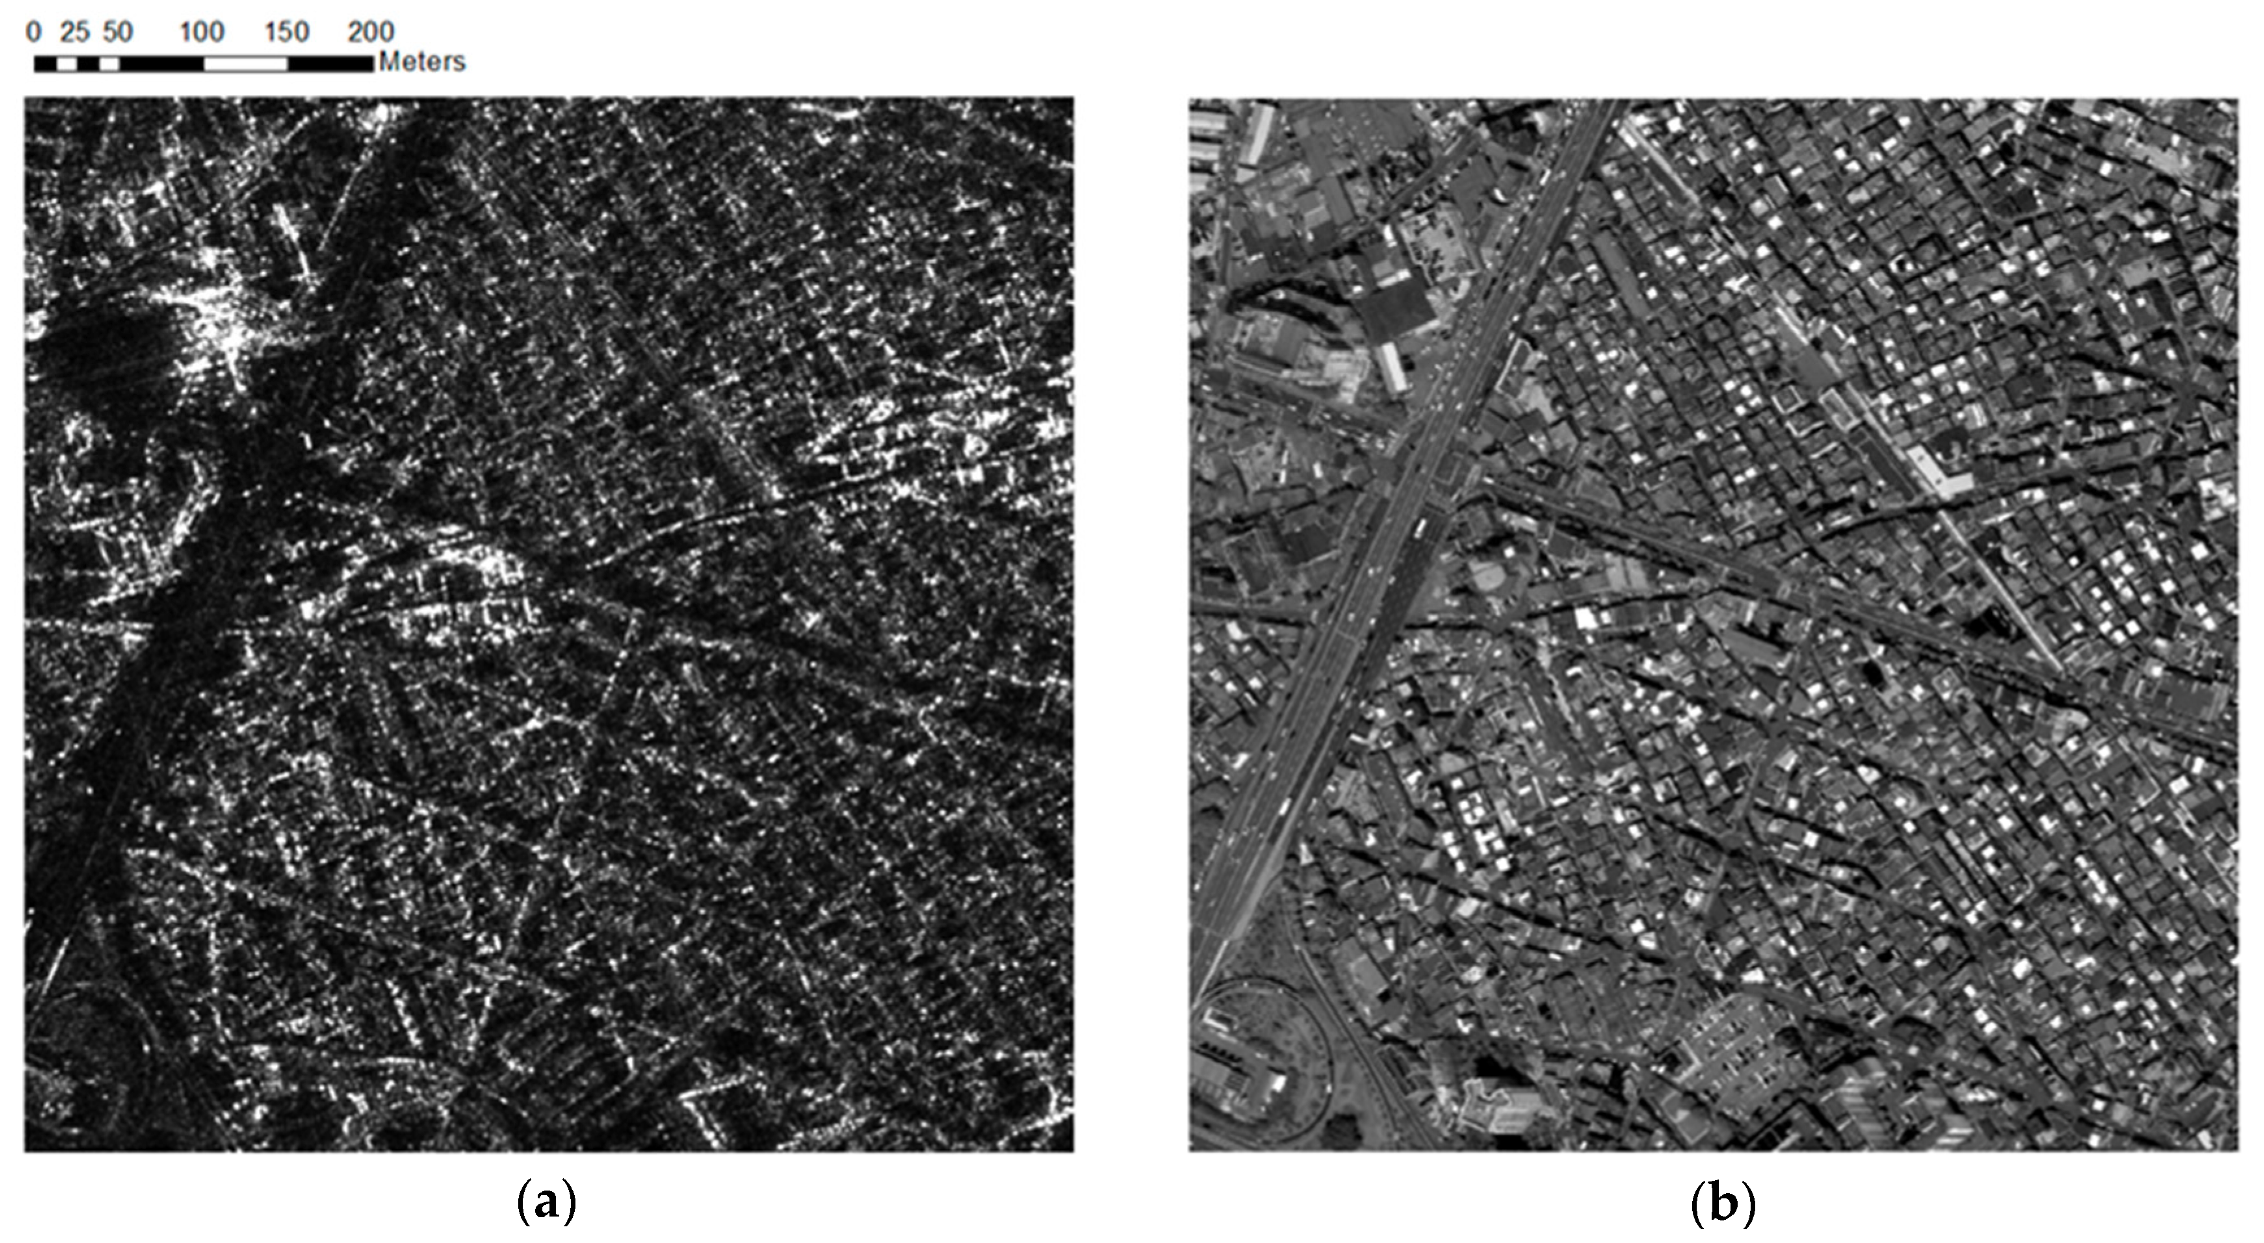
The study areas are Gwangjin-gu and Seongdong-gu, located in Seoul, in central South Korea (Figure 1). These areas are covered by forests, grass, barren land, water, and developed structures; thus, they represent an extensive range of terrain morphologies. The dataset used in the experiments for the panchromatic image type is WorldView-3, and for the SAR image type, the Korea Multi-Purpose Satellite-5 (KOMPSAT-5) dataset is used. The WorldView-3 dataset used in this study was acquired on 7 August 2015; the images in this dataset have a spatial resolution of 0.31 m and a radiometric resolution of 11 bits [31]. The KOMPSAT-5 dataset was acquired on 10 September 2015; it was obtained in the enhanced high-resolution mode with a spatial resolution of 1 m, an ascending orbit, and horizontal transmit-horizontal receive (HH) polarization. The processing level was L1D, which performs terrain correction and then geolocates onto a digital elevation model (DEM) with cartographic projection [32]. Initially, speckle noise exists in the SAR images; however, it is expected to reduce through filtering, thereby providing better information. In this study, a gamma map filter of 5 × 5 kernels, which is the most efficient filter for reducing speckles while preserving object edges, is selected for speckle filtering [33]. Furthermore, because the filtered KOMPSAT-5 images should be calculated with the same weights as the weights used for the WordlView-3 images, the filtered KOMPSAT-5 images are configured with a matching pixel value range [20]. For the fusion scheme, the KOMPSAT-5 images are resampled at a resolution of 0.31 m to match that of the WorldView-3 images. Next, to remove the misregistration error term, image registration is applied using manual ground control points, followed by geometric transformation. In addition, the coordinate system of each image is projected as the Universal Transverse Mercator Coordinate System (UTM). Then, for a reasonable computation time, experiments are performed with subsets of 2000 × 2000 pixels, and the total area of the three sites is selected to validate the proposed method. Table 1 describes the specifications of the data, and Figure 2, Figure 3 and Figure 4 show the preprocessed experimental images for three sites.
2.2. Methods
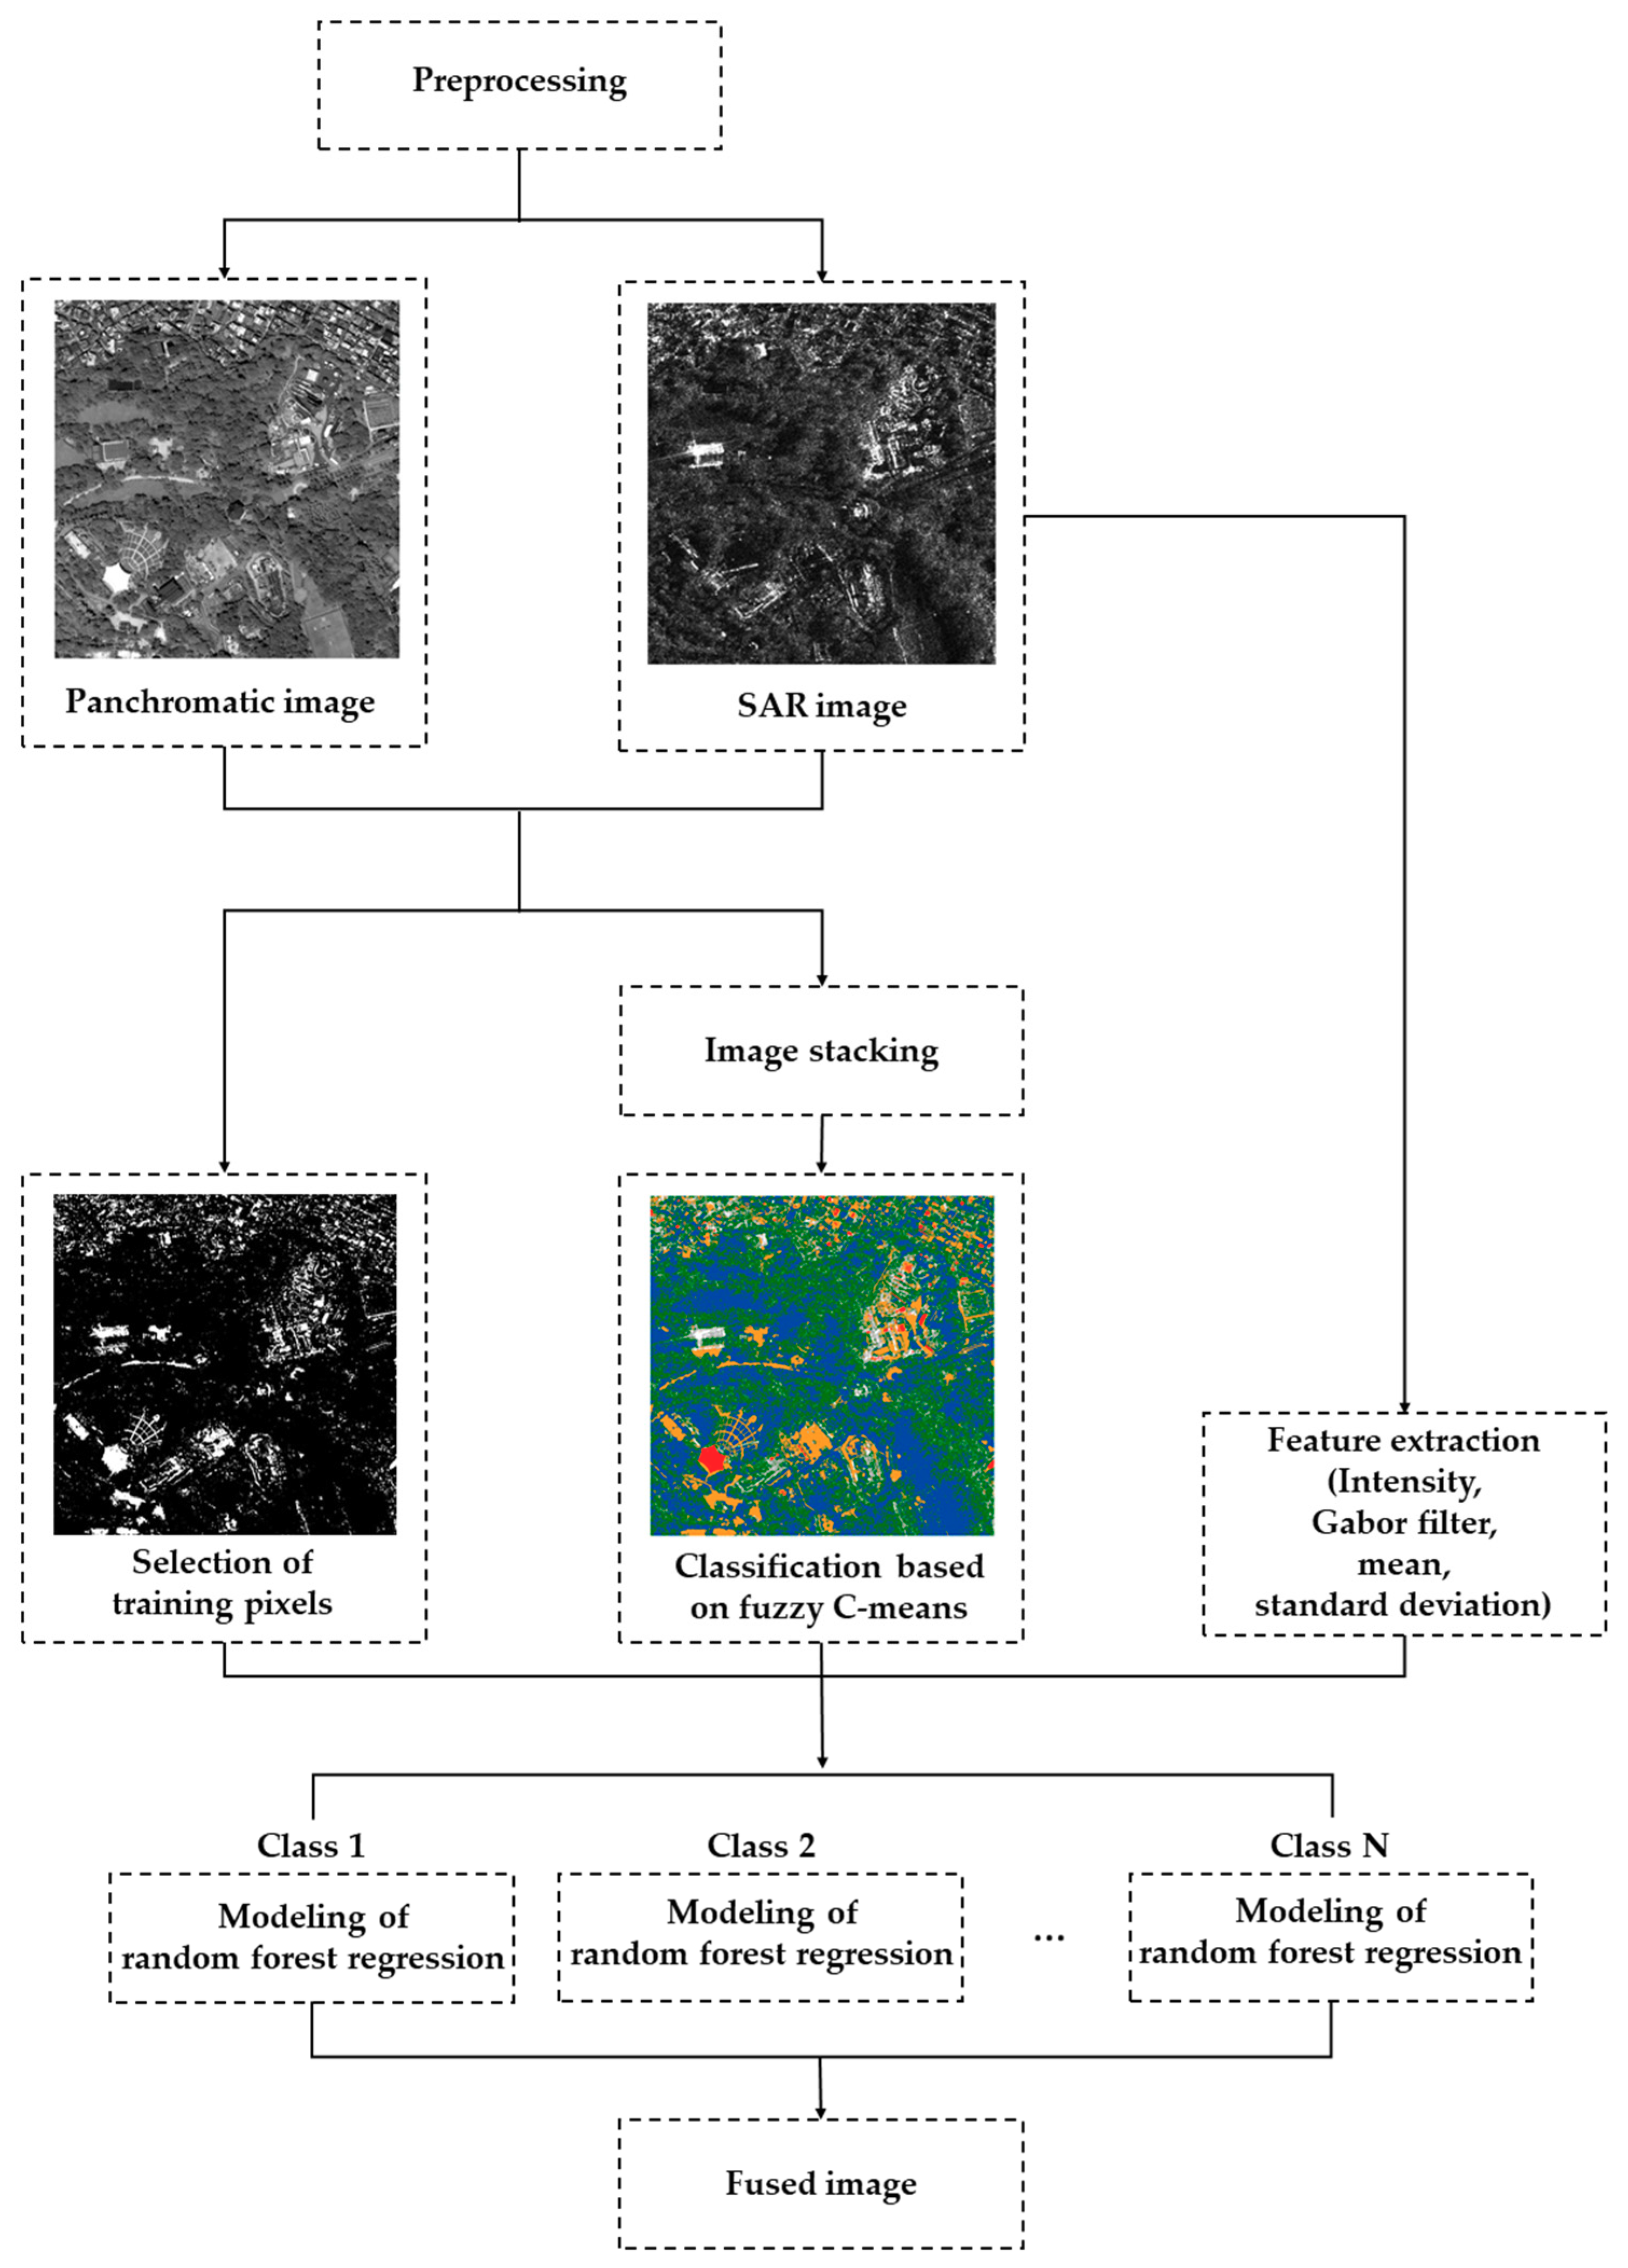
The proposed fusion framework can be decomposed into four steps for the preprocessed images: (1) selection of training pixels, (2) classification, (3) feature extraction, and (4) learning-based image fusion; they are shown in Figure 5. In the first step, the pixels to be used for the training are selected, and in the second step, classification is performed on the SAR and panchromatic images. In the third step, feature descriptors are extracted to be used for training as the SAR image, and in the fourth step, fusion is performed by establishing a relationship based on learning. These steps are described below.
2.2.1. Selection of Training Pixels
In the step involving the selection of training pixels, meaningful pixels to be used for establishing the relationship should be selected. In particular, training pixels should be selected to consider the differences in imaging mechanisms. This study selects invariant pixels, that is, pixels with little difference in reflectance between the two images. In other words, the relationships are established based on invariant pixels, and the values of pixels with substantially large differences are predicted [28,34]. The invariant pixels are acquired through image differencing, which is a method that subtracts pixel values between the SAR and panchromatic images, in accordance with Equation (1):
where is the pixel value in the SAR image, is the pixel value in the panchromatic image, i and j represent rows and columns, respectively, and C is an arbitrary constant. Then, Otsu’s method is used to classify change and no-change, where the no-change region is selected as the invariant pixels.
2.2.2. Classification
To reduce the complexity of the algorithm and to enforce a higher prediction, classification is performed in this study [28]. In other words, each class is obtained, and learning is performed independently for each class. Here, classification is performed by stacking two images to consider the characteristics of both SAR and panchromatic images using fuzzy C-means (FCM), which is an unsupervised classification algorithm [35]. FCM is based on the optimization of the objective function based on the similarity measure considering the distance between data and the center of the cluster as shown by Equation (2):
where is the number of data; is the number of clusters; is the membership function and satisfied the condition , ; is a weighting exponent that control the degree of fuzziness in the resulting membership functions and is set to 2 for simplicity [36]; is squared distance between and , in which is a dataset to be grouped and is the cluster center. To minimize the objective function, the FCM algorithm performs an iterative process, and the membership functions and cluster centers are defined as Equations (3) and (4):
and are iteratively updated to obtain an optimal solution, and the iterative process ends when , where and are the membership functions in the and iterations and is a predefined small positive threshold [37]. Furthermore, the number of clusters is a key parameter in the proposed method as it determines the number of training models in which land-cover distribution characteristics as well as performance and training time should be considered. If there are not enough clusters, the land-cover distribution characteristics will be neglected, and if there are too many clusters, the training time will increase, complex computations will be necessary, and overtraining may occur. Therefore, in this study, the number of clusters is set to 6 to not only obtain appropriate performance and training times but also to consider the land cover distribution characteristics [28].
2.2.3. Feature Extraction
Conventional image-fusion methods use only the pixel values of SAR and panchromatic images. However, in general, the gray level of single pixels is not informative; therefore, additional information other than the pixel values is necessary [38,39]. To ensure that abundant information is considered, this study uses texture information. Several approaches exist for extracting texture features, for example, the gray-level co-occurrence matrix, local binary patterns, and Gabor filters [40,41,42], among which the Gabor filter is selected; this filter is inspired by a multi-channel filtering theory for processing visual information in the human visual system [43]. It is advantageous in terms of invariance to illumination, rotation, scale, and translation; thus, it has been successfully applied for various image processing and machine vision applications [44]. The 2-D Gabor function comprises a complex sinusoid modulated by a Gaussian envelope, in which the Gabor filter includes a real component and an imaginary one. In this study, because of the substantial magnitude of the images, only real components were considered. Calculation without imaginary components would cause small discrepancies; however, the results are still efficient in terms of feature extraction time [45]. This can be represented as Equations (5)–(7):
where and are pixel positions; is the spatial aspect ratio (the default value is 0.5 in [46]); is the standard deviation of the Gaussian envelope; is the wavelength of the sinusoidal factor and 1/ is equal to the spatial frequency ; is the phase offset, where and return the real component and imaginary component, respectively [47]; and is the orientation.
Gabor features, generally taken as Gabor filters, are constructed by selecting different spatial frequencies and orientations. The frequency corresponds to scale information and is expressed as Equation (8):
where is the th frequency; is the central frequency of the filter at the highest frequency, for which the most commonly adopted value is , based on the suggestion that should be lower than 0.5 [48,49]; and is the scale factor, which this study selects as 2 [50]. Then, the orientations are expressed as Equation (9):
where is the th orientation and is the total number of orientations. In the study, a total of 40 features are extracted by selecting five scales and eight orientations. Then, to reduce the dimensionality of features and condense the relevant information, PCA is applied. The dimension of the features is compressed to six, a value which considers both the information of the features and the efficiency of computation [51]. Furthermore, as supplementary features, the mean and standard deviation, considering the information of neighboring pixels, are included. Here, to reflect both the coarse and fine-texture information of neighborhoods sufficiently, window sizes of , , , and are selected.
2.2.4. Learning-Based Image Fusion
As mentioned above, there are significant differences in imaging mechanisms between SAR and panchromatic images. To consider the differences in the imaging mechanisms, compositive characteristics should be utilized, and non-linear relationships are required. Therefore, this study employed RF regression, which is a representative algorithm that considers compositive characteristics and models non-linear relationships. RF regression is based on the classification and regression tree (CART) model, which is an ensemble-based algorithm that combines several decision trees and obtains results [52]. For the classification, the results are obtained by most votes from the tree results, whereas for regression, the tree results are averaged [53]. In particular, each tree is created independently through a process called bootstrap aggregation, or bagging, to avoid correlations with other trees; in this process, training data subsets are drawn by randomly resampling the subsets with replacement from the original training dataset [54,55]. Thus, this process is robust to the presence of noise or slight variations in the input data, has greater stability, and increases the prediction accuracy [56,57]. Furthermore, in each tree, approximately 30% of the data is excluded from the training process, which is called out-of-bag (OOB) data. The mean squared error (MSE) between the OOB data and the data used for growing the regression trees is obtained; then, a prediction error called the OOB error is calculated for each variable [53]. This error estimates the importance of every variable, such that the influence of each input variable can be further analyzed. To determine the importance of the input variables, each variable is permuted, and regression trees are grown on the modified dataset [58]. The variable importance is calculated based on the difference in the MSE between the original OOB dataset and the modified dataset. In other words, if the exclusion of a variable leads to a significant reduction in prediction accuracy, the variable is considered important.
In addition, the RF algorithm requires the specification of two parameters: the number of variables to be used for the best split at each node () and the number of trees in the forest (). In regression problems, the standard value of is one-third of the total number of input variables; thus, in this study, was selected as 5 [59]. Regarding , previous studies have shown that using a large value for provides better stability. However, recent studies have revealed that has no significant effect on performance; thus, in this study, was selected as 32 considering both the performance and training time [28,34,52].
Using the two parameters, the RF is modeled and generated independently for each class, which leads to a reduction in the complexity of the algorithm and allows more information to be retrieved. For each class, supervised learning is performed by setting the features extracted from the SAR image as independent variables and the pixel values of the panchromatic image as dependent variables for the positions corresponding to previously obtained invariant pixels. Then, the features of the SAR image corresponding to all the pixels of each class are extracted and utilized as input values of the obtained RF regression model. Finally, the fusion result is generated by integrating the predicted values for each class.
2.3. Criteria for Fusion Quality Assessment
The quality of the image-fusion results can be evaluated according to two criteria. First, the performance of the fusion results for the proposed method can be intuitively evaluated in terms of visual aspect. Second, quantitative evaluation can be used to obtain the performance of fusion results, which must be statistical and objective [22]. To assess the performance, the fusion quality index (FQI), average gradient (AG), and spatial frequency (SF) are selected. FQI is an index for evaluating the quality of a fused image for given input images; it is based on the combination of luminance distortion, contrast distortion, and loss of correlation of coefficient over local regions into a single measure [60]. Given the SAR image , the panchromatic image , and the fused image , FQI is defined as Equation (10):
where is a weight computed over a window , in which and are the variance of the SAR and panchromatic images, respectively; is a saliency computed over a window , where ; and are the quality indexes of the fused image with regard to the SAR and panchromatic images, respectively; and is set to [60]. Given two images a and b, the QI is defined as Equation (11):
where and are the means of the respective images; and are the standard deviations of the respective images; and is the covariance of the two images. AG represents information on the edge details of an image, which is sensitive to the details of contrast and texture in the image [22]; it is defined as Equation (15):
where and are the differences in the and directions in the fused image, respectively. SF reflects the active degree of an image in the spatial domain [61] and is defined as Equations (16)–(18):
FQI has the range of , and an FQI value closer to 1 indicates better performance, whereas for AG and SF, higher values indicate better performance [61].
3. Results and Discussion
3.1. Comparison of Fusion Results
To evaluate the effectiveness of the proposed fusion approach, its results were compared with those of the conventional image-fusion algorithm. To ensure a fair comparison, fusion algorithms using a single SAR and panchromatic image were considered, where the à-trous wavelet decomposition (ATWD) [20], DWT [23], NSCT [19], and NSCT-pulse couple neural network (NSCT-PCNN) [5] methods were selected. The ATWD method is based on the importance of the wavelet coefficient, which is incorporated into the SAR image at a certain high frequency. For the DWT method, the maximum values of the coefficients at low frequencies and high frequencies are selected as the low and high frequencies, respectively. The NSCT method is based on the contourlet transform without downsamplers and upsamplers, and it also selects the averaging scheme at a low frequency and the maximum scheme at high frequency. The NSCT-PCNN method performs fusion based on PCNN for coefficients at low frequencies, and the coefficients at high frequencies are obtained through NSCT. In accordance with the aforementioned details, the decomposition level of NSCT and NSCT-PCNN was selected as the three showing the best image-fusion results [19]. Furthermore, the experiments were carried out on a desktop PC with an Intel(R) Core (TM) i7-8700 @ 3.20 GHz processor, 24.00 GB of RAM, and a 64-bit Windows 10 operating system. Particularly, all experiments involving the proposed model were programmed in Python 3.7, and the conventional methods were programmed in MATLAB 2019a. The image-fusion results are shown in Figure 6, Figure 7 and Figure 8.
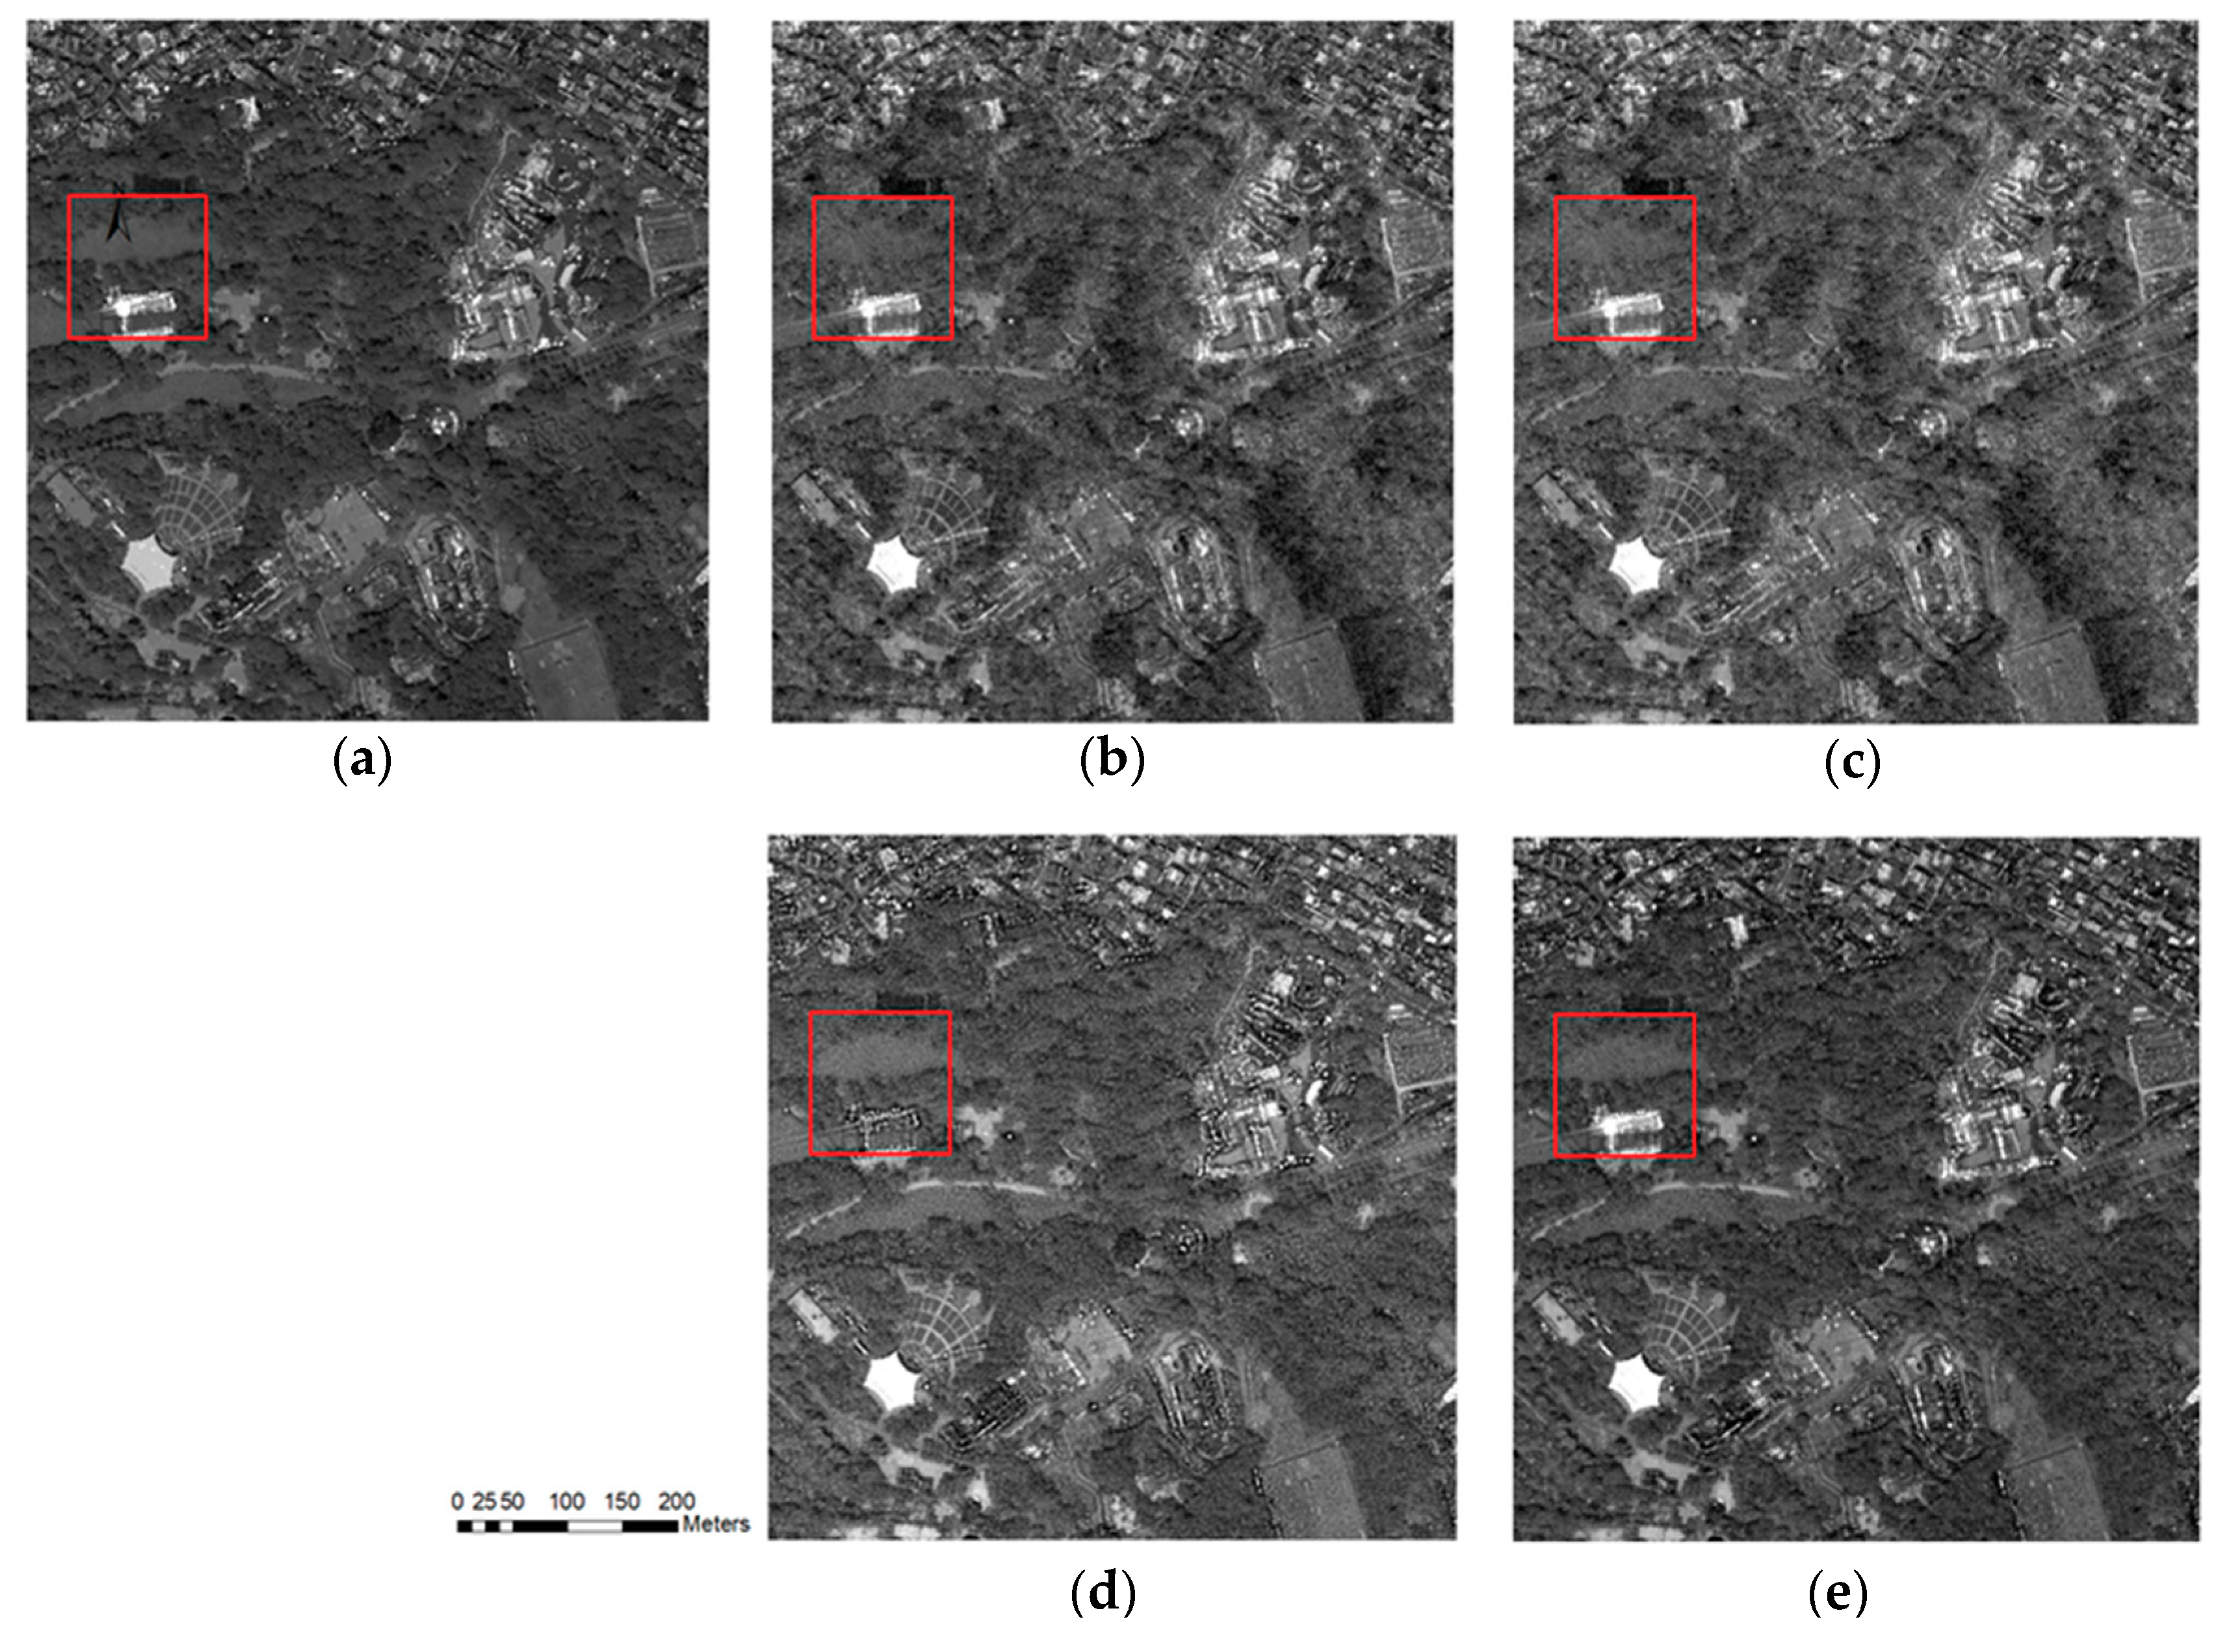
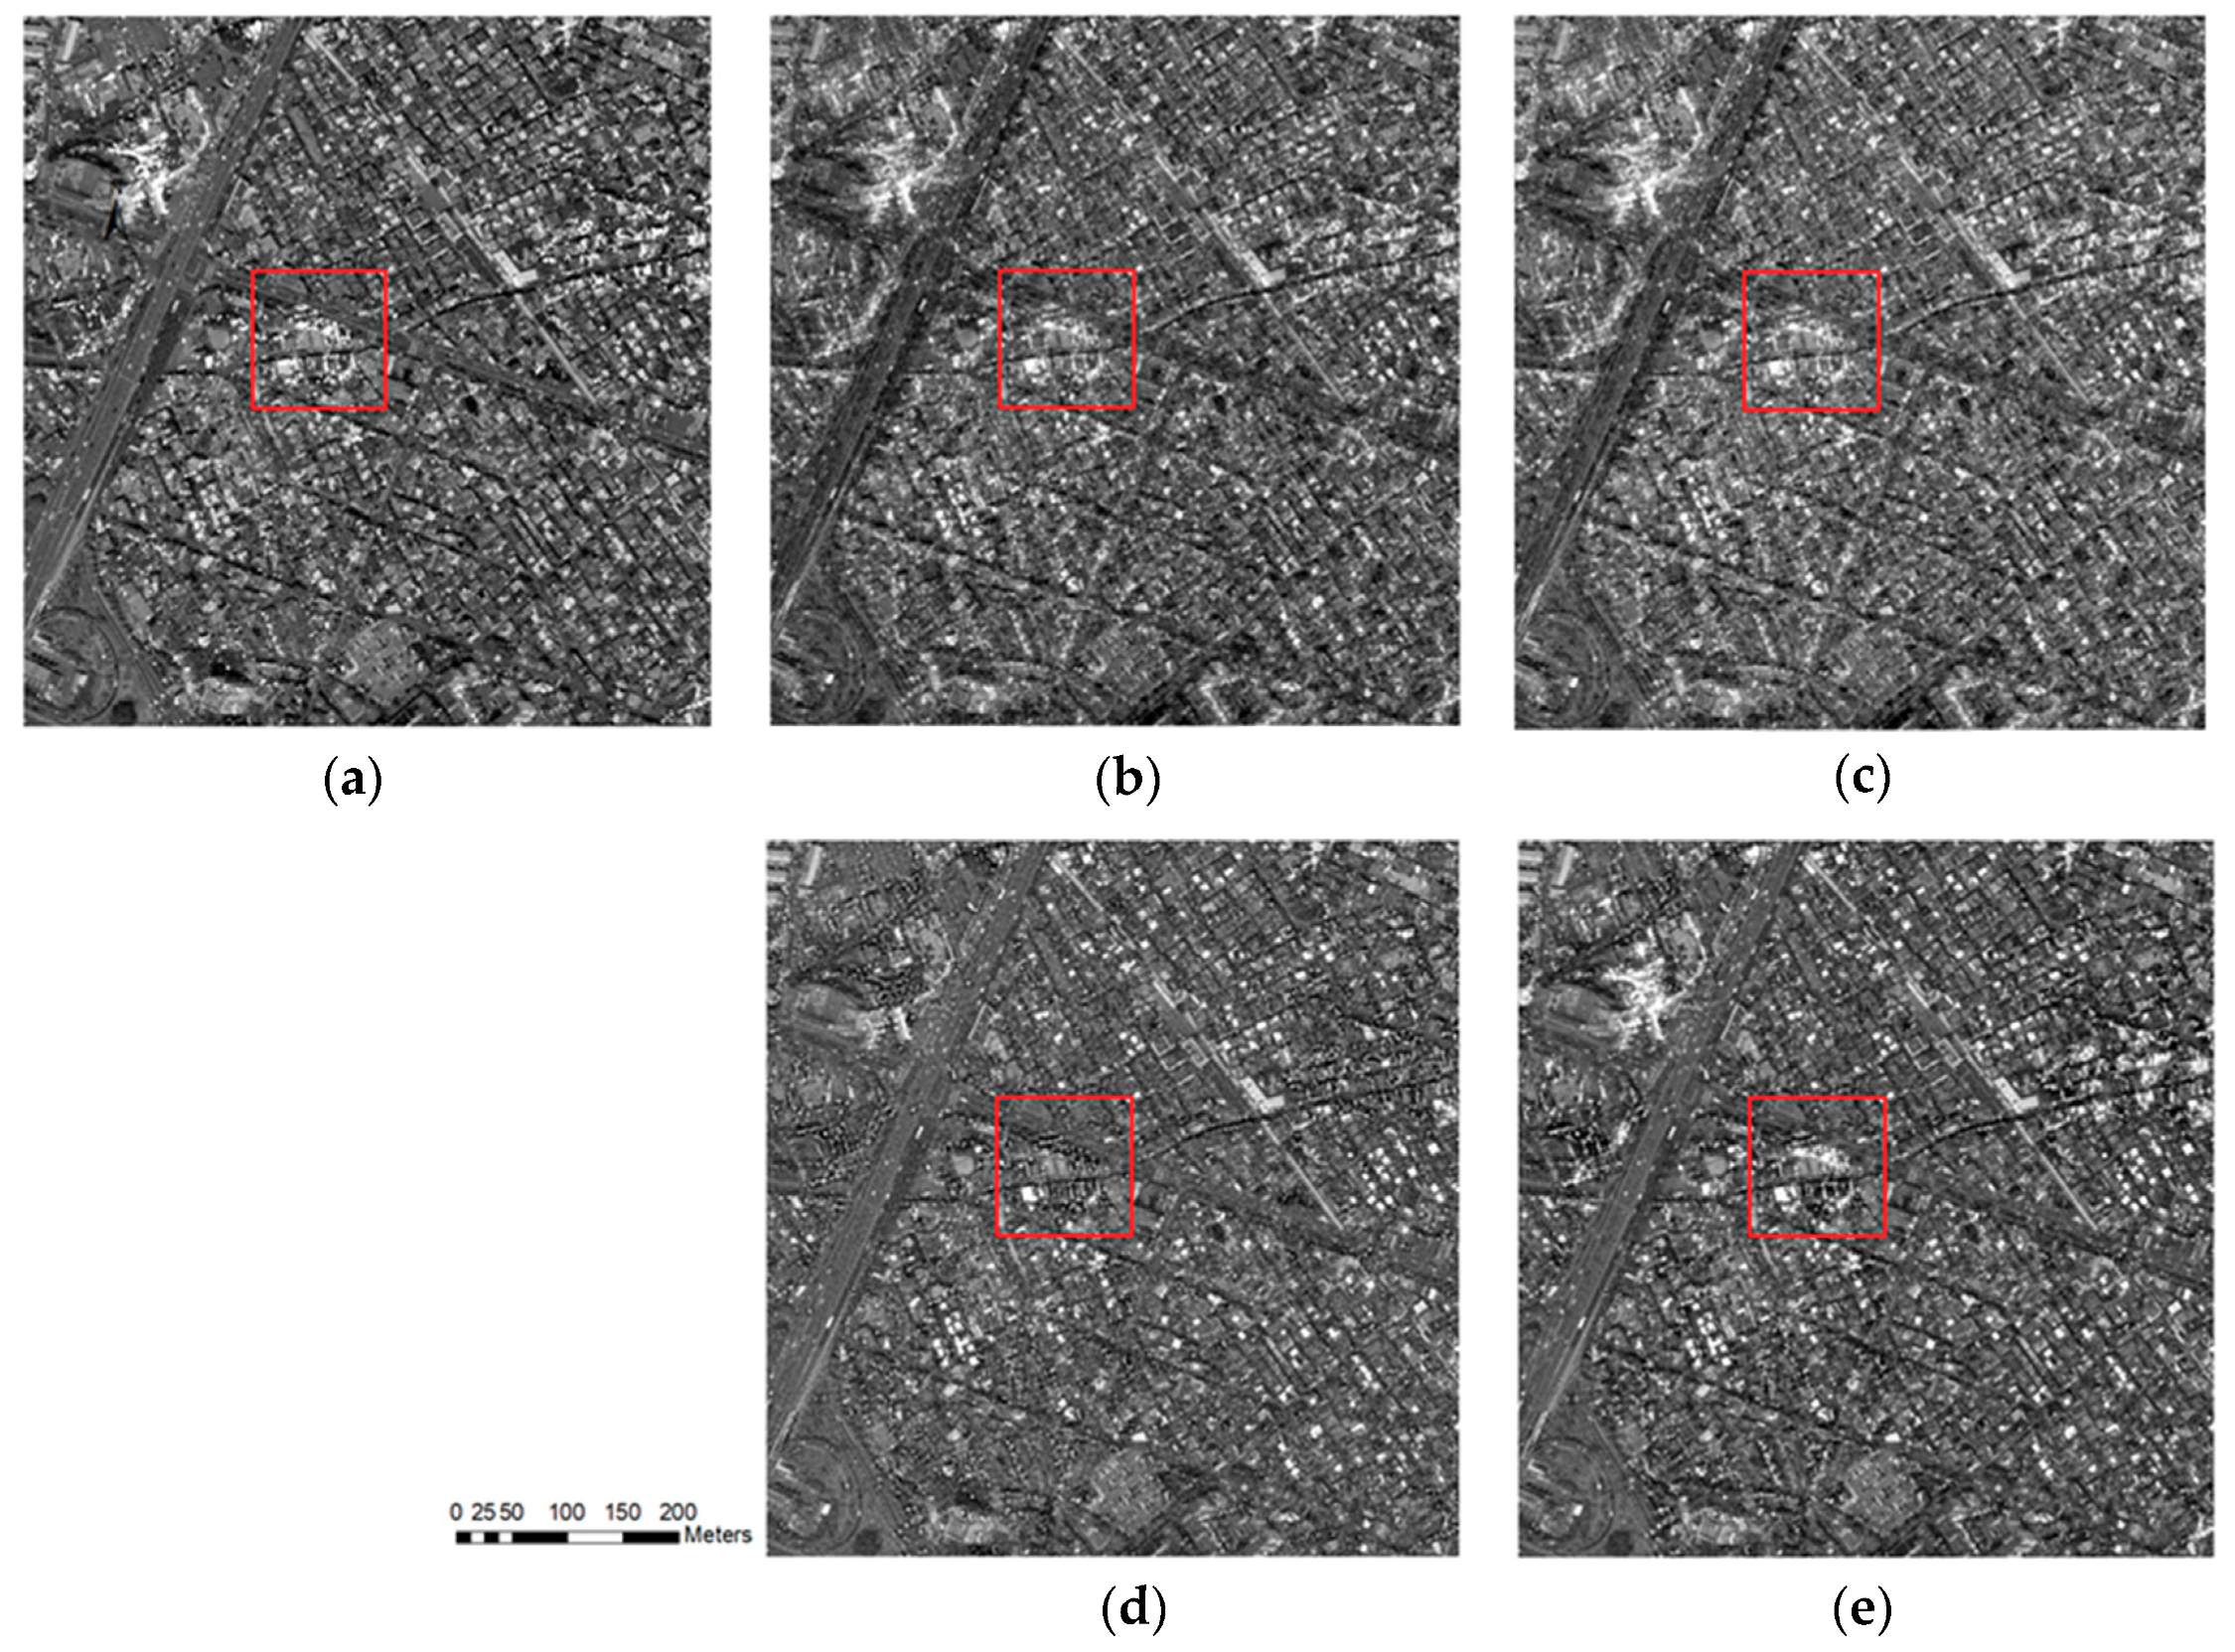
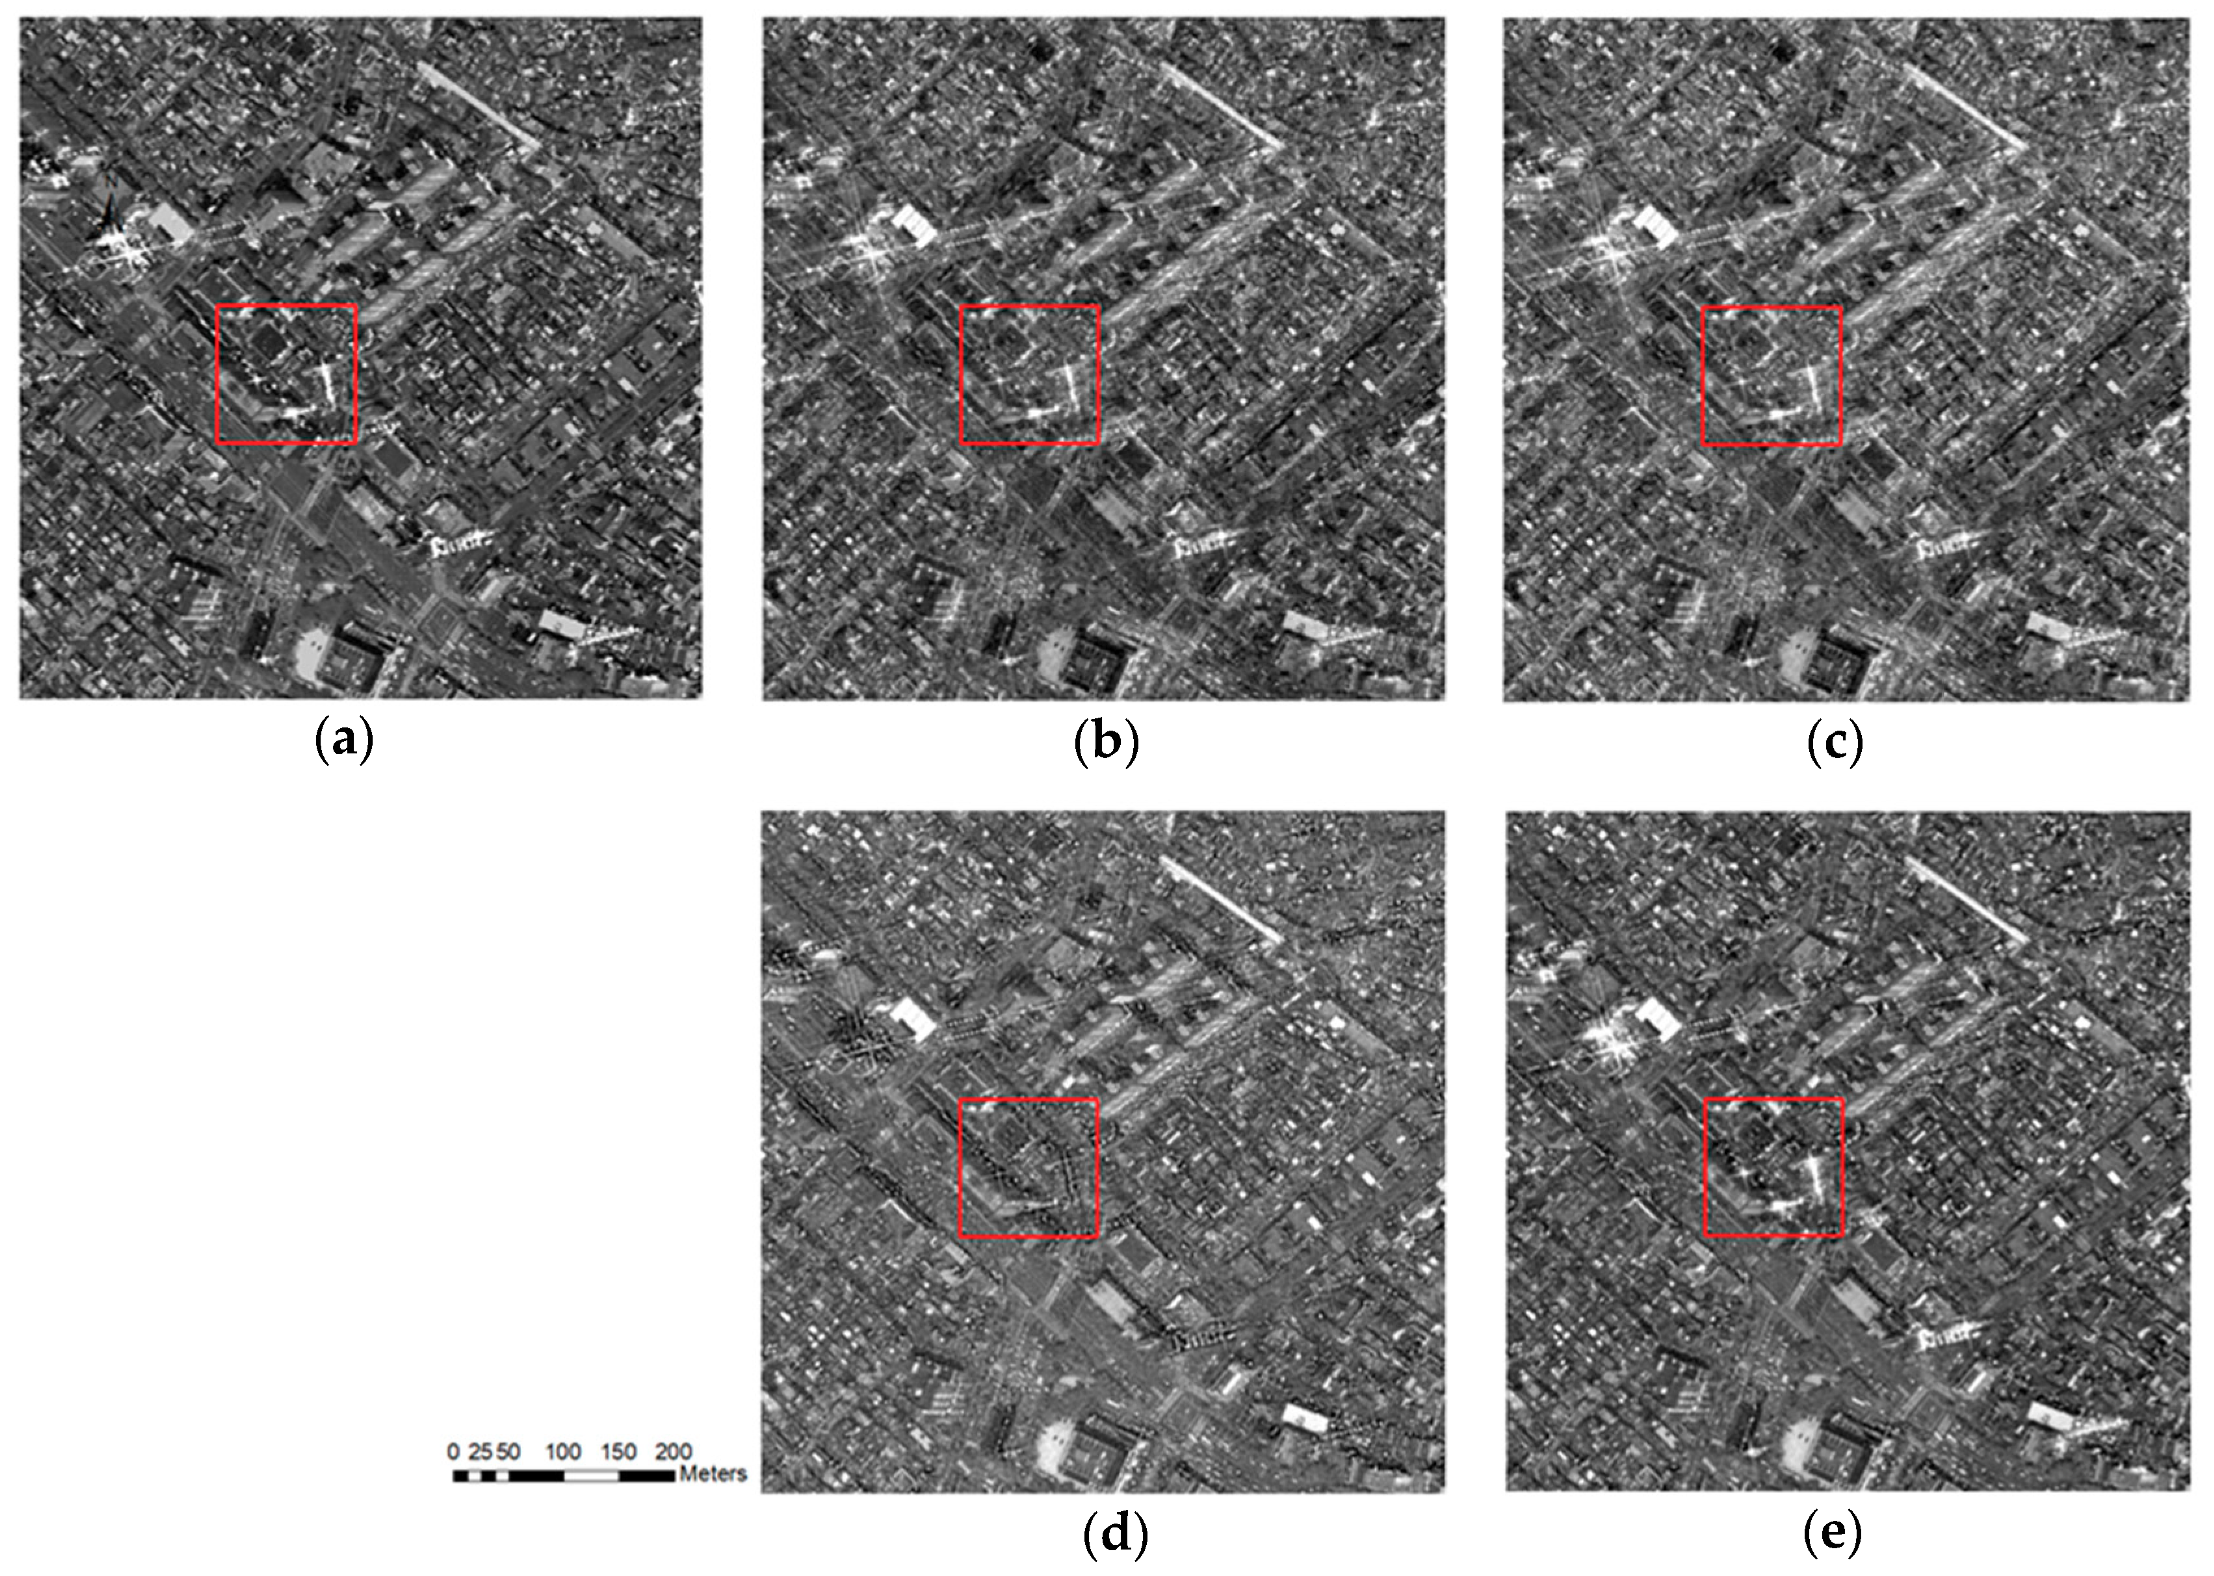
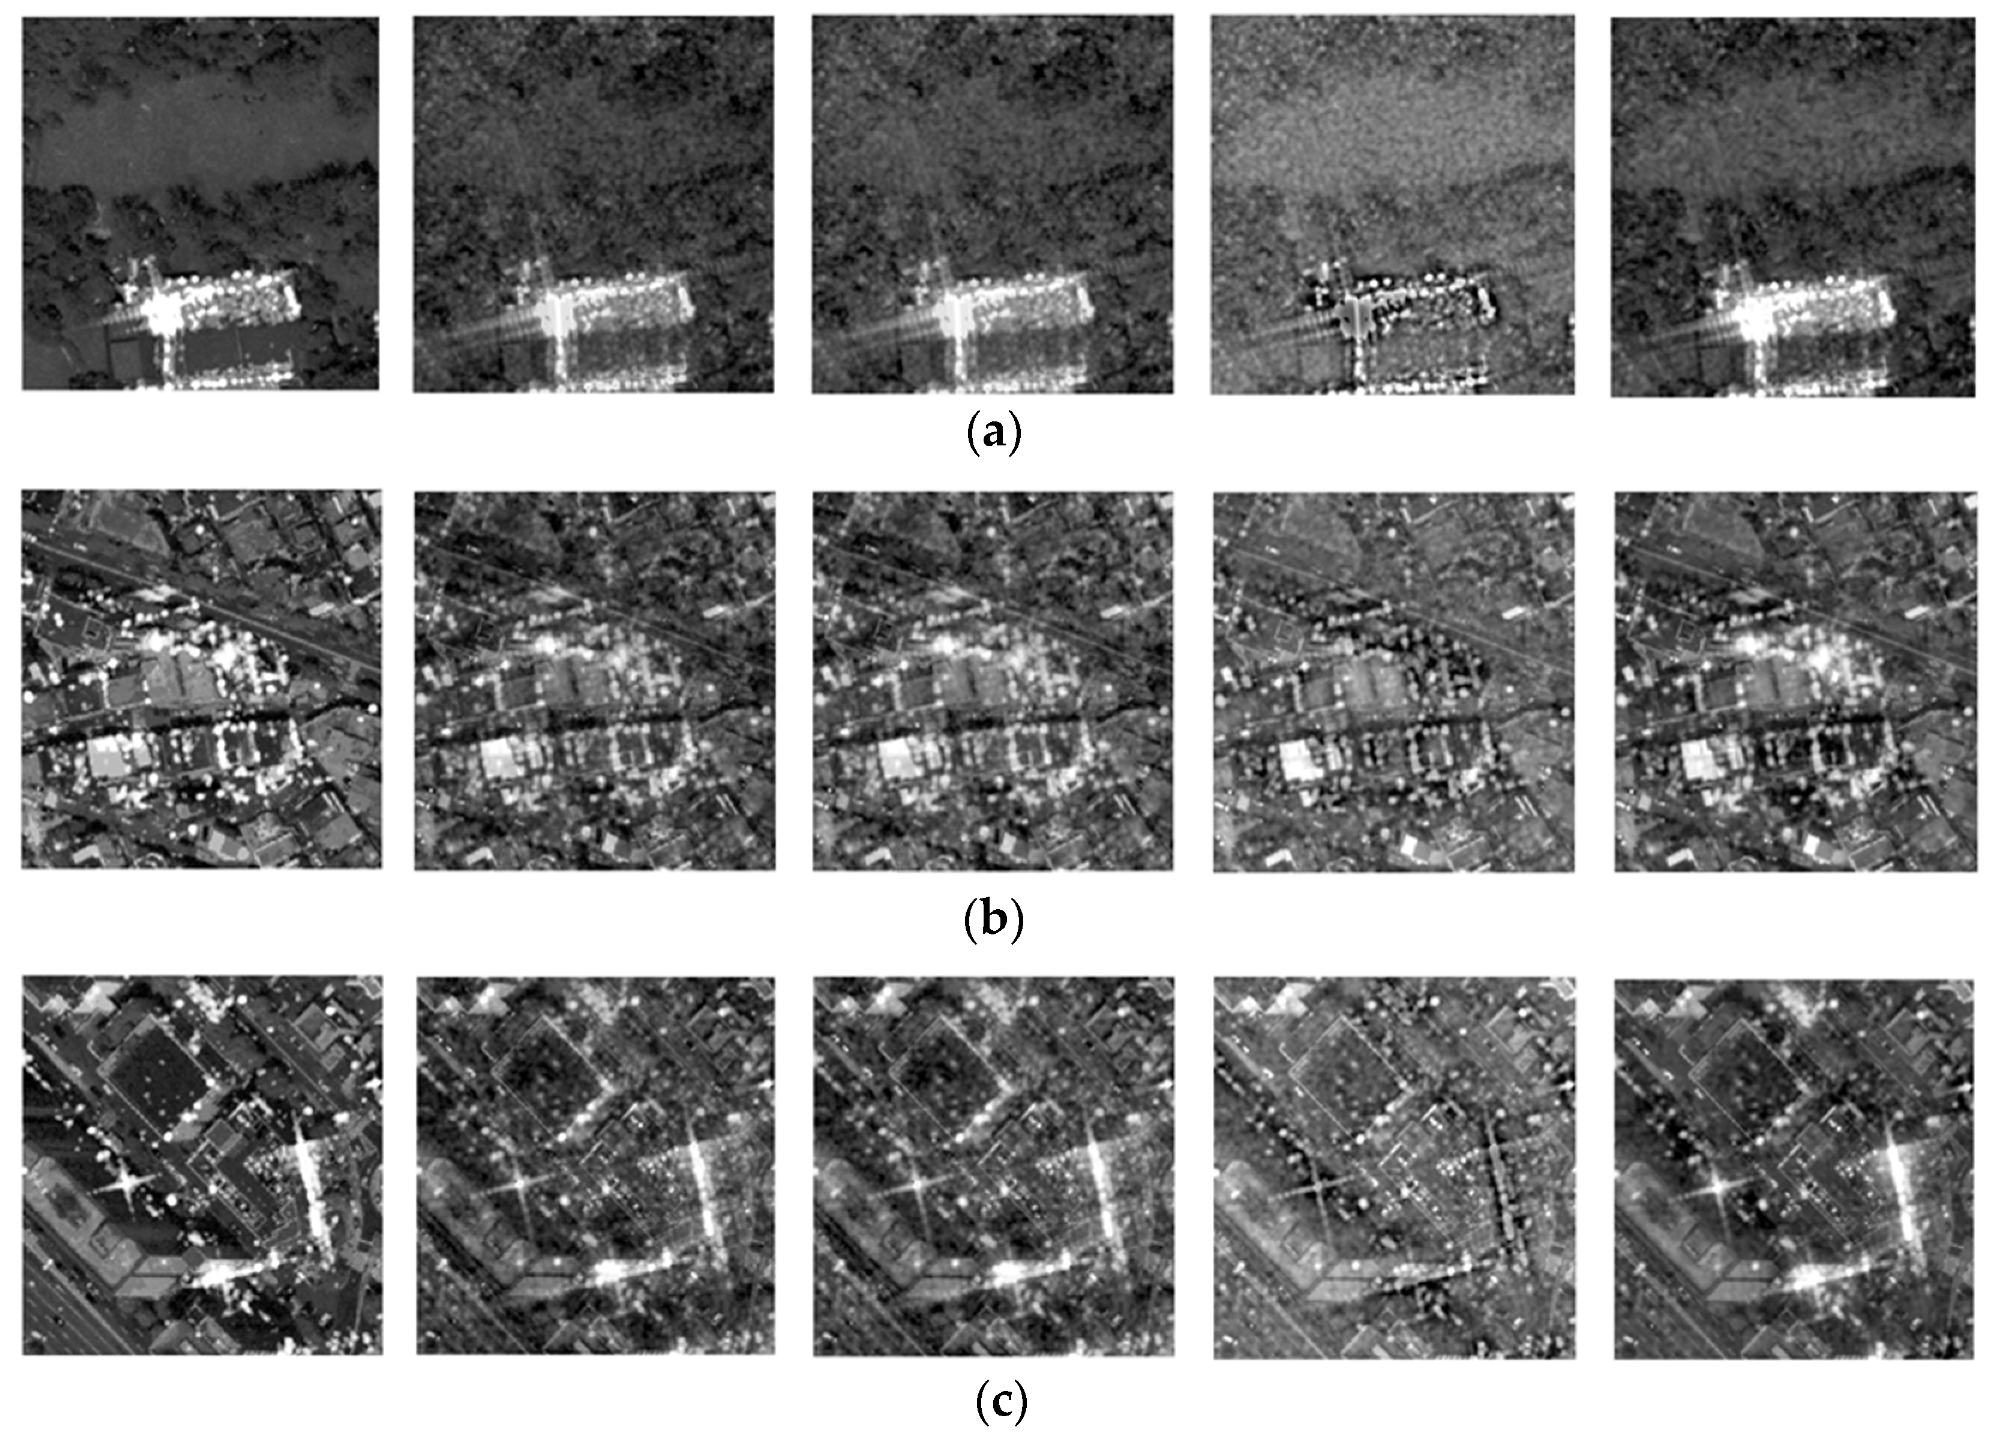
From an overall visual inspection, the results of the proposed method and those of the conventional fusion methods provided more information than the original single image. They contained spatial information of the panchromatic image, such as the line information and edge information of buildings, as well as the object information of the SAR image. However, in the results of ATWD and DWT, spatial information was insufficient compared with those of other methods. For Site 1, which primarily consisted of vegetation and included developed structures, the surface roughness of the SAR image in both these areas was emphasized, resulting in less spatial information. Sites 2 and 3 mainly consisted of developed structures, and the surface roughness of the SAR image was also emphasized more than the line and edge information of buildings, like the results for Site 1. Furthermore, more spatial information was present in the result of the NSCT than in the result of ATWD or DWT; however, it was also confirmed that the object information of the SAR image was lost compared to the original SAR image. The result of the NSCT-PCNN included more spatial and object information compared to those of the conventional image-fusion methods; however, the spatial information of the vegetation in Site 1 was somewhat insufficient. In contrast, the proposed method included sufficient spatial and object information regardless of vegetation or developed areas. The specific details are indicated on the red rectangle in Figure 6, Figure 7 and Figure 8, and the enlarged areas are shown in Figure 9.
Although visual analysis is direct and intuitive, it is also highly subjective and, therefore, may not allow for fully accurate evaluation. Thus, the performance of the fusion results was further evaluated quantitatively based on FQI, AG, and SF, which are summarized in Table 2. Regarding the FQI, the proposed method performed better than the conventional image-fusion methods in all sites. For site 1, the proposed method showed improvements of 8.51%, 6.24%, 27.14%, and 19.90% over ATWD, DWT, NSCT, and NSCT-PCAA, respectively, in addition to respective improvements of 2.78%, 0.53%, 21.92%, and 24.63% for Site 2 and respective improvements of 2.77%, 0.45%, 20.25%, and 14.68% for Site 3. The higher FQI of the proposed method indicates that its fusion results contain more of the information of the SAR and panchromatic images. In contrast, AG yielded different results for each site, as follows. For Site 1, the NSCT-PCNN had the highest value, whereas at Sites 2 and 3 the proposed method had the highest value. AG represents the spatial information in the panchromatic image in addition to the object information and surface roughness in the SAR image. As mentioned above, Site 1 consisted mostly of vegetation, and the result of the NSCT-PCNN contained most of the surface roughness information of the SAR image with a lack of the spatial information of the panchromatic image of the vegetation area. Because of this, the texture features of the vegetation were best highlighted owing to the influence of surface roughness in the calculation of AG. However, for Sites 2 and 3, which consisted mainly of developed structures, the spatial information of the panchromatic image and the object information of the SAR image were the main information, and the result of the proposed method had the highest abundance with regard to both aforementioned sets of information. Regarding the SF, which is primarily a metric for assessing the spatial information derived from the panchromatic image, the proposed method exhibited the best performance in all sites. In other words, it is confirmed that the proposed method would be more useful than the conventional image-fusion methods in visual and quantitative evaluations.
3.2. Validation of Random Forest Regression
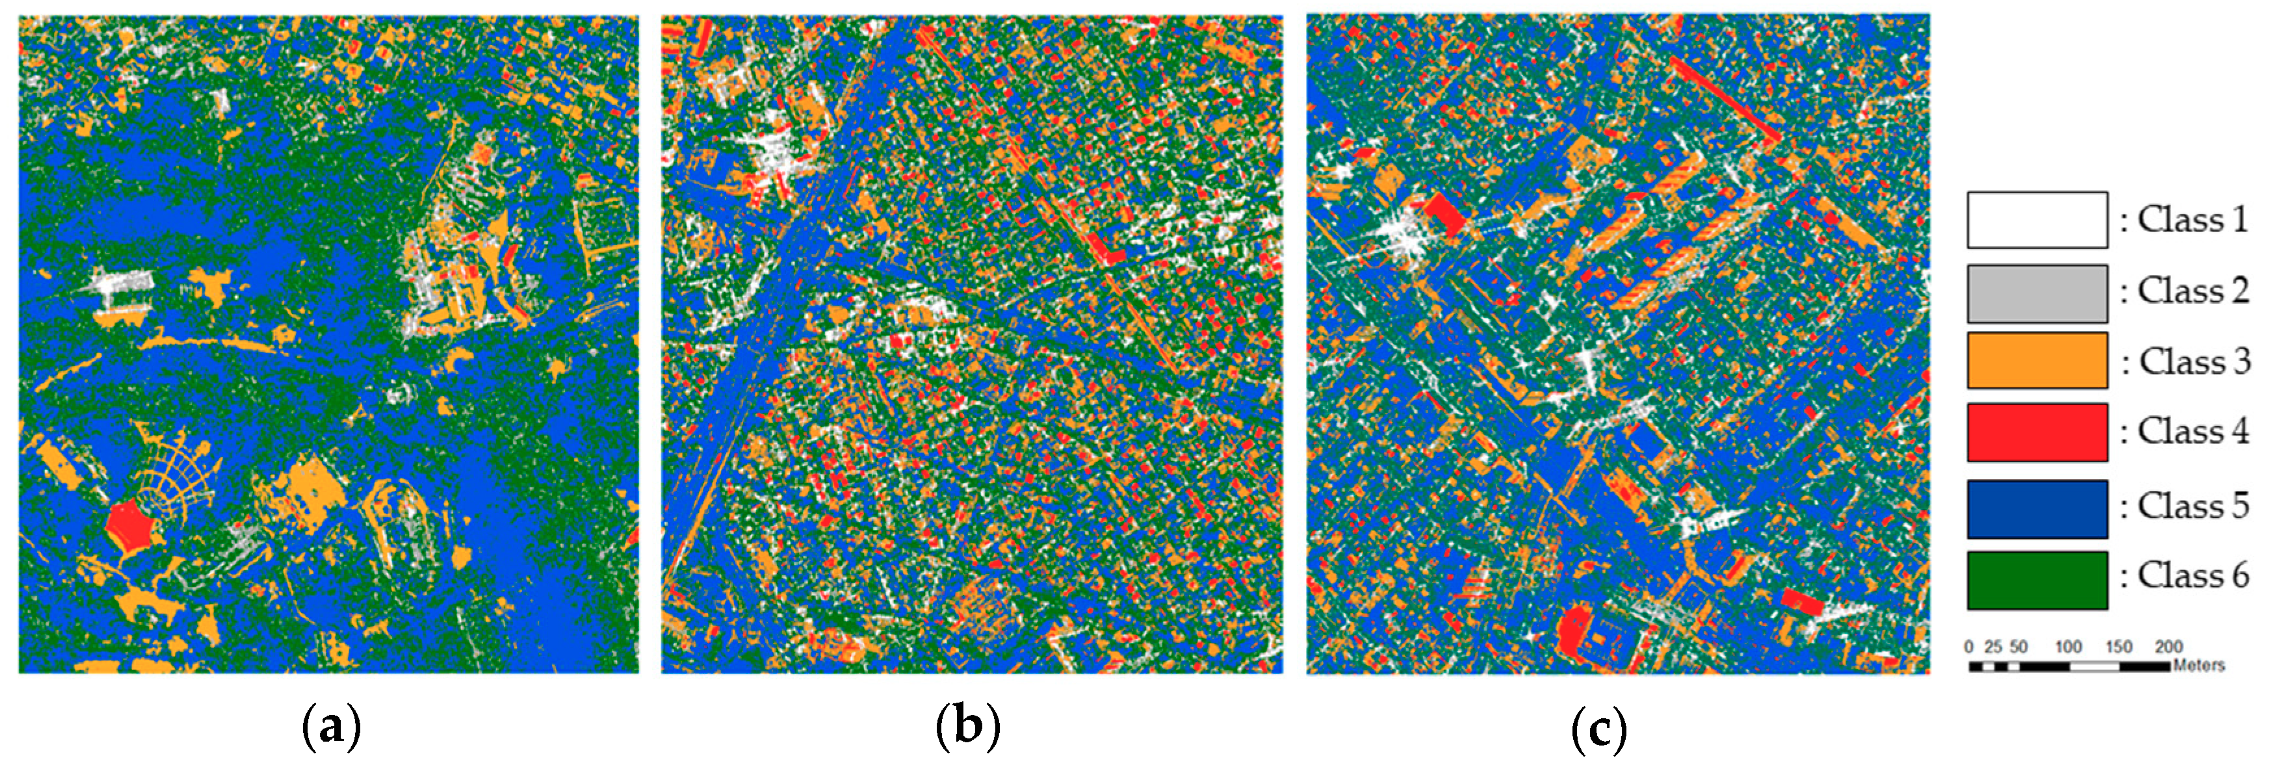
As mentioned above, the RF regression models were constructed independently for each class, thus, the predictive models were verified separately. The classification images of each site are shown in Figure 10, and the characteristics of each class are as follows: Classes 1 and 2 represent areas with high backscattered intensity and double bounce scattering characteristics, because of the artifacts in the SAR image, where the intensity of class 2 is lower than that of class 1. Classes 3 and 4 include the specular reflection characteristics of the SAR image and bare land or those of the high-brightness roofs in the panchromatic image, where class 4 is brighter than class 3 in the panchromatic image. Classes 5 and 6 are composed of vegetation, roads, or low buildings in the panchromatic image; the low backscattered intensity characteristics of class 5 and diffuse scattering characteristics of class 6 are shown in the SAR image.
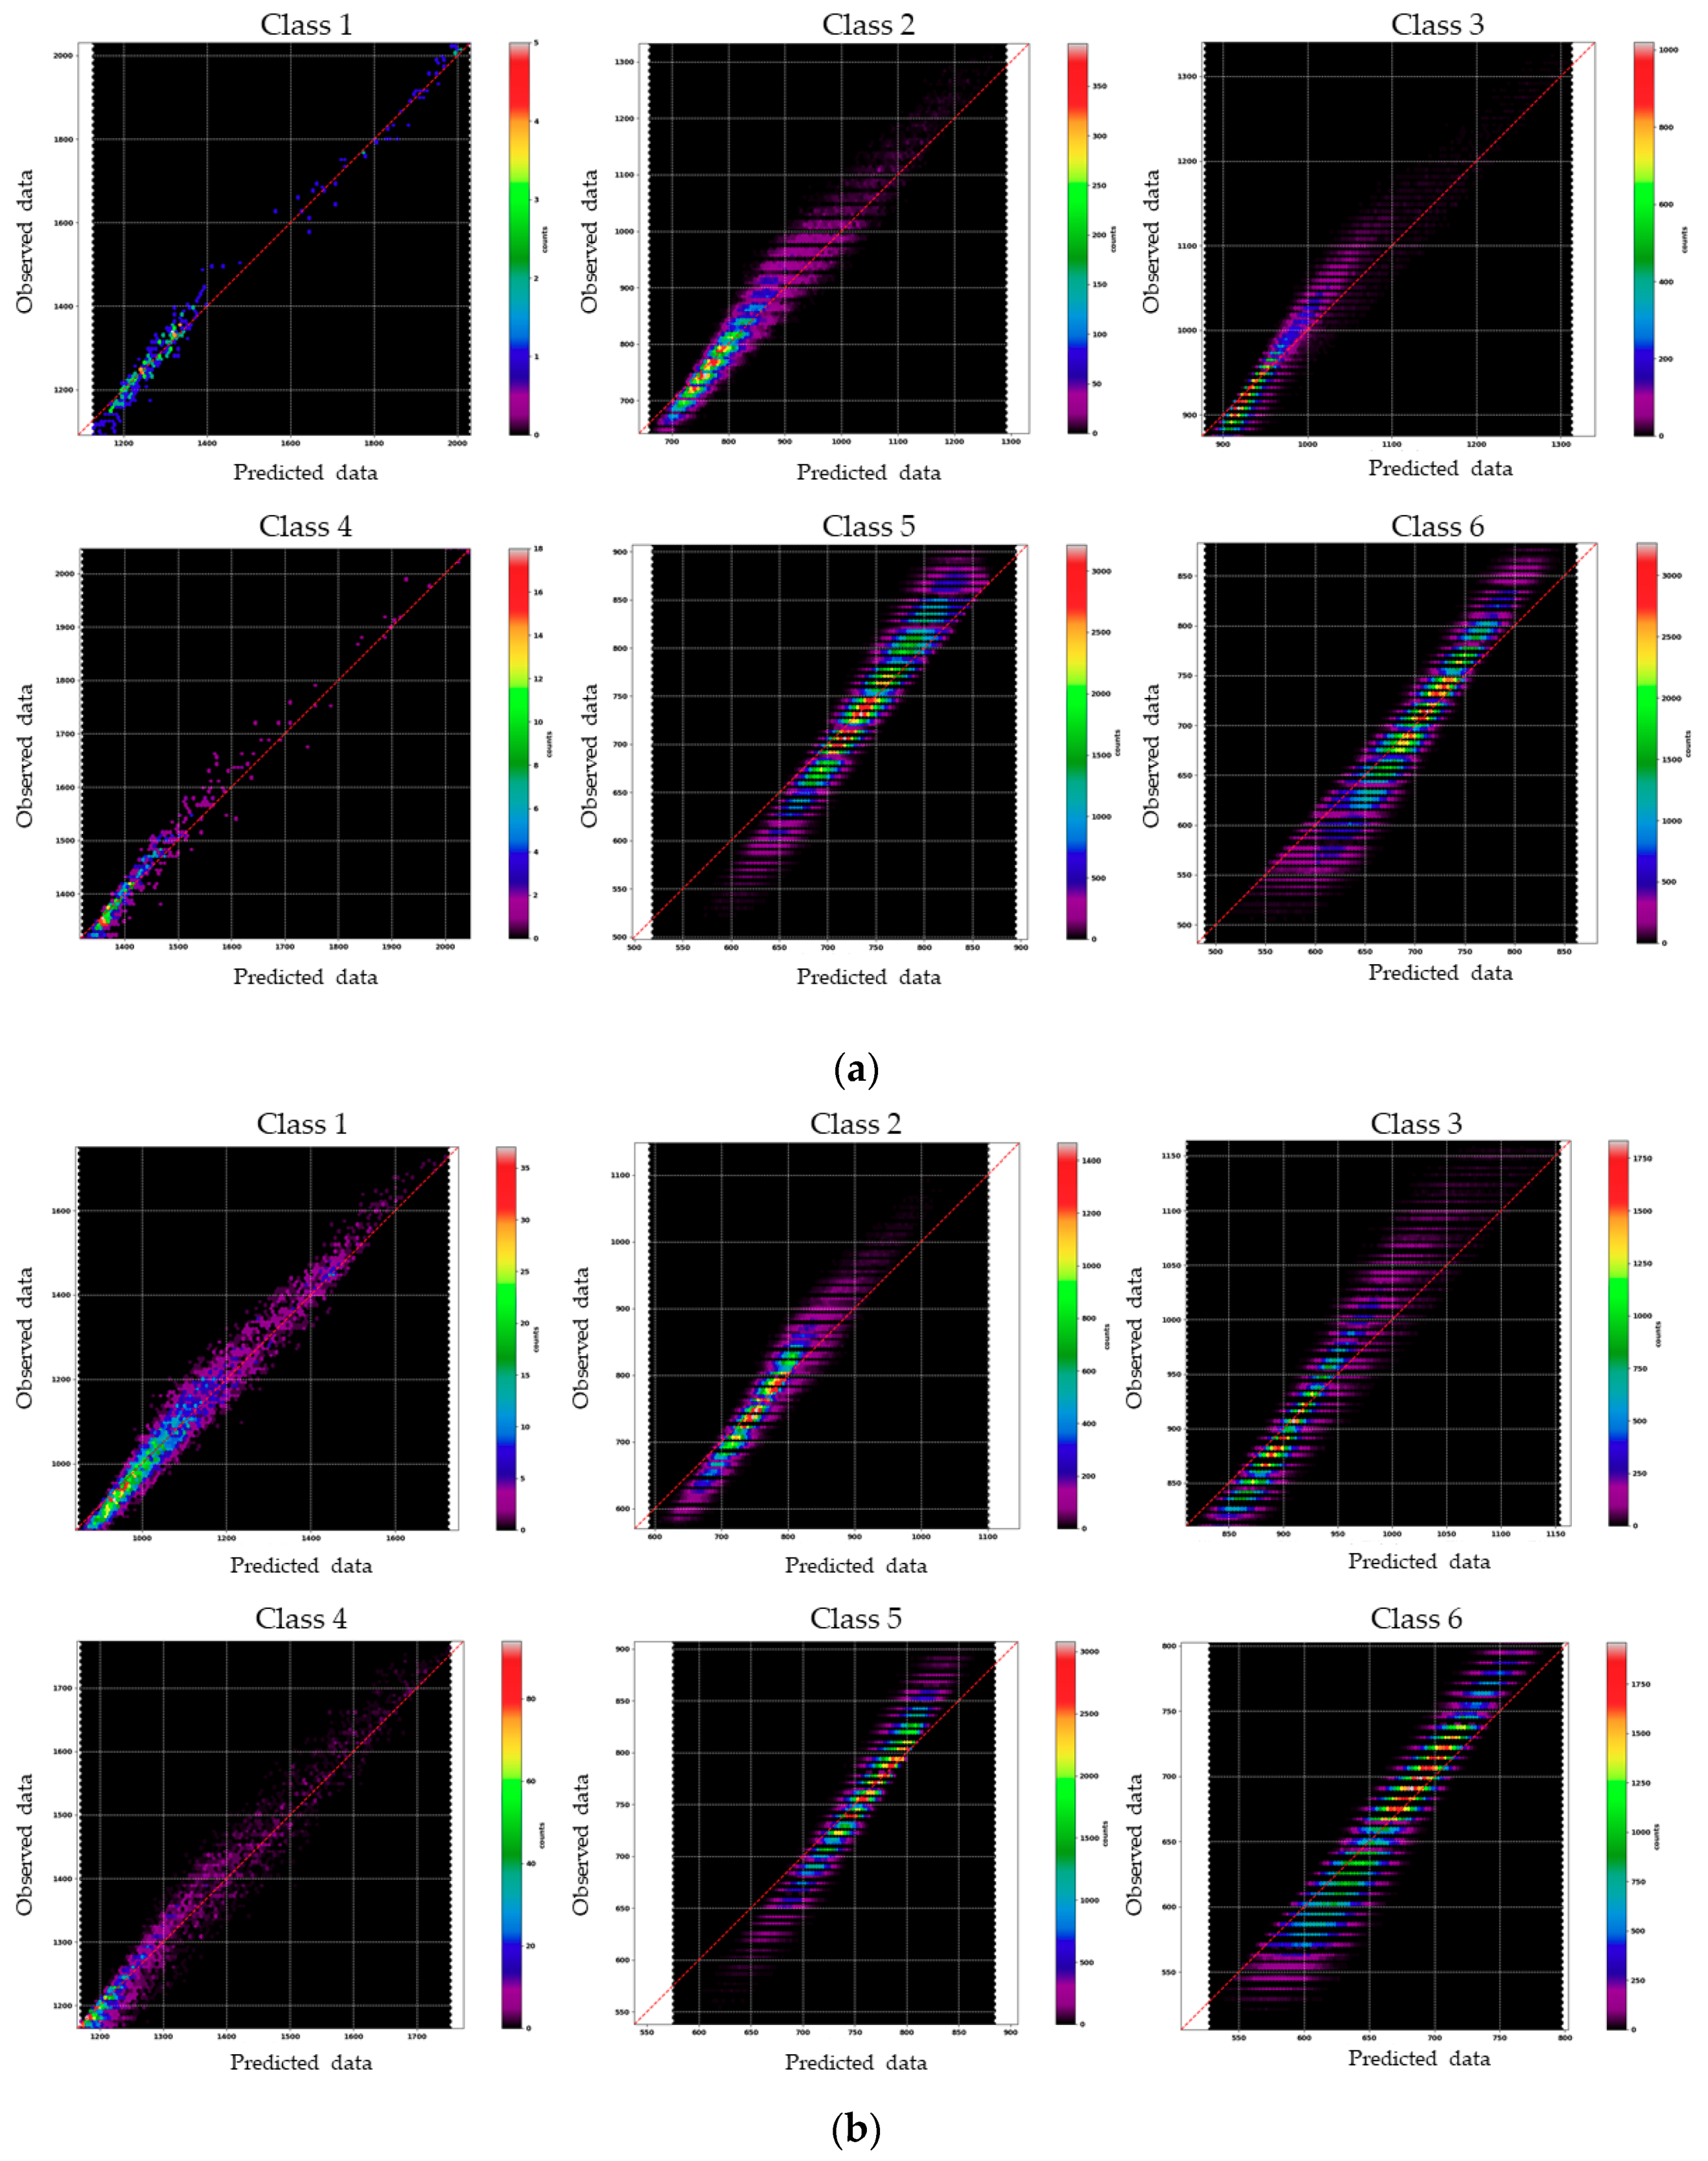
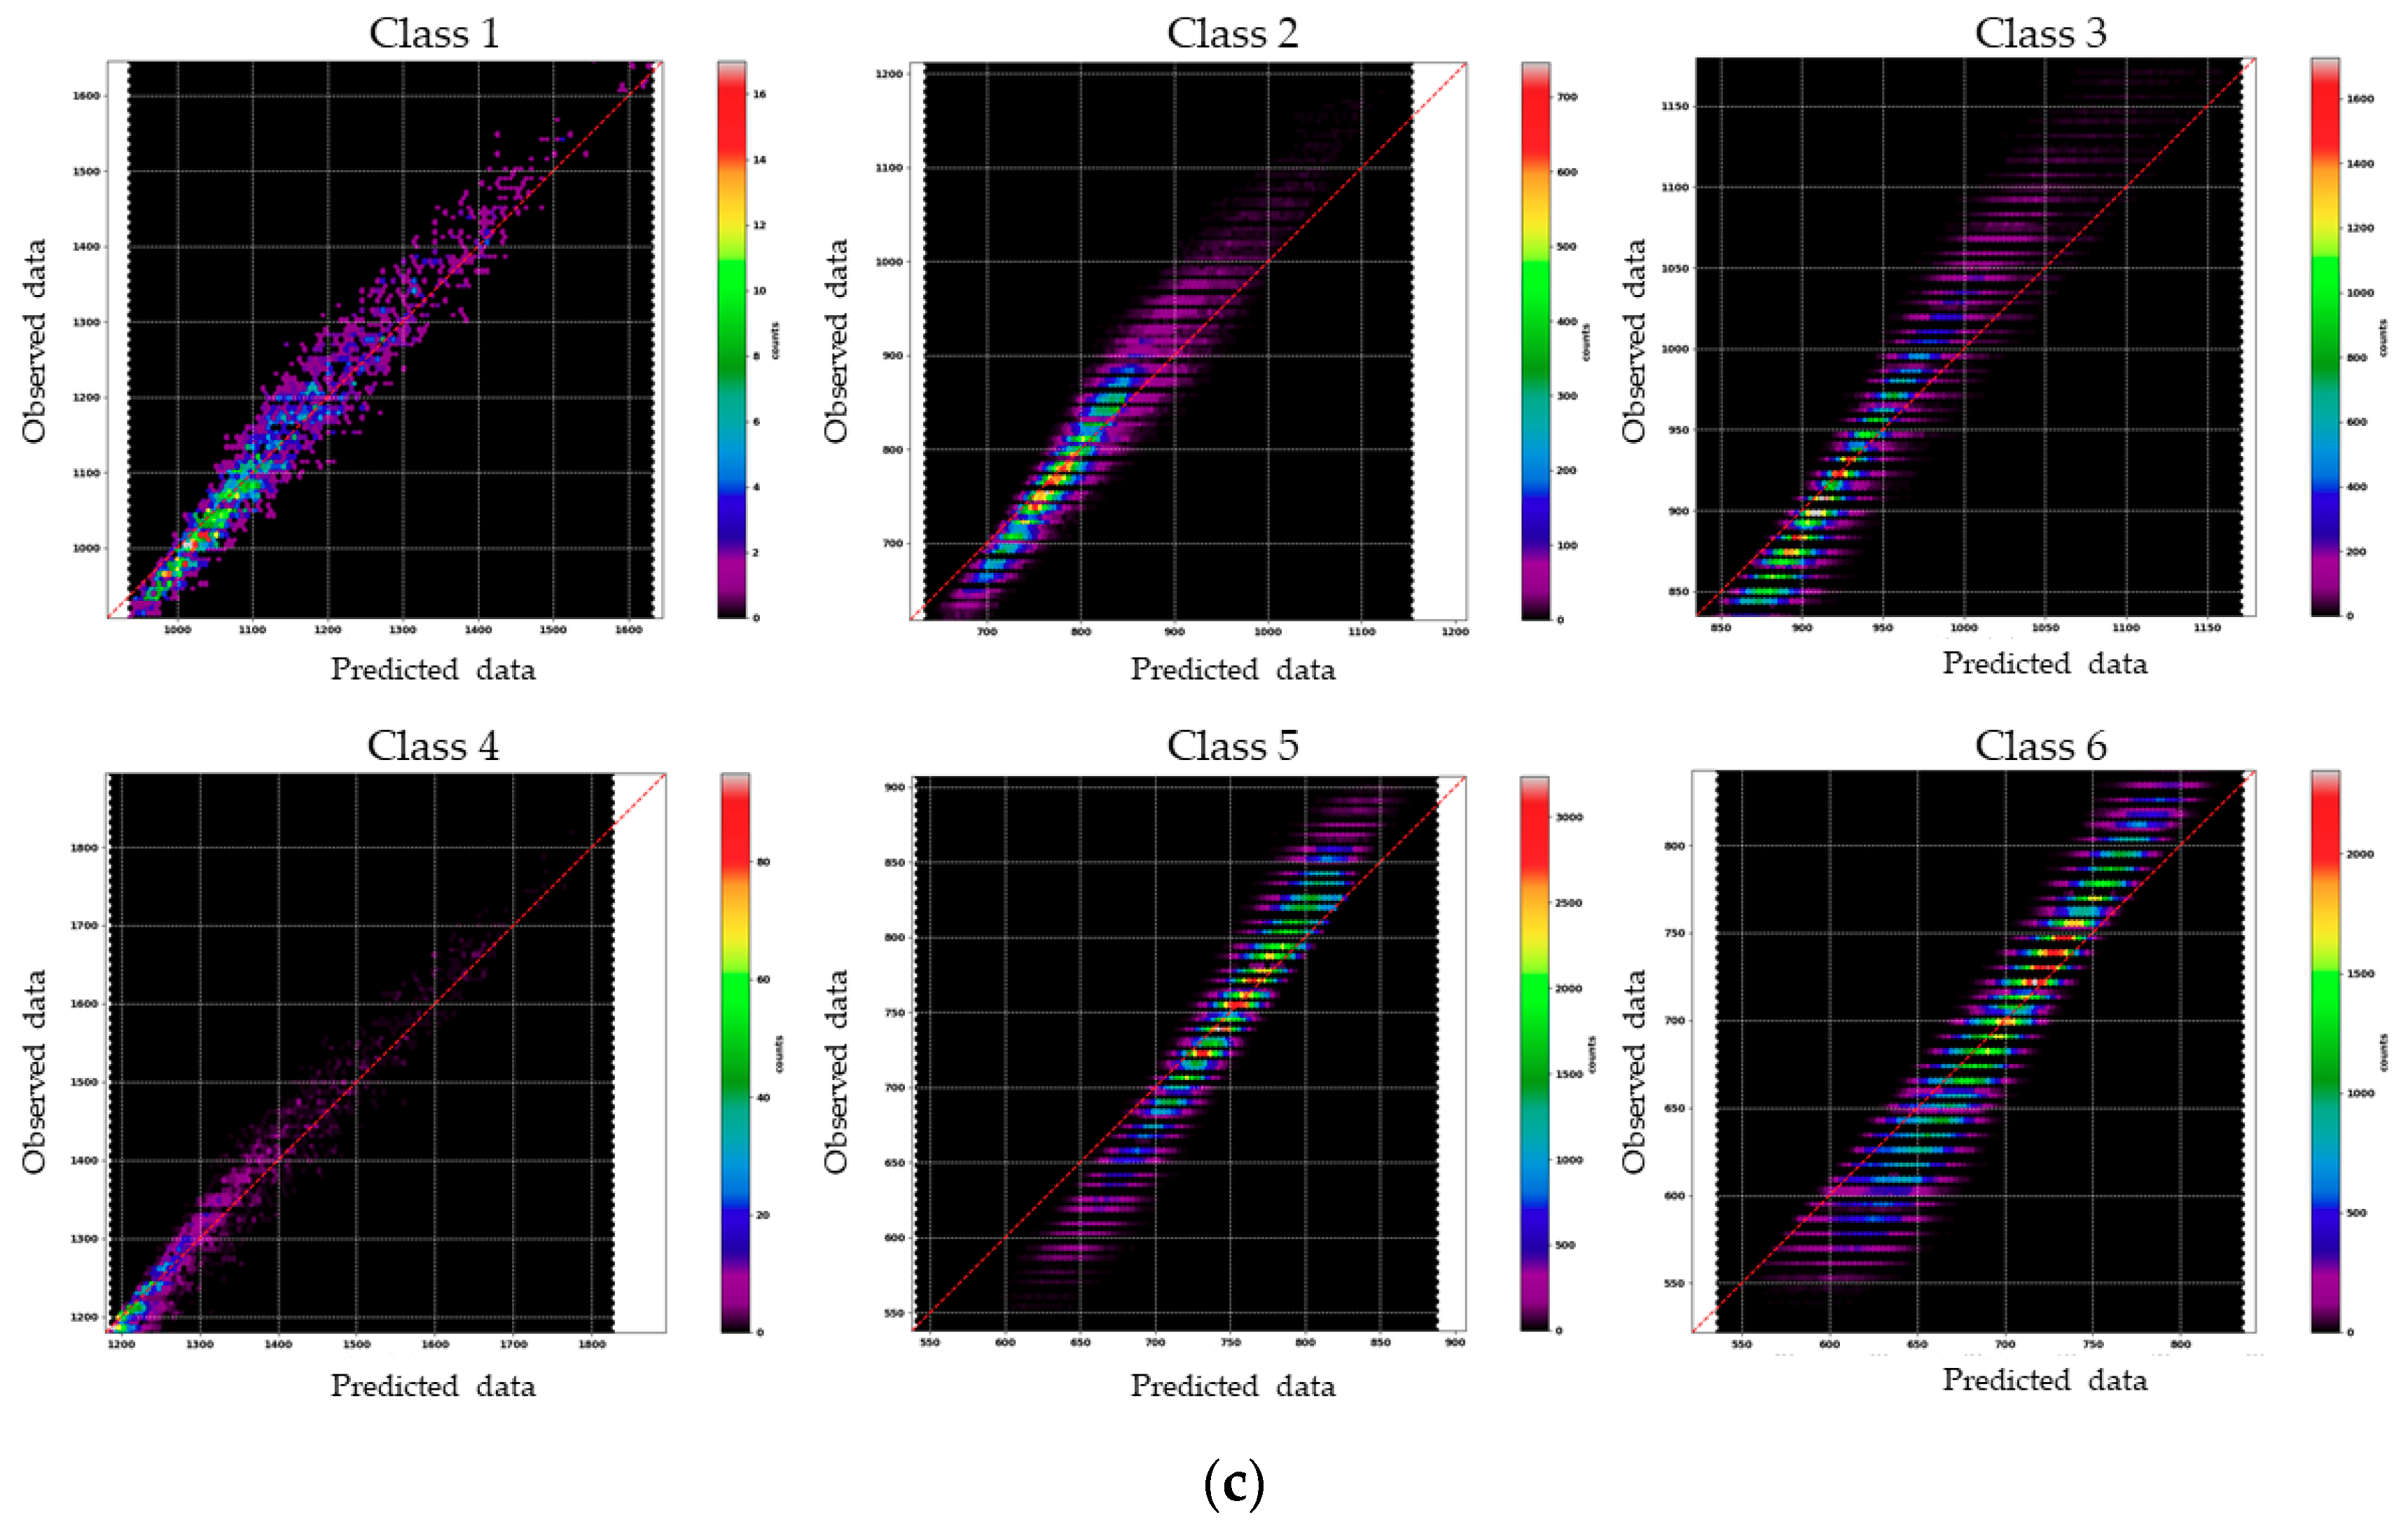
The evaluation was performed visually with a scatter plot and quantitatively using the coefficient of determination (), as shown in Figure 11 and Table 3. The scatter plot represents the correlation between data, and there are high correlations among all classes regardless of the site. In particular, Site 1 showed a high correlation among classes 1, 2, and 4, whereas Sites 2 and 3 showed a high correlation between classes 1 and 4. The other classes showed a moderate bias but a sufficiently high correlation. Considering , a high value of which indicates the high precision and accuracy of the model, similar tendencies are observed, as follows. For all sites, classes 1 and 4 had the highest , and both exhibited similar properties. However, for class 2, Sites 2 and 3 were somewhat lower than Site 1, which is thought to be because of the complex structure of many buildings. Furthermore, classes 3, 5, and 6 involved several characteristics, which can lead to relatively low values. However, the overall results are reasonable; thus, the robustness of the constructed modes is confirmed.
3.3. Variable Importance
To evaluate the influence of variables on RF regression, the variable importance scores were obtained. In particular, the variable importance scores were evaluated for each site, and the importance of each variable was averaged by all classes, as shown in Table 4. In terms of the importance of an individual variable, regardless of the site, the intensity of the SAR image contributed the most, followed by the mean of window sizes , , , and . In the case of the Gabor filter and standard deviation, the contribution was approximately 4–6%, which was relatively insignificant. On the other hand, in terms of the variable type, the contributions of intensity, Gabor filter, mean, and standard deviation were approximately 13–16%, 25–30%, 36–37%, and 17–20%, respectively; thus, it is confirmed that all variables are properly influenced.
However, it should be noted that the variable importance scores are relative; therefore, they depend on the number of variables included. In other words, the importance scores can be changed by removing or replacing the predictors, as different inter-correlated variables could act as substitutes.
3.4. Additional Dataset
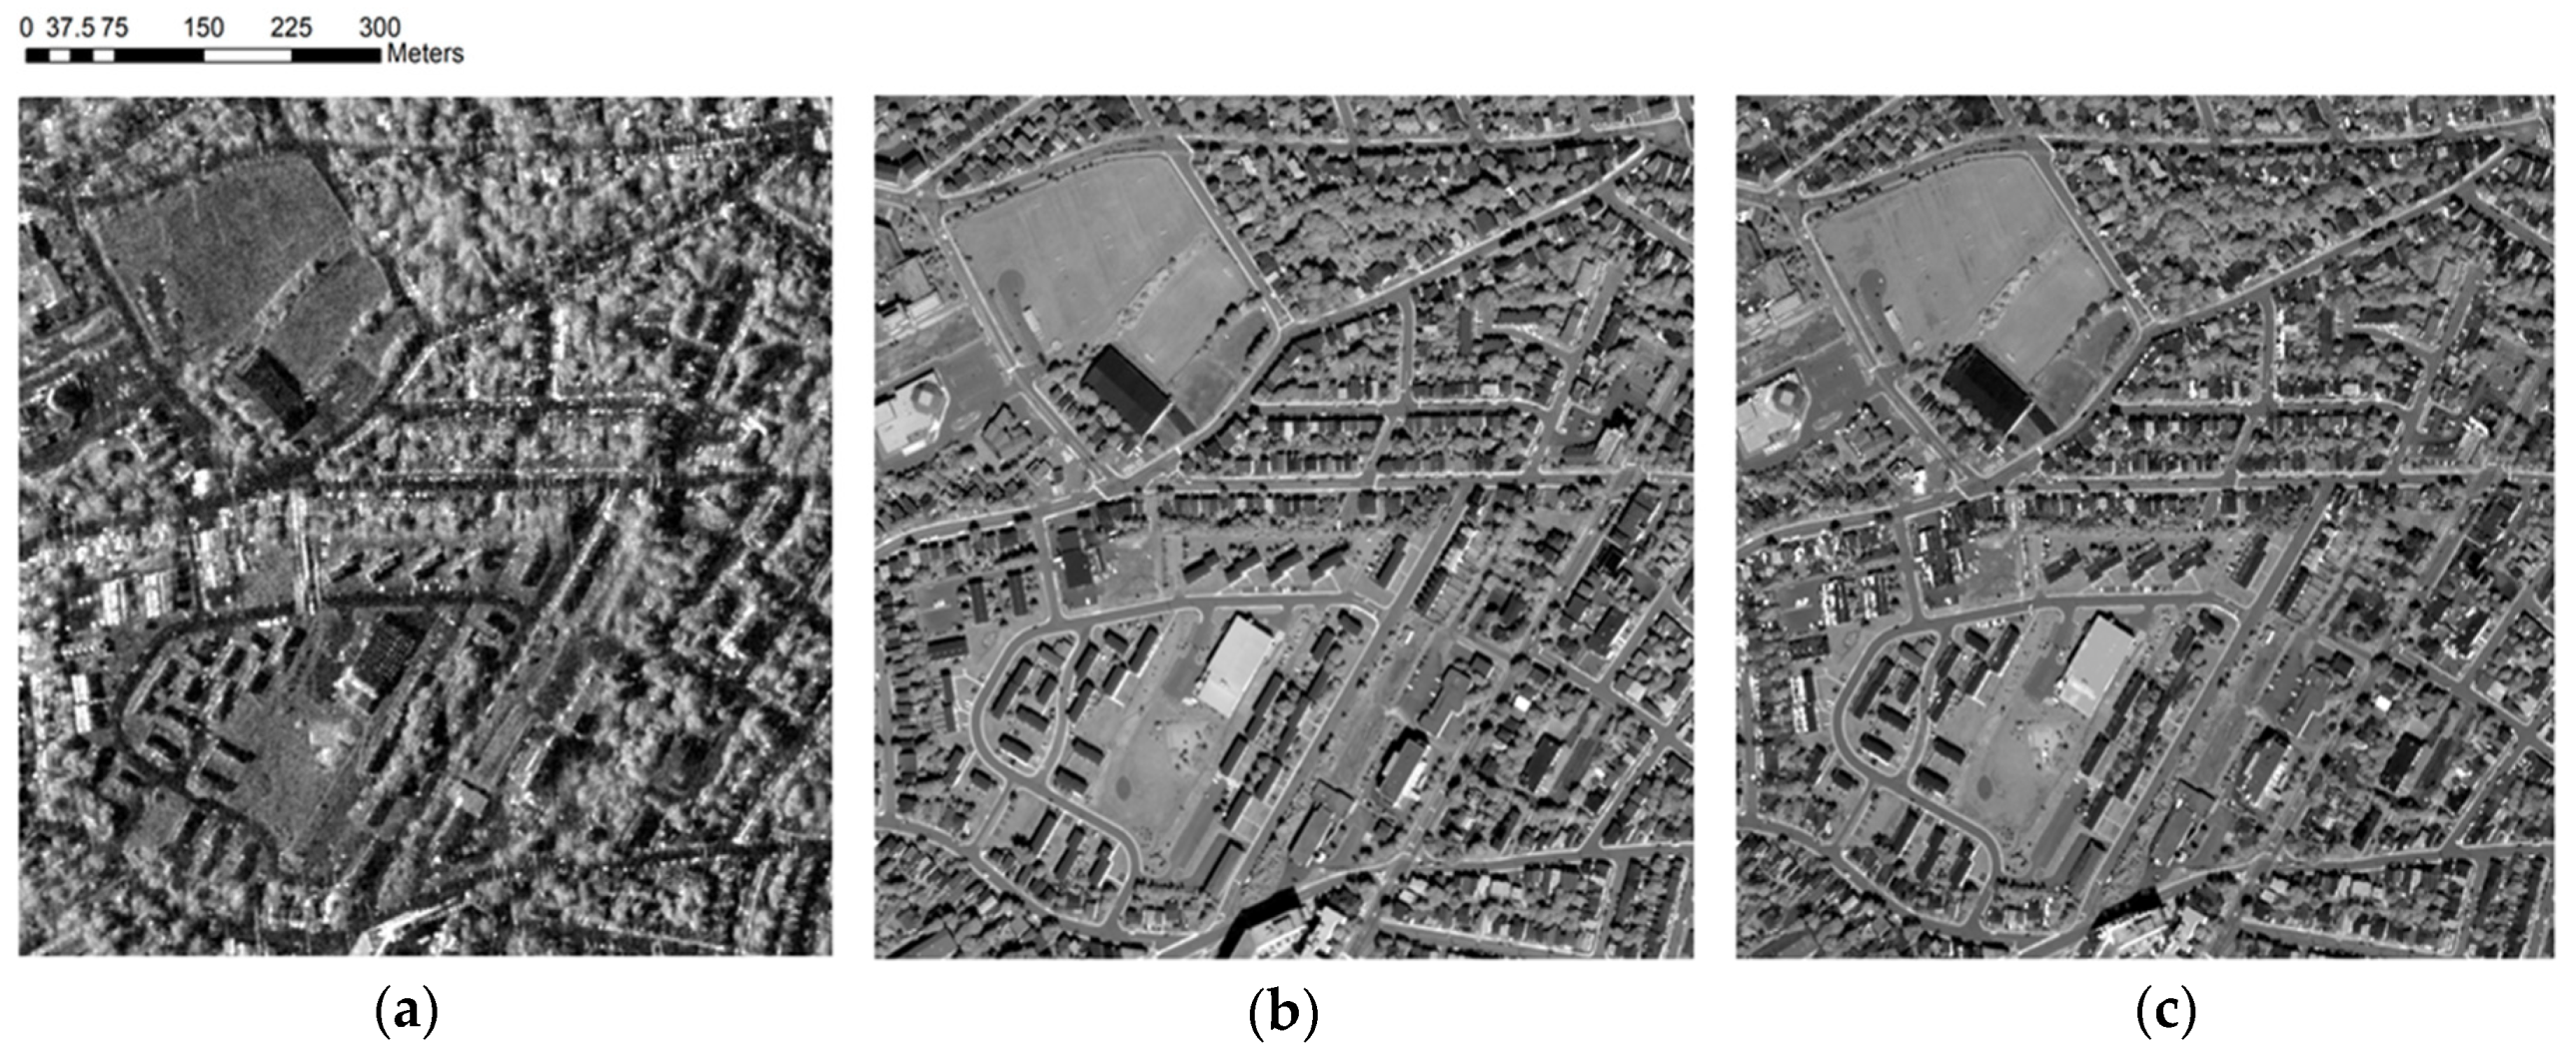
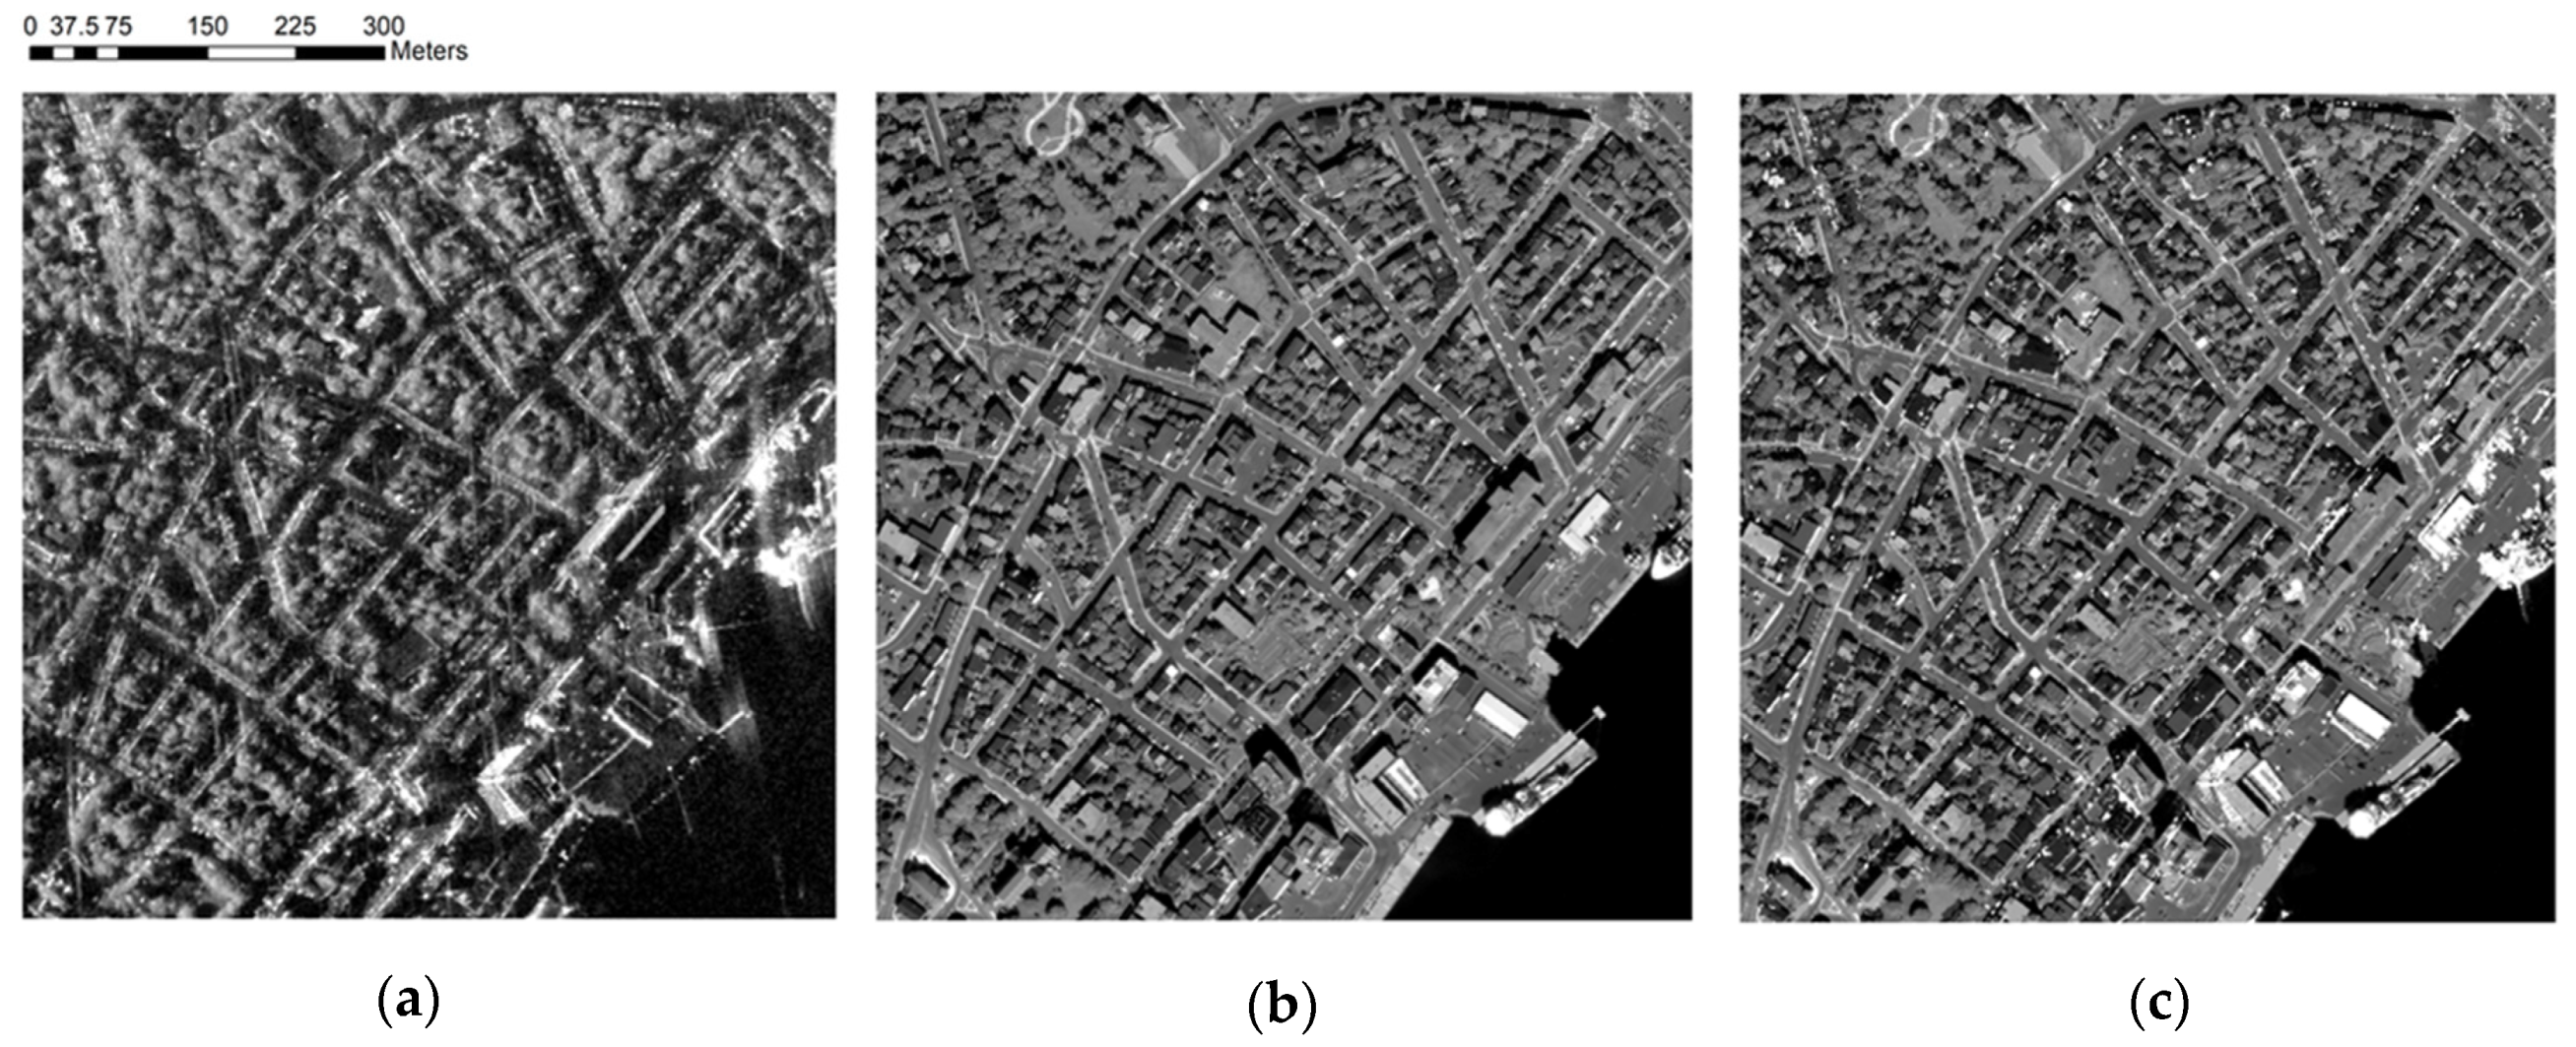
One additional dataset was included to verify the robustness of the proposed method. The area is St. John’s, Newfoundland and Labrador, which is located along the Atlantic Ocean and mainly contains the water, grass, barren land, forest, and developed structures, and the panchromatic and SAR images are acquired from the GeoEye-1 and TerraSAR-X sensors. The GeoEye-1 image was acquired on 19 August 2019; it has a 0.46 m spatial resolution and 11-bit radiometric resolution. The TerraSAR-X was acquired on 8 August 2019; it was obtained in Staring SpotLight mode with a 0.8 m 0.25 m spatial resolution, an ascending orbit, and HH polarization. The preprocessing was performed in the same way as that for the previously used dataset, elucidated in the previous sections, and the additional experiments were performed on two sites with a subset of 1500 × 1500 pixels. The additional experimental images and results are shown in Figure 12 and Figure 13. From a visual inspection, it can be seen that the fusion was properly performed and that both the spatial information of the panchromatic image and the object information of the SAR image are sufficiently present in the resultant image. Furthermore, as shown in Table 5, the performance for the additional sites was like that in the previous results. That is, it is confirmed that the proposed method shows satisfactory results for the additional dataset, and its applicability is verified.
4. Conclusions
This study proposes a method that fuses high-resolution SAR and panchromatic images. A learning-based approach is adopted, and RF regression, which considers the differences in imaging mechanisms, forms the basis of the proposed method. The proposed method first selects the pixels to be used for learning and then performs classification on stacked SAR and panchromatic images to establish independent relationships for each class, thereby reducing the algorithm complexity. In particular, the number of classes is selected as six considering the land cover distributions and training time. Furthermore, to consider as many features as possible, various features are extracted from the SAR image, among which the Gabor filter and the mean and standard deviation of multiple window sizes are selected. Finally, image fusion is performed based on RF regression; then, the results are compared with those of conventional image-fusion methods. The following conclusions are obtained based on the results. First, from the visual aspect, the proposed method includes more of the object information of the SAR image and spatial information of the panchromatic image than conventional image-fusion methods. It is confirmed that sufficient information is included, regardless of vegetation and built-up areas. Second, the quantitative performance of the proposed method shows significant improvements. The performance evaluation verifies that the proposed method exhibits improved preservation of the information of the SAR and panchromatic images and results in less distortion when compared with conventional image-fusion methods. Third, when validating the RF regression model employed in the proposed method, it is confirmed that the predictive model is properly constructed. In addition, in the case of the variables selected, they contribute appropriately to the RF regression model. Finally, the applicability of the proposed model is verified by applying the proposed method to an additional dataset.
In future studies, the following aspects should be considered. First, by obtaining and applying the method to a sufficiently wide range of seasonal and temporal images, it should be further verified. Second, the method’s usefulness should be further confirmed through application to SAR and panchromatic images obtained from other sensors. Third, the performance of the RF regression process should be improved by further extracting and combining various features. Finally, its applicability should be investigated by applying the fused images to various applications.
Author Contributions
Conceptualization, Y.D.E.; methodology, D.K.S.; software, D.K.S.; validation, D.K.S; formal analysis, D.K.S.; investigation, D.K.S.; resources, D.K.S.; data curation, Y.D.E.; writing—original draft preparation, Y.D.E.; writing—review and editing, Y.D.E.; visualization, D.K.S.; supervision, Y.D.E.; project administration, Y.D.E.; funding acquisition, Y.D.E. All authors have read and agreed to the published version of the manuscript.
Funding
This work was supported by the National Research Foundation of Korea (NRF) grant funded by the Korea government (MSIT) (No. 2019R1A2C1085618).
Conflicts of Interest
The authors declare no conflict of interest.
References
- Chibani, Y. Integration of panchromatic and SAR features into multispectral SPOT images using the ‘à trous’ wavelet decomposition. Int. J. Remote Sens. 2007, 28, 2295–2307. [Google Scholar] [CrossRef]
- Amarsaikhan, D.; Blotevogel, H.; Van Genderen, J.; Ganzorig, M.; Gantuya, R.; Nergui, B. Fusing high-resolution SAR and optical imagery for improved urban land cover study and classification. Int. J. Image Data Fusion 2010, 1, 83–97. [Google Scholar] [CrossRef]
- Hong, G.; Zhang, Y.; Mercer, B. A Wavelet and HIS Integration Method to Fuse High Resolution SAR with Moderate Resolution Multispectral Images. Photogramm. Eng. Remote Sens. 2009, 75, 1213–1223. [Google Scholar] [CrossRef]
- Krylov, V.A.; Moser, G.; Voisin, A.; Serpico, S.B.; Zerubia, J. Change detection with synthetic aperture radar images by Wilcoxon statistic likelihood ratio test. In Proceedings of the 2012 19th IEEE International Conference on Image Processing, Orlando, FL, USA, 30 September–3 October 2012; pp. 2093–2096. [Google Scholar]
- Mercier, G.; Moser, G.; Serpico, S. Conditional Copulas for Change Detection in Heterogeneous Remote Sensing Images. IEEE Trans. Geosci. Remote Sens. 2008, 46, 1428–1441. [Google Scholar] [CrossRef]
- Wang, X.L.; Chen, C.X. Image fusion for synthetic aperture radar and multispectral images based on sub-band-modulated non-subsampled contourlet transform and pulse coupled neural network methods. Imaging Sci. J. 2016, 64, 87–93. [Google Scholar] [CrossRef]
- Pappas, O.; Achim, A.; Bull, D.R. Curvelet fusion of panchromatic and SAR satellite imagery using fractional lower order moments. In Proceedings of the 2013 10th IEEE International Conference on Advanced Video and Signal Based Surveillance, Krakow, Poland, 27–30 August 2013; pp. 342–346. [Google Scholar]
- Gungor, O.; Shan, J. An Optimal Fusion Approach for Optical and SAR Images. In Proceedings of the ISPRS Commission VII Symposium: Remote Sensing: From Pixels to Process, Enschede, The Netherlands, 8–11 May 2006; pp. 111–116. [Google Scholar]
- Reyes, M.F.; Auer, S.J.; Merkle, N.; Henry, C.; Schmitt, M. SAR-to-Optical Image Translation Based on Conditional Generative Adversarial Networks—Optimization, Opportunities and Limits. Remote Sens. 2019, 11, 2067. [Google Scholar] [CrossRef] [Green Version]
- Li, Y.; Fu, R.; Meng, X.; Jin, W.; Shao, F. A SAR-to-Optical Image Translation Method Based on Conditional Generation Adversarial Network (cGAN). IEEE Access 2020, 8, 60338–60343. [Google Scholar] [CrossRef]
- Hellwich, O.; Heipke, C.; Wessel, B. Sensor and data fusion contest: Information for mapping from airborne SAR and optical imagery. In Proceedings of the IGARSS 2001, Scanning the Present and Resolving the Future, Proceedings, IEEE 2001 International Geoscience and Remote Sensing Symposium (Cat. No.01CH37217), Sydney, Australia, 9–13 July 2001; Volume 6, pp. 2793–2795. [Google Scholar]
- Santoso, A.W.; Bayuaji, L.; Sze, L.T.; Lateh, H.; Zain, J.M. Comparison of Various Speckle Noise Reduction Filters on Synthetic Aperture Radar Image. Int. J. Appl. Eng. Res. 2016, 11, 8760–8767. [Google Scholar]
- Zeng, Y.; Zhang, J.; Van Genderen, J.L. Change Detection Approach to SAR and Optical Image Integration. Int. Arch. Photogramm. Remote Sens. Spat. Inf. Sci. 2008, XXXVII, 1077–1084. [Google Scholar]
- Shimada, M. Ortho-Rectification and Slope Correction of SAR Data Using DEM and Its Accuracy Evaluation. IEEE J. Sel. Top. Appl. Earth Obs. Remote Sens. 2010, 3, 657–671. [Google Scholar] [CrossRef]
- Al-Nasrawi, A.K.M.; Hopley, C.A.; Hamylton, S.; Jones, B.G. A Spatio-Temporal Assessment of Landcover and Coastal Changes at Wandandian Delta System, Southeastern Australia. J. Mar. Sci. Eng. 2017, 5, 55. [Google Scholar] [CrossRef] [Green Version]
- Klonus, D. Comparison of Pansharpening Algorithms for Combining Radar and Multispectral Data. Int. Arch. Photogramm. Remote Sens. Spat. Inf. Sci. 2008, XXXVII, 189–194. [Google Scholar]
- Orsomando, F.; Lombardo, P.; Zavagli, M.; Costantini, M. SAR and Optical Data Fusion for Change Detection. In Proceedings of the Urban Remote Sensing Joint Event, Paris, France, 11–17 April 2007; pp. 1–9. [Google Scholar]
- Abdikan, S.; Sanli, F.B. Comparison of different fusion algorithms in urban and agricultural areas using sar (palsar and radarsat) and optical (spot) images. Boletim de Ciências Geodésicas 2012, 18, 509–531. [Google Scholar] [CrossRef] [Green Version]
- Ye, C.; Zhang, L.; Zhang, Z. SAR and panchromatic image fusion based on region features in nonsubsampled contourlet transform domain. In Proceedings of the 2012 IEEE International Conference on Automation and Logistics, Zhengzhou, China, 15–17 August 2012; Institute of Electrical and Electronics Engineers (IEEE): Piscataway, NJ, USA, 2012; pp. 358–362. [Google Scholar]
- Pohl, C.; Van Genderen, J. Review article Multisensor image fusion in remote sensing: Concepts, methods and applications. Int. J. Remote Sens. 1998, 19, 823–854. [Google Scholar] [CrossRef] [Green Version]
- Chibani, Y. Selective Synthetic Aperture Radar and Panchromatic Image Fusion by Using the à Trous Wavelet Decomposition. EURASIP J. Adv. Signal Process 2005, 2005, 404562. [Google Scholar] [CrossRef] [Green Version]
- Liu, G.; Li, L.; Gong, H.; Jin, Q.; Li, X.; Song, R.; Chen, Y.; Chen, Y.; He, C.; Huang, Y.; et al. Multisource Remote Sensing Imagery Fusion Scheme Based on Bidimensional Empirical Mode Decomposition (BEMD) and Its Application to the Extraction of Bamboo Forest. Remote Sens. 2016, 9, 19. [Google Scholar] [CrossRef] [Green Version]
- Pajares, G.; De La Cruz, J.M. A wavelet-based image fusion tutorial. Pattern Recognit. 2004, 37, 1855–1872. [Google Scholar] [CrossRef]
- Ma, X.; Hu, S.; Liu, S.; Fang, J.; Xu, S. Remote Sensing Image Fusion Based on Sparse Representation and Guided Filtering. Electronics 2019, 8, 303. [Google Scholar] [CrossRef] [Green Version]
- Miao, Q.; Wang, B. A Novel Fusion Method Using Contourlet Transform. In Proceedings of the 2006 International Conference on Communications, Circuits and Systems, Guilin, China, 25–28 June 2006; pp. 548–552. [Google Scholar]
- Da Cunha, A.L.; Zhou, J.; Do, M.N. The nonsubsampled contourlet transform: Theory, design, and applications. IEEE Trans. Image Process 2006, 15, 3089–3101. [Google Scholar] [CrossRef] [Green Version]
- Zhu, Z.; Yin, H.; Chai, Y.; Li, Y.; Qi, G. A novel multi-modality image fusion method based on image decomposition and sparse representation. Inf. Sci. 2018, 432, 516–529. [Google Scholar] [CrossRef]
- Seo, D.; Kim, Y.; Eo, Y.D.; Lee, M.H.; Park, W.Y. Fusion of SAR and Multispectral Images Using Random Forest Regression for Change Detection. ISPRS Int. J. Geo Inf. 2018, 7, 401. [Google Scholar] [CrossRef] [Green Version]
- Hultquist, C.; Chen, G.; Zhao, K. A comparison of Gaussian process regression, random forests and support vector regression for burn severity assessment in diseased forests. Remote Sens. Lett. 2014, 5, 723–732. [Google Scholar] [CrossRef]
- Tsai, F.; Lai, J.-S.; Lu, Y.-H. Full-Waveform LiDAR Point Cloud Land Cover Classification with Volumetric Texture Measures. Terr. Atmos. Ocean. Sci. 2016, 27, 549. [Google Scholar] [CrossRef] [Green Version]
- Wang, B.; Choi, J.; Choi, S.; Lee, S.; Wu, P.; Gao, Y. Image Fusion-Based Land Cover Change Detection Using Multi-Temporal High-Resolution Satellite Images. Remote Sens. 2017, 9, 804. [Google Scholar] [CrossRef] [Green Version]
- Hong, S.H.; Lee, K.Y.; Kim, Y.S. KOMPSAT-5 SAR Application. In Proceedings of the 2011 3rd International Asia-Pacific Conference on Synthetic Aperture Radar (APSAR), Seoul, Korea, 26–30 September 2011; pp. 1–2. [Google Scholar]
- Dimov, D.; Kuhn, J.; Conrad, C. Assessment of Cropping System Diversity in the Fergana Valley through Image Fusion of Landsat 8 and Sentinel-1. In Proceedings of the XXIII ISPRS Congress, Prague, Czech Republic, 12–19 July 2016; pp. 173–180. [Google Scholar]
- Seo, D.; Kim, Y.; Eo, Y.D.; Park, W.Y. Learning-Based Colorization of Grayscale Aerial Images Using Random Forest Regression. Appl. Sci. 2018, 8, 1269. [Google Scholar] [CrossRef] [Green Version]
- Ghosh, A.; Mishra, N.S.; Ghosh, S. Fuzzy clustering algorithms for unsupervised change detection in remote sensing images. Inf. Sci. 2011, 181, 699–715. [Google Scholar] [CrossRef]
- Shao, P.; Shi, W.; He, P.; Hao, M.; Zhang, X. Novel Approach to Unsupervised Change Detection Based on a Robust Semi-Supervised FCM Clustering Algorithm. Remote Sens. 2016, 8, 264. [Google Scholar] [CrossRef] [Green Version]
- Yan, W.; Shi, S.; Pan, L.; Zhang, G.; Wang, L. Unsupervised change detection in SAR images based on frequency difference and a modified fuzzy c-means clustering. Int. J. Remote Sens. 2018, 39, 3055–3075. [Google Scholar] [CrossRef]
- Seo, D.K.; Eo, Y.D. Relative Radiometric Normalization for High-Resolution Satellite Imagery Based on Multilayer Perceptron. J. Korean Soc. Surv. Geod. Photogramm Cartogr. 2018, 36, 515–523. [Google Scholar] [CrossRef]
- Seo, D.; Eo, Y.D. Multilayer Perceptron-Based Phenological and Radiometric Normalization for High-Resolution Satellite Imagery. Appl. Sci. 2019, 9, 4543. [Google Scholar] [CrossRef] [Green Version]
- Zakeri, H.; Yamazaki, F.; Liu, W. Texture Analysis and Land Cover Classification of Tehran Using Polarimetric Synthetic Aperture Radar Imagery. Appl. Sci. 2017, 7, 452. [Google Scholar] [CrossRef] [Green Version]
- Vigneshl, T.; Thyagharajan, K.K. Local binary pattern texture feature for satellite imagery classification. In Proceedings of the 2014 International Conference on Science Engineering and Management Research (ICSEMR), Chennia, India, 27–29 November 2014; pp. 1–6. [Google Scholar]
- Huang, C. Terrain classification of polarimetric synthetic aperture radar imagery based on polarimetric features and ensemble learning. J. Appl. Remote Sens. 2017, 11, 26002. [Google Scholar] [CrossRef] [Green Version]
- Marmel, U. Use of Filters for Texture Classification of Airborne Images and LIDAR data. Arch. Photogramm. Cartogr. Remote Sens. 2011, 22, 325–336. [Google Scholar]
- Kim, J.; Um, S.; Min, D. Fast 2D Complex Gabor Filter With Kernel Decomposition. IEEE Trans. Image Process 2018, 27, 1713–1722. [Google Scholar] [CrossRef] [Green Version]
- Chen, L.; Zhu, Q.; Xie, X.; Hu, H.; Zeng, H. Road Extraction from VHR Remote-Sensing Imagery via Object Segmentation Constrained by Gabor Features. ISPRS Int. J. Geo Inf. 2018, 7, 362. [Google Scholar] [CrossRef] [Green Version]
- A Clausi, D.; Jernigan, M.E. Designing Gabor filters for optimal texture separability. Pattern Recognit. 2000, 33, 1835–1849. [Google Scholar] [CrossRef]
- Chen, C.; Li, W.; Su, H.; Liu, K. Spectral-Spatial Classification of Hyperspectral Image Based on Kernel Extreme Learning Machine. Remote Sens. 2014, 6, 5795–5814. [Google Scholar] [CrossRef] [Green Version]
- Kamarainen, J.-K.; Kyrki, V.; Kälviäinen, H. Invariance properties of gabor filter-based features-overview and applications. IEEE Trans. Image Process 2006, 15, 1088–1099. [Google Scholar] [CrossRef]
- Bianconi, F.; Fernández, A. Evaluation of the effects of Gabor filter parameters on texture classification. Pattern Recognit. 2007, 40, 3325–3335. [Google Scholar] [CrossRef] [Green Version]
- Ilonen, J.; Kamarainen, J.-K.; Kalviainen, H. Fast extraction of multi-resolution Gabor features. In Proceedings of the 14th International Conference on Image Analysis and Processing (ICIAP 2007), Modena, Italy, 10–14 September 2007; Institute of Electrical and Electronics Engineers (IEEE): Piscataway, NJ, USA, 2007; pp. 481–486. [Google Scholar]
- Deng, H.B.; Lian, W.J.; Zhen, L.X.; Huang, J.C. A New Facial Expression Recognition Method Based on Local Filter Bank and PCA plus LDA. Int. J. Inf. Tech. 2005, 11, 86–96. [Google Scholar]
- Seo, D.; Kim, Y.; Eo, Y.D.; Park, W.Y.; Park, H.C. Generation of Radiometric, Phenological Normalized Image Based on Random Forest Regression for Change Detection. Remote Sens. 2017, 9, 1163. [Google Scholar] [CrossRef] [Green Version]
- Breiman, L. Random Forests. Mach. Learn. 2001, 45, 5–32. [Google Scholar] [CrossRef] [Green Version]
- Peters, J.; De Baets, B.; Verhoest, N.E.C.; Samson, R.; Degroeve, S.; De Becker, P.; Huybrechts, W. Random forests as a tool for ecohydrological distribution modelling. Ecol. Model. 2007, 207, 304–318. [Google Scholar] [CrossRef]
- Prasad, A.; Iverson, L.R.; Liaw, A. Newer Classification and Regression Tree Techniques: Bagging and Random Forests for Ecological Prediction. Ecosystems 2006, 9, 181–199. [Google Scholar] [CrossRef]
- Rodriguez-Galiano, V.; Sanchez-Castillo, M.; Olmo, M.C.; Chica-Rivas, M. Machine learning predictive models for mineral prospectivity: An evaluation of neural networks, random forest, regression trees and support vector machines. Ore Geol. Rev. 2015, 71, 804–818. [Google Scholar] [CrossRef]
- Hutengs, C.; Vohland, M. Downscaling land surface temperatures at regional scales with random forest regression. Remote Sens. Environ. 2016, 178, 127–141. [Google Scholar] [CrossRef]
- Pal, M.; Singh, N.; Tiwari, N. Pier scour modelling using random forest regression. ISH J. Hydraul. Eng. 2013, 19, 69–75. [Google Scholar] [CrossRef]
- Chagas, C.D.S.; Júnior, W.D.C.; Bhering, S.B.; Filho, B.C. Spatial prediction of soil surface texture in a semiarid region using random forest and multiple linear regressions. Catena 2016, 139, 232–240. [Google Scholar] [CrossRef]
- Piella, G.; Hejimans, H. A New Quality for Image Fusion. In Proceedings of the 200 International Conference on Image Processing, Barcelona, Spain, 14–17 September 2003; pp. 173–176. [Google Scholar]
- Pandit, V.R.; Bhiwani, R.J. Image Fusion in Remote Sensing Applications: A Review. Int. J. Comput. Appl. 2015, 120, 22–32. [Google Scholar] [CrossRef]
Figure 1.
Location of the study area (red outline indicates the study area).

Figure 2.
Experimental images from Site 1: (a) synthetic aperture radar image acquired on 10 September 2015; and (b) panchromatic image acquired on 7 August 2015.
Figure 2.
Experimental images from Site 1: (a) synthetic aperture radar image acquired on 10 September 2015; and (b) panchromatic image acquired on 7 August 2015.

Figure 3.
Experimental images from Site 2: (a) synthetic aperture radar image acquired on 10 September 2015; and (b) panchromatic image acquired on 7 August 2015.
Figure 3.
Experimental images from Site 2: (a) synthetic aperture radar image acquired on 10 September 2015; and (b) panchromatic image acquired on 7 August 2015.

Figure 4.
Experimental images from Site 3: (a) synthetic aperture radar image acquired on 10 September 2015; and (b) panchromatic image acquired on 7 August 2015.
Figure 4.
Experimental images from Site 3: (a) synthetic aperture radar image acquired on 10 September 2015; and (b) panchromatic image acquired on 7 August 2015.

Figure 5.
Flowchart of the proposed method.

Figure 6.
Comparison with the results of image fusion for Site 1: (a) proposed method; (b) a-trous wavelet decomposition; (c) discrete wavelet transform; (d) non-subsampled contourlet transform; and (e) non-subsampled contourlet transform-pulse couple neural network.
Figure 6.
Comparison with the results of image fusion for Site 1: (a) proposed method; (b) a-trous wavelet decomposition; (c) discrete wavelet transform; (d) non-subsampled contourlet transform; and (e) non-subsampled contourlet transform-pulse couple neural network.

Figure 7.
Comparison with the results of image fusion for Site 2: (a) proposed method; (b) a-trous wavelet decomposition; (c) discrete wavelet transform; (d) non-subsampled contourlet transform; and (e) non-subsampled contourlet transform-pulse couple neural network.
Figure 7.
Comparison with the results of image fusion for Site 2: (a) proposed method; (b) a-trous wavelet decomposition; (c) discrete wavelet transform; (d) non-subsampled contourlet transform; and (e) non-subsampled contourlet transform-pulse couple neural network.

Figure 8.
Comparison with the results of image fusion for Site 3: (a) proposed method; (b) a-trous wavelet decomposition; (c) discrete wavelet transform; (d) non-subsampled contourlet transform; and (e) non-subsampled contourlet transform-pulse couple neural network.
Figure 8.
Comparison with the results of image fusion for Site 3: (a) proposed method; (b) a-trous wavelet decomposition; (c) discrete wavelet transform; (d) non-subsampled contourlet transform; and (e) non-subsampled contourlet transform-pulse couple neural network.

Figure 9.
Enlargement of the area marked with a red rectangle: (a) Site 1, (b) Site 2, (c) Site 3. From left to right: proposed method, a-trous wavelet decomposition, discrete wavelet transforms, non-subsampled contourlet transform, and non-subsampled contourlet transform-pulse couple neural network.

Figure 10.
Classification images: (a) Site 1, (b) Site 2, (c) Site 3.

Figure 11.
Scatter plots for each class: (a) Site 1, (b) Site 2 (c) Site 3.


Figure 12.
Experimental images in the additional dataset (Site 1): (a) TerraSAR-X image acquired on 8 August 2019, (b) GeoEye-1 image acquired on 19 August 2019, (c) fusion result of the proposed method.
Figure 12.
Experimental images in the additional dataset (Site 1): (a) TerraSAR-X image acquired on 8 August 2019, (b) GeoEye-1 image acquired on 19 August 2019, (c) fusion result of the proposed method.

Figure 13.
The experimental images in the additional dataset (Site 2): (a) TerraSAR-X image acquired on 8 August 2019, (b) GeoEye-1 image acquired on 19 August 2019, (c) fusion result of the proposed method.
Figure 13.
The experimental images in the additional dataset (Site 2): (a) TerraSAR-X image acquired on 8 August 2019, (b) GeoEye-1 image acquired on 19 August 2019, (c) fusion result of the proposed method.


Table 1.
Specifications of the experimental data (SAR: synthetic aperture radar, HH: horizontal transmit-horizontal receive).
Table 1.
Specifications of the experimental data (SAR: synthetic aperture radar, HH: horizontal transmit-horizontal receive).
| Sensor | KOMPSAT-5 (SAR Image) | WorldView-3 (Panchromatic Image) |
|---|---|---|
| Location | Seoul (Korea) | |
| Date | 10 September 2015 | 7 August 2015 |
| Spatial resolution (m) | 1 m | 0.31 m |
| Radiometric resolution | - | 11-bit |
| Polarization | HH | - |
| Flight direction | Ascending | - |
| Image size (pixels) | 2000 × 2000 |
Table 2.
Evaluations for the image fusion methods (FQI: fusion quality index, AG: average gradient, SF: spatial frequency, ATWD: à-trous wavelet decomposition, DWT: discrete wavelet transforms, NSCT: non-subsampled contourlet transform, NSCT-PCNN: non-subsampled contourlet transform-pulse couple neural network).
| Site | Method | FQI | AG | SF |
|---|---|---|---|---|
| Site 1 | Proposed method | 0.8489 | 18.5836 | 10.1753 |
| ATWD | 0.7638 | 14.8698 | 7.5353 | |
| DWT | 0.7865 | 14.3675 | 7.0175 | |
| NSCT | 0.5775 | 20.0136 | 8.4952 | |
| NSCT-PCNN | 0.6499 | 20.4469 | 9.2749 | |
| Site 2 | Proposed method | 0.8199 | 33.5763 | 17.0272 |
| ATWD | 0.7921 | 21.1922 | 11.0085 | |
| DWT | 0.8146 | 21.1521 | 10.4409 | |
| NSCT | 0.6007 | 28.738 | 12.3708 | |
| NSCT-PCNN | 0.6527 | 30.0487 | 13.6092 | |
| Site 3 | Proposed method | 0.7936 | 29.9653 | 15.7126 |
| ATWD | 0.7659 | 19.2859 | 10.3327 | |
| DWT | 0.7891 | 20.2947 | 10.2658 | |
| NSCT | 0.5911 | 25.9567 | 11.4126 | |
| NSCT-PCNN | 0.6468 | 27.9568 | 12.9668 |
Table 3.
Values of the predictive models for each class.
| Site | Class 1 | Class 2 | Class 3 | Class 4 | Class 5 | Class 6 |
|---|---|---|---|---|---|---|
| Site 1 | 0.9856 | 0.9209 | 0.9171 | 0.9745 | 0.8698 | 0.8771 |
| Site 2 | 0.9594 | 0.8775 | 0.8791 | 0.9606 | 0.8584 | 0.8792 |
| Site 3 | 0.9450 | 0.8917 | 0.8692 | 0.9591 | 0.8593 | 0.8717 |
Table 4.
Variable importance scores averaged across all classes.
| Variable Importance Scores (%) | Site 1 | Site 2 | Site 3 |
|---|---|---|---|
| Intensity | 13.24 | 16.59 | 15.03 |
| Gabor filter-principal component 1 | 5.70 | 5.72 | 5.94 |
| Gabor filter-principal component 2 | 4.90 | 4.61 | 4.79 |
| Gabor filter-principal component 3 | 4.88 | 4.60 | 4.80 |
| Gabor filter-principal component 4 | 4.91 | 4.57 | 4.80 |
| Gabor filter-principal component 5 | 4.92 | 4.55 | 4.78 |
| Gabor filter-principal component 6 | 4.94 | 4.67 | 4.78 |
| Mean () | 12.82 | 12.27 | 13.45 |
| Mean () | 10.19 | 8.97 | 9.50 |
| Mean () | 6.92 | 8.49 | 7.82 |
| Mean () | 6.66 | 7.07 | 6.13 |
| Standard deviation () | 4.83 | 4.44 | 4.50 |
| Standard deviation () | 4.85 | 4.29 | 4.43 |
| Standard deviation () | 4.95 | 4.45 | 4.49 |
| Standard deviation () | 5.31 | 4.72 | 4.78 |
Table 5.
Evaluations of the additional dataset (FQI: fusion quality index, AG: average gradient, SF: spatial frequency).
Table 5.
Evaluations of the additional dataset (FQI: fusion quality index, AG: average gradient, SF: spatial frequency).
| Site | FQI | AG | SF |
|---|---|---|---|
| Site 1 | 0.7967 | 24.0456 | 14.8655 |
| Site 2 | 0.7873 | 28.3798 | 18.0001 |
© 2020 by the authors. Licensee MDPI, Basel, Switzerland. This article is an open access article distributed under the terms and conditions of the Creative Commons Attribution (CC BY) license (http://creativecommons.org/licenses/by/4.0/).
Share and Cite
MDPI and ACS Style
Seo, D.K.; Eo, Y.D. A Learning-Based Image Fusion for High-Resolution SAR and Panchromatic Imagery. Appl. Sci. 2020, 10, 3298. https://0-doi-org.brum.beds.ac.uk/10.3390/app10093298
AMA Style
Seo DK, Eo YD. A Learning-Based Image Fusion for High-Resolution SAR and Panchromatic Imagery. Applied Sciences. 2020; 10(9):3298. https://0-doi-org.brum.beds.ac.uk/10.3390/app10093298
Chicago/Turabian StyleSeo, Dae Kyo, and Yang Dam Eo. 2020. "A Learning-Based Image Fusion for High-Resolution SAR and Panchromatic Imagery" Applied Sciences 10, no. 9: 3298. https://0-doi-org.brum.beds.ac.uk/10.3390/app10093298
Note that from the first issue of 2016, this journal uses article numbers instead of page numbers. See further details here.