Article

Dynamic Model and Graphical User Interface: A Solution for the Distribution Process of Regional Products

by
Ernesto A. Lagarda-Leyva
1,
Alfredo Bueno-Solano
1,*,
Harvey P. Vea-Valdez
2 and
Daniel O. Machado
3
1
Industrial Engineering Department at Sonora Institute of Technology, Cd. Obregón, Sonora 85000, Mexico
2
Aptiv Corporation, Los Mochis, Sinaloa 81280, Mexico
3
AGM Corporative, Cd. Obregón, Sonora 85010, Mexico
*
Author to whom correspondence should be addressed.
Submission received: 1 June 2020 / Revised: 19 June 2020 / Accepted: 21 June 2020 / Published: 28 June 2020
(This article belongs to the Special Issue Applied Engineering to Lean Manufacturing and Production Systems 2020)

Abstract

:

Featured Application

This solution was registered as a user manual in the National Institute of Copyright (INDAUTOR) under the register 03-2019-121810235200-01. For the organization, it provides specific information on how to use a graphic interface for all the regional products distributed to its customers in southern Sonora, Mexico, and it actually provides a lower logistics cost for delivery and inventories.

Abstract

Organizations in the agroindustry sector face shorter delivery schedules; therefore, they are seeking ways to conduct more effective and less costly product distribution. Supply chain management efforts have focused on improving the flow of both products and information. Thus, the aim of this case study was to build a graphical user interface to enable decision-making based on quantitative information for a food distribution process. The problem to be solved was associated with the development of a technological solution to reduce and control variations in transportation times, delivery costs and capacities in cold and dry food distribution. An eight-step system for a dynamics methodology was used: (1) distribution process analysis, (2) route description, (3) variable and parameter description, (4) causal loop diagram creation, (5) current model simulation, (6) validation, (7) quantitative scenario construction based on key performance indicators, and (8) graphical user interface development. The main findings of this research were that the graphical user interface and simulation showed information that represented on average 56.49% of the total distribution costs regarding fuel and that maintenance and tire wearing costs had less of an impact on total costs, representing 9.21% and 3.66% of the total costs, respectively. Additionally, the technological solution—created for the supply chain in the distribution process against the background of changes in policies—makes it possible to improve decision-making based on different scenarios supported by a graphical interface according to key performance indicators. This solution could be used by different organizations who aim to reduce logistics and transportation costs. The main implications of this research were the available and organized information and the restructuring of the distribution process.

Graphical Abstract

1. Introduction

Southern Sonora, Mexico has 158 organizations registered as a “wholesale business”. They are grouped according to the different products offered and are distributed into economic entities, as is the case for the studied organization. Economic units in the wholesale sector are mainly divided according to the types of products distributed, namely the wholesale marketing of fruits and vegetables, groceries, seeds and food grains.
Within this context, the organization under study is a regional product wholesaler—mostly involving food but also cleaning products and medicines—in southern Sonora. Its main clients are four dining facilities located in Ciudad Obregón, Bácum, Etchojoa and Campo 5, as well as organization workers in the same area. The company business model is focused on being an intermediary between the producer and the end customer and it is seeking to expand product sales in the region. These operations are carried out on a Web platform and an application through which customers place their order to the company in charge of delivering the products to the client, stepping into the area of what is known as e-commerce.
In this research study, the main problem to be solved was associated with the development of a technological solution to reduce the variations in transportation times, delivery costs and distribution capacities of cold and dry food.
Within the distribution process under study, a number of variables have negative impacts; for example, diesel fuel had an average price of $21.61 Mexican pesos in the southern region of Sonora until March 2019. On the other hand, transit vehicle capacity usage was at 66.6%, 29.86% and 23.26% of a total load of 1300 kg with respect to its usage in the months of January, February and March 2019, respectively. The Rabon-type truck—owned by the company, with a capacity of 8000 kg—is not being used under the current conditions. Moreover, the current wholesale customer demand ranges from a minimum of 10.16 kg to a maximum of 1830.92 kg per order, which causes a cost variation in the transport of a kilogram, with a fluctuation between $3.48 and $0.04, considering the kilograms per order and distribution cost. Due to the above-mentioned situation, the complicated interactions of these variables have led to more empirical decision-making, affecting the entire process performance.

2. Literature Review

2.1. Regional Product Distribution Process

Product distribution processes to customers are related to the last part of the supply chain; this stage is one of the most critical because it is directly related to the logistics of goods or services to end customers located in local or external geographical locations. Logistics involves the integration of different elements, namely information flow, transportation, inventory, storage, material handling, packaging and—most recently—security [1,2]. Supply chain complexity may be approached with several tools for decision-making; one of these tools is system dynamics methodology, which is used to better understand the organization’s complexity when viewed as a system.
A system—entity of at least two elements—is defined as a set of interrelated elements; each one of these elements is related to the other ones, either directly or indirectly, and these relationships have been identified as being of special interest [3,4].
Systemic thought allows a conceptual framework of these interactions; this is reflected in different dynamic archetypes, which enable a greater clarity and understanding of each of the parts of the supply chain. From a conceptual and quantitative perspective, through the use of differential equations, they are represented in related diagrams, such as flows, levels (warehouses, lines, ovens and bands) and auxiliary variables, as well as endogenous and exogenous parameters that are represented in dynamics models [5,6,7,8,9,10,11].

2.2. Supply Chain System Dynamics Analysis

System dynamics studies information feedback characteristics, mainly within industrial activity, with the purpose of clarifying the organizational structure, policy extension and delays (in actions and decisions) that interact and impact organizations’ success. Its study objective is based on the examination of interactions between company information flow, money, orders, materials, staff and equipment that arise in the entrepreneurial environment, such as in production and employment instability, because these interactions shape the companies’ assumptions regarding the difficulty of experimenting and restating criticism [12,13,14,15].
To better understand the behavior variables that are conditioned by organizational policies, an interface has been developed for the user to observe different scenarios through the variation of the most sensitive parameters. The scenarios may lead to reflection on the considerable changes that take place in education and its more comprehensive environment, which may clarify the vision of what is desired in education and how to reach these goals by analyzing the negative variables that should be avoided [16,17,18,19].

2.3. Empirical Studies

The empirical studies using system dynamics methodology have focused on supplier and food distribution, as exhibited in [20]; the authors proposed a model facilitating the identification and study of the critical components of the overall supply chain, allowing the creation of an efficient and sustainable model. The model also provides a tool for the generation of multiple business situations for effective strategic planning and business decision-making.
In [21], the authors used system dynamics to facilitate resilience planning for food security in rural communities; they found that stability in food systems was mainly driven by key actions and resources that moderate the effects of environmental changes on food availability and affordability.
On the other hand, in [22], the authors applied game theory to a supply chain. Their supply chain consisted of a farmer and a local food retailer with stochastic exogenous demand and risk sharing policies; they used a single period inventory in which a single ordering decision was to be made before the sales period began to maximize the expected total profit.
From another perspective, the authors in [23] exhibited the user interfaces (input and output dashboards) of a model to help decision makers modify the values of selected endogenous parameters and to see and compare the time-based values of the resilience factors and thus evaluate the risks related to the Operation Area in the North Atlantic Treaty Organization (NATO). The model represented the interrelationships among various resilience domains (continuity of government, energy supplies, movement of people, food and water, mass casualties, communication, and transportation) and provided a holistic methodology for a comprehensive resilience assessment for NATO.
The authors in [24] reported recommendations on the potential of system thinking modeling in the use of causal loops; one of the phases in the system dynamics methodology encompassed the development of a causal model, considering exogenous and endogenous variables, as well as parameters that directly impact the behavior of one or more dynamic variables within the entities.
According to the authors in [25], the system dynamics methodology could be used to develop a complex and dynamic system, such as in the energy sector and the food sector, which requires a comprehensive understanding of their constituent components and interactions. In consequence, this method requires an approach that can adapt to the complexity of the system dynamics.
In [26], in partnership with the Wheat Society at southern Sonora, the authors reported a dynamics interface that would allow the observation of the quantitative scenarios in the distribution link. The method included the prior analysis of the wheat collection processes and delivery at the Port of Guaymas to attend to the demands of Algeria, Nigeria and Venezuela.
The authors in [27] presented a study to find an alternative solution to the currently used production method using the system dynamics approach. Real conditions were captured in a model; then, a series of decision scenarios were performed to obtain the best results using computer assistance. The scenario results showed that soybean production could be increased to meet the needs of soybean demand in Indonesia for 20 years.
The contribution of this research is the use of systems dynamics methodology in a regional product distribution process as a part of food supply chains. A graphical interface can be used for decision-making based on quantitative information with different policies used to run scenarios and predict possible answers before investing in and implementing solutions.

3. Materials and Methods

3.1. Materials

For the development of the graphical user interface, the following software was used: (a) Stella® Architect 1.6 version (Isee Systems, Lebanon, NH, 03766, USA); (b) Vensim® PLE 7.3.5 version (Ventana Systems Inc., Harvard, MA, 01451, USA); (c) Excel Matrix with distribution data (Microsoft, Redmond, WA, 98052, USA); and (d) Google Maps® (Alphabet Inc, Mountain View, CA, 94043, USA).

3.2. Method

The methodological basis of the research undertaken to meet the objectives consisted of eight steps of the system dynamics methodology, primarily based on contributions made in [28,29,30].
The creator of system dynamics methodology defines it as a process that studies data feedback characteristics—mainly within industrial activities—to prove how organizational structures, policy broadening and delays (in both actions and decisions) interact and impact success within an organization. Its subject matter is based on the examination of the interactions between company data flow, money, orders, materials, staff and equipment. Moreover, system dynamics provides a single structure to group the functional areas of top management [11].
From another perspective, in [12], the authors established the use of system dynamics as a method to optimize learning within complex systems and develop decision-making simulators by means of specialized computer software. The purpose of their work was to determine the dynamics complexity within a system, to understand the source of policy resistance and to design more effective strategies, such as the following: (1) distribution process analysis, (2) route description, (3) variable and parameter description, (4) causal loop diagram creation, (5) current model simulation, (6) current model validation, (7) quantitative scenario construction based on key performance indicators (KPIs) and (8) graphical user interface development.

4. Results

The case study in this research is related to a micro-company that has a collection center for regional products associated with the cold and dry food chain, which must be packaged according to demand and distributed to customers located on different routes. The objective of this work is to minimize costs and delivery time. The company requires the monitoring of the logistics performance indicators; the following steps were followed for the solution, which could be generalized for different organizations intending to reduce logistics and transportation costs.

4.1. Analysis of the Distribution Process

In order to better understand the context of the studied company, different mapping techniques were carried out with information collected from interviews and guided visits within the company by the director with the aim of improving our understanding of its operation.
The work team met with the company director and staff from the distribution process. The director shared information and showed the complete supply chain processes and the available information required to develop the solution through a guided visit.
On the other hand, the administrator of the regional products (dry and cold distribution process) gave a mapping tour of all the delivery routes; the maps for each route were constructed and data were collected and validated. The solution was presented to the director and distributors to validate the graphical interface.
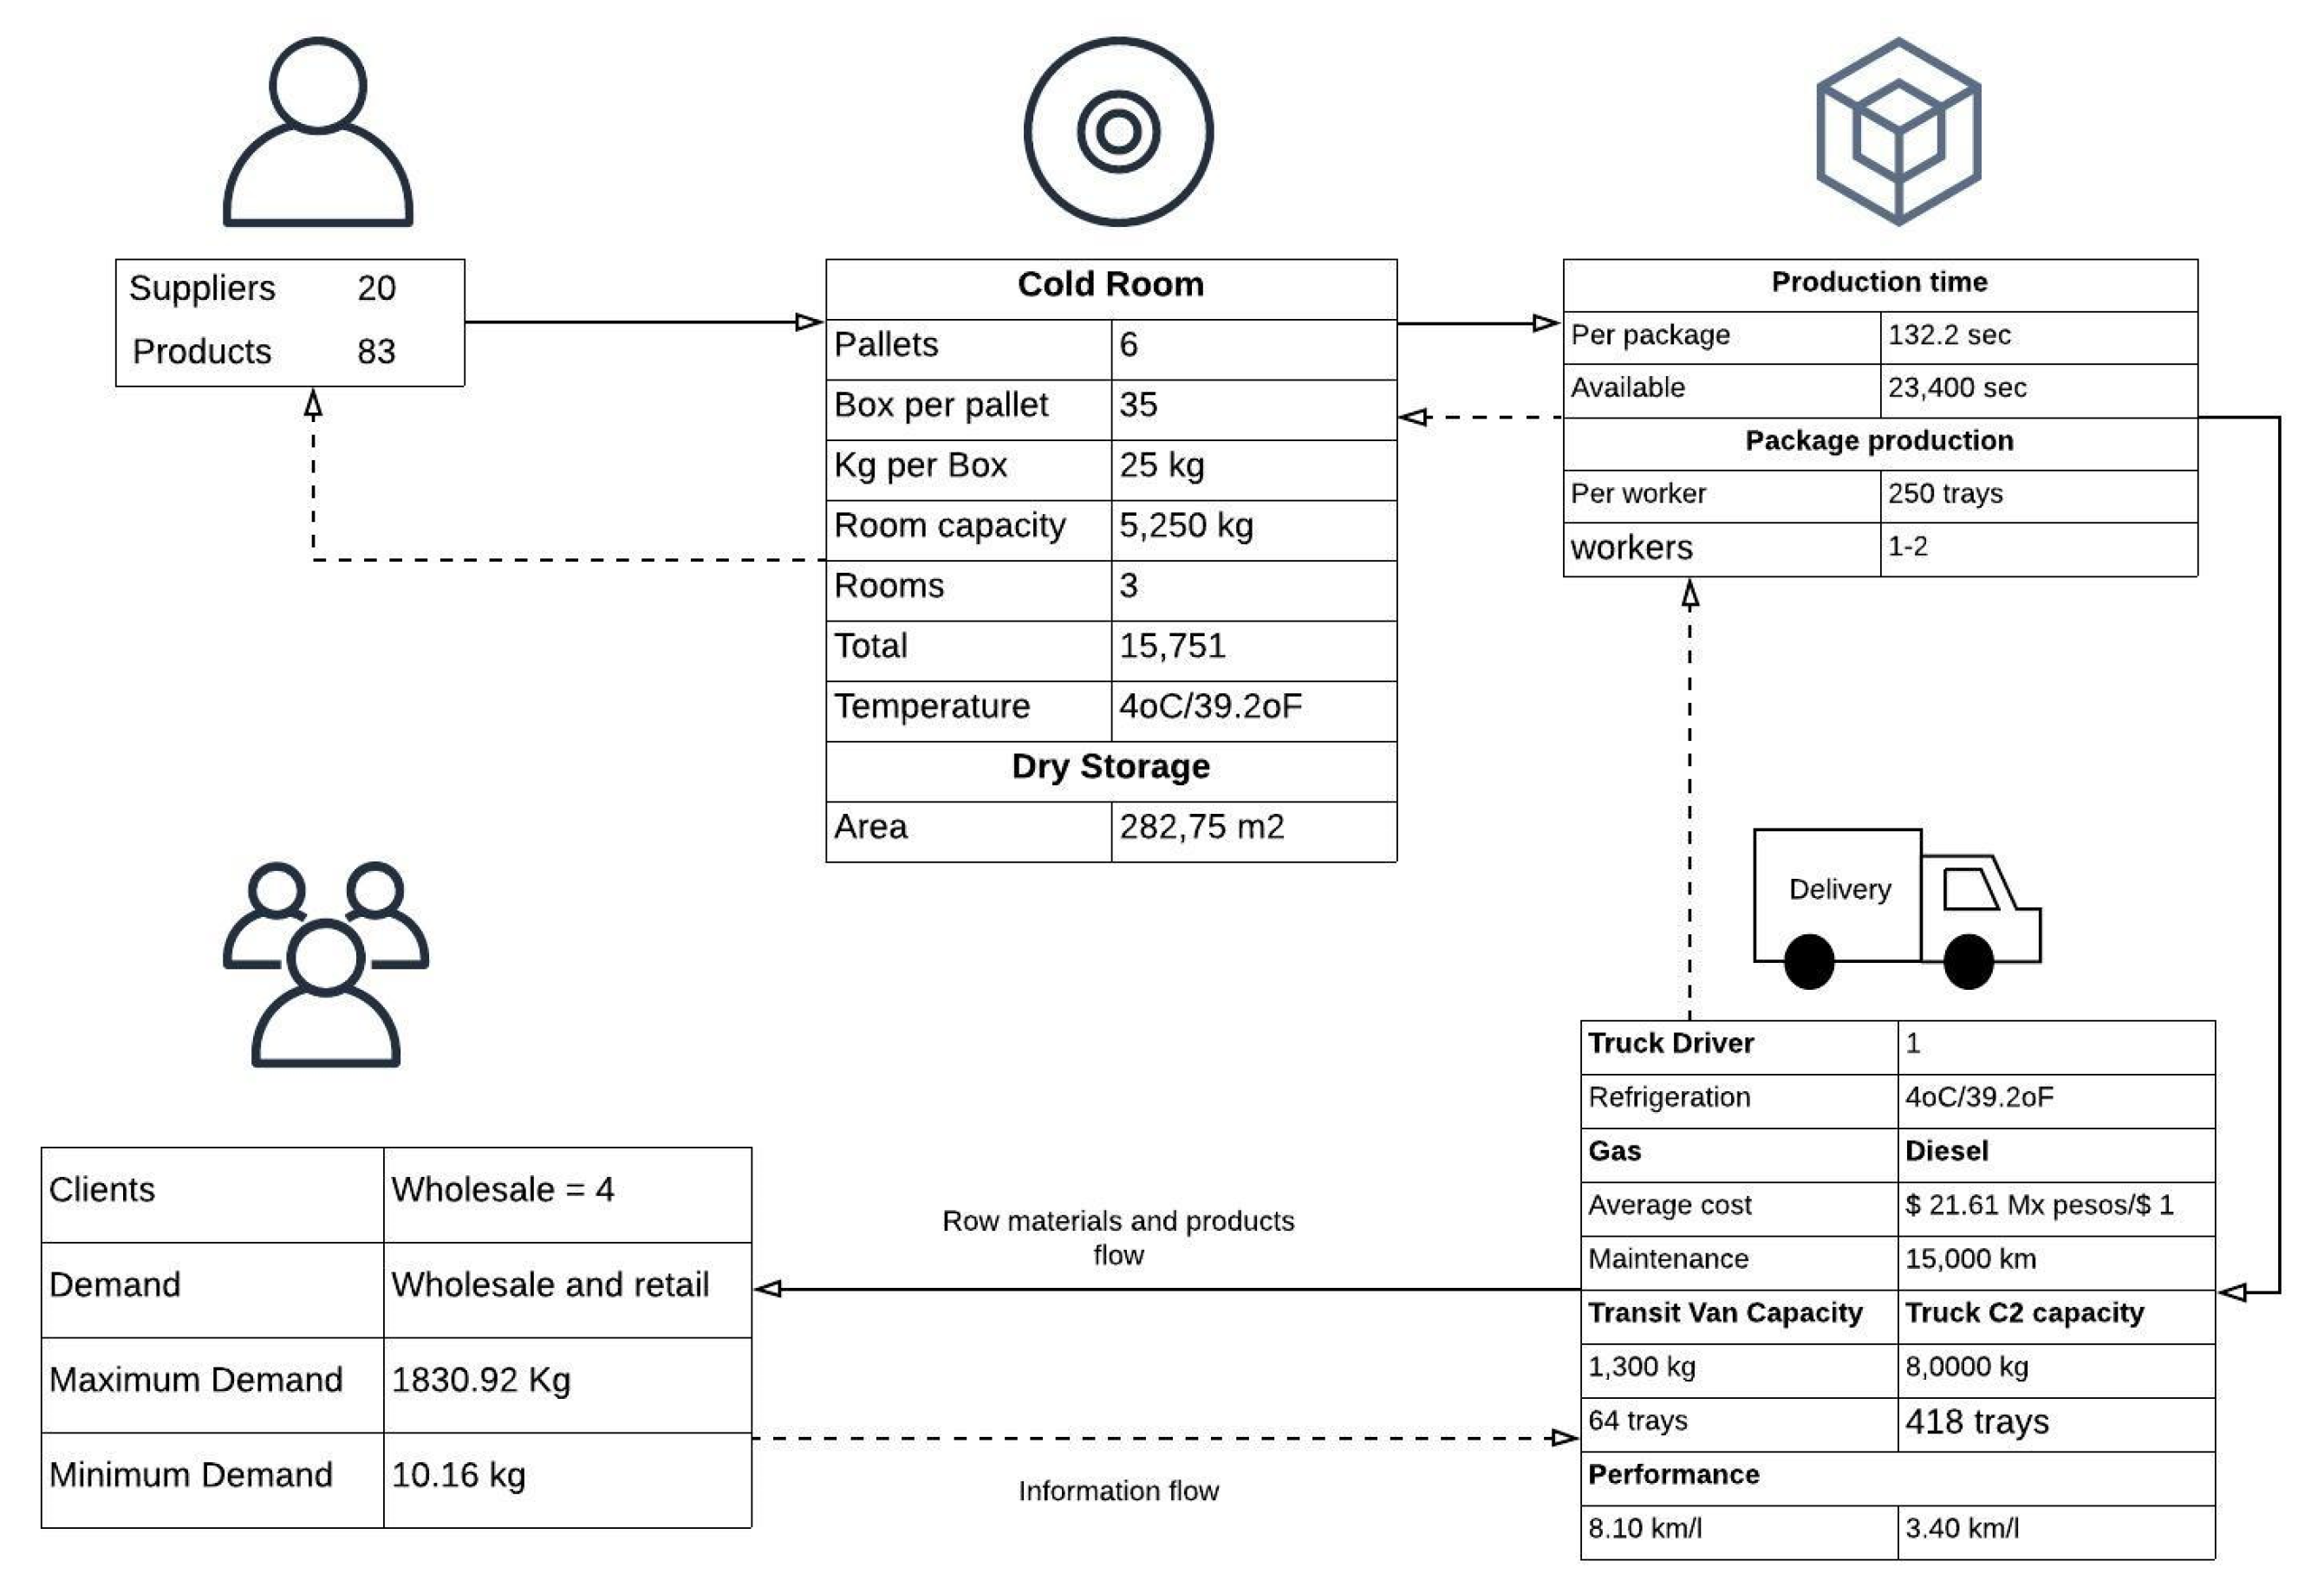
A supply chain map was made with the most important aspects of the company’s current supply chain. As already mentioned, the first contact with the company was made through interviews and a guided visit, which provided more clarity on the vision of how the organization operates, as shown in Figure 1.

4.2. Route Description

By conducting interviews with the owner regarding the process and distribution route observation, the current distribution routes were put into context; these routes corresponded to the four current customers of the organization, located in the Industrial Park of Ciudad Obregón, Bacum, Campo 5 and Etchojoa, Sonora, Mexico, as shown in Table 1.

4.3. Variable and Parameter Description

To identify important variables and parameters in the distribution process which should be included in the simulation model, the process information provided by the owner was taken into consideration first, as well as the information obtained from the conducted interviews. Regarding the organization, the variables to be considered are shown in Table 2.
To broaden the project approach, the existing literature was reviewed with reference to product distribution. This research considered empirical and technical studies [31,32,33,34,35]. The literature background allowed us to extend the variables considered during the implementation of the simulation dynamics model, as shown in Table 3.

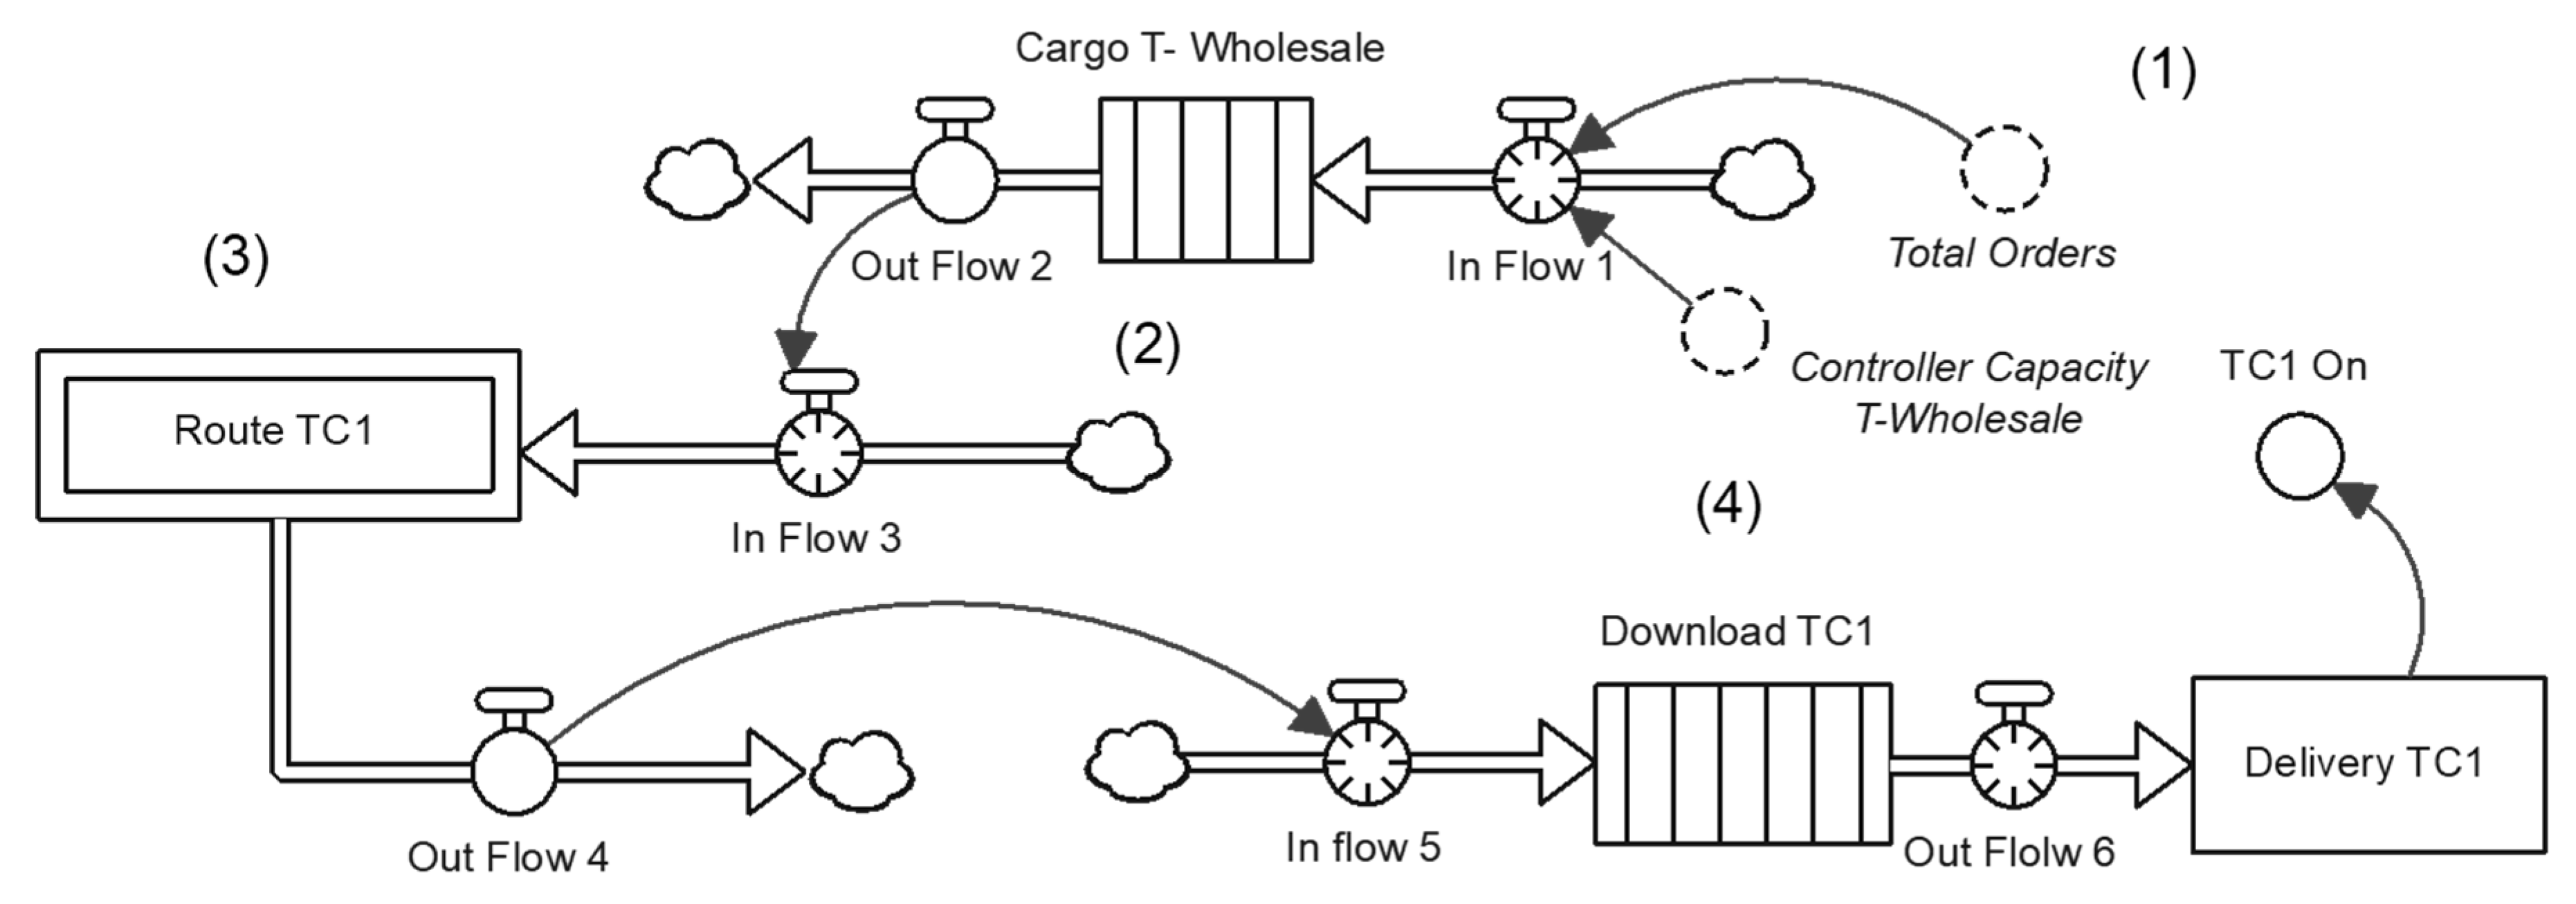
4.4. Causal Loop Diagram Creation

For the variables analyzed in the previous step, a causal diagram related to variable behavior and interaction was created for the company’s distribution process, as shown in Figure 2.
The causal loop diagram shows the variables that are interrelated at the moment of instigating the wholesale and retail demand distribution process. The influence of the interaction among variables is depicted by the symbols positive (+)—defining a reinforcement variable—and negative (−)—defining a balancing variable. The diagram has five feedback loops that are responsible for balancing the system (B1, B2 is B1-2, B3, B4, and B5). Each loop is explained according to its relationship and conditions; B refers to the balancing loop.
The first causal loop is B1-B2 is B1-2, which shows the relationship among warehouse products, demand, distribution, product delivery, routes, costs, profit, investments, number of trucks, distribution capacity and clients; the B1 loop closes with wholesale demand, and at the same time, B2 closes the loop with retail demand. B3 is the relationship between warehouse products and distribution process, and B4 is the relationship between warehouse products and production package. Finally, B5 is the relationship between delivery routes and costs.

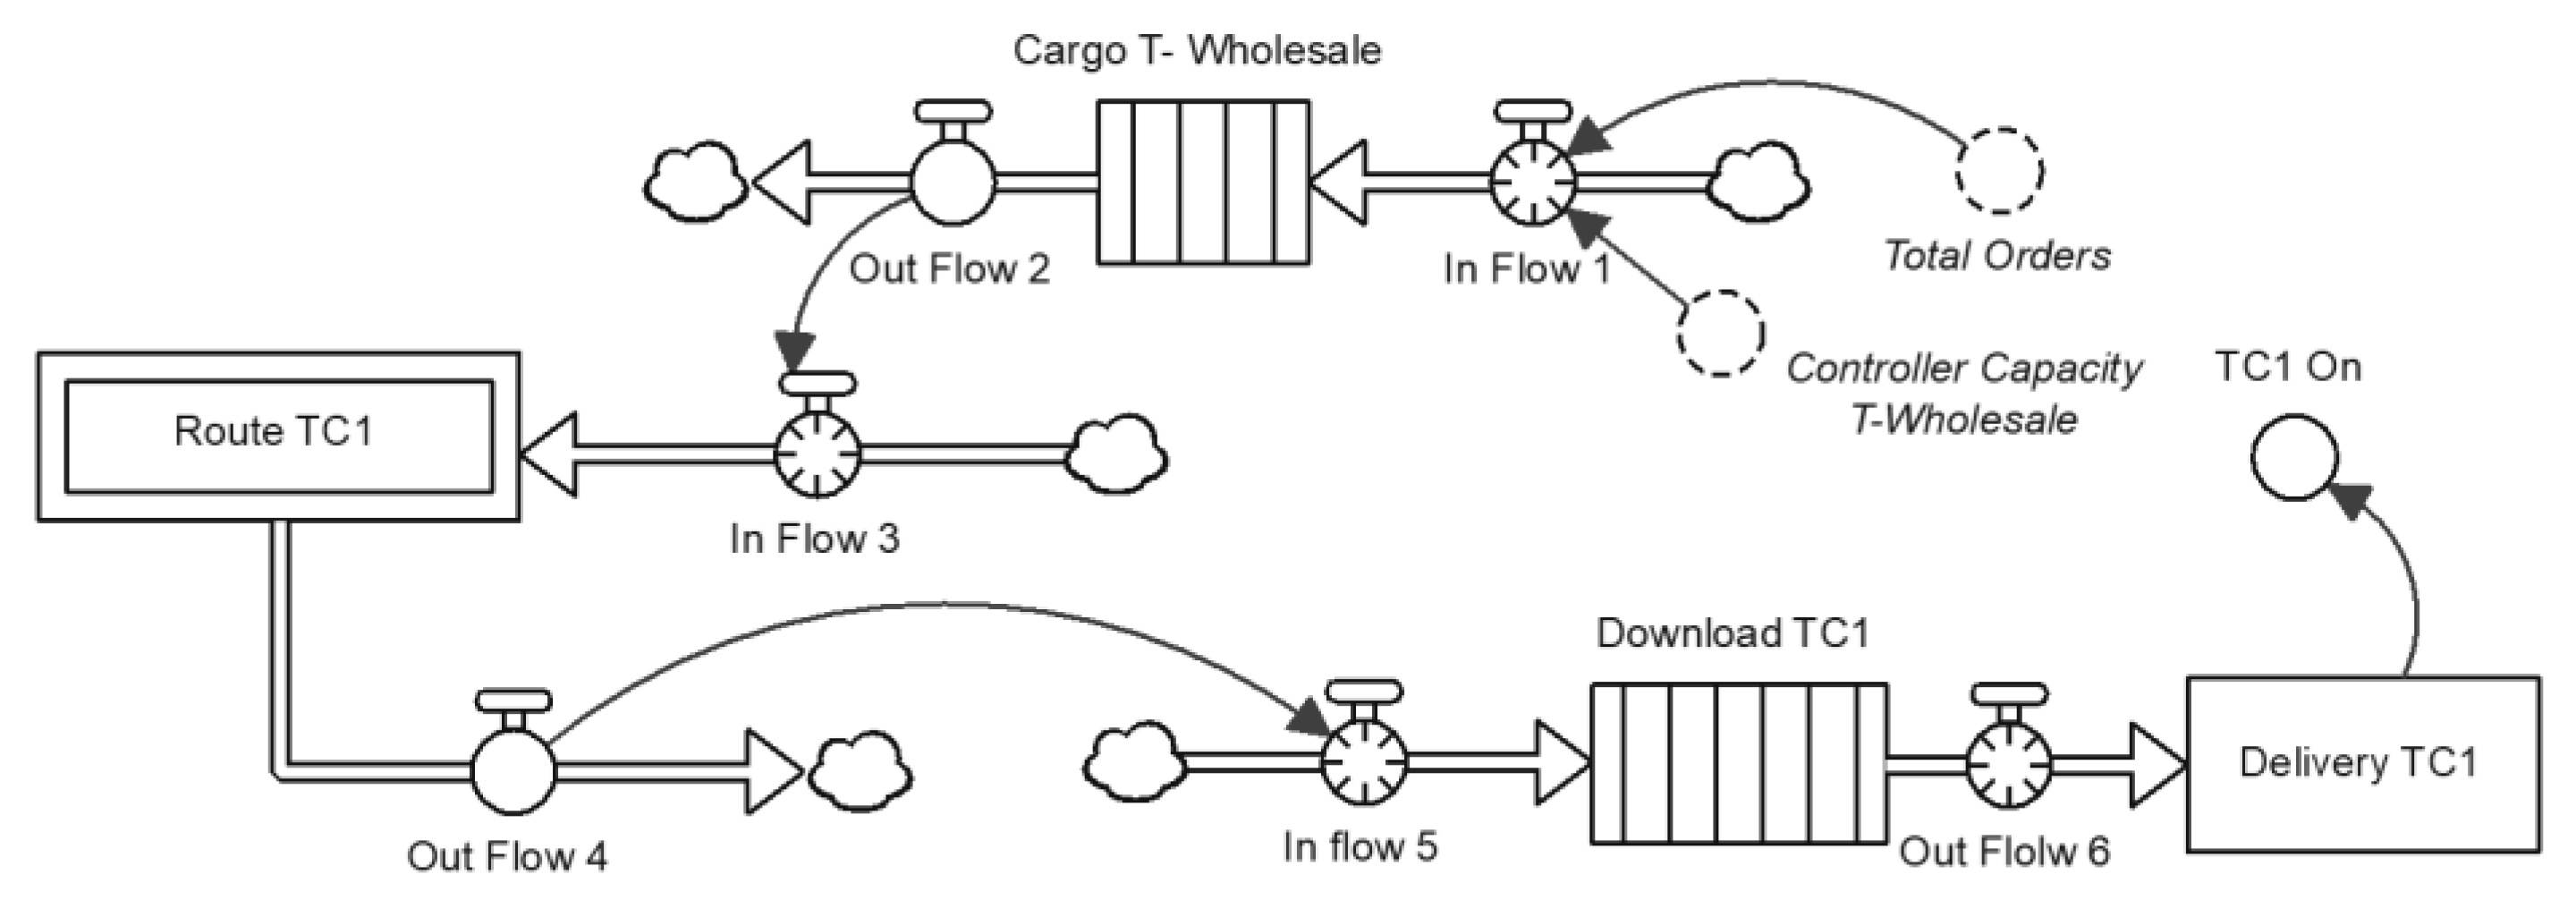
4.5. Current Model Simulation

Based on the variables determined for the model and causal diagram, the dynamics simulation model was formulated by using Stella® Architect software. The model was structured based on the mathematical equations used to calculate the different variable values. The considerations taken into account for the designed model were as follows: wholesale demand (kg) when less or equal to 1300 kg; that is, demand less than or equal to the capacity in kilograms of the Ford Transit vehicle. The demand for wholesale is up to 8000 kg; that is, the C2 truck capacity is considered in kilograms.
Under these considerations, a package needed to be specified as a container with the following measurements: 0.60 m (length), 0.32 m (width) and 0.40 cm (height). The different products are then placed inside and delivered to the customers. Due to the dimensions of the container, the space within the transportation vehicle units is restricted: the possible volume to be transported is 0.0768 m3.
The base model is structured in a logical way, representing the real structure of the system under study (the distribution process), consisting of loading activities, transporting the product to customers, unloading and delivering the product to customers. Figure 3 shows the varying wholesale demand using the Ford Transit vehicle.
In the model for the current scenario, a single load, route and unloading is considered, and the products are delivered to only one customer. The model considers delivery to several customers on the same route: it may carry out distribution to one, two or three customers. Product loading is performed only once when all the goods to be delivered to all the customers are loaded. Moreover, the distance traveled in the routes to reach each location is considered, as well as the unloading maneuvers that are conducted individually. 
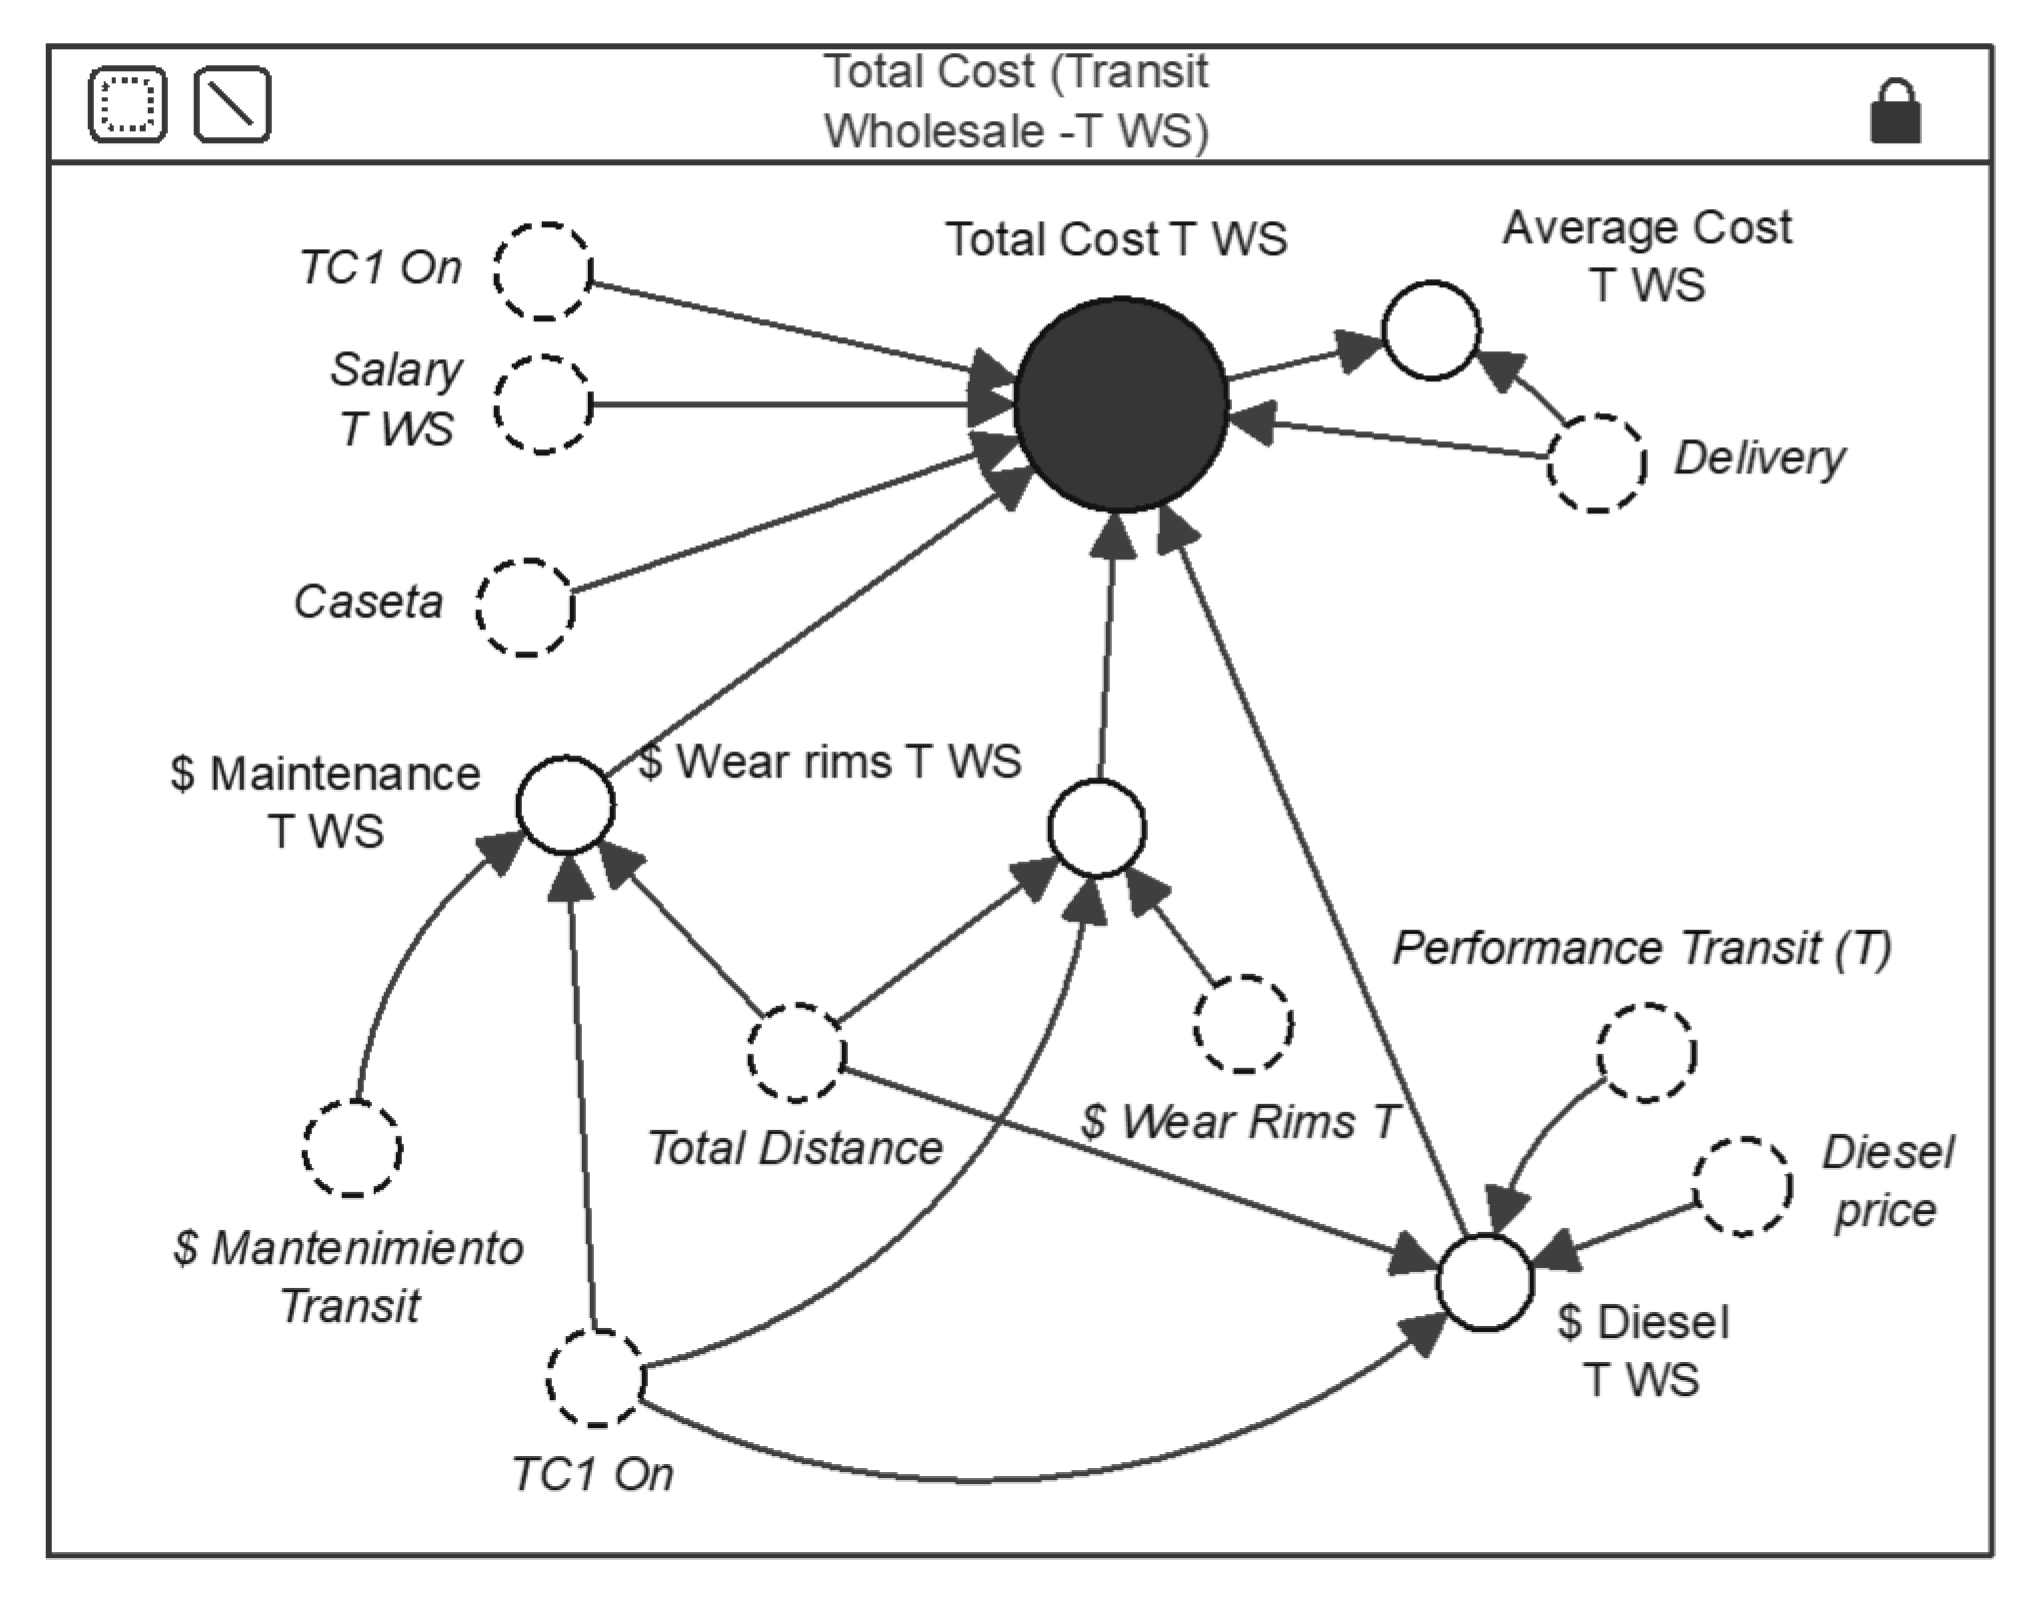
Figure 4 shows the inherent wholesale delivery costs.
The costs considered in goods distribution, including the truck driver’s salary, vehicle maintenance, tire wearing, diesel consumption and tolls in a given case, are all considered. These costs are added to obtain the total distribution cost. The proposed model is based on variables and parameters, for which different equations were required. The determination of the type of variables was also necessary according to the symbols suggested in [11]; that is, level, auxiliary, flow or parameter variables. Below is a summary of the variables based on their category:
Level:
W i T l ( t ) = W i T l   ( 0 ) + 0 t [ W m l f ( t ) W m O f   ( t ) ] d t
where WiTl = wholesale items, total load; WmIf = wholesale meat, input flow; WmOf = wholesale meat, output flow.
R 1 L T ( t ) = R 1 L T ( 0 ) + 0 t [ R 1 W m I f ( t )   R 2 W m O f   ( t ) ] d t
where R1LT = Route 1, load transport; R1WmIf = Route 1, wholesale meat input flow; R2WmOf = Route 2, wholesale meat output flow.
R 1 L T d ( t ) = R 1 L t d ( 0 ) + 0 t [ R 1 W m f d O f ( t ) ] d t
where R1LTd = Route 1, load, transport deliveries; R1WmfdOf = Route 1, wholesale meat, final delivery output flow.
Auxiliary:
Tt(t) = Ltpe (t) × D(t)
where Tt = transit time; Ltpe = loading time per employee; D = demand.
Ct (t) = (C1d/TVs)
where Ct = cooking time (time during which wholesale products remain in the Transit vehicle); C1d = C1 distance; TVs = Transit vehicle speed.
WmC (t) = [(WmC + TwC + DC + S + TbC) × (LDgt) × (Dl)] TTnt
where WmC = wholesale maintenance cost; TwC = tire wearing cost; DC = diesel cost; S = salary; TbC = toll cost; LDgt = loading time; Dl = deliveries; TTnt = Transit truck number of trips.
Flow Variables:
MMIF = (IF (Total Order ≤ 1300) THEN (Total Order) ELSE (0)) × 16
where MMIF = wholesale meat input flow.

4.6. Current Model Validation

In this section, model validation was performed by means of four tests: (1) proper limits, (2) structure verification, (3) dimensional consistency and (4) extreme condition.
According to [36], the first test should consider if the current model meets the purpose for which it was created. In this case study, the main objectives determined were cost reduction and distribution time. The proposed model considered cost indicators (vehicle maintenance, tire wearing, tolls, salary and diesel), as well as time (route and hours worked to complete delivery). The second test verified the model structure. In this test, the current system structure must be compared with the existing model, as shown in Figure 5.
The dimensional consistency test, according to [36], seeks to assess and analyze every mathematical equation and model parameter. Stella® Architect, provides a tool to conduct the vehicle unit tests. A revision of the model vehicle units was performed considering 251 equations and 410 variables, finding 100% consistency. Finally, the extreme condition test was carried out with the aim of determining whether the model operated logically when the parameter values drastically changed. The change made to this test was the lack of demand; by eliminating the demand, the model should not reflect any behavior, since it is the demand that “pulls” the entire system—that is, the values must be zero. As both wholesale and retail demand were modified to 0 (zero), the model behaved as expected; i.e., no movement indication was observed in the flows. Thus, the structural tests conducted validated the developed model.

4.7. Quantitative Scenarios Based on Key Performance Indicator Construction

In this part of the method, different quantitative scenarios were simulated in the model; thus, a sensitivity analysis was performed to determine which variables were more sensitive to different parameters.
Three scenarios were considered; the first one represented a less favorable situation for the organization, the second one represented the normal distribution process conditions and the third one represented a favorable situation for the organization. The following data (Table 4) show the normal scenario as an example of how the parameters were defined.
To define indicators, the data in Table 4 were considered to generate the total result shown in Table 5. To explain this idea, two types of equations must be created: one summative (profit, distribution cost) and the other average (vehicle usage capacity, transportation cost/Kg, and cost–profit ratio).
According to the information in Table 4, the variable total profit ($) shown in Table 5 is the result from each profit according to the transit vehicle and C2 truck generated with the following formula
T P   ( $ ) =   i = 1 ,   2 ,   3 ,   4 T i  
where TP ($) = total profit; Ti = Transit vehicle; i = routes—Ciudad Obregón, Etchojoa, Bácum, and Campo 5. The final parameter for TP ($) was 73,627.4 + 32,741.3 + 21,180.5 + 3994.8 = 131,544.
The average vehicle usage capacity (AUVC) is defined by Equation (9):
A U V C = i = 1 ,   2 ,   3 ,   4 A T i
where AUVC = average vehicle usage capacity; ATi = average of each Transit vehicle; i = routes—Ciudad Obregón, Etchojoa, Bácum, and Campo 5.
The average vehicle usage capacity parameter in Table 5 was obtained according to an AUVC of (39.06 + 56.25 + 34.38 + 39.06)/4 = 41.21.
The seven key performance indicators selected to investigate these scenarios were considered with two requirements: (1) the indicator showed its impact on the results obtained, and (2) the organization had not considered the indicator within their analysis. Thus, the selected indicators were as follows: (1) wholesale demand, which is measured in kilograms ordered by each customer; (2) retail demand, which refers to the number of packages ordered by one or several customers; (3) diesel price, expressed in Mexican pesos per liter; (4) net income per kilogram, which considers the income per kilogram; (5) net income per package, representing the income obtained per package; (6) cost per tire, which refers to tire purchase cost; and (7) maintenance cost, considering servicing charges for the distribution vehicle units. Table 6 shows a summary of the wholesale distribution including the six relevant variables.
The three wholesale product distribution scenarios showed that the optimistic scenario considerably increased the total profit, mainly due to the consideration of a greater number of customers (i.e, six potential customers).
When considering weekly and average demands for each of the customers, the option of purchasing another Transit vehicle was not considered necessary because, taking into account the operating hours per month (224 h; i.e., 8 h a day for four weeks), the vehicle was only used for 58 h.
The number of hours used by the vehicle increased significantly in the optimistic scenario compared with the normal one, with a difference of 78.76 h compared to that of the Transit vehicle and 65.72 h considering the C2 truck. Lastly, cost-related information regarding the three scenarios is described in Table 6.
The purchase of diesel represented the highest cost in the three simulated scenarios, which indicated the need to pay greater attention to the distance traveled by the vehicles and their fuel yield since this will determine on average 56.49% of the total distribution cost. In addition, one of the findings referred to vehicle unit maintenance and tire wearing costs, which contributed 9.21% and 3.66% of the total costs, respectively.

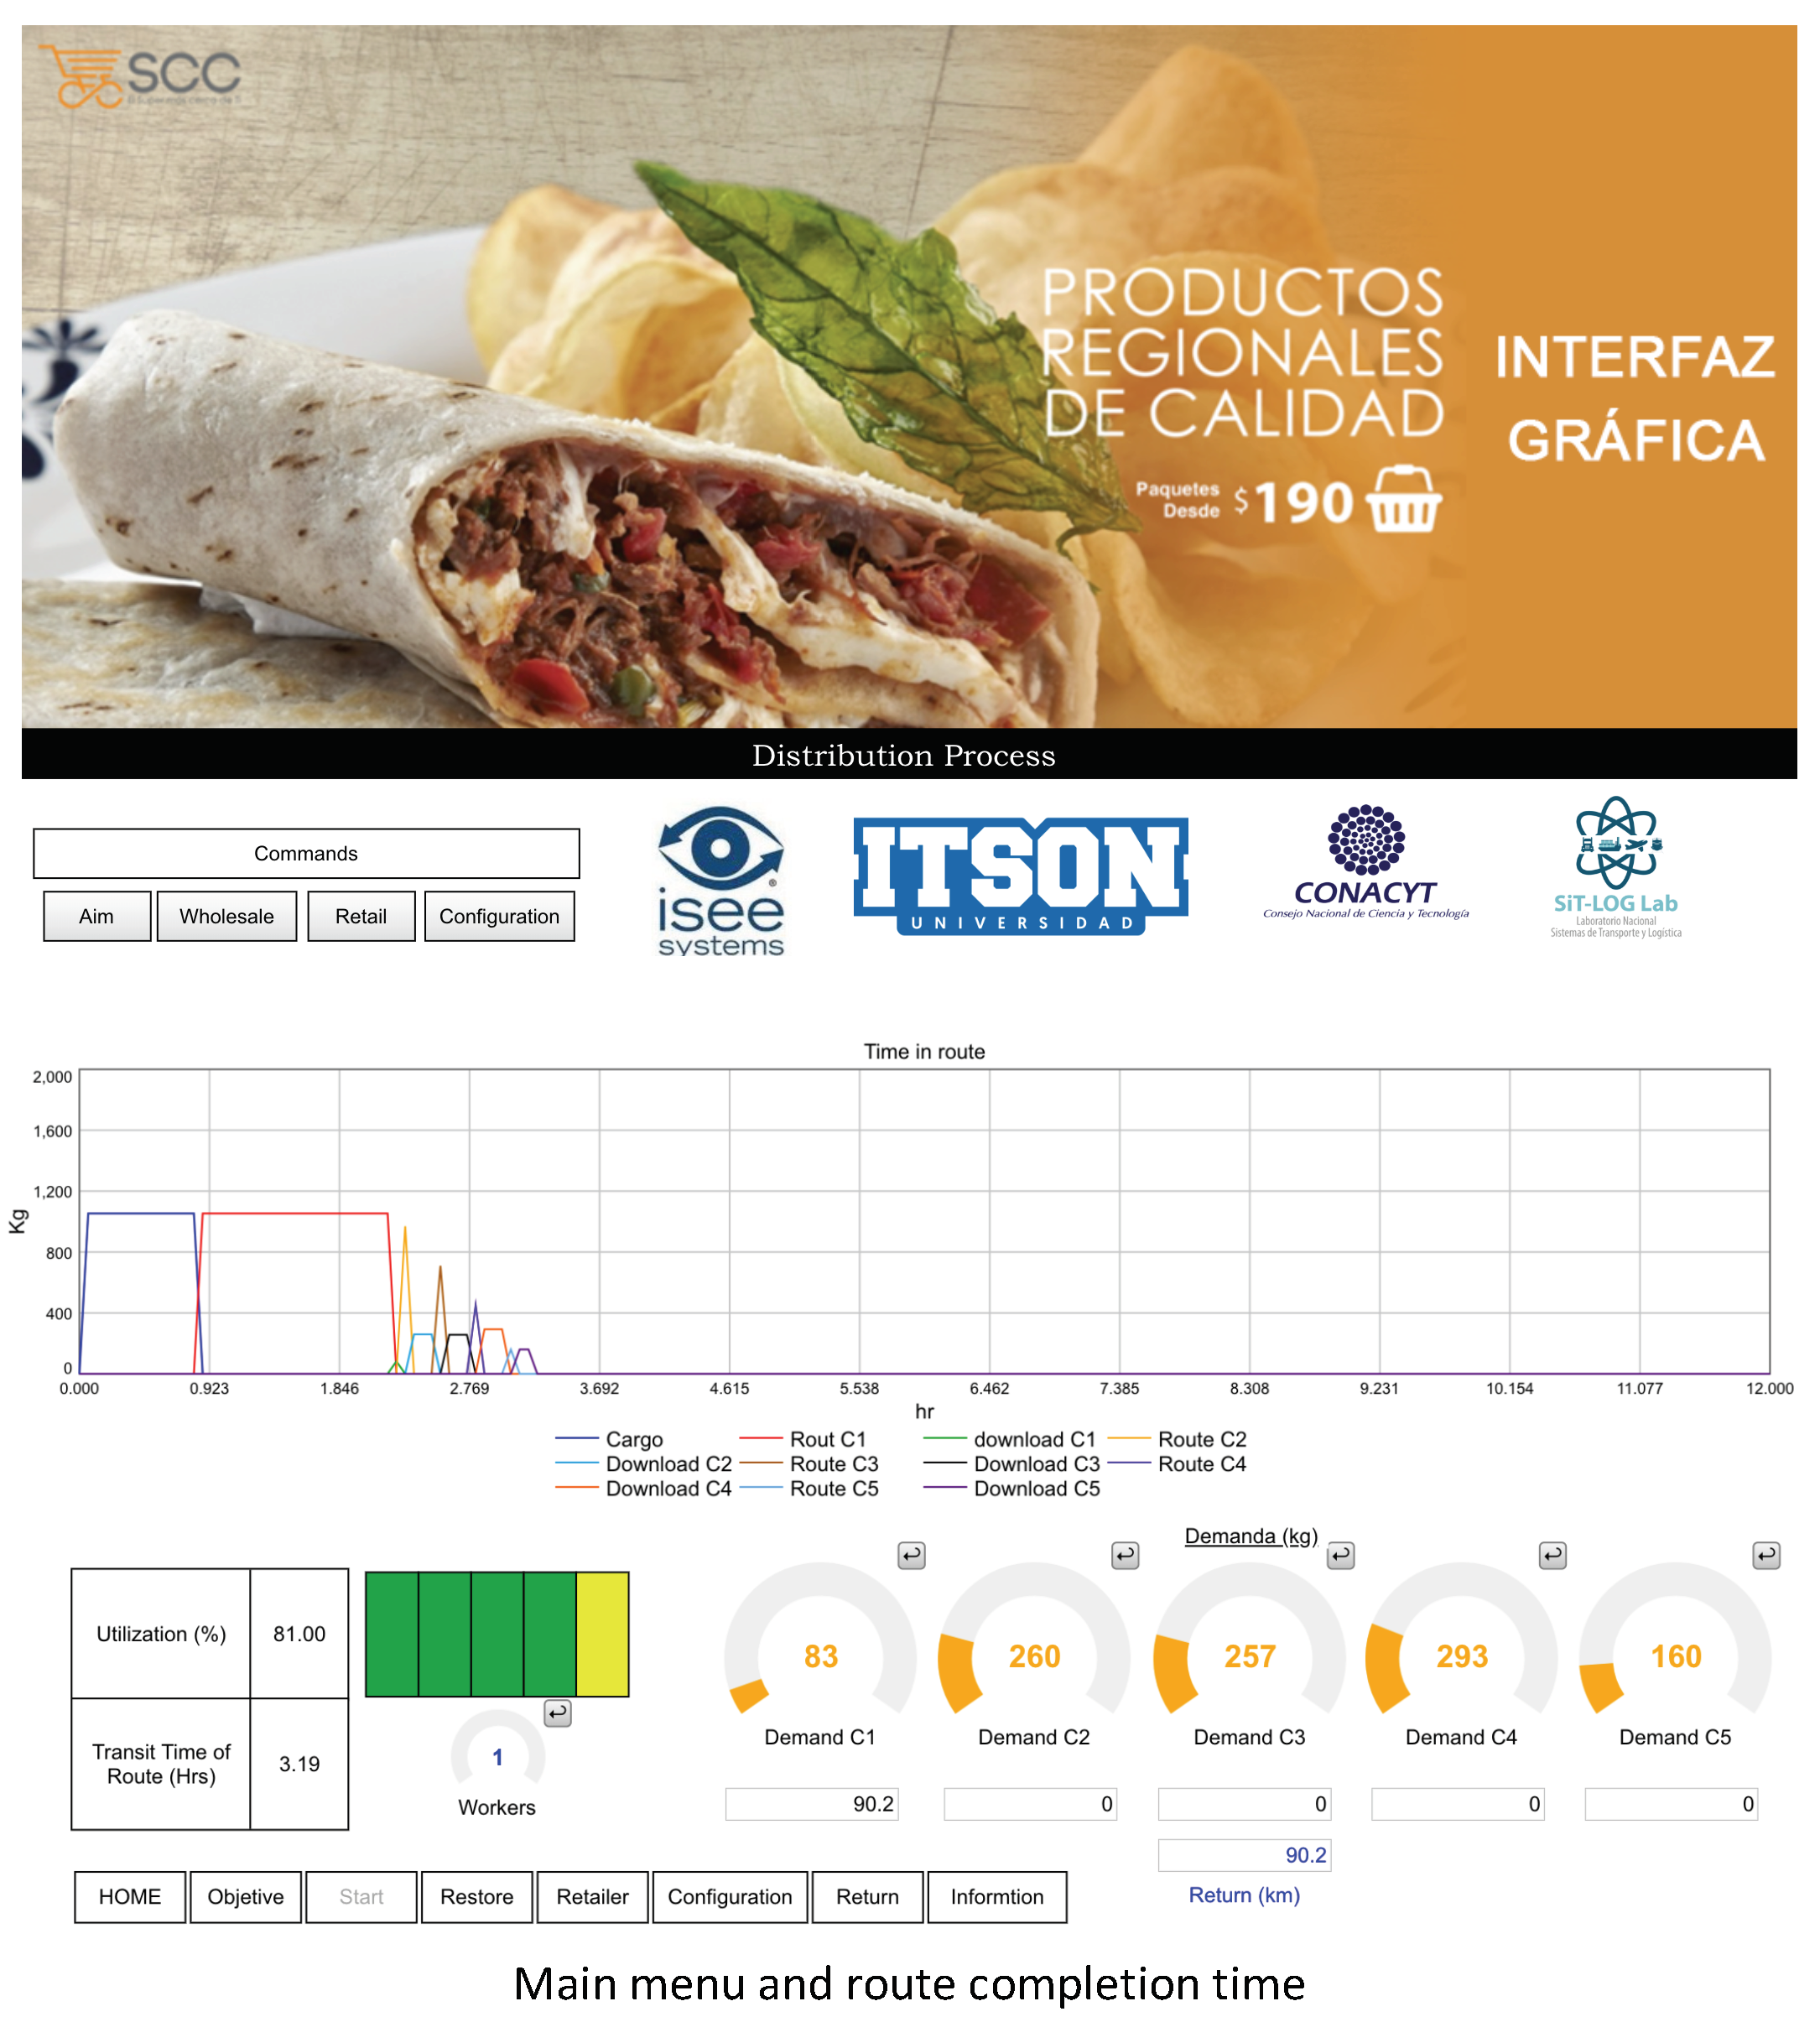
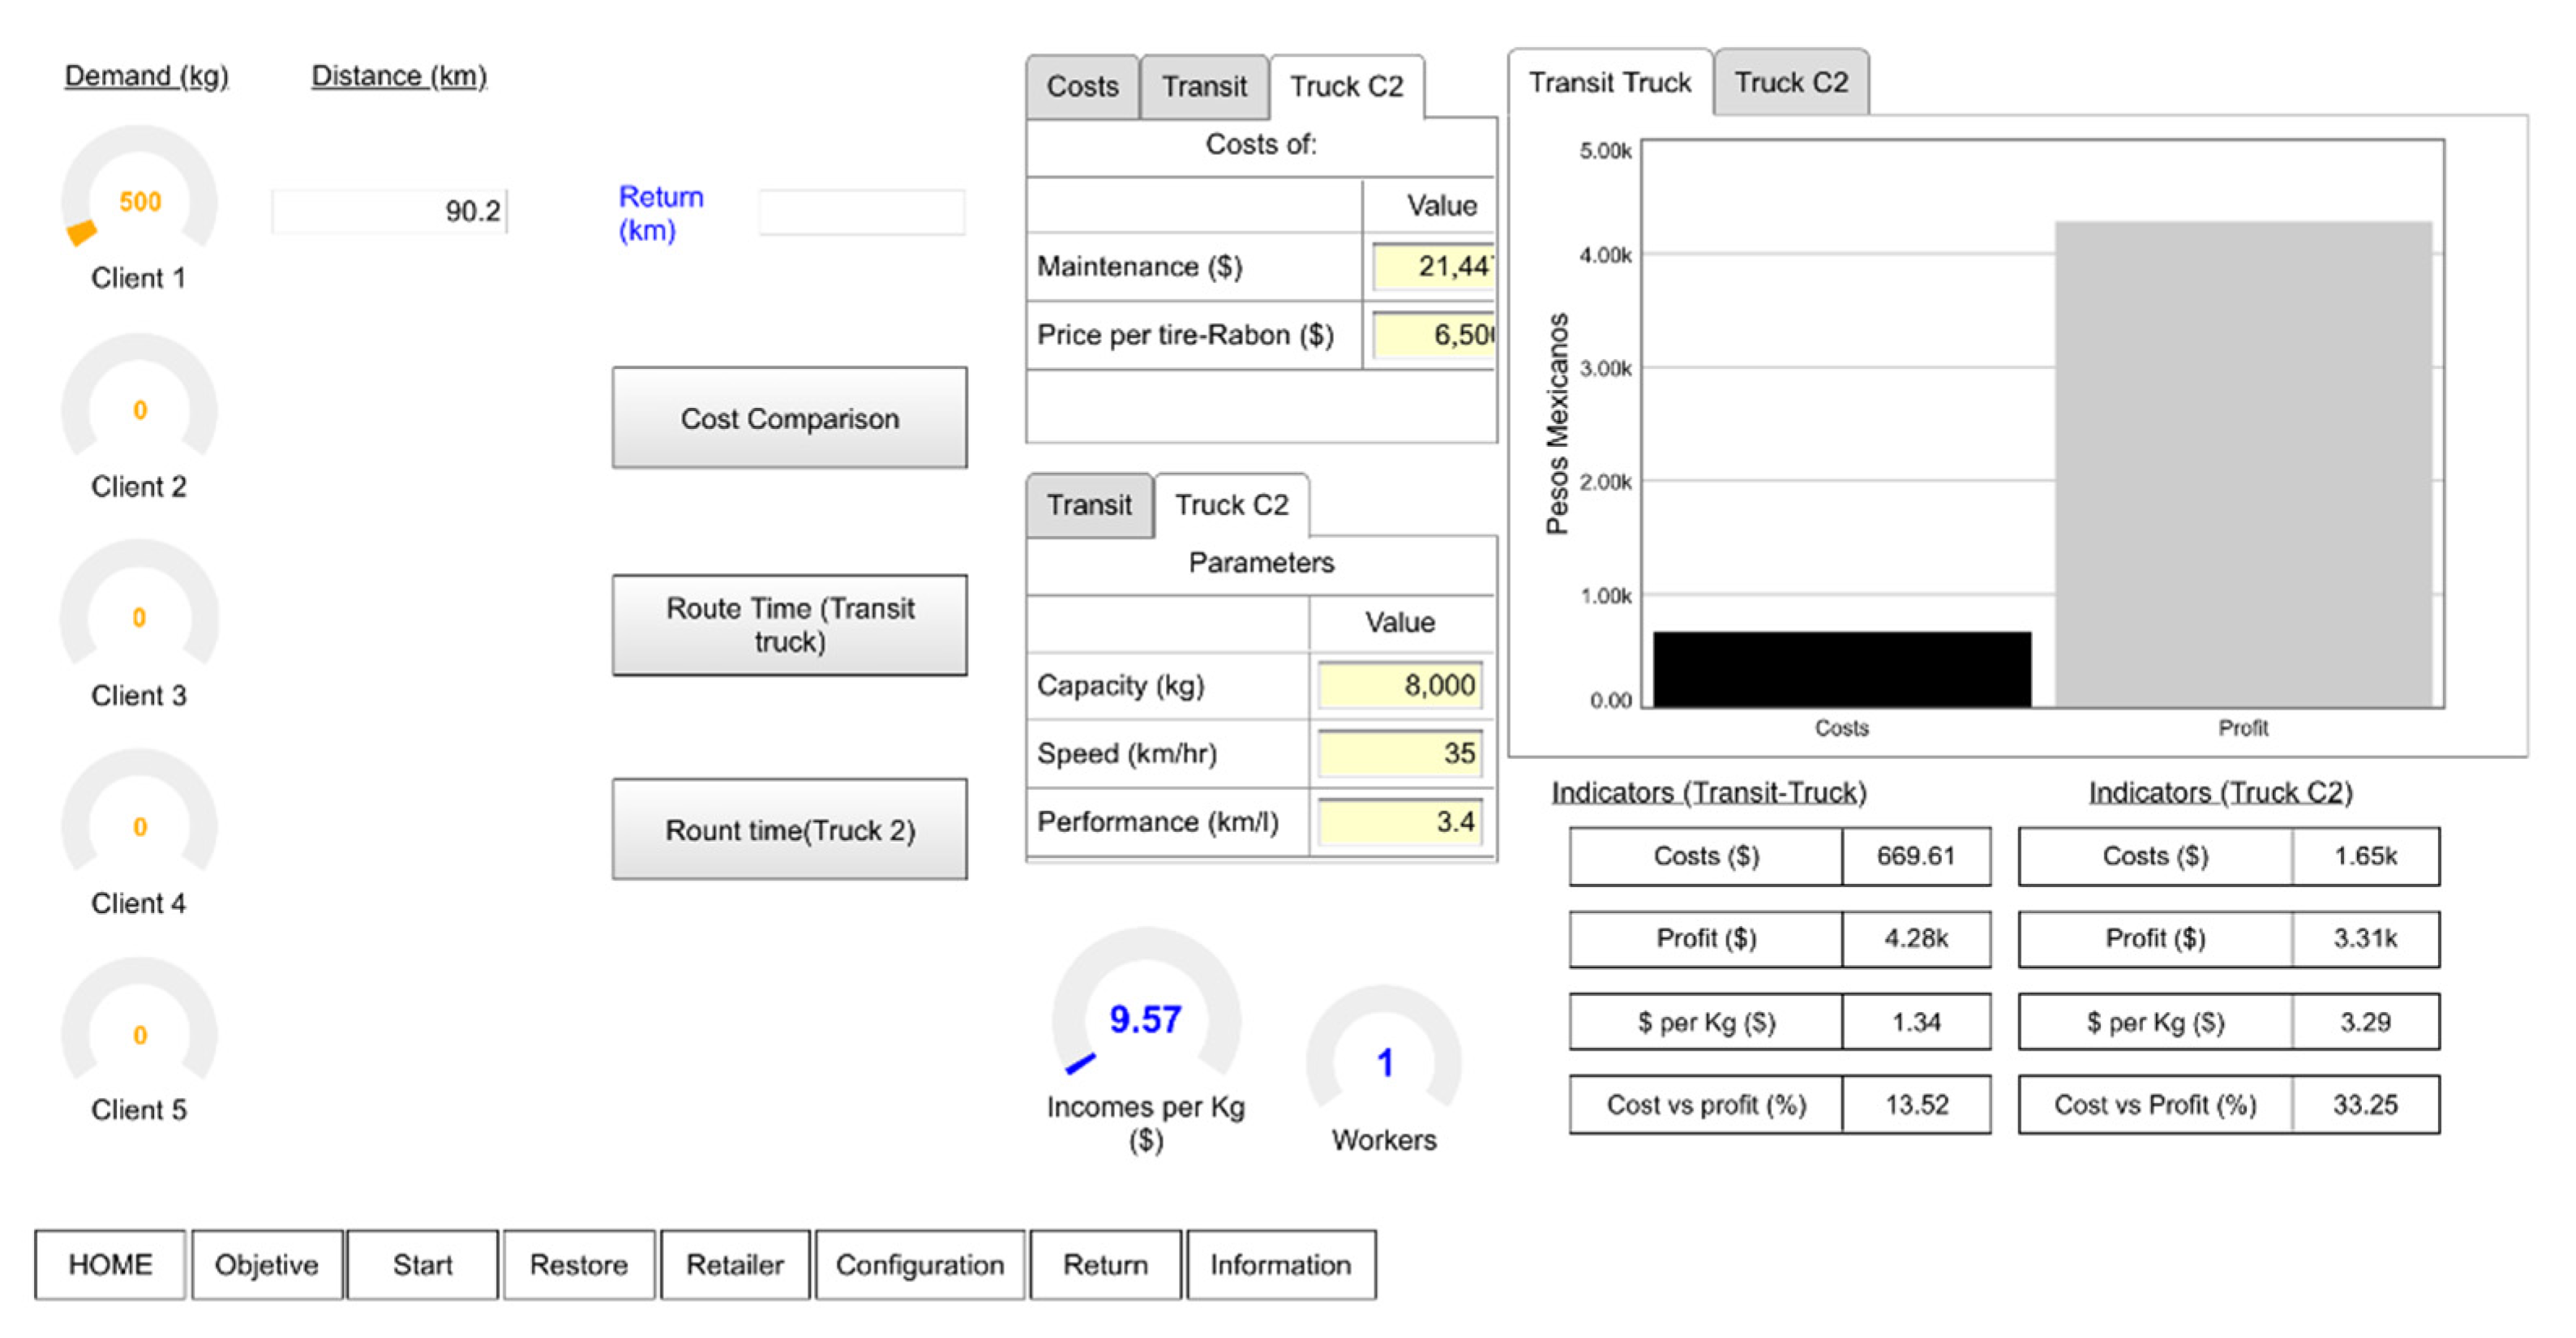
4.8. Graphical User Interface Development

Lastly, and to continue the project’s congruency, a graphic interface was created to support decision-making (Figure 6). The interface was divided into three main parts on screens that provide information (i.e., Home, Settings and Objective). The screens analyzed wholesale demand (for 1 to 5 customers, Transit and C2 Truck, “n” customers, route completion time and cost comparison), and the screens focused on analyzing retail demand (for 1 to 5 customers, Transit vehicle and C2 Truck, “n” customers, route completion time and cost comparison).
The objective of the first screen is to give the interface a professional look and link the organization under study with its sponsors. Navigation buttons are placed on the interface screens and buttons that provided information with regards to the screen are shown, where one serves as a “tutorial” and indicates the functioning of the rest of the buttons. After the home screen, the functional interface appears, as shown in Figure 7.
This screen is related to the wholesale demand key performance indicators, with a focus on analyzing the demand of 1–5 customers individually; an information button indicates the correct way to use the screen. Within this modality, customer demand and distances must be entered individually. There are also two setting tables in which the main model parameters operate and carry out significant analysis. It is also necessary to show the indicators related to delivery times and vehicle capacity usage; Figure 8 shows the screen designed for this purpose.
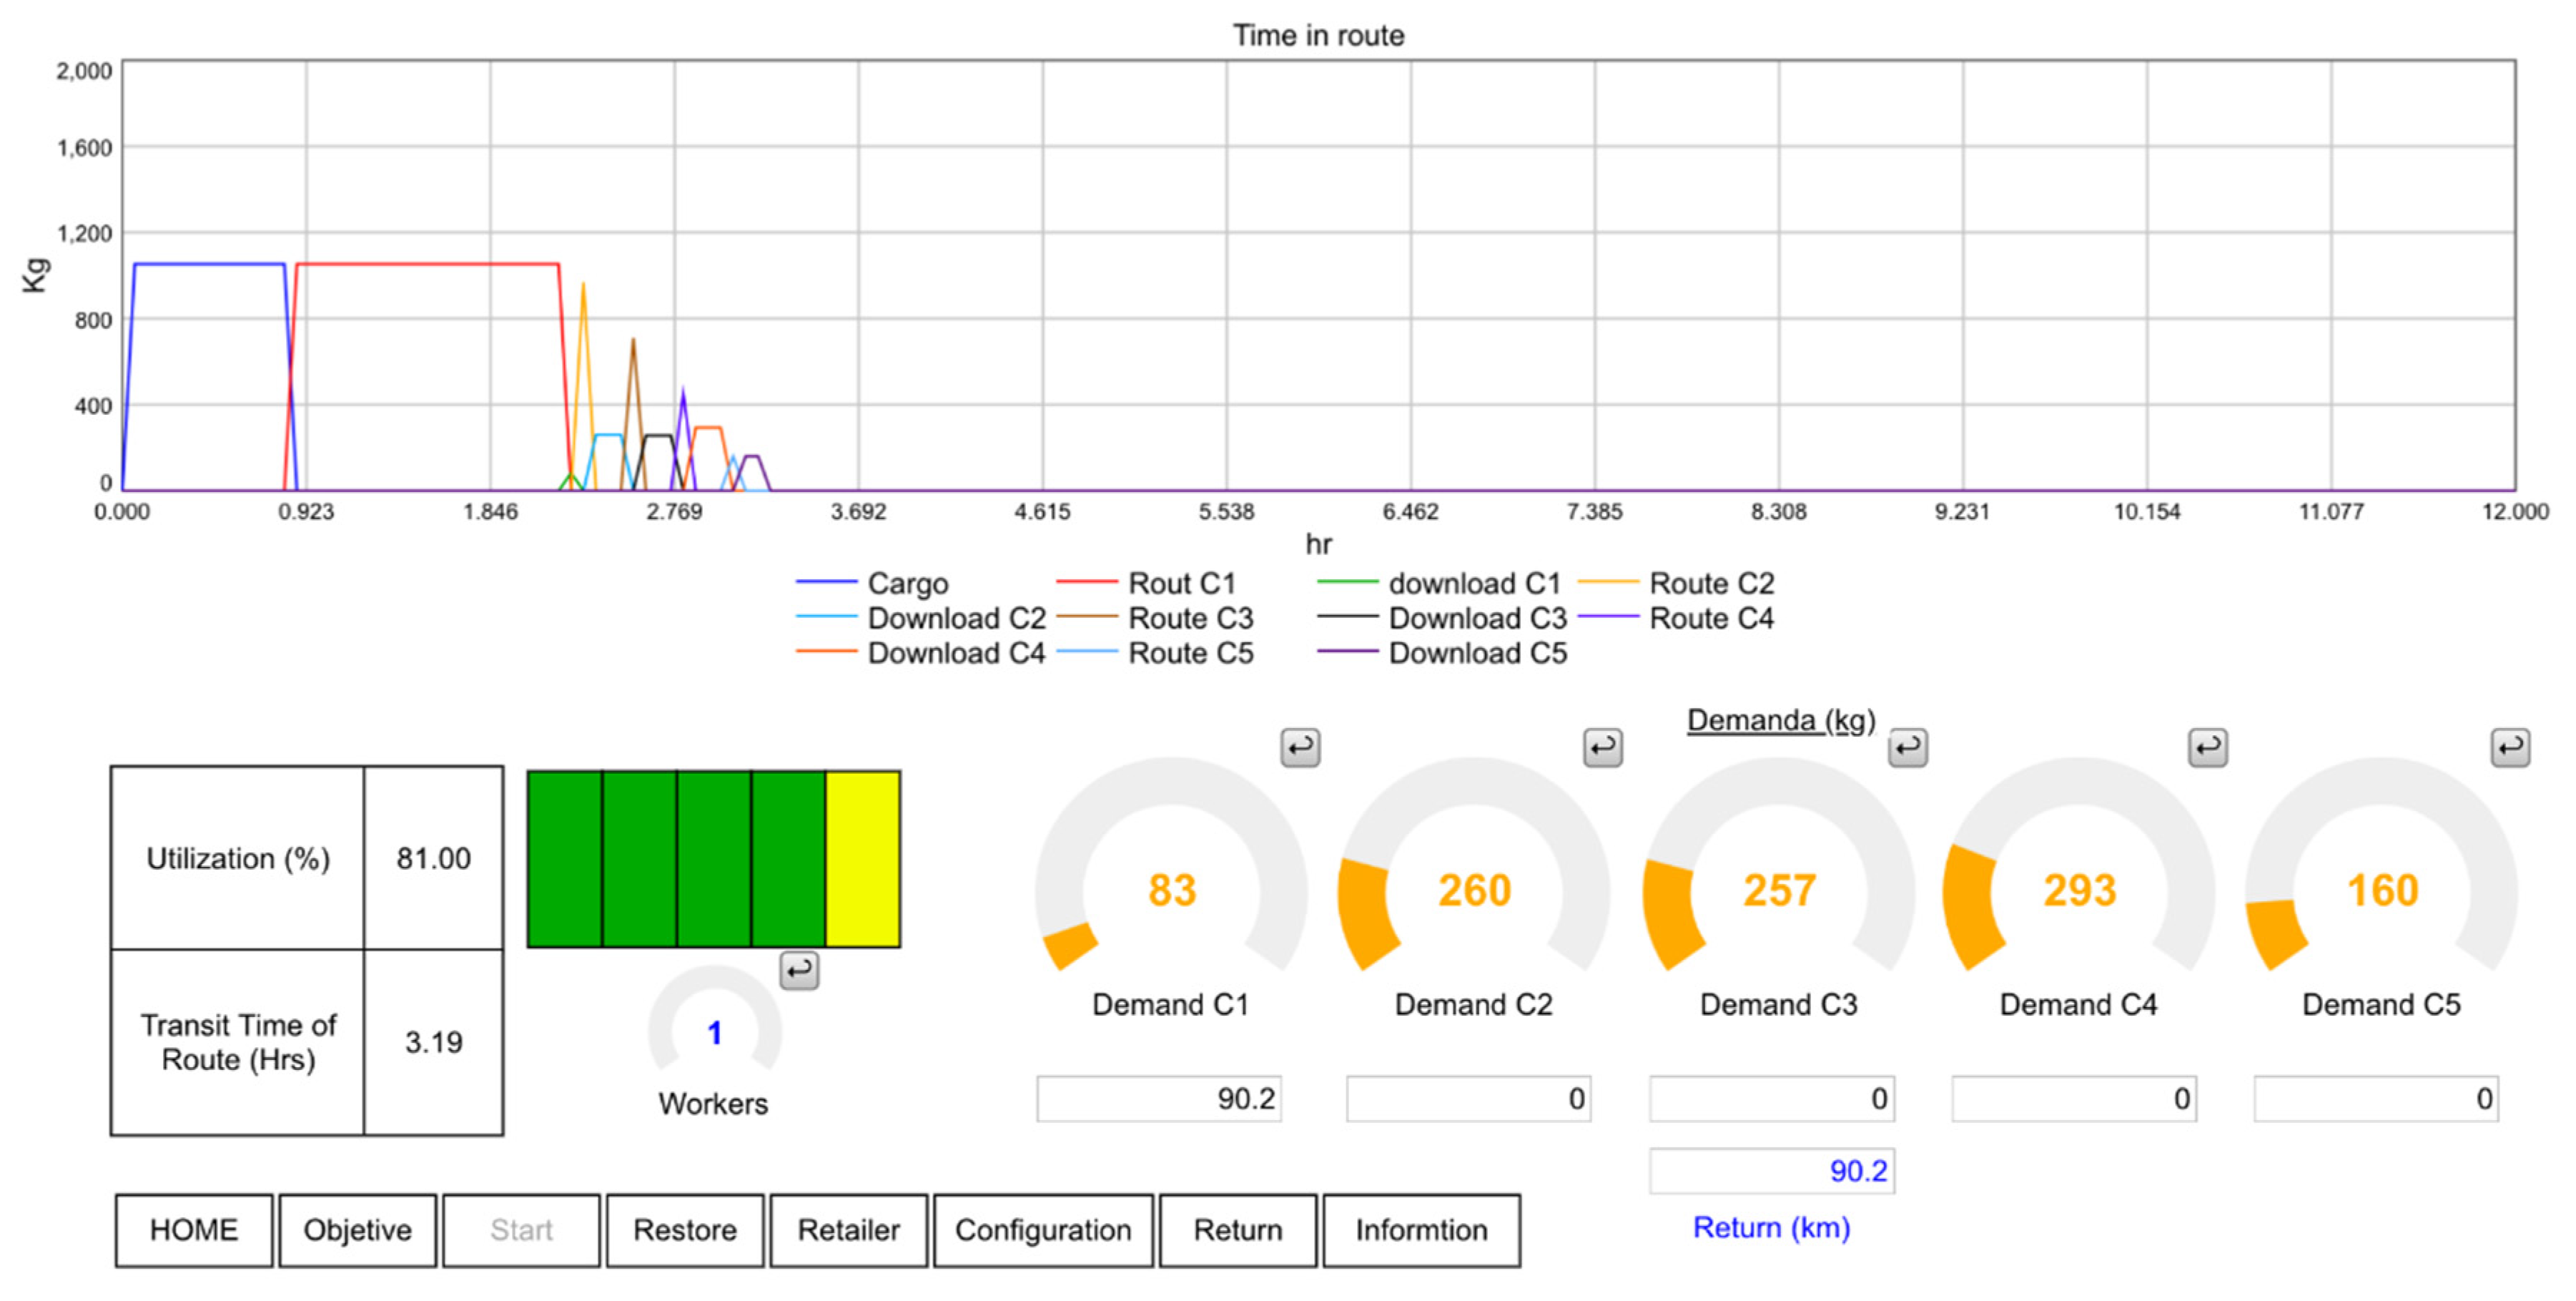
The time analysis screen related to the delivery route may be observed; as with the other screens, by modifying the customer demands or distances, the graph shown in the upper part is directly affected. Within this screen, the route completion time indicators are found, estimating vehicle usage percentage in hours, shown as numerical data and in an animation that changes color depending on the vehicle unit usage level, varying from red (empty) and yellow (loaded) to green (full).
On this screen, the route completion time indicators are found, which estimate the vehicle usage percentage in hours, shown as numerical data and in an animation that changes color depending on the vehicle unit usage level, varying from red (empty) and yellow (loaded), to green (full).

5. Discussion

System dynamics allows the simulation of real-world situations through complex models [9,10,11,12,16]. In this case study, the model represented the company’s capacity needed to carry out the five distribution routes based on the proposal of three pessimistic, normal and optimistic scenarios. The scenarios could be evaluated by changing their parameters to predict situations which incurred risk or in which the company operation may be the most favorable [28]. The pessimistic and optimistic scenarios were constructed based on the model that reflected the normal situation of the company in the study.
One of the factors that had the most impact on distribution costs was that of the distance at which each customer is located: the greater the distances, the higher the costs. This was influenced by fuel consumption, as it represented on average 56.46% of the total distribution cost. Based on this, the organization must seek a fuel provider that offers the best diesel price, which will positively impact the total costs.
In addition, maintenance and tire wearing costs were found to have a minor impact on the total costs, representing 9.21% and 3.66% of the total, respectively. On the other hand, by considering more customers and the creation of more distribution routes in the optimistic scenario, an increase in route profitability could be observed despite the rise in costs, which leads to the conclusion that greater vehicle usage capacity will translate into greater profits.
The validation process of the models using techniques such as the mean error test [37], unit consistency and extreme tests allowed us to state that the model was close to reality; however, the implementation of models based on abstractions of reality should take into consideration that events that were not considered could exist and affect the operation of the organization; for example, the Covid-19 pandemic is causing supply chains to contract, and their method of operation now has to be based on stricter health standards.
According to [16], the development of a graphical user interface using Stella® Architect (Isee Systems) is an available option to organizations. However, two important facts should be considered: (1) a person with knowledge of the use of the software and the basic concepts of system dynamics methodology is required for future modifications of the model, based on new constraints, variables or parameters; and (2) the price of the software and of investing in licenses, which have a significant cost in the market, should be considered. However, the cost–benefit ratio of doing so is beneficial due to the information that the model for data-driven decision making will provide.

6. Conclusions

The objective of this case study was to build a graphic interface for decision-making in the distribution process of an organization that markets regional products in southern Sonora. The interface created will allow the organization to conduct both current and future simulations of its distribution routes for decision-making, mainly based on demand volume. To achieve this objective and respond to the need for solutions, the creation of a model that allowed the simulation of different distribution routes was necessary by means of the system dynamics methodology. This method enabled the analysis of the system’s complexity and the observation of relationships within variables, as well as their key performance indicators.

Author Contributions

Conceptualization, E.A.L.-L. and A.B.-S.; methodology, E.A.L.-L. software, and formal analysis, H.P.V.-V., D.O.M., E.A.L.-L.; supervision, E.A.L.-L.; writing—original draft preparation, E.A.L.-L.; A.B.-S.; writing—review and editing, E.A.L.-L., A.B.-S. All authors have read and agreed to the published version of the manuscript.

Funding

This research was funded by the Federal Program of Mexico (PFCE-2020) and National Science and Technology Council of Mexico (CONACYT), through the National Laboratory for Transportation System and Logistics, and by supplemental funds provided by ITSON through PROFAPI-2020-0434.

Acknowledgments

The authors E.A.L.-L., A.B.-S., H.P.V.-V., D.O.M., as part of the National Laboratory in Transportation and Logistics—Consolidation Systems, are grateful for the support received from the National Science and Technology Council of Mexico (CONACYT) through the “National Laboratories” program. This Publication was funded with PROFAPI-2020-ITSON; thanks go to D. Fischer for editorial services in English.

Conflicts of Interest

There is no conflict of interest. The funding sponsors had no role in the study design; collection, analyses, or interpretation of data; writing of the manuscript; and decision to publish the results.

References

  1. Chopra, S.; Meindl, P. Administración de la Cadena de Suministro: Estrategia, Planeación y Operación; Pearson Prentice Hall: Upper Saddle River, NJ, USA, 2013. [Google Scholar]
  2. Islam, D.; Meier, J.; Adijandra, P.; Zunder, T.; Pace, G. Logistics and supply chain management. Res. Transp. Econ. 2013, 41, 3–16. [Google Scholar] [CrossRef]
  3. Van Gigch, J. Teoría General de Sistemas, 3rd ed.; Trillas: Mexico City, Mexico, 2012. [Google Scholar]
  4. Ackoff, R. El Paradigma de Ackoff: Una Administración Sistémica; Limusa: Mexico City, Mexico, 2002. [Google Scholar]
  5. Lagarda, E.; Portugal, J.; Naranjo, A.; Burboa, L.; Noriega, A. Using Scenarios: A Case Study of a Corporate of Chemical Distribution in Mexico. In XIV Encuentro Colombiano de Dinámica de Sistemas; Universidad Pontifica Bolivariana: Medellín, Colombia, 2016; pp. 96–104. [Google Scholar]
  6. von Bertalanffy, L. Teoria General de Los Sistemas; Fondo de Cultura Economica de España: Madrid, Spain, 1976. [Google Scholar]
  7. Churchman, C.W. El Enfoque de Sistemas; Diana: Mexico City, Mexico, 1973. [Google Scholar]
  8. Johansen, O. Introduccion a la Teoria General de Sistemas; Limusa, S.A. de C.V.: Mexico City, Mexico, 1993. [Google Scholar]
  9. Senge, P.; Roberts, C.; Ross, R. La Quinta Disciplina en la Práctica: Estrategias y Herramientas para Construir la Organización Abierta al Aprendizaje; Ediciones Granica, S.A. de C.V.: Buenos Aires, Argentina, 2006. [Google Scholar]
  10. Forrester, J. System Dynamics, Systems Thinking, and Soft OR. Syst. Dyn. Rev. 1997, 10, 245–256. [Google Scholar] [CrossRef]
  11. Forrester, J. Dinámica Industrial (Segunda ed.); Editorial “El Ateneo”: Buenos Aires, Argentina, 1981. [Google Scholar]
  12. Sterman, J. Business Dynamics: Systems Thinking and Modeling for a Complex World; McGraw Hill: New York, NY, USA, 2000. [Google Scholar]
  13. Bujanda Clark, A. Evaluación del Desempeño de la Cadena de Suministro en Una Microempresa de Envases de Plástico; ITSON: Obregón, Sonora, Mexico, 2016. [Google Scholar]
  14. Forrester, J.W. System Dynamics as a Foundation for Pre- College Education (D-4133); Massachusetts Institute of Technology: Cambridge, MA, USA, 1990; p. 14. [Google Scholar]
  15. Chermack, T.J. Scenario Planning as a Development and Change. Available online: http://www.thomaschermack.com/Thomas_Chermack_-_Scenario_Planning/Research_files/Chermack(2006)SPasDeveandChange.pdf (accessed on 24 March 2020).
  16. Richardson, G.; Pugh, A., III. Introduction to System Dynamics Modeling with Dynamo. J. Oper. Res. Soc. 1997, 48, 1146. [Google Scholar] [CrossRef]
  17. Martínez, S.; Requema, A. Simulación Dinámica por Ordenador; Alianza: Madrid, Spain, 1988. [Google Scholar]
  18. Luna, L. El Diseño de interfaz gráfica de usuario para publicaciones digitales. Rev. Digit. Univ. UNAM 2004, 5, 2–8. [Google Scholar]
  19. Rodríguez, R. Visualización del Proceso de Enseñanza-Aprendizaje, Apoyado en una Interfaz Gráfica; Universidad Autónoma Metropolitana: Mexico City, Mexico, 2014. [Google Scholar]
  20. Sameer, K.; Anvar, A. System dynamics analysis of food supply chains—Case study with non-perishable products. Simul. Model. Pract. Theory 2011, 19, 2151–2168. [Google Scholar] [CrossRef]
  21. Herrera de Leon, H.J.; Kopainsky, B. Do you bend or break? System dynamics in resilience planning for food security. Syst. Dyn. Rev. 2019, 35, 287–309. [Google Scholar] [CrossRef]
  22. Iakovou, E.; Bochtis, D.; Vlachos, D.; Aidonis, D. Risk Management for Agrifood Supply Chain. In Supply Chain Management for Sustainable Food Networks; John Wiley & Sons, Ltd.: Hoboken, NJ, USA, 2016. [Google Scholar]
  23. Hodicky, J.; Özkan, G.; Özdemir, H.; Stodola, P.; Drozd, J.; Buck, W. Dynamic Modeling for Resilience Measurement: NATO Resilience Decision Support Model. Appl. Sci. 2020, 10, 2639. [Google Scholar] [CrossRef] [Green Version]
  24. Lagarda-Leyva, E.A.; Ruiz, A. A Systems Thinking Model to Support Long-Term Bearability of the Healthcare System: The Case of the Province of Quebec. Sustainability 2019, 11, 7028. [Google Scholar] [CrossRef] [Green Version]
  25. Laimon, M.; Mai, T.; Goh, S.; Yusaf, T. Energy Sector Development: System Dynamics Analysis. Appl. Sci. 2020, 10, 134. [Google Scholar] [CrossRef] [Green Version]
  26. Lagarda-Leyva, E. Collection and Distribution of Wheat, Dynamic of the process of Shipping to International Markets: Case Study. Int. J. Supply Chain Manag. 2019, 8, 43–57. [Google Scholar]
  27. Hasan, N.; Suryani, E.; Hendrawan, R. Analysis of Soybean Production and Demand to Develop Strategic Policy of Food Self Sufficiency: A System Dynamics Framework. Procedia Comput. Sci. 2015, 72, 605–612. [Google Scholar] [CrossRef] [Green Version]
  28. Schwartz, P. The Art of The Long View: Planning for the Future in an Uncertain World; Currency doubleday: New York, NY, USA, 1996. [Google Scholar]
  29. Aracil, J.; Gordillo, F. Dinámica de Sistemas; Alianza: Madrid, Spain, 1997. [Google Scholar]
  30. Lagarda-Leyva, E. Introducción a la Dinámica de Sistemas; Aplicaciones y ejemplos en la cadena de suministro del sector agroalimentario; Pearson: Mexico City, Mexico, 2019; ISBN 978-607-32-5154-9. [Google Scholar]
  31. Morales, C.; de la Torre, M. Características del Transporte Refrigerado en México; Technical Publication: Pune, India, 2006. [Google Scholar]
  32. Moreno, E. Análisis de Comparativo de la Modelación del Autotransporte: Carga vs Pasajeros; Technical Publication: Pune, India, 2006. [Google Scholar]
  33. Romero, O.; Becerra, M.; González, E.; Javier, F. Planning of capacities of a logistic operator in distribution center. In XIII Congreso Latinoamericano y Encuentro Colombiano de Dinámica de Sistemas, Universidad de Cartagena; Universidad Jorge Tadeo Lozano: Bogotá, Colombia, 2015; pp. 447–454. [Google Scholar]
  34. Leyva, E.L.; Solano, A.B.; Campos, M.G.; Cantú, J.M. Case study: Supply Chain Scenarios in a Plastic Container Company. Nova Sci. 2018, 10, 510–538. [Google Scholar] [CrossRef] [Green Version]
  35. Jiménez, J.E. Impacto del Precio de Diésel y otros Insumos en Los Costos de Operación del Autrotransporte de Carga; Technical Publication: Pune, India, 2018. [Google Scholar]
  36. Rodríguez, L.; López, M. Aplicación de Técnicas de Validación de un Modelo de Simulación de Dinámica de Sistemas Caso de Estudio. Rev. Latinoam. de Ing. de Softw. 2016, 4, 187–196. [Google Scholar] [CrossRef] [Green Version]
  37. Barlas, Y. Multiple tests for validation of system dynamics type of simulation models. Eur. J. Oper. Res. 1989, 42, 59–87. [Google Scholar] [CrossRef]
Figure 1. Regional product supply chain for the case study in southern Sonora, Mexico.
Applsci 10 04481 g001
Figure 2. Causal loop distribution process diagram under study.
Applsci 10 04481 g002
Figure 3. Base model in Stella® Architect. TC = Transit client; T = Transit cargo vehicle.
Applsci 10 04481 g003
Figure 4. Wholesale distribution costs structure in the Transit vehicle. TC = Transit client; TWS = Transit wholesale; T = Transit cargo vehicle.
Applsci 10 04481 g004
Figure 5. Comparing the process activities under study with the simulation model. (1) Delivery order receipt; (2) delivery road truck; (3) transport customer product; (4) customer product delivery.
Applsci 10 04481 g005
Figure 6. Graphic interface, main screen. SCC: Closed Commercial System. Productos Regionales de Calidad (Quality Regional Products), Interfaz Gráfica (Graphic Interface).
Applsci 10 04481 g006
Figure 7. Graphic interface—wholesale demand for “1 to 5” customers.
Applsci 10 04481 g007
Figure 8. Graphic interface, route completion time (1–5 customers).
Applsci 10 04481 g008
Table 1. Information summary for each route.
RouteCustomerDistance (km)Time (mins)Minimum Requirement (kg)Maximum Requirement (kg)
1Industrial Park1.1310.161830.92
2Bacúm28.339107.55777.97
3Camp 517.32639.10137.86
4Etchojoa90.272297.501196.76
Table 2. Variables suggested by the organization under study in southern Sonora, Mexico.
VariablesDescription
Diesel consumption Consumption of liters per kilometer traveled by the truck used.
Customer demand Number of products required in the customers’ purchasing orders.
DistanceKilometers traveled in the delivery routes.
Delivery times Time needed by the company to deliver the products.
Generated costsExpenditure incurred due to product distribution; the organization did not specify which products.
ProfitFinancial benefit obtained by the products delivered to the client.
Table 3. Variable and parameter description considered in the simulation dynamics model.
VariableDescription
Vehicle capacity Products—measured in kilograms—which the product delivery vehicle unit is capable of transporting. It also measures the capacity of the number of packages that the vehicle is able to transport.
Capacity usage Percentage that represents the vehicle capacity usage measured in kilograms or in food packages.
Truck loading time Time—measured in hours—which represents the time it takes the distributor to prepare the order to be delivered.
Truck unloading time Time—measured in hours—which represents the time it takes the distributor to deliver the products to the customer.
Distance traveled per route Kilometers traveled by the delivery vehicle unit in each distribution route.
Average speed per hour Average speed—measured in kilometers per hour—at which the delivery truck travels.
YieldNumber of kilometers that a liter of diesel can be covered in the truck.
Diesel price Cost related to purchasing a liter of diesel.
Distributor operation time Time in which the distributor was busy in product delivery tasks.
Maintenance costVehicle maintenance cost per kilometer traveled.
Maintenance to vehicle units Number of kilometers at which the distribution vehicle unit will require maintenance.
Tire wearing costsCost related to vehicle tire wear and tear per kilometer traveled.
Tire performance Number of kilometers that the tires may travel before they need to be replaced.
Toll costs Cost incurred when a distribution toll road is chosen.
Distributor salaryPayment granted to the distributor for the time required to deliver a customer’s order.
Total cost per trip Cost related to the total expenditure per trip.
Total profit per trip Financial benefit referred in money per delivery.
Customer demandThe number of products required per customer in each trip, which can be the demand of wholesale or retail products.
Table 4. Normal scenario sensitivity analysis for wholesale demand per month.
Routes (Clients)
IndicatorCiudad ObregónEtchojoaBácumCampo 5
TransitC2TransitC2TransitC2TransitC2
Total profit $73,627.473,455.532,741.328,967.821,180.520,059.83994.83337.6
Total distribution cost $439.5610.512580.36352.7928.52048.3561.91218
Vehicle average usage capacity39.065.9856.258.6134.385.2639.065.98
Transportation average cost/kg ($/kg)47.157.6667.2910.93426.838.41.37
Cost–profit ratio0.590.827.3117.994.209.2712.3326.74
The indicators generate the final parameter for each scenario related to each route; the final parameters are shown in Table 5.
Table 5. Wholesale demand summary of simulated scenarios.
ParametersPessimist ScenarioNormal ScenarioOptimist Scenario
TransitC2TransitC2Transit
Total Profit ($)103,54997,131.2131,544125,820.6190,754.2
Total Distribution Costs ($)5016.489445.154510.28743.115777
Vehicle average usage capacity34.345.5841.216.6993.7
Transportation average cost per kg ($/kg)0.802.020.91.550.29
Cost–profit ratio 7.8720.476.1013.702.95
Transit vehicle was only considered in the optimistic scenario.
Table 6. Simulated cost analysis scenarios.
KPI: Cost InvolvedPercentage of Contribution (%)
Diesel cost 56.49
Maintenance cost 9.21
Tire wearing cost3.66
Workers’ salary29.60
Toll cost0.94
The cost that has the most impact on the total is diesel consumption (56.49%). KPI = key performance indicators.

