Article

Recycling Biogas Digestate from Energy Crops: Effects on Soil Properties and Crop Productivity

1
Research Centre Agriculture and Environment, Consiglio per la Ricerca in Agricoltura e L’analisi Dell’economia Agraria (CREA-AA), Via di Lanciola, 12/A, 50125 Firenze, Italy
2
Cooperativa Agroenergetica Territoriale (CAT), Via Fossa Faiella 6/A, 42015 Correggio (Reggio Emilia), Italy
*
Author to whom correspondence should be addressed.
Current address: Research Centre Plant Protection and Certification, Consiglio per la Ricerca in Agricoltura e L’analisi Dell’economia Agraria (CREA-DC), Via di Lanciola, 12/A, 50125 Firenze, Italy.
Submission received: 21 December 2020 / Revised: 11 January 2021 / Accepted: 11 January 2021 / Published: 14 January 2021
(This article belongs to the Special Issue Sustainable Agriculture and Soil Conservation)

Abstract

:
Digestate from biogas production can be recycled to the soil as conditioner/fertilizer improving the environmental sustainability of the energy supply chain. In a three-year maize-triticale rotation, we investigated the short-term effects of digestate on soil physical, chemical, and microbiological properties and evaluated its effectiveness in complementing the mineral fertilizers. Digestate soil treatments consisted of combined applications of the whole digestate and its mechanically separated solid fraction. Digestate increased soil total organic C, total N and K contents. Soil bulk density was not affected by treatments, while aggregate stability showed a transient improvement due to digestate treatments. A decrement of the transmission pores proportion and an increment of fissures was observed in digestate treated soils. Soil microbial community was only transiently affected by digestate treatments and no soil contamination from Clostridiaceae-related bacteria were observed. Digestate can significantly impair seed germination when applied at low dilution ratios. Crop yield under digestate treatment was similar to ordinary mineral-based fertilization. Overall, our experiment proved that the agronomic recycling of digestate from biogas production maintained a fair crop yield and soil quality. Digestate was confirmed as a valid resource for sustainable management of soil fertility under energy-crop farming, by combining a good attitude as a fertilizer with the ability to compensate for soil organic C loss.

Graphical Abstract

1. Introduction

Interest in biogas production has grown significantly in the past two decades, following the need to reduce fossil fuel consumption in favour of renewable energy sources. To encourage biogas market penetration, EU policy issued financial incentives [1] which have led to a significant increase in the number of biogas plants. More than 18,000 biogas plants were registered by October 2020 [2] with an overall installed electric capacity (IEC) of 13,520 MW estimated at the end of 2019 [3]. Currently, in Europe, Italy and Germany rank first in terms of the number of active biogas plants, with most Italian plants (1900 units with an IEC of around 1000 MW) located in the Po Valley and other northern regions [4,5].
Biogas production from anaerobic digestion mainly relies on four types of biomass sources: (i) biomass wastes from farms (animal slurries and crop residues) and households (municipal solid waste and food waste); (ii) agro-industrial by-products; (iii) sewage sludges; (iv) biomass from dedicated energy crops [6].
The energy derived from anaerobic digestion is considered to be almost “carbon-neutral” and to bring environmental and social benefits, contributing to a reduction of greenhouse gas emissions (allowed by replacement of fossil fuels) and organic wastes [7], and supporting rural development and new employment opportunities [8]. Against these benefits, biogas production from energy crops generates several issues and conflicts that are under the political attention on a world scale, since the shift of farmland to non-food systems creates doubts concerning the security of food supply and the environmental impact of energy crops cultivation [9]. One main concern is the environmental sustainability of energy crop cultivation as large amounts of organic matter and plant nutrients are removed with the crop biomass from the field. Depletion of organic matter and plant nutrients from the agricultural system can lead to soil degradation if not balanced by appropriate replenishments. Secondly, since the number of biogas plants in many European countries has increased significantly in recent years, the disposal of residues from anaerobic digestion has become of growing concern [10]. From a sustainability perspective of the biogas supply chain, since a wide range of undecomposed organic compounds and plant nutrients removed from the field (mainly ammonia and phosphate) are retained in the digestate [11,12,13,14], the direct land application of digestate is an economical option for residues disposal and soil amendment/fertilization [15,16,17]. The risk of a potential transfer of organic pollutants, such as herbicides and fungicides, from digestate to rotational crops and feedstuffs is considered very low by the European Food Standards Agency [16].
A third concern is that energy crops require resources (land, water and energy) which inevitably become no longer available for food production [8,9,18,19]. For cereal crop-based productions, the “food vs. fuel” conflict would be overcome if the grain was excluded from the biogas feedstock and used for livestock feed, while in general, the conflict would not exist at all if energy-crop cultivation was carried out on soils unsuitable for food production (marginal land) [20]. In this context, energy crop farming is an effective and profitable strategy to prevent the land from abandonment and degradation while promoting rural investments and new job opportunities [8].
Digestate can be applied to the soil without further processing (whole digestate, WD) [17] or after mechanical separation to obtain a solid fibrous material (solid digestate, SD) which can be directly spread to the field, composted, or dried for intermediate storage and transport [17,21]. Both WD and SD are sources of organic carbon and plant nutrients but since they exhibit quantitative and qualitative differences, they are expected to contribute differently to soil organic matter turnover [22], plant nutrients availability, and soil physical properties [23]. Typically, SD exhibits a great percentage (38–75%) of highly stable organic matter and a low NH4-N to total-N (TN) ratio [23], which make it suitable for use as a soil conditioner rather than as a source of readily available N. The use of digestate as a soil amendment can contribute to soil carbon sequestration, especially in intensively cultivated soils where crop residues are removed [24]. Organic matter addition is beneficial to soil fertility, since it may improve soil structure, increase plant nutrient retention, and water holding capacity and stimulate microbial activity [25]. A higher microbial activity, in turn, may enhance the release of plant nutrients from added residues and soil organic matter itself [26]. Conversely, the low organic matter concentration and the high NH4-N/TN ratio in WD makes it more suitable for use as an N-fertilizer [22,23]. The efficiency of digestate as N fertilizer changes with the features of digestate itself, soil type, crop and time of spreading [4]. Like any other fertilizer, WD should be applied at appropriate rates and times during the crop growing season, to ensure optimum plant nutrient uptake and to avoid phytotoxic effect and pollution of groundwater [16].
Research on digestate suitability for land application is relatively recent and is focused, on the one hand, on agricultural benefits of digestate as soil fertilizer and/or improver, and on the other hand, on the environmental risks associated with digestate use. Overall, many studies have investigated the potential of digestate as N fertilizer and the fate of N in the soil after land application [27,28], as well as the effect of digestate on soil organic matter and chemical properties [28,29,30], while there is still little knowledge about the impact of digestate on soil physical [27,28,31] and biological properties (bacterial and fungal communities) [32,33], which are key factors of soil functioning. Knowledge gaps about appropriate rates and soil-digestate interactions still exist, and the research field is very broad and complex, involving different kinds of feedstocks, crops, soils, environments, and agricultural management.
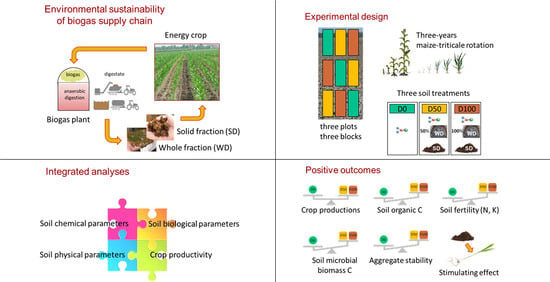
The main goal of our research was to understand the short-term effects of digestate on soil properties through a holistic approach, investigating soil physical, chemical, and microbiological properties and their interactions. Furthermore, we evaluated the effectiveness of digestate in replacing mineral fertilizers and as a resource to compensate for carbon depletion due to biomass removal in a three-year energy crop rotation. The study included both the whole digestate and its mechanically-separated solid fraction.

2. Materials and Methods

2.1. Digestate

The whole digestate was obtained from the biogas plant of the Cooperativa Agroenergetica Territoriale (CAT) in Correggio (Reggio Emilia, Italy). The digester was fed with the above-ground biomass from energy crops, including maize, triticale and sorghum silages, combined with by-products from the agricultural industry (i.e., stalks of grapes and sugar beet pulps), and cattle slurry from Parmesan cheese farms [34]. The solid fraction (SD) was retrieved from the whole digestate (WD) through a mechanical solid/liquid separation system following the digestion. SD was rich in organic C (44.4% of air-dry digestate) but relatively poor in N, P and K, whereas WD had a very low organic C content (1.1% of air-dry digestate) and a low C/N ratio (3.1), with a large proportion of NH4-N in the total amount of N (about 60% of air-dry digestate) (Table S1).
For a more in-depth characterization of digestate, we performed molecular-level analyses of microbial communities (see the paragraph on soil sampling and analysis) on WD, SD and two additional fractions, one collected directly from the fermentation silos, the other one from the mechanically-separated liquor (LD).

2.2. Study Site and Experimental Design

The experimental field was a 35 × 130 m area belonging to the R.G.R. Farm (CAT cooperative partner) located in the lower Po Valley (Correggio, Reggio Emilia, Italy; 44°49′ N–10°45′ E). The land use of the area had been converted from sugar beet cultivation to a 2-year maize-triticale rotation to feed the biogas plant, according to the set-aside scheme introduced by the Common Agriculture Policy. The trial was carried out from January 2011 to October 2013, maize cultivated from spring to summer 2011 and 2013, and triticale from autumn 2011 to summer 2012. The effects of digestate application on soil properties were investigated in the two maize growing seasons, using the whole digestate (WD) as a partial or total replacement of mineral fertilizer, and the digestate solid fraction (SD) as a soil amendment. Nitrogen fertilization was performed during maize post-emergency stage as follows: D0 plots, with mineral fertilizer only (control); D50 plots, based on WD + mineral fertilizer; D100 plots, with WD only. The SD fraction was applied to the WD-fertilized plots (D50 and D100) between one crop cycle and the next.
The treatments were assigned to 4 × 10 m field plots according to a randomized block design with three blocks (replicates). 1 m between plots and 5 m between blocks were kept free to avoid disturbance during soil tillage and to allow machinery operations. During the trial period, the mean annual air temperature was 14.2 °C and precipitation 681 mm (Figure S1). The experimental soil was a Hypocalcic Hypovertic Calcisols [35], with a silty-clay texture (Table S2). The main soil physical and chemical characteristics at the start of the trial (time t0) are given in Table S2.
In September 2010, the field was ploughed and harrowed for seedbed preparation. On 2 April 2011, maize (Zea mais L., cv. Kalumet) was sown at a density of 7 plants/m2 and all plots fertilized with urea (125 kg N ha−1). At the plant emergence (20 May 2011), an additional N fertilization was applied as follows: D0 plots, urea (125 kg N ha−1); D50 plots, urea (62.5 kg N ha−1) plus WD (17,400 L ha−1 = 62.5 kg N ha−1); D100 plots, WD only (34,700 L ha−1 = 125 kg N ha−1). WD was spread on the soil surface along the maize rows using mobile equipment (Figure S2) specifically developed by CAT and Cavazzuti Franco (Carpi, Modena, Italy), consisting of a 1 m3 tanker mounted on a tractor and connected to a boom with 4 trailing hoses, with a 2.80 m working width. The tanker was equipped with a pump-loading apparatus for filling. Maize was irrigated on 26 May, 13 June and 6 July 2011, and harvested at the wax ripeness stage (17 August 2011). On 16 September 2011, the D50 and D100 plots received 40 m3 ha−1 SD (equivalent to 10 t ha−1), applied by a solid manure spreader (Vaschieri, Solignano di Castelvetro, Modena, Italy) and incorporated into the soil by ploughing and harrowing. Triticale (x Triticosecale Wittm., cultivar Agrano) was sown in November 2011 at a density of 240 kg seeds ha−1 and fertilized in a single operation in April 2012 by urea only (30 kg ha−1). Due to the high plant density and the lack of suitable equipment for WD application in the standing crop, no WD top-dressing treatment was possible for triticale. The option of a pre-sowing WD treatment was discarded because of the low N use efficiency in the autumn-winter period and the related risk of N leaching [4]. Triticale biomass was harvested on 24 June 2012. In October 2012, the D50 and D100 plots were amended with the SD fraction (40 m3 ha−1) and the whole field was prepared for maize sowing as previously described (19 April 2013). The trial continued with a maize cycle according to the same practices as for the first experimental year. Due to unfavourable weather conditions (Figure S1), sowing, fertilization and harvesting operations needed to be delayed for about one month, respectively. Maize was harvested at the wax ripeness stage on 3 September 2013.
The whole above-ground biomass yielded at the end of the crop cycles was harvested and used as feedstock for biogas production.
The combination of both SD and WD with the agricultural management (fertilization factor) and sampling data (time factor) were the factors considered for the evaluation of differences in soil physical-chemical and biological characteristics.

2.3. Seed Germination Bioassay

Extracts of the two digestate fractions (WD and SD) collected from biogas plant at the beginning of experimentation were prepared by adding 25 g digestate to 100 mL of sterile deionized water. The suspensions were shaken for two hours and then centrifuged at 5000 g for 30 min. The supernatants from each digestate were used to prepare test solutions with digestate concentrations of 100% (pure), 50%, 25%, 12.5% and 0% (distilled water as control). Petri dishes of 9 cm diameter were prepared, each containing twenty maize seeds placed upon two sheets of Whatman N. 1 filter paper pre-treated with 10 mL of the test solution. The dishes were transferred to a germination chamber under controlled temperature (20 °C) in the dark. There were five replicates for each treatment.
The number of seeds germinated in each Petri dish was counted after three days and after one week of incubation, and the germination index (GI) was calculated as a percentage relative to the control [26]. Seedling root elongation was measured after 1 week.

2.4. Crop Yield

Crop yield just before harvest (in August for maize and in June for triticale) was estimated by collecting biomass at ground level from three randomly selected point in each plot spaced 30 cm from the edges to avoid border effects. In each sampling point, maize was harvested from 1 m in length row sections (including 6–7 plants), while triticale was harvested from 0.5 m2 areas. After weighing, the biomass was oven-dried at 70 °C until constant weight (about 56 h for maize and 48 h for triticale) to determine the dry weight.

2.5. Soil

2.5.1. Sampling

Soil samples were collected before maize sowing (25 March 2011 = t0; at the beginning of the trial); after maize harvesting (17 November 2011 = t1); before sowing in the second maize cycle (14 April 2013 = t2); at the end of the trial (3 October 2013 = t3).
For soil chemical, biochemical, microbiological and particle size analyses, each plot was sampled by auger to a depth of 20 cm in three selected points, collecting soil cores of 5 cm in diameter. The three cores were then mixed thoroughly providing a single composite sample per plot (3 replicates for each treatment, as a whole). Before chemical and biochemical analyses, the soil was air-dried, ground and sieved through a 2 mm mesh size. The samples for microbiological analyses were stored untreated at −80 °C until analysis.
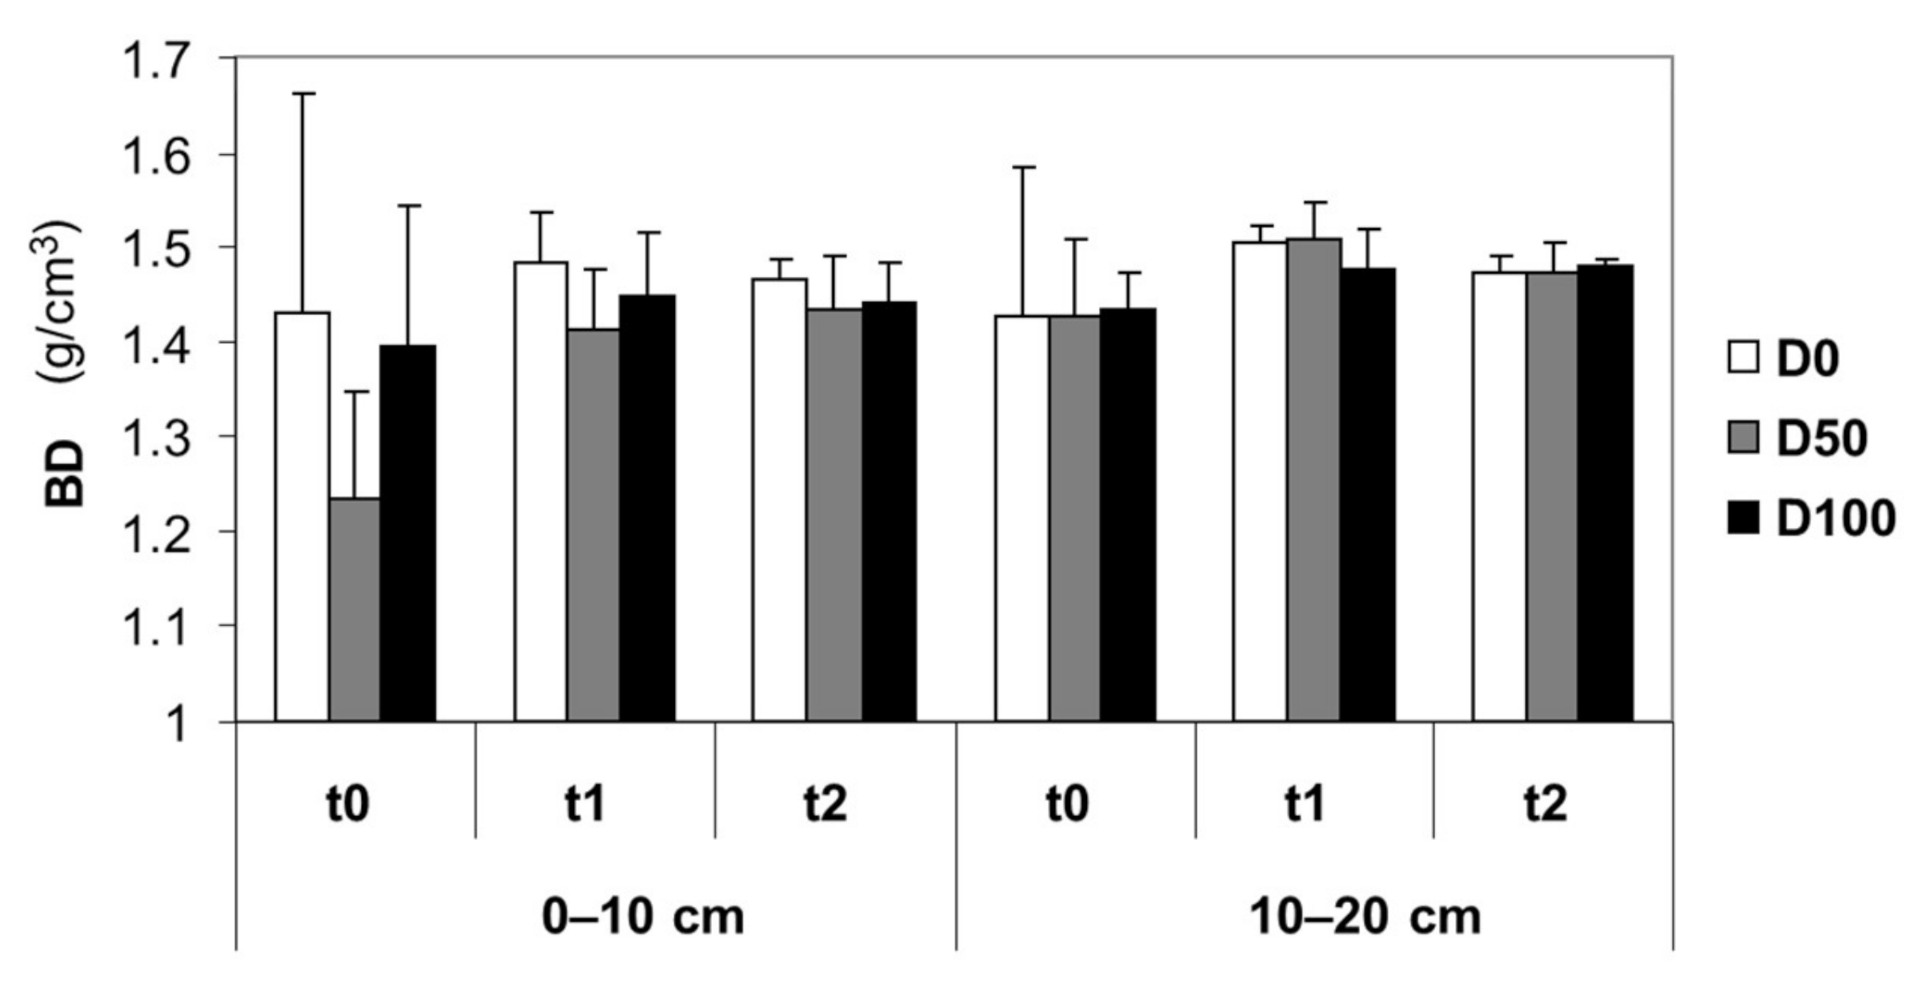
For soil bulk density (BD) and macro-porosity measurements, three undisturbed soil samples were collected from the central part of each plot, at depth increments of 0–10 and 10–20 cm, using a hammer-driven linear sampler. Samples for BD were collected at each sampling time whereas those for macro-porosity analysis were taken only at t0 and t2.
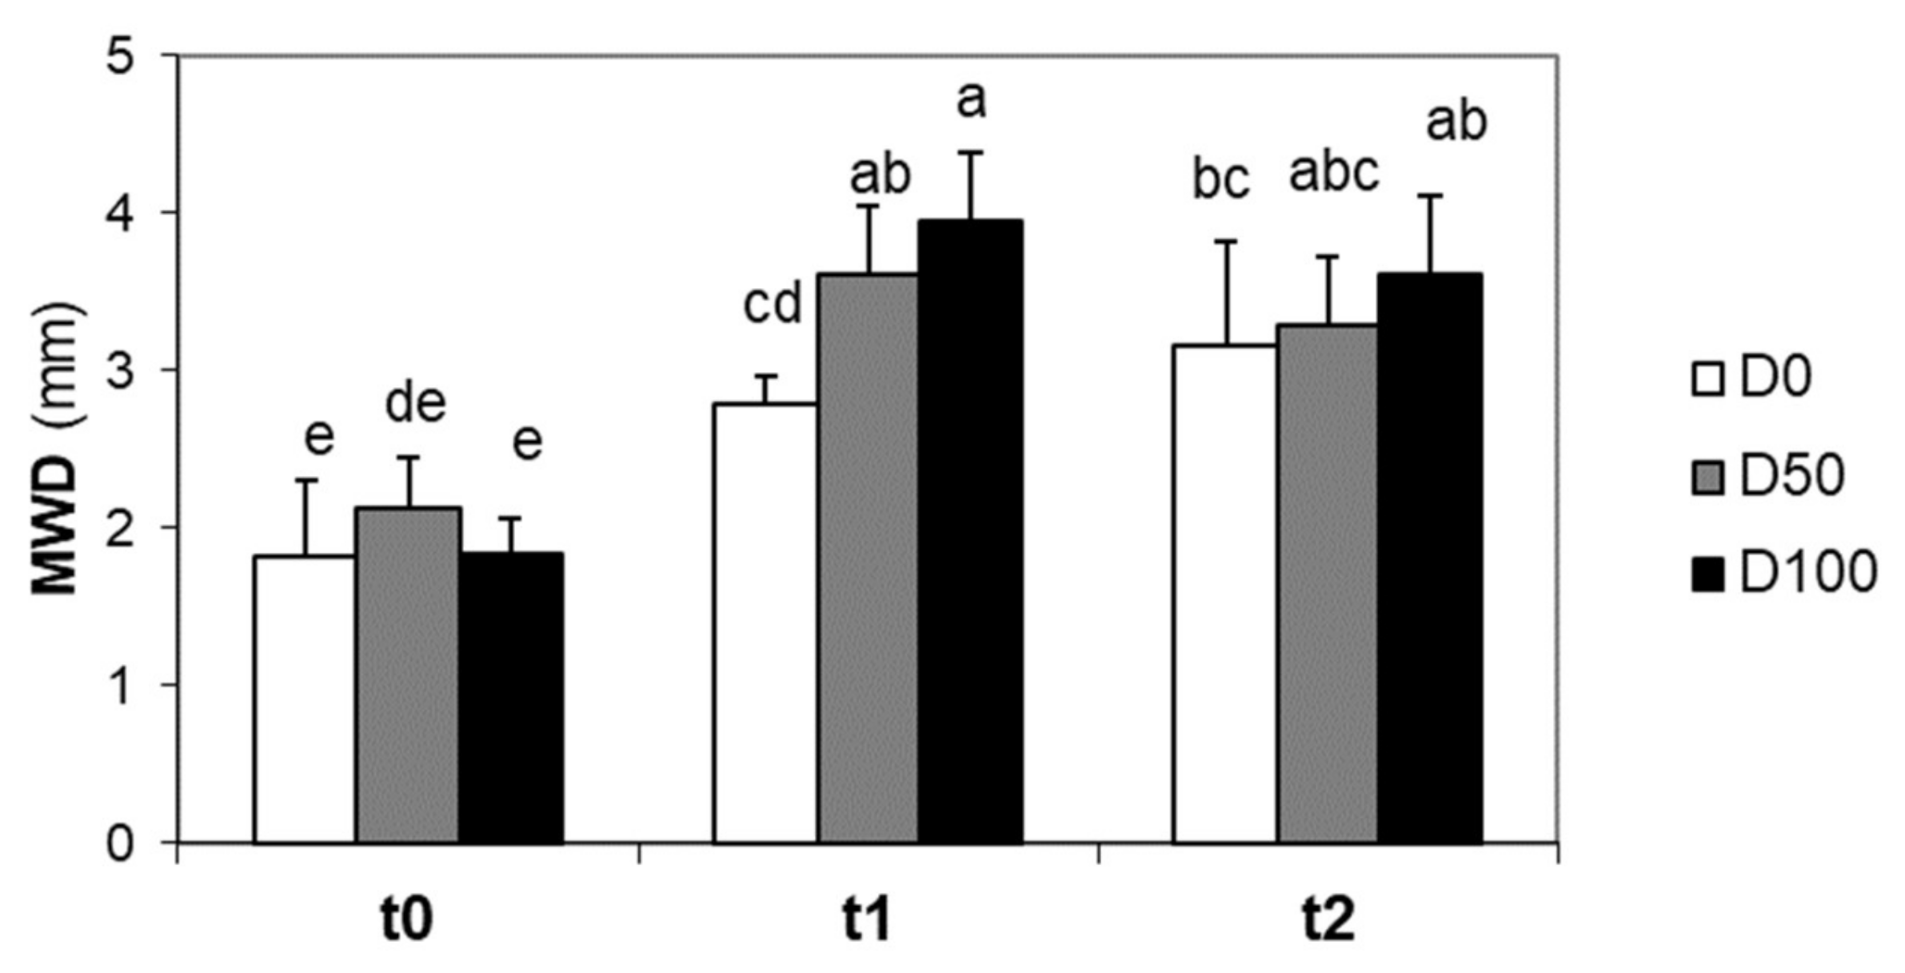
Soil aggregate stability was determined at t0, t1 and t2 on a single composite sample per plot, obtained from three spatially separated sub-samples of soil aggregates collected down to 10 cm depth.

2.5.2. Chemical Analyses

Soil pH was measured potentiometrically in a 1:2.5 soil-water suspension. Soil cation exchange capacity (CEC) and exchangeable base concentrations (Ca, Mg, K and Na) were determined on BaCl2 triethanolamine (pH 8.2) extracts by flame atomic absorption spectrometry [36]. Soil available Cu, Zn, Fe and Mn were extracted and quantified according to Lindsay and Norvell [37]. Soil total organic carbon (TOC) and total nitrogen (TN) in the bulk soil were measured by dry combustion using a Thermo Flash 2000 CN elemental analyser (Thermo Fisher Scientific, Walthman, MA, USA). The analysis was performed on 20 to 40 mg of soil weighed into Ag-foil capsules and pre-treated with 10% HCl until complete removal of carbonates.

2.5.3. Biochemical Analyses

Microbial biomass carbon and nitrogen (MBC and MBN, respectively) were determined following the fumigation extraction method [38]. Two aliquots from each soil sample were brought to 60% of water holding capacity (WHC), 24 h before the analysis; a first aliquot was immediately extracted with K2SO4 (0.5 M) and then filtered with Whatman n. 42 filter paper; the second aliquot was fumigated for 24 h at 25 °C with CHCl3 and extracted as the first one. The organic C and N concentration in the extracts was then determined by Thermo Flash 2000 CN elemental analyser (Thermo Fisher Scientific). MBC and MBN were calculated as the difference between the C and N extracted from the fumigated samples and those extracted from non-fumigated samples, respectively.
Soil microbial respiration was determined according to Badalucco et al. [39]. Each sample was incubated at 28 °C in a flask sealed with a stopper. The CO2 developed during incubation was trapped in NaOH solution after 1, 3, 7, 10, 14, 21 and 28 days and then measured by titration with HCl (0.1 M). The cumulative amount of CO2 produced over 28 days of incubation (MRcum) was regarded as the potentially mineralizable C.

2.5.4. Microbiological Analyses

Soil RNA was extracted using the RNA PowerSoilTM Total Isolation Kit (MoBio, Solano Beach, CA, USA), following the manufacturer’s instructions with the minor modification of adding Na-EDTA (0.5 M) to the lyses solution to improve the DNA desorption from clay particles [40]. RNA was eluted in nuclease-free water (Promega, Madison, WI, USA) and then DNA was co-extracted by the RNA PowerSoilTM DNA Elution Accessory Kit (MoBio). The extracted RNA was subsequently subjected to DNase digestion using the RQ1 RNase-free DNase (Promega) and complementary cDNA was generated by reverse transcription (RT) using the ImProm-IITM Reverse Transcriptase System (Promega).
For Denaturing Gradient Gel Electrophoresis (DGGE) analysis of microbial communities, the extracted DNA and the generated cDNA were amplified using specific primers for bacterial and archaeal 16S rDNA, and for fungal 18S rDNA (Table S3). Amplification and DGGE procedures were carried out following Pastorelli et al. [41] and Lazzaro et al. [42].
Representative bands from archaea and Clostridiaceae-related DGGEs were excised, eluted from gels and screened according to Pastorelli et al. [43]. Selected bands were subjected to direct sequencing by Macrogen Service (Macrogen Ltd., Amsterdam, The Netherlands). The nucleotide sequences collected in this study were deposited in the GenBank database under the accession numbers MF415444-MF415489.

2.5.5. Physical Analyses

Soil texture was determined by the pipette method [44]. Soil bulk density (BD) was measured by the core method according to Blake and Hartge [45].
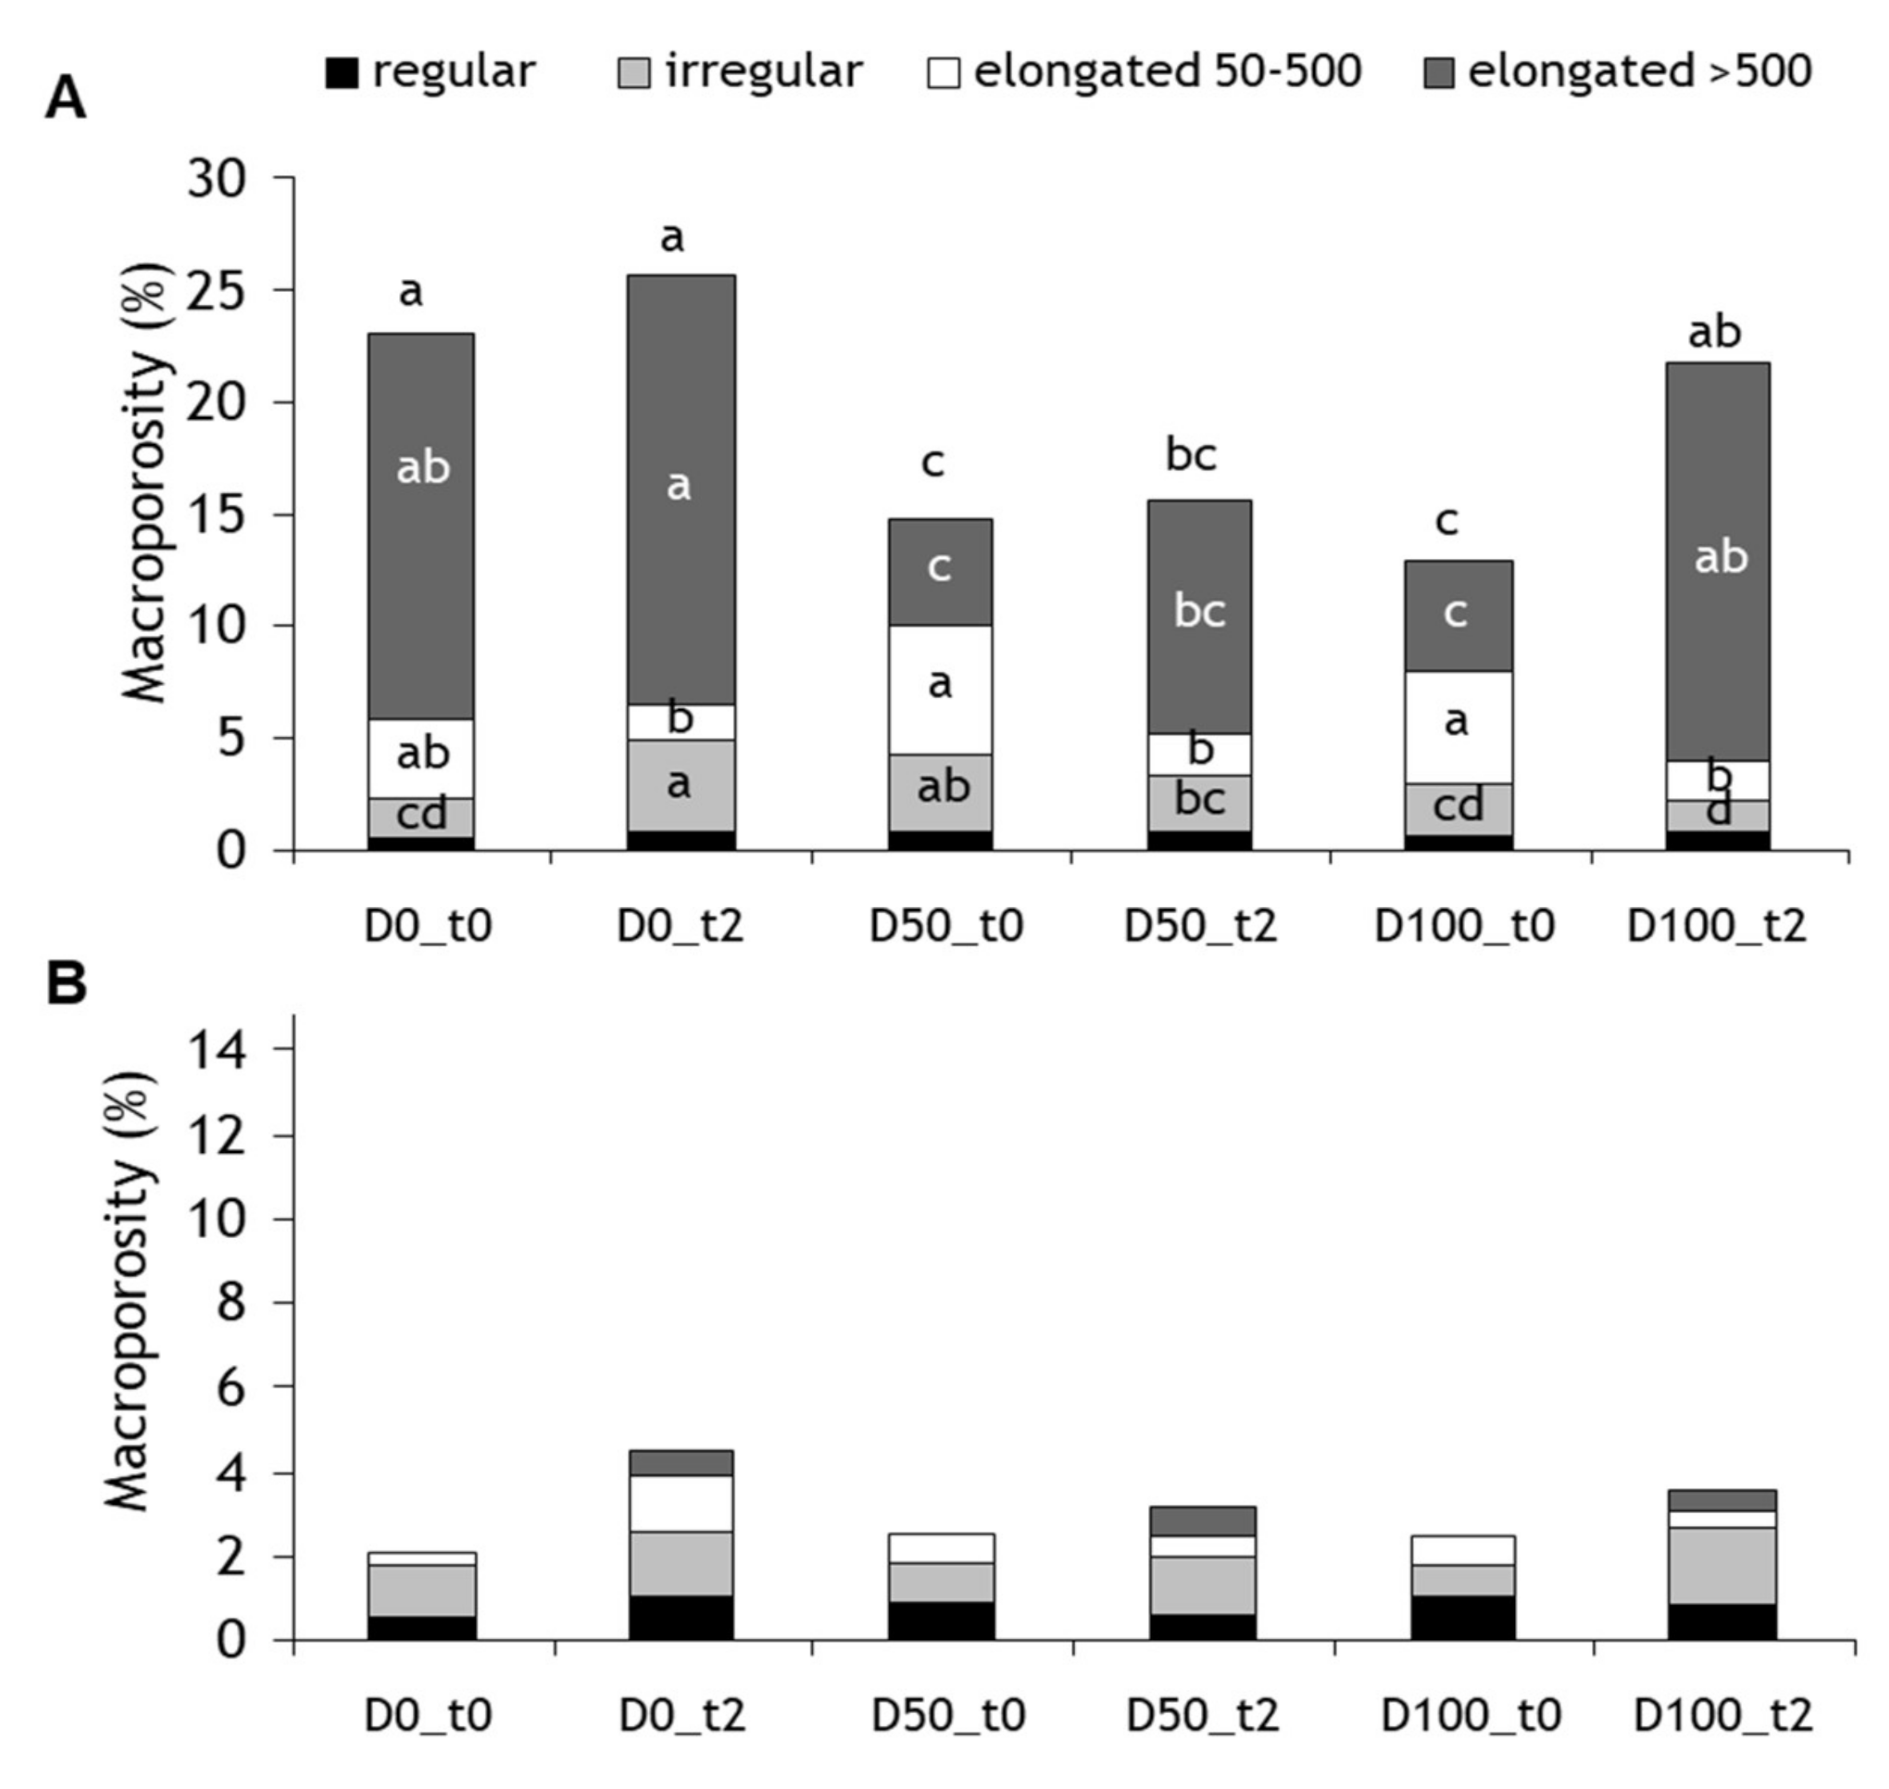
Soil macro-porosity was determined by the micro-morphometric method [46]. This method allows the characterization and quantification of soil macro-porosity according to pore shape, size distribution, irregularity, orientation and continuity from vertically oriented thin sections of 5.5 × 8.5 cm size, obtained from undisturbed soil samples. A 2.82 × 3.54 cm area of each thin section was captured with a video camera avoiding the edges where disruption could have occurred. The images collected were then analysed by Image-Pro Plus software (Media Cybernetics, Silver Spring, MD, USA), set up specifically to measure pores larger than 50 µm. The total porosity and pore distribution were calculated from the measurement of pore shape and size [46]. From a functional point of view, the elongated pores of 50–500 µm were described as transmission pores and the pores with >500 µm size as fissures [47]. The thin sections were also examined by a Zeiss “R POL” microscope at a 25× magnification to characterize soil structure.
Soil aggregate stability was determined by the wet sieving method and the calculation of the mean weight diameter of water-stable aggregates (MWD) [48]. Soil aggregates from each composite sample were air-dried, weighed and separated into different size fractions (10–20, 4.75–10, 2–4.75, 1–2, <1 mm) using a vibrating sieve shaker (Retsch, Germany). The most representative aggregate size fraction was used to perform wet sieving. Twenty grams of aggregates from the most abundant size class (4.75–10 mm) were directly soaked for 5 min on the top of nests of 4.75, 2, 0.25- and 0.05-mm diameter sieves immersed in water (fast wetting). The nest of sieves with its content was then vertically shaken in water by an electronically controlled machine with a stroke of 40 mm per 10 min, at a rate of 30 complete oscillations per minute. For each sample, 3 repetitions were performed.

2.6. Statistical Analyses

The results of soil physical, chemical and microbiological (richness and α-diversity indices) analyses were processed by analysis of variance (ANOVA) followed by Fisher’s least significant difference (LSD) test at the significance level p ≤ 0.05, using the Statistica software (Palo Alto, CA, USA). Pearson correlation analysis was performed among physico-chemical properties of soil by Statistica software.
Band migration distance and intensity for each DGGE profile were obtained using the Gel Compare II software v 4.6 (Applied Maths, Saint-Martens-Latem, Belgium). The number of bands (species richness) and their relative abundance (Shannon index, H’ and Simpson index, D) were used as proxies of richness and α-diversity of soil microbial communities, as described by Pastorelli et al. [43]. The banding patterns of bacterial and fungal DGGE profiles were converted into presence/absence band matching tables and imported into PAST3 software [
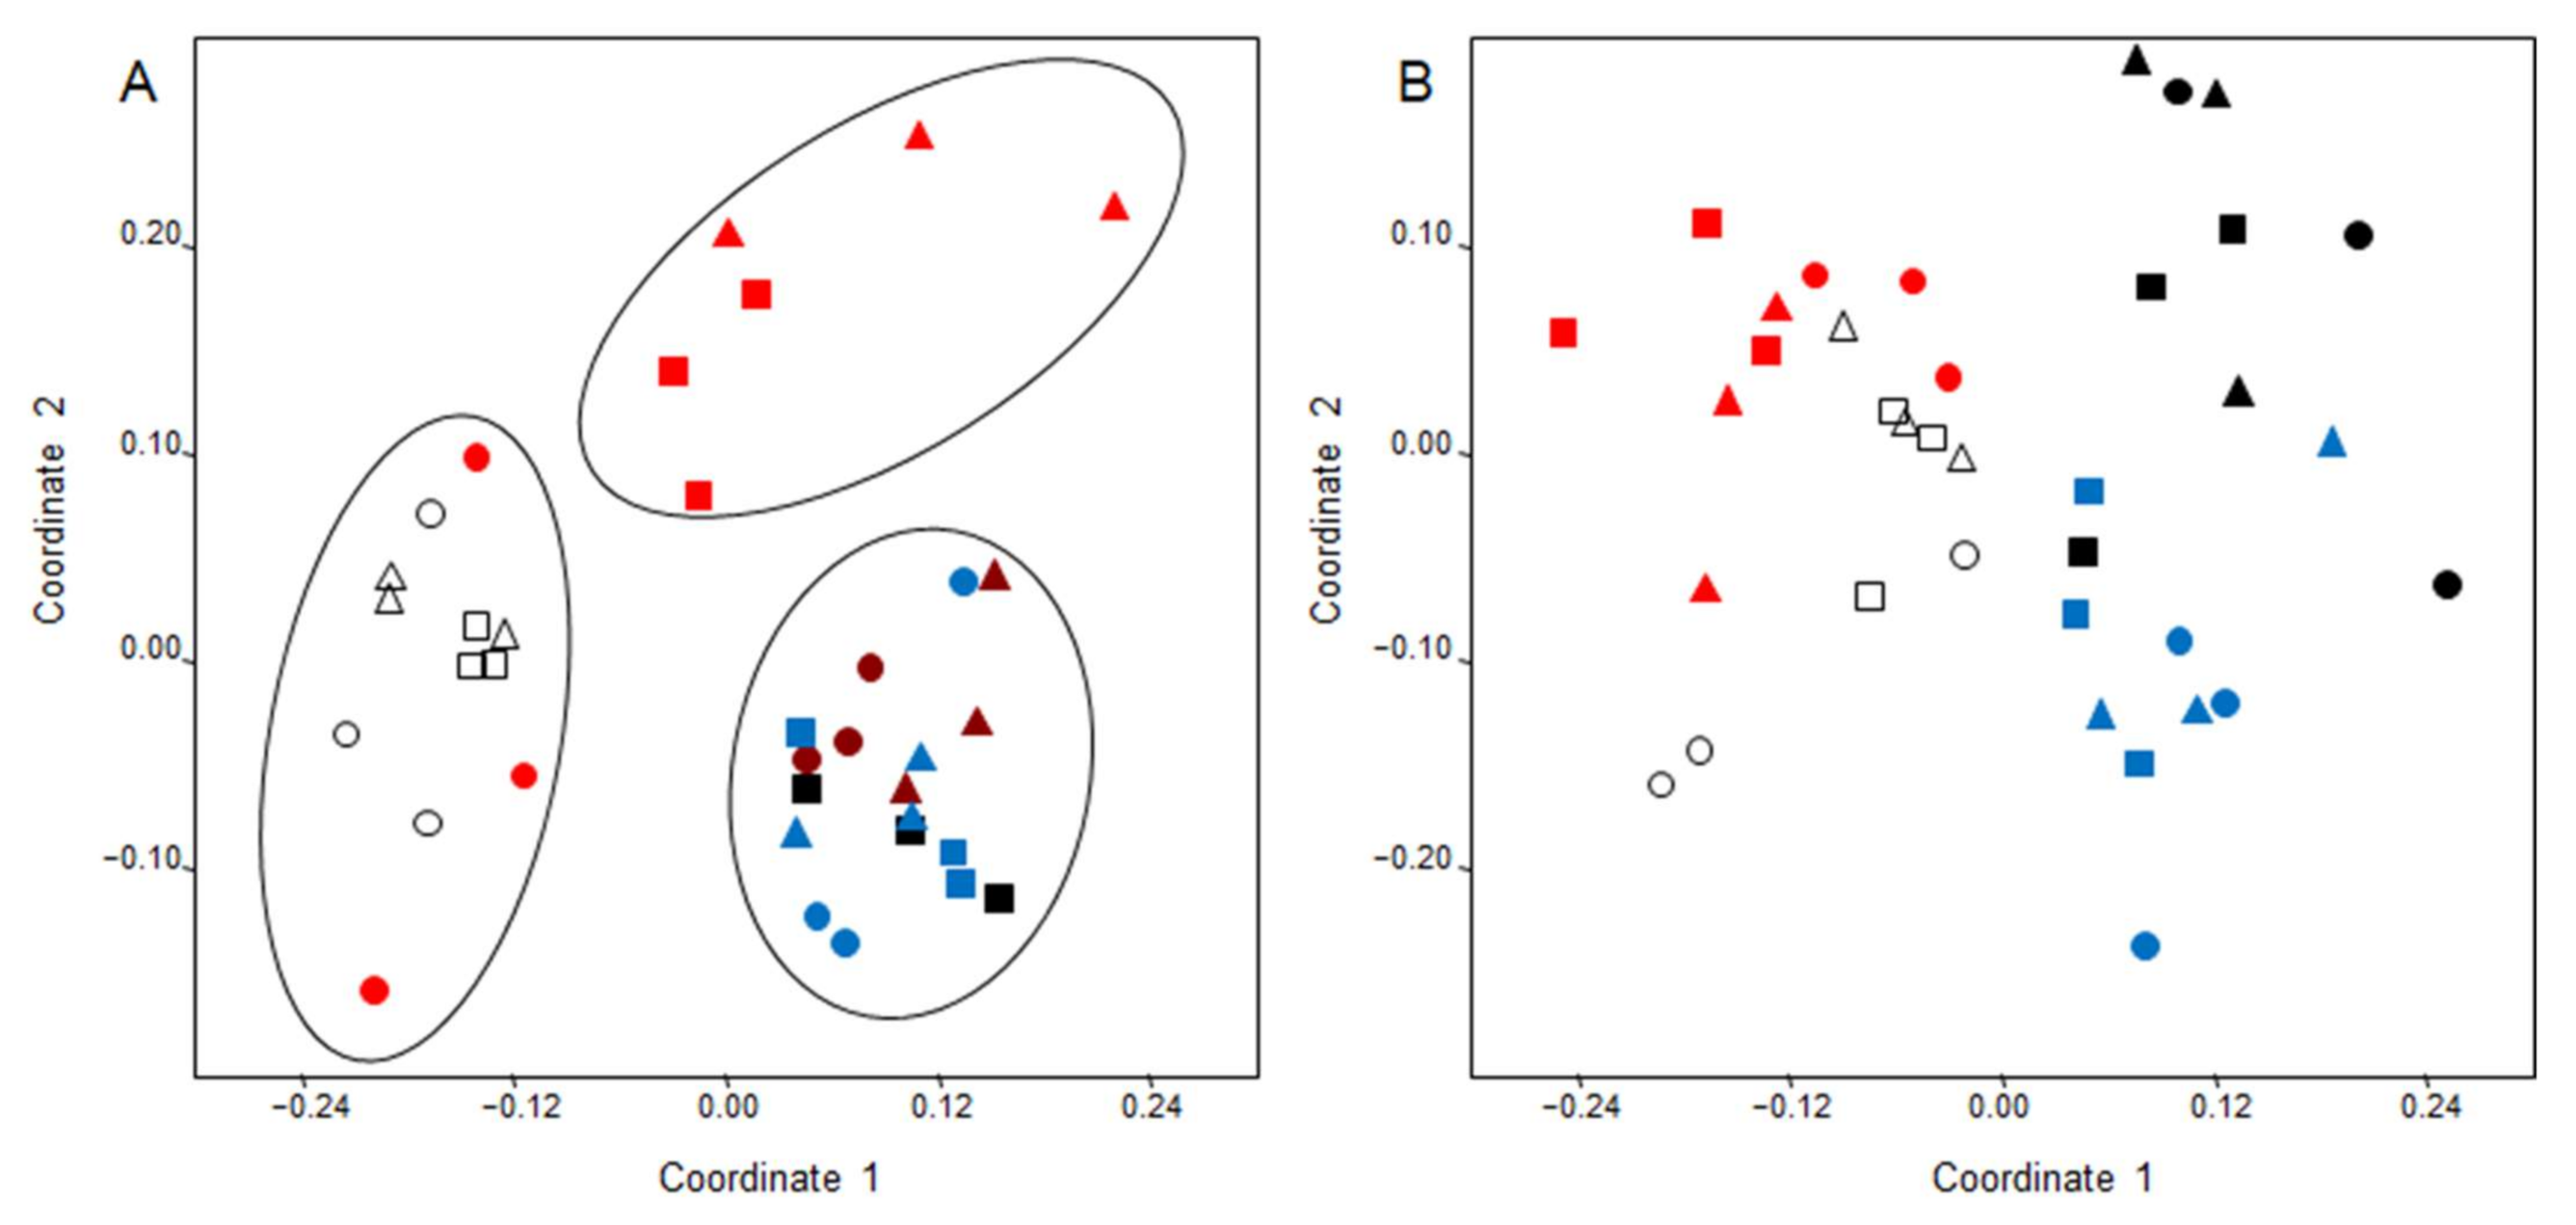
49]. Non-metric multidimensional scaling (MDS) based on the Dice coefficient was performed to represent the distance between the DGGE profiles in the two-dimensional space. Analysis of similarity (ANOSIM) based on Dice similarity coefficient and 9999 permutational tests were run to assess the statistical significance in microbial community structure due to fertilizer/amendment treatments.
Nucleotide sequence chromatograms were edited using Chromas Lite software v2.1.1 (Technelysium Pty Ltd., Tewantin, Old, AU) to verify the absence of ambiguous peaks and to convert them to FASTA format. The DECIPHER’s Find Chimeras web tool [50] was used to uncover chimaeras hidden in nucleotide sequences. The Web-based BLAST tools was used to identify closely related nucleotide sequences within those stored in the GenBank database.in order Microbial taxonomic identification was achieved by means of different sequence similarity thresholds as described by Webster et al. [51].

3. Results

3.1. Germination Index Bioassay

GI was lowest when maize seeds were treated with undiluted SD and WD soluble extracts (57% and 34.9%, respectively; Table 1) but increased with increasing dilution ratio. According to McLachlan et al. [52], GI values above 70%, as those observed under 50%, 25% and 12.5% digestate concentrations, indicate the absence of toxicity.
After one-week incubation there were significant differences in rootlet lengthening between SD and WD treated maize seeds, as well as between the different digestate used concentrations. The rootlet length was lowest in the undiluted extracts and greatest under 12.5% (SD) and 25% (WD) concentrations (Table 2). With a 12.5% SD concentration, the root elongated more than in the control, although not significantly.

3.2. Crop Biomass Yield

Neither maize nor triticale biomass showed significant differences between treatments (Table 3). In 2013, due to abundant rainfall (Figure S1), the growth of maize suffered a marked delay compared to 2011, along with a reduction in the biomass yield irrespective of treatment (8.8–12.8 t ha−1 against 19.6–22.1 t ha−1, respectively).

3.3. Soil Chemical Properties

As reported in Table 4, the average TOC content in the plots under digestate treatment generally showed slight increases compared to that of the control plots, with no difference between the application rates.
TN followed a different trend but, overall, it was well correlated with TOC (0.723 ***), confirming a positive digestate effect in the third experimental year (t2 and t3 sampling). The TOC to TN ratio did not change with treatment, except for t1 sampling which showed lower C/N values under digestate application (Table 4).
Soil CEC values, exchangeable Ca and exchangeable Mg concentrations did not differ among treatments for the entire duration of the trial (Table 5). In contrast, at the end of the first year (t1) the exchangeable K concentration was increased by D50 and D100 regardless of the application rate. At t2, K showed a significant decrease in all plots as compared to t0 and t1 contents. The available Cu, Zn, Fe and Mn contents were not affected by treatments (Table 5).

3.4. Soil Physical Properties

Soil BD did not change significantly with treatments and was stable over time (Figure 1).
Macro-porosity ranged within moderate levels in the surface layer (10–25%) while it averaged less than 5% in the deeper layer, indicating a very compact soil, as defined according to the micro-morphometric method [53] (Figure 2). Differences between treatments were significant in the surface layer only. The t0 sampling showed a certain degree of field variability for soil macro-porosity, with D0 plots showing a higher macro-porosity than D50 and D100 plots (related to a larger number of fissures) and D50 plots featuring a higher proportion of irregular pores compared to D0 and D100 plots. In the t0–t2 time frame, soil total macro-porosity increased under D100 with an increase in the percentage of >500 µm elongated pores (fissures) and a reduction in that of 50–500 µm elongated pores. Over the same period, macro-porosity remained quantitatively unchanged under D50, showing a decrease in the 50–500 µm elongated pores.
Soil aggregate stability was very low at the beginning of the trial (MWD < 2.5 mm, against a theoretical MWD maximum of 7.375 mm for the 4.75–10 mm size class aggregate) but increased over time regardless of treatment (Figure 3). The effect of digestate treatment was significant only at t1, soon after WD distribution. After two years (t2), the differences in soil aggregate stability between treatments were not significant.

3.5. Soil Microbial Biomass and Respiration

Soil MBC was relatively stable over time with a small but significant increase (p ≤ 0.05) only in D50 plots. The MBN decreased from t1 to t2 regardless of treatments (Table 6).
The C mineralization potential (after 28 days of incubation) did not change significantly either in relation to treatment or time, except for D50 plots where it was higher than in the control plots at t1 (Table 6).

3.6. DGGE Analysis of Total Bacterial and Fungal Communities

The abundance (richness) and α-diversity (Shannon–Weiner and Simpson indices) calculated from DGGE profiles showed that the soil bacterial community was overall richer and more diverse than the fungal community (Table S4). When considering all groups independently (12 groups: 4 sampling time combined with three digestate treatments), there were significant differences between soil samples for both bacterial and fungal communities (Table S4). Multifactorial ANOVA (Table S4) showed that the species richness and α-diversity indices of the bacterial community were significantly influenced by the interaction between sampling time and digestate treatment. Differently, only the sampling time had a significant effect on the species richness and α-diversity indices of the fungal community (Table S4).
At t0, MDS ordination showed a low inter-specific variation between the bacterial communities from the differently treated plots (Figure 4A). At t1, the D50 and D100 bacterial communities were clearly separated from the D0 ones, which grouped with t0 communities. Bacterial communities at t2 and t3 grouped together regardless of treatment and were well separated from the t0 and t1 ones (Figure 4A). Conversely, at t0 the fungal community showed a higher inter-specific variation than bacterial community. In the following sampling, the fungal community showed a progressive change of its structure, which seems to be independent of the treatments (Figure 4B).
Due to the poor reliability of MDS ordination results, especially for 18S-DGGE (stress = 0.282), DGGE profiles were further analysed by multivariate analysis. When testing all groups independently (sampling time × fertilizer treatment), the one-way ANOSIM global test revealed significant differences in both bacterial and fungal DGGE profiles (Table 7), although R values were not sufficiently reliable. According to the outcomes of the two-way crossed ANOSIM test, the differences in both bacterial and fungal community composition were greater in relation to the sampling time (R = 0.822 and 0.808 for bacteria and fungi, respectively) than in relation to the digestate treatment (R = 0.448 and 0.275 for bacteria and fungi, respectively) (Table 7).

3.7. DGGE Analysis of Total Active Bacterial Community

The active bacterial community was analysed by matching the t0 DGGE profiles with those obtained at t1 (different seasons within the same year: March vs. November) and t2 (different years under the same field conditions: before maize sowing, 2011 vs. 2013).
The abundance (richness), α-diversity (Shannon–Weiner and Simpson indices), and composition of the active bacterial community were more influenced by sampling time than by digestate treatment or sampling time × digestate treatment interaction (Data not shown). The separation between active bacterial communities was stronger when they were compared according to the different season (t0 vs. t1) than to the different year (t0 vs. t2) (Table 8).

3.8. DGGE Analysis of Archaea and Clostridiaceae-Related Communities

The DGGE profiles from the different digestate fractions were very similar to each other and quite different from those of the soil (Figure S3). Digestate-based treatments had no substantial effect on soil archaeal (Figure S3a) and Clostridiaceae-related bacterial (Figure S3b–e) communities. Some additional dominant bands were found at t1 in D50 and D100 DGGE profiles obtained with the primer sets specific for Clostridiaceae-cluster I and -cluster IV. In particular, a group of γ-Proteobacteria-related bands appeared in the Clostridiaceae-cluster I DGGE profiles (Figure S3b), while a group of bands phylogenetically related to Caproiciproducens galactitolivorans (similarity ranged from 93% to 94%) appeared in the Clostridiaceae-cluster IV DGGE profiles (Figure S3d). These bands were almost undetectable in the t2 DGGE profiles.
Overall, the digestate DGGE profiles were characterized by one or more all-time dominant bands related to Clostridiacea (Figure S3b–e; Table S5). However, none of the primer sets was specific enough to detect only Clostridium-related species, since several DGGE bands revealed to be related to β-, δ- and γ-Proteobacteria divisions, Acidobacteria group or Actinobacteria phylum (Table S5).

4. Discussion

4.1. Effects of Digestate on Soil Chemical, Physical and Microbiological Properties

In this trial, digestate treatments provided consistent results in the two years of maize cultivation. The soil TOC tended to be slightly higher in plots treated with digestate than in plots under mineral fertilization, in agreement with results obtained using digestate or other different bioenergy by-products as a soil amendment or fertilizer [28,29]. It is possible that, to some extent, soil organic C enrichment was limited by tillage practices, due the dilution of the organic matter across the ploughed layer and the exposure of physically protected organic compounds to enhanced mineralization [54].
Functional properties of organic residues as amendments are related to the organic matter stability, i.e., the ratio of recalcitrant to labile organic fractions [55] and how these interact with soil features, climate and crop management. There is consistent laboratory evidence of lower carbon mineralization of digestate compared to undigested feedstock, due to an increase of the recalcitrance of organic matter during digestion [28]. However, results from previous short-term experiments on the effects of digestate on soil carbon and nitrogen and crop yield are contrasting, probably due to the various chemical characteristics of digestate and different type of soil used in the experimentations [13,33,56,57].
Overall, the role of soil organic matter in soil fertility and plant nutrition may be summed up in its ability to supply and store plant nutrients [58]. This role is expressed through the release of organically-bound plant nutrients by microbial mineralization and the contribution of organo-mineral complexes to the retention of plant nutrients as available cations [58]. As indicated by the close similarity between soil TN and TOC distribution patterns, soil organic matter contributed to the overall N pool. In addition, the determination coefficient of the relationship between soil TN and TOC (R2 = 0.723 ***) suggests that additional factors may account for TN variations, namely the dynamics of mineral N supplied by fertilizers (WD, urea) and soil organic matter mineralization.
According to crop yield performances, digestate treatments were at least as effective as mineral fertilization in supporting crop requirements. There was no evidence of a significant contribution of the organic fraction of the digestate to the cation exchange capacity of the soil, which is explained by the modest TOC variations found after digestate treatments and the fine-textured composition of the soil mineral fraction [59]. This agrees with previous studies showing that the effects of organic amendment on soil CEC were generally more pronounced in coarse-textured soils than in clayey soils [59].
The whole digestate (WD) also proved to be a valuable source of K, by increasing the available K pool of the soil by 22% during the first year of trial. To further support the high potential of digestate as a substitute for mineral K-fertilizers, numerous experimental evidences demonstrate very high rates of K recovery during anaerobic digestion (above 94%) from a wide range of feedstock materials [60].
The unexpected decrease in soil K and Na content across the experimental field before sowing in the second maize cycle (compared to their average content in the previous sampling times) can be ascribed to a leaching effect (Figure S1), which conversely left Ca and Mg concentrations unchanged due to their lower water-solubility and the buffering effect of soil carbonates [61].
Soil BD was not affected by digestate treatments, which disagrees with results by other authors who found a reduction of BD under organic amendments in both compacted and uncompacted soils [62]. BD and organic matter are linked by a close relationship involving physical and chemical interactions between organic substances and soil mineral particles [63]. Usually, due to a lower density of the organic matter compared to that of the mineral fraction, the average BD of a mixture mineral fraction/organic matter decreases as the organic matter content increases. In the present experiment, several factors may have interfered with these relationships, i.e., an experimental period too short compared to the time required for soil structure formation and a contrasting effect of soil tillage on aggregates formation and stabilization. This was reflected in the pattern of soil pore size distribution, with a decrease in the amount of transmission pores, which are of primary importance for optimal soil–water–plant relationships, and an increase in the proportion of fissures mainly involved in water and air flows but related to poor structure and physical degradation when they are (as in D100) over 70% of total porosity [64].
The stability of soil aggregates is a key indicator of soil physical quality, affecting the ability of the soil to retain its structure and the related physical and hydraulic functions against degradative forces [65]. Soil aggregate stability relies on a complex range of factors involving soil texture and mineralogy, the chemistry of soil cations and soil organic matter content and quality [64]. At the beginning of the trial, aggregate stability (expressed as MWD) was quite low possibly due to the high silt proportion and the low organic C content [66,67]. However, aggregate stability was improved by digestate treatment during the first experimental year, consistently with findings of other authors [27,31]. In addition, it correlated positively with TOC (Figure 5), in line with the role of soil organic C as a driver of soil aggregate formation [66,67,68].
With respect to soil biological parameters, biochemical analysis revealed just a slight (statistically not significant) increase over time in the soil MBC under digestate treatment. This increase was consistent with the trend of TOC, suggesting that part of the organic C supplied by digestate could have been converted into MBC [69]. The small extent of MBC increase was expected from a short term digestate treatment, due to the relatively high recalcitrance of the organic matter in SD and the low organic C concentration in WD [26,70]. This evidence confirms SD application as a valuable tool to improve soil C sequestration [71] and to compensate for C depletion associated to crop biomass removal.
Microorganisms are crucial for soil fertility [25]. They drive the turnover of organic substrates and their abundance and diversity can be affected by soil management as well as by the quality of soil amendments/fertilizers. A reduction in microorganism number and diversity may impair their ability to perform specific functions as well as to withstand soil perturbations from a long-term perspective [72]. In this trial, “time” was the main factor affecting the α-diversity of soil microbial communities. Differences in the microbial community structure in response to digestate addition were showed when t0 and t1 were compared. Conversely, the microbial community structure remained quite similar when t2 and t3 were compared. In addition, active bacterial communities resulted more affected by season than by digestate treatments, contrasting many reports which indicated an enhanced soil microbial activity after field applications of digestates [32,33]. Calbrix et al. [73], in a study dealing with the impact of organic amendments on soil bacterial communities over a 12-month period, observed that changes in soil bacterial community structure were only temporary and that seasonal variations had the greatest effect on microbial community composition. Accordingly, in our study, digestate showed to have only a transient effect on the microbial community structure. Successively, the soil microbial communities developed new stability and equilibrium over time in both digestate treatments, thus strengthening the hypothesis of a resilience of microbial communities to anthropogenic changes [74,75,76]. Likewise, the Archaea and Clostridiaceae-related bacteria revealed remarkably stable soil resident communities, with negligible and temporary changes after the introduction of allochthones species (Figure S3).

4.2. Effects of Digestate on Seed Germination and Crop Yield

The GI bioassays revealed that highly concentrated SD and WD extracts impaired seed germination, whereas <50% digestate concentrations had no phytotoxicity. This suggests that the use of digestate should follow appropriate rates and timings of application to avoid the direct contact with seeds, as also described by Alburquerque et al. [26]. According to our experimental plan, we can exclude any phytotoxic interference of digestate with maize seed germination under field condition, as the SD fraction was applied several months before sowing and WD in the post-emergence stage.
Interestingly, the 12.5% SD concentration increased the germination index and the relative root elongation as compared to the control, which can be explained by assuming a stimulating effect of plant nutrients, growth enhancers or even phytormone-like compounds contained in SD as suggested by other authors [26,77].
In the first two years of the trial, both maize and triticale biomass yields were consistent with the average yields in the area [78], which is promising in the perspective of agricultural use of digestate, alone or combined with mineral fertilizers. The implementation of conservation tillage management [79] may further improve the efficiency of digestate as an amendment and/or fertilizer.
With regard to the pronounced decrease in maize yield across the whole experimental field in the third experimental year (second maize growth season), it was most likely due to a combination of adverse climate and soil physical conditions arising from the abundant rainfall between January and April (Figure S1), which caused a shift of the entire growing season. At the same time, the fine texture of the soil combined with the low organic matter content might have led to a stronger impact of the heavy machinery on soil structure and hydrological behaviour, resulting in insufficient drainage, extended water stagnation and overall poor soil physical conditions for seed germination and shoot development [80].

5. Conclusions

With a focus on the environmental sustainability of the bioenergy supply chain, the application of digestate to the soil can meet the need to safely dispose and recycle the residues coming from anaerobic digestion and, at the same time, to compensate for soil C and plant nutrient depletion due to crop biomass removal.
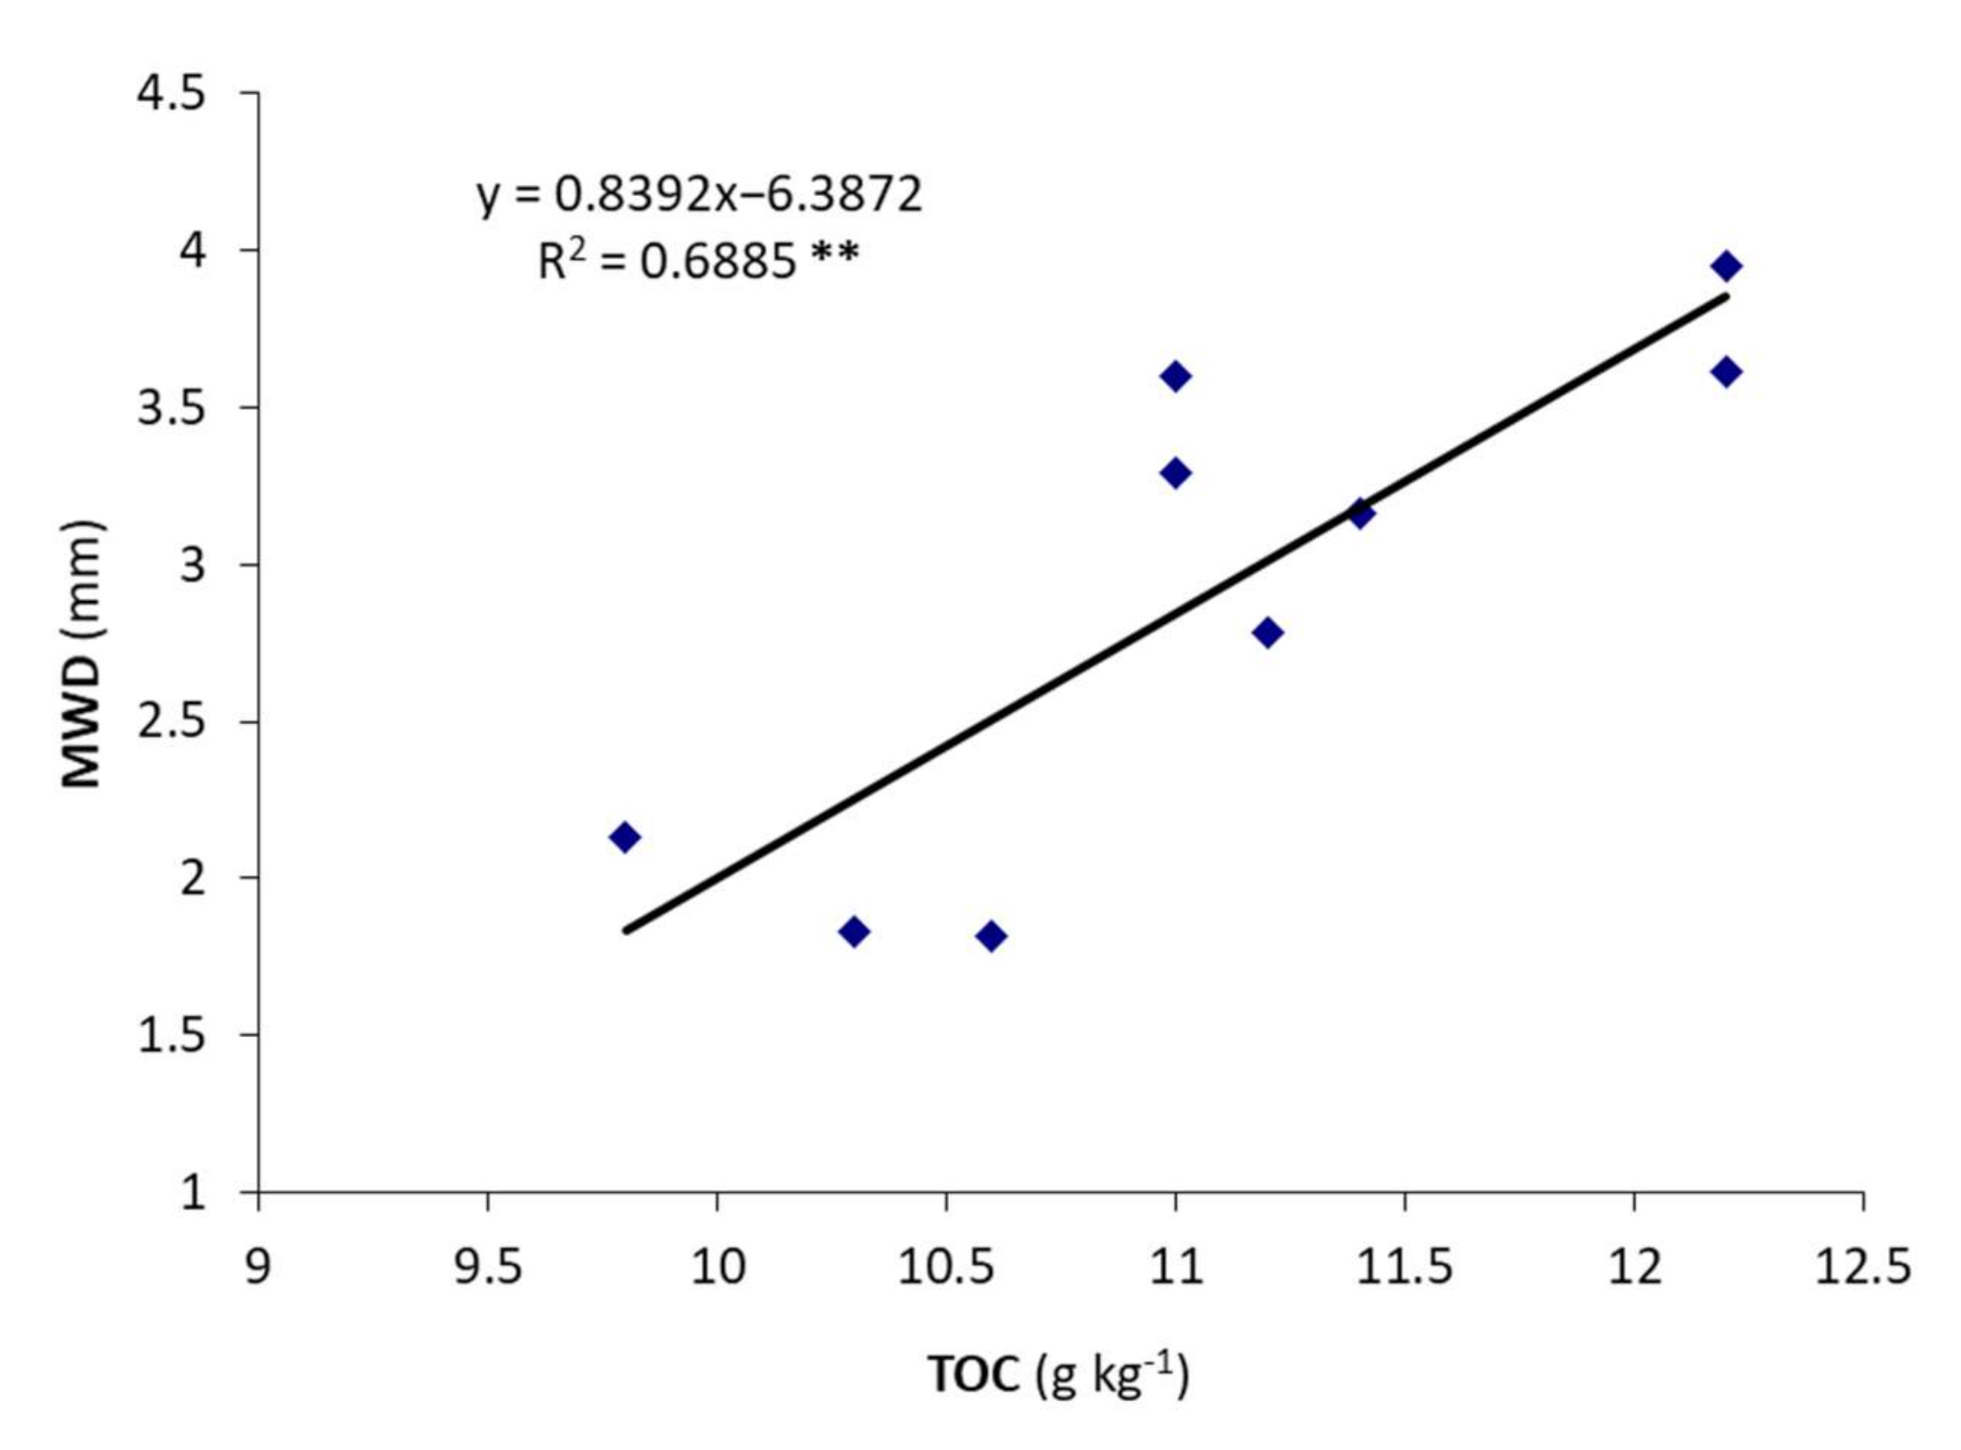
From our results, digestate application in a three-year maize-triticale rotation cycle proved to be as effective as 100% mineral fertilization in maintaining crop productivity level. Moreover, the increase in soil TOC following digestate treatments confirmed digestate effectiveness to compensate for carbon depletion.
Further research is needed to increase the knowledge about the optimum dose of digestate to be applied in relation to soil/crop specificities and the best application method to minimize potential negative effects of digestate to the soil and environment quality. The pattern and extent with which the effects of digestate treatments were expressed and their temporal fluctuations underline complex dynamics of chemical, physical and biological processes affecting the material brought to the soil. This suggests that a more or less long period of time is needed during which the achievement of a new stable equilibrium in the soil functions is regulated by the interaction between the amount and quality of biomass supplied, the impact of mechanical operations associated with crop management and climate trend.
Further expected benefits from digestate as amendment, such as improvement of soil bulk density and porosity, were not observed, possibly due to a counteracting interference of soil tillage operations. The effectiveness of a soil amendment and the sustainability of the use of digestate can be strongly conditioned by the crop management system as a whole, and in particular, by those cultivation practices that have a direct impact on the soil and the dynamics of the organic matter and nutrients supplied with the treatment. For this reason, to fully exploit digestate potential, its use should be integrated within an overall more conservative soil management system, involving reduced soil mechanical disturbance. This would be essential to prevent soil physical degradation and excessive organic matter mineralization, thus allowing the organic compounds of digestate to perform their chemical, physical and biological functions and minimize the risk of N loss by leaching and/or gas emissions.
Additional considerations regard the cultivation of energy crops in marginal lands or set-aside areas; this could be a solution to the “food vs. fuel conflict” and, at the same time, would promote rural investments and new job opportunities.

Supplementary Materials

The following are available online at https://0-www-mdpi-com.brum.beds.ac.uk/2076-3417/11/2/750/s1. References [81,82,83,84,85,86,87,88,89,90,91,92,93,94] are cited in the supplementary materials.

Author Contributions

Conceptualization, R.P., G.V., A.L., A.F. and N.V.; formal analysis, R.P., G.V., A.L., S.S. and N.V.; investigation, R.P., G.V., A.L. and N.V.; resources, M.Z.; data curation, R.P., G.V., A.L. and N.V.; writing—original draft preparation, R.P., G.V., A.L. and N.V.; writing—review and editing, R.P., G.V., A.L. and N.V. All authors have read and agreed to the published version of the manuscript.

Funding

This study was supported by the Italian Ministry of Agriculture (BIOMASSVAL project).

Institutional Review Board Statement

Not applicable.

Informed Consent Statement

Not applicable.

Data Availability Statement

Data is contained within the article or supplementary material.

Acknowledgments

We acknowledge the technical support of Azienda Agraria R.G.R. that hosts the field experiment and the CAT cooperative that supplies the digestate. In particular, we greatly acknowledge Gabriele Santi, president of CAT, that coordinated the agronomic management of the field trial. The technical work during sampling of Raimondo Piccolo and Ilaria Secciani is highly appreciated.

Conflicts of Interest

The authors declare no conflict of interest.

References

  1. Beurskens, L.W.M.; Hekkenberg, M. Renewable Energy Projections as Published in the National Renewable Energy Action Plans of the European Member States; ECN/European Environment Agency: Petten, NL, USA, 2011. [Google Scholar]
  2. European Biogas Association (EBA). Biogas Success Stories 2020; Renewable Energy House: Brussels, Belgium, 2020; Available online: https://www.europeanbiogas.eu/biogas-success-stories-2020 (accessed on 1 December 2020).
  3. International Renewable Energy Agency (IRENA). Renewable Energy Statistics. 2020. Available online: https://www.irena.org/publications/2020/Jul/Renewable-energy-statistics-2020 (accessed on 1 December 2020).
  4. Italian Biogas Consortium (CIB). ISAAC-PROJECT. Deliverable D2.1. State of the Art and Best Practices Collection. 2017. Available online: https://andrianeparla.it/wp-content/uploads/2017/05/D2.2-State-of-the-art-and-best-practices-collection.pdf (accessed on 1 December 2020).
  5. Barbera, E.; Menegon, S.; Banzato, D.; D’Alpaos, C.; Bertucco, A. From biogas to biomethane: A process simulation-based techno-economic comparison of different upgrading technologies in the Italian context. Renew. Energy 2019, 135, 663–673. [Google Scholar] [CrossRef]
  6. Schievano, A.; D’Imporzano, G.; Orzi, V.; Colombo, G.; Maggiore, T.; Adani, F. Biogas from dedicated energy crops in Northern Italy, Electric energy generation costs. GCB Bioenergy 2015, 7, 899–908. [Google Scholar] [CrossRef] [Green Version]
  7. Braun, R.; Weiland, P.; Wellinger, A. Biogas from Energy Crop Digestion; International Energy Agency (IEA) Bioenergy; Task 37, Energy from Biogas. 2010. Available online: https://www.iea-biogas.net (accessed on 1 December 2020).
  8. Murphy, J.D.; Braun, R.; Weiland, P.; Wellinger, A. Update Biogas from Crop Digestion; International Energy Agency (IEA) Bioenergy; Task 37, Energy from Biogas. 2011. Available online: https://www.iea-biogas.net (accessed on 1 December 2020).
  9. Smeets, E.M.W.; Faaij, A.P.C.; Lewandowski, I.M.; Turkenburg, W.C. A bottom-up assessment and review of global bioenergy potentials to 2050. Prog. Energy Combust. Sci. 2007, 33, 56–106. [Google Scholar] [CrossRef] [Green Version]
  10. Fuchs, W.; Drosg, B. Assessment of the state of the art of technologies for the processing of digestate residue from anaerobic digesters. Water Sci. Technol. 2013, 67, 1984–1993. [Google Scholar] [CrossRef] [Green Version]
  11. Gijzen, H.J. Anaerobic digestion for sustainable development, a natural approach. Water Sci. Technol. 2002, 45, 321–328. [Google Scholar] [CrossRef]
  12. Teglia, C.; Tremier, A.; Martel, J.L. Characterization of solid digestates, Part 1; review of existing indicators to assess solid digestates agricultural use. Waste Biomass Valori. 2011, 2, 43–58. [Google Scholar] [CrossRef]
  13. Möller, K.; Müller, T. Effects of anaerobic digestion on digestate nutrient availability and crop growth, a review. Eng. Life Sci. 2012, 12, 242–257. [Google Scholar] [CrossRef]
  14. Diacono, M.; Persiani, A.; Testani, F.; Ciaccia, C. Recycling agricultural wastes and by-products in organic farming: Biofertilizer production, yield performance and carbon footprint analysis. Sustainability 2020, 11, 3824. [Google Scholar] [CrossRef] [Green Version]
  15. Svensson, K.; Odlare, M.; Pell, M. The fertilizing effect of compost and biogas residues from source separated household waste. J. Agric. Sci. 2004, 142, 461–467. [Google Scholar] [CrossRef]
  16. Al Seadi, T.; Lukehurst, C. Quality Management of Digestate from Biogas Plants Used as Fertiliser; International Energy Agency (IEA) Bioenergy; Task 37: Energy from Biogas. 2012. Available online: http://www.iea-biogas.net (accessed on 1 December 2020).
  17. Drosg, B.; Fuchs, W.; Al Seadi, T.; Madsen, M.; Linke, B. Nutrient Recovery by Biogas Digestate Processing; International Energy Agency (IEA) Bioenergy; Task 37, Energy from Biogas. 2015. Available online: http://www.iea-biogas.net (accessed on 1 December 2020).
  18. Karp, A.; Halford, N.G. Energy crops, introduction. In Energy Crops; Karp, A., Halford, N.G., Eds.; The Royal Society of Chemistry: Cambridge, UK, 2010; pp. 1–12. [Google Scholar]
  19. González-García, S.; Bacenetti, J.; Negri, M.; Fiala, M.; Arroja, L. Comparative environmental performance of three different annual energy crops for biogas production in Northern Italy. J. Clean. Prod. 2013, 43, 71–83. [Google Scholar] [CrossRef]
  20. Sims, R.E.H.; Hastings, A.; Schlamadinger, B.; Taylors, G.; Smith, P. Energy crops, current status and future prospects. Glob. Chang. Biol. 2006, 12, 2054–2076. [Google Scholar] [CrossRef]
  21. Lukehurst, C.T.; Frost, P.; Al Seadi, T. Utilisation of Digestate from Biogas Plants as Biofertiliser; International Energy Agency (IEA) Bioenergy; Task 37, Energy from Biogas. 2010. Available online: http://www.iea-biogas.net (accessed on 1 December 2020).
  22. Tambone, F.; Genevini, P.; D’Imporzano, G.; Adani, F. Assessing amendment properties of digestate by studying the organic matter composition and the degree of biological stability during the anaerobic digestion of the organic fraction of MSW. Bioresour. Technol. 2009, 100, 3140–3142. [Google Scholar] [CrossRef]
  23. Nkoa, R. Agricultural benefits and environmental risks of soil fertilization with anaerobic digestates, a review. Agron. Sustain. Dev. 2014, 34, 473–492. [Google Scholar] [CrossRef] [Green Version]
  24. Béghin-Tanneau, R.; Guérin, F.; Guiresse, M.; Kleiber, D.; Scheiner, J.D. Carbon sequestration in soil amended with anaerobic digested matter. Soil Till. Res. 2019, 192, 87–94. [Google Scholar] [CrossRef]
  25. Nyberg, K. Impact of Organic Waste Residues on Structure and Function of Soil Bacterial Communities. Ph.D. Thesis, Swedish University of Agricultural Sciences, Uppsala, Sweden, 2006. [Google Scholar]
  26. Alburquerque, J.A.; de la Fuente, C.; Ferrer-Costa, A.; Carrasco, L.; Cegarra, J.; Abad, M.; Bernal, M.P. Assessment of the fertiliser potential of digestates from farm and agroindustrial residues. Biomass Bioenerg. 2012, 40, 181–189. [Google Scholar] [CrossRef]
  27. Frøseth, R.B.; Bakken, A.K.; Bleken, M.A.; Riley, H.; Pommeresche, R.; Thorup-Kristensen, K.; Hansen, S. Effects of green manure herbage management and its digestate from biogas production on barley yield; N recovery; Soil structure and earthworm populations. Eur. J. Agron. 2014, 52, 90–102. [Google Scholar] [CrossRef] [Green Version]
  28. Möller, K. Effects of anaerobic digestion on soil carbon and nitrogen turnover; N emissions; and soil biological activity. A review. Agron. Sustain. Dev. 2015, 35, 1021–1041. [Google Scholar] [CrossRef]
  29. Galvez, A.; Sinicco, T.; Cayuela, M.L.; Mingorance, M.D.; Fornasier, F.; Mondini, C. Short term effects of bioenergy by-products on sol C and N dynamics; Nutrient availability and biochemical properties. Agric. Ecosyst. Environ. 2012, 160, 3–14. [Google Scholar] [CrossRef]
  30. Grigatti, M.; Boanini, E.; Cavani, L.; Ciavatta, C.; Marzadori, C. Phospohorus in digestate-based compost, chemical speciation and plant availability. Waste Biomass Valori. 2015, 6, 481–493. [Google Scholar] [CrossRef]
  31. Beni, C.; Servadio, P.; Marconi, S.; Neri, U.; Aromolo, R.; Diana, G. Anaerobic digestate administration, effect on soil physical and mechanical behavior. Comm. Soil Sci. Plant Anal. 2012, 43, 821–834. [Google Scholar] [CrossRef]
  32. Walsh, J.J.; Rousk, J.; Edward-Jones, G.; Jones, D.L.; Williams, A.P. Fungal and bacterial growth following the application of slurry and anaerobic digestate of livestock manure to temperate pasture soil. Biol. Fertil. Soils 2012, 48, 889–897. [Google Scholar] [CrossRef]
  33. Bachmann, S.; Gropp, M.; Eichler-Löbermann, E. Phosphorus availability and soil microbial activity in 3 year field experiment amended with digested dairy slurry. Biomass Bioenerg. 2014, 70, 429–439. [Google Scholar] [CrossRef]
  34. Pulvirenti, A.; Ronga, D.; Zaghi, M.; Tomasselli, A.R.; Mannella, L.; Pecchioni, N. Pelleting is a successful method to eliminate the presence of Clostridium spp. From digestate of biogas plants. Biomass Bioenerg. 2015, 81, 479–482. [Google Scholar] [CrossRef]
  35. FAO. Guidelines for Soil Description, 4th ed.; Food and Agriculture Organisation (FAO): Rome, Italy, 2006. [Google Scholar]
  36. Gessa, C.; Ciavatta, C. Complesso di scambio. In Metodi di Analisi Chimica del Suolo. Ministero per le Politiche Agricole e Forestali; Angeli, F., Ed.; Osservatorio Nazionale Pedologico e per la Qualità del Suolo: Milano, Italy, 2000; pp. 1–31. [Google Scholar]
  37. Lindsay, W.L.; Norvell, W.A. Development of a DTPA soil test for zinc; iron; manganese and copper. Soil Sci. Soc. Am. J. 1978, 42, 421–428. [Google Scholar] [CrossRef]
  38. Vance, E.D.; Brookes, P.C.; Jenkinson, D.S. An extraction method for measuring soil microbial biomass C. Soil Biol. Biochem. 1987, 19, 703–707. [Google Scholar] [CrossRef]
  39. Badalucco, L.; Grego, S.; Dell’Orco, S.; Nannipieri, P. Effect of liming on some chemical; biochemical and micro-biological properties of acid soil under spruce (Picea abies L.). Biol. Fertil. Soils 1992, 14, 76–83. [Google Scholar] [CrossRef]
  40. Pastorelli, R.; Piccolo, R.; Cocco, S.; Landi, S. mRNA recovery and denitrification gene expression in clay-soil bacterial communities under different agricultural managements. Agrochimica 2010, 54, 179–192. [Google Scholar]
  41. Pastorelli, R.; Piccolo, R.; Landi, S. Changes in active microbial soil communities in agricultural managements, from anthropic to natural. Agrochimica 2009, 53, 386–397. [Google Scholar]
  42. Lazzaro, L.; Giuliani, C.; Fabiani, A.; Agnelli, A.E.; Pastorelli, R.; Lagomarsino, A.; Benesperi, R.; Calamassi, R.; Foggi, B. Soil and plant changing after invasion, the case of Acacia dealbata in a Mediterranean ecosystem. Sci. Total Environ. 2014, 497, 491–498. [Google Scholar] [CrossRef]
  43. Pastorelli, R.; Landi, S.; Trabelsi, D.; Piccolo, R.; Mengoni, A.; Bazzicalupo, M.; Pagliai, M. Effects of soil management on structure and activity of denitrifying bacterial communities. Appl. Soil Ecol. 2011, 49, 46–58. [Google Scholar] [CrossRef]
  44. Gee, G.W.; Bauder, J.W. Particle-size analysis. In Methods of Soil Analysis. Part 1; Physical and Mineralogical Methods, 2nd ed.; Klute, A., Ed.; Agron Monogr 9; ASA: Madison, WI, USA, 1986; pp. 383–411. [Google Scholar]
  45. Blake, G.R.; Hartge, K.H. Bulk density. In Methods of Soil Analysis. Part 1; Physical and Mineralogical Methods, 2nd ed.; Klute, A., Ed.; Agron. Monogr 9; Soil Science Society of America: Madison, WI, USA, 1986; pp. 363–375. [Google Scholar]
  46. Pagliai, M.; Vignozzi, N. Image analysis and microscopic techniques to characterize soil pore system. In Physical Methods in Agriculture—Approach to Precision and Quality; Blahovec, J., Kutilek, M., Eds.; Springer: Boston, MA, USA, 2002; pp. 13–38. [Google Scholar]
  47. Greenland, D.J.; Pereira, H.C. Soil damage by intensive arable cultivation, temporary or permanent? Phil. Trans. R. Soc. B 1977, 281, 193–208. [Google Scholar] [CrossRef]
  48. Kemper, W.D.; Rosenau, R.C. Aggregate stability and size distribution. In Methods of Soil Analysis. Part 1; Physical and Mineralogical Methods, 2nd ed.; Klute, A., Ed.; Agron. Monogr. 9; Soil Science Society of America: Madison, WI, USA, 1986; pp. 425–442. [Google Scholar]
  49. Hammer, Ø.; Harper, D.A.T.; Ryan, P.D. PAST: Palaeontological statistics software package for education and data analysis. Palaeontol. Electron. 2001, 4.1, 9. [Google Scholar]
  50. Wright, E.S. DECIPHER: Harnessing local sequence context to improve protein multiple sequence alignment. BMC Bioinform. 2015, 16, 322. [Google Scholar] [CrossRef] [PubMed] [Green Version]
  51. Webster, N.S.; Taylor, M.W.; Behnam, F.; Lucker, S.; Rattei, T.; Whalan, S.; Horn, M.; Wagner, M. Deep sequencing reveals exceptional diversity and modes of transmission for bacterial sponge symbionts. Environ. Microbiol. 2010, 12, 2070–2082. [Google Scholar] [CrossRef] [PubMed] [Green Version]
  52. McLachlan, K.L.; Chong, C.; Vorony, R.P.; Liu, H.W.; Holbein, B.E. Assessing the potential phytotoxicity of digestate during processing of municipal solid waste by anaeroboic digestion; a comparison to aerobic digestion. Acta Hort. 2004, 638, 225–230. [Google Scholar] [CrossRef]
  53. Pagliai, M. Soil porosity aspects. Int. Agrophys. 1988, 4, 215–232. [Google Scholar]
  54. Kan, Z.R.; Virk, A.L.; He, C.; Liu, Q.Y.; Qi, J.Y.; Dang, Y.P.; Zhao, X.; Zhang, H.L. Characteristics of carbon mineralization and accumulation under long-term conservation tillage. Catena 2020, 193, 104636. [Google Scholar] [CrossRef]
  55. Kögel-Knabner, I. The macromolecular organic composition of plant and microbial residues as inputs to soil organic matter. Soil Biol. Biochem. 2002, 34, 139–162. [Google Scholar] [CrossRef]
  56. Erhart, E.; Siegl, T.; Bonell, M.; Unterfrauner, H.; Peticzka, R.; Ableidinger, C.; Haas, D.; Hartl, W. Fertilization with liquid digestate in organic farming—Effects on humus balance; soil potassium contents and soil physical properties. Geophys. Res. Abstr. 2014, 16, 4419. [Google Scholar]
  57. Maucieri, C.; Nicoletto, C.; Caruso, C.; Sambo, P.; Borin, M. Effects of digestate solid fraction fertilisation on yield and soil carbon dioxide emission in a horticulture succession. Ital. J. Agron. 2017, 12, 116–123. [Google Scholar] [CrossRef] [Green Version]
  58. Sikora, L.J.; Stott, D.E. Soil organic carbon and nitrogen. In Methods for Assessing Soil Quality; Doran, J.W., Jones, A.J., Eds.; Soil Science Society of America: Madison, WI, USA, 1997; Volume 49, pp. 157–167. [Google Scholar]
  59. Abbruzzini, T.; Oliveira Zenero, M.; de Andrade, P.; Dini Andreote, F.; Campo, J.; Pellegrino Cerri, C. Effects of biochar on the emissions of greenhouse gases from sugarcane residues applied to soils. Agric. Sci. 2017, 8, 869–886. [Google Scholar] [CrossRef] [Green Version]
  60. Muhayodin, F.; Fritze, A.; Rotter, V.S. A review on the fate of nutrients and enhancement of energy recovery from rice straw through anaerobic digestion. Appl. Sci. 2020, 10, 2047. [Google Scholar] [CrossRef] [Green Version]
  61. Sharpley, A.N. Effect of soil pH on cation and anion solubility. Commun. Soil Sci. Plant Anal. 1991, 22, 827–841. [Google Scholar] [CrossRef]
  62. Rivenshield, A.; Bassuk, N. Using organic amendments to decrease bulk density and increase macroporosity in compacted soils. Arboric. Urban For. 2007, 33, 140–146. [Google Scholar]
  63. Emerson, W.W.; Foster, R.C.; Oades, J.M. Organo-mineral complexes in relation to soil aggregation and structure. In Interactions of Soil Minerals with Natural Organics and Microbes; Huang, P.M., Schnitzer, M., Eds.; Soil Science Society of America: Madison, WI, USA, 1986; Volume 17, pp. 521–548. [Google Scholar] [CrossRef]
  64. Pagliai, M.; Vignozzi, N.; Pellegrini, S. Soil structure and the effect of management practices. Soil Tillage Res. 2004, 79, 131–143. [Google Scholar] [CrossRef]
  65. Bronick, C.J.; Lal, R. Soil structure and management, a review. Geoderma 2005, 124, 3–22. [Google Scholar] [CrossRef]
  66. Tisdall, J.M.; Oades, J.M. Organic-matter and water-stable aggregates in soils. J. Soil Sci. 1982, 33, 141–163. [Google Scholar] [CrossRef]
  67. Erktan, A.; Cécillon, L.; Graf, F.; Roumet, C.; Legout, C.; Rey, F. Increase in soil aggregate stability along a Mediterranean successional gradient in severely eroded gully bed ecosystems, combined effects of soil; root traits and plant community characteristics. Plant Soil 2015, 398, 121–137. [Google Scholar] [CrossRef]
  68. Le Bissonnais, Y.; Arrouays, D. Aggregate stability and assessment of soil crustability and erodibility, II. Application to humic loamy soils with various organic carbon contents. Eur. J. Soil Sci. 1997, 48, 39–48. [Google Scholar] [CrossRef]
  69. Terhoeven-Urselmans, T.; Scheller, E.; Raubuch, M.; Ludwig, B.; Joergensen, B.G. CO2 evolution and N mineralization after biogas slurry application in the field and its yield effects on spring barley. Appl. Soil Ecol. 2009, 42, 297–302. [Google Scholar] [CrossRef]
  70. Herrmann, A. Biogas production from maize, current state; challenges and prospects. 2. Agronomic and environmental aspects. Bioenerg. Res. 2013, 6, 372–387. [Google Scholar] [CrossRef]
  71. Chen, R.; Blagodatskaya, E.; Senbayram, M.; Blagodatsky, S.; Myachina, O.; Dittert, K.; Kuzyakov, Y. Decomposition of biogas residues in soil and their effects on microbial growth kinetics and enzyme activities. Biomass Bioenerg. 2012, 45, 221–229. [Google Scholar] [CrossRef]
  72. Girvan, M.S.; Campbell, C.D.; Killham, K.; Prosser, J.I.; Glover, L.A. Bacterial diversity promotes community stability and functional resilience after perturbation. Environ. Microbiol. 2005, 7, 301–313. [Google Scholar] [CrossRef] [PubMed]
  73. Calbrix, R.L.; Barray, S.; Chabrerie, O.; Fourrie, L.; Laval, K. Impact of organic amendments on the dynamics of soil microbial biomass and bacterial communities in cultivated land. Appl. Soil Ecol. 2007, 35, 511–522. [Google Scholar] [CrossRef]
  74. Nannipieri, P.; Ascher, J.; Ceccherini, M.T.; Landi, L.; Pietramellara, G.; Renella, G. Microbial diversity and soil functions. Eur. J. Soil Sci. 2003, 54, 655–670. [Google Scholar] [CrossRef]
  75. Tatti, E.; Decorosi, F.; Viti, C.; Giovannetti, L. Despite long-term compost amendment seasonal changes are main drivers of soil fungal and bacterial population dynamics in a Tuscan vineyard. Geomicrobiol. J. 2012, 29, 506–519. [Google Scholar] [CrossRef]
  76. Johansen, A.; Carter, M.S.; Jensen, E.S.; Hauggard-Nielsen, H.; Ambus, P. Effects of digestate from anaerobically digested cattle slurry and plant materials on soil microbial community and emission of CO2 and N2O. Appl. Soil Ecol. 2013, 63, 36–44. [Google Scholar] [CrossRef]
  77. Pivato, A.; Vanin, S.; Raga, R.; Lavagnolo, M.C.; Barausse, A.; Rieple, A.; Laurent, A.; Cossu, R. Use of digestate from a decentralized on-farm biogas plant as fertilizer in soils, An ecotoxicological study for future indicators in risk and life cycle assessment. Waste Manag. 2016, 49, 378–389. [Google Scholar] [CrossRef]
  78. Negri, M.; Bacenetti, J.; Brambilla, M.; Manfredini, A.; Cantore, A.; Bocchi, S. Biomethane production from different crop systems of cereals in Northern Italy. Biomass Bioenerg. 2014, 63, 321–329. [Google Scholar] [CrossRef]
  79. Badagliacca, G.; Petrovičovà, B.; Pathan, S.I.; Roccotelli, A.; Romeo, M.; Monti, M.; Gelsomino, A. Use of solid anaerobic digestate and no-tillage practice for restoring the fertility status of two Mediterranean orchard soils with contrasting properties. Agric. Ecosyst. Environ. 2020, 300, 107010. [Google Scholar] [CrossRef]
  80. Von Cossel, M.; Wagner, M.; Lask, J.; Magenau, E.; Bauerle, A.; Von Cossel, V.; Warrach-Sagi, K.; Elbersen, B.; Staritsky, I.; Van Eupen, M.; et al. Prospects of bioenergy cropping systems for a more social-ecologically sound bioeconomy. Agronomy 2019, 9, 605. [Google Scholar] [CrossRef] [Green Version]
  81. Springer, U.; Klee, J. Prufung der leistungsfahigkeit von einigen wichtigeren verfahren zur bestimming des kohlemstoffs mittels chromschwefelsaure sowie vorschlag einer neuen schnellmethode. Pflanz. Dueng Bodenkd 1954, 64, 1. [Google Scholar] [CrossRef]
  82. Bremner, J.M.; Mulvaney, C.S. Nitrogen-total. In Methods of Soil Analysis. Part 2. Chemical and Microbio-Logical Properties; Page, A.L., Miller, R.H., Keeney, D.R., Eds.; Soil Science Society of America: Madison, WI, USA, 1982; pp. 595–624. [Google Scholar]
  83. Anderson, J.M.; Ingram, J.S.I. Tropical Soil Biology and Fertility, A Handbook of Methods; CAB International: Oxford, UK, 1993. [Google Scholar]
  84. Murphy, J.; Riley, J.P. A modified single solution method for determination of phosphate in natural waters. Anal. Chim. Acta 1962, 27, 31–36. [Google Scholar] [CrossRef]
  85. Tabatabai, M.; Bremner, J. Arylsulfatase activity of soils. Soil Sci. Soc. Am. J. 1970, 34, 225–229. [Google Scholar] [CrossRef]
  86. Nübel, U.; Engelen, B.; Felske, A.; Snairdr, J.; Wieshuber, A.; Amann, R.I.; Ludwig, W.; Backhaus, H. Sequence heterogeneities of genes encoding 16S rRNAs in Paenibacillus polymyxa detected by temperature gradient gel electrophoresis. J. Bacteriol. 1996, 178, 5636–5643. [Google Scholar] [CrossRef] [Green Version]
  87. Vainio, E.J.; Hantula, J. Direct analysis of wood-inhabiting fungi using denaturing gradient gel electrophoresis of amplified ribosomal DNA. Mycol. Res. 2000, 8, 927–936. [Google Scholar] [CrossRef]
  88. Watanabe, T.; Kimura, M.; Asakawa, S. Community structure of methanogenic archaea in paddy field soil under double cropping (rice-wheat). Soil Biol. Biochem. 2006, 38, 1264–1274. [Google Scholar] [CrossRef]
  89. Hung, C.H.; Cheng, C.H.; Cheng, L.H.; Liang, C.M.; Lin, C.Y. Application of Clostridium-specific PCR primers on the analysis of dark fermentation hydrogen-producing bacterial community. Int. J. Hydrogen Energy 2008, 33, 1586–1592. [Google Scholar] [CrossRef]
  90. Green, T.R.; Popa, R. Turnover of carbohydrate-rich vegetal matter during microaerobic composting and after amendment in soil. Appl. Biochem. Biotechnol. 2011, 165, 270–278. [Google Scholar] [CrossRef] [Green Version]
  91. Shiratori, H.; Ikeno, H.; Ayame, S.; Kataoka, N.; Miya, A.; Hosono, K.; Beppu, T.; Ueda, K. Isolation and characterization of a new Clostridium sp. that performs effective cellulosic waste digestion in a thermophilic methanogenic bioreactor. Appl. Environ. Microbiol. 2006, 72, 3702–3709. [Google Scholar] [CrossRef] [Green Version]
  92. Zwielehner, J.; Liszt, K.; Handschur, M.; Lassl, C.; Lapin, A.; Haslberger, A.G. Combined PCR-DGGE fingerprinting and quantitative-PCR indicates shifts in fecal population sizes and diversity of Bacteroides; Bifidobacteria and Clostridium cluster IV in institutionalized elderly. Exp. Gerontol. 2009, 44, 440–446. [Google Scholar] [CrossRef] [PubMed]
  93. Van Dyke, M.I.; McCarthy, A.J. Molecular biological detection and characterization of Clostridium populations in municipal landfill sites. Appl. Environ. Microb. 2002, 68, 2049–2053. [Google Scholar] [CrossRef] [PubMed] [Green Version]
  94. Bagnouls, F.; Gaussen, H. Dry periods and vegetation. Comptes Rendus Hebd. Seances Acad. Sci. 1953, 236, 1075–1077. [Google Scholar]
Figure 1. Soil bulk density (BD; g cm−3) at 0–10 and 10–20 cm depth, under the different treatments and at the different sampling times.
Applsci 11 00750 g001
Figure 2. Soil macroporosity (pores size >50 µm) expressed as a percentage of area occupied by pores of different shape (regular, irregular and elongated pores) at 0–10 cm (A) and 10–20 cm (B) depth and at two different sampling times (t0 and t2). Different letters above bars indicate statistically significant differences between the % of fissures (elongated pores, size > 500 µm) in relation to the total macro-porosity; different letters inside the bars indicate significant differences within each shape or size class of pores at p ≤ 0.05 (Fisher LSD test).
Applsci 11 00750 g002
Figure 3. Soil aggregate stability as expressed by the mean weight diameter index (MWD; mm), under the different treatments and at the different sampling times. Different letters indicate statistically significant differences between treatments and sampling times at p ≤ 0.05 (Fisher LSD test).
Applsci 11 00750 g003
Figure 4. MDS ordination plots of bacterial 16S rDNA (A; stress = 0.218) and fungal 18S rDNA (B; stress = 0.282). Symbols: circle = D0 treatment; triangle = D50 treatment; square = D100 treatment. Colours: white = time t0; red = time t1; blue = time t2; black = time t3.
Applsci 11 00750 g004
Figure 5. Correlation between soil aggregate stability based on the mean weight diameter (MWD) and total organic carbon (TOC) (** p ≤ 0.01).
Applsci 11 00750 g005
Table 1. Relative seed germination index (GI) of maize under different digestate concentrations, expressed as the percentage of germinated seeds relative to the control GI (distilled water).
Digestate Concentration (%)GI (%)
SDWD
100(undiluted)57.034.9
50(1:2)75.675.6
25(1:4)84.984.9
12.5(1:8)104.781.4
SD = solid digestate; WD = whole digestate.
Table 2. Root length (mm) of maize seedlings after 1 week of incubation under different digestate concentrations (means followed by standard error in brackets). Different Latin letters within a column indicate statistically significant differences between digestate concentrations at p ≤ 0.05 (Fisher LSD test); different Greek letters within a row indicate statistically significant differences between digestate types at p ≤ 0.05 (Fisher LSD test).
Digestate Concentration (%)Root Length (mm)
SDWD
0(water)25.4 (1.8)ab 25.4 (1.8)a
100(undiluted)11.2 (1.5)dα3.6 (0.7)dβ
50(1:2)19.8 (2.1)cα12.3 (1.4)cβ
25(1:4)22.9 (2.0)bcα16.4 (1.5)bβ
12.5(1:8)30.5 (2.0)aα15.9 (1.8)bcβ
SD = solid digestate; WD = whole digestate.
Table 3. Maize and triticale above-ground biomass (t dry weight ha−1) under different experimental treatments (means followed by standard error in brackets).
MaizeTriticaleMaize
2010–20112011–20122012–2013
D022.1(1.0)12.7(0.4)11.9(2.3)
D5020.4(2.7)11.6(0.7)12.8(3.7)
D10019.6(1.2)11.9(0.4)8.8(2.2)
D0 = 100% N as urea; D50 = 50% N as urea + 50% N as WD; D100 = 100% N as WD.
Table 4. Soil total organic carbon (TOC), total nitrogen (TN) and C/N ratio under the different experimental treatments at different sampling times (means followed by standard error in brackets). Different letters indicate statistically significant differences at p ≤ 0.05 (Fisher LSD test).
TOCTNC/N
PlotsTimeg kg−1g kg−1
D0t010.6(0.2)abcd1.15(0.03)bcde9.2(0.1)abc
t111.2(0.4)abcd1.25(0.02)abcd9.0(0.2)abcd
t211.4(0.2)abc1.17(0.08)bcde9.8(0.6)a
t39.7(0.2)d1.10(0.01)de8.8(0.2)abcd
D50t09.8(0.8)cd1.07(0.08)e9.2(0.1)abc
t112.2(0.6)a1.28(0.08)ab9.6(0.2)ab
t211.0(0.5)abcd1.30(0.04)ab8.5(0.7)cd
t311.1(0.2)abcd1.26(0.03)abcd8.8(0.1)abcd
D100t010.3(0.9)bcd1.12(0.07)cde9.2(0.3)abc
t112.2(0.6)a1.27(0.03)abc9.5(0.2)ab
t211.0(0.3)abcd1.34(0.05)a8.2(0.2)d
t311.7(0.9)ab1.28(0.07)abc9.2(0.4)abc
D0 = 100% N as urea; D50 = 50% N as urea + 50% N as WD; D100 = 100% N as WD.
Table 5. Soil cation exchange capacity (CEC), exchangeable bases (K, Na, Mg, Ca) and available metal content (Cu, Zn, Fe, Mn) in the soil (depth = 0–20 cm) under different fertilization treatments (D0, D50, D100) and at different sampling times (t0, t1, t2) (means followed by standard error in brackets). Different letters indicate significant differences between soil samples at p ≤ 0.05 (Fisher LSD test).
CECKNaMgCaCuZnFeMn
Plots cmol(+) kg−1mg kg−1mg kg−1mg kg−1mg kg−1mg kg−1mg kg−1mg kg−1mg kg−1
D0t021.3(0.7)274.5(3.1)b20.6(2.1)bc196.6(8.9)3781.0(157.9)28.4(7.4)1.8(0.3)15(0.8)a16.6(1.4)a
t121.2(0.6)269.6(9.8)b24.1(1.5)abc207.8(7.4)3752.0(118.5)27.7(7.5)1.9(0.2)14.6(0.2)abc15.1(0.5)ab
t220.7(0.4)225.7(20.2)c15.9(1.6)d201.1(8.8)3691.9(74.4)27.5(7.7)1.7(0.3)14.0(0.7)bcd13.2(4.8)bc
D50t020.1(1.1)275.7(6.8)b25.9(4.1)abc212.3(46.2)3583.3(292.3)26.9(3.0)1.9(0.3)15.3(0.3)ab16.1(0.3)ab
t121.4(0.3)330.0(20.4)a29.9(2.2)a236.3(34.3)3705.2(73.1)25.1(1.6)1.9(0.3)14.2(0.6)abcd16.7(1.6)a
t221.0(0.4)220.0(12.2)c17.3(2.7)d200.3(27.2)3747.1(92.3)24.9(1.5)1.6(0.2)13.3(0.5)cd11.5(2.3)c
D100t021.3(0.2)285.7(12.7)b19.6(1.5)cd196.1(17.9)3788.5(20.2)28.9(6.0)1.6(0.1)15.0(0.3)ab16.1(1.0)ab
t121.1(0.7)328.8(11.1)a26.5(1.5)ab210.9(10.8)3683.6(131.0)27.8(6.2)2.2(0.3)14.4(0.7)abcd17.3(1.0)a
t220.9(0.1)216.9(12.2)c16.3(1.3)d192.8(15.2)3750.1(36.5)28.7(6.1)1.8(0.0)12.8(0.1)d10.2(0.4)c
D0 = 100% N as urea; D50 = 50% N as urea + 50% N as WD; D100 = 100% N as WD.
Table 6. Soil microbial biomass C (MCB), microbial N (MBN) and cumulative microbial respiration (MRcum) under different fertilization treatments (D0, D50, D100) and at different sampling times (t0, t1, t2) (means followed by standard error in brackets). Different letters indicate significant differences between soil samples at p ≤ 0.05 (Fisher LSD test).
MBCMBNMRcum
PlotsTimeµg g−1µg g−1µg C-CO2 g−1
D0t0159.8(27.4)ab20.1(8.1)abc426.5(28.1)b
t1135.5(23.7)ab32.4(6.6)ab424.4(15.9)b
t2157.5(26.6)ab7.0(2.7)c482.8(17.8)ab
D50t0137.1(10.1)ab19.8(1.7)abc443.0(26.8)ab
t1143.6(17.5)ab33.0(7.5)ab507.8(47.8)a
t2203.5(31.1)a16.2(3.7)c469.1(7.9)ab
D100t0133.3(32.5)b35.4(5.9)a462.2(21.3)ab
t1153.4(10.7)ab18.4(5.7)bc470.5(25.4)ab
t2174.4(14.4)ab11.8(2.4)c508.3(20.3)a
D0 = 100% N as urea; D50 = 50% N as urea + 50% N as WD; D100 = 100% N as WD.
Table 7. Summary of ANOSIM analysis based on 16S- and 18S-rDNA Dice similarity matrices. In the one-way ANOSIM groups were analysed independently (three digestate treatments vs. four sampling time), whereas the two factors (sampling time and digestate treatments) were analysed by a two-way analysis.
One-Way Global TestTwo-Way Crossed
Sampling TimeDigestate Treatment
DGGERPRPRP
16S-rDNA0.5750.00010.8220.00010.4480.0001
18S-rDNA0.6370.00010.8080.00010.2750.0009
Table 8. Summary of ANOSIM analysis based on the 16S-cDNA Dice similarity matrices. In the one-way ANOSIM groups were analysed independently (three fertilizer treatments vs. four sampling time), whereas the two factors (sampling time and fertilizer treatments) were analysed by a two-way analysis.
One-Way Global TestTwo-Way Crossed
Sampling TimeDigestate Treatment
DGGERPRPRP
t0 vs. t10.6860.00010.9010.00160.4670.0005
t0 vs. t20.4040.00010.4940.00320.2670.0050
Publisher’s Note: MDPI stays neutral with regard to jurisdictional claims in published maps and institutional affiliations.

