Nondestructive Evaluation of Aluminium Foam Panels Subjected to Impact Loading
by
 , , , and
Gabriella Epasto
1,* ,
,
Fabio Distefano
1 ,
,
Hozhabr Mozafari
2,
Emanoil Linul
3 and
and
Vincenzo Crupi
1
1
Department of Engineering, University of Messina, 98166 Messina, Italy
2
Department of Mechanical Engineering, University of Nebraska, Lincoln, NE 68588, USA
3
Department of Mechanics and Strength of Materials, Politehnica University of Timisoara, 300222 Timisoara, Romania
*
Author to whom correspondence should be addressed.
Appl. Sci. 2021, 11(3), 1148; https://0-doi-org.brum.beds.ac.uk/10.3390/app11031148
Submission received: 28 December 2020
/
Revised: 22 January 2021
/
Accepted: 25 January 2021
/
Published: 27 January 2021
(This article belongs to the Special Issue NondestructiveTesting in Composite Materials Ⅱ)
Abstract
:Featured Application
An innovative Metallic Foam Shell (MFS) protective device against flying ballast impact damage in railway axles was proposed by some of the authors. The next step of this research activity is the application of the proposed MFS protective device in offshore structures. The results of this study are useful for these applications.
Abstract
Aluminium foam sandwich structures have excellent energy absorption capacity, combined with good mechanical properties and low density. Some of the authors of this paper proposed an innovative Metallic Foam Shell protective device against flying ballast impact damage in railway axles. A closed-cell aluminium foam was chosen for the Metallic Foam Shell device. The main goal of this study was the experimental investigation of the impact responses of aluminium foam panels. Low velocity impact tests were carried out at different energies on different types of aluminium foam panels in order to investigate the effects of some parameters, such as core thickness, skin material and layer. Tests were conducted at repeated impacts on aluminium foam panels without and with skins made of aluminium and glass fibre-reinforced polymer. The experimental results were compared and the impacted panels were investigated by means of the nondestructive techniques ultrasonic phased array and digital radiography.
1. Introduction
Sandwich structures are widely used in the transportation industry (automotive, aerospace, shipbuilding industries) for their lightweight and crashworthiness ability, so it is necessary to assess their energy absorption capabilities [1,2]. The impact resistance of aluminium honeycomb [3,4,5] and foam [6,7,8,9] sandwich panels were investigated by means of low-velocity impact (LVI) tests. The comparison of the responses of different types of sandwich panels is reported in [10].
Composite foam sandwich panels were investigated for railway applications, for rail vehicle car bodies [11] and protective devices subjected to low-velocity impact of ballast projectiles [12], showing that such materials have the potential to enhance the impact strength of components in this field. Epasto et al. [13] proposed an innovative Metallic Foam Shell (MFS) protective device against flying ballast impact damage in railway axles. MFS protective device can absorb up to 90% of the initial impact energy with total protection of the axle. Closed-cell aluminium foams (AFs) were chosen by Epasto et al. [13] for MFS because they have interesting combinations of properties, such as being lightweight and having high energy absorption capacity.
The next step of this research activity was to study the application of the proposed MFS protective device in the offshore structures. Han et al. [14] compared the anticollision performance of four types of fenders (aluminium, rubber, AF–rubber and rubber–AF) with an offshore wind turbine (OWT) tripod impacted by a ship. They found that AF was the best choice for the fender. The authors observed that both the correct positioning of the AF inside the fender and the optimal thickness of the AF had beneficial effects compared to other materials, i.e., a positive influence on the anticollision protocol, making the tripod less exposed to damage and avoiding the progressive collapse of the ship during secondary disasters.
The AF applications in marine structures were described in detail in [15] and [16]. The main applications identified by the authors were helicopter-landing pads, floating navigation signs, components of fast patrol vessels or rescue boats, acoustic/thermal shielding of exhaust and transport containers for hazardous materials. In addition to the mentioned applications, a new foam containing fiberglass was proposed as a potential insulating material for onboard fire doors in shipbuilding [17]. Using the newly developed fiberglass-containing foam, the authors achieved a significant reduction of the thermal bridges for a thinner (37%) and lighter (61%) fire door than a traditional one (with rock-wool). In addition, they noticed that acoustic and mechanical properties increased with the use of this cellular material.
As reported in [9,14], ship and offshore structures may frequently suffer from repeated impact loadings during their service life, which are due to different reasons, such as helicopter wheel landings, ice floe impact, slamming on the bow, green water on the deck, sloshing and jet flow in liquefied natural gas (LNG) tank, collisions between supply vessels and offshore platforms. Consequently, the structural safety of marine structures under repeated impact loads attracted considerable attention [18,19]. Current studies of AF panels are mainly focused on the dynamic responses under single impact, whereas the dynamic response under repeated impacts was studied only in a few papers. Zhu et al. [20] and Guo et al. [21] conducted single and repeated impacts on aluminium foam sandwich (AFS) plates at room (20 °C) and low (−60 °C) temperatures. The authors observed that the single impact deflections of AFS plates at −60 °C were smaller compared to those obtained at 20 °C. They associated this decrease with the increase in AF yield stress at low temperatures. In the case of repeated impact tests, the absorbed energies and deflections of AFS plates at −60 °C were smaller than those at 20 °C. Moreover, the effect of temperature on the impact properties of the AFS plates became more obvious as the number of impacts increased.
The impact responses of AFS panels produced via the powder metallurgical (PM) route were previously studied by some of the authors [13]. The LVI tests were carried out at impact energy of 35 J on AFS panels with aluminium and glass fibre-reinforced polymer (GFRP) skins, and the following postmortem analyses were applied: visual testing (VT), computed tomography (CT), pulsed thermography (PT) and ultrasonic phased array (UPA) [13].
For further investigation, in comparison to the previous study [13], the authors considered other distinct types of AF panels. The main goal of this study was the experimental investigation of different types of AFS panels under single and repeated impact loading. The impact response of foam-based panels was compared with that of AFS with different types of external skins, namely, aluminium and GFRP skins. The LVI tests were carried out at different energies, ranging from low- (35 J) to high- (400 J) level impact energy, and the effects of several parameters were investigated, including core thickness, skin material and layer effects. Some tests were conducted at repeated impacts on AF panels without and with skins made of aluminium and GFRP. The impacted panels were investigated by means of the nondestructive techniques (NDT) UPA and digital radiography (DR).
Several studies exist in the literature about the applications of volumetric NDTs. Taheri et al. [22] compared the defect detection capability and sensitivity of the UPA method with conventional ultrasonic technique (UT), concluding that UPA was a promising method for detecting the size and location of defects in GFRP materials. Wang et al. [23] proposed a new, omnidirectional, near-field sampling, phased-array damage imaging method suitable for real-time damage detection in composite materials. Many studies applied different NDT methods, such as lock-in thermography (LT) [24,25], computed tomography [13], UPA [13,26] and radiography [27], to highlight advantages and limitations of the techniques in the detection of the damage for composite materials. CT was applied in the damage detection of AHS panels with GFRP skins [5] and aluminium skins [10,28]. Other studies [29,30] characterised composite materials subjected to impact tests, not only investigating the damaged area, but also the internal damage, including the internal structure and fibre breakage on the various layers of the composite structure. Hou et al. [31] analysed the challenge in the development of innovative computer-aided techniques for automatic detection from radiography images due to the limitation of human interpretation for this test method. Zhang et al. [32] applied a technique called adaptive threshold segmentation in radiography images to carry out defect segmentation by specifying the margin by which the target object was brighter than the background.
2. Materials and Methods
2.1. Materials
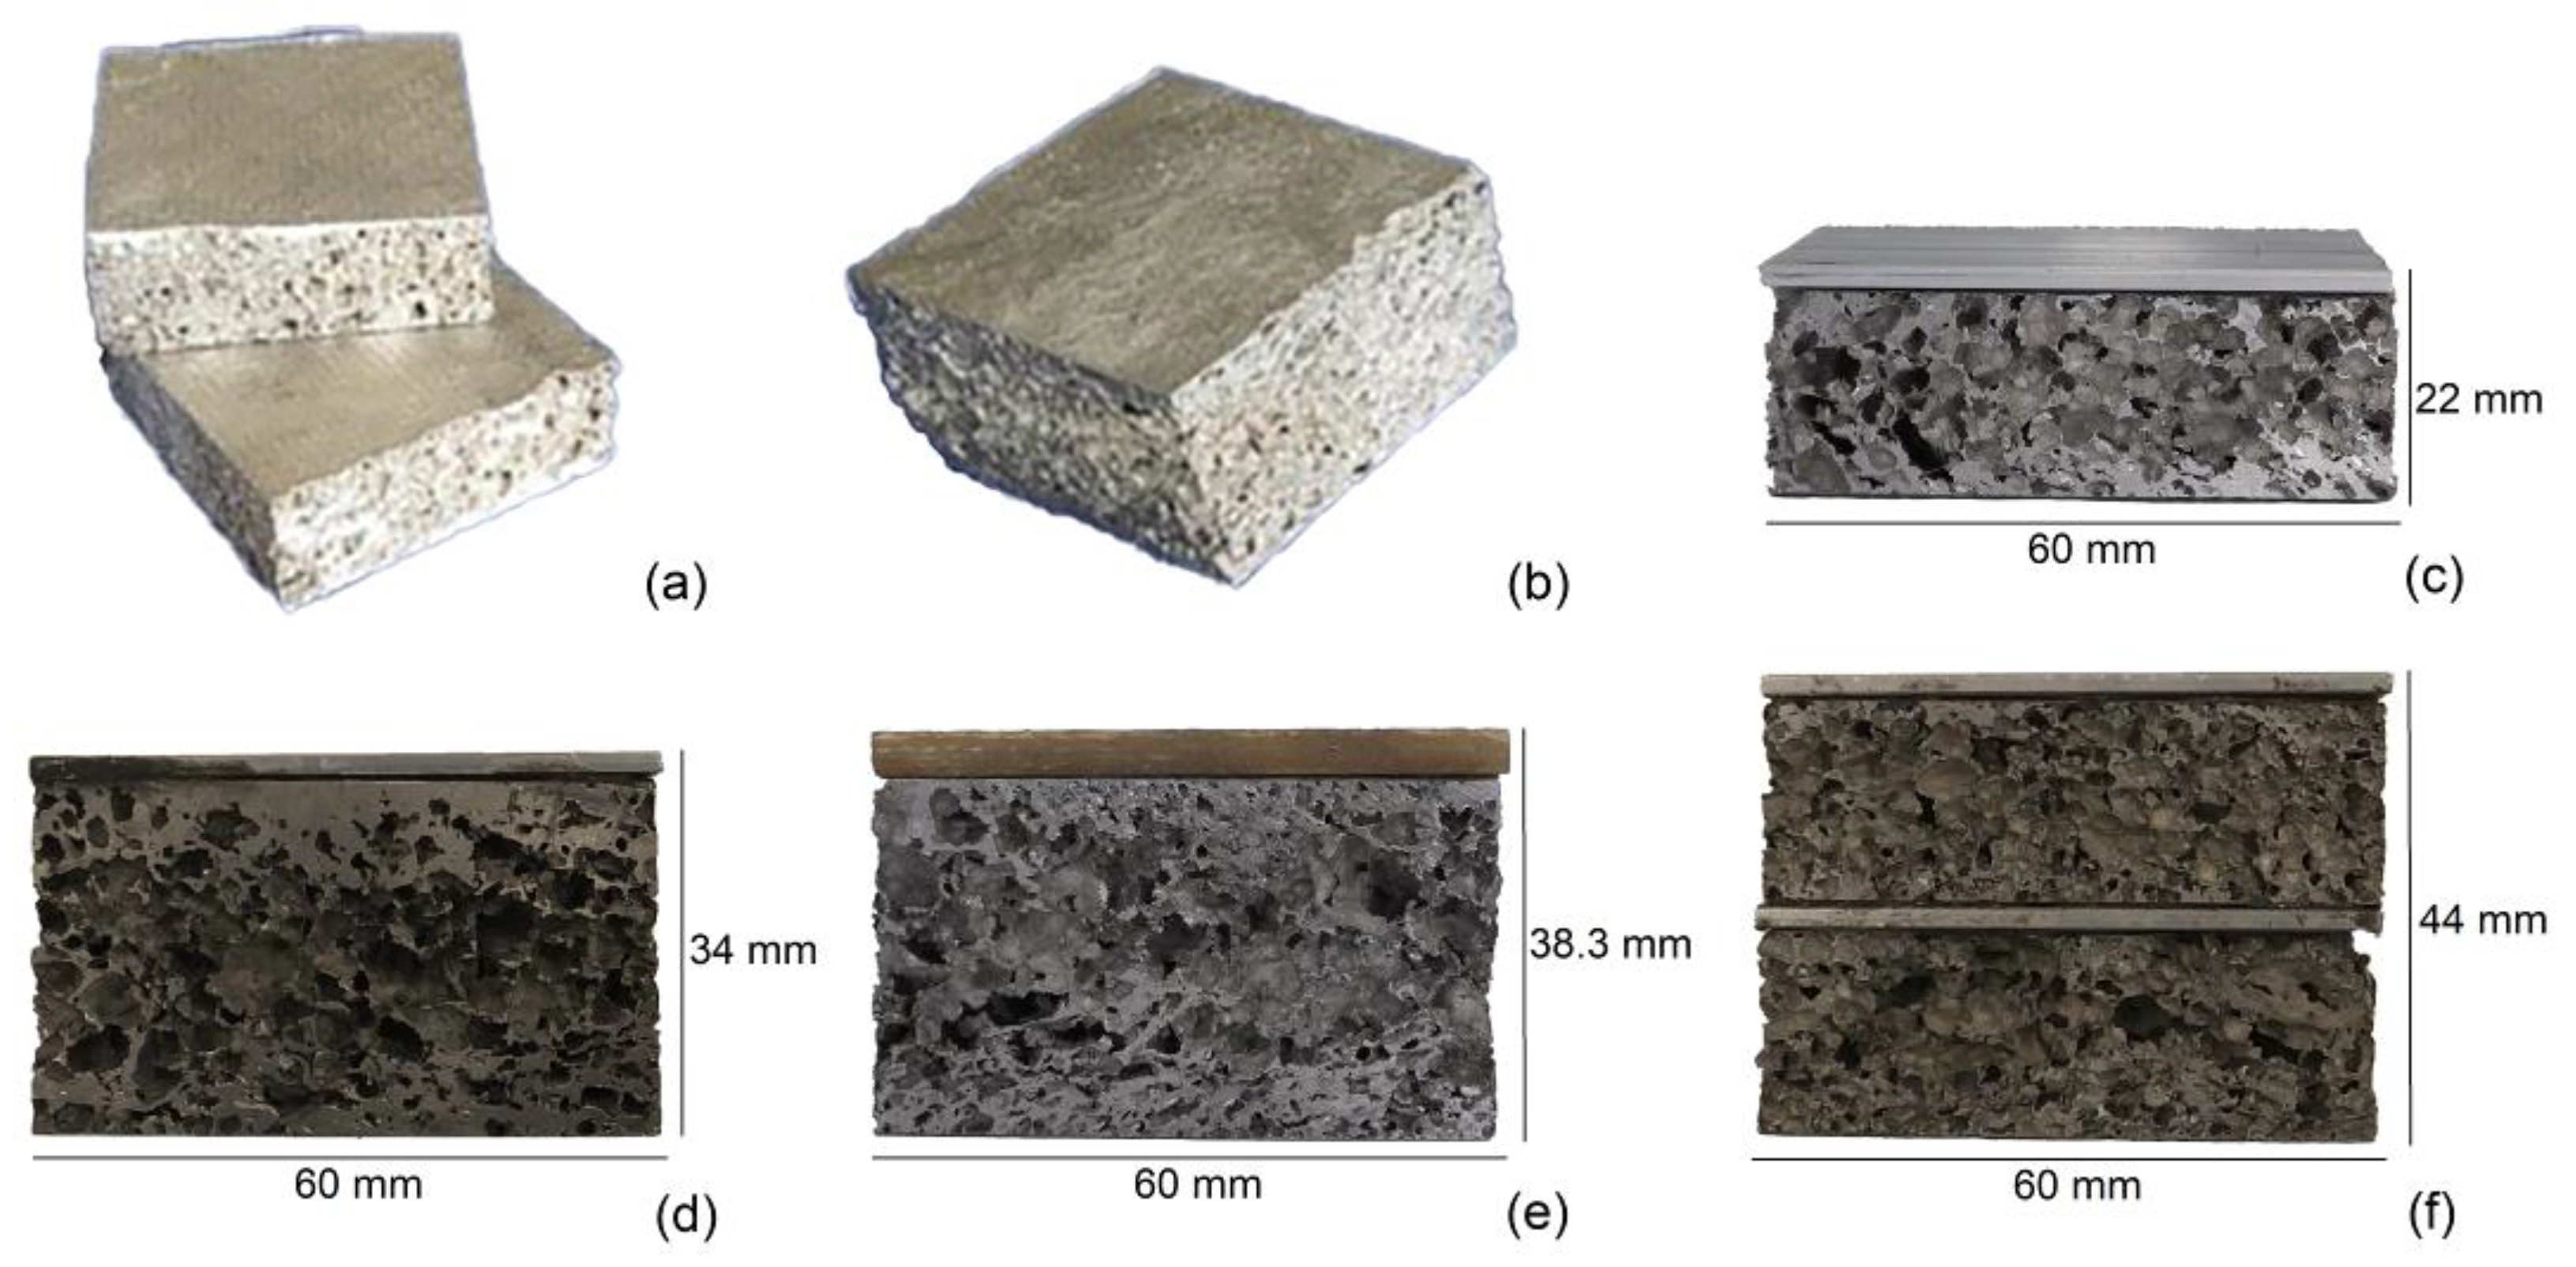
Several AF specimens with various thicknesses, foam densities and skin materials were produced to be used in the LVI tests. The chemical composition of the AF, produced by the powder metallurgical (PM) route, was 10 wt.% Si and Al balanced, while 0.4 wt.% of titanium hydride (TiH2) powder was used as the foaming agent via heating to 620 °C [33]. The matrix material (AlSi10) was an aluminium alloy with good physical, thermal and mechanical characteristics (density 2659 kg/m3, electrical resistivity 4.91 Μω·cm, thermal conductivity 110 W/m°C and tensile strength 379 MPa), together with excellent machinability properties. The density of the AF panels ranged from 400 to 640 kg/m3. The in-plane dimensions of the specimens were 60 mm × 60 mm. The specimens had two values of thickness, 20 mm and 34 mm. GFRP composite and aluminium alloy 6082 were used for the skins of AFS panels. The mechanical characteristics of GFRP and aluminium skins can be found in [13,34]. The mechanical properties of the GFRP skins were the following: ρ = 1328 kg/m3, E = 7500 MPa, σu = 80 MPa and εmax = 1.3%. The layup of GFRP skins, manufactured by hand layup, consisted of six layers according to the following stacking sequence: 2 MAT layers, 2 central layers oriented at 0° and 45° and 2 MAT layers. The central layers consisted of 0°/90° bidirectional fabrics. The total thickness of a GFRP skin was equal to 4.3 mm. The bidirectional fabrics had a specific weight of 400 g/m2 and the MAT layer had a specific weight of 225 g/m2. The fibre volume fraction was 0.55. The aluminium skin with total thickness of 2 mm was used in order to yield identical in-plane flexural stiffness with GFRP skin. The flexural stiffness D of both aluminium and GFRP was calculated in [13] by applying both Classical Lamination Theory and the Dietz approach [26]. Double-layer AFS panels were manufactured by applying epoxy adhesive provided by Teknica.
Six different types of AF panels, shown in Figure 1, were investigated by means of LVI tests:
- Type I: AF panels without external skins and with a 20 mm thickness;
- Type II: AF panels without external skins and with a 34 mm thickness;
- Type III: AFS panels with aluminium skins and with a 22 mm total thickness;
- Type IV: AFS panels with aluminium skins and with a 36 mm total thickness;
- Type V: AFS panels with GFRP skins and with a 38 mm total thickness;
- Type VI: double-layer AFS panels with aluminium skins and with a 44 mm total thickness.
2.2. Low-Velocity Impact Tests
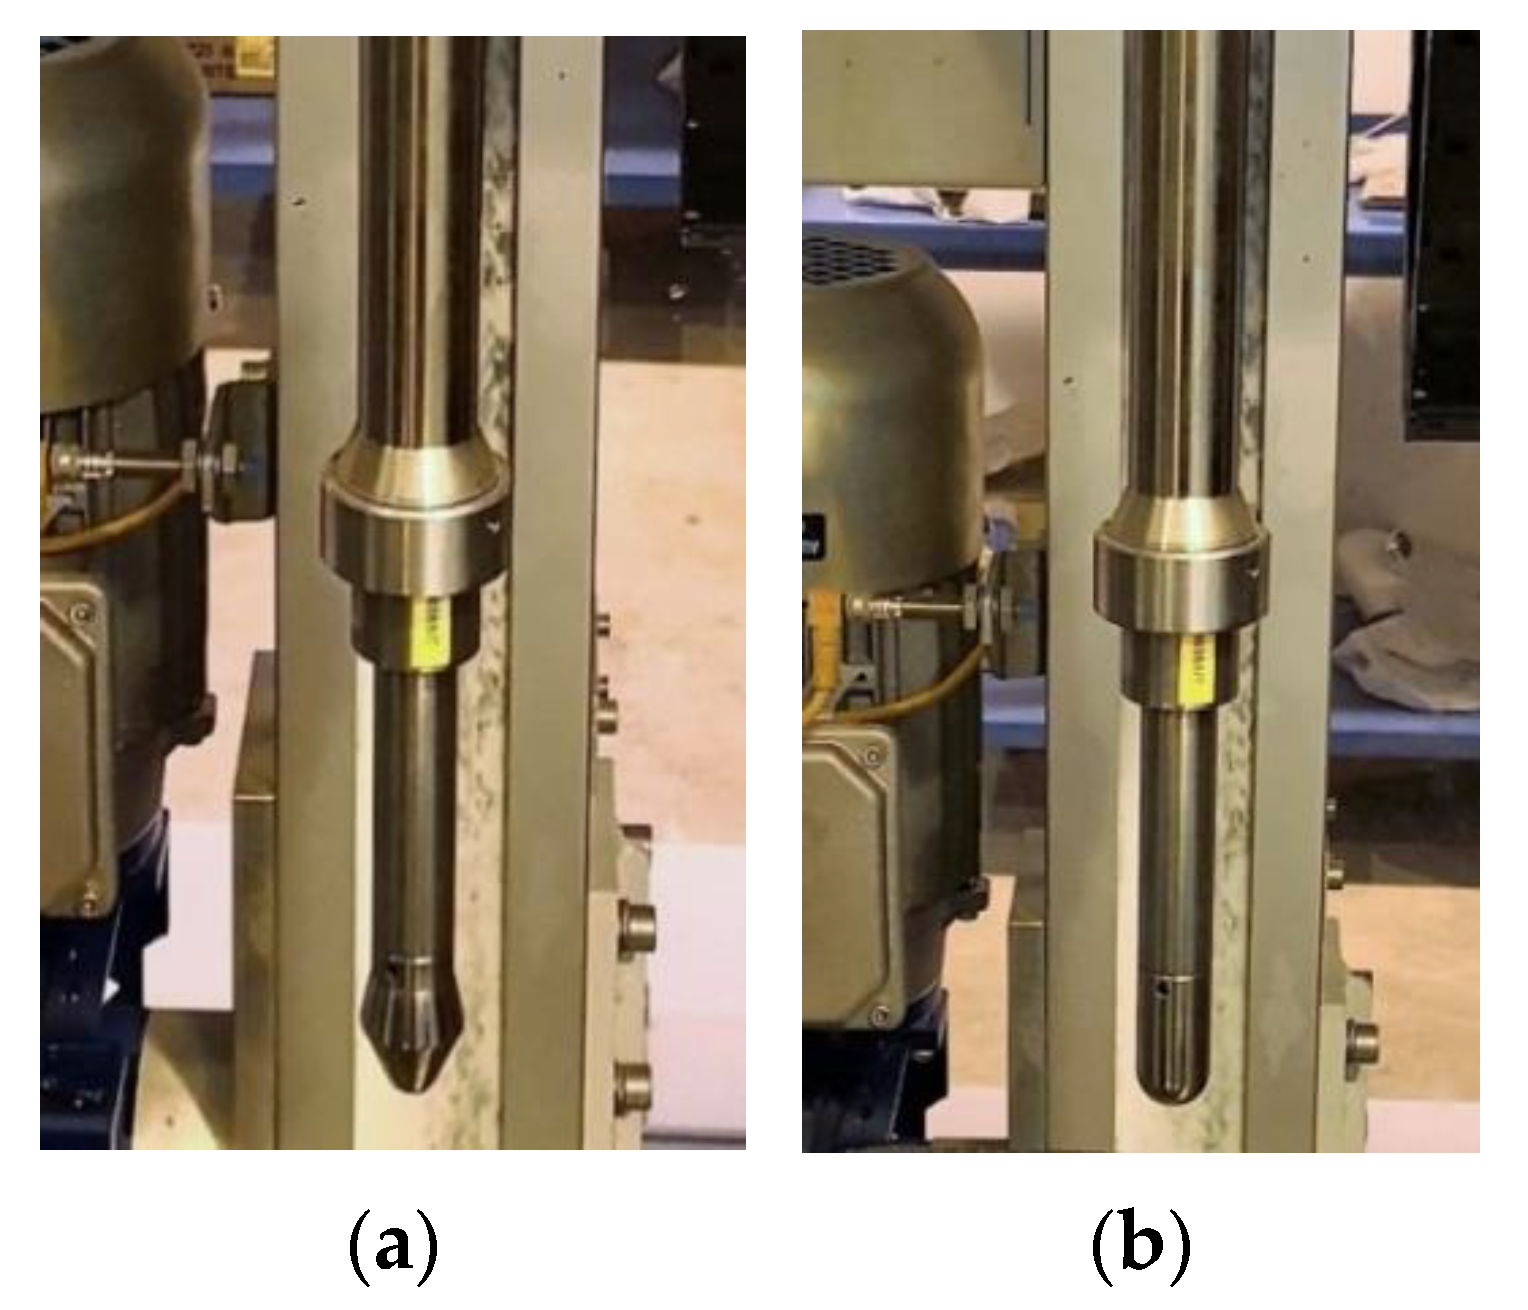
The low-velocity impact (LVI) tests were performed with a Ceast Fractovis Plus drop test machine, equipped with a system for the elimination of multiple impacts. The LVI tests were carried out at different energies, ranging from low-level impact energy (35 J) to high-level impact energy (400 J). A desired impact energy could be obtained by changing the drop height and/or the impactor mass. The machine was provided with a spring system, which was automatically activated when the tower height was insufficient to obtain the requested potential energy. An impactor with conical shape (6.35 mm conical radius and Ø25.4 mm base) was used for the tests on single-layer panels (Types I–V), whereas an impactor with a spherical shape (10 mm radius) was used for the tests on double-layer panels (Type VI). The use of an impactor with spherical shape for double-layer panels was due to practical reasons. Even though the drop test machine was equipped with an adjustable support system for a wide range of thickness, the double-layer panels did not fit in the space available between the support and the reference point of the conical nose, which corresponded to the zero height of the impact; thus a spherical nose was chosen instead of the conical one, used for the single-layer panel.
The impact energy of 35 J was chosen for the repeated impact tests on AF panels without and with skins made of aluminium and GFRP. The panels were simply supported during the impact test on a fixed ring with an internal diameter of 40 mm, without any clamping system.
During the test, the sample was hit by an impactor of mass M at the certain initial velocity v0 and three variables were recorded during this impact event: the force F, the time t and the initial velocity v0. The force signal F(t) was recorded during the impact test by the impactor, which was instrumented by means of a 90 kN piezoelectric force transducer. The drop test machine was equipped with a photocell that triggered the digital acquisition system at the passage of the impactor and measured its velocity v0 at the beginning of the contact before the impact. The acceleration signal a(t) was given by the ratio between the force signal F(t), subtracted by the impactor weight P (P = Mg) and the mass M. The displacement signal w(t) was obtained by double integration of the acceleration signal a(t) knowing the initial impact velocity v0, which was measured by the photocell.
Figure 2 shows the impact setup test and an AFS specimen.
2.3. Nondestructive Inspection
Nondestructive inspection was performed to evaluate the damage occurred on the AFS specimens after LVI tests. The UPA and DR techniques were applied.
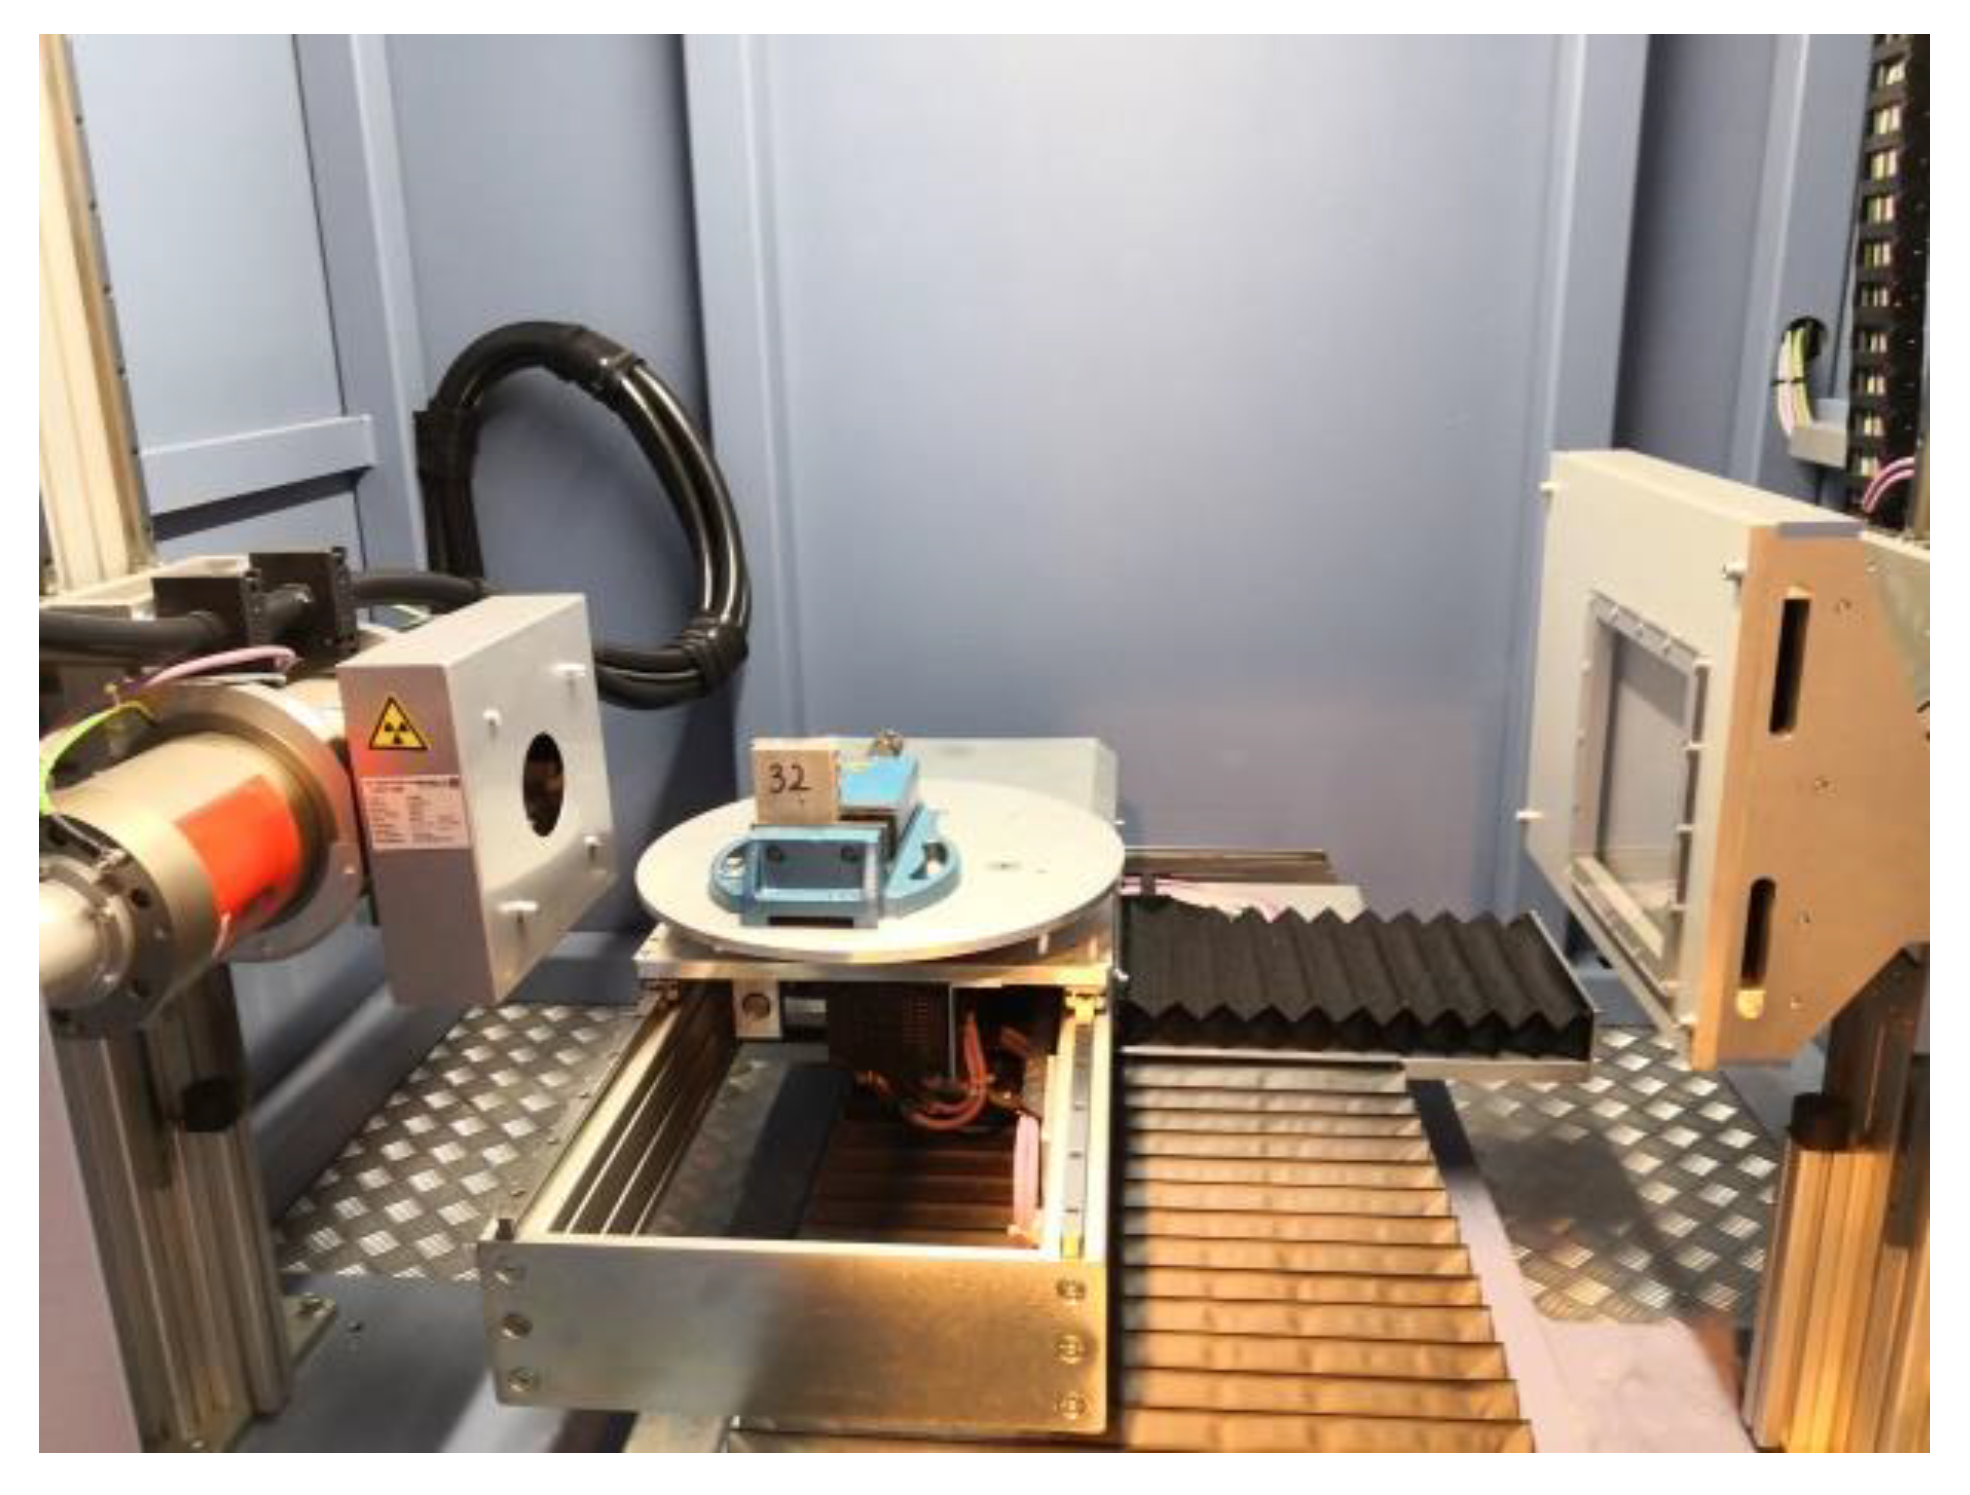
Figure 3 shows the radiographic system.
UPA tests were performed by using Olympus Focus PX 16/128 acquisition unit with TomoView software and a 64 element linear probe at 3.5 MHz (3.5 L64-NW1, 64 mm aperture, 1 mm pitch, 7 mm elevation) equipped with a wedge SNW1-0 L-IHC and with a Versa MOUSE encoder.
The inspection was performed for the investigated AFS structures. The AFS specimens with GFRP skin presented the difficulty to detect the damage from visual inspection and the different material velocity longitudinal waves between GFRP skin and the AF core, giving high attenuation of ultrasonic waves. For the last reason, the UPA inspections were performed only for the skins. For AFS with aluminium skin, the inspections were conducted over the whole specimen (i.e., skin plus core). Thus, longitudinal wave velocity was calculated, which was equal to 2757 m/s for the GFRP skin and 4223 m/s for the aluminium skin.
Beam delay and sensitivity was adjusted to perform phased array calibrations. The beam delay was adjusted in order to match the front wall with the zero point. The obtained sensitivity parameters from our calibration were as follows: for the GFRP, the reflector amplitude was 100% with a tolerance of 10% and a gain of 20 dB, while for the aluminium, the reflector amplitude was 90% with a tolerance of 5% and a gain of 26 dB. The encoder resolution was also calibrated and the obtained values for the GFRP skin and the aluminium skin were 8.55 steps/mm and 9.07 steps/mm, respectively. UPA inspections were carried out with a resolution of 1 pixel = 1 mm.
The tested specimens were subjected to radiographic inspection, aiming to investigate the consequences of the impact event. The radiographic evaluation was performed with a Bosello SRE m@x system. At the next step, the radiographic inspection was used by implementing the Bosello SRE m@x system in order to study the specimens in more detail. The radiographic machine was equipped with a shielded cabin and an X-ray tube with a maximum voltage of 320 kV and a focal spot size of 0.4 mm. The detector was a flat panel with a resolution of 1024 × 1024 pixels. The system was equipped with a manipulator with an automatic 4-axes movement control system.
The impacted specimens were positioned in the X-ray system, as shown in Figure 3. The radiographic images were obtained by setting the X-ray source at a voltage of 75 kV and a current of 0.4 mA. Radiographies were processed with inbuilt Imaging Processing software from Bosello High Technology (IP BHT Plus image processor) and a median EN filter was applied to improve the signal-to-noise ratio in the radiographic images.
3. Results and Discussion
3.1. Low-Velocity Impact Tests
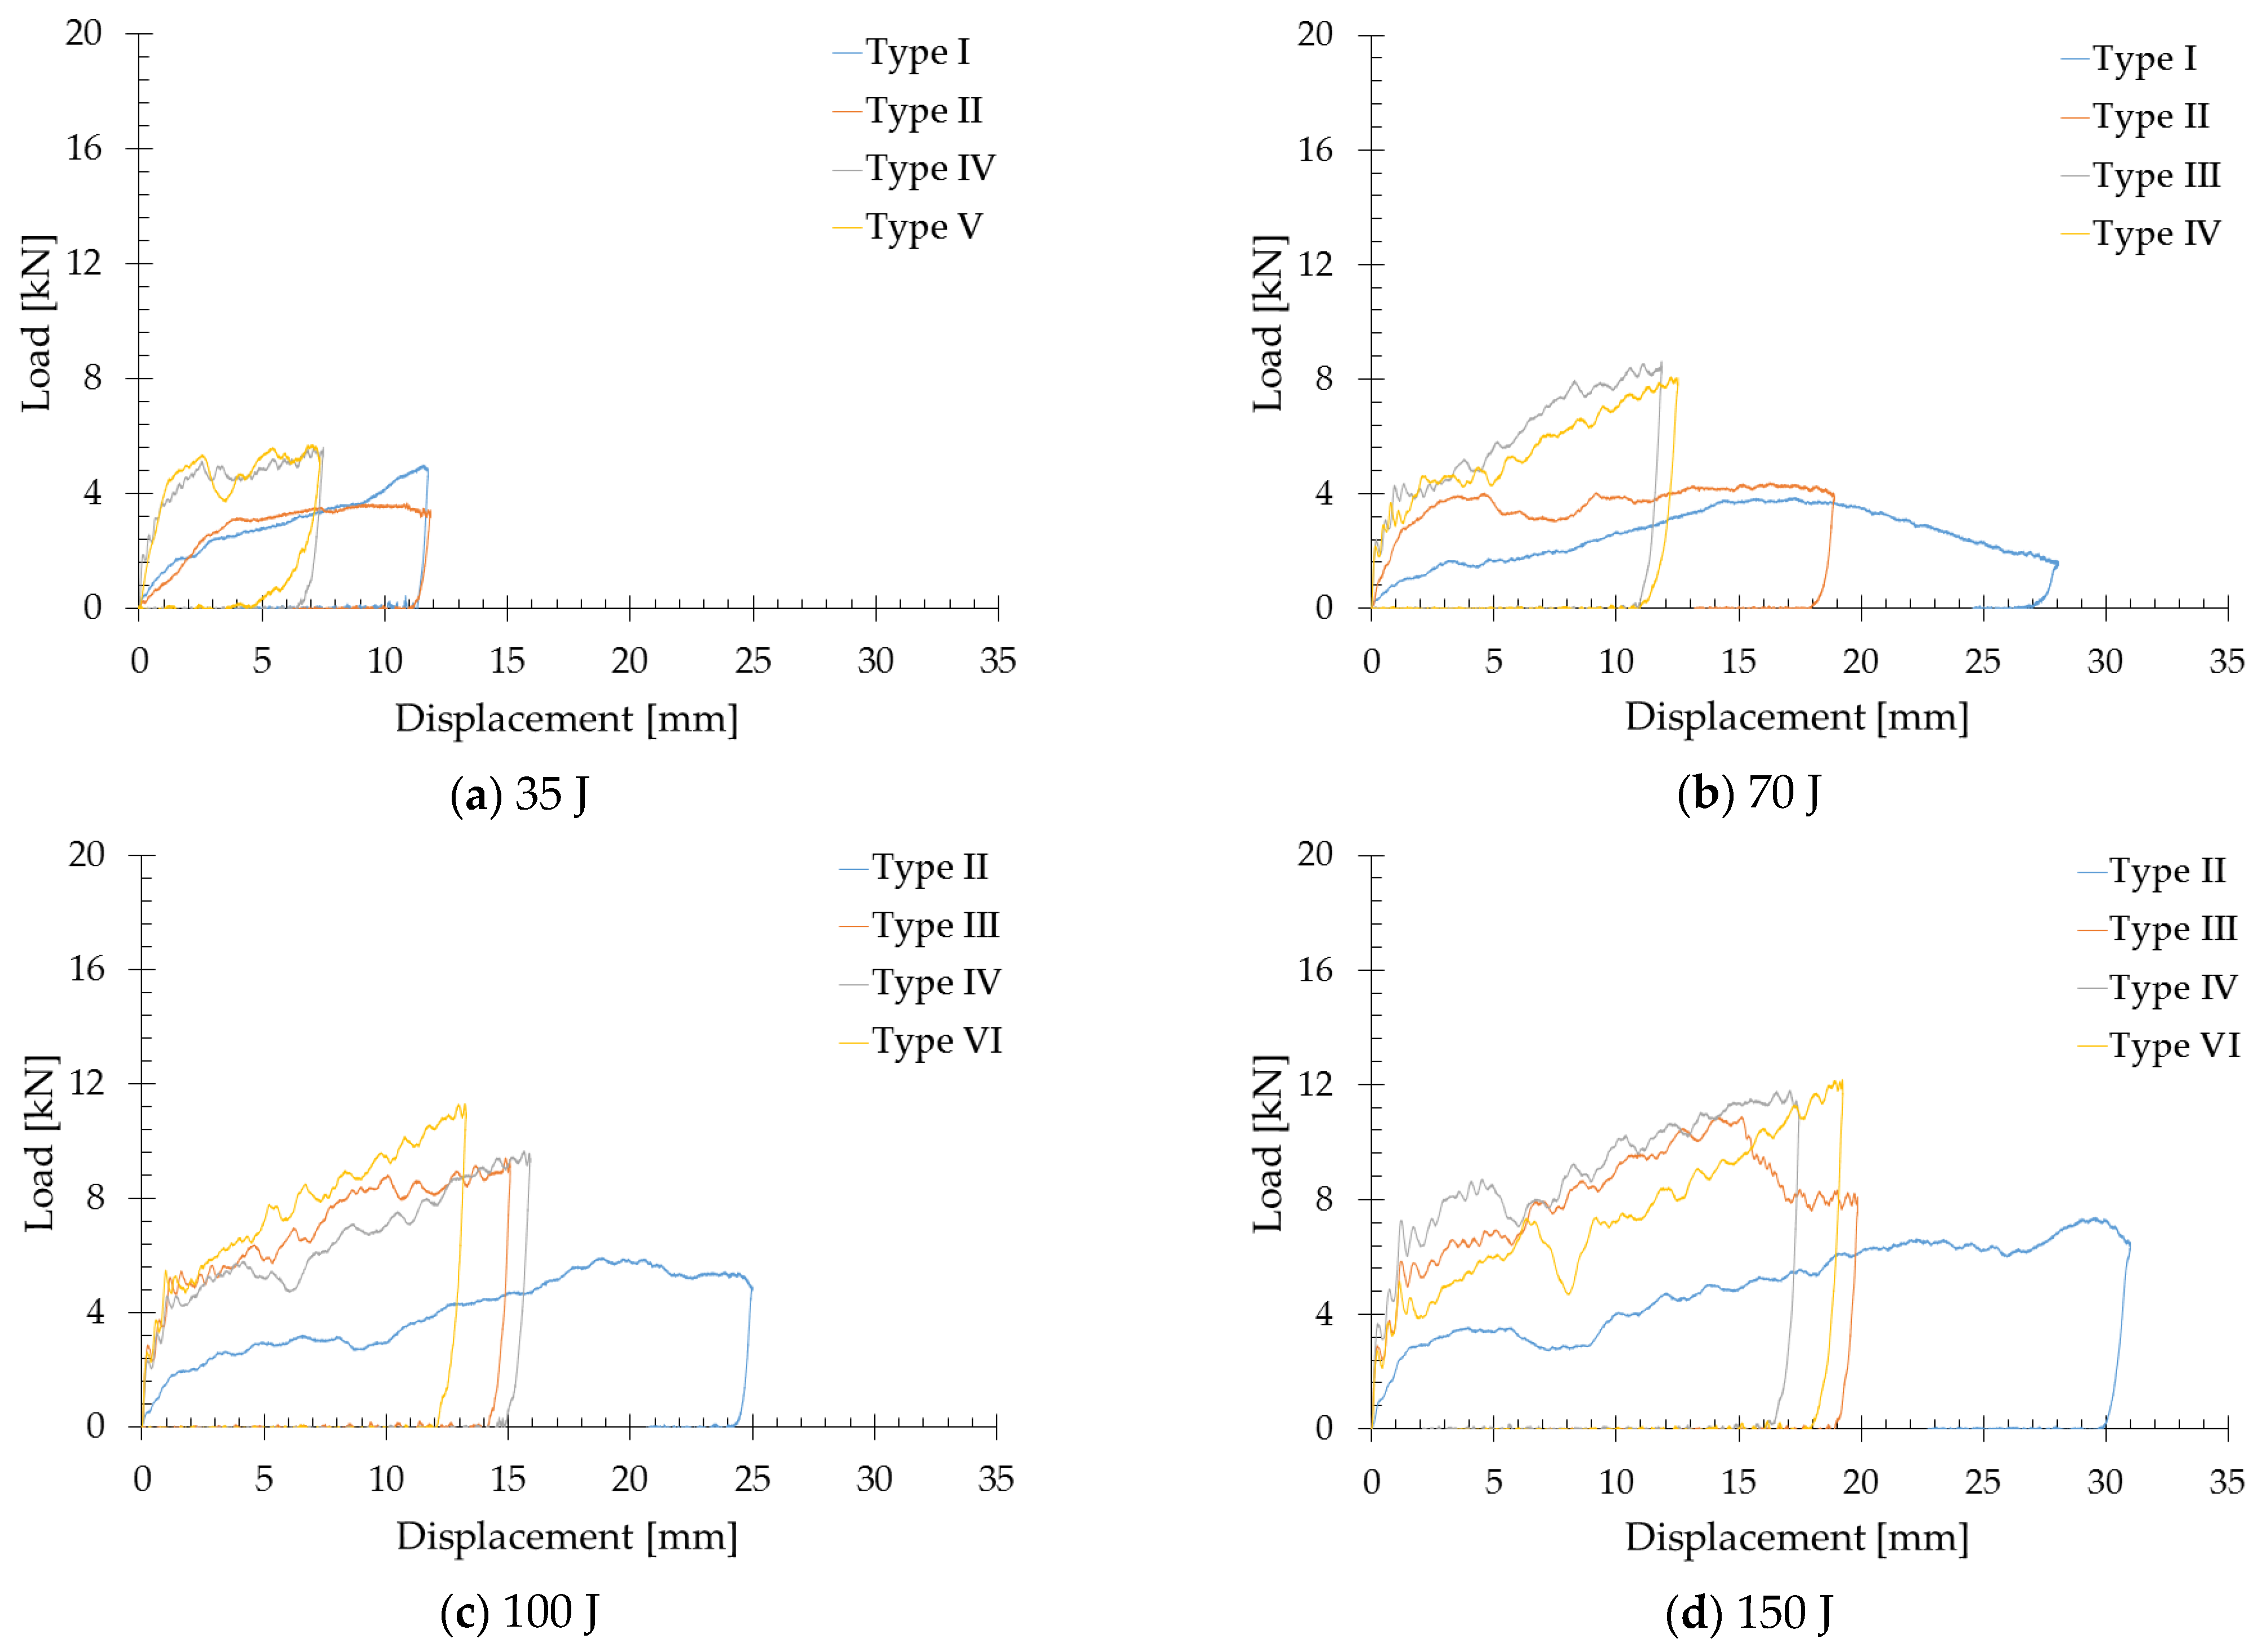
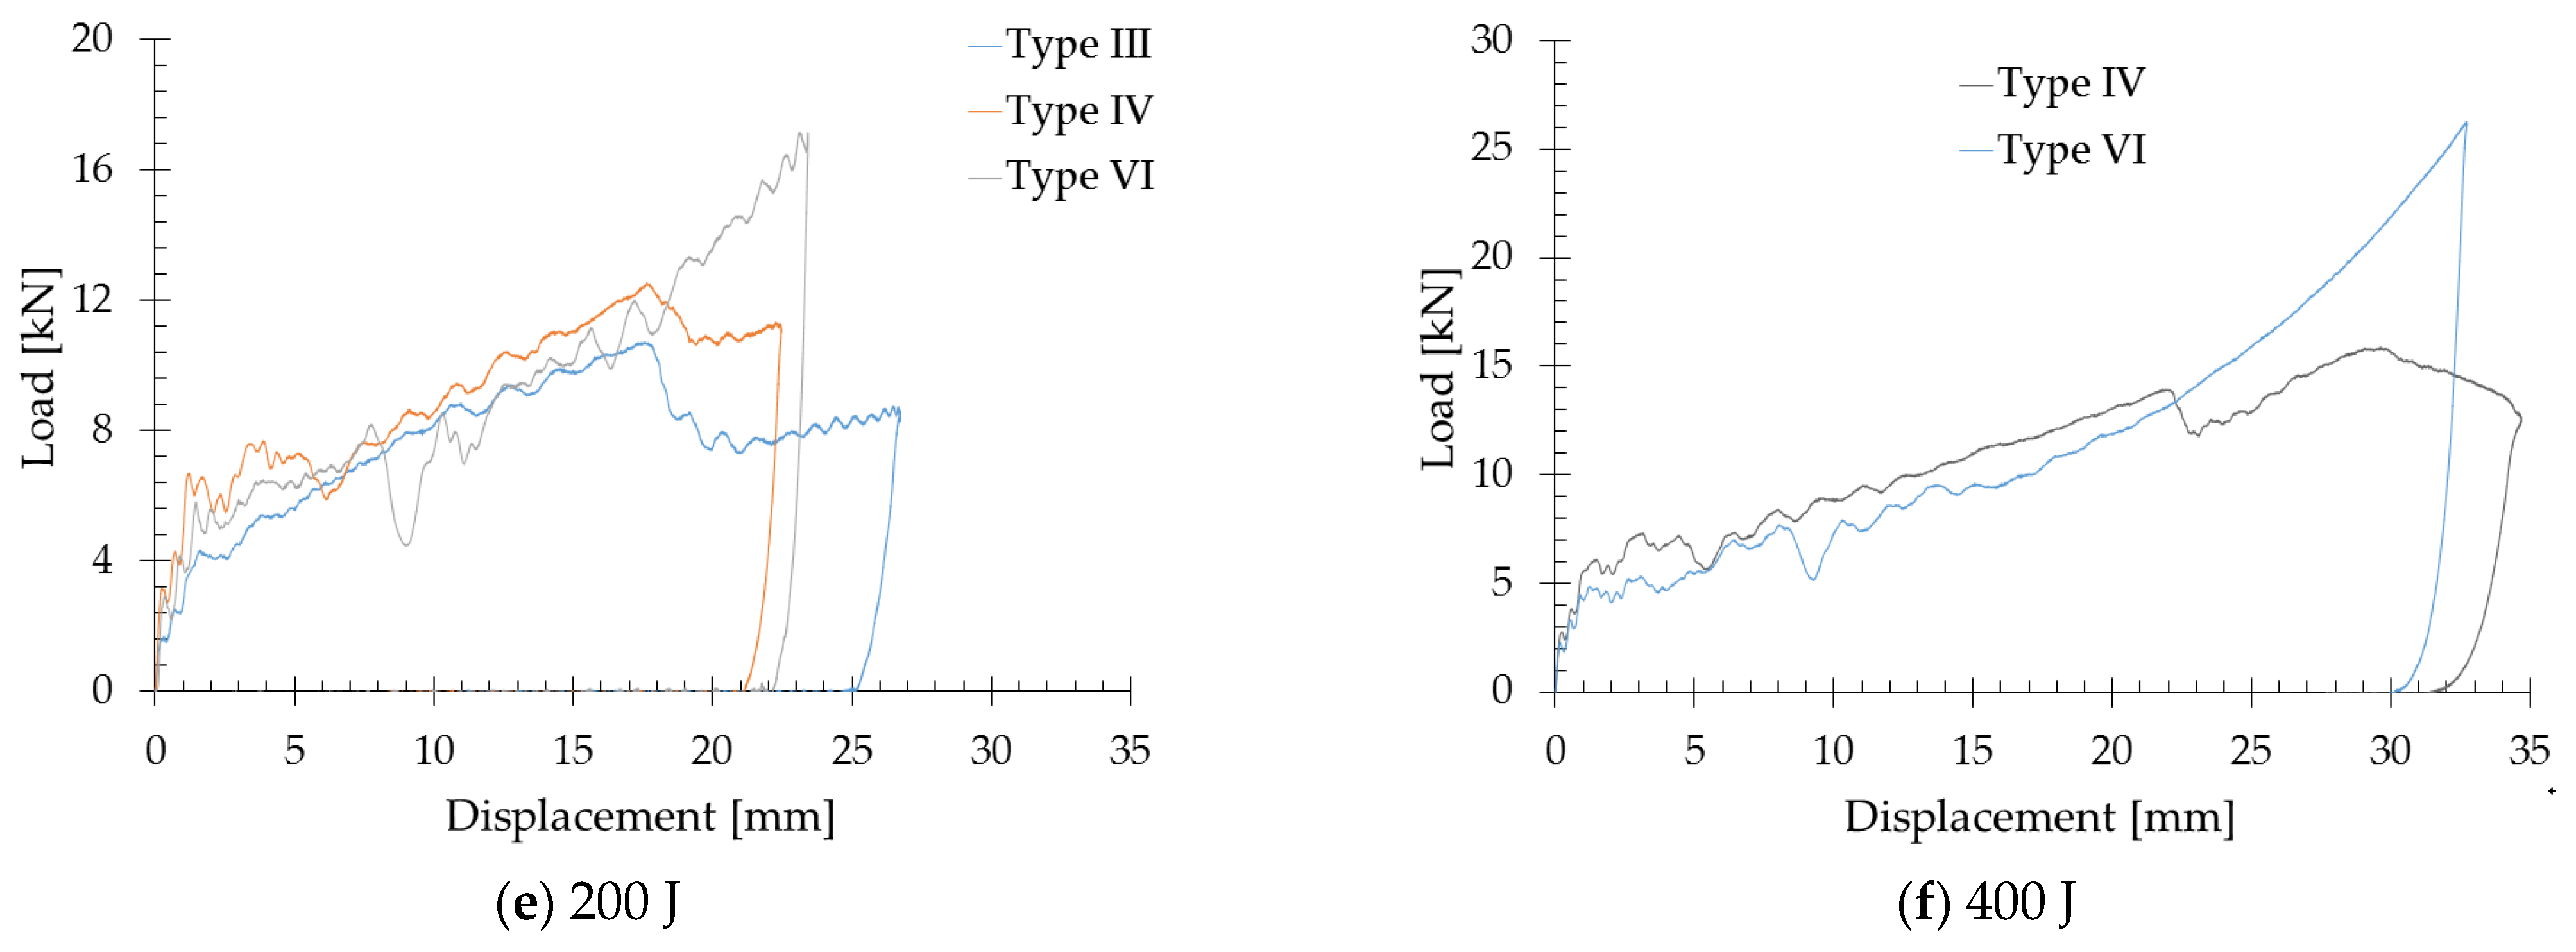
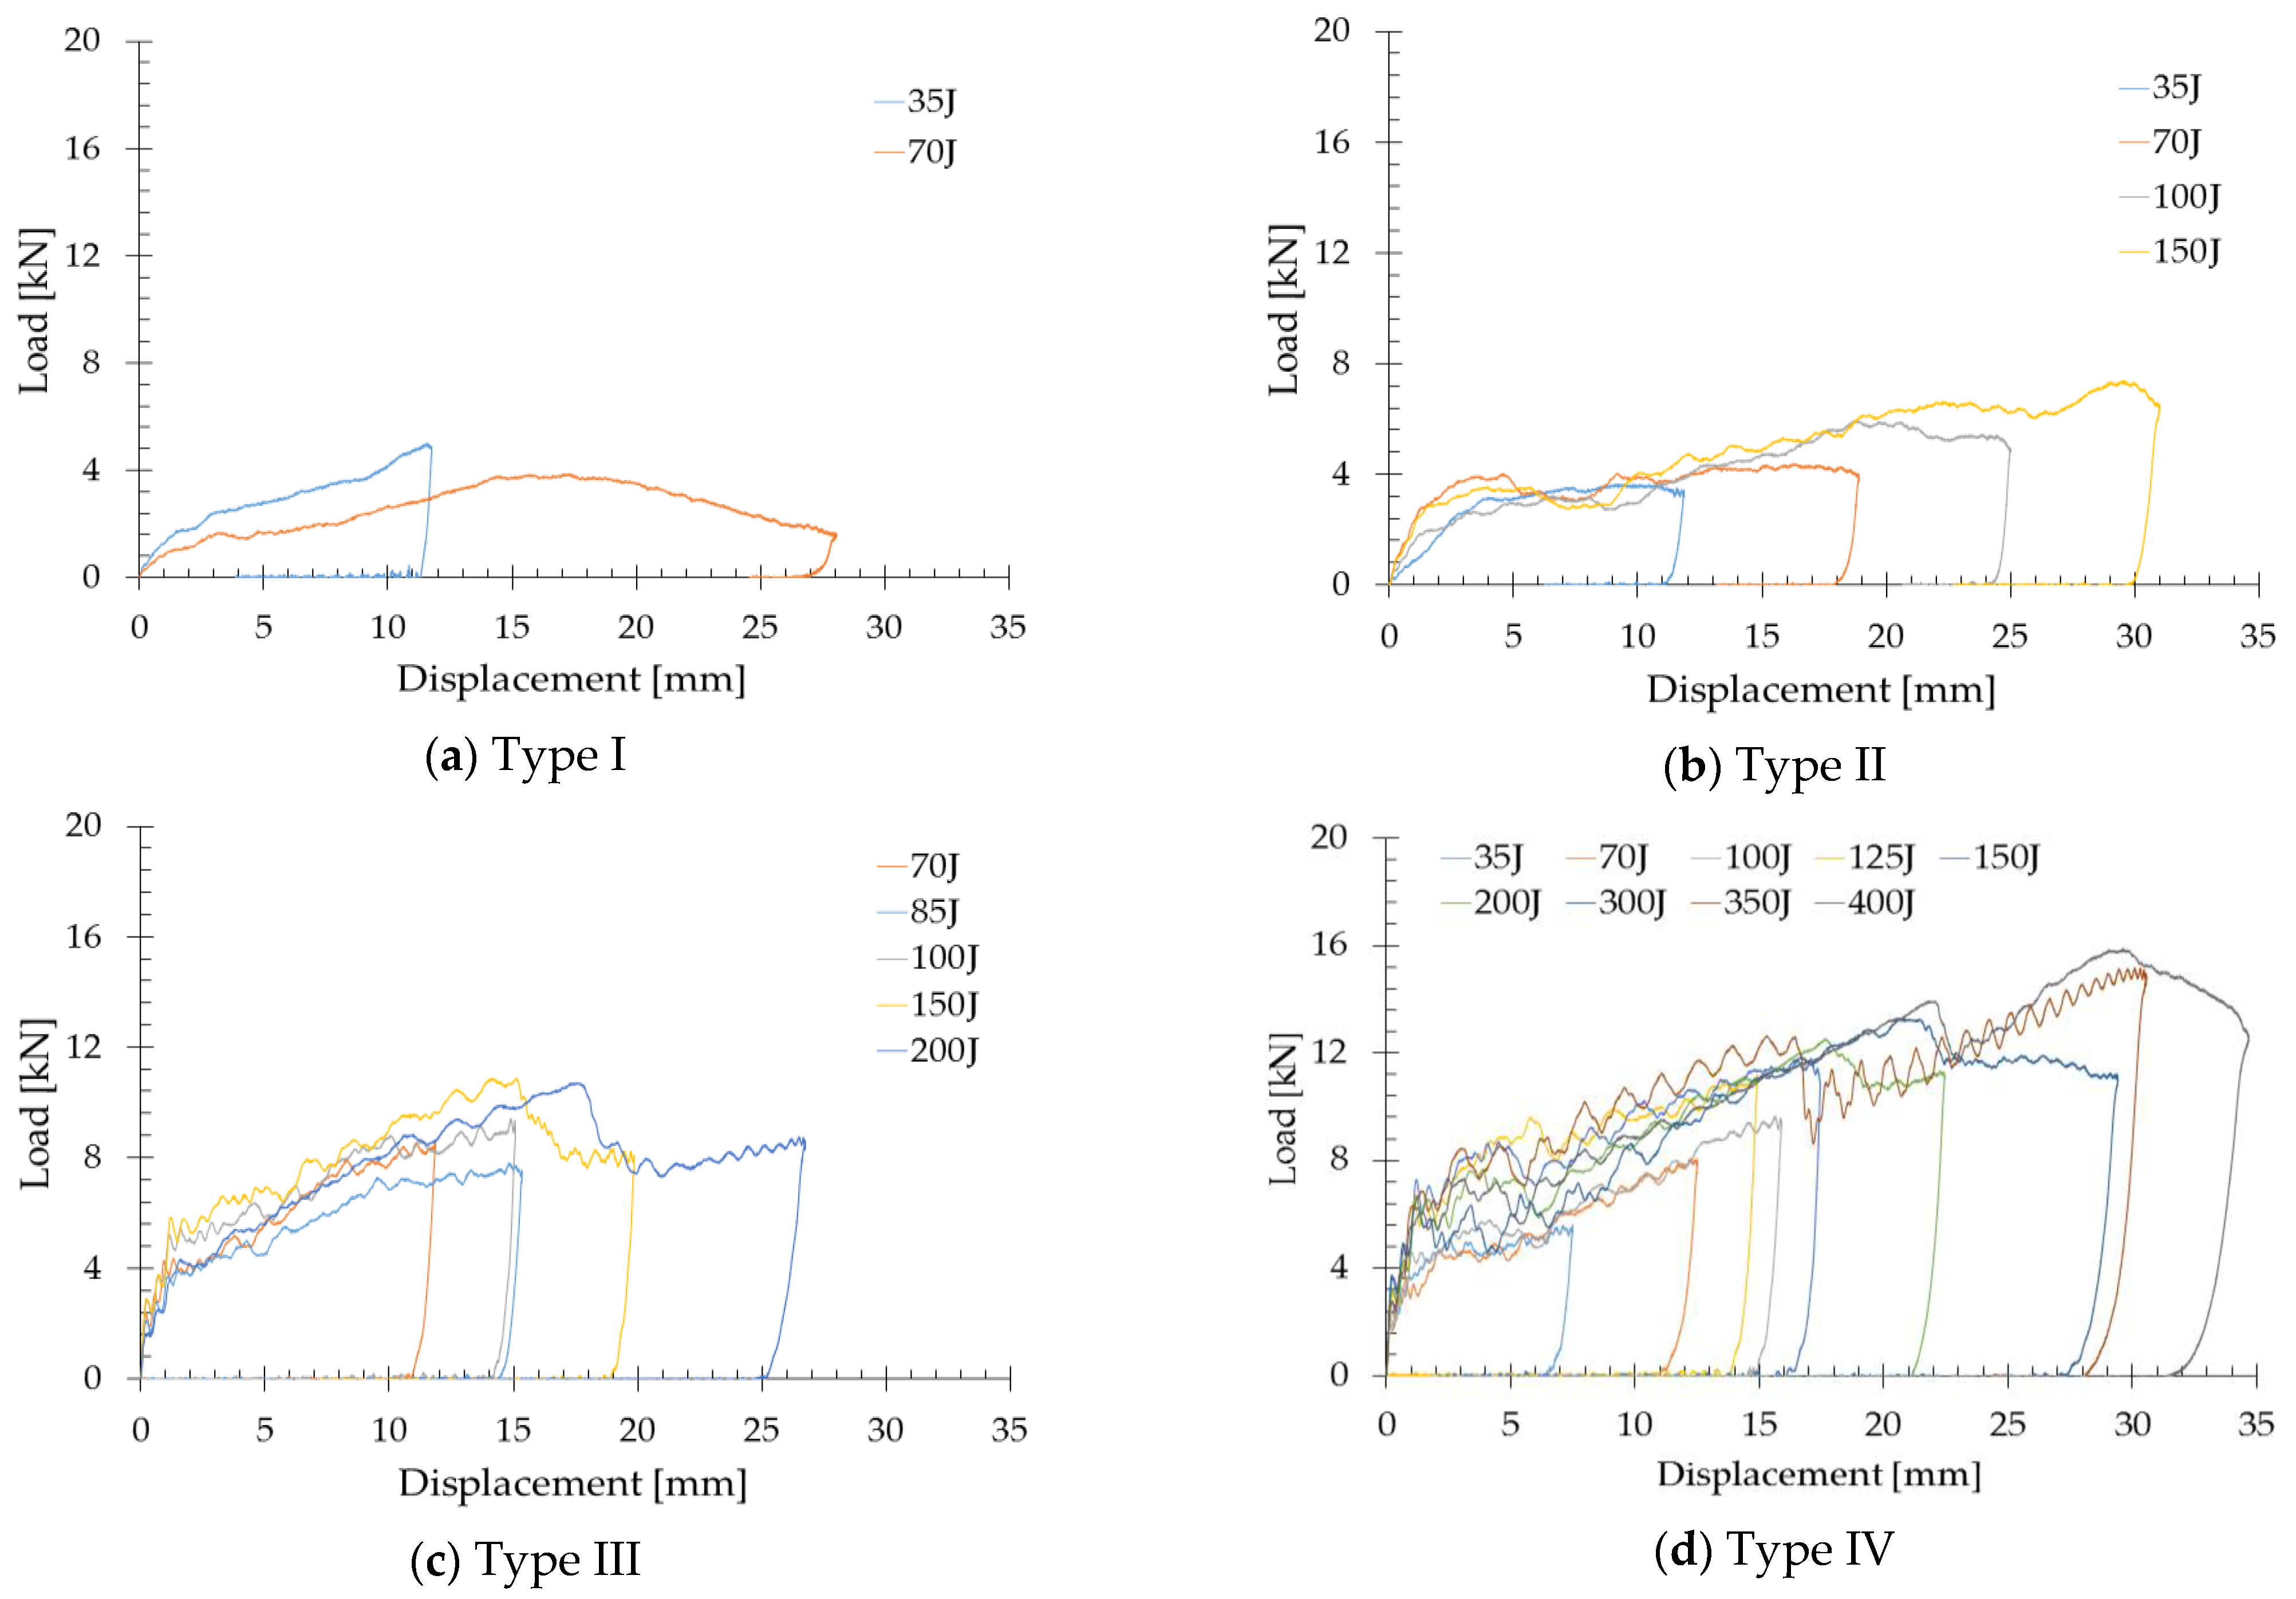
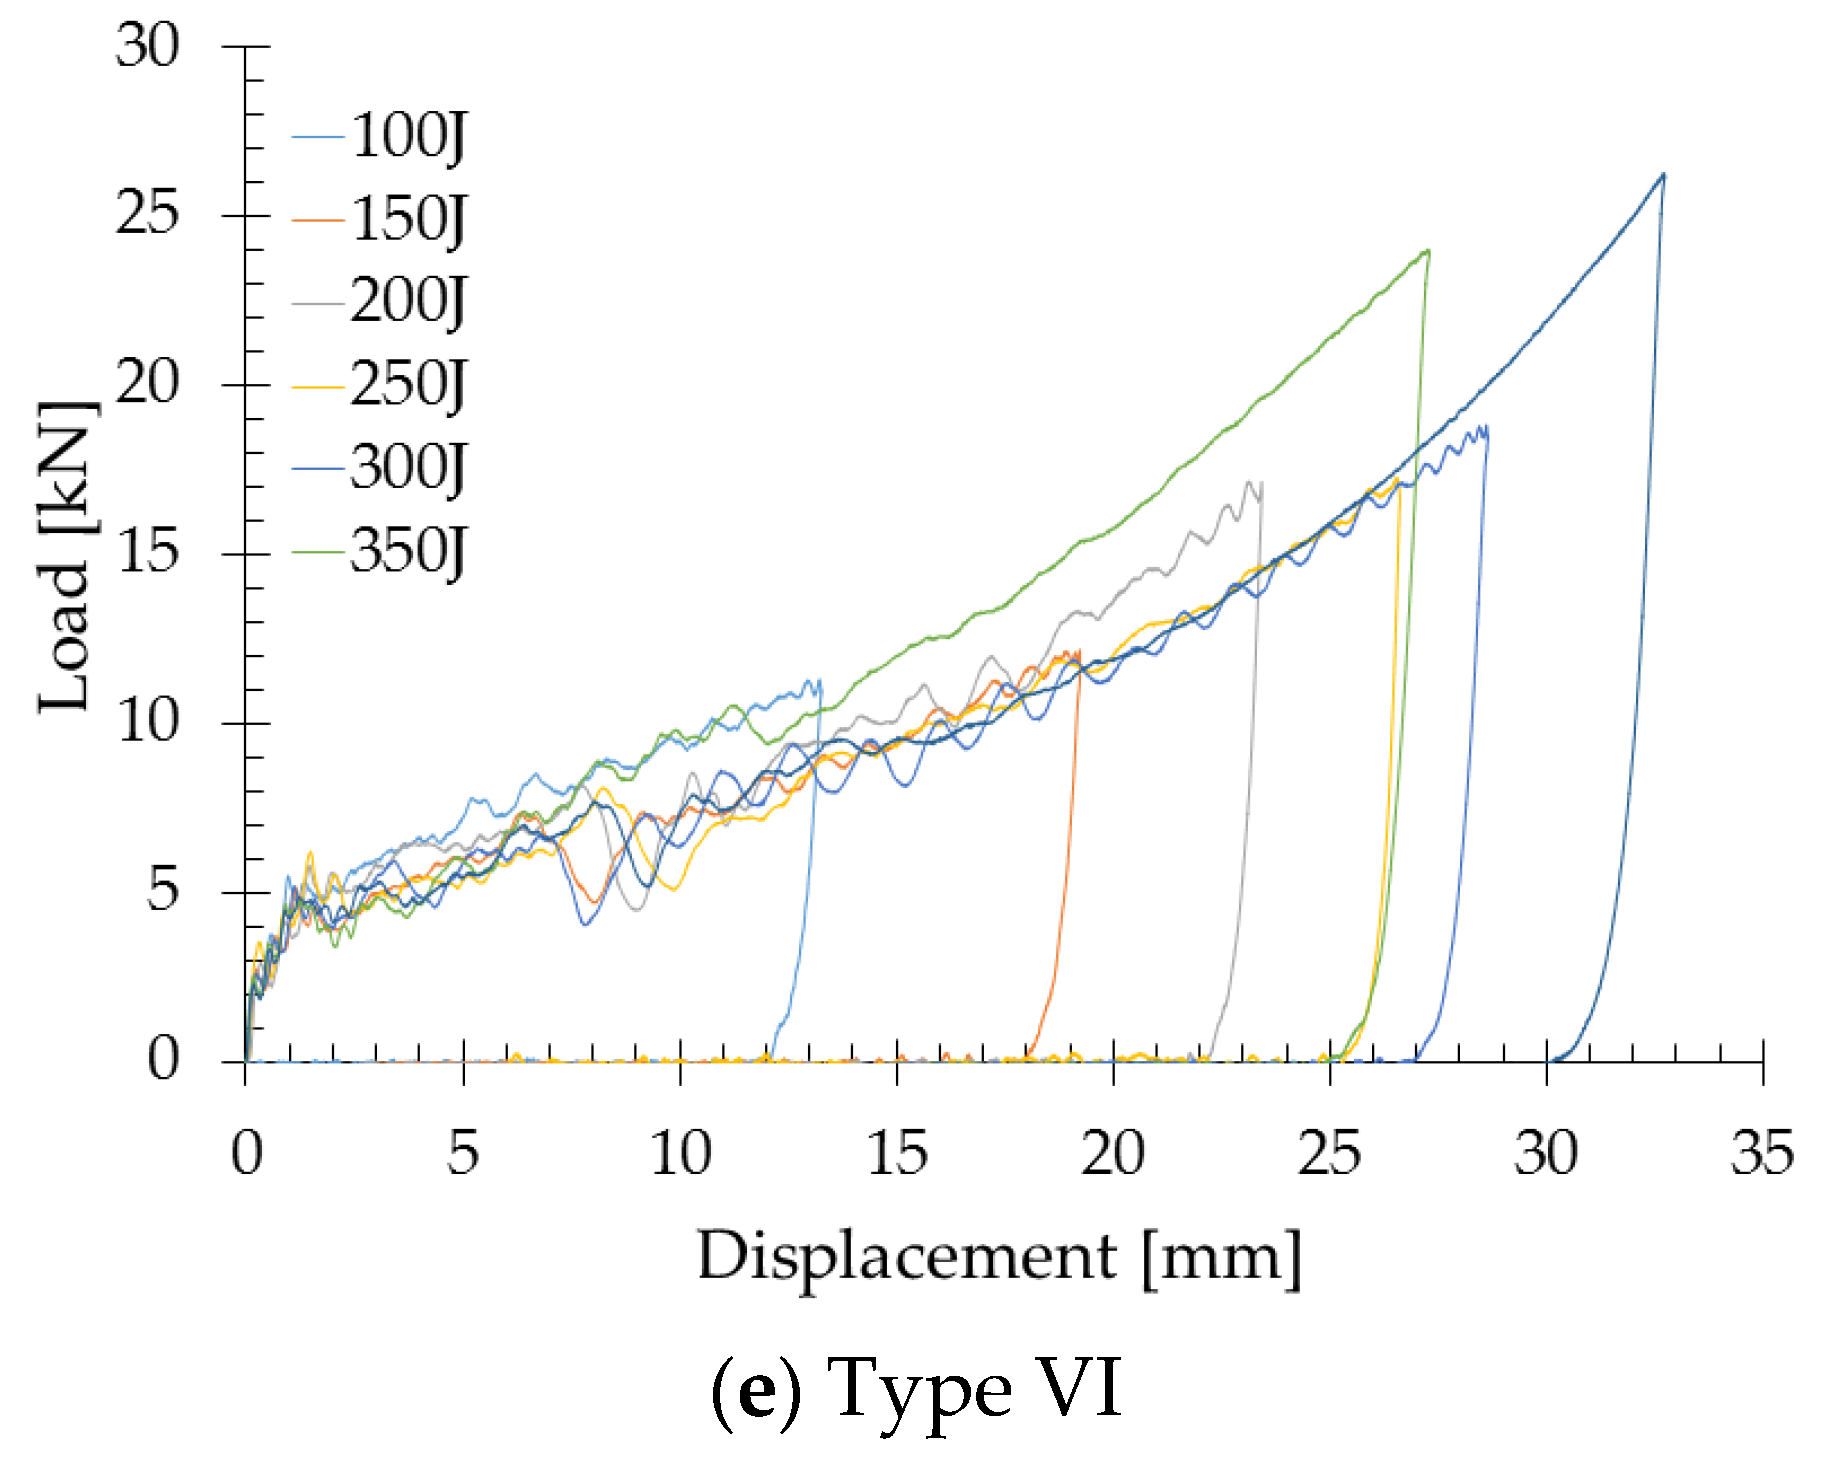
The load–displacement curves for all the investigated panels at different impact energies are shown in Figure 4.
The load–displacement curves for each type of the investigated panels at different impact energies are presented in Figure 5.
Peak Crush Force (FMAX) and depth (w) are defined as the highest values of force magnitude and displacement observed in the force–displacement response, respectively. The specific absorbed energy (SAE) was calculated by dividing the amount of energy absorbed during the impact event, equal to the area under the force–displacement curve, by the density () of each specimen, as described in Equation (1) below.
The specific weight absorbed energy (SAEw) was defined by dividing the amount of energy absorbed during impact event (Ea) for the weight of each specimen. Table 1 reports the specimens’ thickness (ttot), impact energy (Ei) and the results of the experimental tests in terms of peak force (FMAX), depth (w) and specific absorbed energy respective to density (SAE) and weight (SAEw). The specimens with 44 mm thickness were the double-layer panels; the core densities of each layer are reported in Table 1.
According to the analysis of the results shown in Figure 4 and Table 1, the responses of the different AFS panels with skins (Types III, IV, V and VI) were similar at the same impact energies; they showed similar values of w, FMAX and SAE. Different behaviours were observed for the AF panels without skins (Types I and II), with lower values of FMAX and higher values of w and SAE. Generally, a lower FMAX is desirable for crashworthiness designed to minimise any sudden deceleration due to the impact. Conversely to SAE, the lower the FMAX, the better the energy absorption structure.
Perforation of the full AF panels was observed at the following impact energies: 70 J for Type I, 150 J for Type II, 200 J for Type III and 400 J for Type IV. The effectiveness of energy absorption properties of the AFS was evaluated by comparing the values of the maximum specific energies which produced the full panel perforation (Type I–VI) to the maximum SAE of other structures under LVI loading, which are reported in literature [10]: AFS, AFS with GFRP external skins, aluminium honeycomb sandwich (AHS), AHS with GFRP external skins, double-layer AHS, seven-layer trapezoidal corrugated aluminium sandwich structures with 0°/0° (7L-TCAS 0°/0°) and 0°/90° (7L-TCAS 0°/90°)-oriented fins and Ti64 body-centred cubic (BCC) microlattice core with GFRP skins (GFRP-BCC). The results of the comparison are summarised in Table 2.
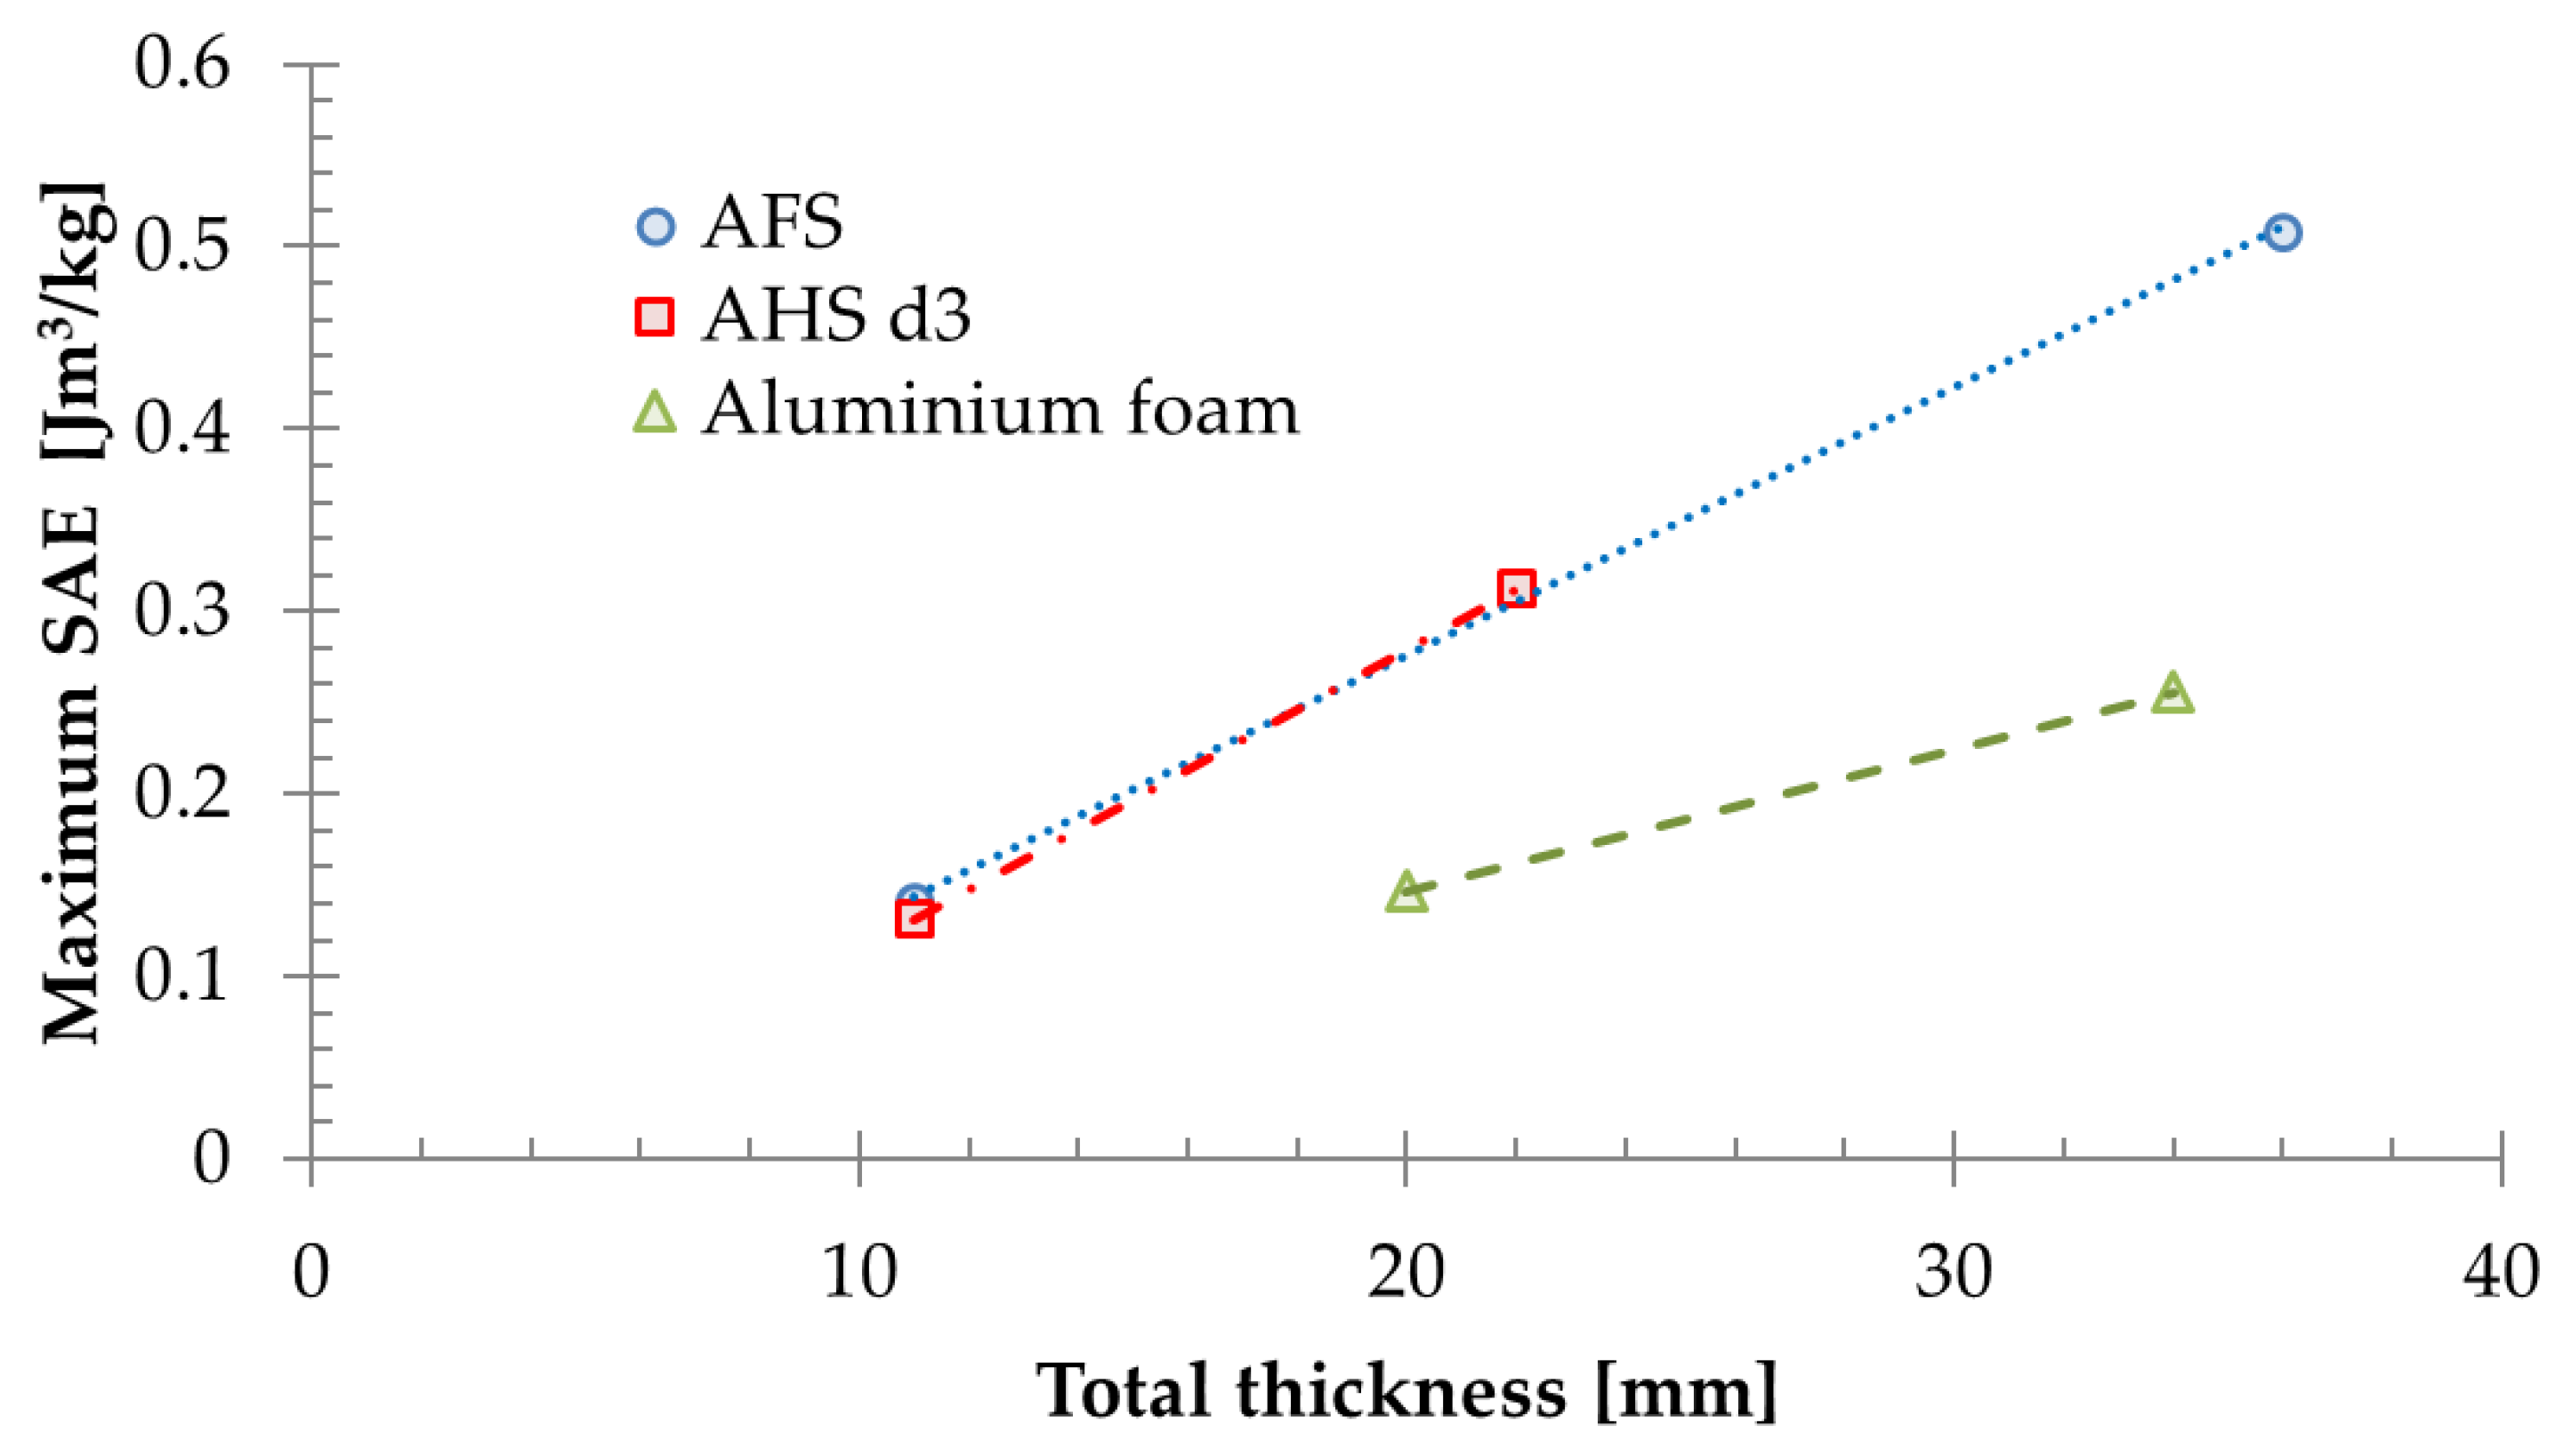
According to the analysis of the results shown in Table 2, the maximum SAE producing the full panel perforation showed a linear trend with respect to the total thickness of the panels (Figure 6). Moreover, the AFS panels exhibited, obviously, higher values of maximum SAE compared to the values for the AF panels without skins and similar values respect to the values for AHS panels with 3 mm cell diameter.
3.2. Repeated Impact Tests
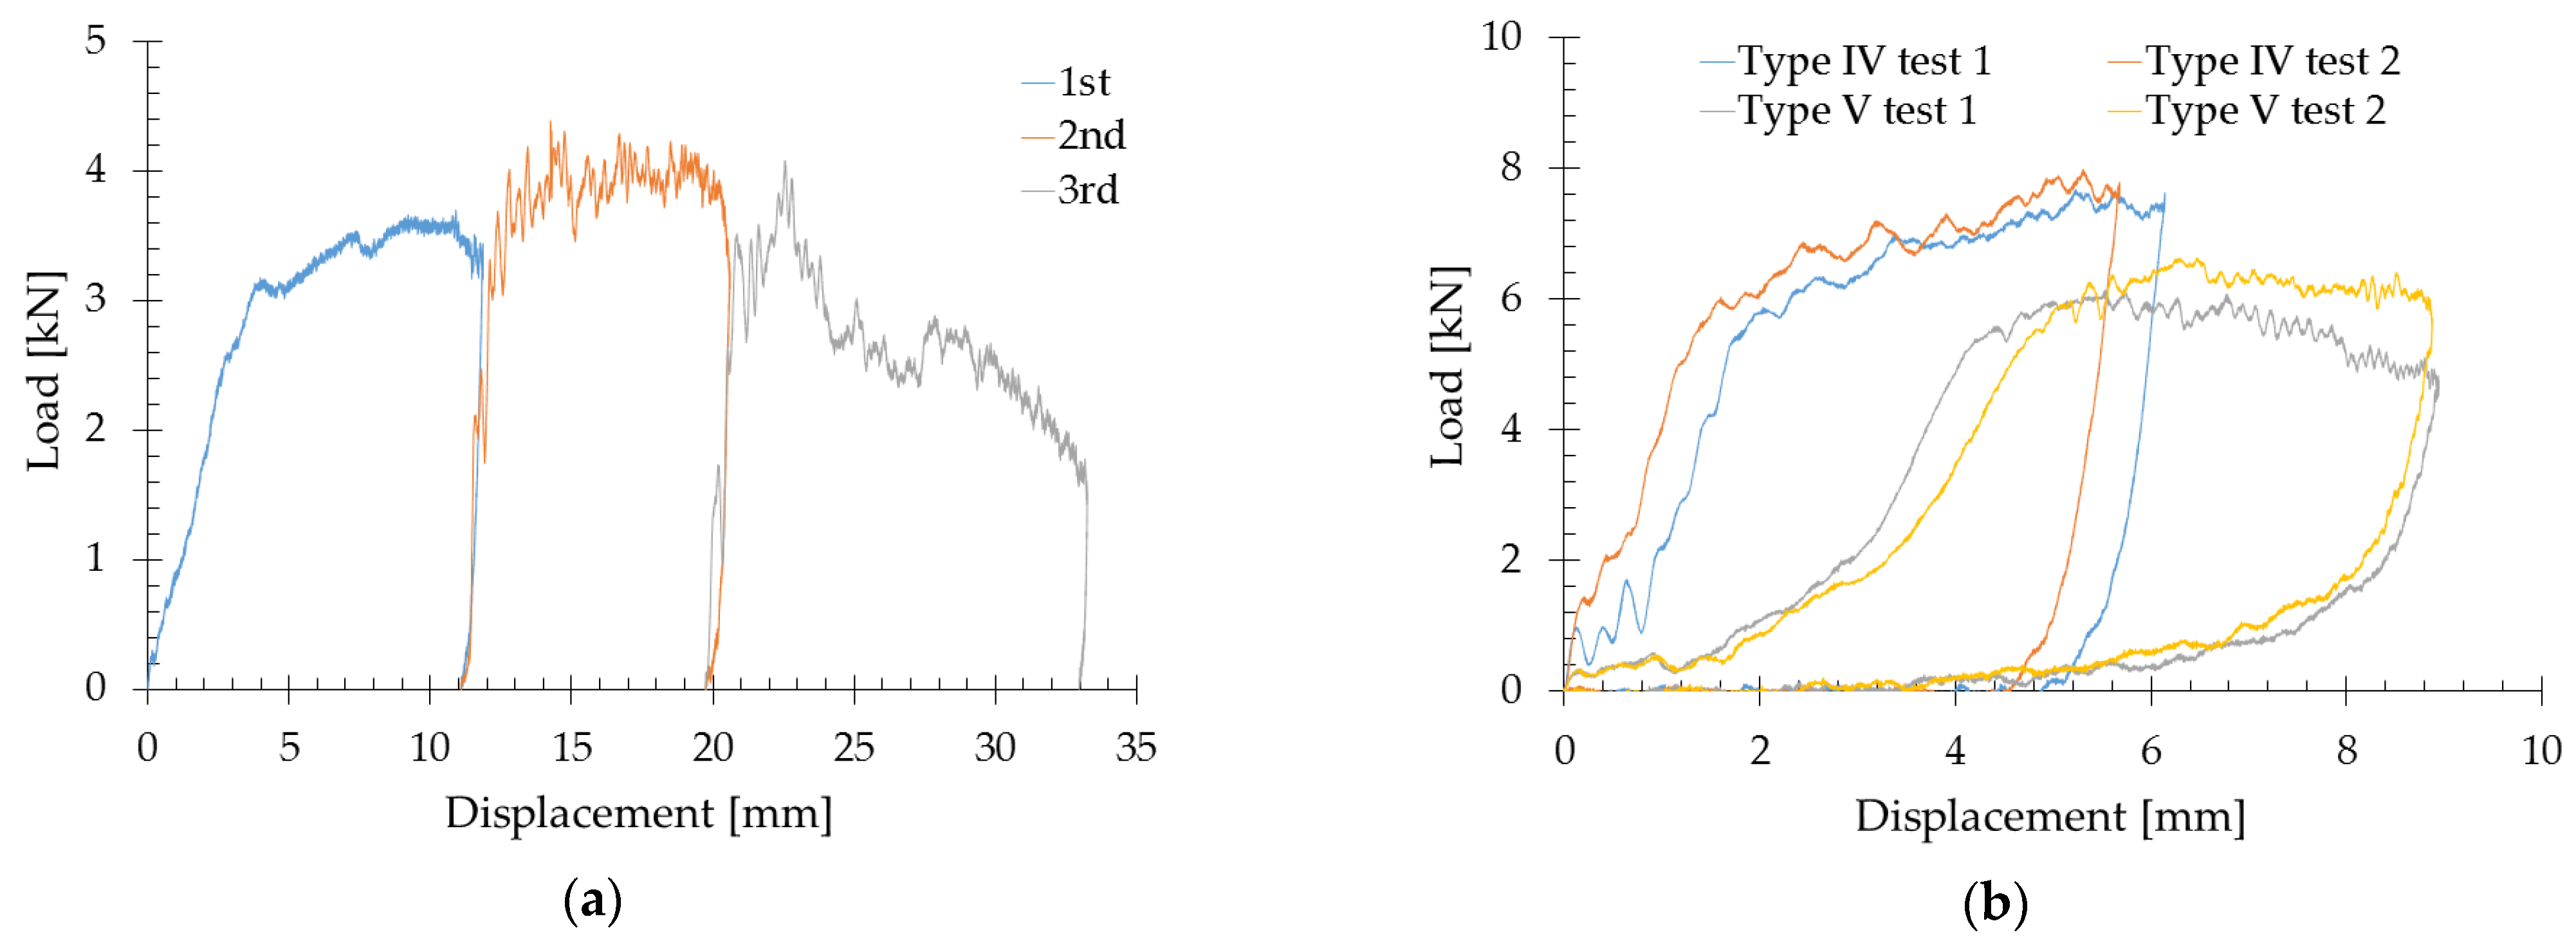
Figure 7 shows the load–displacement curves of the repeated impact tests on AF panels without and with skins made of aluminium and GFRP.
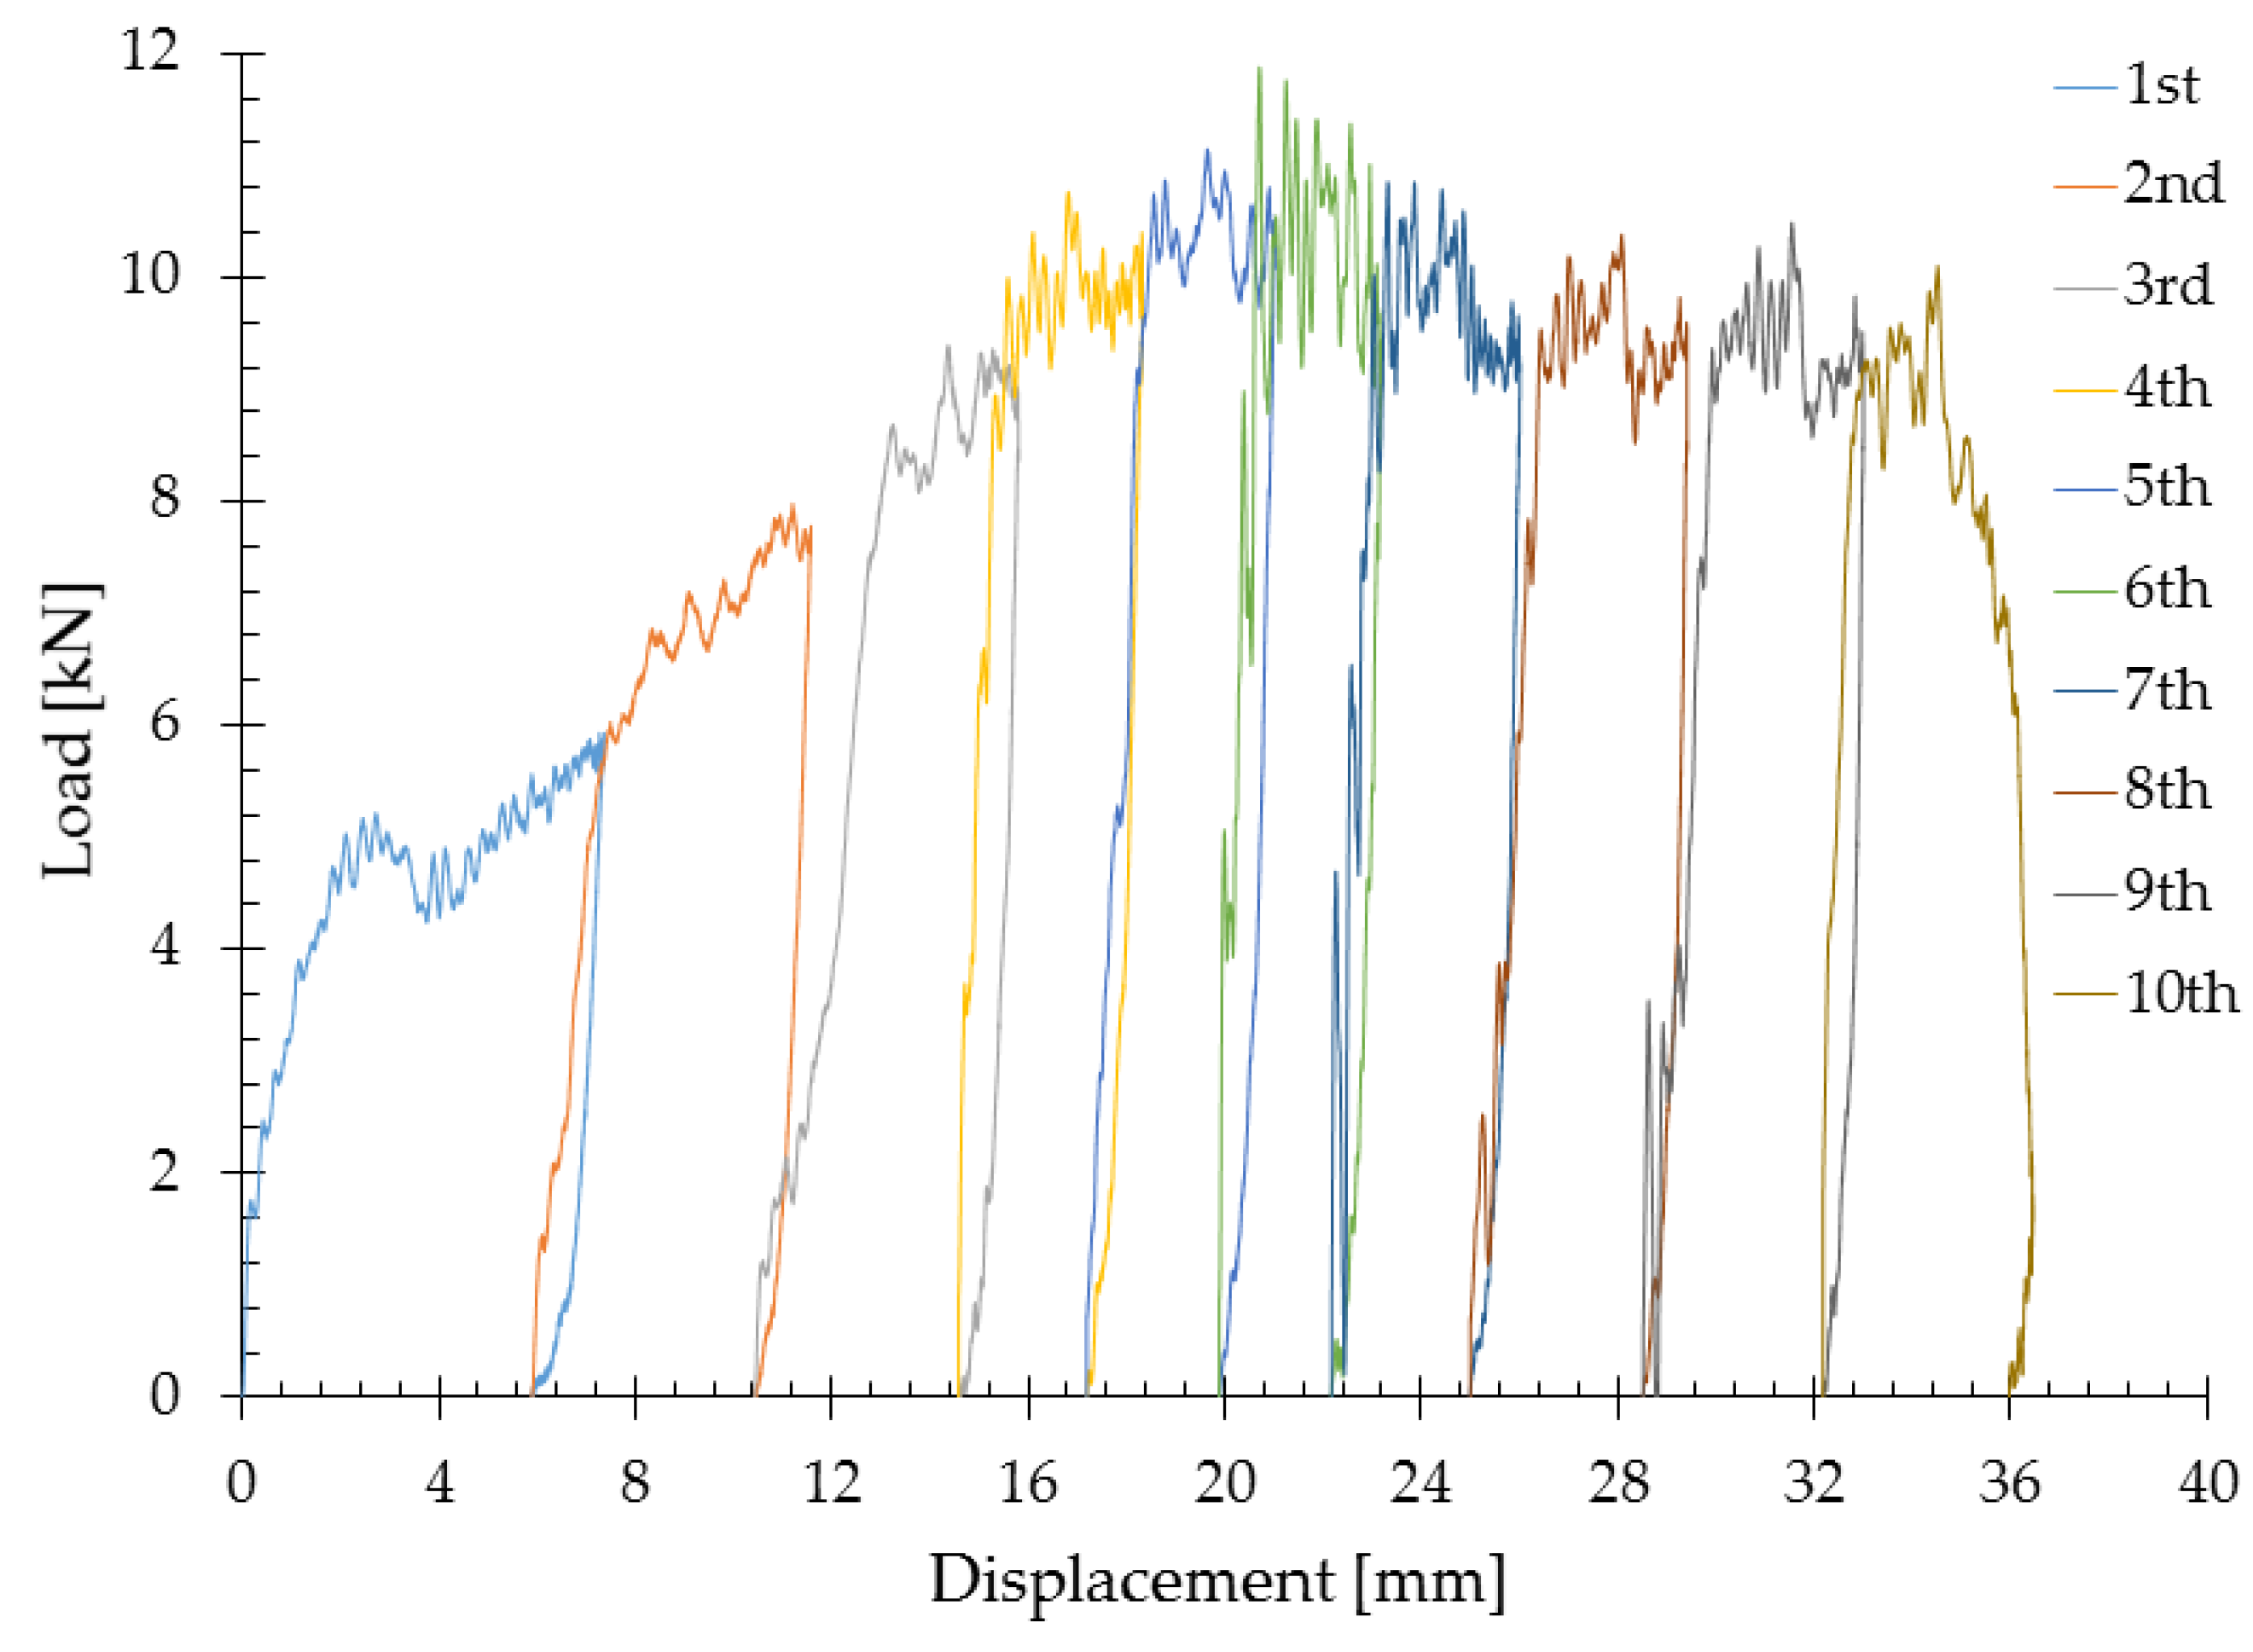
Figure 8 shows the load–displacement curves for a Type IV specimen subjected to 10 repeated impact tests including stages of loading and unloading at impact energy equal to 35 J. The impact repeating was sustained until obtaining a displacement of 36 mm equal to the specimen thickness.
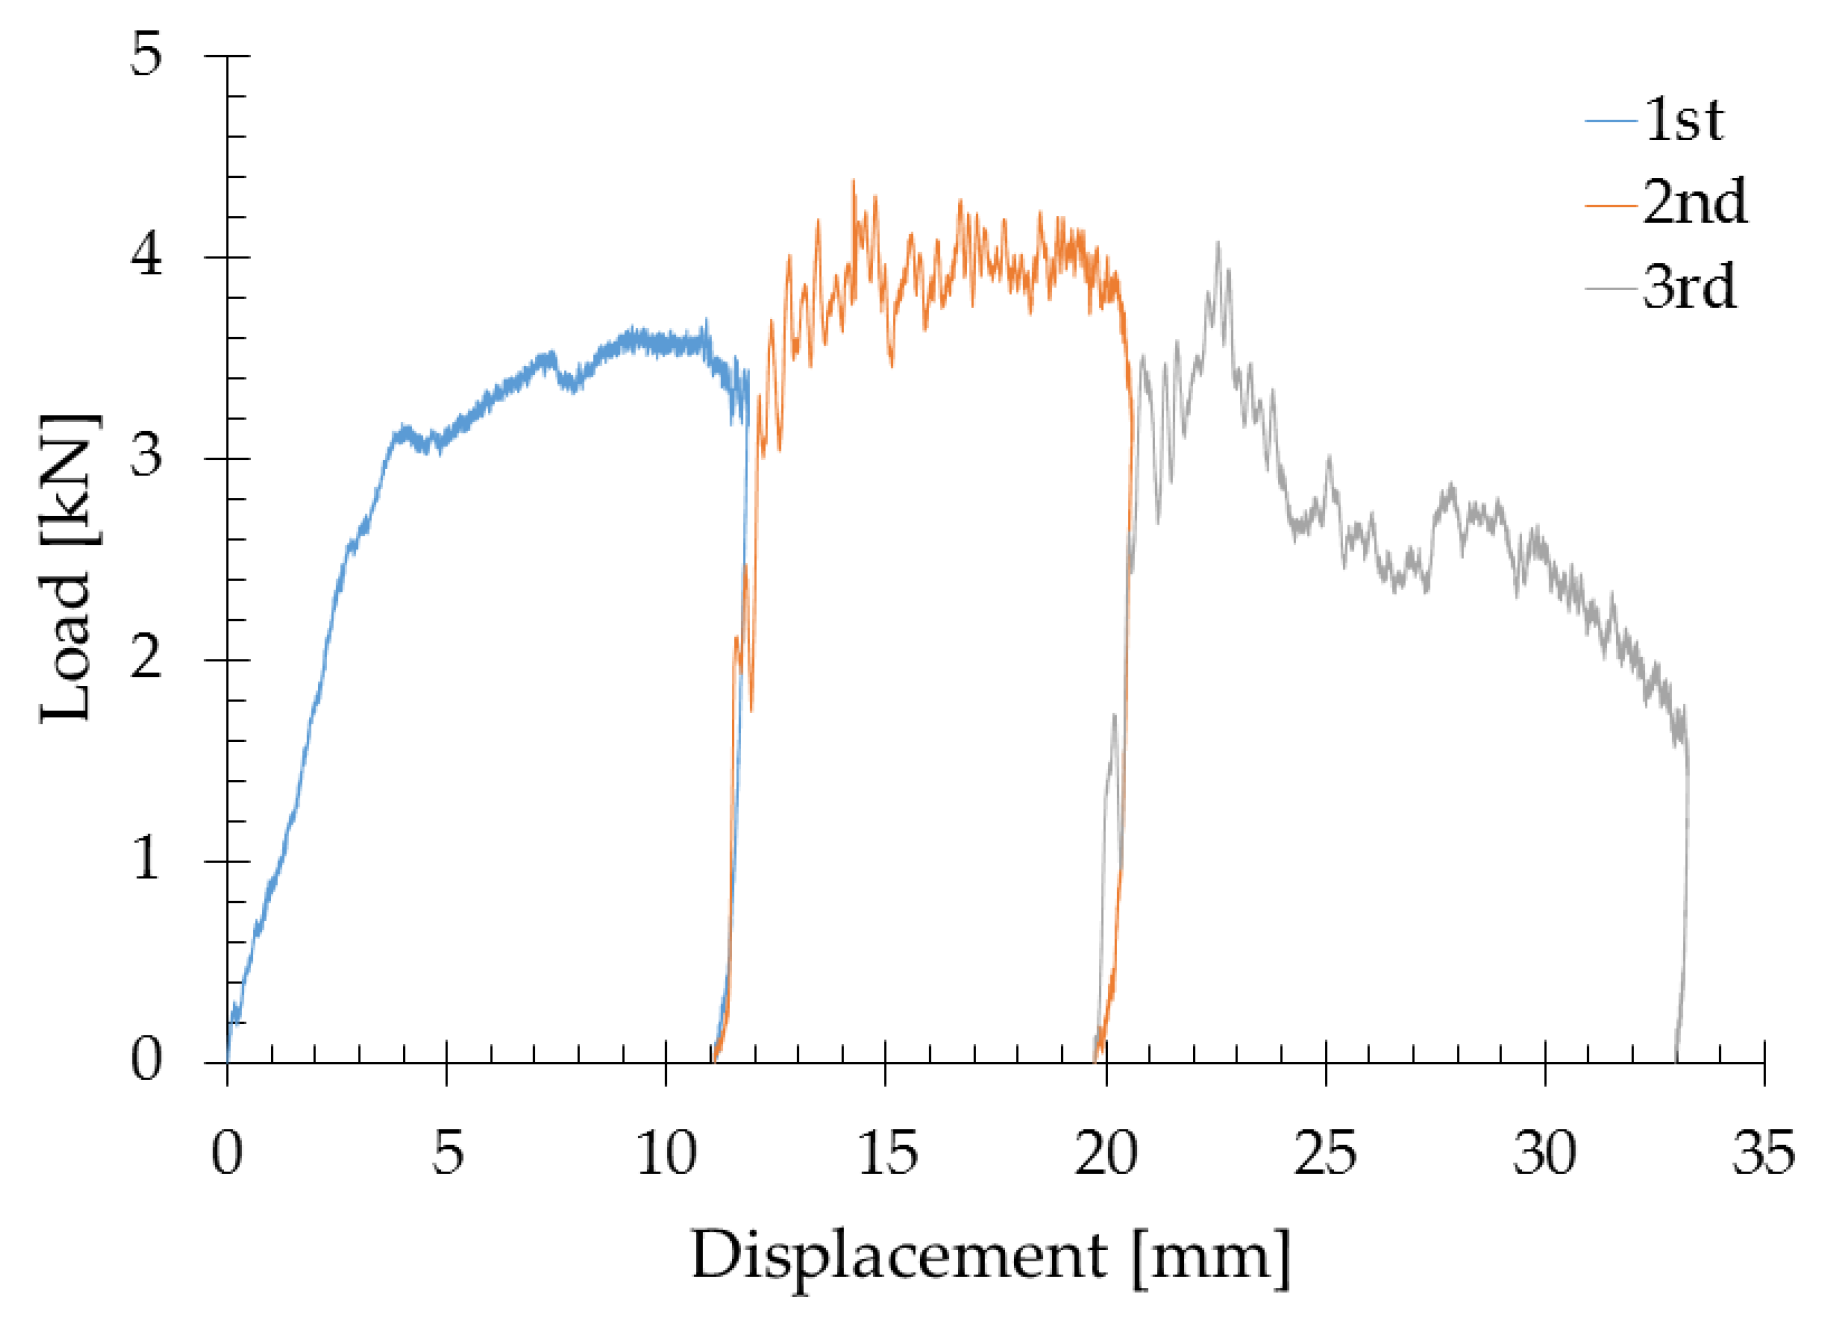
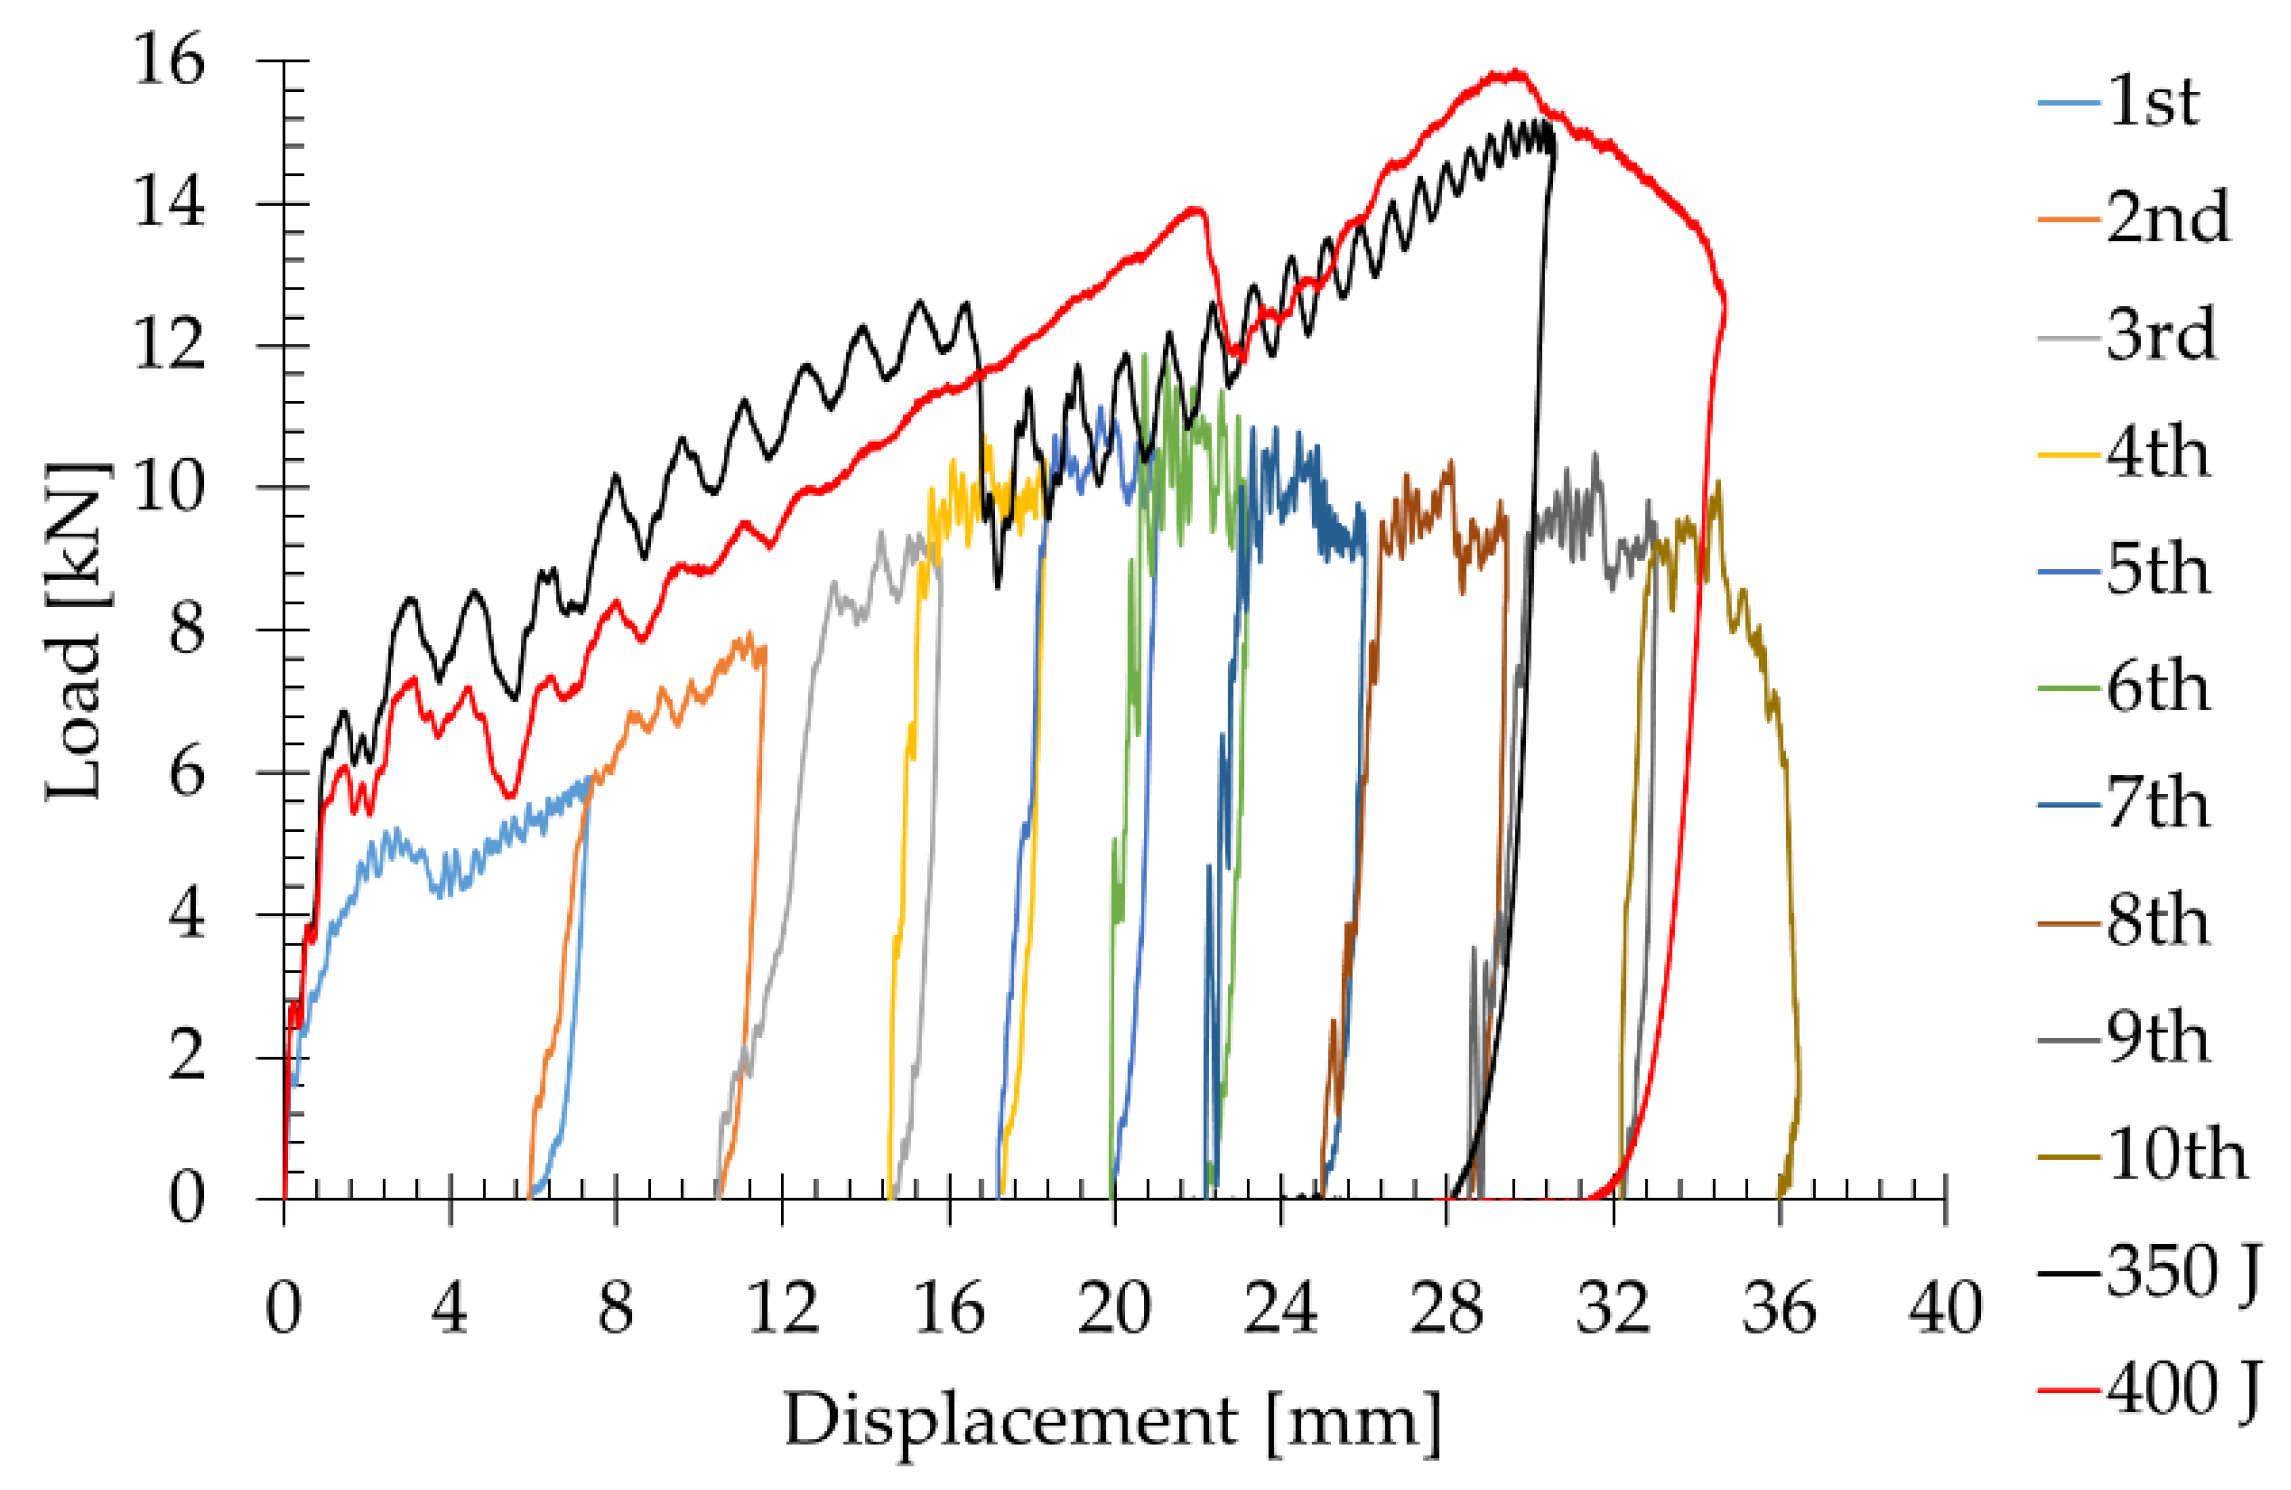
Figure 9 shows the load–displacement curves for a Type II specimen subjected to repeated impact tests, including stages of loading and unloading at an impact energy equal to 35 J. The impact repeating was sustained until the full panel perforation. Figure 10 shows the load–displacement curves obtained by three tests on Type IV specimens, namely, a single impact test at an impact energy equal to 350 J, a single impact test at an impact energy equal to 400 J and a repeated impact test at an impact energy equal to 35 J.
According to the results (Figure 8 and Figure 10), the behaviours of the AFS panels under repeated impacts were similar to those observed for the AHS panels [18,20]. The unloading stiffness after an impact was almost equal to the loading stiffness of the next impact (Figure 8 and Figure 9). As the impact number increased, the peak force and the loading stiffness increased, while the displacement decreased (Figure 8). With the increase in the impact number, the foam core compressed, gradually reaching the densification stage, and the foam panel was strengthened, resulting in an increase of the impact force and a reduction of the permanent deflection. The following results were obtained considering all ten repeated impact tests at an impact energy Ei equal to 35 J: Ea = 308 J, FMAX = 1.19E×104 N, SAE = 0.487 J·m3/kg (evaluated considering the initial value of specimen density ρ = 632 kg/m3, while the core density ρcore = 510 kg/m3) and SAEw = 3743 J/kg. The ten repeated impact tests at an impact energy Ei equal to 35 J produced a lower value of peak load (FMAX) and higher value of depth (w) respective to the values obtained by the single impact test carried out on a Type IV specimen at an impact energy Ei equal to 350 J (Figure 10). The initial slope of the load–displacement curve and the slope after the first peak load were similar for the three tests (repeated impact test at impact energy equal to 35 J and single impact test at impact energies equal to 350 and 400 J), as shown in Figure 10.
Concerning the load trend during the repeated impact tests carried out on the Type IV specimen, the load value increased up to the 6th impact, which produced the initial skin perforation, and a peak value of 1.19 × 10⁴ N was achieved (Figure 8). The load variation for each impact test is reported in Table 3.
The full skin perforation occurred after the 8th impact, highlighted by the increase in load value in the 9th impact test, when the skin effect was no longer present.
Concerning the depth trend during the repeated impact tests carried out on the Type IV specimen, the depth value decreased after each impact due to core crushing and densification, up to the 6th impact, which produced the initial skin perforation. Then, the depth value highly increased after the 7th and 8th impacts, when full skin perforation occurred. The depth value was almost constant, with a small percentage variation after the 8th, 9th and 10th impacts, where the effect of the skin was missing. The total depth calculated after 10 impacts was 36.45 mm, corresponding to the complete panel perforation.
The load and depth variation for each impact test are reported in Table 3.
Table 4 shows the comparison between the repeated impact tests and the single impact test at 350 J for the Type IV panel in terms of the maximum values of load FMAX and depth.
3.3. Nondestructive Evaluation
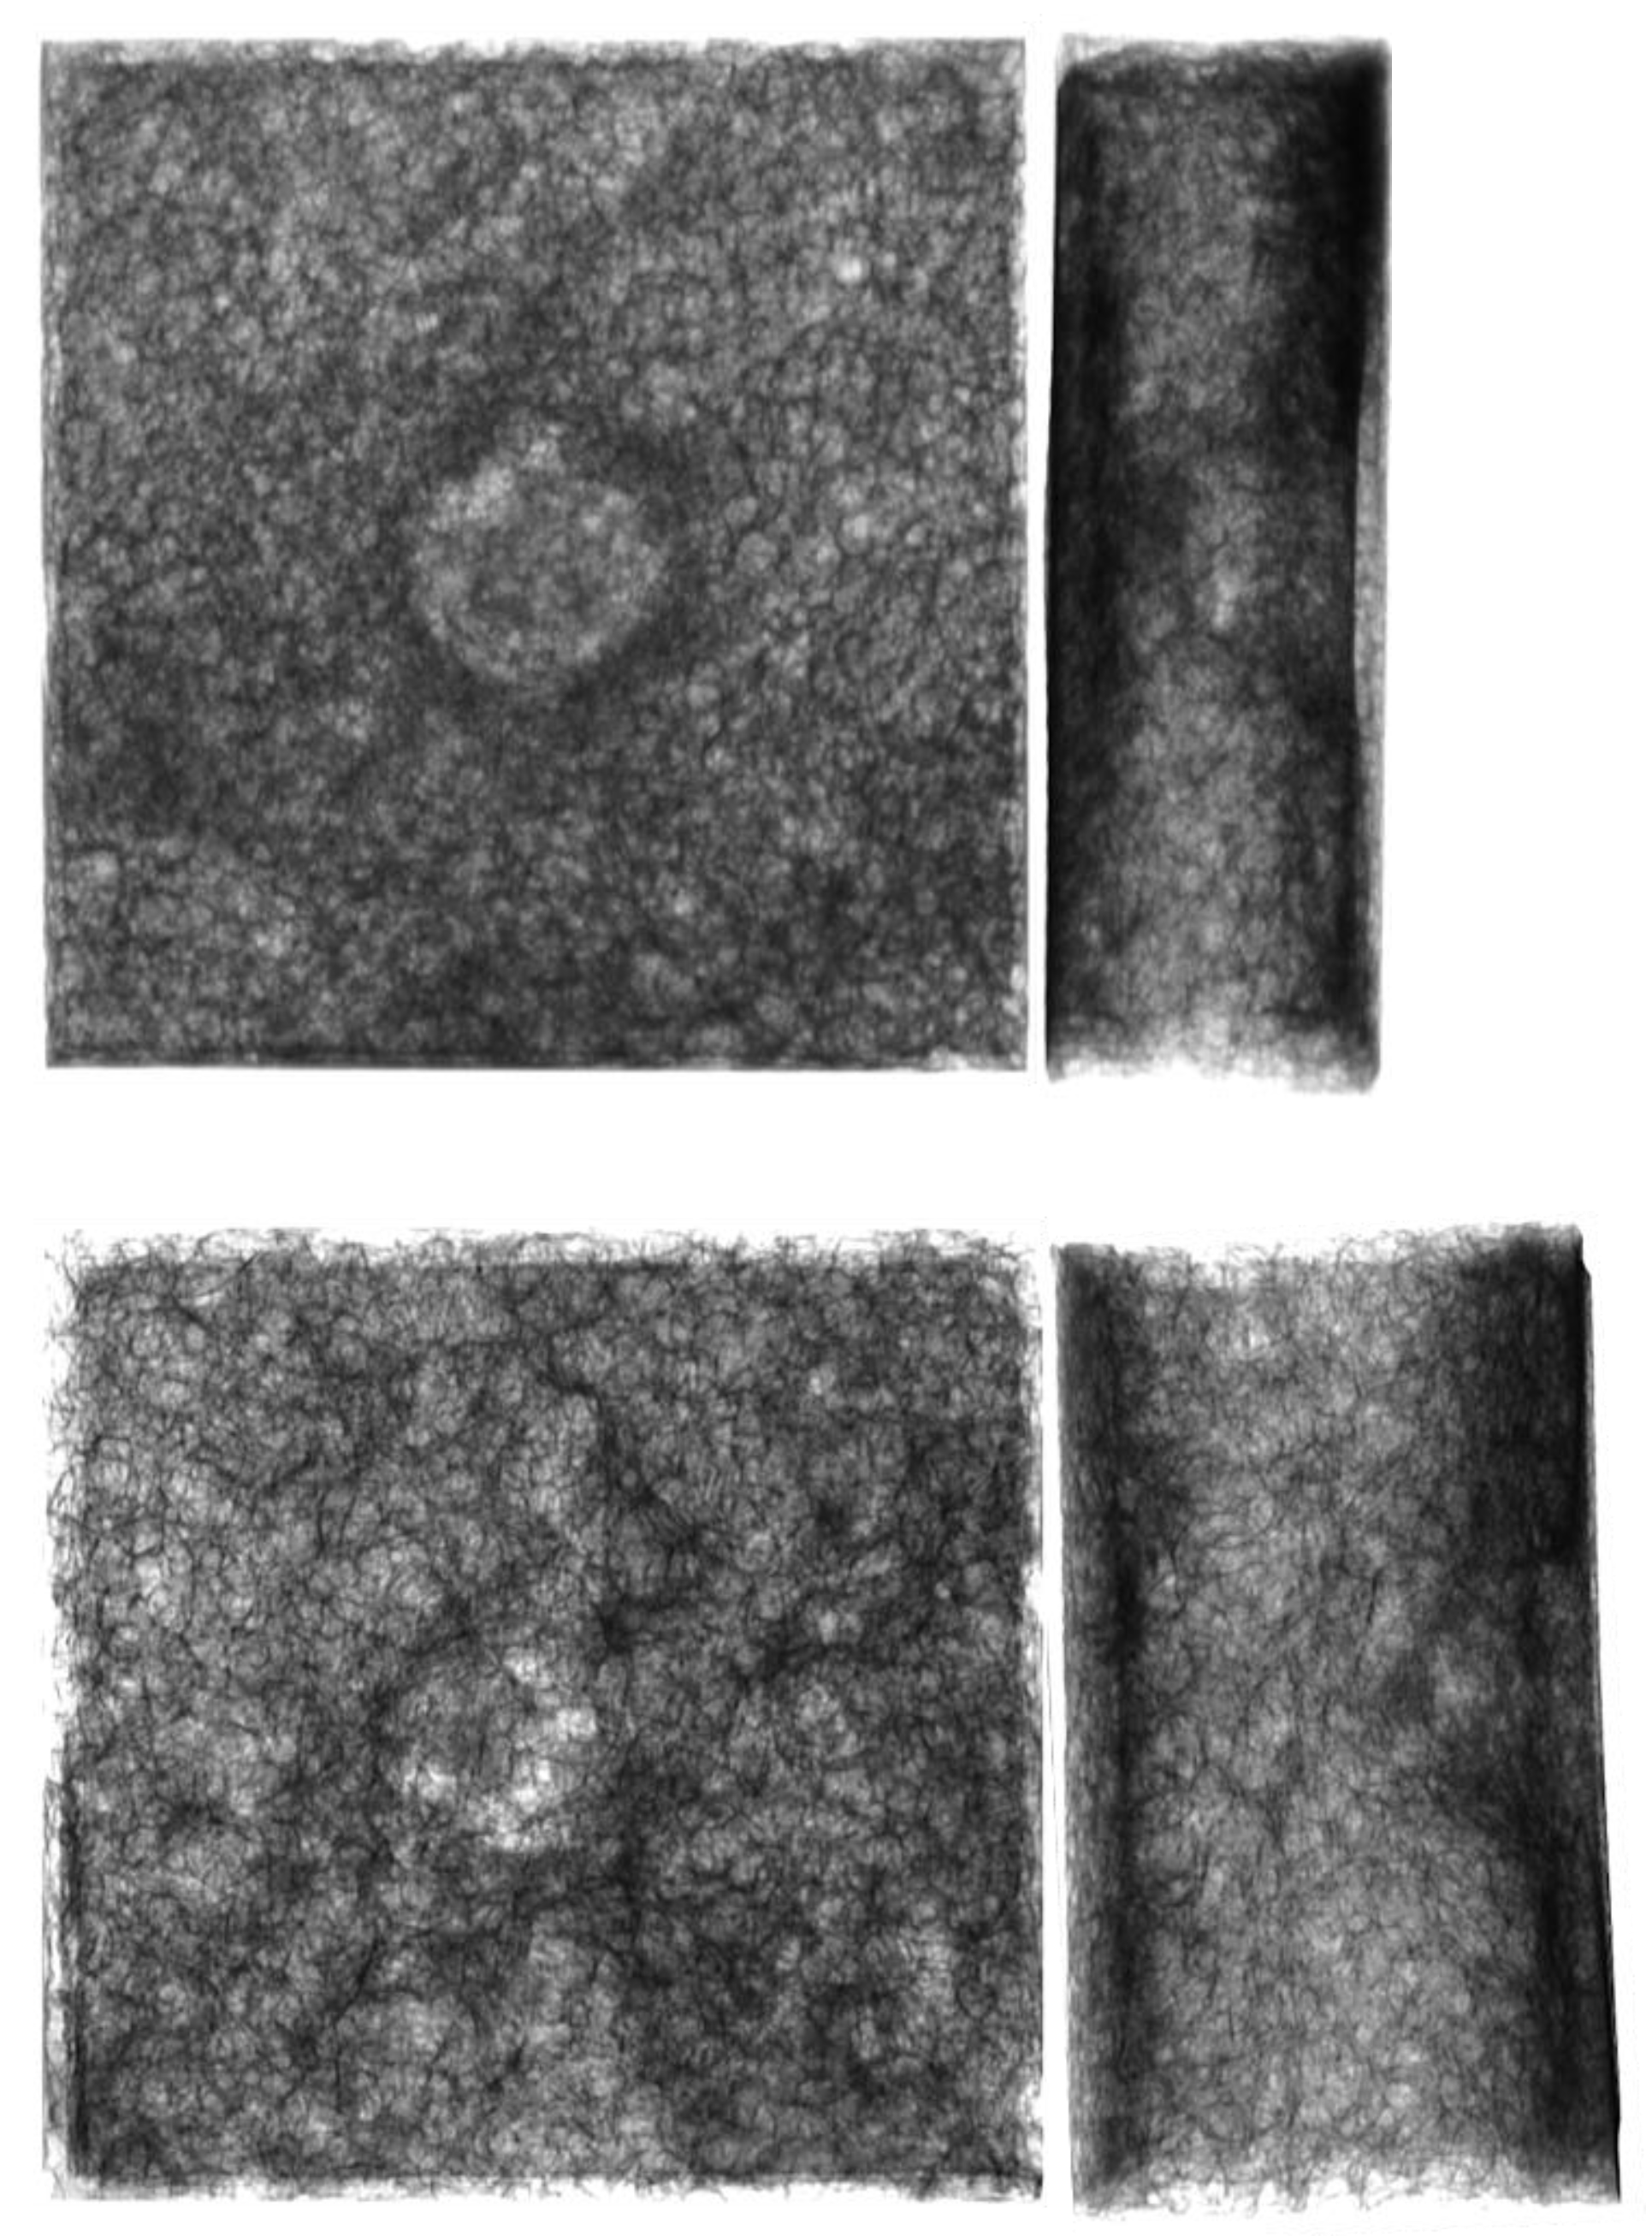
Nondestructive evaluation by means of DR allowed damage detection in the AF specimens without skins subjected to an energy impact of 35 J (Figure 11). Thus, considering the very low level of the impact energy, the detected foam damage involved only the foam under the indenter nose without provoking perforation. The impact damage could be assessed by analysing the grey levels, which describe densification in the darker regions and cell failure in the lighter ones. The damage depth could be observed only in the side projection, which is not possible to perform in onsite application with portable equipment. Nevertheless, due to a high content of air with a composite-specific, near-wall probe, ultrasonic waves could not penetrate the specimens. Thus, UPA did not allow inspection of the specimens without external skins (Types I and II).
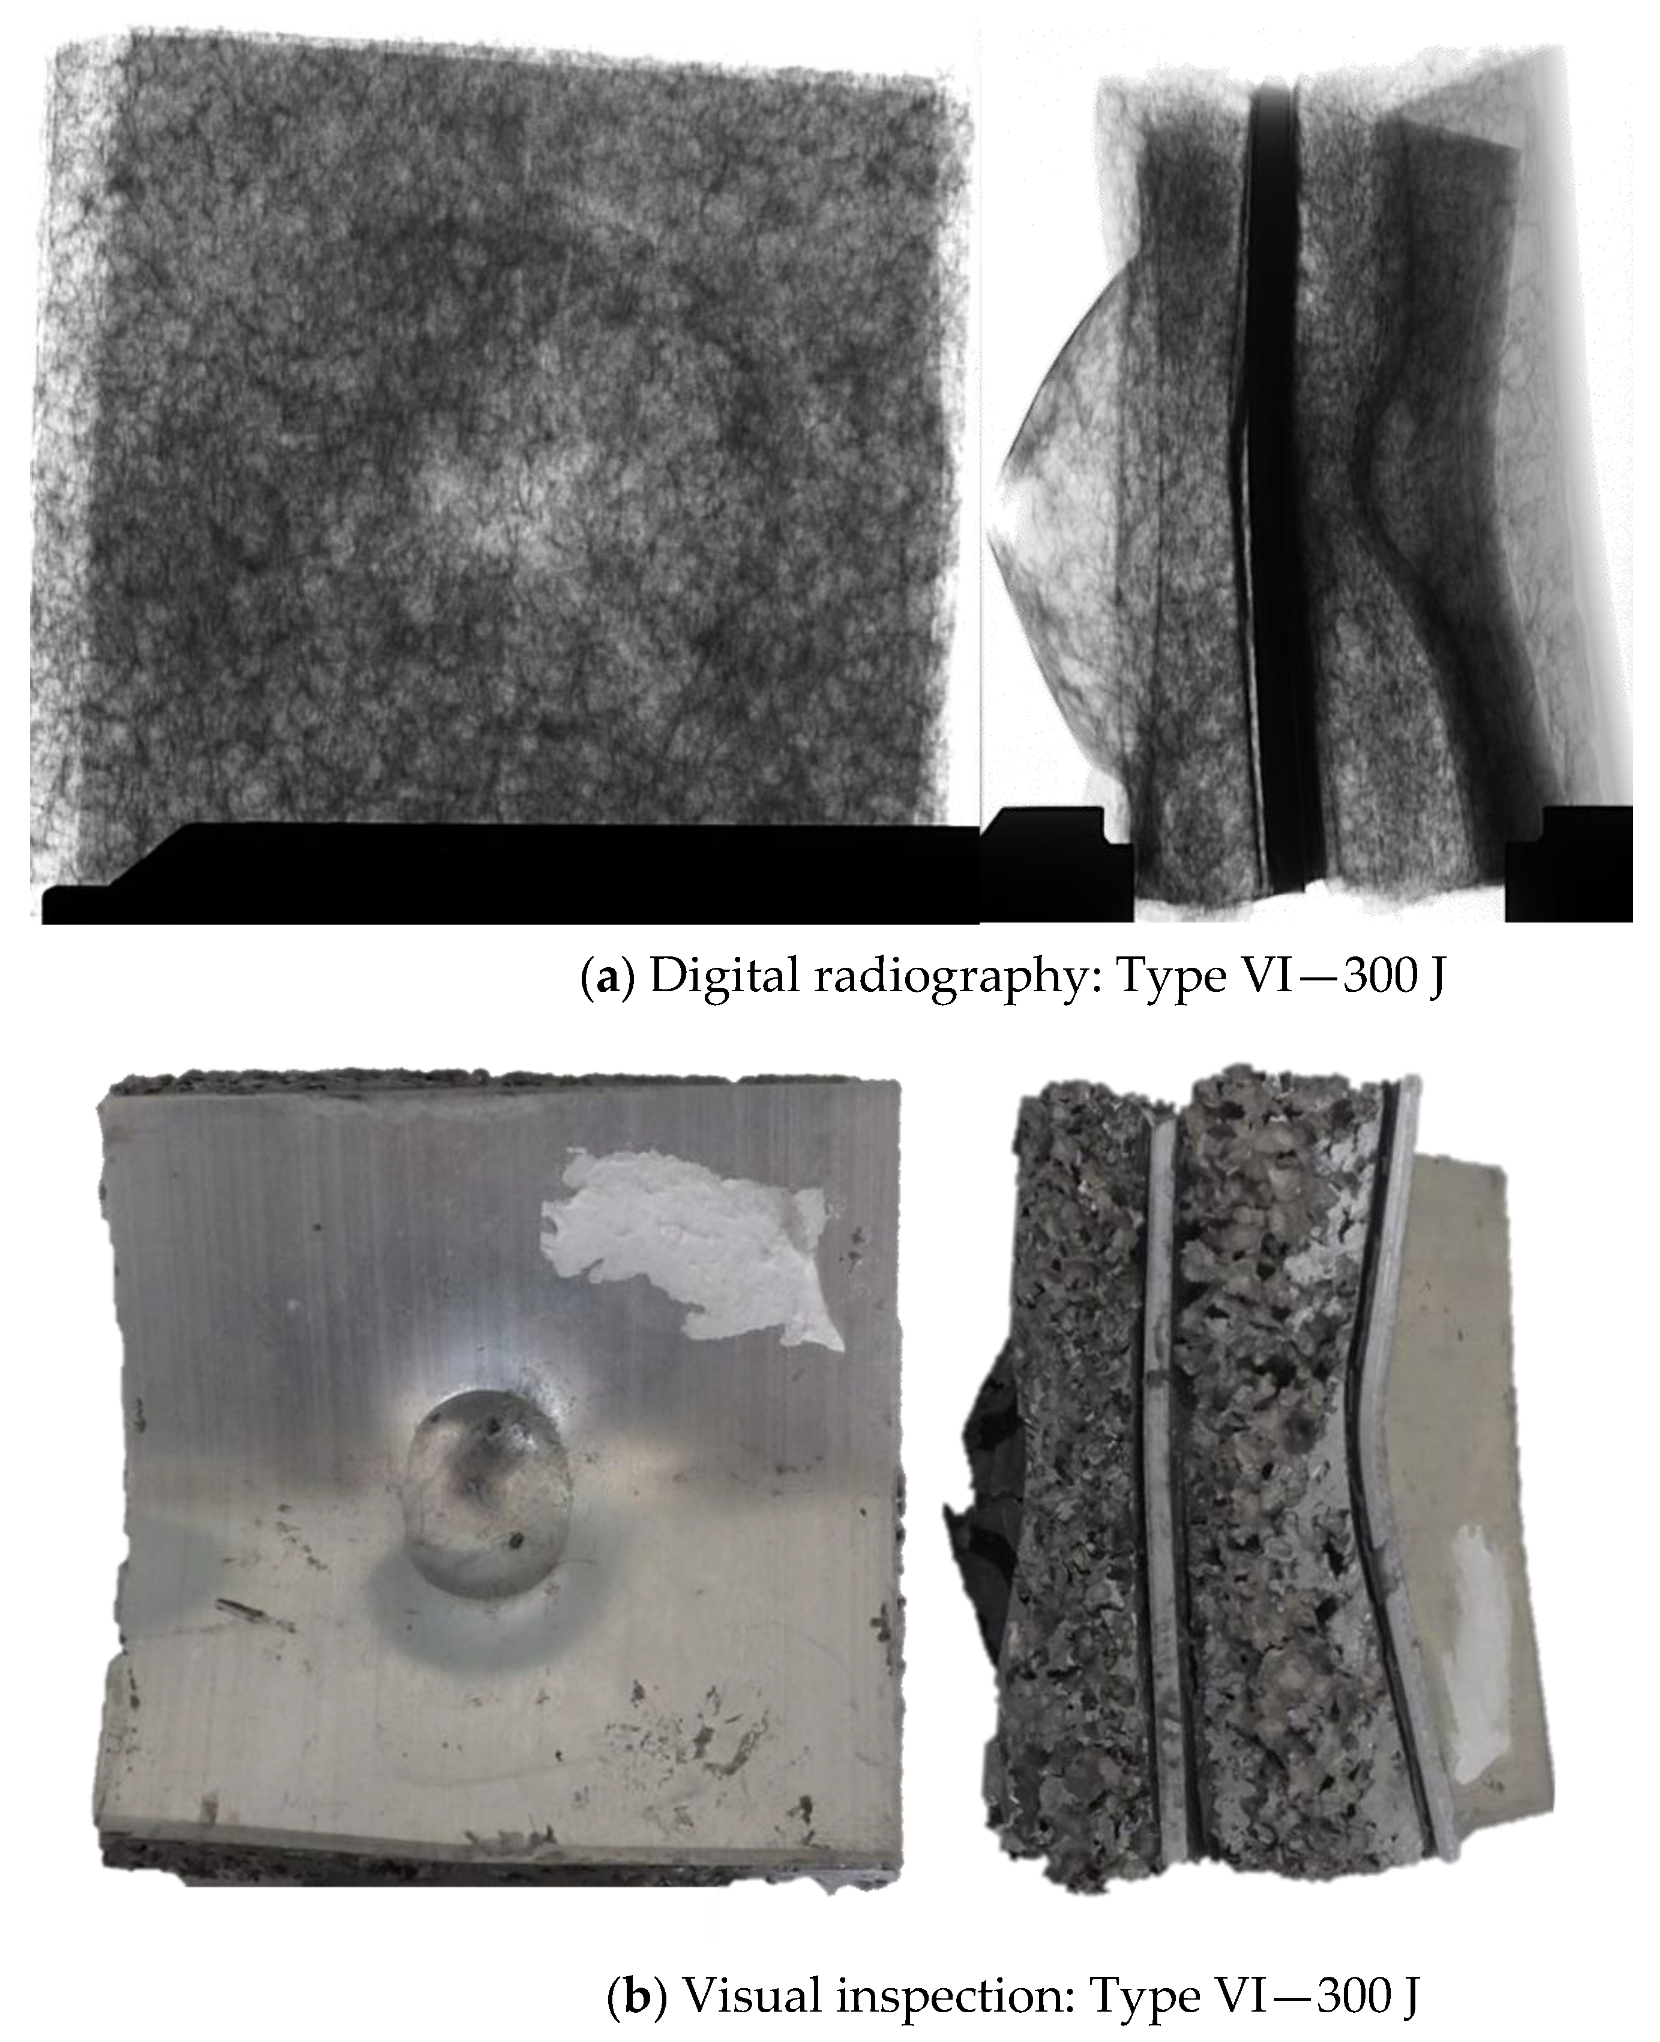
In the double-layer specimens (Type VI), UPA did not allow obtainment of reliable results, while damage detection was evaluated by the DR technique. As depicted in Figure 12a, the core damage (lighter area in the centre of the specimen) could be easily observed also in the case in which upper skin fracture did not occur. Obviously, such damage could not be detected by visual inspection (Figure 12b). In the side projection, global bending without perforation produced the damage of the inner skin was observed. Thus, the energy absorbing mechanism was mainly due to the global compression strain, which involved the second layer. A similar behaviour was detected for double-layer AHS panels [10].
By analysing the load–displacement curves reported in Figure 4d–f for Type VI, an abrupt decrease in load, at about 8–9 mm in depth, was seen. This load drop was probably due to the collapse mechanism of double-layer AF panels. Moreover, a global densification damage, due to the collapse of the AF cell walls, occurred in the bottom layer of Type VI panels for impact energies over 150 J, as demonstrated by the radiographic and visual inspections, shown in Figure 12a,b. A similar behaviour was reported in [10].
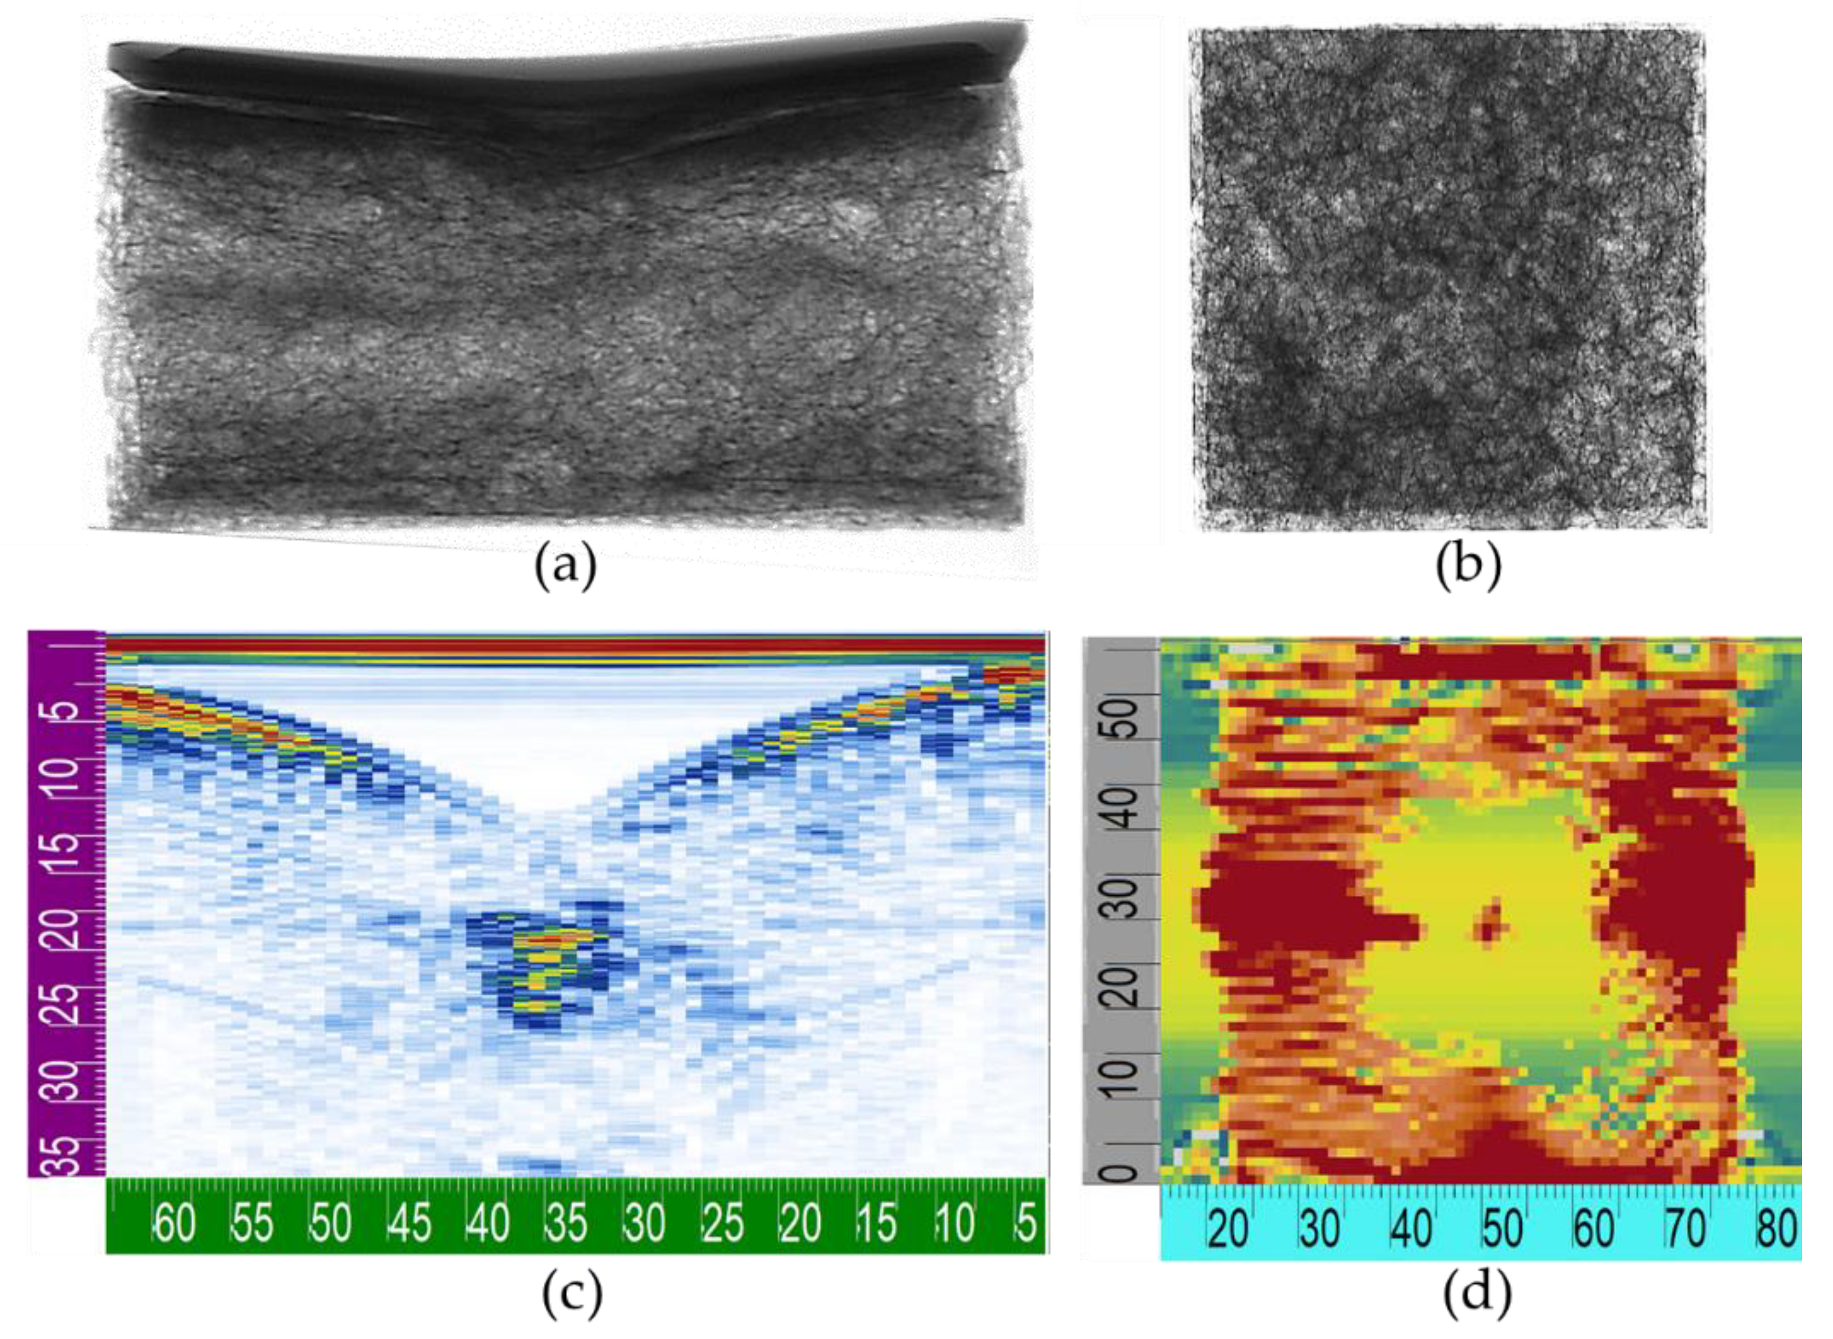
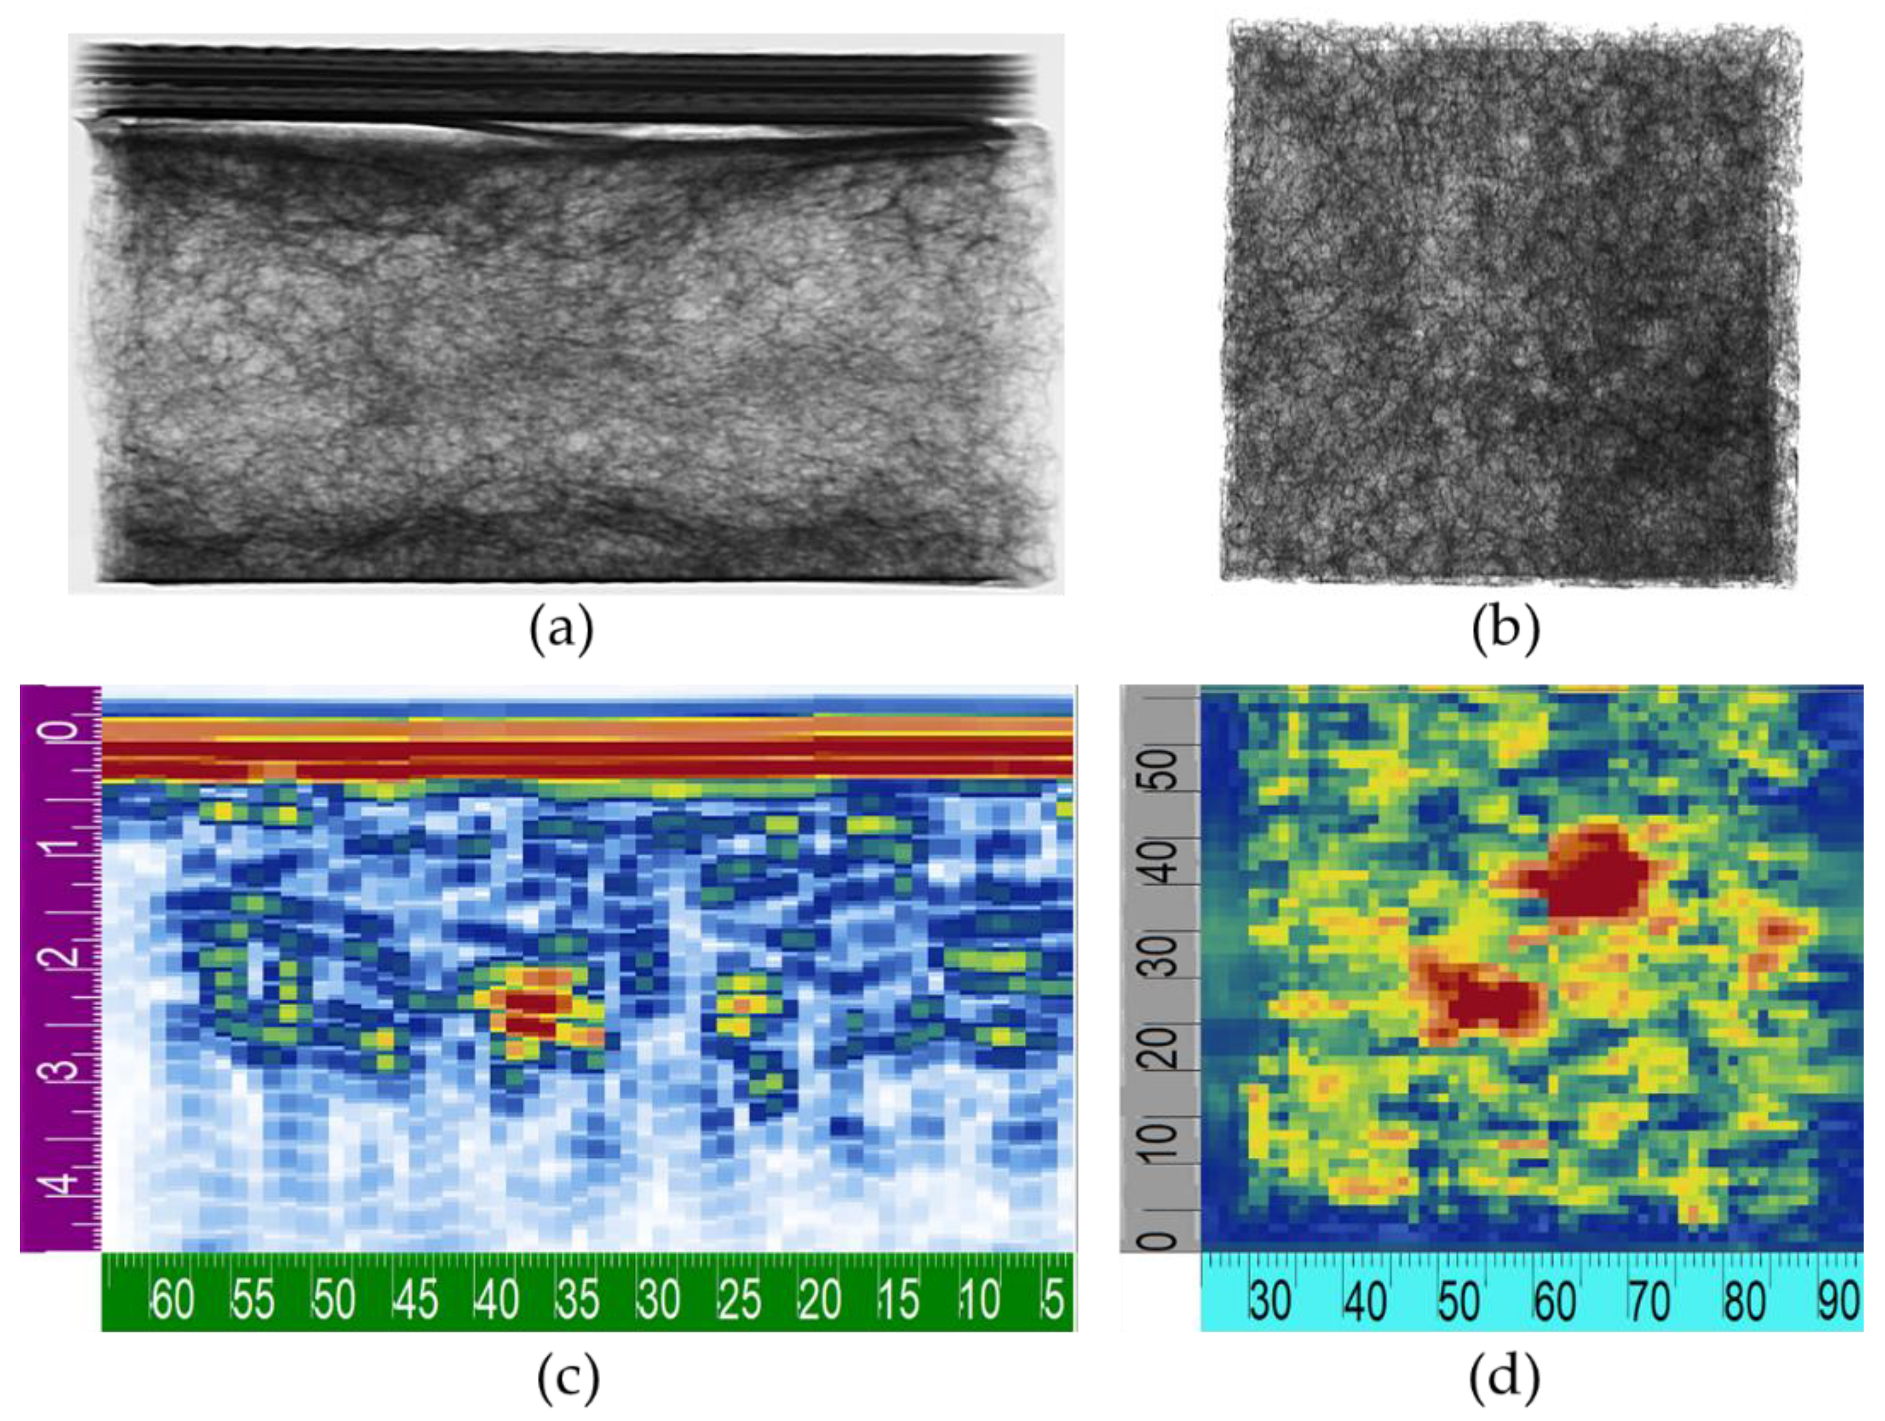
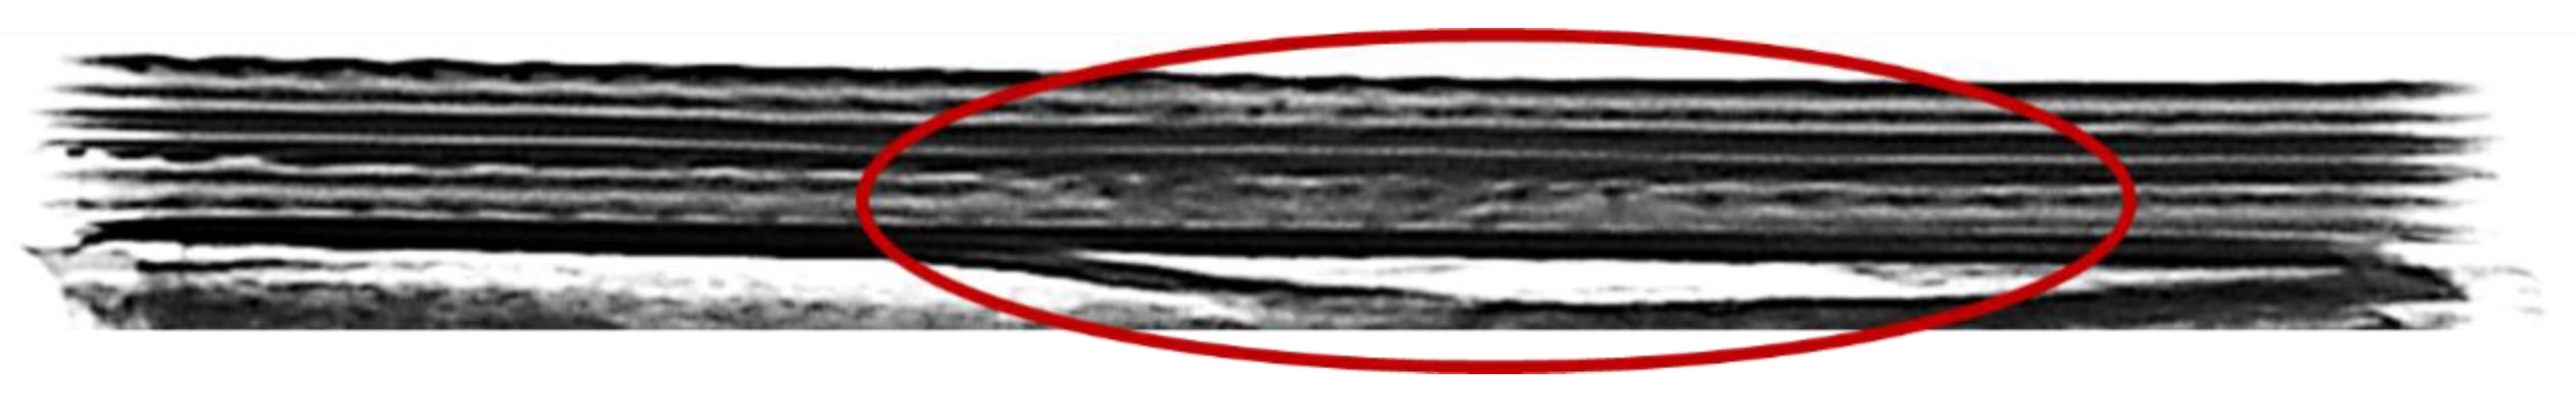
UPA was successfully applied for damage evaluation of Type IV specimens (as reported in a previous study [13]) also in the case in which the damage was provoked by a second impact at the same energy (35 J, Figure 13). Indeed, ultrasonic waves easily detected both the densification areas in about the mid-depth of the specimen (Figure 13c) and the debonding between skin and core. The latter was barely detected by DR due to superimposition of all projections (Figure 13a,b). Core densification was detected in the darker zone in the mid-depth of the specimen. Different considerations can be drawn for the Type V specimens, since UPA was well-suitable for damage evaluation of the skin only (Figure 14c,d). Indeed, due to the high beam attenuation of the skin, ultrasonic waves could not reach the foam bottom without allowing damage detection of the core. As demonstrated in a previous research paper [13], UPA allows the detection of skin delamination and fibre failure. Thus, it remains the most suitable technique for this kind of specimens. By analysing the radiographic images (Figure 14b), the skin damage cannot be properly resolved with this focal spot size. In the side view (Figure 14a and Figure 15), the skin damage was barely detected.
4. Conclusions
The impact behaviours of six different types of aluminium foam panels were investigated by means of LVI tests at different impact energies, ranging from 35 to 400 J. The following findings can be outlined:
- The response of different types of AFS panels with skins was similar at the same impact energy, while the AF panels without skins had a different impact behaviour with lower values of FMAX and higher values of w and SAE;
- AFS panels highlighted similar values of maximum SAE compared to AHS panels with 3 mm cell diameter;
- The maximum SAE showed a linear trend with respect to the total thickness of the panels;
- The LVI behaviours of AFS panels under repeated impacts were similar to that observed for the AHS panels. The unloading stiffness after an impact was almost equal to the loading stiffness of the next impact. As the impact number increased, the FMAX and the loading stiffness increased, while the increment of the displacement decreased;
- Ten repeated impact tests at the impact energy equal to 35 J on the same panel produced lower values of FMAX and w with respect to the single impact test at 350 J;
- UPA represented an effective technique for damage detection in AFS panels with aluminium skins, while DR was able to detect foam densification and skin fracture due to the impact event. Both techniques can be applied, with some limitations, for damage detection of real foam-based structures;
- The results of this comprehensive experimental investigation are useful for determining impact performance and optimization design of lightweight AF and AFS panels used in various engineering applications.
Author Contributions
Conceptualization, E.L., V.C. and G.E.; methodology, F.D. and G.E.; investigation, F.D. and G.E.; resources, E.L.; data curation, F.D. and G.E.; writing—original draft preparation, V.C., G.E. writing—review and editing, V.C., G.E., E.L., H.M.; visualization, H.M. and F.D.; supervision, V.C. All authors have read and agreed to the published version of the manuscript.
Funding
This research received no external funding.
Conflicts of Interest
The authors declare no conflict of interest.
Nomenclature
| AF | Aluminium Foam |
| AFS | Aluminium Foam Sandwich |
| AHS | Aluminium Honeycomb Sandwich |
| a(t) | Acceleration (m/s2) |
| c-hi | Clamped hemispherical indenter |
| D | Flexural stiffness (N·mm) |
| DR | Digital Radiography |
| E | Young’s modulus (MPa) |
| Ea | Absorbed energy during impact event (J) |
| Ei | Impact energy (J) |
| F(t) | Force (N) |
| FMAX | Impact peak crush force (N) |
| GFRP | Glass fibre-reinforced polymer |
| LVI | Low-velocity impact |
| M | Impactor mass (kg) |
| MFS | Metallic Foam Shell |
| NDE | Non-Destructive Evaluation |
| P | Impactor weight (kg m/s2) |
| SAE | Specific Absorbed Energy (J m3/kg) |
| SAEw | Weight Specific Absorbed Energy (J/kg) |
| ss-ci | Simply supported conical indenter |
| ss-hi | Simply supported hemispherical indenter |
| t | Time (s) |
| tcore | Core thickness (mm) |
| tskin | Skin thickness (mm) |
| ttot | Total thickness (mm) |
| UPA | Ultrasonic phased array |
| v0 | Initial velocity (m/s) |
| w | Depth (mm) |
| εmax | Maximum strain (%) |
| ρ | Specimen density (kg/m3) |
| ρcore | Core density (kg/m3) |
| σu | Ultimate stress (MPa) |
References
- Abrate, S. Impact on Composite Structures; Cambridge University Press: Cambridge, UK, 1998; ISBN 9780521473897. [Google Scholar]
- Sutherland, L.S. A review of impact testing on marine composite materials: Part I—Marine impacts on marine composites. Compos. Struct. 2018, 188, 197–208. [Google Scholar] [CrossRef]
- Akil Hazizan, M.; Cantwell, W.J. The low velocity impact response of an aluminium honeycomb sandwich structure. Compos. Part B Eng. 2003, 34, 679–687. [Google Scholar] [CrossRef]
- Foo, C.C.; Seah, L.K.; Chai, G.B. Low-velocity impact failure of aluminium honeycomb sandwich panels. Compos. Struct. 2008, 85, 20–28. [Google Scholar] [CrossRef]
- Crupi, V.; Kara, E.; Epasto, G.; Guglielmino, E.; Aykul, H. Theoretical and experimental analysis for the impact response of glass fibre reinforced aluminium honeycomb sandwiches. J. Sandw. Struct. Mater. 2018, 20, 42–69. [Google Scholar] [CrossRef]
- Yu, J.L.; Wang, E.; Li, J.; Zheng, Z. Static and low-velocity impact behavior of sandwich beams with closed-cell aluminum-foam core in three-point bending. Int. J. Impact Eng. 2008, 35, 885–894. [Google Scholar] [CrossRef]
- Huo, X.; Liu, H.; Luo, Q.; Sun, G.; Li, Q. On low-velocity impact response of foam-core sandwich panels. Int. J. Mech. Sci. 2020, 181, 105681. [Google Scholar] [CrossRef]
- Rajaneesh, A.; Sridhar, I.; Rajendran, S. Relative performance of metal and polymeric foam sandwich plates under low velocity impact. Int. J. Impact Eng. 2014, 65, 126–136. [Google Scholar] [CrossRef]
- Linul, E.; Marsavina, L.; Kováčik, J. Collapse mechanisms of metal foam matrix composites under static and dynamic loading conditions. Mater. Sci. Eng. A 2017, 690, 214–224. [Google Scholar] [CrossRef]
- Palomba, G.; Epasto, G.; Crupi, V.; Guglielmino, E. Single and double-layer honeycomb sandwich panels under impact loading. Int. J. Impact Eng. 2018, 121, 77–90. [Google Scholar] [CrossRef]
- Mozafari, H.; Khatami, S.; Molatefi, H. Out of plane crushing and local stiffness determination of proposed foam filled sandwich panel for Korean Tilting Train eXpress—Numerical study. Mater. Des. 2015, 66, 400–411. [Google Scholar] [CrossRef]
- Sakly, A.; Laksimi, A.; Kebir, H.; Benmedakhen, S. Experimental and modelling study of low velocity impacts on composite sandwich structures for railway applications. Eng. Fail. Anal. 2016, 68, 22–31. [Google Scholar] [CrossRef]
- Epasto, G.; Distefano, F.; Gu, L.; Mozafari, H.; Linul, E. Design and optimization of Metallic Foam Shell protective device against flying ballast impact damage in railway axles. Mater. Des. 2020, 196, 109120. [Google Scholar] [CrossRef]
- Han, Z.; Li, C.; Deng, Y.; Liu, J. The analysis of anti-collision performance of the fender with offshore wind turbine tripod impacted by ship and the coefficient of restitution. Ocean Eng. 2019, 194, 106614. [Google Scholar] [CrossRef]
- Kaczyński, P.; Ptak, M.; Gawdzińska, K. Energy absorption of cast metal and composite foams tested in extremely low and high-temperatures. Mater. Des. 2020, 196, 109114. [Google Scholar] [CrossRef]
- Filetin, T.; Marić, G.; Kramer, I. Metal Foams in Shipbuilding. Brodogradnja 2005, 56, 228–237. [Google Scholar]
- D’Amore, G.K.O.; Mauro, F.; Marinò, A.; Caniato, M.; Kašpar, J. Towards the use of novel materials in shipbuilding: Assessing thermal performances of fire-doors by self-consistent numerical modelling. Appl. Sci. 2020, 10, 5736. [Google Scholar] [CrossRef]
- Zhang, Y.; Li, Y.; Guo, K.; Zhu, L. Dynamic mechanical behaviour and energy absorption of aluminium honeycomb sandwich panels under repeated impact loads. Ocean Eng. 2020, 108344. [Google Scholar] [CrossRef]
- He, X.; Soares, C.G. Experimental study on the dynamic behavior of beams under repeated impacts. Int. J. Impact Eng. 2021, 147, 103724. [Google Scholar] [CrossRef]
- Zhu, L.; Guo, K.; Li, Y.; Yu, T.X.; Zhou, Q. Experimental study on the dynamic behaviour of aluminium foam sandwich plates under single and repeated impacts at low temperature. Int. J. Impact Eng. 2018, 114, 123–132. [Google Scholar] [CrossRef]
- Guo, K.; Zhu, L.; Li, Y.; Yu, T.X.; Shenoi, A.; Zhou, Q. Experimental investigation on the dynamic behaviour of aluminum foam sandwich plate under repeated impacts. Compos. Struct. 2018, 200, 298–305. [Google Scholar] [CrossRef]
- Taheri, H.; Hassen, A.A. Nondestructive Ultrasonic Inspection of Composite Materials: A Comparative Advantage of Phased Array Ultrasonic. Appl. Sci. 2019, 9, 1628. [Google Scholar] [CrossRef] [Green Version]
- Wang, Z.; Xiao, Z.; Li, Y.; Jiang, Y. An Omnidirectional Near-Field Comprehensive Damage Detection Method for Composite Structures. Appl. Sci. 2019, 9, 567. [Google Scholar] [CrossRef] [Green Version]
- Corigliano, P.; Crupi, V.; Epasto, G.; Guglielmino, E.; Maugeri, N.; Marinò, A. Experimental and theoretical analyses of Iroko wood laminates. Compos. Part B Eng. 2017, 112, 251–264. [Google Scholar] [CrossRef]
- Boccardi, S.; Boffa, N.D.; Carlomagno, G.M.; Del Core, G.; Meola, C.; Monaco, E.; Russo, P.; Simeoli, G. Lock-In Thermography and Ultrasonic Testing of Impacted Basalt Fibers Reinforced Thermoplastic Matrix Composites. Appl. Sci. 2019, 9, 3025. [Google Scholar] [CrossRef] [Green Version]
- Meola, C.; Boccardi, S.; Carlomagno, G.M.; Boffa, N.D.; Monaco, E.; Ricci, F. Nondestructive evaluation of carbon fibre reinforced composites with infrared thermography and ultrasonics. Compos. Struct. 2015, 134, 845–853. [Google Scholar] [CrossRef]
- Samal, S.; Kolinova, M.; Rahier, H.; Dal Poggetto, G.; Blanco, I. Investigation of the Internal structure of fiber reinforced geopolymer composite under mechanical impact: A micro computed tomography (µCT) study. Appl. Sci. 2019, 9, 516. [Google Scholar] [CrossRef] [Green Version]
- Palomba, G.; Crupi, V.; Epasto, G. Collapse modes of aluminium honeycomb sandwich structures under fatigue bending loading. Thin Walled Struct. 2019, 145, 106363. [Google Scholar] [CrossRef]
- Militello, C.; Bongiorno, F.; Epasto, G.; Zuccarello, B. Low-velocity impact behaviour of green epoxy biocomposite laminates reinforced by sisal fibers. Compos. Struct. 2020, 253, 112744. [Google Scholar] [CrossRef]
- Eva, Z.; Kamila, H.; Tereza, K.; Patrik, S.; Jiří, Š.; Ondřej, A. NDT methods suitable for evaluation the condition of military fortification construction in the field. Appl. Sci. 2020, 10, 8161. [Google Scholar] [CrossRef]
- Hou, W.; Zhang, D.; Wei, Y.; Guo, J.; Zhang, X. Review on computer aided weld defect detection from radiography images. Appl. Sci. 2020, 10, 1878. [Google Scholar] [CrossRef] [Green Version]
- Zhang, J.; Guo, Z.; Jiao, T.; Wang, M. Defect detection of aluminum alloy wheels in radiography images using adaptive threshold and morphological reconstruction. Appl. Sci. 2018, 8, 2365. [Google Scholar] [CrossRef] [Green Version]
- Kováčik, J.; Marsavina, L.; Linul, E. Poisson’s ratio of closed-cell aluminium foams. Materials 2018, 11, 1904. [Google Scholar] [CrossRef] [PubMed] [Green Version]
- Rajak, D.; Pagar, D.; Menezes, P.; Linul, E. Fiber-reinforced polymer composites: Manufacturing, properties, and applications. Polymers 2019, 11, 1667. [Google Scholar] [CrossRef] [PubMed] [Green Version]
Figure 1.
Investigated AF panels: Type I (a), Type II (b), Type III (c), Type IV (d), Type V (e) and Type VI (f).
Figure 1.
Investigated AF panels: Type I (a), Type II (b), Type III (c), Type IV (d), Type V (e) and Type VI (f).

Figure 2.
Conical (a) and hemispherical (b) impactor.

Figure 3.
Radiographic system.

Figure 4.
Load–displacement curves at different impact energies.


Figure 5.
Load–displacement curves at different impact energies for each type of AF panels with and without aluminium skins.
Figure 5.
Load–displacement curves at different impact energies for each type of AF panels with and without aluminium skins.


Figure 6.
Maximum SAE versus total thickness.

Figure 7.
Load–displacement curves at impact energy equal to 35 J. (a) First impact tests and (b) second impact tests.
Figure 7.
Load–displacement curves at impact energy equal to 35 J. (a) First impact tests and (b) second impact tests.

Figure 8.
Loading and unloading curves for a Type IV specimen subjected to repeated impacts at impact energy equal to 35 J.
Figure 8.
Loading and unloading curves for a Type IV specimen subjected to repeated impacts at impact energy equal to 35 J.

Figure 9.
Loading and unloading curves for a Type II specimen subjected to repeated impacts at an impact energy equal to 35 J.
Figure 9.
Loading and unloading curves for a Type II specimen subjected to repeated impacts at an impact energy equal to 35 J.

Figure 10.
Load-displacements curves obtained by three tests on Type IV specimens.

Figure 11.
Radiographic images for Type I (upper) and Type II (below) AF specimens subjected to an energy impact of 35 J.
Figure 11.
Radiographic images for Type I (upper) and Type II (below) AF specimens subjected to an energy impact of 35 J.

Figure 12.
(a) Radiographic and (b) visual inspections for Type VI specimen subjected to an energy impact of 300 J.
Figure 12.
(a) Radiographic and (b) visual inspections for Type VI specimen subjected to an energy impact of 300 J.

Figure 13.
(a,b) Radiographic and (c,d) UPA inspections for Type IV specimen subjected to a second impact of 35 J.
Figure 13.
(a,b) Radiographic and (c,d) UPA inspections for Type IV specimen subjected to a second impact of 35 J.

Figure 14.
(a,b) Radiographic and (c,d) UPA inspections for Type V specimen subjected to an impact of 35 J.
Figure 14.
(a,b) Radiographic and (c,d) UPA inspections for Type V specimen subjected to an impact of 35 J.

Figure 15.
A particular of radiographic inspection for Type V specimen subjected to an impact of 35 J. Skin damage is highlighted by the red circle.
Figure 15.
A particular of radiographic inspection for Type V specimen subjected to an impact of 35 J. Skin damage is highlighted by the red circle.


Table 1.
Results of the impact tests.
| Specimen | Type | Ei [J] | ρcore [kg/m3] | ttot [mm] | Skins | w [mm] | FMAX [N] | SAEw [J/kg] | SAE [J·m3/kg] |
|---|---|---|---|---|---|---|---|---|---|
| 1 | I | 35 | 642 | 20 | no | 12 | 5.01 × 10³ | 723 | 0.053 |
| 2 | II | 35 | 453 | 34 | no | 12 | 3.70 × 10³ | 603 | 0.073 |
| 3 | IV | 35 | 430 | 36 | Al | 7 | 5.62 × 10³ | 446 | 0.057 |
| 4 | V | 35 | 468 | 38 | GFRP | 7 | 5.71 × 10³ | 392 | 0.054 |
| 5 | I | 70 | 477 | 20 | no | 28 | 3.88 × 10³ | 2025 | 0.147 |
| 6 | II | 70 | 563 | 34 | no | 19 | 4.40 × 10³ | 985 | 0.121 |
| 7 | III | 70 | 483 | 22 | Al | 12 | 8.62 × 10³ | 1279 | 0.100 |
| 8 | IV | 70 | 548 | 36 | Al | 13 | 8.08 × 10³ | 758 | 0.098 |
| 9 | III | 85 | 422 | 22 | Al | 15 | 7.81 × 10³ | 1757 | 0.137 |
| 10 | II | 100 | 556 | 34 | no | 25 | 5.95 × 10³ | 1411 | 0.176 |
| 11 | III | 100 | 476 | 22 | Al | 15 | 9.42 × 10³ | 1936 | 0.152 |
| 12 | IV | 100 | 525 | 36 | Al | 16 | 9.65 × 10³ | 1206 | 0.155 |
| 13 | VI | 100 | 505/508 | 44 | Al | 13 | 1.13 × 10⁴ | 885 | 0.140 |
| 14 | IV | 125 | 536 | 36 | Al | 15 | 1.12 × 10⁴ | 1414 | 0.191 |
| 15 | II | 150 | 583 | 34 | no | 31 | 7.39 × 10³ | 2049 | 0.256 |
| 16 | III | 150 | 531 | 22 | Al | 20 | 1.09 × 10⁴ | 2712 | 0.214 |
| 17 | IV | 150 | 549 | 36 | Al | 17 | 1.18×10⁴ | 1737 | 0.230 |
| 18 | VI | 150 | 425/428 | 44 | Al | 19 | 1.22 × 10⁴ | 1411 | 0.217 |
| 19 | III | 200 | 421 | 22 | Al | 27 | 1.07 × 10⁴ | 4065 | 0.313 |
| 20 | IV | 200 | 519 | 36 | Al | 22 | 1.25 × 10⁴ | 2386 | 0.31 |
| 21 | VI | 200 | 455/457 | 44 | Al | 23 | 1.72 × 10⁴ | 2042 | 0.313 |
| 22 | VI | 250 | 437/439 | 44 | Al | 27 | 1.73 × 10⁴ | 2363 | 0.372 |
| 23 | IV | 300 | 504 | 36 | Al | 29 | 1.33 × 10⁴ | 3398 | 0.434 |
| 24 | VI | 300 | 408/409 | 44 | Al | 29 | 1.88 × 10⁴ | 2774 | 0.432 |
| 25 | IV | 350 | 590 | 36 | Al | 31 | 1.52 × 10⁴ | 3393 | 0.449 |
| 26 | VI | 350 | 395/545 | 44 | Al | 27 | 2.40 × 10⁴ | 2956 | 0.461 |
| 27 | IV | 400 | 616 | 36 | Al | 35 | 1.59 × 10⁴ | 3829 | 0.508 |
| 28 | VI | 400 | 400/403 | 44 | Al | 33 | 2.63 × 10⁴ | 3746 | 0.592 |
Table 2.
Comparison of the maximum specific absorbed energy (SAE) among different sandwich structures.
Table 2.
Comparison of the maximum specific absorbed energy (SAE) among different sandwich structures.
| Sandwich Structures | Test Conditions | ρcore [kg/m3] | ttot [mm] | Maximum SAE [J m3/kg] |
|---|---|---|---|---|
| AFS Alulight with bonded skins | c-hi 1 | 906 | 11 | 0.140 |
| AFS Schunk with integral skins | c-hi | 674 | 11 | 0.131 |
| GFRP-AFS Alulight | c-hi | 1066 | 17.5 | 0.211 |
| GFRP-AFS Schunk | c-hi | 1032 | 17.5 | 0.218 |
| AHS d3 (cell diameter d = 3 mm) | c-hi | 674 | 11 | 0.131 |
| AHS d6 (cell diameter d = 6 mm) | c-hi | 639 | 11 | 0.138 |
| GFRP-AHS d3 | c-hi | 926 | 17.5 | 0.243 |
| GFRP-AHS d6 | c-hi | 910 | 17.5 | 0.313 |
| AHS d3 | ss-hi 2 | 130 | 11 | 0.126 |
| AHS d6 | ss-hi | 80 | 11 | 0.140 |
| AHS d3 double-layer | ss-hi | 130 | 22 | 0.312 |
| AHS d6 double-layer | ss-hi | 80 | 22 | 0.328 |
| AHS double-layer (d3 up layer and d6 bottom layer) | ss-hi | 130/80 | 22 | 0.288 |
| AHS double-layer (d6 up layer and d3 bottom layer) | ss-hi | 80/130 | 22 | 0.289 |
| 7L-TCAS 0°/0° | c-hi | 370 | 70 | 0.811 |
| 7L-TCAS 0°/90° | c-hi | 370 | 70 | 0.797 |
| GFRP-BCC | c-hi | 825 | 9.5 | 0.098 |
| AF (Type I) | ss-ci 3 | 477 | 20 | 0.147 |
| AF (Type II) | ss-ci | 583 | 34 | 0.256 |
| AFS with bonded skin (Type III) | ss-ci | 421 | 22 | 0.313 |
| AFS with bonded skin (Type IV) | ss-ci | 616 | 36 | 0.508 |
1 Clamped, hemispherical indenter; 2 simply supported, hemispherical indenter; 3 simply supported, conical indenter.
Table 3.
Load and depth percentage variation after the repeated impact tests.
| Impact Number | Load [N] | Load Variation [%] | Depth [mm] | Depth Variation [%] |
|---|---|---|---|---|
| 1st | 5.93 × 10³ | - | 7.37 | - |
| 2nd | 7.98 × 10³ | +34.52 | 5.68 | −22.86 |
| 3rd | 9.40 × 10³ | +17.74 | 5.36 | −5.62 |
| 4th | 1.08 × 10⁴ | +14.57 | 3.74 | −30.31 |
| 5th | 1.11 × 10⁴ | +3.53 | 3.84 | +2.65 |
| 6th | 1.19 × 10⁴ | +6.56 | 3.29 | −14.31 |
| 7th | 1.09 × 10⁴ | −8.62 | 3.84 | +16.73 |
| 8th | 1.04 × 10⁴ | −4.31 | 4.41 | +14.96 |
| 9th | 1.05 × 10⁴ | +1.01 | 4.48 | +1.52 |
| 10th | 1.01 × 10⁴ | −3.68 | 4.26 | −4.78 |
Table 4.
Comparison between repeated impact tests and single impact test at 350 J for the Type IV panel.
Table 4.
Comparison between repeated impact tests and single impact test at 350 J for the Type IV panel.
| Test Type | FMAX [N] | w [mm] |
|---|---|---|
| Repeated impact tests | 1.19 × 10⁴ | 36.45 |
| Single impact test at 350 J | 1.52 × 10⁴ | 30.57 |
| Variation [%] | +27.73 | −16.13 |
Publisher’s Note: MDPI stays neutral with regard to jurisdictional claims in published maps and institutional affiliations. |
© 2021 by the authors. Licensee MDPI, Basel, Switzerland. This article is an open access article distributed under the terms and conditions of the Creative Commons Attribution (CC BY) license (http://creativecommons.org/licenses/by/4.0/).
Share and Cite
MDPI and ACS Style
Epasto, G.; Distefano, F.; Mozafari, H.; Linul, E.; Crupi, V. Nondestructive Evaluation of Aluminium Foam Panels Subjected to Impact Loading. Appl. Sci. 2021, 11, 1148. https://0-doi-org.brum.beds.ac.uk/10.3390/app11031148
AMA Style
Epasto G, Distefano F, Mozafari H, Linul E, Crupi V. Nondestructive Evaluation of Aluminium Foam Panels Subjected to Impact Loading. Applied Sciences. 2021; 11(3):1148. https://0-doi-org.brum.beds.ac.uk/10.3390/app11031148
Chicago/Turabian StyleEpasto, Gabriella, Fabio Distefano, Hozhabr Mozafari, Emanoil Linul, and Vincenzo Crupi. 2021. "Nondestructive Evaluation of Aluminium Foam Panels Subjected to Impact Loading" Applied Sciences 11, no. 3: 1148. https://0-doi-org.brum.beds.ac.uk/10.3390/app11031148
Note that from the first issue of 2016, this journal uses article numbers instead of page numbers. See further details here.