Article

Traceable PM2.5 and PM10 Calibration of Low-Cost Sensors with Ambient-like Aerosols Generated in the Laboratory

Laboratory for Particles and Aerosols, Federal Institute of Metrology METAS, 3003 Bern-Wabern, Switzerland
*
Author to whom correspondence should be addressed.
Contributed equally to this work.
Submission received: 2 September 2021 / Revised: 22 September 2021 / Accepted: 23 September 2021 / Published: 28 September 2021
(This article belongs to the Special Issue Advances in Gaseous and Particulate Air Pollutants Measurement)

Abstract

:
This work builds upon previous efforts at calibrating PM (particulate matter) monitors with ambient-like aerosols produced in the laboratory under well-controlled environmental conditions at the facility known as PALMA (Production of Ambient-like Model Aerosols). In this study, the sampling system of PALMA was equipped with commercial PM2.5 and PM10 impactors, designed according to the EN 12341:2014 standard, to select different aerosol size fractions for reference gravimetric measurements. Moreover, a metallic frame was mounted around the PM impactor to accommodate up to eight low-cost PM sensors. This sampling unit was placed at the bottom of the 2-meter-long aerosol homogenizer, right above the filter holder for the reference gravimetric measurements. As proof of principle, we used the upgraded PALMA facility to calibrate the new AirVisual Outdoor (IQAir, Goldach, Switzerland) and the SDS011 (InovaFitness, Jinan, China) low-cost PM sensors in a traceable manner against the reference gravimetric method according to the EN 12341 standard. This is the first time that PM2.5 and PM10 calibrations of low-cost sensors have been successfully carried out with complex ambient-like aerosols consisting of soot, inorganic species, secondary organic matter, and dust particles under controlled temperature and relative humidity.

1. Introduction

High levels of particulate matter (PM) in ambient air are linked to morbidity as well as mortality [1,2]. More precisely, exposure to polluted air is associated with coughing, wheezing, and shortness of breath among children [2], and a recently published study calculated that up to 166,000 premature deaths could be prevented if PM2.5 levels were to decrease to the lowest measured concentrations in Europe, i.e., 3.7 µg/m3 [1]. Experiments with PM analyzers mounted on cars have shown that spatial concentration differences in cities can be substantial; thus, personal exposure can vary significantly, and the spatial resolution provided by government-operated air quality stations can be considered insufficient [3]. It is no surprise that cities seek to increase spatial resolution in an affordable manner, which has led to an increasing demand for low-cost sensors for air quality monitoring in recent years [4,5,6].
Sensitivity to composition and particle size of the aerosol, influence of relative humidity (RH), low accuracy, poor repeatability, drifts due to aging, and high unit-to-unit variability are, however, limitations of (some) low-cost optical sensors [7,8,9,10,11]. In theory, each sensor must be regularly calibrated so that users can trust the sensor data. Furthermore, such calibrations aim to compensate for some of the interfering effects—e.g., artefacts due to RH—but can lead to spatial or temporal relocation issues (i.e., a sudden increase in measurement uncertainty) if performed in the field [12,13,14,15]. The question arises to what extent governments can rely on such data to make informed policy decisions. Thus, maintaining so-called “digital trust” with low-cost products during the operation of wireless sensor networks in smart cities remains a challenge [16,17,18,19].
As aerosols vary across locations and seasons, examining low-cost PM sensors in laboratory facilities is essential for benchmarking them under different standardized environments, yielding reliable performance assessments independent of the location and time of the year. Recently, a setup known as PALMA (Production of Ambient-like Model Aerosols) was developed for the production of ambient-like aerosols (i.e., mixtures of inorganic salt, mineral dust, soot particles, and secondary organic matter) under controlled environmental conditions, and was successfully applied to the calibration of commercial PM monitors against the gravimetric reference method [20]. However, the setup in its original form was limited to the calibration of total PM mass concentration.
In this work, we report on a further development of the PALMA setup. The sampling system of the gravimetric reference method was equipped with impactors as described in the EN 12341:2014 standard in order to determine PM2.5 and PM10 mass concentrations, which are more relevant for legislation and air quality assessment. Moreover, the method was scaled up so that a batch of low-cost PM sensors could be calibrated simultaneously, thereby also accounting for unit-to-unit variability. Compared to other setups reported in the literature (see [21] and references therein), this is the first laboratory-based facility that enables the calibration of PM sensors with multicomponent ambient-like aerosols instead of simple model aerosols, such as sodium chloride, sucrose, polystyrene spheres, or dry dust particles. Indeed, ambient PM does not refer to a single pollutant, but to a highly variable mixture of combustion particles, salts, mineral dust, organic substances, and other materials [22,23]. PM sensors based on light scattering are sensitive to particle size, density, and refractive index distribution as well as hygroscopic growth, which can lead to considerable measurement artefacts [24,25]. Thus, complex model aerosols with realistic size distribution and chemical composition are essential for reliable calibration.
As a proof of concept, we present here the successful calibration of the new AirVisual Outdoor sensor (IQAir, Switzerland) and the SDS011 (InovaFitness, China) sensor. We believe that these advances in the calibration of low-cost PM sensors can make a valuable contribution towards the standardization and SI-traceable calibration of low-cost PM sensors.

2. Materials and Methods

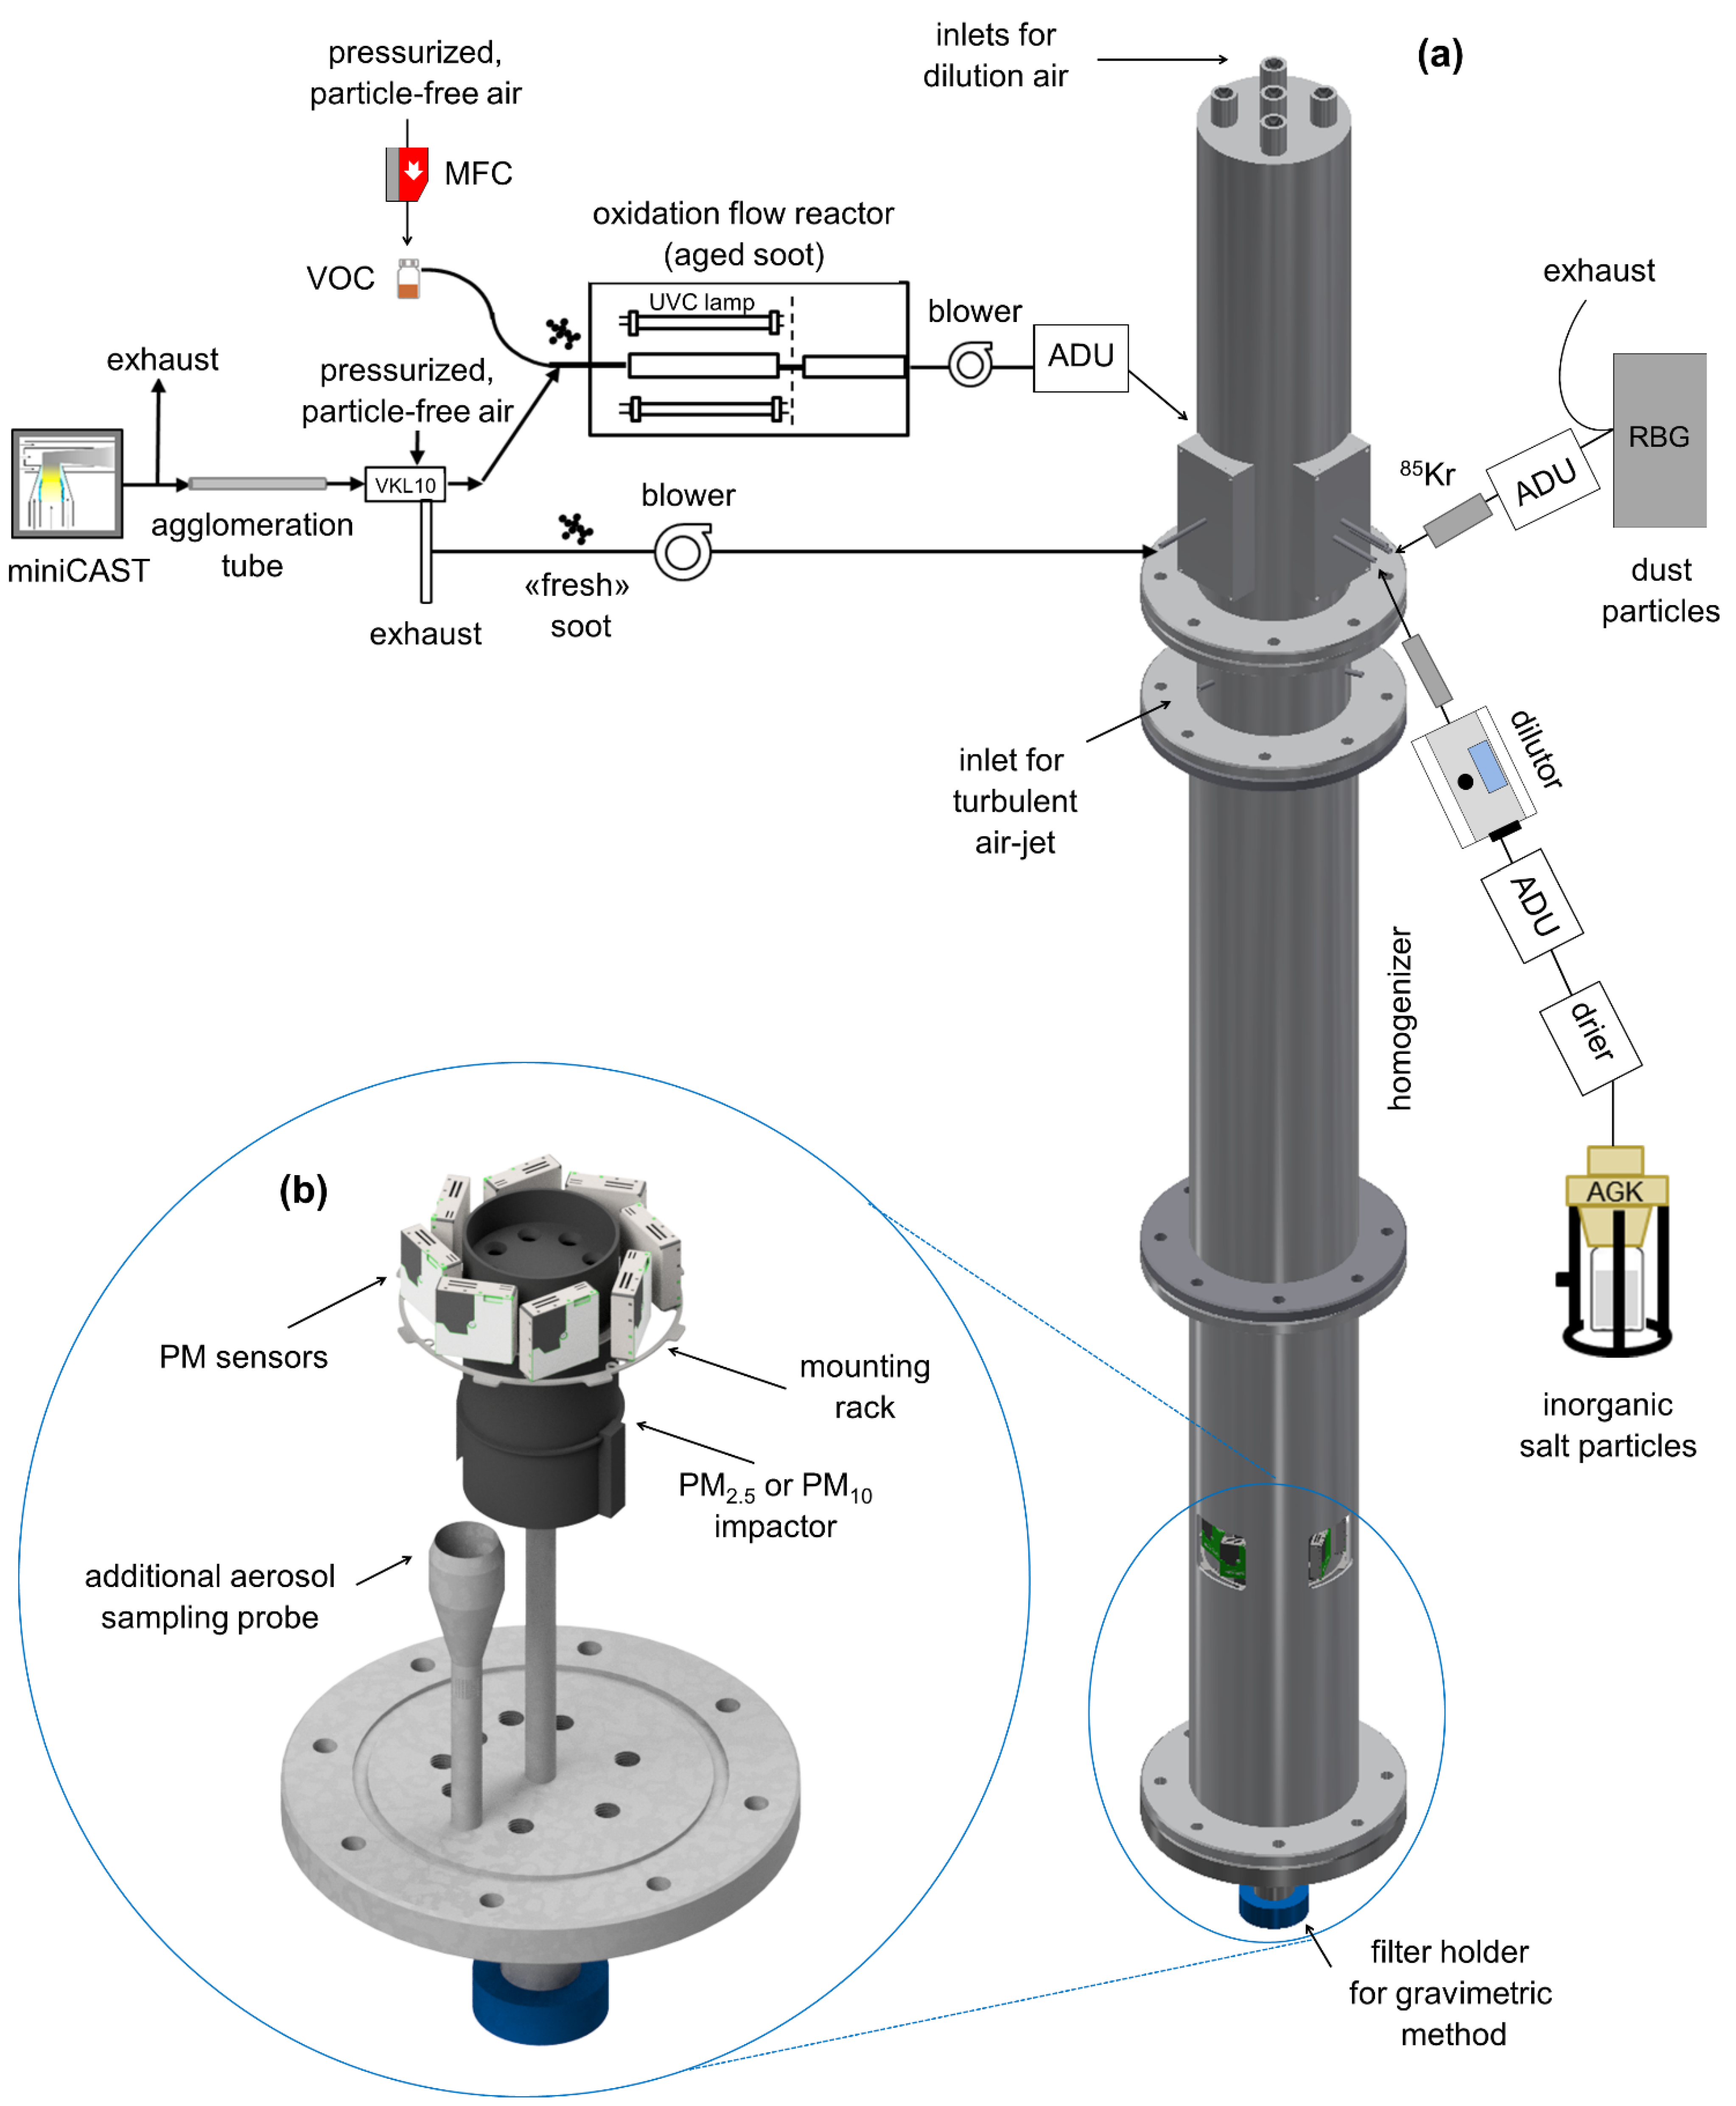
2.1. Experimental Setup

Part of the experimental facility has been described in a previous publication [20]. Briefly, the setup consists of multiple aerosol generators, a 2.1-meter-long flow tube homogenizer placed vertically, a set of custom-made isokinetic sampling probes, and a system for temperature and humidity control. A graphical illustration of the flow tube homogenizer is shown in Figure 1a. Soot, aged soot, ammonium nitrate, ammonium sulfate, and dust particles were aerosolized (see Section 2.2 for a detailed description of the generators) and mixed in the homogenizer by three turbulent air jets. The inorganic salt and dust particles passed through two separate radioactive 85Kr sources (TSI Inc., Shoreview, MN, USA) to reduce the charges of the particles and render the aerosols (as an ensemble) neutral before entering the homogenizer. Experiments with soot and aged soot aerosols have revealed that these are already neutral and do not require any further treatment. Salt particles were dried by passing them through a bed of silica gel beads (2–5 mm, Dry & Safe GmbH, Oensingen, Switzerland). Tests of hygroscopic growth of pure ammonium sulfate particles showed that particles were dried below the efflorescence point before entering the homogenizer.
In this study, we designed an entirely new sampling system that enables PM2.5 and PM10 calibration of multiple low-cost PM sensors simultaneously based on the selection of different particle size fractions by standardized impactors. A computer-aided design (CAD, Inventor Professional 2019, Autodesk, San Rafael, CA, USA) of the sampling system is displayed in Figure 1b. The central component is the PM2.5 or PM10 impactor (Digitel, Zürich, Switzerland). A metallic rack, which can accommodate several PM sensors (the exact number depends on the sensor’s dimensions), is placed around the impactor at the height of the impactor’s aerosol inlet. The sensors are placed upright, so that the aerosol inlet is on the top, right next to the impactor. The impactor is connected to the filter holder of the gravimetric reference method through a straight metallic tube. Up to eight additional isokinetic sampling probes for the aerosol monitoring instruments—e.g., TEOM (tapered element oscillating microbalance) and SMPS (scanning mobility particle sizer)—and/or PM monitors under test can be attached to the bottom metallic plate of the homogenizer, depending on the experimental needs. The aerosol spatial homogeneity at the sampling region is within 2.6% (k = 2; 95% confidence interval) in particle number concentration [20].

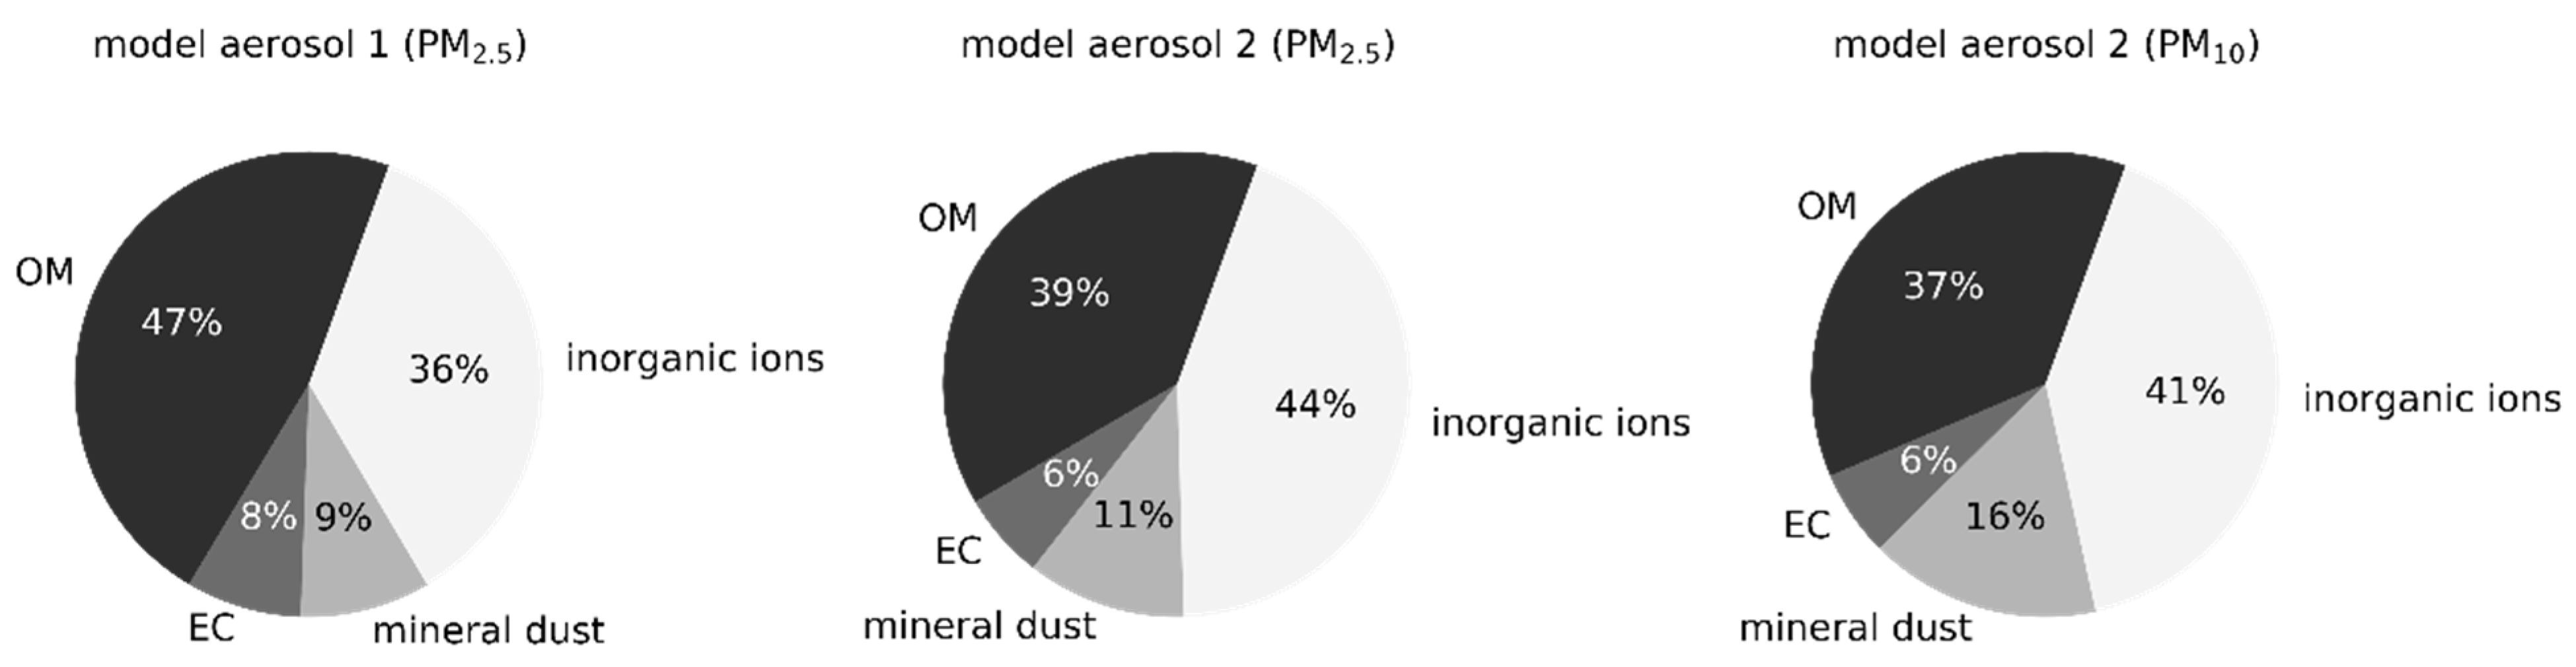
2.2. Aerosol Generation and Characterization

The primary aerosols were generated as described below:
  • Inorganic salt: aqueous solutions of ammonium nitrate (>99%, Acros Organics, Thermo Fisher Scientific, Geel, Belgium) and ammonium sulfate (>99.5%, Acros Organics, Thermo Fisher Scientific, Geel, Belgium) were nebulized with an AGK 2000 atomizer (PALAS, Karlsruhe, Germany). The aerosol had a GMDmob (geometric mean mobility diameter, number-based) of 160 nm and a GSDmob (geometric standard deviation) of 1.9. The mode of the mass-based aerodynamic size distribution was expected to lie above 300 nm [20];
  • Dust particles (ISO A3 test dust, 98% SiO2, DMT, Longmont, CO, USA) were dispersed with an RBG 1000 rotating brush generator (PALAS, Germany). The aerosol had a GMDmob of 300 nm and GSDmob of 1.7. The mode of the mass-based aerodynamic size distribution was expected to be in the lower micrometer range [20];
  • Soot by propane combustion with a miniCAST 6204 burner (Jing Ltd., Zollikofen, Switzerland), with a GMDmob of 120 nm and a GSDmob of 1.6 (see [26,27] and references therein);
  • Photochemically aged soot by ozonolysis of α-pinene (>97%, Sigma-Aldrich, Buchs, Switzerland) in a prototype micro smog chamber ([28,29]); the size distribution had a GMDmob of 180 nm and a GMDmob of 1.2.
The mobility measurements were performed with an SMPS (SMPS+C with L-DMA and CPC model 5.403, Grimm GmbH, Hochdorf, Germany), which was traceably calibrated. The SMPS mobility size range extended to about 1 µm. If needed, the aerosols were diluted before injection in the homogenizer by using custom-made adjustable dilution units (ADU) or commercial dilutors (DDS 562, Topas GmbH, Dresden, Germany).
Reference gravimetric measurements were carried out according to the EN 12341:2014 standard, i.e., particulate matter was passed through a PM2.5 or PM10 impactor and then sampled on filters and weighed by means of a balance. More specifically, the model aerosols were drawn through 47 mm PTFE-coated glass fiber filters (Measurement Technology Laboratories, Bloomington, MN, USA) placed in a metallic filter holder (C806 standard aerosol filter holder, Merck Millipore, Darmstadt, Germany). The aerosol flow was controlled with a needle valve and measured with a calibrated mass flow meter (Natec Sensors GmbH, Garching bei München, Germany) connected to an aerosol pump (VTE8, Gardner Denver Thomas GmbH, Memmingen, Germany) in such a way that the volumetric flow corresponded to 2.3 m3/h at ambient conditions. The flow measurement was traceable to national standards.
The connecting tube between the isokinetic sampling and the filter holder was made of inert, electrically conducting rubber material, and was kept as short as possible (≈5 cm) without bends to minimize deposition losses of particulate matter via kinetic processes, as well as losses due to thermal, chemical, or electrostatic processes. Before and after sampling, the filters were conditioned for 48 h at 20 °C and 50% relative humidity, and then weighed with a calibrated balance (Model UMT5, Mettler Toledo, Albstadt, Germany), which was traceable to national standards. Temperature, pressure, and relative humidity inside the sampling region were also recorded (ALMEMO FHAD 46x with sinter filter SK6, Ahlborn Mess- und Regelungstechnik GmbH, Holzkirchen, Germany).
For quality assurance, the mass concentration of the model aerosols was monitored with a TEOM 1405 (Thermo Scientific, Waltham, MA, USA) operated at a temperature of 30 °C to minimize losses of semivolatile material. The TEOM used a custom-made isokinetic sampling probe for sampling (see Figure 1b). Moreover, the optical size distribution of the model aerosols was measured using a Fidas Frog monitor (Palas, Germany) or an 11-D dust monitor (Grimm, Germany).
The composition of the two model aerosols is displayed in Figure 2. The percentage (%) PM mass fraction of each chemical component was determined gravimetrically by switching off all other aerosol generators and simultaneously recording the particle number density with a calibrated CPC (condensation particle counter). This correlation of mass and particle number density was then used to set the concentration of each aerosol for the calibration measurements. The mass of elemental carbon (EC) and organic carbon (OC) was measured by EC/OC analysis (Lab OC-EC Aerosol Analyzer, Model 5, Sunset Laboratories Inc., USA). The mass of organic matter (OM) was then calculated by multiplying the OC mass by 1.8 [30]. For the EC/OC analysis, aerosols were sampled on quartz filters (Advantec, Japan, QR-100, 47 mm, preconditioned by heating at 500 °C for 1.5 h). The relative expanded uncertainty in the determination of the OC and OM mass concentrations in the model aerosols was estimated to be 12–16%. In the case of inorganic salt and dust particles, the relative expanded uncertainty in the determination of the mass concentration was 10%.

3. Results and Discussion

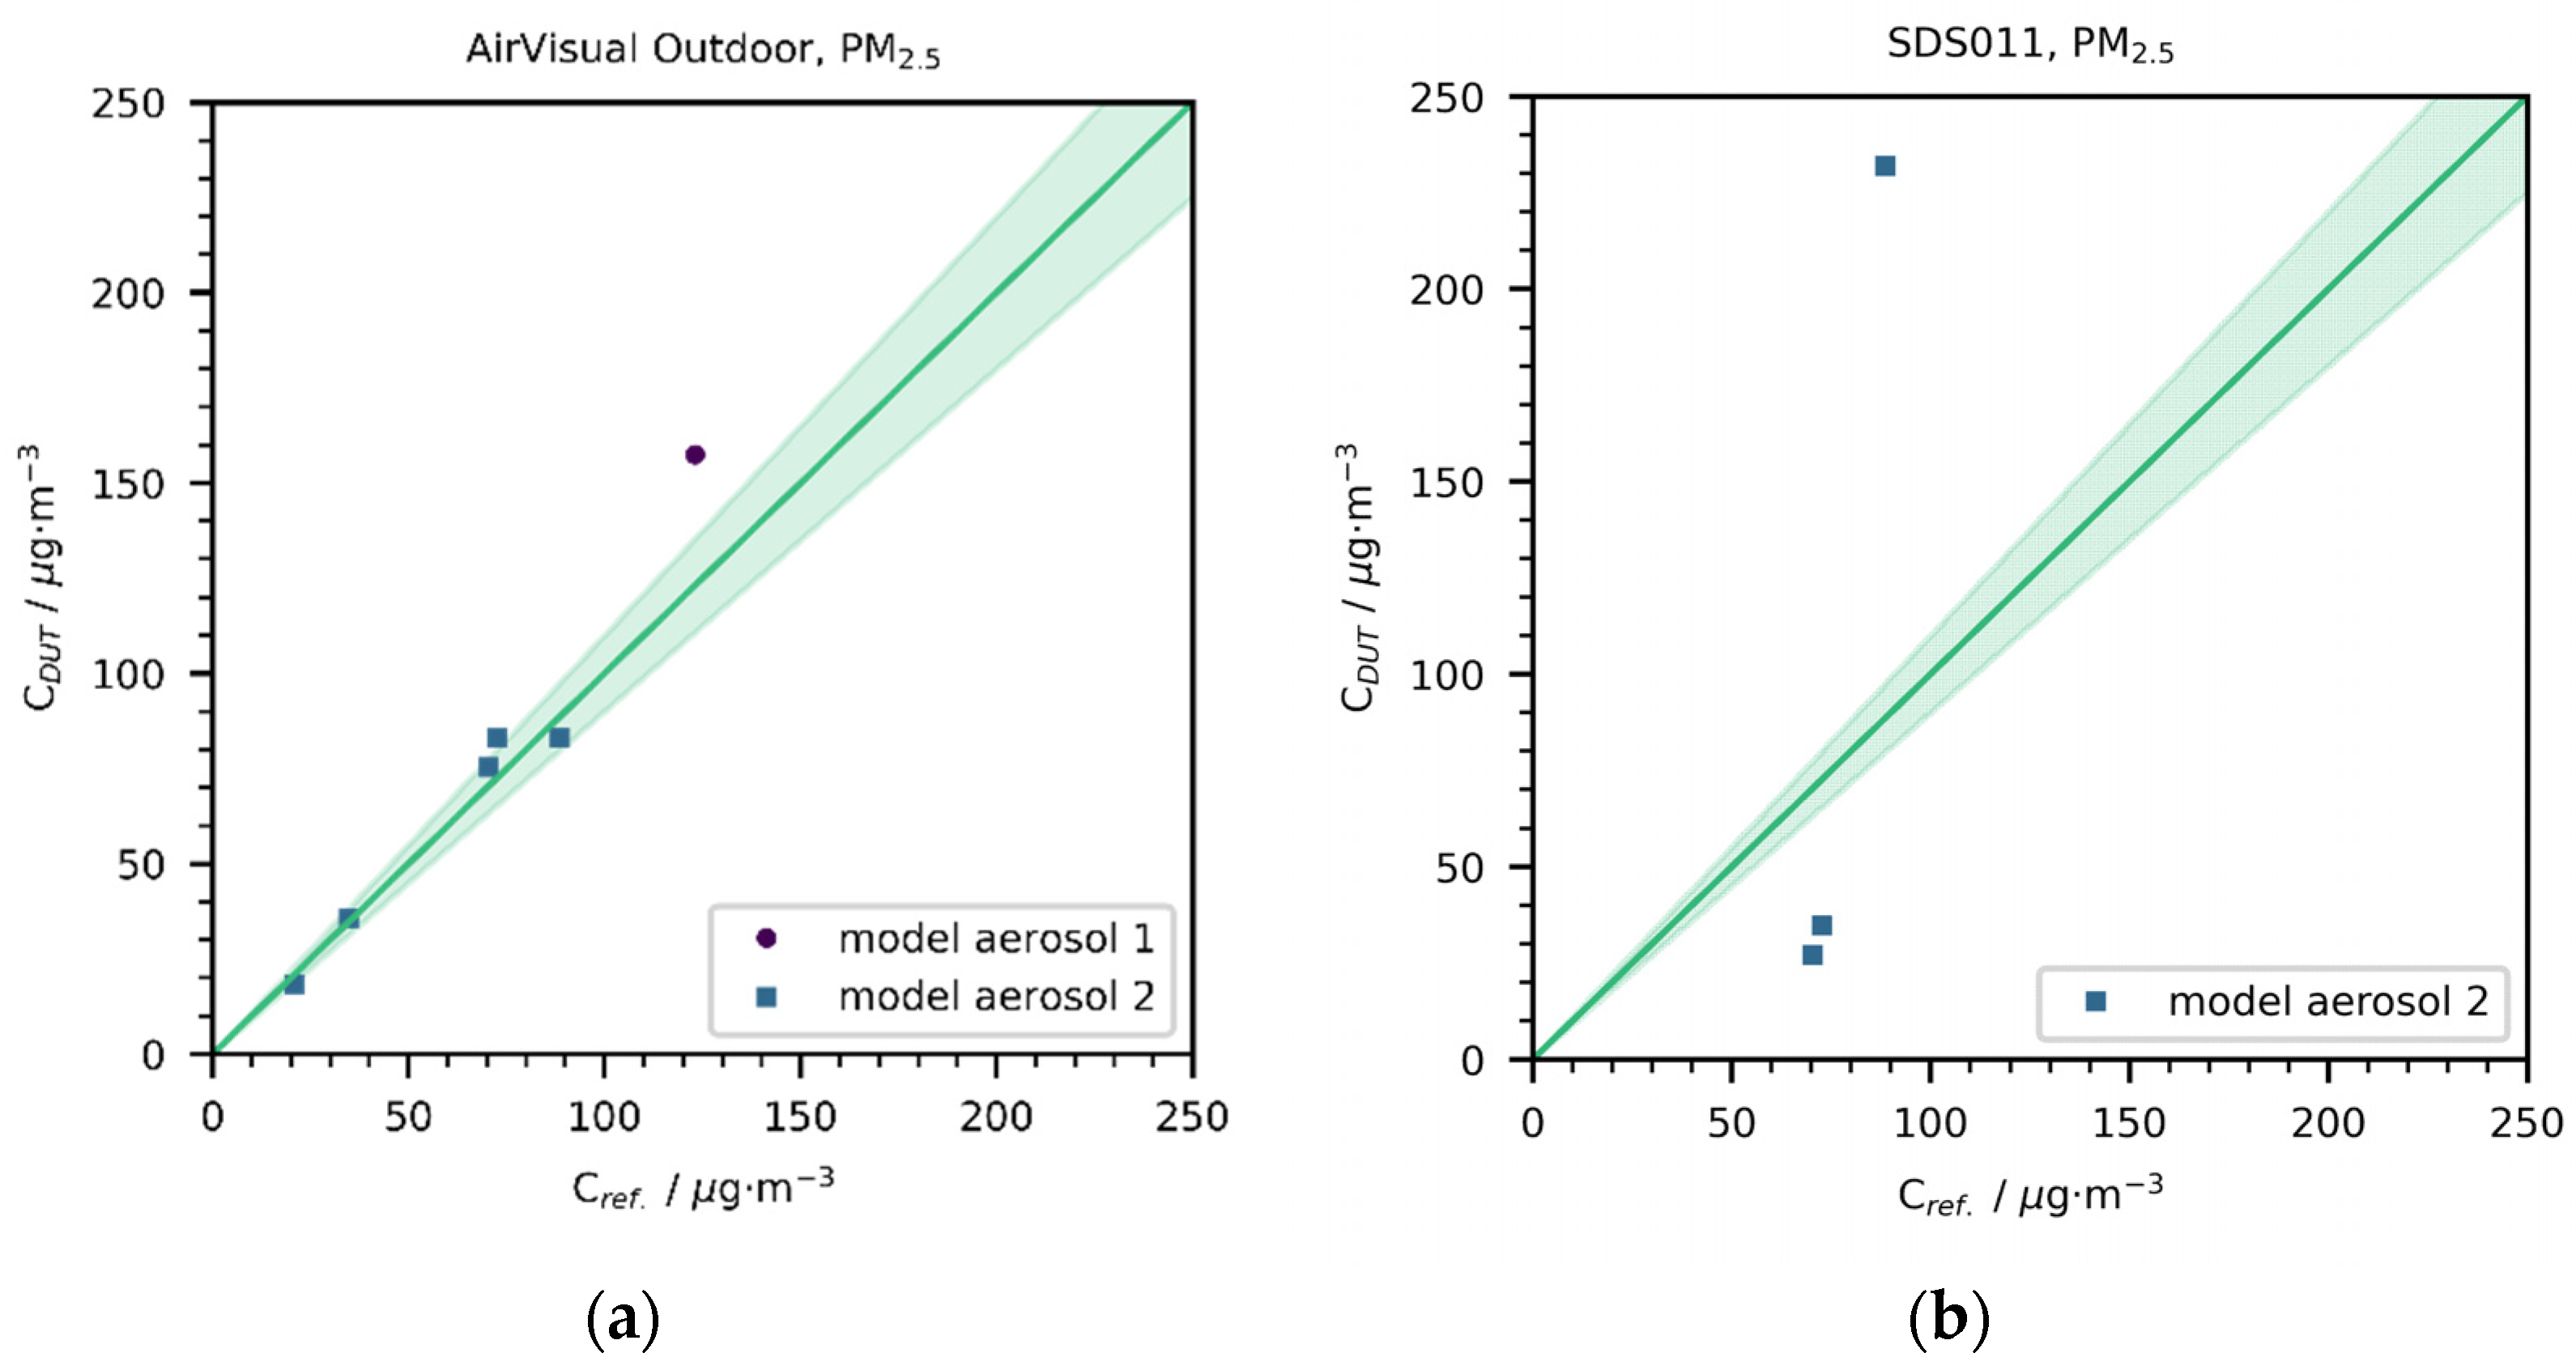
3.1. PM2.5 Calibration

An AirVisual Outdoor sensor unit (comprising two PM sensors) was mounted on the rack surrounding the PM impactor (see Figure 1b) throughout all experiments with model aerosols 1 and 2 (see Figure 2). Due to limited availability, the SDS011 PM sensor (InovaFitness, China) was only mounted during the experiments with model aerosol 2. The AirVisual Outdoor is a photometer recording the light scattered from all particles present in the measurement cell, whereas the SDS011 is based on light scattering from individual particles. Note that both devices report PM2.5 and PM10 measurements as 1 min averages.
The AirVisual Outdoor sensor was calibrated against the gravimetric reference method with the two different model aerosols presented in Section 2.2. As an example, a PM2.5 mass concentration measurement is shown in Figure 3. The green line corresponds to the mass concentration according to the gravimetric reference method, while the shaded green area designates the expanded uncertainty (k = 2; 95% confidence interval) thereof. A very good agreement between the AirVisual Outdoor sensor (purple dots) and the gravimetric reference method was observed. The sensor reported an average PM2.5 mass concentration CDUT of 83.4 µg/m3, thus underestimating the PM2.5 mass concentration by ~6% compared to the reference measurement (Cref. = 88.5 µg/m3). The calibration was repeated at various mass concentrations, as shown in Figure 4a and summarized in Table 1. The AirVisual Outdoor sensor performed very well with both model aerosols, in most cases exhibiting a measurement efficiency (EDUT = CDUT/Cref) of 0.9–1.1. The only exception was the measurement of model aerosol 1 at high relative humidity, where the measurement efficiency was around 1.3, presumably due to hygroscopic growth of the ammonium nitrate and ammonium sulfate particles.
In contrast, the SDS011 sensor showed a rather erratic behavior, reporting a sudden decrease in the PM2.5 mass concentration during measurement (Figure 3). The measurement efficiency ranged between 0.4 and 2.6 (Figure 4b, Table 1). Budde at al. compared 17 SDS011 sensors to a Palas PROMO 2000 reference in a laboratory setting using ambient air, and reported an average PM2.5 measurement efficiency EDUT of 0.66 (EDUT ranging from 0.48 to 0.85) [31]. The measurement efficiency decreased even further to an average of 0.49 (0.41–0.63) with pure ammonium sulfate as the test aerosol. Liu et al. also reported underestimation of PM2.5 mass concentration in their field campaign, particularly for higher pollution levels (EDUT ranging from 0.7 to 0.9) [32].

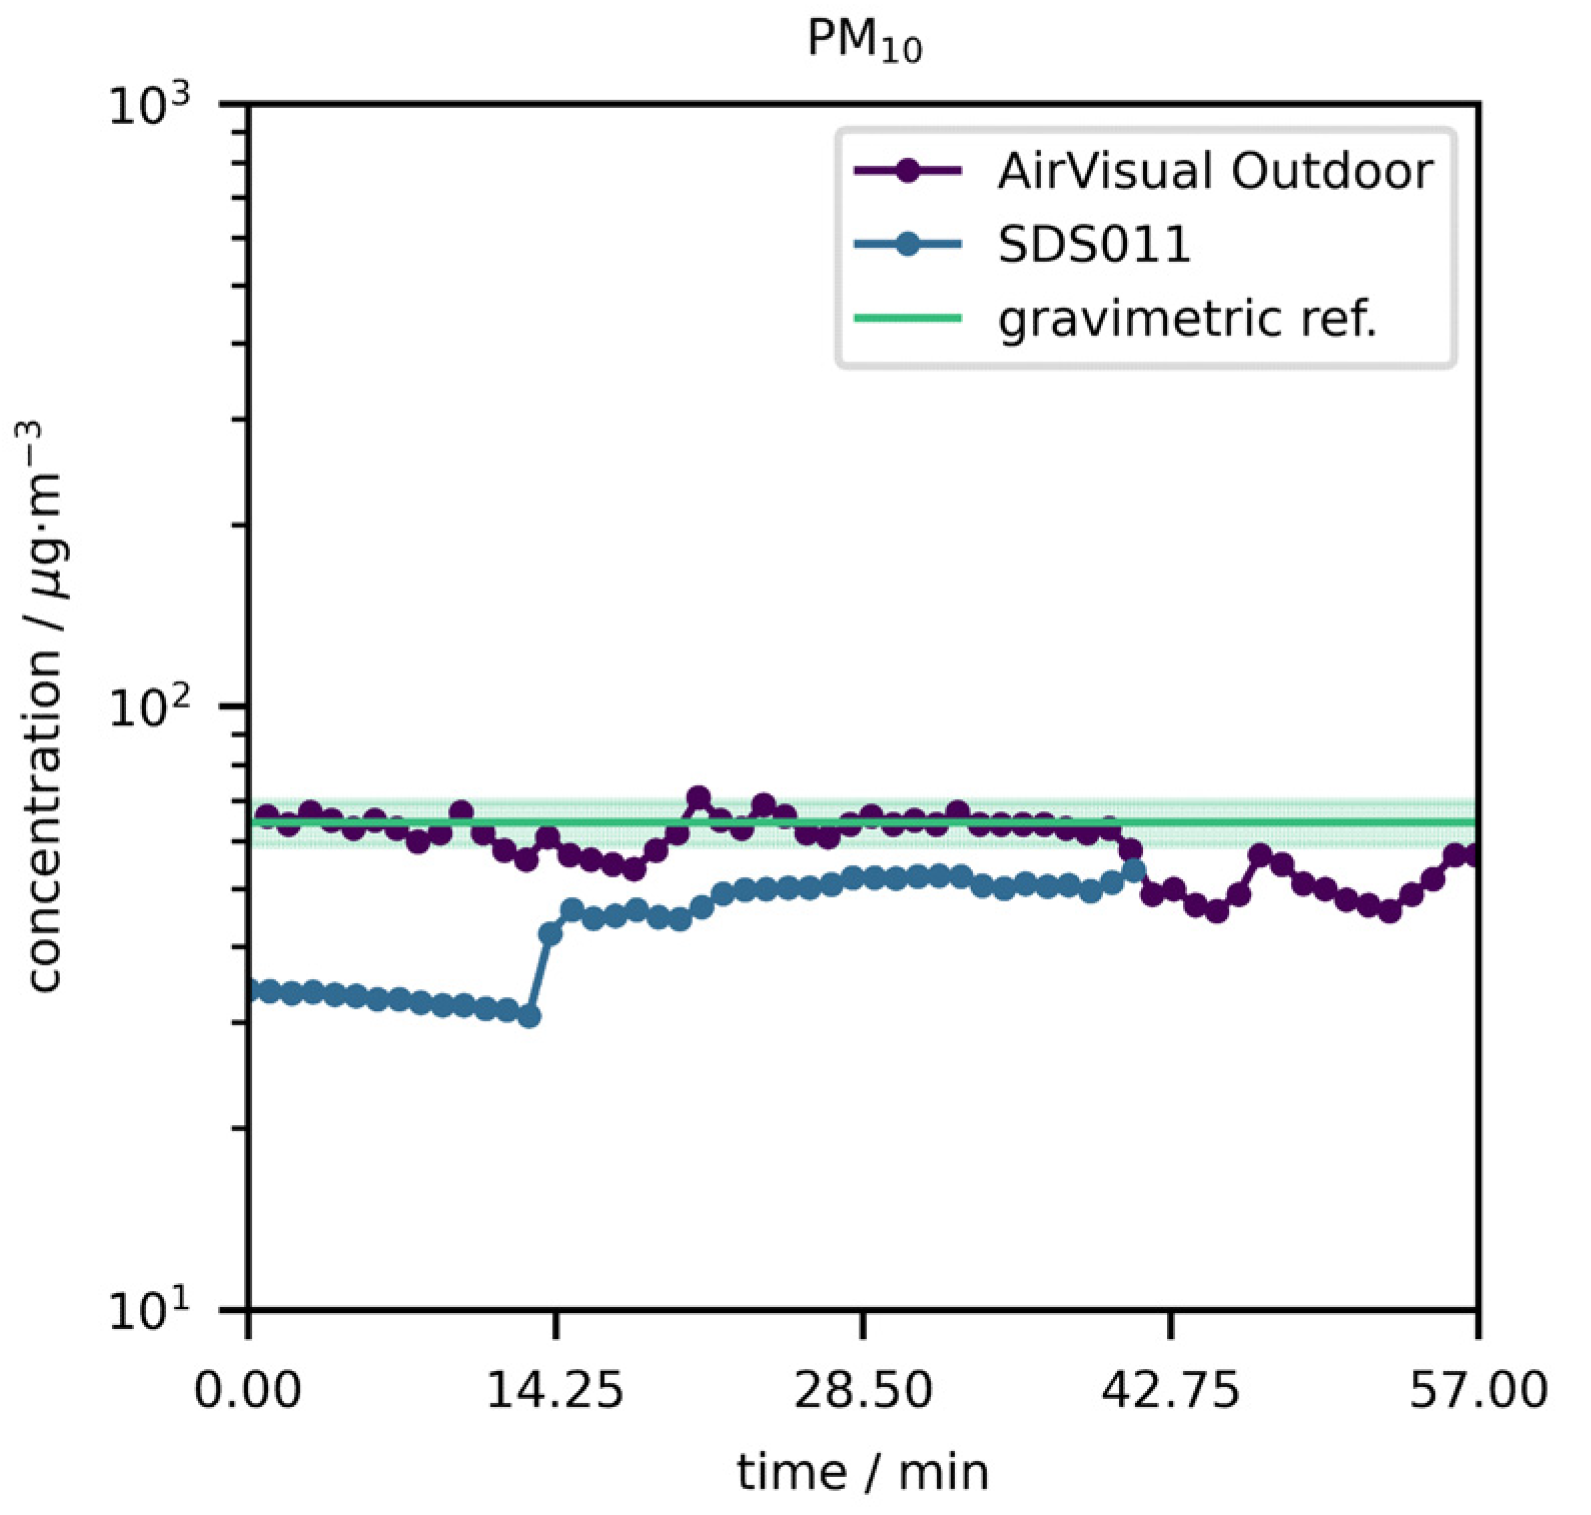
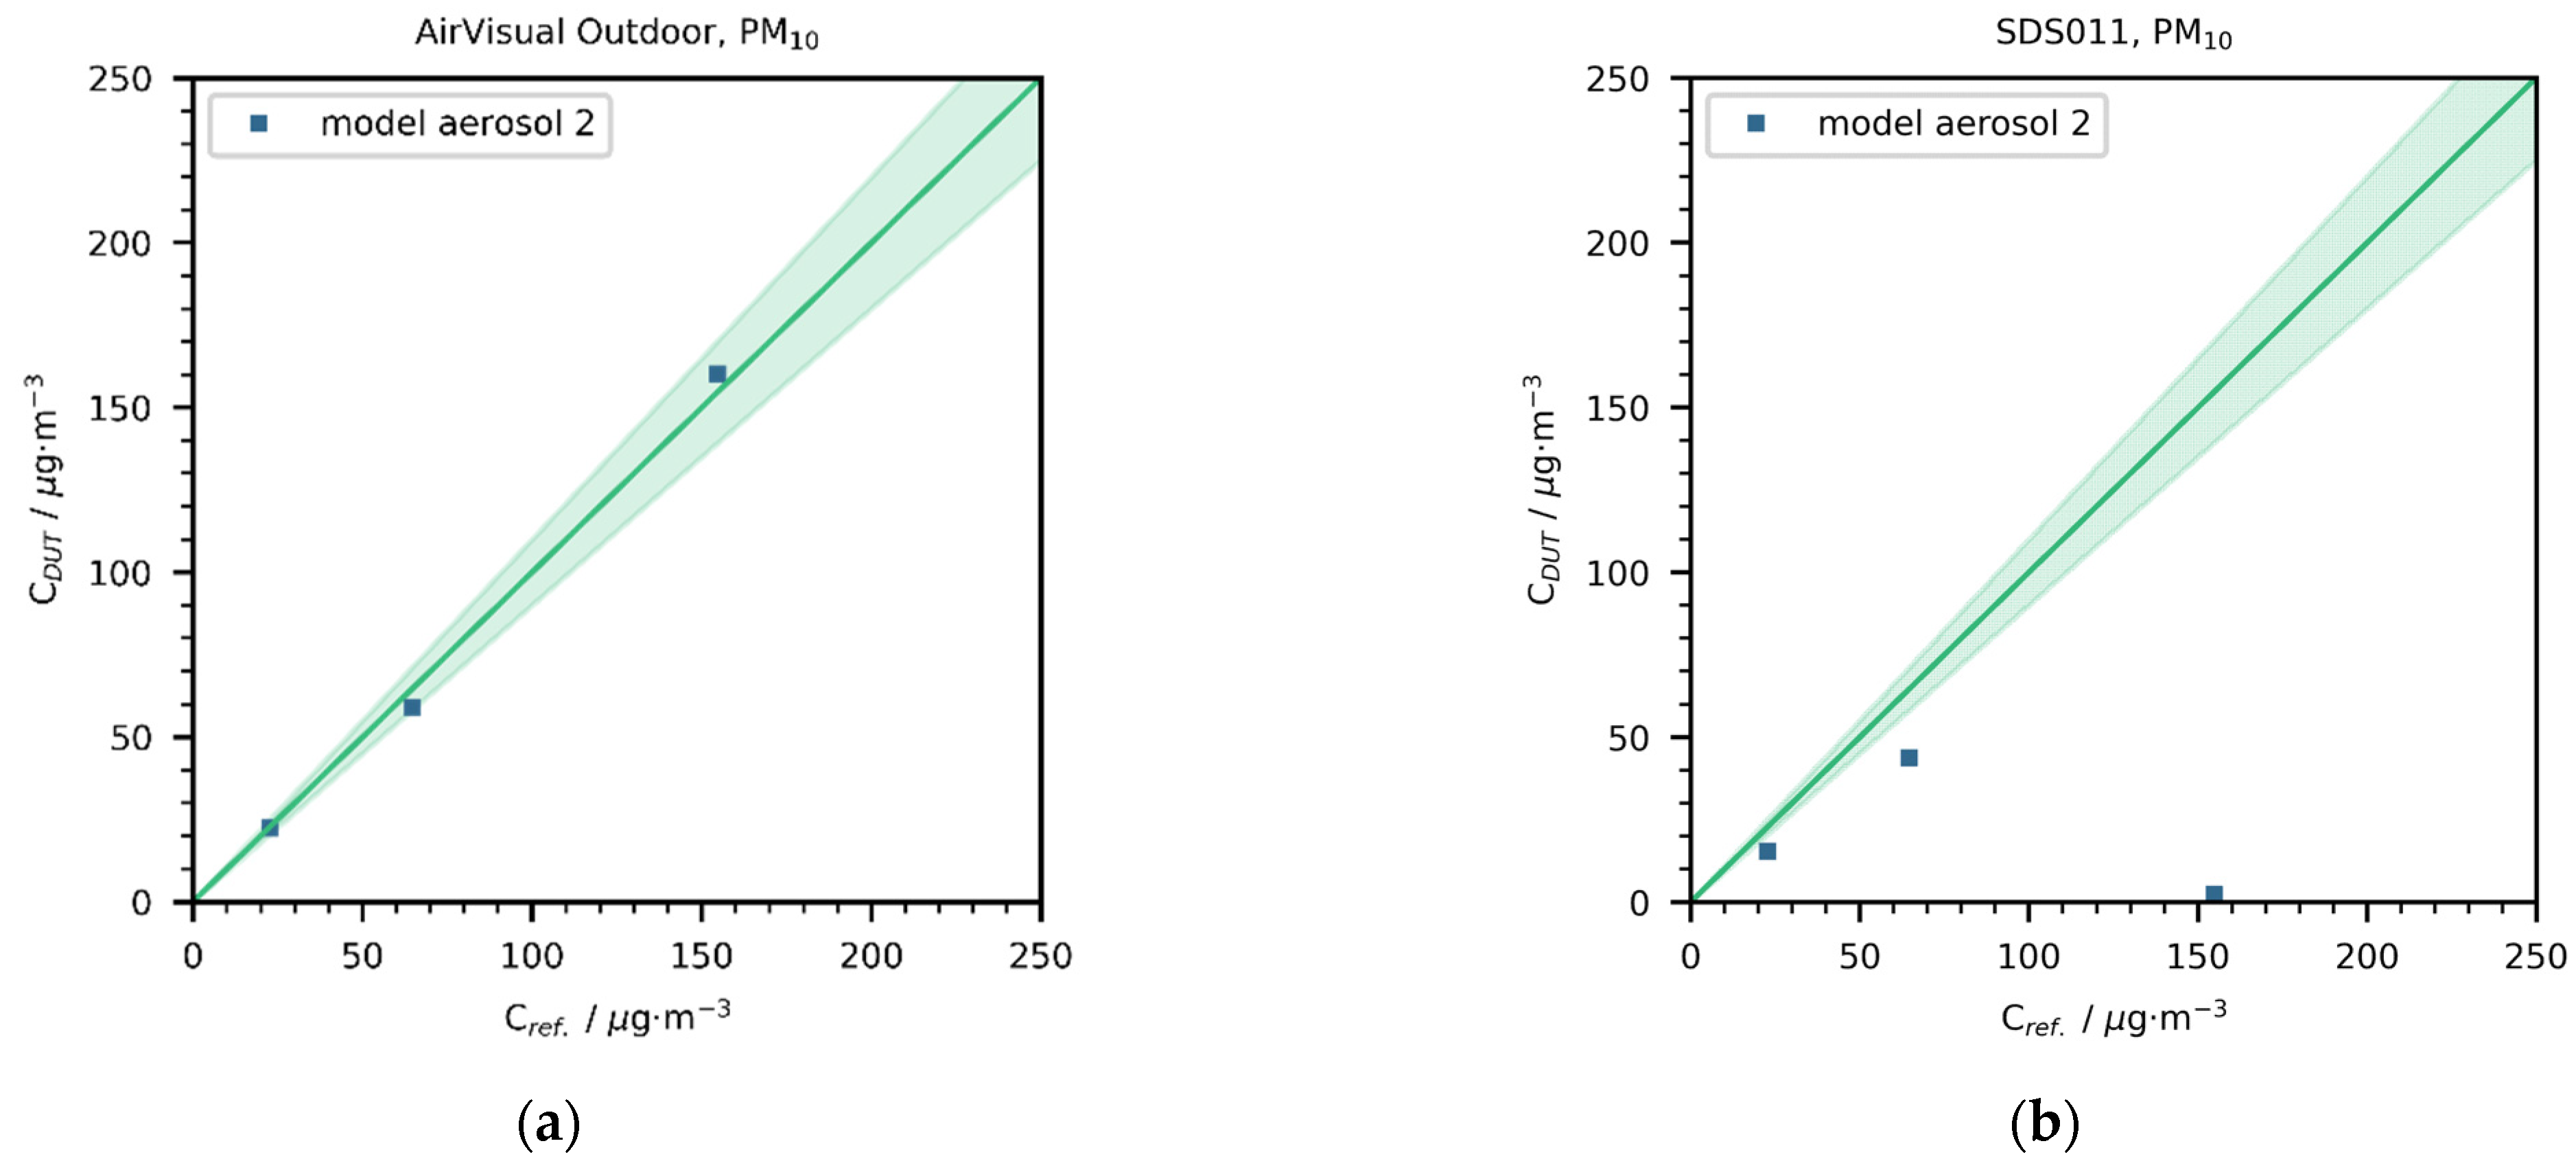
3.2. PM10 Calibration

Figure 5 displays an example of a PM10 calibration of the low-cost sensors as a function of time. A summary of all PM10 calibrations in the mass concentration range 20–150 µg/m3 is provided in Figure 6, and the data are listed in Table 2. A very good agreement between the AirVisual sensor and the gravimetric reference method was observed (EDUT close to 1), while the SDS011 drastically underestimated the mass concentrations. For the PM10 readings of the SDS011, Budde et al., reported that particles larger than 5 µm were severely underestimated, resulting in an average EDUT value of 0.65 [31], which is consistent with the trends reported here.
Note that sensors measuring PM mass concentration based on light scattering are very sensitive to the chemical composition and size distribution of the test aerosol. Since the properties of ambient air vary by time and location, it is impossible to define a single test aerosol in the laboratory that would sufficiently simulate all real environmental scenarios. In principle, the generators described in Section 2.2 are versatile, and can easily be used to produce different kinds of inorganic species (e.g., sodium chloride) or mineral dust particles (Arizona test dust, dolomite dust, kaolinite, etc.) to further refine the composition and scattering properties of the test aerosols. However, for simulating remote aerosols, marine aerosols, or specific pollution events (such as wildfires), more dedicated experiments must be carried out, and additional generators (e.g., a stove) would be required. A rigorous calibration of low-cost sensors in the laboratory, akin to that described in this study, would increase the price of the sensors. A more pragmatic approach would be to provide sensor manufacturers, air quality monitoring stations, and other end users with a limited set of calibrated sensors, which could then serve as (mobile) “reference” set in the laboratory or field [33,34,35].

4. Conclusions

This manuscript describes a novel method for the traceable calibration of low-cost PM2.5 and PM10 sensors with ambient-like aerosols generated in the laboratory. The setup consisted of multiple aerosol generators for producing soot, aged soot (i.e., coated with secondary organic matter), inorganic species, and dust particles. The aerosols were mixed in an aerosol flow tube homogenizer and sampled through a custom-made system equipped with PM2.5 and PM10 impactors for the gravimetric reference method. Up to eight low-cost sensors could be calibrated simultaneously. As a proof of concept, the AirVisual Outdoor and the SDS011 sensors were calibrated against the gravimetric method in the mass concentration range ~20–150 µg/m3. The AirVisual Outdoor sensor agreed very well with the reference method, showing measurement efficiencies typically in the range of 0.9–1.1, whereas the SDS011 exhibited a rather erratic behavior, with large deviations from the reference method. We believe that the calibration procedure outlined in this study can contribute to the performance characterization and standardization of low-cost sensors for air quality control.

Author Contributions

S.H. performed the experiments. G.T. analyzed and visualized the data. G.T. and K.V. wrote the manuscript. K.A. and S.H. designed the new sampling system. All authors have read and agreed to the published version of the manuscript.

Funding

The work received funding from Innosuisse (grant number: 36779.1 IP-ENG).

Institutional Review Board Statement

Not applicable.

Informed Consent Statement

Not applicable.

Data Availability Statement

Data can be shared upon request.

Acknowledgments

We thank Stefan Russi (Sector Technology, METAS) for valuable technical support, and Regula Muther (Digitel, Switzerland) for providing us with the drawings of the PM impactors. We also thank Daniel Kalbermatter (Laboratory for Particles and Aerosols, METAS) for performing the EC/OC analysis.

Conflicts of Interest

The authors declare that they have no conflict of interest.

References

  1. Khomenko, S.; Cirach, M.; Pereira-Barboza, E.; Mueller, N.; Barrera-Gómez, J.; Rojas-Rueda, D.; de Hoogh, K.; Hoek, G.; Nieuwenhuijsen, M. Premature mortality due to air pollution in European cities: A health impact assessment. Lancet Planet. Health 2021, 5196, 1–14. [Google Scholar]
  2. Balmes, J.R.; Eisner, M.D. Indoor and outdoor air pollution. In Murray and Nadel’s Textbook of Respiratory Medicine; Elsevier: Philadelphia, PA, USA, 2016; pp. 1331–1342.e5. ISBN 9781455733835. [Google Scholar]
  3. Apte, J.S.; Messier, K.P.; Gani, S.; Brauer, M.; Kirchstetter, T.W.; Lunden, M.M.; Marshall, J.D.; Portier, C.J.; Vermeulen, R.C.H.; Hamburg, S.P. High-Resolution Air Pollution Mapping with Google Street View Cars: Exploiting Big Data. Environ. Sci. Technol. 2017, 51, 6999–7008. [Google Scholar] [CrossRef]
  4. Karagulian, F.; Barbiere, M.; Kotsev, A.; Spinelle, L.; Gerboles, M.; Lagler, F.; Redon, N.; Crunaire, S.; Borowiak, A. Review of the performance of low-cost sensors for air quality monitoring. Atmosphere 2019, 10, 506. [Google Scholar] [CrossRef] [Green Version]
  5. Lewis, A.C.; von Schneidemesser, E.; Peltier, R.E.; Lung, C.; Jones, R.; Zellweger, C.; Karppinen, A.; Penza, M.; Dye, T.; Hüglin, C.; et al. Low-Cost Sensors for the Measurement of Atmospheric Composition: Overview of Topic and Future Applications; World Metrological Organization (WMO): Geneva, Switzerland, 2018. [Google Scholar]
  6. Manikonda, A.; Zíková, N.; Hopke, P.K.; Ferro, A.R. Laboratory assessment of low-cost PM monitors. J. Aerosol Sci. 2016, 102, 29–40. [Google Scholar] [CrossRef]
  7. Wang, Y.; Li, J.; Jing, H.; Zhang, Q.; Jiang, J.; Biswas, P. Laboratory Evaluation and Calibration of Three Low-Cost Particle Sensors for Particulate Matter Measurement. Aerosol Sci. Technol. 2015, 49, 1063–1077. [Google Scholar] [CrossRef]
  8. Kuula, J.; Mäkelä, T.; Aurela, M.; Teinilä, K.; Varjonen, S.; González, Ó.; Timonen, H. Laboratory evaluation of particle-size selectivity of optical low-cost particulate matter sensors. Atmos. Meas. Tech. 2020, 13, 2413–2423. [Google Scholar] [CrossRef]
  9. Tryner, J.; Mehaffy, J.; Miller-Lionberg, D.; Volckens, J. Effects of aerosol type and simulated aging on performance of low-cost PM sensors. J. Aerosol Sci. 2020, 150, 105654. [Google Scholar] [CrossRef]
  10. Tancev, G. Relevance of Drift Components and Unit-to-Unit Variability in the Predictive Maintenance of Low-Cost Electrochemical Sensor Systems in Air Quality Monitoring. Sensors 2021, 21, 3298. [Google Scholar] [CrossRef] [PubMed]
  11. Feinberg, S.; Williams, R.; Hagler, G.S.W.; Rickard, J.; Brown, R.; Garver, D.; Harshfield, G.; Stauffer, P.; Mattson, E.; Judge, R.; et al. Long-term evaluation of air sensor technology under ambient conditions in Denver, Colorado. Atmos. Meas. Tech. 2018, 11, 4605–4615. [Google Scholar] [CrossRef] [Green Version]
  12. Kelly, K.E.; Whitaker, J.; Petty, A.; Widmer, C.; Dybwad, A.; Sleeth, D.; Martin, R.; Butterfield, A. Ambient and laboratory evaluation of a low-cost particulate matter sensor. Environ. Pollut. 2017, 221, 491–500. [Google Scholar] [CrossRef]
  13. Zheng, T.; Bergin, M.H.; Johnson, K.K.; Tripathi, S.N.; Shirodkar, S.; Landis, M.S.; Sutaria, R.; Carlson, D.E. Field evaluation of low-cost particulate matter sensors in high-and low-concentration environments. Atmos. Meas. Tech. 2018, 11, 4823–4846. [Google Scholar] [CrossRef] [Green Version]
  14. De Vito, S.; Esposito, E.; Castell, N.; Schneider, P.; Bartonova, A. On the robustness of field calibration for smart air quality monitors. Sens. Actuators B Chem. 2020, 310, 127869. [Google Scholar] [CrossRef]
  15. Tancev, G.; Pascale, C. The Relocation Problem of Field Calibrated Low-Cost Sensor Systems in Air Quality Monitoring: A Sampling Bias. Sensors 2020, 20, 6198. [Google Scholar] [CrossRef]
  16. Kozhevnikov, D.E.; Korolev, A.S. Digital trust as a basis for the digital transformation of the enterprise and economy. In Proceedings of the 2018 11th International Conference of Management of Large-Scale System Development, Moscow, Russia, 1–3 October 2018; pp. 1–3. [Google Scholar]
  17. Mattila, J.; Seppala, T. Digital Trust, Platforms, and Policy, ETLA Br. (2016) 1–2. Available online: http://pub.etla.fi/ETLA-Muistio-Brief-42.pdf%0AIn (accessed on 20 March 2021).
  18. Kumar, H.; Singh, M.K.; Gupta, M.P.; Madaan, J. Moving towards smart cities: Solutions that lead to the Smart City Transformation Framework. Technol. Forecast. Soc. Chang. 2020, 153, 119281. [Google Scholar] [CrossRef]
  19. Mustapää, T.; Nikander, P.; Hutzschenreuter, D.; Viitala, R. Metrological challenges in collaborative sensing: Applicability of digital calibration certificates. Sensors 2020, 20, 4730. [Google Scholar] [CrossRef]
  20. Horender, S.; Auderset, K.; Quincey, P.; Seeger, S.; Nielsen Skov, S.; Dirscherl, K.; Smith, T.; Williams, K.; Aegerter, C.; Kalbermatter, D.; et al. Facility for production of ambient-like model aerosols (PALMA) in the laboratory: Application in the intercomparison of automated PM monitors with the reference gravimetric method. Atmos. Meas. Tech. 2021, 14, 1225–1238. [Google Scholar] [CrossRef]
  21. Alfano, B.; Barretta, L.; Del Giudice, A.; De Vito, S.; Di Francia, G.; Esposito, E.; Formisano, F.; Massera, E.; Miglietta, M.L.; Polichetti, T. A review of low-cost particulate matter sensors from the developers’ perspectives. Sensors 2020, 20, 6819. [Google Scholar] [CrossRef]
  22. Hueglin, C.; Gehrig, R.; Baltensperger, U.; Gysel, M.; Monn, C.; Vonmont, H. Chemical characterisation of PM2.5, PM10 and coarse particles at urban, near-city and rural sites in Switzerland. Atmos. Environ. 2005, 39, 637–651. [Google Scholar] [CrossRef]
  23. Putaud, J.-P.; Van Dingenen, R.; Alastuey, A.; Bauer, H.; Birmili, W.; Cyrys, J.; Flentje, H.; Fuzzi, S.; Gehrig, R.; Hansson, H.C.; et al. A European aerosol phenomenology—3: Physical and chemical characteristics of particulate matter from 60 rural, urban, and kerbside sites across Europe. Atmos. Environ. 2010, 44, 1308–1320. [Google Scholar] [CrossRef]
  24. Di Antonio, A.; Popoola, O.A.M.; Ouyang, B.; Saffell, J.; Jones, R.L. Developing a relative humidity correction for low-cost sensors measuring ambient particulate matter. Sensors 2018, 18, 2790. [Google Scholar] [CrossRef] [Green Version]
  25. Crilley, L.R.; Shaw, M.; Pound, R.; Kramer, L.J.; Price, R.; Young, S.; Lewis, A.C.; Pope, F.D. Evaluation of a low-cost optical particle counter (Alphasense OPC-N2) for ambient air monitoring. Atmos. Meas. Tech. 2018, 11, 709–720. [Google Scholar] [CrossRef] [Green Version]
  26. Ess, M.N.; Bertò, M.; Irwin, M.; Modini, R.L.; Gysel-Beer, M.; Vasilatou, K. Optical and morphological properties of soot particles generated by the miniCAST 5201 BC generator. Aerosol Sci. Technol. 2021, 55, 828–847. [Google Scholar]
  27. Ess, M.N.; Vasilatou, K. Characterization of a new miniCAST with diffusion flame and premixed flame options: Generation of particles with high EC content in the size range 30 nm to 200 nm. Aerosol Sci. Technol. 2019, 53, 29–44. [Google Scholar] [CrossRef]
  28. Keller, A.; Burtscher, H. A continuous photo-oxidation flow reactor for a defined measurement of the SOA formation potential of wood burning emissions. J. Aerosol Sci. 2012, 49, 9–20. [Google Scholar] [CrossRef]
  29. Ess, M.N.; Bertò, M.; Keller, A.; Gysel-Beer, M.; Vasilatou, K. Coated soot particles with tunable, well-controlled properties generated in the laboratory with a miniCAST BC and a micro smog chamber. J. Aerosol Sci. 2021, 157, 105820. [Google Scholar] [CrossRef]
  30. El-Zanan, H.S.; Zielinska, B.; Mazzoleni, L.R.; Hansen, D.A. Analytical Determination of the Aerosol Organic Mass-to-Organic Carbon Ratio. J. Air Waste Manag. Assoc. 2012, 59, 58–69. [Google Scholar] [CrossRef] [PubMed] [Green Version]
  31. Budde, M.; Schwarz, A.D.; Müller, T.; Laquai, B.; Streibl, N.; Schindler, G.; Köpke, M.; Riedel, T.; Dittler, A.; Beigl, M. Potential and Limitations of the Low-Cost SDS011 Particle Sensor for Monitoring Urban Air Quality. ProScience 2018, 5, 6–12. [Google Scholar]
  32. Liu, H.Y.; Schneider, P.; Haugen, R.; Vogt, M. Performance assessment of a low-cost PM 2.5 sensor for a near four-month period in Oslo, Norway. Atmosphere 2019, 10, 41. [Google Scholar] [CrossRef] [Green Version]
  33. Tancev, G.; Grasso Toro, F. Sequential Recalibration of Wireless Sensor Networks with (Stochastic) Gradient Descent and Mobile References. Meas. Sens. 2021, 18, 100115. [Google Scholar] [CrossRef]
  34. Saukh, O.; Hasenfratz, D.; Thiele, L. Reducing multi-hop calibration errors in large-scale mobile sensor networks. In Proceedings of the 14th International Conference on Information Processing in Sensor Networks, Seattle, WA, USA, 13–16 April 2015; pp. 274–285. [Google Scholar]
  35. Maag, B.; Zhou, Z.; Thiele, L. A Survey on Sensor Calibration in Air Pollution Monitoring Deployments. IEEE Internet Things J. 2018, 5, 4857–4870. [Google Scholar] [CrossRef] [Green Version]
Figure 1. (a) CAD illustration of the homogenizer (see [20] for more information). (b) Enlarged view of the aerosol sampling system. An impactor selects PM2.5 or PM10 size fractions for the gravimetric reference method. The low-cost PM sensors are mounted on a rack surrounding the impactor. Aerosols can be also sampled through additional isokinetic sampling probes for further aerosol characterization. For simplicity, only one such probe is displayed. ADU: adjustable dilution unit (custom-made); VOC: volatile organic compound.
Applsci 11 09014 g001
Figure 2. PM composition (%) of the two model aerosols.
Applsci 11 09014 g002
Figure 3. PM2.5 mass concentrations reported by the AirVisual Outdoor and SDS011 as a function of time for model aerosol 2. The green line refers to the average mass concentration over the whole measurement period according to the gravimetric reference method, while the shaded green area designates the expanded uncertainty (k = 2; 95% confidence interval) thereof.
Applsci 11 09014 g003
Figure 4. PM2.5 mass concentrations reported by (a) the AirVisual Outdoor and (b) the SDS011 versus the gravimetric reference mass concentration. The green line denotes a perfect agreement, while the shaded green area designates a maximum 10% relative expanded uncertainty (k = 2; 95% confidence interval) of the gravimetric reference method.
Applsci 11 09014 g004
Figure 5. PM10 mass concentrations reported by the AirVisual Outdoor and SDS011 as a function of time (model aerosol 2). The green line refers to the average mass concentration over the whole measurement period according to the gravimetric reference method, while the shaded green area designates the expanded uncertainty (k = 2; 95% confidence interval) thereof.
Applsci 11 09014 g005
Figure 6. PM10 mass concentrations reported by (a) the AirVisual Outdoor and (b) the SDS011 versus the gravimetric reference mass concentration. The green line denotes a perfect agreement, while the shaded green area designates a maximum 10% relative expanded uncertainty (k = 2; 95% confidence interval) of the gravimetric reference method.
Applsci 11 09014 g006
Table 1. PM2.5 mass concentrations reported by the DUT (device under test) and the reference gravimetric method—CDUT and Cref., respectively—and measurement efficiency of the DUT, EDUT. U denotes expanded uncertainties (k = 2; 95% confidence interval); s is the standard deviation of the mean (i.e., σ n , with n being the number of measurements).
Model AerosolT/°CRH/%DUTCDUT ± 2 s/µg·m−3Cref. ± U/µg·m−3EDUT ± U
1882AirVisual Outdoor157 ± 7123 ± 61.28 ± 0.09
22150AirVisual Outdoor18.4 ± 3.020.9 ± 2.20.88 ± 0.17
215035.9 ± 4.236.6 ± 2.20.98 ± 0.13
215035.9 ± 4.234.6 ± 2.11.04 ± 0.14
218375.5 ± 2.270.2 ± 3.51.08 ± 0.06
216683.1 ± 1.472.6 ± 5.01.14 ± 0.08
215083.4 ± 1.888.5 ± 4.70.94 ± 0.06
2183SDS-01127.3 ± 4.070.2 ± 3.50.39 ± 0.06
216634.9 ± 5.472.6 ± 5.00.48 ± 0.08
2150232 ± 4488.5 ± 4.72.62 ± 0.52
Table 2. PM10 mass concentrations reported by the DUT and the reference gravimetric method—CDUT and Cref., respectively—and measurement efficiency of the DUT, EDUT. U denotes expanded uncertainties (k = 2; 95% confidence interval); s is the standard deviation of the mean (i.e., σ n , with n being the number of measurements).
Model AerosolT/°CRH/%DUTCDUT ± 2 s/µg·m−3Cref. ± U/µg·m−3EDUT ± U
22150AirVisual Outdoor22.6 ± 1.422.6 ± 1.81.00 ± 0.10
215059.3 ± 1.864.5 ± 5.00.92 ± 0.08
2150160 ± 18156 ± 101.03 ± 0.14
2150SDS01115.5 ± 2.022.6 ± 1.80.69 ± 0.10
215043.8 ± 2.264.5 ± 5.00.68 ± 0.07
21502.40 ± 0.20154 ± 10̴ 0
Publisher’s Note: MDPI stays neutral with regard to jurisdictional claims in published maps and institutional affiliations.

