
All Fiber Mach–Zehnder Interferometer Based on Intracavity Micro-Waveguide for a Magnetic Field Sensor


1
Hebei Key Laboratory Micro-Nano Precision Optical Sensing and Measurement Technology, Northeastern University, Qinhuangdao 066004, China
2
College of Information Science and Engineering, Northeastern University, Shenyang 110819, China
*
Authors to whom correspondence should be addressed.
Appl. Sci. 2021, 11(23), 11569; https://0-doi-org.brum.beds.ac.uk/10.3390/app112311569
Submission received: 2 November 2021
/
Revised: 25 November 2021
/
Accepted: 3 December 2021
/
Published: 6 December 2021
(This article belongs to the Special Issue State-of-the-Art Laser Measurement Technologies)
Abstract
:A magnetic fluid (MF)-based magnetic field sensor with a filling-splicing fiber structure is proposed. The sensor realizes Mach–Zehnder interference by an optical fiber cascade structure consisting of single mode fiber (SMF), multimode fiber (MMF), and single-hole-dual-core fiber (SHDCF). The core in the cladding and the core in the air hole of SHDCF are used as the reference and sensing light path, respectively, and the air hole of SHDCF is filled with magnetic fluid to realize magnetic field measurement based on magnetic controlled refractive index (RI) characteristics. The theoretical feasibility of the proposed sensing structure is verified by Rsoft simulation, the optimized length of SHDCF is determined by optical fiber light transmission experiment, and the SHDCFs are well fused without collapse through the special parameter setting. The results show that the sensitivity of the sensor is −116.1 pm/Gs under a magnetic field of 0~200 Gs with a good long-term operation stability. The proposed sensor has the advantages of high stability, fast response, simple structure, and low cost, which has development potential in the field of miniaturized magnetic field sensing.
1. Introduction
Magnetic field measurement is of great significance in various fields, such as biomedical, aerospace, military war, the construction of electrical equipment, and so on [1,2,3]. The traditional electromagnetic sensor is easy to be damaged or disturbed by the magnetic field [4]. In contrast, optical fiber magnetic field sensors, with the advantages of anti-electromagnetic interference, small size, high stability, corrosion resistance, and remote measurement, are widely studied in the field of magnetic field sensing [5,6]. Magnetic fluid (MF) is a kind of promising magneto-optical nanomaterial consisting of magnetic particles and base fluid. The MF has no magnetic attraction in static state, and the magnetic particles are evenly distributed in the base fluid in static state. However, a magnetic linkage structure will be gradually formed by the magnetic particles along the direction of the applied magnetic field when the magnetic field is applied, which will cause the effective dielectric constants of MF to change, and then the change in the refractive index (RI) of the magnetic fluid [7,8,9,10,11]. Hence, the MF has attracted extensive attention for serving as crucial sensing elements of an optical fiber magnetic field sensor owing to the advantages of high sensitivity and good fiber compatibility [12,13,14].
The MF-based optical fiber magnetic field sensors mainly include Fabry–Perot (FP) microcavity magnetic field sensor, fiber Bragg grating (FBG) magnetic field sensor, mode interference magnetic field sensor, and surface plasmon resonance (SPR) magnetic field sensor. In 2016, Xia et al. [15] proposed an FP magnetic field sensor with temperature compensation by FBG; the sensitivity is 0.53 nm/mT. In 2018, Bao et al. [16] designed a phase-shifting fiber Bragg grating magnetic field sensor with micro-slit, with sensitivity of 2.42 pm/Oe and the measurement range of 0~120 Oe. In 2019, Zhang et al. [17] proposed a tapered optical fiber Mach–Zehnder interferometer (MZI) magnetic field sensor with a sensitivity of 71.98 pm/Oe and 0.11 dB/Oe at 40~120 Oe. In 2019, Zhou et al. [18] demonstrated an optical fiber magnetic field sensing system based on SPR with a sensitivity of 303 pm/Gs. In the above literature, the method of gluing-immersing MF was used in preparation of the sensor, which is simple to operate, but generally requires the use of capillary tubes for packing MF, and it also has disadvantages including a high dosage of MF, relatively large volume, and long response time. In addition, because of the use of glue to seal the sensing structure, the MF is prone to be contaminated, which will affect the sensing properties of MF. Compared with the gluing-immersion method, the all-fiber structures prepared by filling-splicing have the advantages of small volume, fast response rate, strong stability, and low cost. According to the research, the smaller the volume of magnetic fluid, the faster the response speed of the MF sensor [19]. In 2017, Yin et al. [20] prepared photonic crystal fiber misplaced fused magnetic field sensors by the method of filling-splicing, and the X-axis sensitivity reached 114.5 pm/mT. In 2018, Li et al. [21] used multimode fiber and photonic crystal fiber to make a magnetic field sensor by the method of filling-splicing with a sensitivity of 72 pm/Gs. However, the MF inside the porous fibers is carbonized and gasified when fused, which affects the reflectivity of the fiber end face, and eventually the performance of the entire sensor is affected. In order to avoid the influence of the carbonization and gasification of the MF on the performance of the sensor, the air hole filled with the MF should not be used as the light transmission channel. If an optical waveguide can be added to the air hole, it can not only ensure the transmission of light, but also sense the change of liquid refractive index in the air hole, which will be very helpful to improve the sensing performance.
In this paper, an intracavity micro-waveguide structure is proposed based on the SHDCF. The air cavity plays the role of filling MF and protecting micro-waveguide, and micro-waveguide as a sensing arm can sense the change in the RI of MF. The effective RI of the biased core as a reference arm in the cladding is hardly affected by the magnetic fluid. In addition, the theoretical feasibility of the proposed sensing structure structural scheme is verified by Rsoft simulation, the optimized length of SHDCF is determined by optical fiber light transmission experiment, and the SHDCFs are well welded without collapse through the special splicing parameter setting. The transmission spectrum of proposed sensor is blue shifted with the magnetic field intensity increase in the range of 0~200 Gs, and the sensitivity is −116.1 pm/Gs.
2. Principle and Preparation
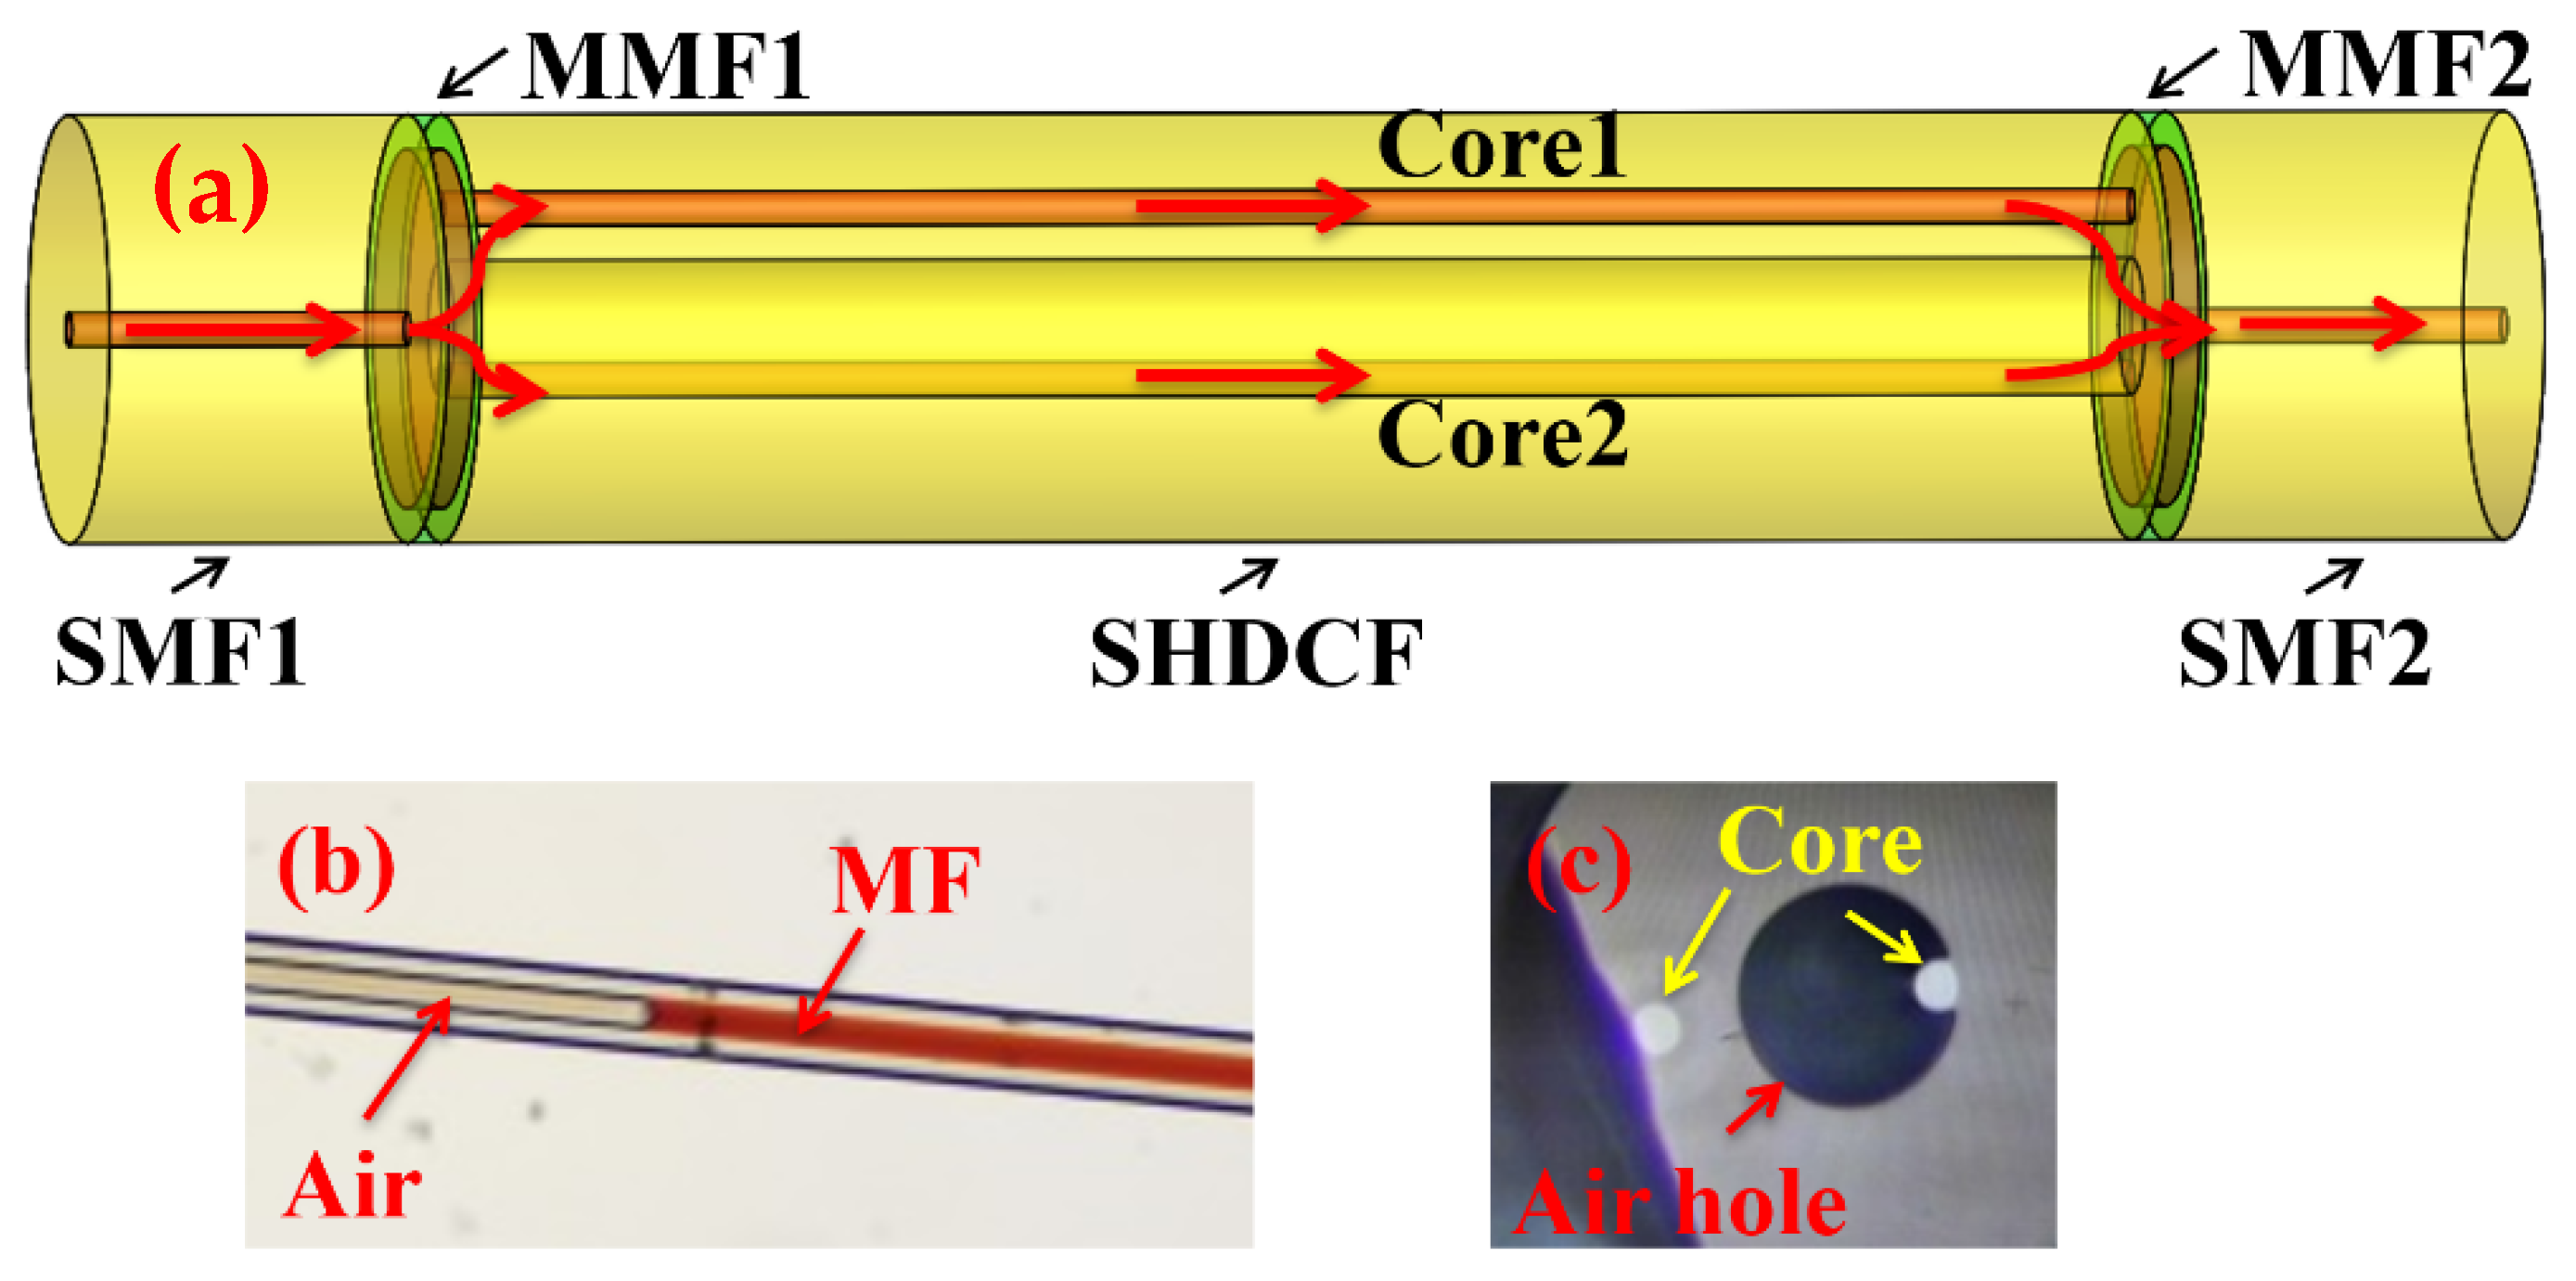
The proposed MZI sensor is composed of a cascade structure of SMF1-MMF1-SHDCF-MMF2-SMF2. A beam of light is coupled into MMF1 through SMF1, and then expands to two cores of SHDCF, and the two beam lights in the SHDCF are coupled to SMF2 through MMF2. The schematic diagram is shown in Figure 1a. The MF is filled into the air hole of the SHDCF by capillary action, as shown in Figure 1b and the cross-section diagram of the SHDCF is shown in Figure 1c. The SMF used in the experiment is commercial SMF with a cladding diameter of 125 μm and core diameter of 8.2 μm, and the cladding diameter and core diameter of MMF are 125 μm and 105 μm, respectively. The structural parameters of the SHDCF can be referred to in Table 1.
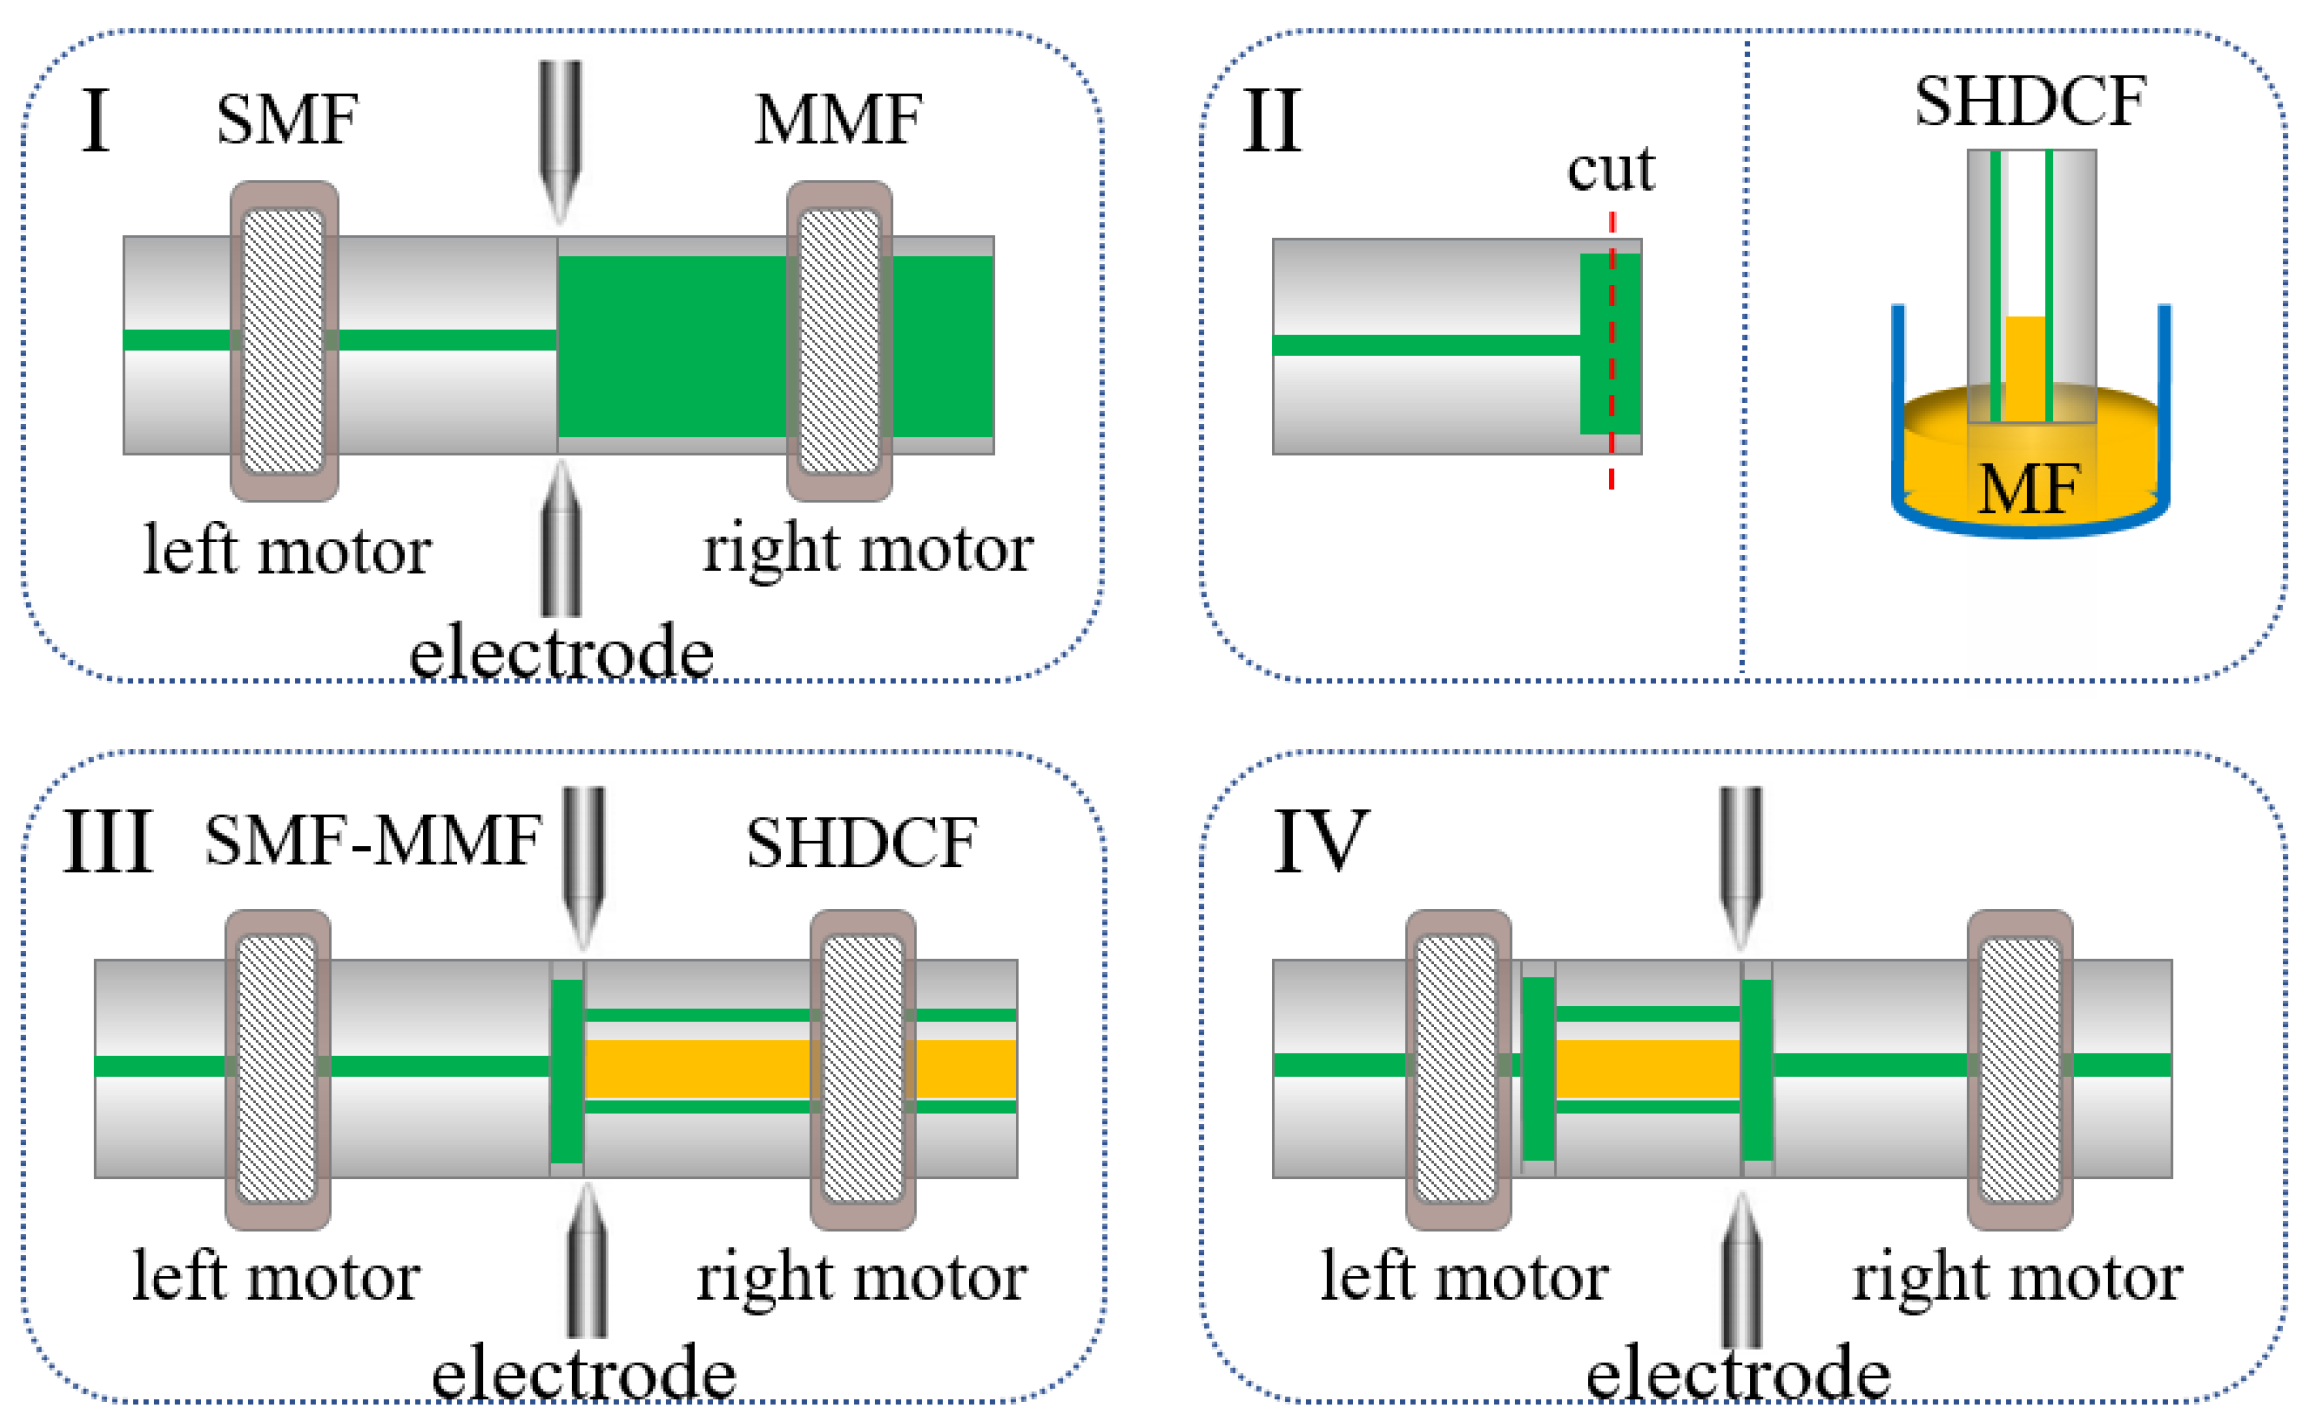
The fabrication process of the proposed sensor is shown in Figure 2. First, a segment of SMF and a segment of MMF are cleaved and welded together by an optical fiber cleaver (Fitel, S325) and fusion splicer (Fitel, S179), as shown in Figure 2I. Second, The SMF-MMF section is obtained by cutting with an optical fiber cleaver, and the SHDCF with a flat end face is vertically inserted into the MF for capillary effect filling, as shown in Figure 2II. Third, SMF-MMF and SHDCF are fused together without collapse. Finally, another MMF-SMF section is fused to the right side of the SHDCF.
In this structure, the output transmission spectrum can be described as follows [22]:
where I1 and I2 are the light intensity of core 1 and core 2, respectively; is the phase difference between the guide lights in core 1 and core 2, which can be calculated by the following formula:
where λ is the wavelength of operation, L is the length of the SHDCF, and the Δneff is the RI difference between core 2 and core 1. Hence, the calculation formula of interference valley wavelength λk is as follows:
where k is an integer. The RI of the MF in air hole (nMF) will change with the external magnetic field, which changes the reflection condition of the core in the air hole, and finally affects the effective RI of the core in air hole with reference to the research results of Chen et al. [23]; under a constant temperature value of T, the relationship between the RI of the MF and the magnetic field is as follows:
where ns is the saturation value of the RI of MF, which depends on the type of carrier liquid and the concentration of MF; n0 is the RI of the MF with the critical magnetic field; Hc,n is the critical value of the applied magnetic field (H > Hc,n); H is the field strength in Oe; T is the temperature in Kelvin; and α represents the fitting parameters, which is a data fitting value of magnetic saturation experiment of fixed magnetic fluid at 8 ℃. Δneff are related to the changes in the RI of MF (Δ according to the classic perturbation theory, through the overlap factor f defined as follows [24]:
When the intensity of the external magnetic field changes, the refractive index of the magnetic fluid (nMF) will change, resulting in the change in the effective refractive index of core 2, according to Formula (3), the characteristic wavelength of the interference spectrum will shift. Hence, the measurement of the external magnetic field can be realized by detecting the shift of the interference spectrum.
3. Results
3.1. Simulation of Sensing Structure
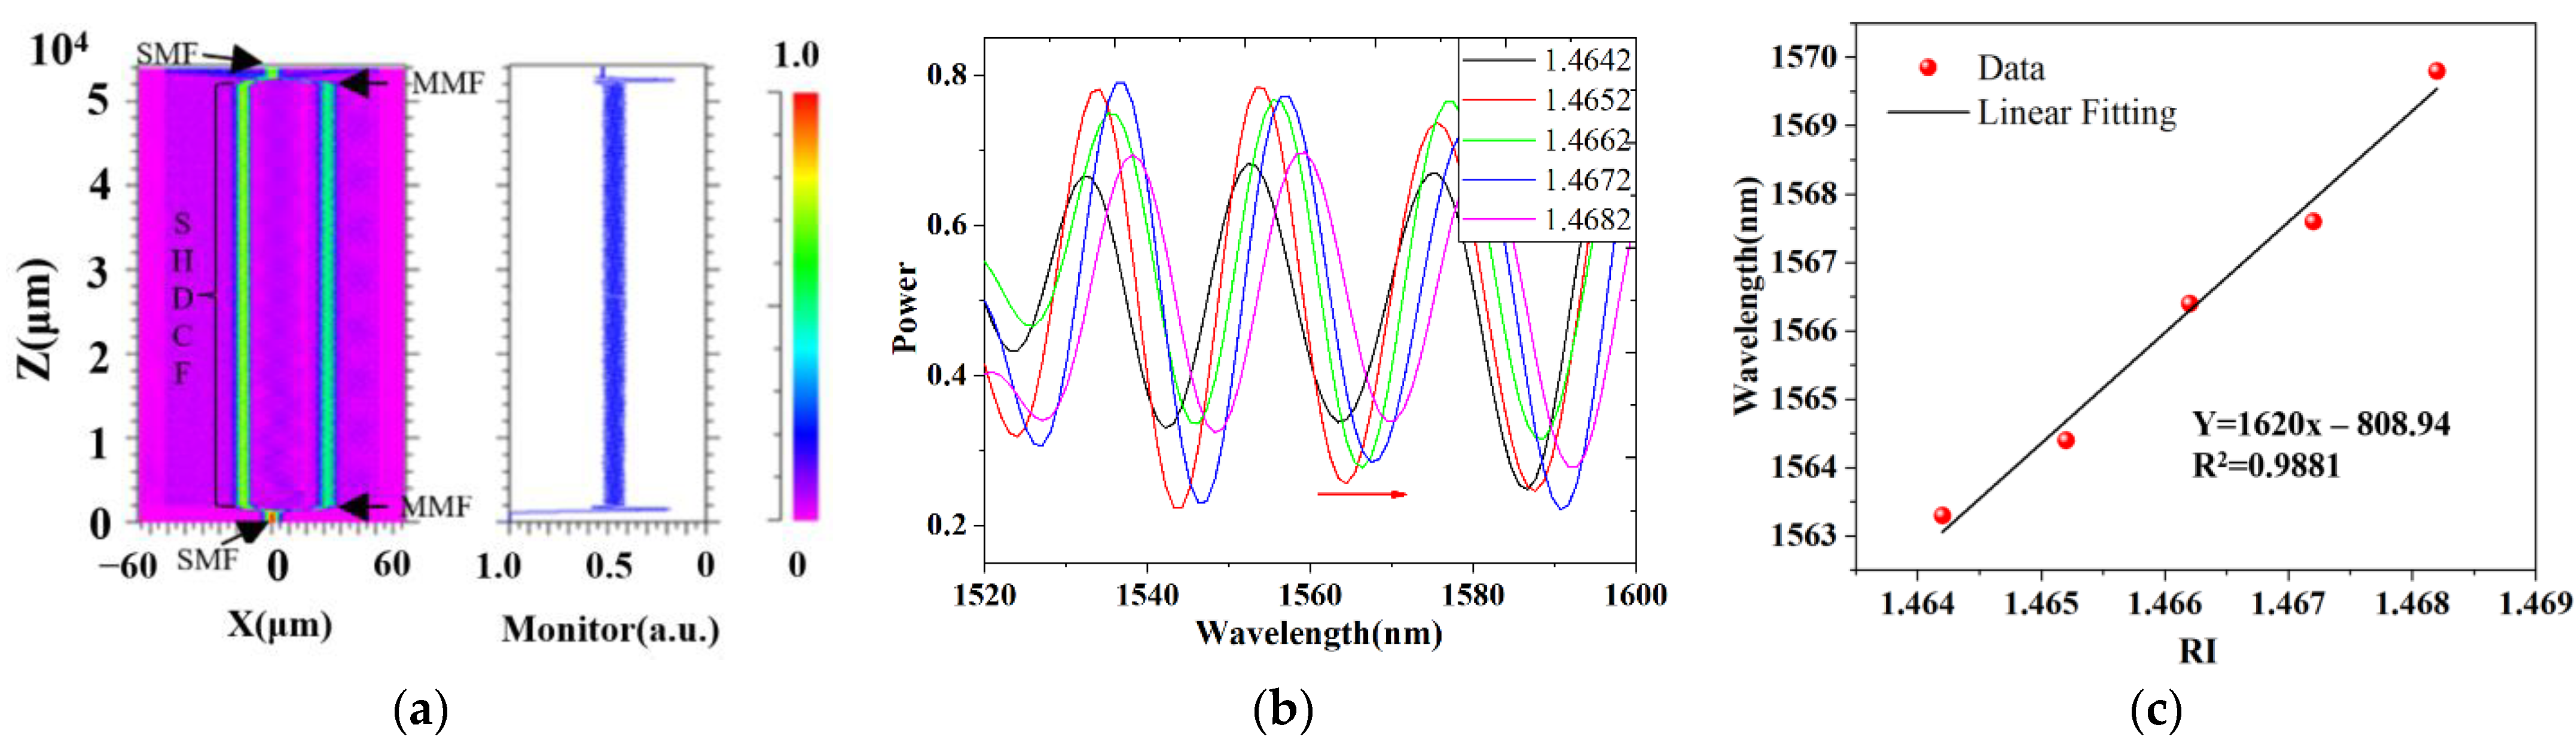
The change in the effective RI of the suspension core is determined by MF, and eventually leads to the movement of the interference spectrum. Therefore, the sensitivity of the RI change of the suspension core waveguide of this structure is simulated based on Rsoft software. The optical path diagram of the simulation model is shown in Figure 3a, and the simulated optical path diagram is consistent with the optical path structure shown in Figure 1. The RI of the core in the air hole of the simulation model is changed in the input light wavelength range of 1520~1600 nm, and the wavelength shift of the simulated transmission spectrum as RI rises of the suspension core is shown in Figure 3b. There are obvious interference valleys (peaks) at 1525, 1540, 1565, and 1570 nm of the transmission spectrum, and it is found that the sensitivity is 1620 nm/RIU at about 1565 nm after wavelength demodulation. The linear fitting of wavelength demodulation is shown in Figure 3c, and the value of R2 is 0.9881.
3.2. The Light Path Receiving Verification
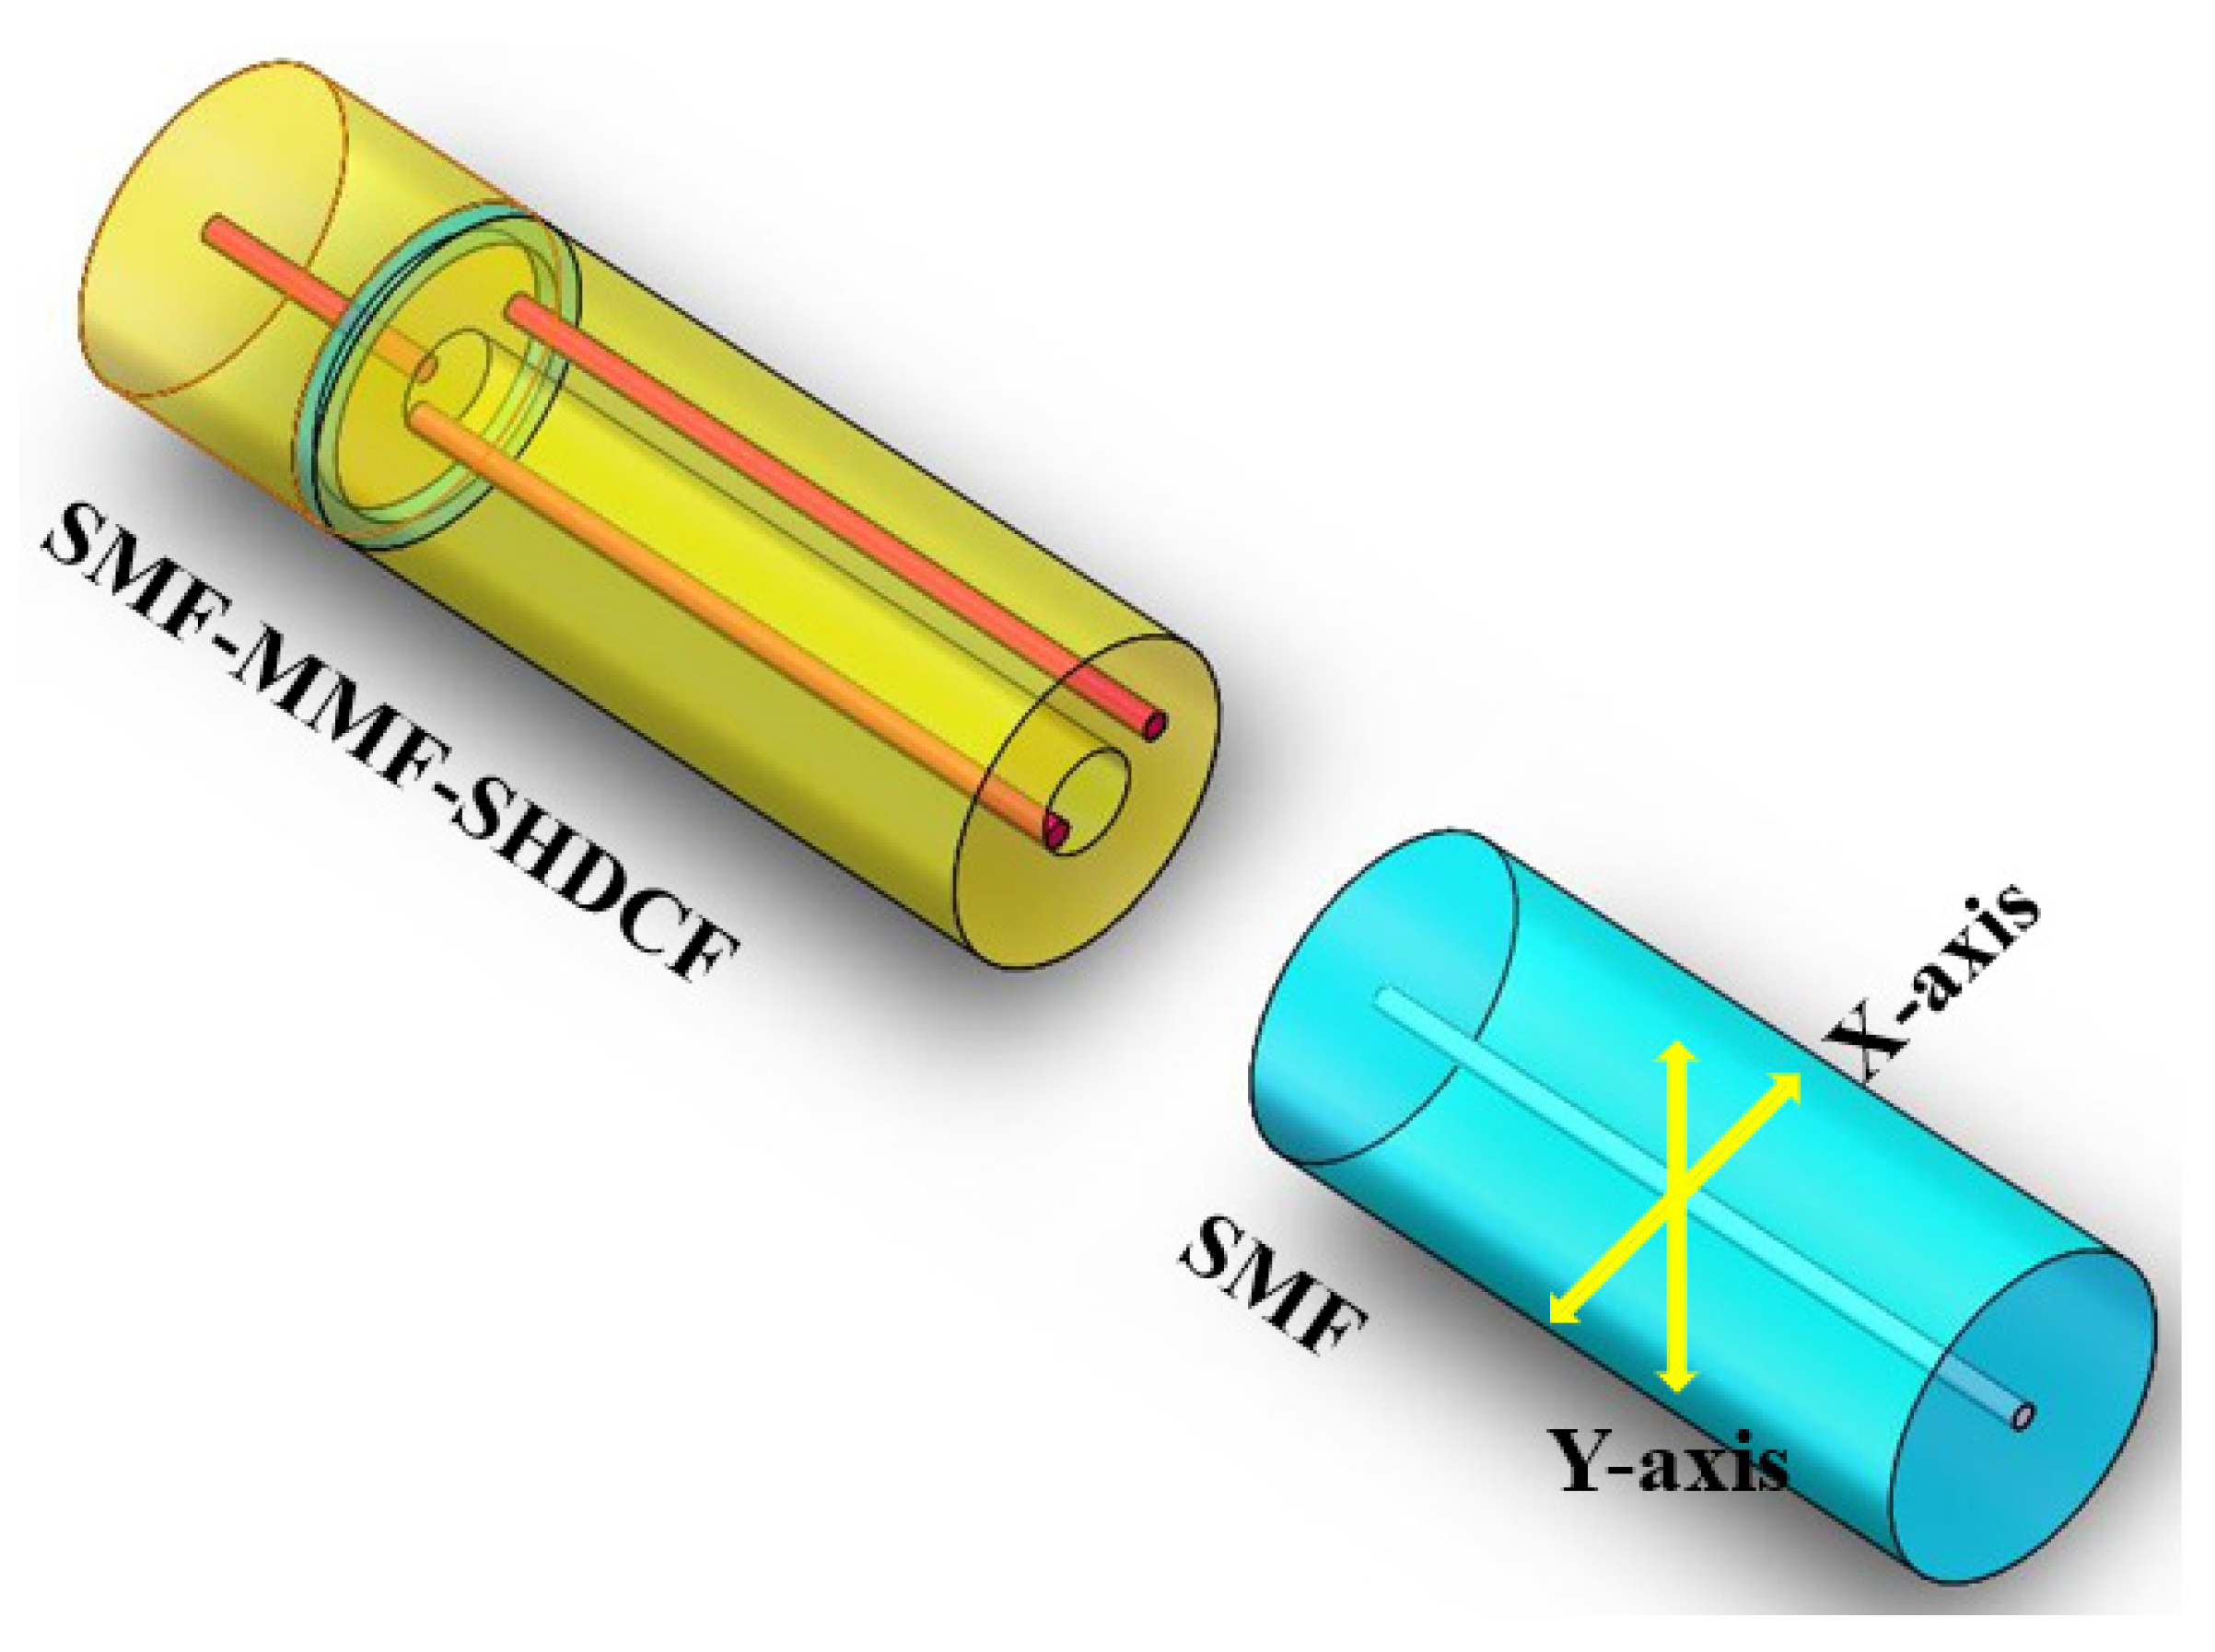
To verify the actual sensing optical path, an experimental system is built as shown in Figure 4. The SMF-MMF-SHDCF structure connected with a light source and the SMF connected with a spectrometer are placed on the left and right motors of the fiber fusion splicer, respectively, and the distance between SHDCF and SMF is as small as possible. Move the SMF in the X-axis and Y-axis directions to receive the transmitted light from core 1, core 2, air hole, and cladding of the SHDCF, respectively. The position of core 1 can be determined by observing the transmission spectrum in the spectrometer, and the position of core 2 and cladding can be determined by geometric calculation of cross section and transmission spectrum.
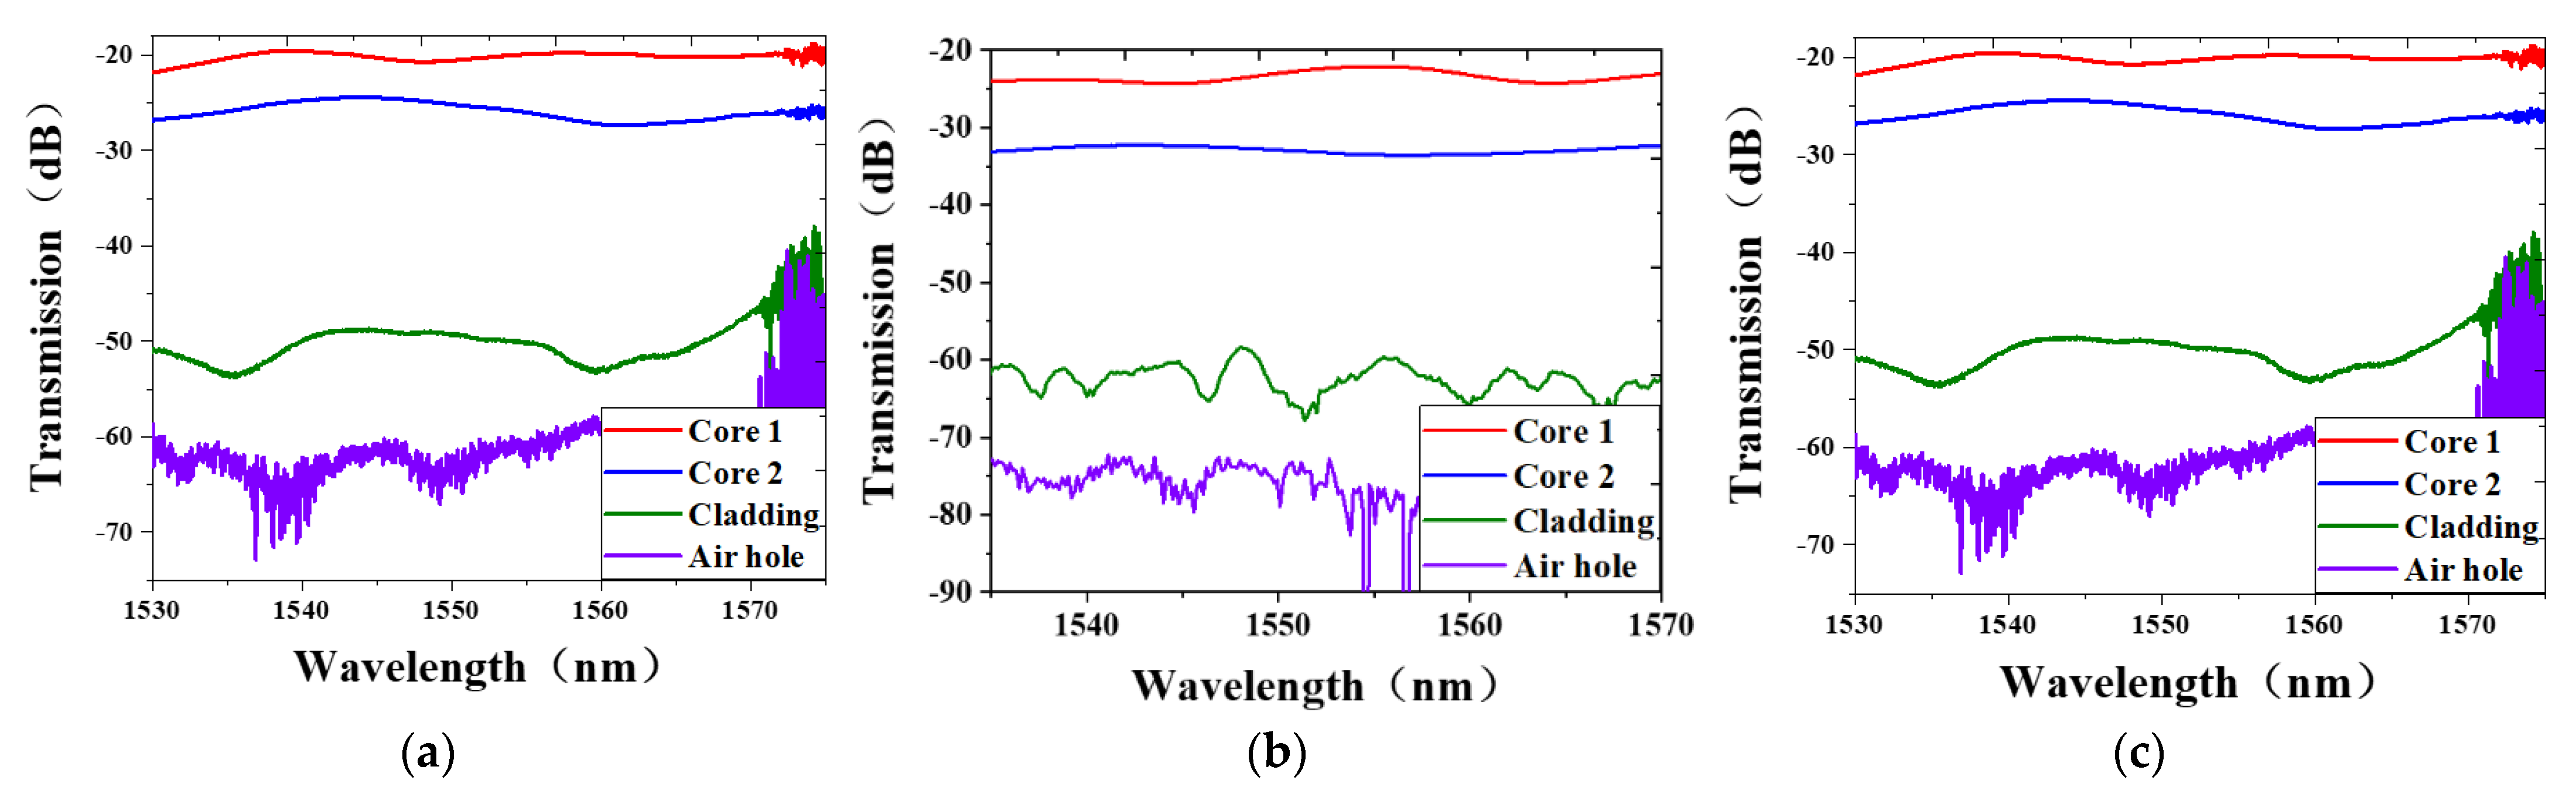
The SMF receives transmitted light from SHDCF with lengths of 3 cm, 5 cm, and 7 cm, as shown in Figure 5. The core in the air hole is exposed and the loss is greater than that in the cladding, so core 2 in Figure 5 is the core in the air hole. It can be seen from the results that the loss of core 2 is much less than that of the air holes and the cladding, and the longer the SHDCF, the greater the loss of transmitted light. According to Formula (5), the longer the length of SHDCF, the higher the sensitivity. As shown in Figure 5a, the light intensity in the cladding and air holes in the 3 cm SHDCF is too high, which will bring high-order mode interference. As shown in Figure 5c, the loss of core 2 in 7 cm SHDCF is too large, so the intensity of interference spectral will be very low. Referring to the above factors, the length of SHDCF is determined as 5 cm, and the light transmission intensity of each part of the SHDCF is shown in Figure 5b. The length of MMF is 1 mm, because of the beam can be expanded into two cores of SHDCF with the length, and the relevant theoretical analysis can refer to the published article [25].
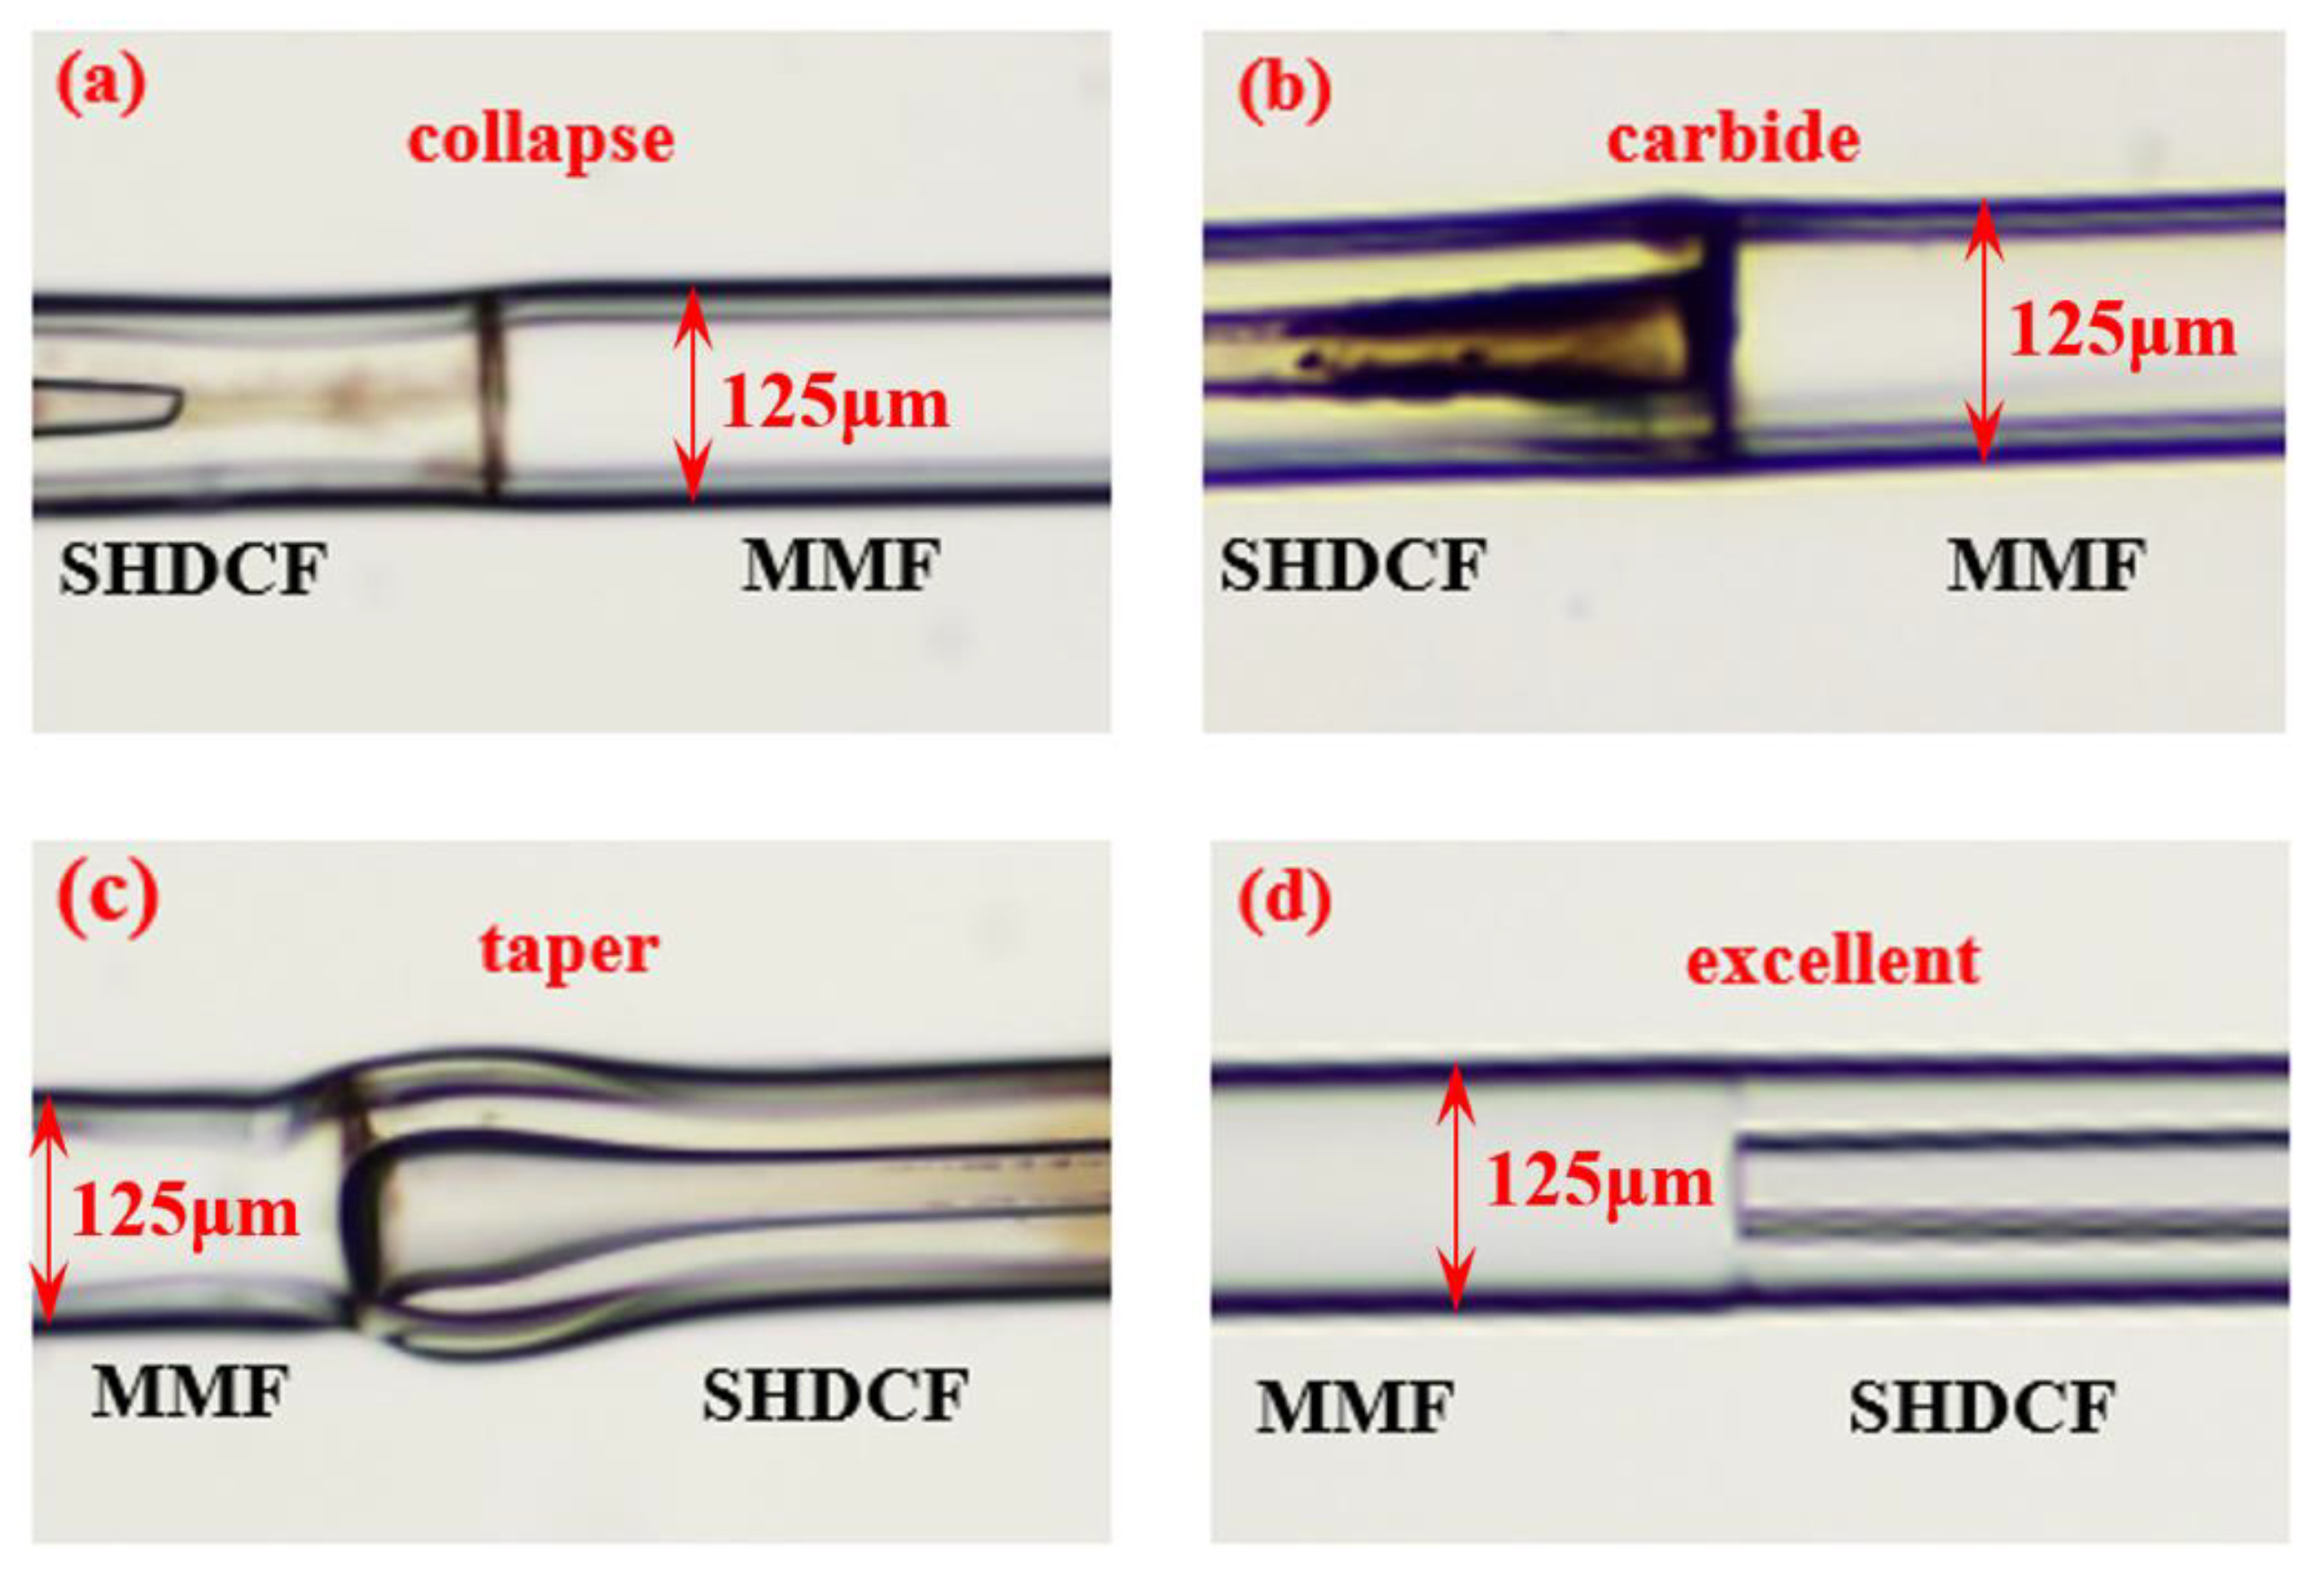
The splicing parameters are observed to fuse well. The automatic splicing procedure in the splicing machine is used to fuse SMF and MMF, and manual splicing mode is used to fuse SHDCF and MMF. The main parameters of splicing are discharge intensity and discharge time, and the collapse of the air hole (Figure 6a) and the over carbonization of the MF (Figure 6b) will be caused when the discharge intensity is too high, or the discharge time is too long. The SHDCF and MMF cannot be fused when the discharge time is short and the discharge intensity is small, and multiple discharges are needed, which will lead to the taper (Figure 6c). After a series of comparative experiments, the discharge time of 300 ms and the discharge intensity of 30 unit were finally selected; the effect drawing of no collapse splicing is shown in Figure 6d.
3.3. The Experimental Analysis
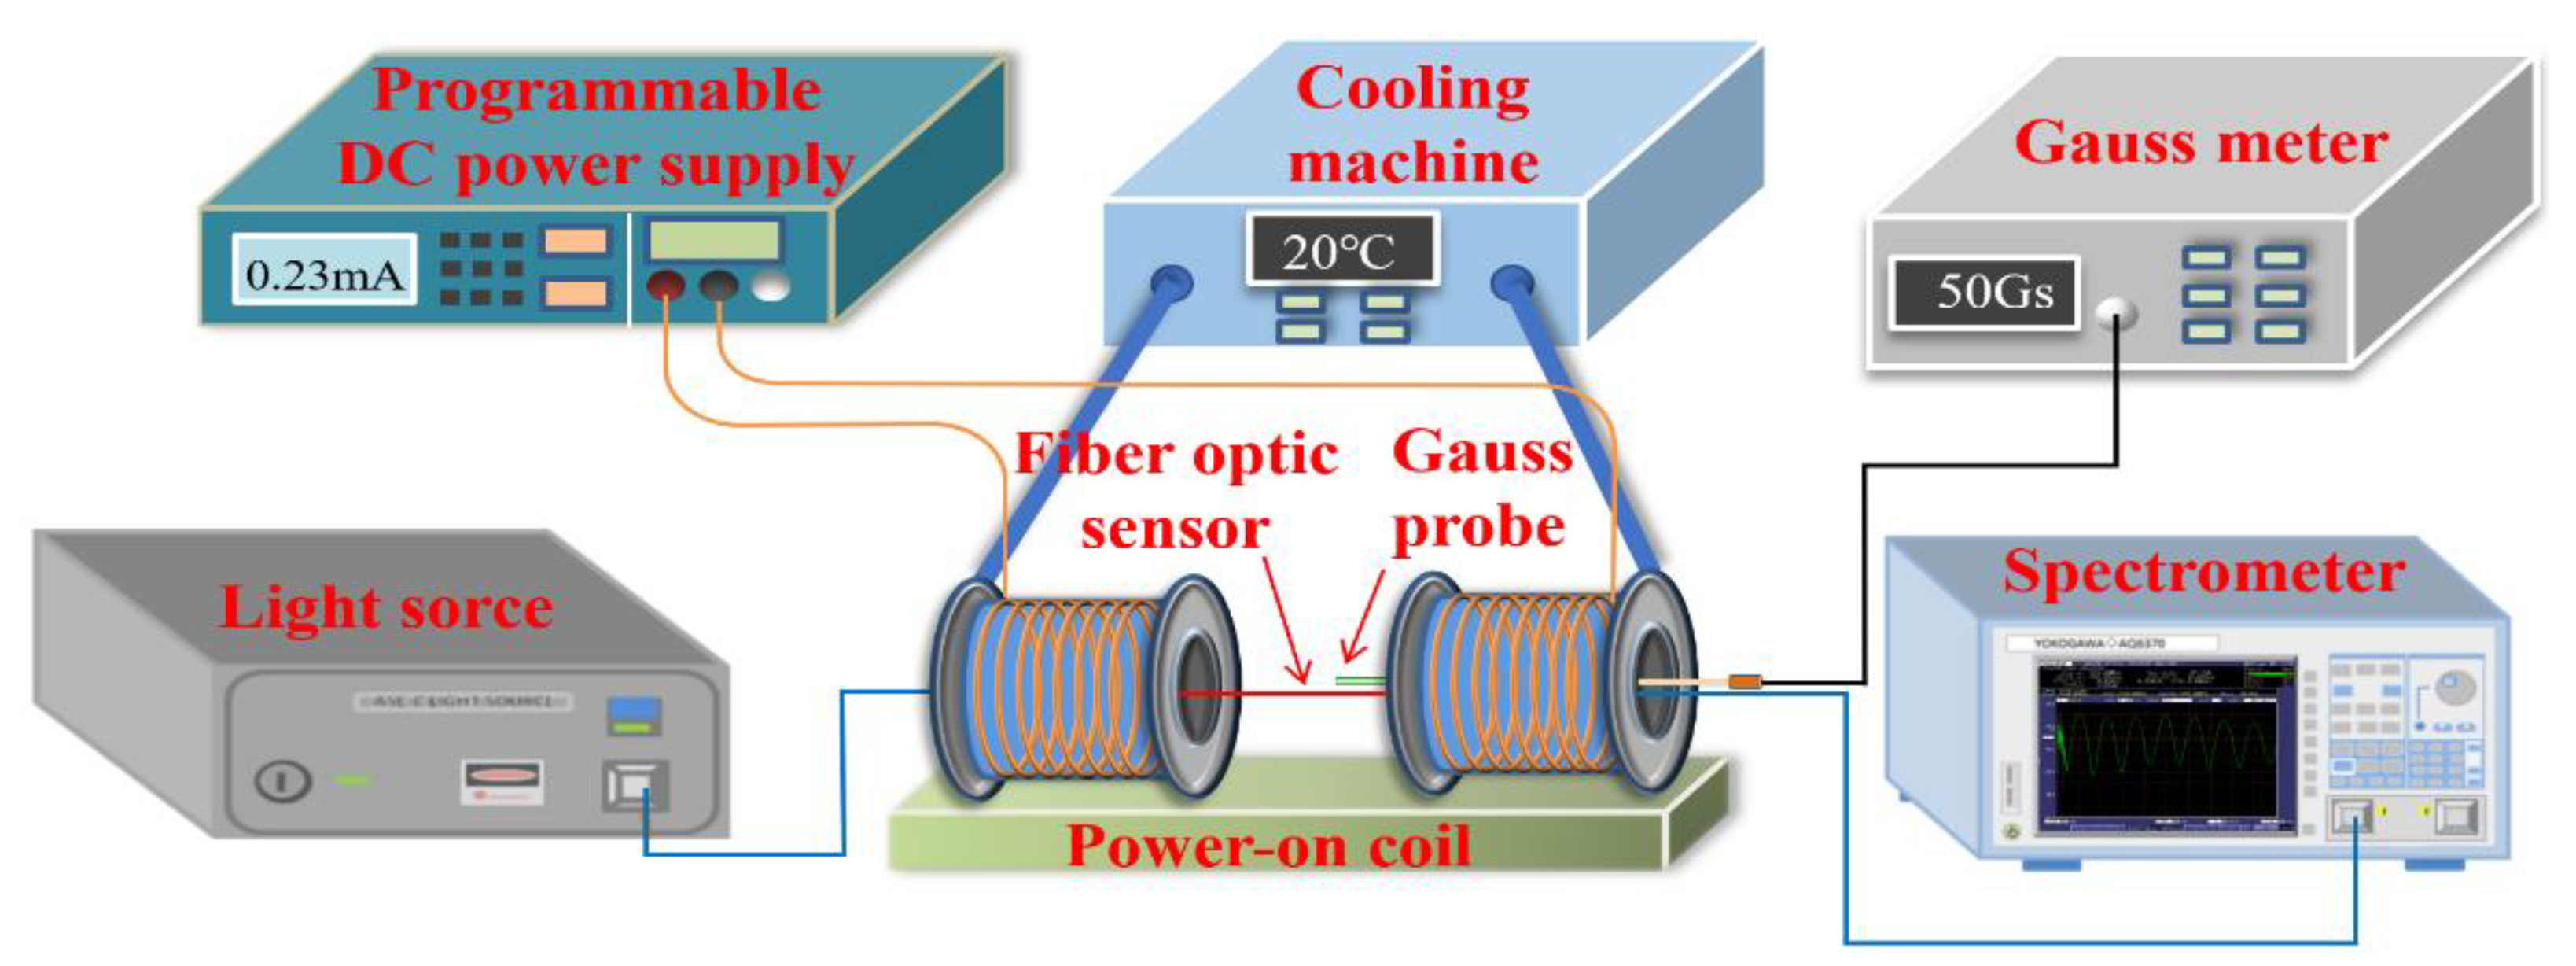
The magnetic field measurement platform is shown in Figure 7. The optical spectrum analyzer (AQ6370D) amplified spontaneous emission source, Gauss meter (CH-1500), and two 700-turn coils are used in the measurement platform. The programmable DC power (IT6164B) is used for power supply, and the magnetic field calibration is carried out by a Gauss meter with precision of 0.01 Gs.
The coil will heat up with a long working time, which will lead to the increase in coil resistance and instability of magnetic field environment. The temperature will also affect the RI of MF, which will cause inaccurate magnetic field measurement data. Therefore, circulating coolant is used to reduce the temperature. The coolant driven by a motor pump circulates in the inner of the coil frame, and the pumped coolant is cooled by the fan and finally flows back to the power coil. During the experiment, the temperature was set at 20 °C.
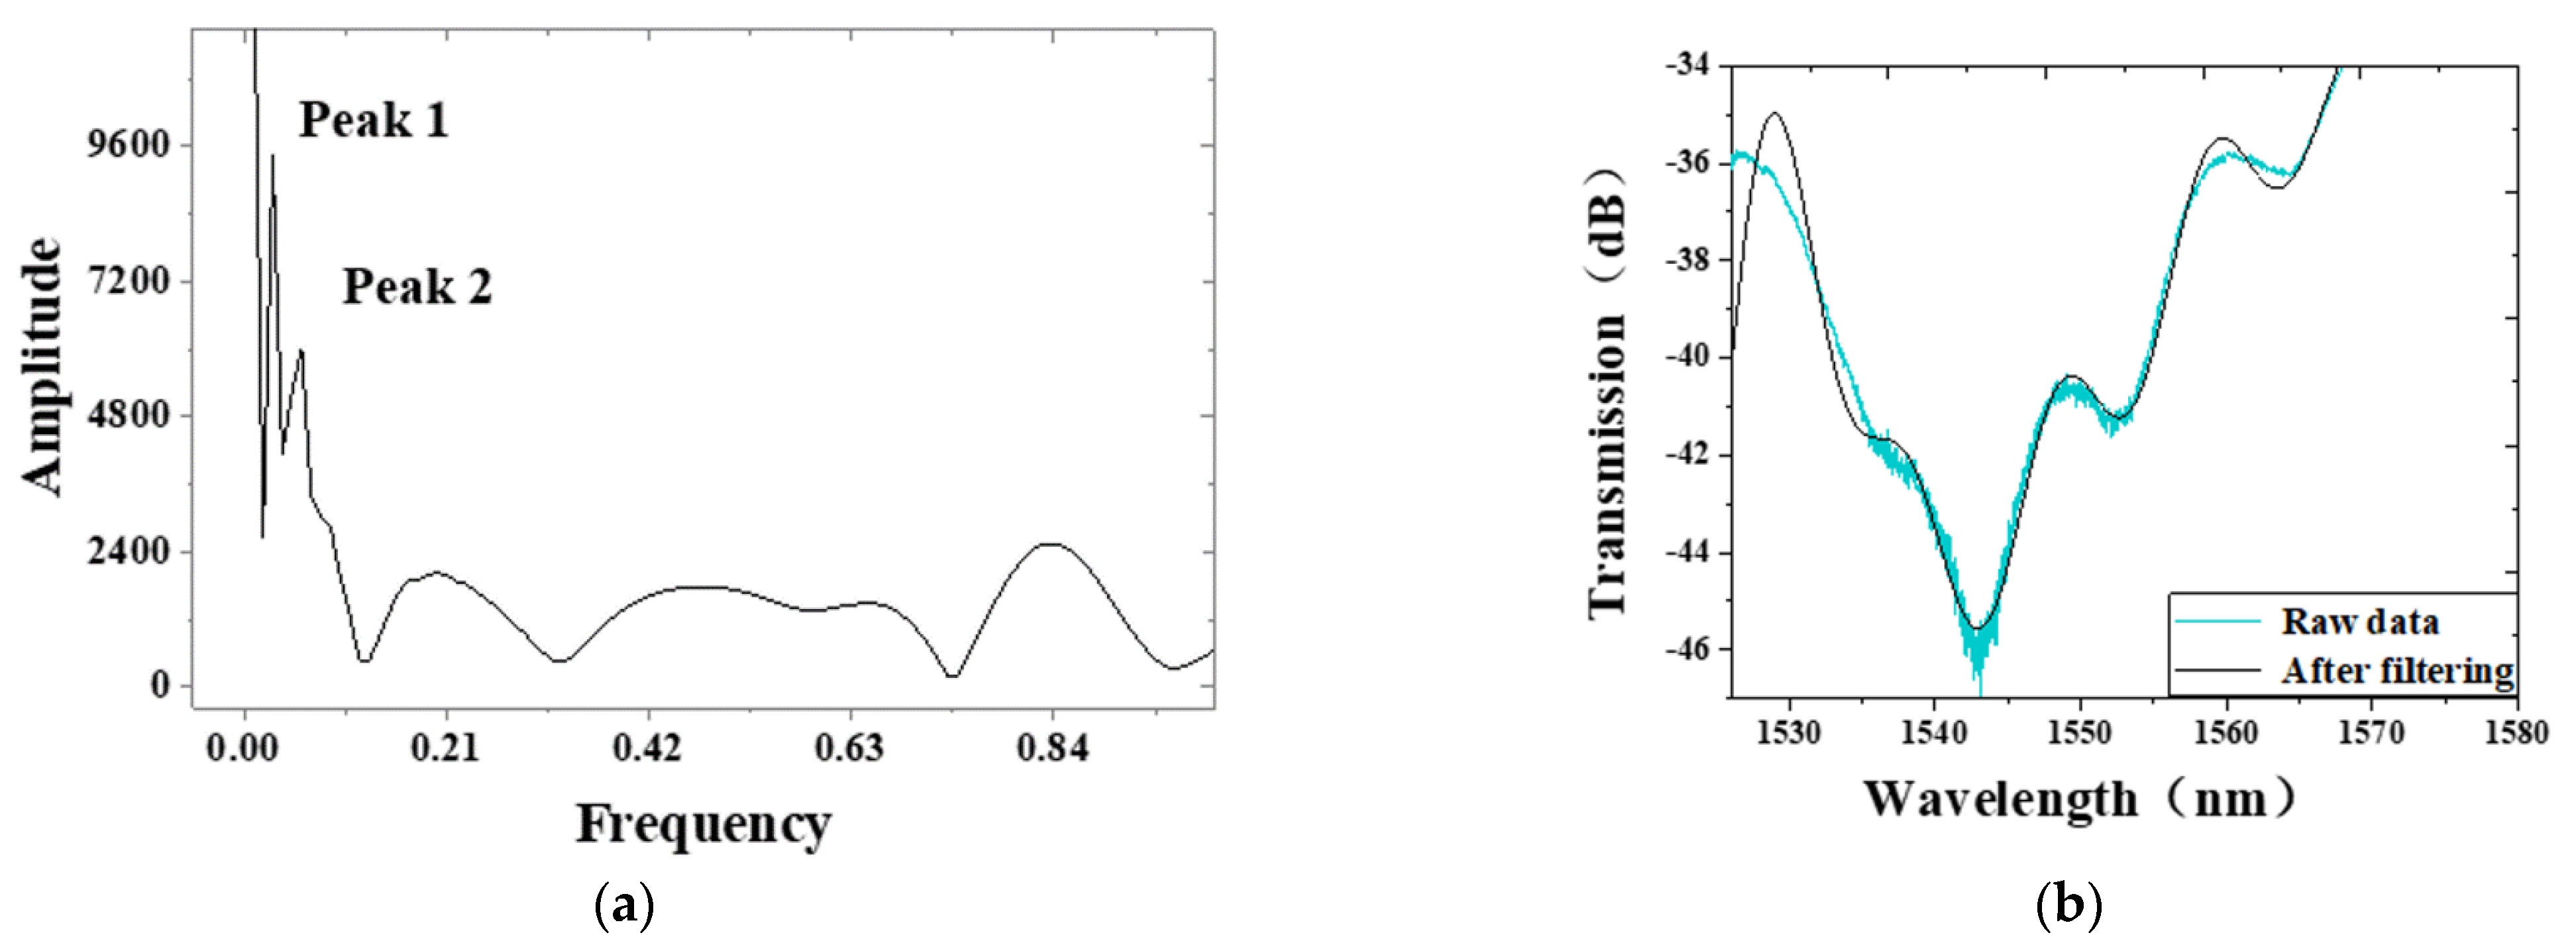
The prepared magnetic field sensor is placed on the magnetic field measurement platform, as shown in Figure 7. Gauss meter zeroing and pre-heat treatment for 30 min. The magnetic field strength is increased by 25 Gs every 20 min by increasing the output current of the DC power supply, and the measured data of each magnetic field strength are saved on the optical spectrum analyzer. Fourier transform of the magnetic field measurement data is carried out, as shown in Figure 8a, and a small amount of light passes through the air hole and cladding and causes high-order mode interference, according to the results of Fourier transform. The band-pass filter is used to eliminate the high-order mode interference from the air hole and cladding in magnetic field measurement data; the comparison of transmission spectrum before and after filtering is shown in Figure 8b.
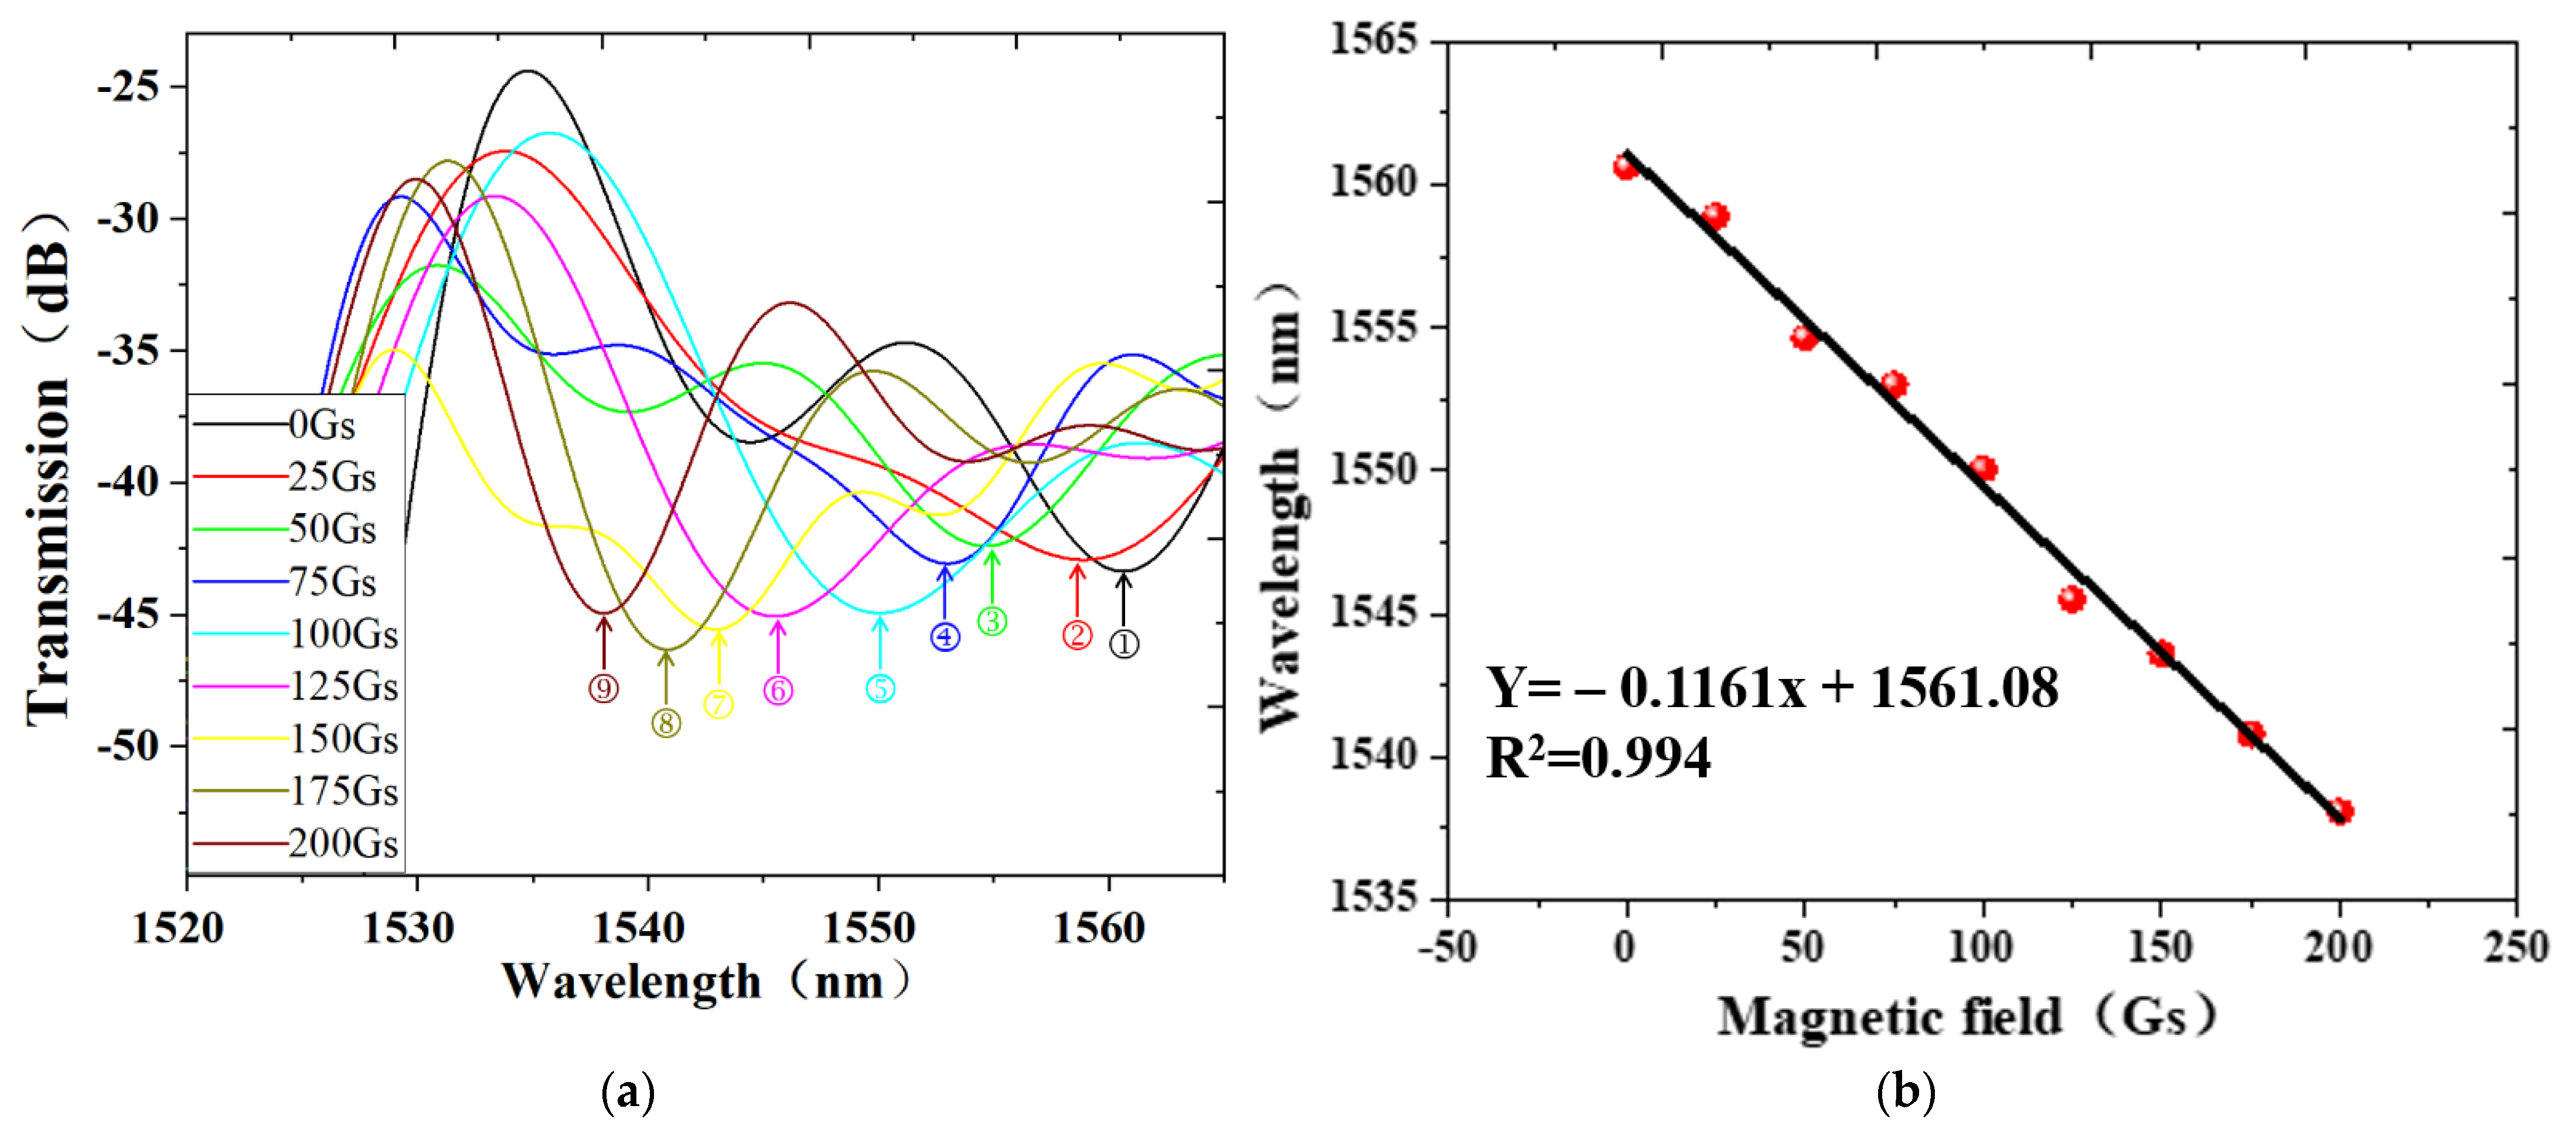
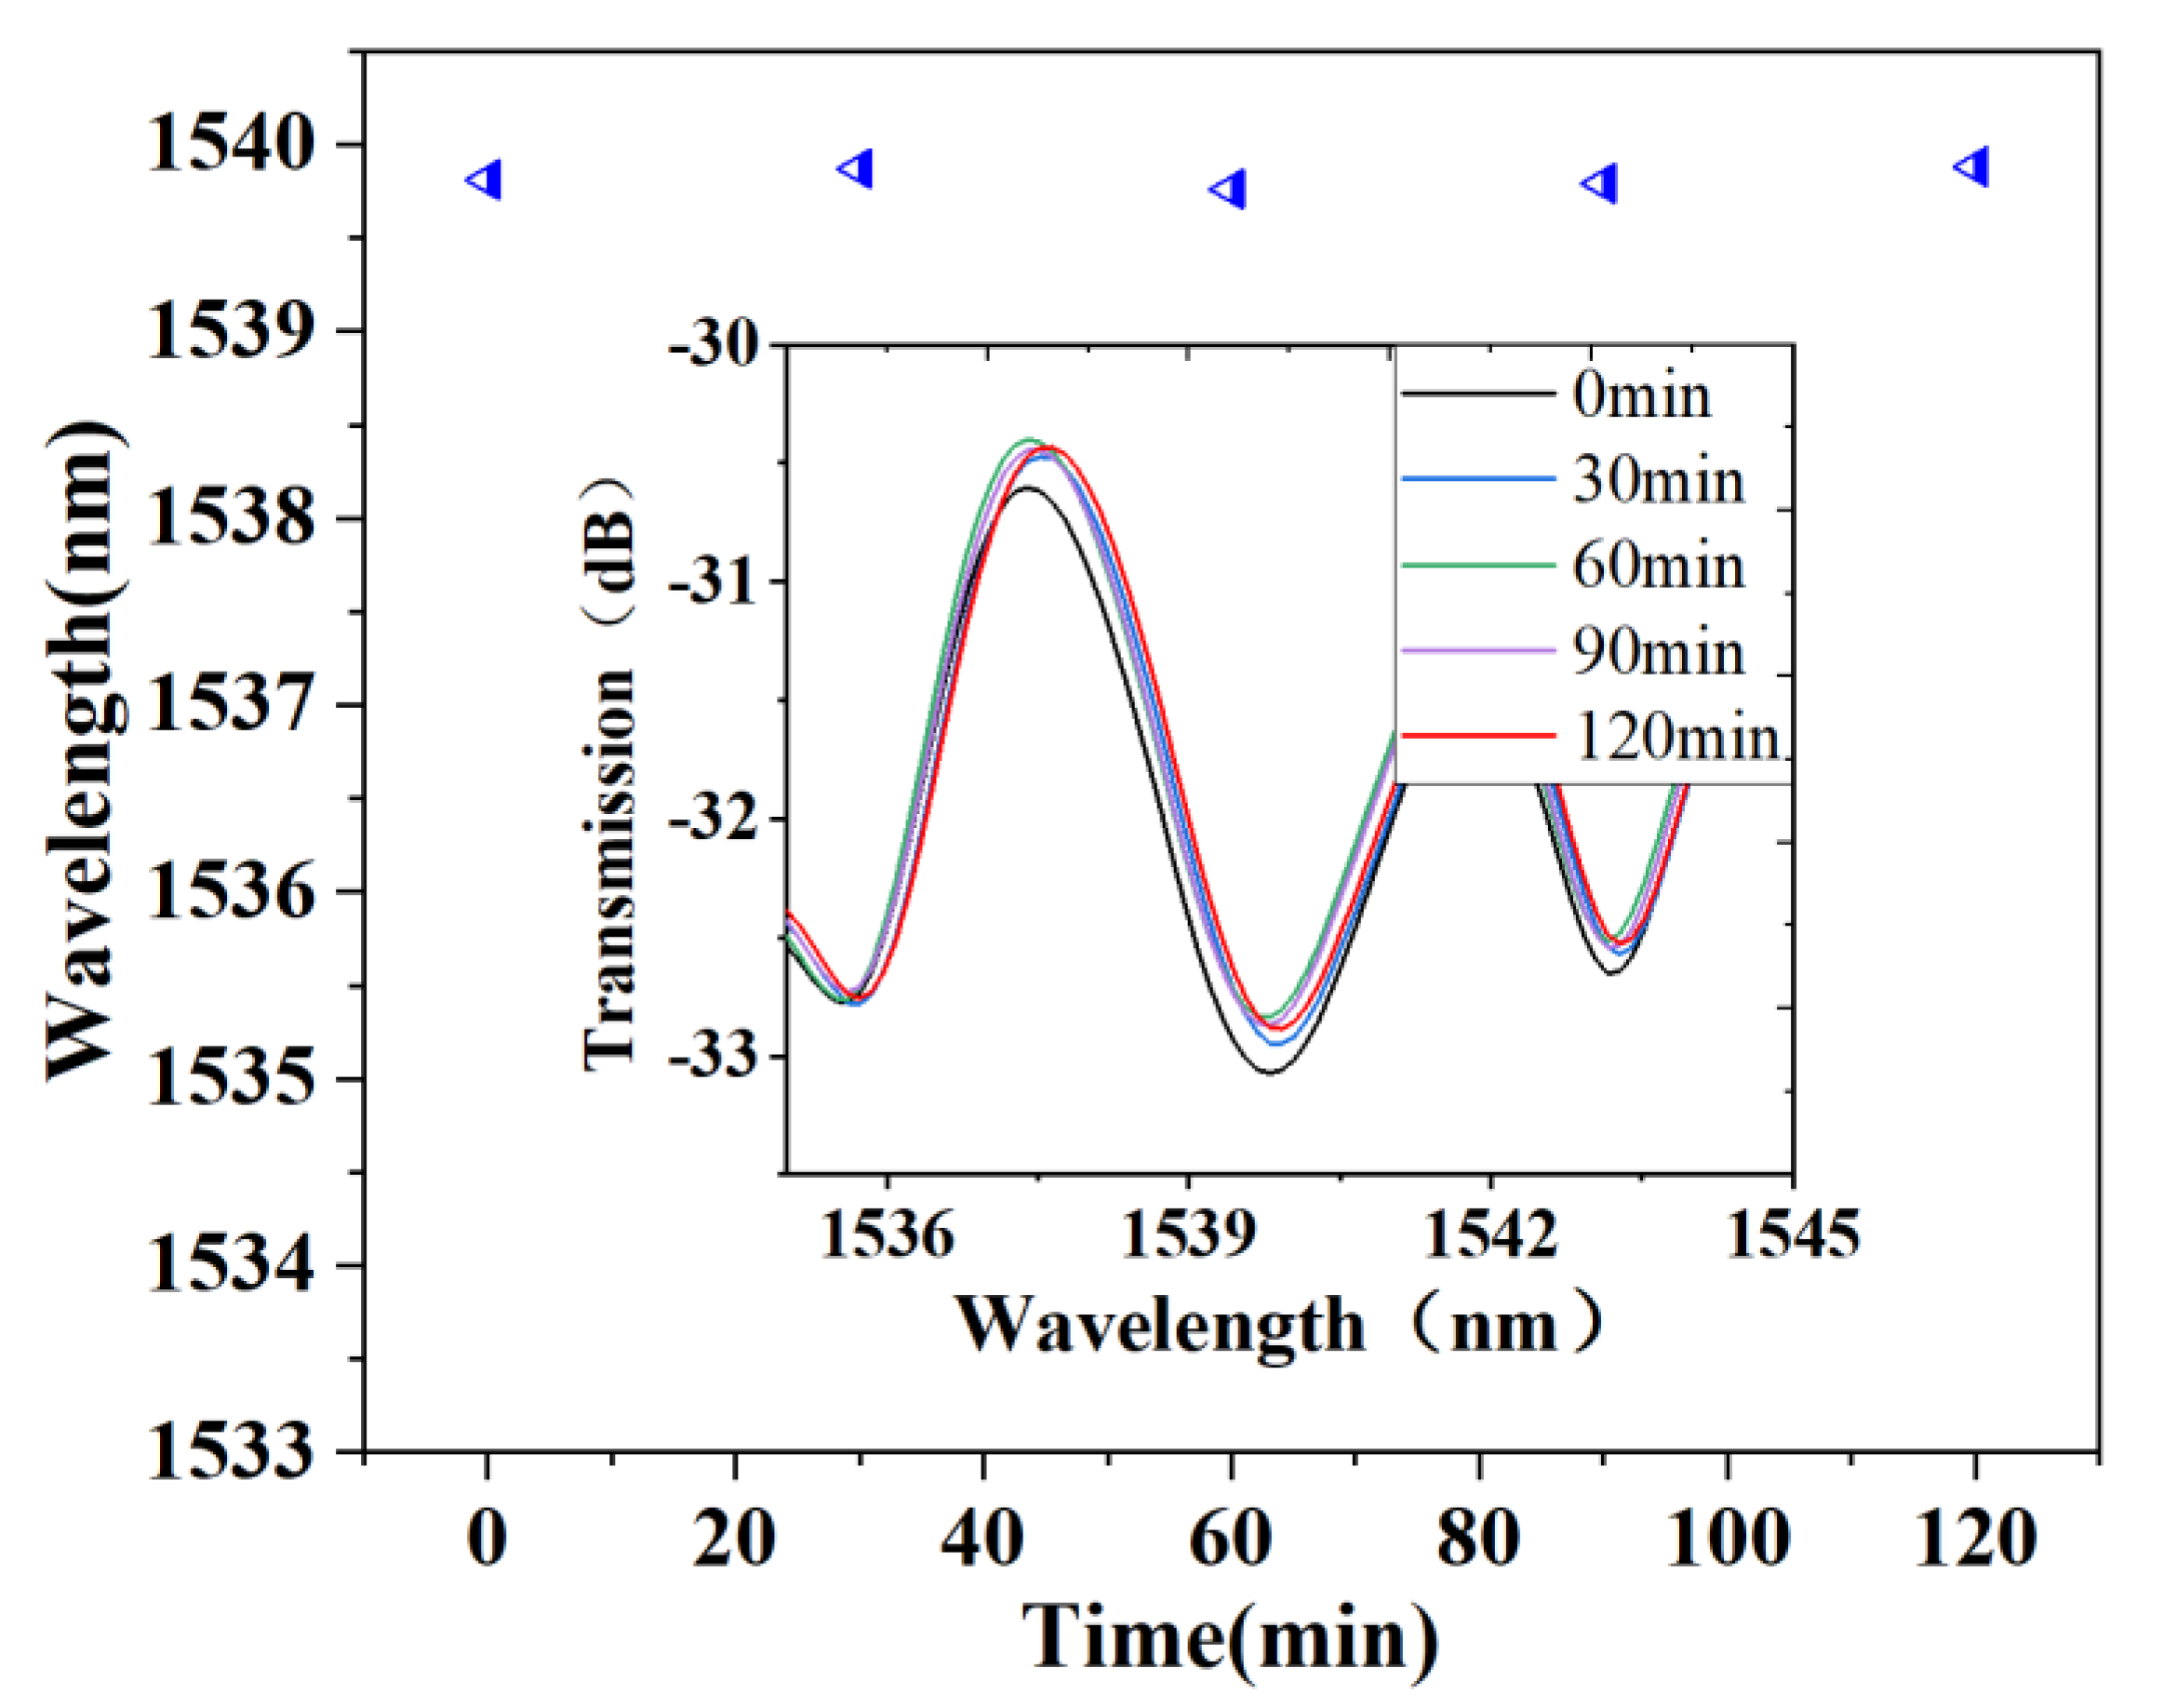
As shown in Figure 9a, the transmission spectrum after band-pass filtering of the sensor in the magnetic field range of 0~200 Gs is blue shifted with the increase in magnetic field intensity, and the sensitivity is −116.1 pm/Gs with a linearly fitted index of 0.9940, as shown in Figure 9b. The magnetic field measurement data are saved every 30 min at the magnetic field of 0 Gs for the verification of sensor stability, as shown in Figure 10. The maximum wavelength shift is 0.12 nm within 120 min through wavelength demodulation.
The performance comparison of the proposed sensor with the MF-based optical fiber MZI sensors in recent years is given in Table 2. From Table 2, the sensitivity and the measurement range of [21,26,27,28] are lower than that of the structure proposed in this paper, and although the sensitivity of [29] is higher than that of the proposed sensor, the measurement range is only from 0.024 to 0.2 Gs and the glue immersion method is adopted. In addition, only the basic fusing structure is used in this paper, and the sensitivity of the sensor can be further improved through the methods of tapering, bending, and dislocation of SHDCF. The simple preparation process, low cost, and fast response make the sensor proposed in this paper a potential candidate in practical magnetic field measurement applications.
4. Conclusions
A magnetic field sensor based on MZI fabricated by filling-splicing is proposed in this paper. The SHDCF is fused after filling MF in the air hole to ensure that the MF is in a completely enclosed space, which makes the sensor stable. The sensitivity of the RI change of the suspension core waveguide of this structure is simulated based on Rsoft. The SMF connected to the optical spectrum analyzer is used to receive the transmitted light from core 1, core 2, air hole, and cladding of the SHDCF, respectively, to verify the sensing theory and determine the optimized length of SHDCF. Finally, the sensor was fabricated with the appropriate splicing parameters, and the experimental results show that the sensitivity of the sensor is −116.1 pm/Gs in the range of 0~200 Gs with a good linearity. The sensor has the advantages of a simple structure, low cost, fast response, and high structural strength, and the structure is expected to be used in magnetic field measurement of industrial production.
Author Contributions
Conceptualization, M.C. and Y.Z.; methodology, M.C.; software, Q.L.; validation, M.C. and Y.Z.; investigation, Q.L.; resources, Y.Z.; data curation, Q.L.; writing—original draft preparation, Q.L. and M.C.; writing—review and editing, M.C.; visualization, M.C.; supervision, Y.Z.; project administration, Y.Z.; funding acquisition, Y.Z. and M.C. All authors have read and agreed to the published version of the manuscript.
Funding
This work was supported in part by the National Natural Science Foundation of China under Grant 61933004; the Fundamental Research Funds for the Central Universities under Grants N2123012, N2123014, and N160408001; Natural Science Foundation of Hebei Province (F2021501011, F2020501040); and the Science and Technology Commission of Shanghai Municipality (STCSM) (SKLSFO2020-03) in China.
Institutional Review Board Statement
Not applicable.
Informed Consent Statement
Not applicable.
Data Availability Statement
The data presented in this study are available on request from the corresponding author.
Acknowledgments
The authors acknowledge the Hebei Key Laboratory Micro-Nano Precision Optical Sensing and Measurement Technology at the Northeastern University.
Conflicts of Interest
The authors declare no conflict of interest. The funders had no role in the design of the study; in the collection, analyses, or interpretation of data; in the writing of the manuscript; or in the decision to publish the results.
References
- Fotis, G.P.; Rapanakis, A.G.; Gonos, I.F.; Stathopulos, I.A. Measurement of the magnetic field radiating by electrostatic discharges during the verification of the ESD generators. Measurement 2006, 40, 428–436. [Google Scholar] [CrossRef]
- Zheng, J.; Dong, X.Y.; Zu, P.; Ji, J.H.; Su, H.B.; Shum, P.P. Intensity-modulated magnetic field sensor based on magnetic fluid and optical fiber gratings. Appl. Phys. Lett. 2015, 103, 183511. [Google Scholar] [CrossRef]
- Ying, Y.; Zhao, Y.; Lv, R.Q.; Li, J. Thermally modulated slow light in magnetic fluid photonic crystal. IEEE Photonics Technol. Lett. 2015, 27, 883–886. [Google Scholar] [CrossRef]
- Lopez, J.; Dante, A.; Carvalho, C.; Allil, R.; Werneck, M. Simulation and experimental study of FBG-based magnetic field sensors with Terfenol-D composites in different geometric shapes. Measurement 2021, 172, 108893. [Google Scholar] [CrossRef]
- Culshaw, B. Optical fiber sensor technologies: Opportunities and-perhaps-pitfalls. J. Lightwave Technol. 2004, 22, 39–50. [Google Scholar] [CrossRef]
- Wang, S.F.; Chiang, C.C. A notched long-period fiber grating magnetic field sensor based on nanoparticle magnetic fluid. Appl. Sci. 2016, 6, 9. [Google Scholar] [CrossRef]
- Chen, X.; Zhu, X.Q.; Xu, Z.Y.; Lin, Y.C.; He, G.T. An inductance-based technique for the measurement of magnetic moment of the magnetorheological fluids. Measurement 2014, 47, 693–697. [Google Scholar] [CrossRef]
- Zhao, Y.; Wu, D.; Lv, R.Q.; Ying, Y. Tunable characteristics and mechanism analysis of the magnetic fluid refractive index with applied magnetic field. IEEE Trans. Magn. 2014, 50, 4600205. [Google Scholar] [CrossRef]
- Ying, Y.; Zhao, Y.; Lv, R.Q.; Hu, H.F. Magnetic field measurement using Surface Plasmon Resonance sensing technology combined with magnetic fluid photonic crystal. IEEE Trans. Instrum. Meas. 2016, 65, 170–176. [Google Scholar] [CrossRef]
- Zhao, Y.; Zhang, Y.Y.; Lv, R.Q.; Wang, Q. Novel optical devices based on the tunable refractive index of magnetic fluid and their characteristics. J. Magn. Magn. Mater. 2011, 323, 2987–2996. [Google Scholar] [CrossRef]
- Liu, Y.X.; Li, X.G.; Zhang, Y.N.; Zhao, Y. Fiber-optic sensors based on Vernier effect. Measurement 2021, 167, 108451. [Google Scholar] [CrossRef]
- Zhang, J.Y.; Chen, F.Y.; Wang, R.H.; Qiao, X.G. Vector magnetic field measurement based on magnetic fluid and high-order cladding-mode Bragg grating. Opt. Laser Technol. 2021, 143, 107264. [Google Scholar] [CrossRef]
- Dai, J.X.; Yang, M.H.; Li, X.B.; Liu, H.L.; Tong, X.L. Magnetic field sensor based on magnetic fluid clad etched fiber Bragg grating. Opt. Fiber Technol. 2011, 17, 210–213. [Google Scholar] [CrossRef]
- Zhao, Y.; Wang, X.X.; Lv, R.Q.; Li, G.L.H.; Zheng, K.; Zhou, Y.F. Highly sensitive reflective Fabry-Perot magnetic field sensor using magnetic fluid based on Vernier effect. IEEE Trans. Instrum. Meas. 2021, 70, 7000808. [Google Scholar] [CrossRef]
- Xia, J.; Wang, F.Y.; Luo, H.; Wang, Q.; Xiong, S.D. A magnetic field sensor based on a magnetic fluid-filled FP-FBG structure. Sensors 2016, 16, 620. [Google Scholar] [CrossRef] [PubMed]
- Bao, L.F.; Dong, X.Y.; Zhang, S.Q.; Shen, C.Y.; Shum, P.P. Magnetic field sensor based on magnetic fluid-infiltrated phase-shifted fiber Bragg grating. IEEE Sens. J. 2018, 18, 4008–4012. [Google Scholar] [CrossRef]
- Zhang, J.Y.; Qiao, X.G.; Wang, R.H.; Chen, F.Y.; Bao, W.J. Highly sensitivity fiber-optic vector magnetometer based on two-mode fiber and magnetic fluid. IEEE Sens. J. 2019, 19, 2576–2580. [Google Scholar] [CrossRef]
- Zhou, X.; Li, X.G.; Li, S.G.; An, G.W.; Cheng, T.L. Magnetic field sensing based on SPR optical fiber sensor interacting with magnetic fluid. IEEE Trans. Instrum. Meas. 2019, 68, 234–239. [Google Scholar] [CrossRef]
- Zhao, Y.; Wang, X.X.; Lv, R.Q.; Zheng, H.K.; Zhou, Y.F.; Chen, M.Q. Reflective Highly Sensitive Fabry-Perot Magnetic Field Sensor Based on Magneto-Volume Effect of Magnetic Fluid. IEEE Trans. Instrum. Meas. 2021, 70, 9386132. [Google Scholar] [CrossRef]
- Yin, J.D.; Ruan, S.C.; Liu, T.G.; Jiang, J.F.; Wang, S.; Wei, H.F.; Yan, P.G. All-fiber-optic vector magnetometer based on nano-magnetic fluids filled double-clad photonic crystal fiber. Sens. Actuator B Chem. 2017, 238, 518–524. [Google Scholar] [CrossRef]
- Li, X.G.; Zhou, X.; Zhao, Y.; Lv, R.Q. Multi-modes interferometer for magnetic field and temperature measurement using Photonic crystal fiber filled with magnetic fluid. Opt. Fiber Technol. 2018, 41, 1–6. [Google Scholar] [CrossRef]
- Li, L.C.; Xia, L.; Xie, Z.H.; Liu, D.M. All-fiber Mach-Zehnder interferometers for sensing applications. Opt. Express 2012, 20, 11109–11120. [Google Scholar] [CrossRef] [PubMed]
- Chen, Y.F.; Yang, S.Y.; Tse, W.S.; Horng, H.E.; Hong, C.Y.; Yang, H.C. Thermal effect on the field-dependent refractive index of the magnetic fluid film. Appl. Phys. Lett. 2003, 82, 3481–3483. [Google Scholar] [CrossRef]
- Qu, H.; Skorobogatiy, M. Resonant bio- and chemical sensors using low-refractive-index-contrast liquid-core Bragg fibers. Sens. Actuator B Chem. 2012, 161, 261–268. [Google Scholar] [CrossRef]
- Wu, Y.; Pei, L.; Jin, W.X.; Jiang, Y.C.; Yang, Y.G.; Shen, Y.; Jian, S.S. Highly sensitive curvature sensor based on asymmetrical twin core fiber and multimode fiber. Opt. Laser Technol. 2017, 92, 74–79. [Google Scholar] [CrossRef] [Green Version]
- Wang, J.; Pei, L.; Wang, J.S.; Ruan, Z.L.; Zheng, J.J.; Li, J.; Ning, T.G. Magnetic field and temperature dual-parameter sensor based on magnetic fluid materials filled photonic crystal fiber. Opt. Express 2020, 28, 1456–1471. [Google Scholar] [CrossRef] [PubMed]
- Zhang, R.; Zhang, S.L.; Li, Y.Q.; Zhao, Y.L.; Jia, Z.X.; Yao, J.L.; Li, Y.X. Mach-Zehnder interferometer cascaded with FBG for simultaneous measurement of magnetic field and temperature. IEEE Sens. J. 2019, 19, 4079–4083. [Google Scholar] [CrossRef]
- Ding, X.Z.; Yang, H.Z.; Qiao, X.G.; Zhang, P.; Tian, O.; Rong, Q.Z.; Nazal, N.A.M.; Lim, K.S.; Ahmad, H. Mach-Zehnder interferometric magnetic field sensor based on a photonic crystal fiber and magnetic fluid. Appl. Opt. 2018, 57, 2050–2056. [Google Scholar] [CrossRef] [PubMed]
- Chen, H.Z.; Shao, H.; Zhang, X.; Hao, Y.X.; Rong, Q.Z. Highly sensitive magnetic field sensor using tapered Mach-Zehnder interferometer. Opt. Lasers Eng. 2018, 107, 78–82. [Google Scholar] [CrossRef]
Figure 1.
(a) Schematic diagram of the sensing structure; (b) the effect drawing of magnetic fluid filling in the air hole of SHDCF; (c) the cross-section diagram of SHDCF.
Figure 1.
(a) Schematic diagram of the sensing structure; (b) the effect drawing of magnetic fluid filling in the air hole of SHDCF; (c) the cross-section diagram of SHDCF.

Figure 2.
Fabrication process of the optical fiber magnetic field sensor, (I~IV) are the preparation steps of optical fiber sensing structure.
Figure 2.
Fabrication process of the optical fiber magnetic field sensor, (I~IV) are the preparation steps of optical fiber sensing structure.

Figure 3.
(a) Optical path diagram of the simulation model; (b) the wavelength shift of the simulated transmission spectrum as RI rises of the suspension core (core 2); (c) the linear fitting curve of RI sensitivity.
Figure 3.
(a) Optical path diagram of the simulation model; (b) the wavelength shift of the simulated transmission spectrum as RI rises of the suspension core (core 2); (c) the linear fitting curve of RI sensitivity.

Figure 4.
The experiment of light receiving verification.

Figure 5.
(a) The SMF receives transmitted light from SHDCF with the different lengths of SHDCF: (a) 3 cm; (b) 5 cm; and (c) 7 cm.
Figure 5.
(a) The SMF receives transmitted light from SHDCF with the different lengths of SHDCF: (a) 3 cm; (b) 5 cm; and (c) 7 cm.

Figure 6.
The splicing effect diagram of MMF and SHDCF under different discharge intensity and discharge time: (a) 40 unit and 300 ms; (b) 30 unit and 400 ms; (c) 20 unit and 300 ms; (d) 30 unit and 300 ms.
Figure 6.
The splicing effect diagram of MMF and SHDCF under different discharge intensity and discharge time: (a) 40 unit and 300 ms; (b) 30 unit and 400 ms; (c) 20 unit and 300 ms; (d) 30 unit and 300 ms.

Figure 7.
The measurement platform of the magnetic field.

Figure 8.
(a) Fourier transform of transmission spectrum; (b) comparison of transmission spectrum before and after filtering.
Figure 8.
(a) Fourier transform of transmission spectrum; (b) comparison of transmission spectrum before and after filtering.

Figure 9.
(a) The wavelength shift of the interference spectrum as the magnetic field rises from 0 to 200 Gs; (b) linear fitting curve of the magnetic field sensitivity.
Figure 9.
(a) The wavelength shift of the interference spectrum as the magnetic field rises from 0 to 200 Gs; (b) linear fitting curve of the magnetic field sensitivity.

Figure 10.
The change in wavelength of the proposed sensor at a magnetic field of 0 Gs within 120 min; the illustration shows the change in transmission spectrum with time intervals of 30 min.
Figure 10.
The change in wavelength of the proposed sensor at a magnetic field of 0 Gs within 120 min; the illustration shows the change in transmission spectrum with time intervals of 30 min.


Table 1.
The parameters table of SHDCF.
| Parameter | Core Diameter | Cladding Diameter | Core Refractive Index | Cladding Refractive Index |
|---|---|---|---|---|
| Value | 9 μm | 125 μm | 1.4682 | 1.4627 |
Publisher’s Note: MDPI stays neutral with regard to jurisdictional claims in published maps and institutional affiliations. |
© 2021 by the authors. Licensee MDPI, Basel, Switzerland. This article is an open access article distributed under the terms and conditions of the Creative Commons Attribution (CC BY) license (https://creativecommons.org/licenses/by/4.0/).
Share and Cite
MDPI and ACS Style
Chen, M.; Liu, Q.; Zhao, Y. All Fiber Mach–Zehnder Interferometer Based on Intracavity Micro-Waveguide for a Magnetic Field Sensor. Appl. Sci. 2021, 11, 11569. https://0-doi-org.brum.beds.ac.uk/10.3390/app112311569
AMA Style
Chen M, Liu Q, Zhao Y. All Fiber Mach–Zehnder Interferometer Based on Intracavity Micro-Waveguide for a Magnetic Field Sensor. Applied Sciences. 2021; 11(23):11569. https://0-doi-org.brum.beds.ac.uk/10.3390/app112311569
Chicago/Turabian StyleChen, Maoqing, Qifeng Liu, and Yong Zhao. 2021. "All Fiber Mach–Zehnder Interferometer Based on Intracavity Micro-Waveguide for a Magnetic Field Sensor" Applied Sciences 11, no. 23: 11569. https://0-doi-org.brum.beds.ac.uk/10.3390/app112311569
Note that from the first issue of 2016, this journal uses article numbers instead of page numbers. See further details here.