
Application of Neural Network and Time-Domain Feature Extraction Techniques for Determining Volumetric Percentages and the Type of Two Phase Flow Regimes Independent of Scale Layer Thickness

 , , , , and
Abstract
:1. Introduction
- (A)
- One of the requirements for optimizing the separation process in the oil and gas industry is to have quantitative and sufficient information about the volume fraction of the gas and oil phases.
- (B)
- Understanding the type of flow pattern along with determining the volume fraction of gas and oil phases is a requisite of transfer processes because it is straightforwardly related to a large part of the project economy.
- (C)
- The efficiency of the separation process is highly influenced by the type of flow regime.
- (D)
- Whether the drilling process should continue or stop at any time can only be determined by understanding the volume fraction of each component.
2. Simulation Setup
3. Feature Extraction
- 4th order moment:
- skewness:
- kurtosis:
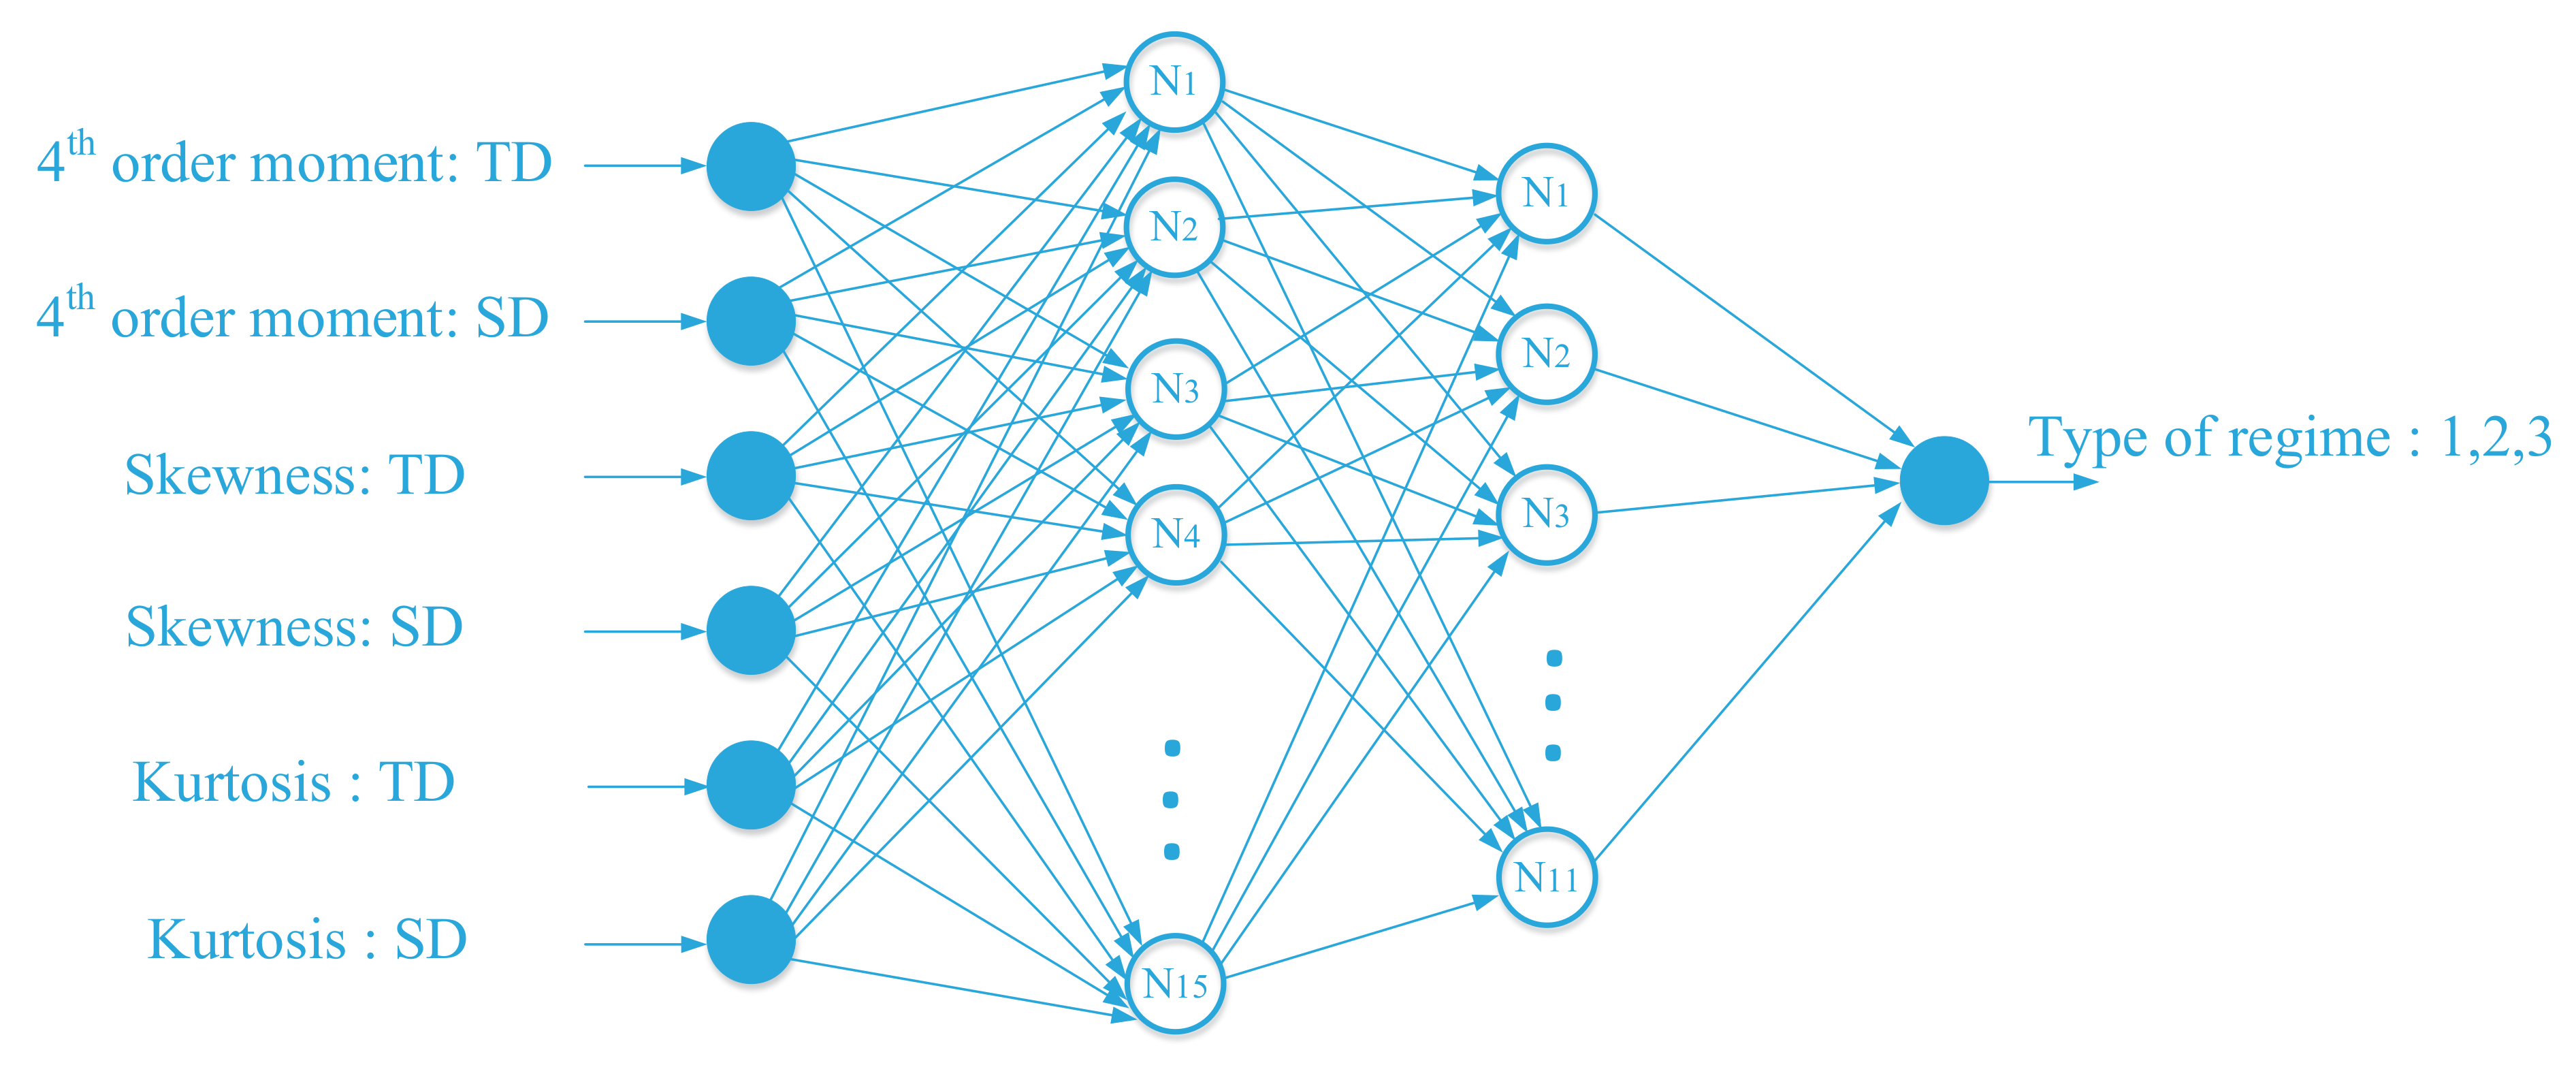
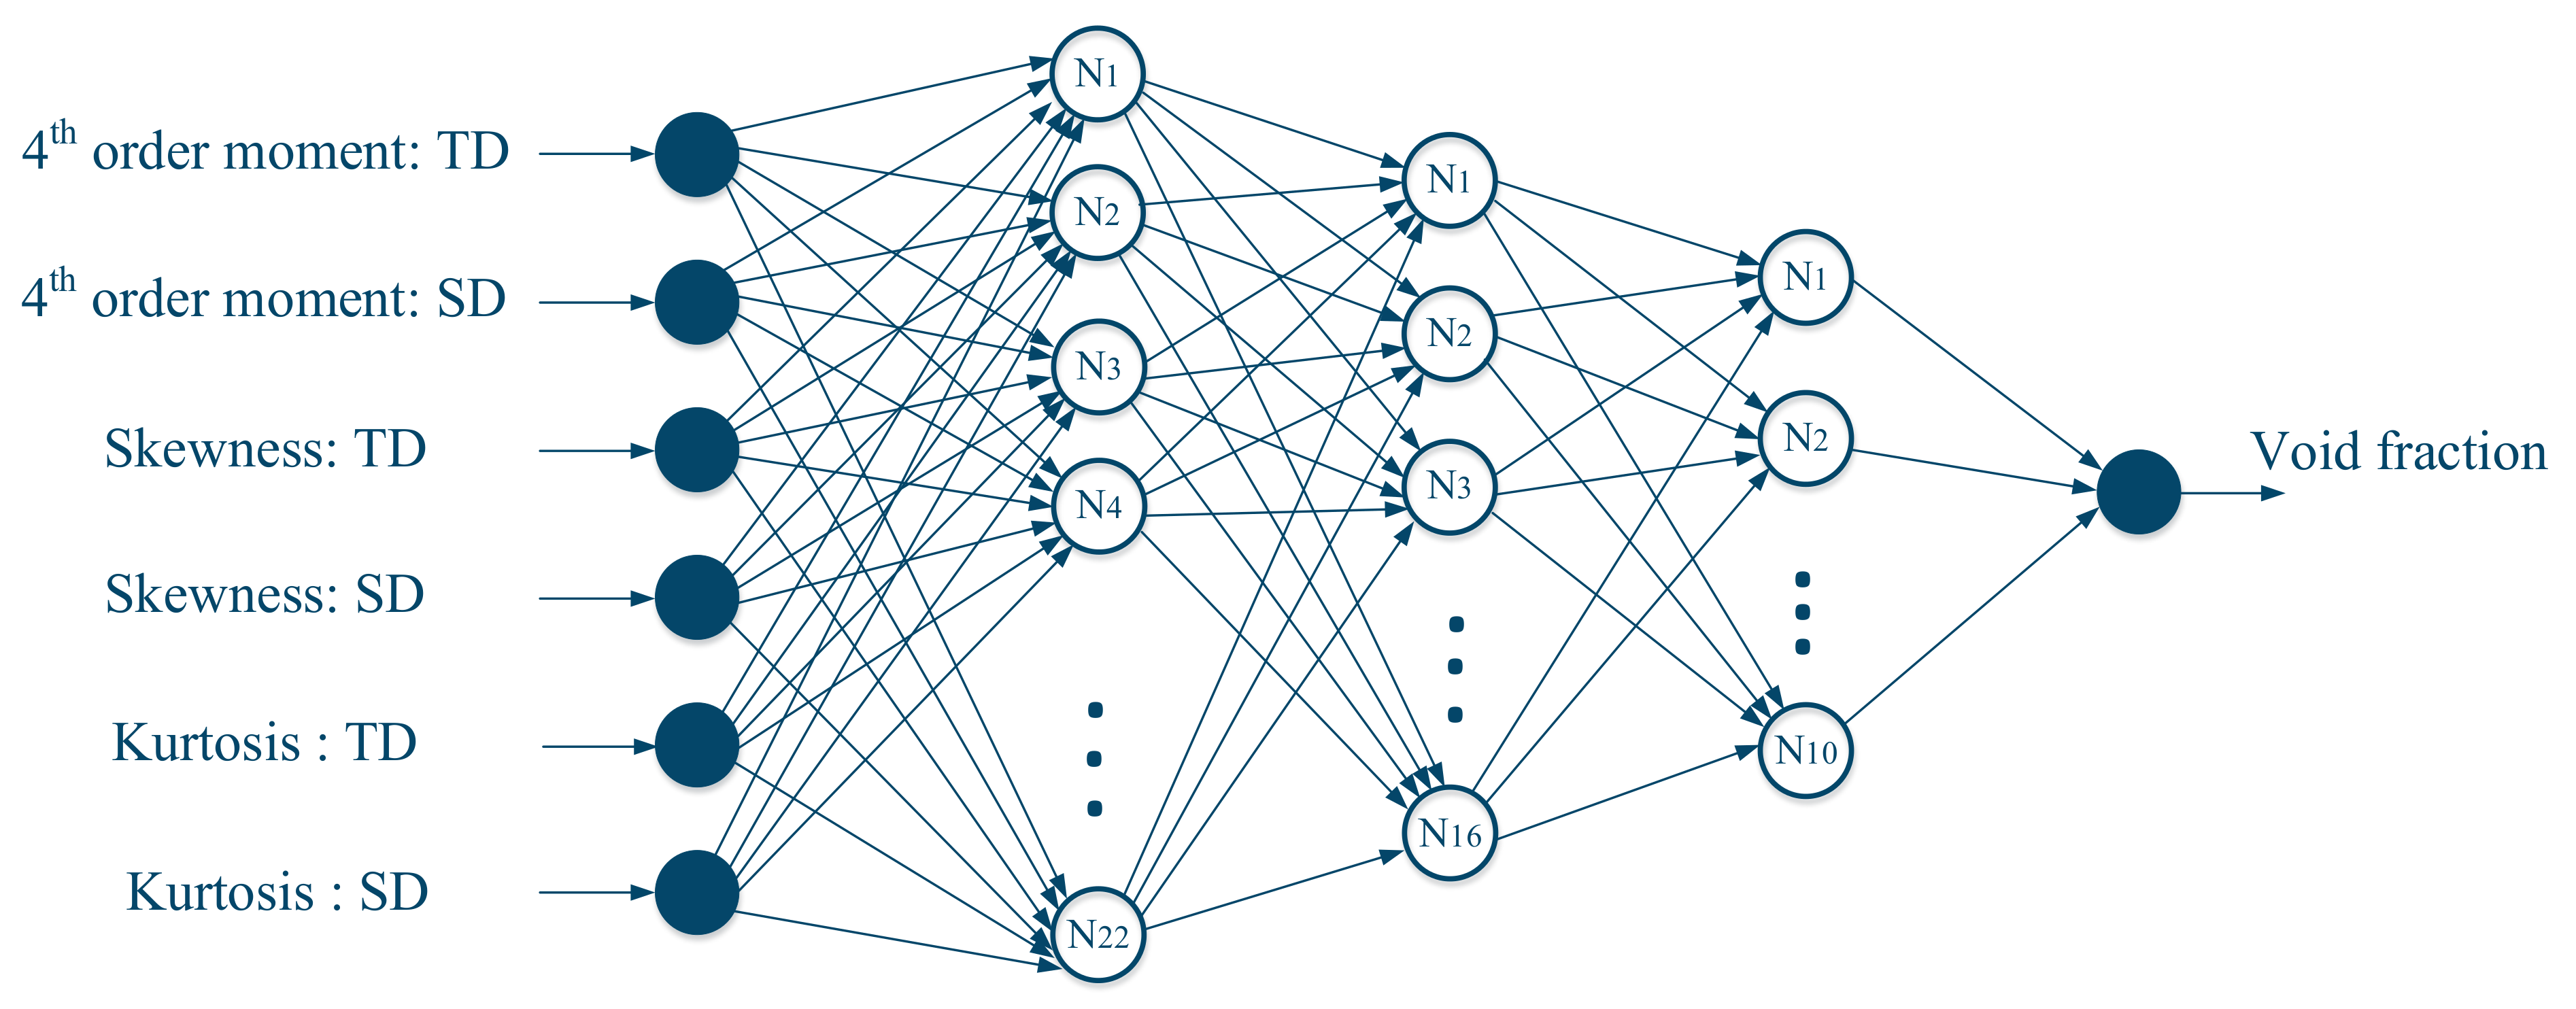
4. MLP Neural Network
- Weights get random values
- For each training instance, perceptron is applied. If the samples are misjudged, the perceptron weight values are corrected.
- Are all trainings evaluated correctly?
- Yes, the end of the algorithm.
- No, back to step 2.
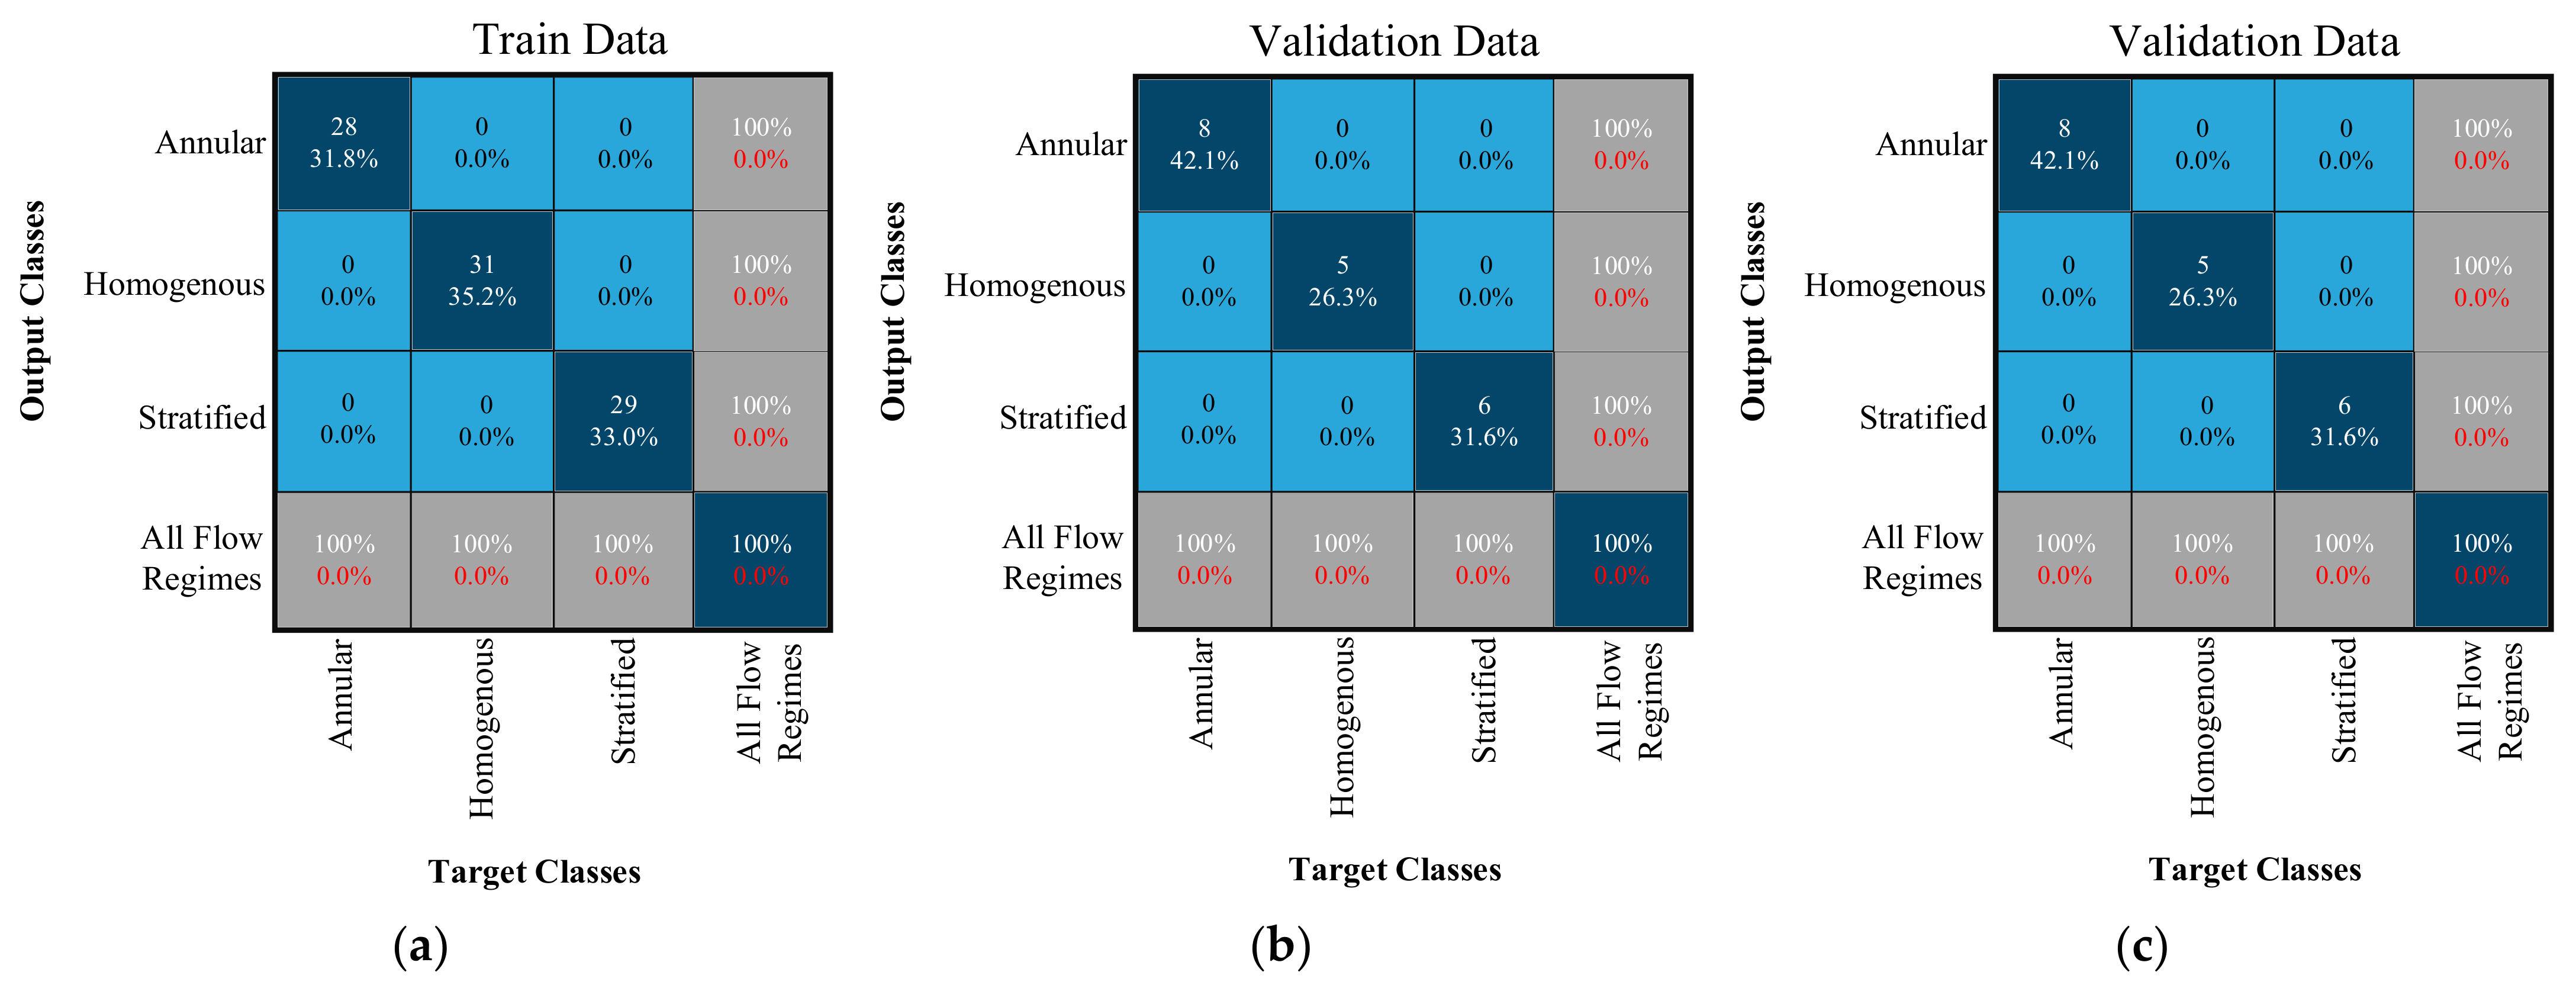
5. Result and Discussion
6. Conclusions
Author Contributions
Funding
Institutional Review Board Statement
Informed Consent Statement
Data Availability Statement
Conflicts of Interest
References
- Åbro, E.; Khoryakov, V.A.; Johansen, G.A.; Kocbach, L. Determination of Void Fraction and Flow Regime Using a Neural Network Trained on Simulated Data Based on Gamma-Ray Densitometry. Meas. Sci. Technol. 1999, 10, 619. [Google Scholar]
- Sattari, M.A.; Roshani, G.H.; Hanus, R. Improving the Structure of Two-Phase Flow Meter Using Feature Extraction and GMDH Neural Network. Radiat. Phys. Chem. 2020, 171, 108725. [Google Scholar] [CrossRef]
- Oliveira, D.F.; Nascimento, J.R.; Marinho, C.A.; Lopes, R.T. Gamma Transmission System for Detection of Scale in Oil Exploration Pipelines. Nucl. Instruments Methods Phys. Res. Sect. A Accel. Spectrometers Detect. Assoc. Equip. 2015, 784, 616–620. [Google Scholar] [CrossRef]
- Roshani, M.; Phan, G.T.; AliP, J.M.; Roshani, G.H.; Hanus, R.; Duong, T.; Corniani, E.; Nazemi, E.; KalmounE, M. Evaluation of Flow Pattern Recognition and Void Fraction Measurement in Two Phase Flow Independent of Oil Pipeline’s Scale Layer Thickness. Alex. Eng. J. 2021, 60, 1955–1966. [Google Scholar] [CrossRef]
- Alamoudi, M.; Sattari, M.; Balubaid, M.; Eftekhari-Zadeh, E.; Nazemi, E.; Taylan, O.; Kalmoun, E. Application of Gamma Attenuation Technique and Artificial Intelligence to Detect Scale Thickness in Pipelines in Which Two-Phase Flows with Different Flow Regimes and Void Fractions Exist. Symmetry 2021, 13, 1198. [Google Scholar] [CrossRef]
- Roshani, G.H.; Nazemi, E.; Feghhi, S.A.; Setayeshi, S. Flow Regime Identification and Void Fraction Prediction in Two-Phase Flows Based on Gamma Ray Attenuation. Measurment 2015, 62, 25–32. [Google Scholar] [CrossRef]
- Nazemi, E.; Feghhi, S.A.H.; Roshani, G.H.; Peyvandi, R.G.; Setayeshi, S. Precise Void Fraction Measurement in Two-Phase Flows Independent of the Flow Regime Using Gamma-ray Attenuation. Nucl. Eng. Technol. 2016, 48, 64–71. [Google Scholar] [CrossRef] [Green Version]
- Karami, A.; Roshani, G.H.; Salehizadeh, A.; Nazemi, E. The Fuzzy Logic Application in Volume Fractions Prediction of the Annular Three-Phase Flows. J. Nondestruct. Evaluation 2017, 36, 35. [Google Scholar] [CrossRef]
- Roshani, M.; Sattari, M.A.; Ali, P.J.M.; Roshani, G.H.; Nazemi, B.; Corniani, E.; Nazemi, E. Application of GMDH Neural Network Technique to Improve Measuring Precision of a Simplified Photon Attenuation Based Two-Phase Flowmeter. Flow Meas. Instrum. 2020, 75, 101804. [Google Scholar] [CrossRef]
- Sætre, C.; Tjugum, S.-A.; Johansen, G.A. Tomographic Segmentation in Multiphase Flow Measurement. Radiat. Phys. Chem. 2014, 95, 420–423. [Google Scholar] [CrossRef]
- Karami, A.; Roshani, G.H.; Khazaei, A.; Nazemi, E.; Fallahi, M. Investigation of Different Sources in Order to Optimize the Nuclear Metering System of Gas–Oil–Water Annular Flows. Neural Comput. Appl. 2018, 32, 3619–3631. [Google Scholar] [CrossRef]
- Mosorov, V.; Zych, M.; Hanus, R.; Sankowski, D.; Saoud, A. Improvement of Flow Velocity Measurement Algorithms Based on Correlation Function and Twin Plane Electrical Capacitance Tomography. Sensors 2020, 20, 306. [Google Scholar] [CrossRef] [PubMed] [Green Version]
- Salgado, C.; Brandão, L.; Conti, C.; Salgado, W. Density Prediction for Petroleum and Derivatives by Gamma-Ray Attenuation and Artificial Neural Networks. Appl. Radiat. Isot. 2016, 116, 143–149. [Google Scholar] [CrossRef]
- 14. Roshani, M.; Ali, P.J.M.; Roshani, G.H.; Nazemi, B.; Corniani, E.; Phan, N.H.; Tran, H.-N.; Nazemi, E. X-Ray Tube with Artificial Neural Network Model as a Promising Alternative for Radioi-Sotope Source in Radiation Based Two Phase Flowmeters. Appl. Radiat. Isot. 2020, 164, 109255. [Google Scholar]
- Biswal, J.; Pant, H.; Goswami, S.; Samantray, J.; Sharma, V.; Sarma, K. Measurement of Flow Rates of Water in Large Diameter Pipelines Using Radiotracer Dilution Method. Flow Meas. Instrum. 2018, 59, 194–200. [Google Scholar] [CrossRef]
- Candeias, J.; de Oliveira, D.; dos Anjos, M.; Lopes, R. Scale Analysis Using X-Ray Microfluorescence and Computed Radiography. Radiat. Phys. Chem. 2014, 95, 408–411. [Google Scholar] [CrossRef]
- Pelowitz, D.B. MCNP-X TM User’s Manual; Version 2.5.0. LA-CP-05e0369; Los Alamos National, Laboratory: Los Alamos, NM, USA, 2005. [Google Scholar]
- Nazemi, E.; Roshani, G.H.; Feghhi, S.A.H.; Setayeshi, S.; Zadeh, E.E.; Fatehi, A. Optimization of a Method for Identifying the Flow Regime and Measuring Void Fraction in a Broad Beam Gamma-Ray Attenuation Technique. Int. J. Hydrog. Energy 2016, 41, 7438–7444. [Google Scholar] [CrossRef]
- Meric, I.; Johansen, G.A.; Mattingly, J.; Gardner, R. On the Ill-Conditioning of the Multiphase Flow Measurement by Prompt Gamma-Ray Neutron Activation Analysis. Radiat. Phys. Chem. 2014, 95, 401–404. [Google Scholar] [CrossRef]
- Holstad, M.B.; Johansen, G.A. Produced Water Characterization by Dual Modality Gamma-Ray Measurements. Meas. Sci. Technol. 2005, 16, 1007–1013. [Google Scholar] [CrossRef]
- Sattari, M.A.; Roshani, G.H.; Hanus, R.; Nazemi, E. Applicability of time-domain feature extraction methods and artificial intelligence in two-phase flow meters based on gamma-ray absorption technique. Measurement 2021, 168, 108474. [Google Scholar] [CrossRef]
- Hosseini, S.; Roshani, G.; Setayeshi, S. Precise Gamma Based Two-Phase Flow Meter Using Frequency Feature Extraction and only One Detector. Flow Meas. Instrum. 2020, 72, 101693. [Google Scholar] [CrossRef]
- Siavash, H.; Taylan, O.; Abusurrah, M.; Akilan, T.; Nazemi, E.; Eftekhari-Zadeh, E.; Bano, F.; Roshani, G.H. Application of Wavelet Feature Extraction and Artificial Neural Networks for Improving the Performance of Gas–Liquid Two-Phase Flow Meters Used in Oil and Petrochemical Industries. Polymers 2021, 13, 3647. [Google Scholar]
- Balubaid, M.; Sattari, M.A.; Taylan, O.; Bakhsh, A.A.; Nazemi, E. Applications of Discrete Wavelet Transform for Feature Extraction to Increase the Accuracy of Monitoring Systems of Liquid Petroleum Products. Math. 2021, 9, 3215. [Google Scholar] [CrossRef]
- Abdulrahman, B.; Sattari, M.A.; Taylan, O.; Nazemi, E. Application of Feature Extraction and Artificial Intelligence Techniques for Increasing the Accuracy of X-Ray Radiation Based Two Phase Flow Meter. Mathematics 2021, 9, 1227. [Google Scholar]
- Roshani, G.H.; Feghhi, S.A.H.; Mahmoudi-Aznaveh, A.; Nazemi, E.; Adineh-Vand, A. Precise volume fraction prediction in oil-water-gas multiphase flows by means of gamma-ray attenuation and artificial neural networks using one detector. Measurement 2014, 51, 34–41. [Google Scholar] [CrossRef]
- Saberinejad, H.; Keshavarz, A.; Payandehdoost, M.; Azmoodeh, M.R.; Batooei, A. Numerical study of heat transfer performance in a pipe partially filled with non-uniform porous media under Ltne Condition. Int. J. Num. Methods Heat Fluid Flow 2018, 28, 1845–1865. [Google Scholar] [CrossRef]
- Nazemi, E.; Feghhi, S.; Roshani, G.; Setayeshi, S.A.; Peyvandi, R.G. A radiation-based hydrocarbon two-phase flow meter for estimating of phase fraction independent of liquid phase density in stratified regime. Flow Meas. Instrum. 2015, 46, 25–32. [Google Scholar] [CrossRef]
- Roshani, G.H.; Nazemi, E.; Feghhi, S.A.H. Investigation of using 60Co source and one detector for determining the flow regime and void fraction in gas-liquid two-phase flows. Flow Meas. Instrum. 2016, 50, 73–79. [Google Scholar] [CrossRef]
- Rouhi, S.; Xiros, N.; Sadeqi, S.; Ioup, J.; Sultan, C.; VanZwieten, J. CFD validation of the thermodynamic model of a compressed gaseous hydrogen storage tank. Proceeding of 5-6th Thermal and Fluids Engineering Conference (TFEC), Virtual, 26–28 May 2021. [Google Scholar]
- Roshani, G.H.; Nazemi, E.; Roshani, M.M. Flow regime independent volume fraction estimation in three-phase flows using dual-energy broad beam technique and artificial neural network. Neural Comput. Appl. 2016, 28, 1265–1274. [Google Scholar] [CrossRef]
- Roshani, G.; Nazemi, E.; Roshani, M. Usage of two transmitted detectors with optimized orientation in order to three phase flow me-tering. Measurement 2017, 100, 122–130. [Google Scholar] [CrossRef]
- Roshani, G.; Nazemi, E. Intelligent densitometry of petroleum products in stratified regime of two phase flows using gamma ray and neural network. Flow Meas. Instrum. 2017, 58, 6–11. [Google Scholar] [CrossRef]
- Roshani, G.; Nazemi, E.; Roshani, M. Intelligent recognition of gas-oil-water three-phase flow regime and determination of volume fraction using radial basis function. Flow Meas. Instrum. 2017, 54, 39–45. [Google Scholar] [CrossRef]
- Du, X.; Tian, W.; Pan, J.; Hui, B.; Sun, J.; Zhang, K.; Xia, Y. Piezo-phototronic effect promoted carrier separation in coaxial P-N junctions for self-powered photodetector. Nano Energy 2022, 92, 106694. [Google Scholar] [CrossRef]
- Karami, A.; Roshani, G.H.; Nazemi, E.; Roshani, S. Enhancing the performance of a dual-energy gamma ray based three-phase flow meter with the help of grey wolf optimization algorithm. Flow Meas. Instrum. 2018, 64, 164–172. [Google Scholar] [CrossRef]
- Roshani, G.H.; Roshani, S.; Nazemi, E.; Roshani, S. Online measuring density of oil products in annular regime of gas-liquid two phase flows. Measurement 2018, 129, 296–301. [Google Scholar] [CrossRef]
- Cai, T.; Dong, M.; Liu, H.; Nojavan, S. Integration of hydrogen storage system and wind generation in power systems under demand response program: A novel P-robust stochastic programming. Int. J. Hydrogen Energy 2022, 47, 443–458. [Google Scholar] [CrossRef]
- Roshani, G.; Hanus, R.; Khazaei, A.; Zych, M.; Nazemi, E.; Mosorov, V. Density and velocity determination for single-phase flow based on radiotracer technique and neural networks. Flow Meas. Instrum. 2018, 61, 9–14. [Google Scholar] [CrossRef]
- Charchi, N.; Li, Y.; Huber, M.; Kwizera, E.A.; Huang, X.; Argyropoulos, C.; Hoang, T. Small mode volume plasmonic film-coupled nanostar resonators. Nanoscale Adv. 2020, 2, 2397–2403. [Google Scholar] [CrossRef] [PubMed]
- Roshani, G.; Nazemi, E.; Roshani, M. Identification of flow regime and estimation of volume fraction independent of liquid phase density in gas-liquid two-phase flow. Prog. Nucl. Energy 2017, 98, 29–37. [Google Scholar] [CrossRef]
- Roshani, S.; Roshani, S. Two-Section Impedance Transformer Design and Modeling for Power Amplifier Applications. Appl. Comput. Electromagn. Soc. J. 2017, 32, 1042–1047. [Google Scholar]
- Lalbakhsh, A.; Alizadeh, S.M.; Ghaderi, A.; Golestanifar, A.; Mohamadzade, B.; Jamshidi, M.B.; Mandal, K.; Mohyuddin, W. A design of a dual-band bandpass ?lter based on modal analysis for modern communication systems. Electronics 2020, 9, 1770. [Google Scholar] [CrossRef]
- Liu, X.; Zheng, W.; Mou, Y.; Li, Y.; Yin, L. Microscopic 3D reconstruction based on point cloud data generated using defocused images. Measurement and Control 2021, 54, 1309–1318. [Google Scholar] [CrossRef]
- Pirasteh, A.; Roshani, S.; Roshani, S. Compact microstrip lowpass filter with ultrasharp response using a square-loaded mod-ified T-shaped resonator. Turk. J. Electr. Eng. Comput. Sci. 2018, 26, 1736–1746. [Google Scholar] [CrossRef]
- Ramtin, A.R.; Nain, P.; Menasche, D.S.; Towsley, D.; de Souza e Silva, E. Fundamental scaling laws of covert ddos attacks. Performance Evaluation 2021, 151, 102236. [Google Scholar] [CrossRef]
- Roshani, S.; Roshani, S. A compact coupler design using meandered line compact microstrip resonant cell (MLCMRC) and bended lines. Wireless Networks 2021, 27, 677–684. [Google Scholar] [CrossRef]
- Ma, Z.; Zheng, W.; Chen, X.; Yin, L. Joint embedding VQA model based on Dynamic Word Vector. PeerJ Comput. Sci. 2021, 7, e353. [Google Scholar] [CrossRef] [PubMed]
- Lalbakhsh, A.; Lotfi Neyestanak, A.A.; Naser-Moghaddasi, M. Microstrip hairpin bandpass filter using modified Minkowski fractal-shape for suppression of second harmonic. IEICE Trans. Electron. 2012, E95-C, 378–381. [Google Scholar] [CrossRef]
- Pourghebleh, B.; Aghaei Anvigh, A.; Ramtin, A.R.; Mohammadi, B. The importance of nature-inspired meta-heuristic algorithms for solving virtual machine consolidation problem in Cloud Environments. Cluster Comput. 2021, 24, 2673–2696. [Google Scholar] [CrossRef]
- Seyedi, M.; Taher, S.A.; Ganji, B.; Guerrero, J. A hybrid islanding detection method based on the rates of changes in voltage and active power for the Multi-Inverter Systems. IEEE Trans. Smart Grid 2021, 12, 2800–2811. [Google Scholar] [CrossRef]
- Roshani, S.; Roshani, S. Design of a very compact and sharp bandpass diplexer with bended lines for GSM and LTE applica-tions. AEU. Int. J. Electron. Commun. 2019, 99, 354–360. [Google Scholar] [CrossRef]
- Wang, K.; Wang, H.; Li, S. Renewable quantile regression for streaming datasets. Knowledge-Based Systems 2022, 235, 107675. [Google Scholar] [CrossRef]
- Lalbakhsh, A.; Mohamadpour, G.; Roshani, S.; Ami, M.; Roshani, S.; Sayem, A.S.M.; Alibakhshikenari, M.; Koziel, S. Design of a compact planar transmission line for miniaturized rat-race coupler with harmonics suppression. IEEE Access 2021, 9, 129207–129217. [Google Scholar] [CrossRef]
- Roshani, S.; Roshani, S.; Zarinitabar, A. A modified Wilkinson power divider with ultra harmonic suppression using open stubs and lowpass filters. Analog. Integr. Circuits Signal Process. 2019, 98, 395–399. [Google Scholar] [CrossRef]
- Wang, K.; Li, S. Robust distributed modal regression for massive data. Comput. Stat. Data Anal. 2021, 160, 107225. [Google Scholar] [CrossRef]
- Jamshidi, M.B.; Siahkamari, H.; Roshani, S.; Roshani, S. A compact Gysel power divider design using U-shaped and T-shaped reso-nators with harmonics suppression. Electromagnetics 2019, 39, 491–504. [Google Scholar] [CrossRef]
- Jamshidi, M.B.; Roshani, S.; Talla, J.; Roshani, S.; Peroutka, Z. Size reduction and performance improvement of a microstrip Wilkinson power divider using a hybrid design technique. Sci. Rep. 2021, 11, 7773. [Google Scholar] [CrossRef] [PubMed]
- Liu, K.; Ke, F.; Huang, X.; Yu, R.; Lin, F.; Wu, Y.; Ng, D.W. Deepban: A temporal convolution-based communication framework for dynamic WBANS. IEEE Trans. Commun. 2021, 69, 6675–6690. [Google Scholar] [CrossRef]
- Pirasteh, A.; Roshani, S.; Roshani, S. A modified class-F power amplifier with miniaturized harmonic control circuit. AEU Int. J. Electron. Commun. 2018, 97, 202–209. [Google Scholar] [CrossRef]
- Roshani, S.; Roshani, S. Design of a high efficiency class-F power amplifier with large signal and small signal measure-ments. Measurement 2020, 149, 106991. [Google Scholar] [CrossRef]
- Lalbakhsh, A.; Jamshidi, M.; Siahkamari, H.; Ghaderi, A.; Golestanifar, A.; Linhart, R.; Talla, J.; Simorangkir, R.B.; Mandal, K. A compact lowpass ?lter for satellite communication systems based on transfer function analysis. AEU-Int. J. Electron. Commun. 2020, 124, 153318. [Google Scholar] [CrossRef]
- Nazemi, B.; Rafiean, M. Forecasting House Prices in Iran Using GMDH. Int. J. Hous. Mark. Anal. 2021, 14, 555–568. [Google Scholar] [CrossRef]
- Roshani, S.; Roshani, S. Design of a compact LPF and a miniaturized Wilkinson power divider using aperiodic stubs with harmonic suppression for wireless applications. Wireless Networks 2019, 26, 1493–1501. [Google Scholar] [CrossRef]
- Lalbakhsh, A.; Afzal, M.U.; Esselle, K. Simulation-driven particle swarm optimization of spatial phase shifters. In Proceedings of the 2016 International Conference on Electromagnetics in Advanced Applications (ICEAA), Cairns, QLD, Australia, 19–23 September 2016. [Google Scholar]
- Hookari, M.; Roshani, S.; Roshani, S. High?efficiency balanced power amplifier using miniaturized harmonics suppressed coupler. Int. J. RF Microwave Comput.-Aided Eng. 2020, 30, e22252. [Google Scholar] [CrossRef]
- Lalbakhsh, A.; Afzal, M.U.; Esselle, K.P.; Smith, S.L. Low-cost nonuniform metallic lattice for rectifying aperture near-field of electromagnetic bandgap resonator antennas. IEEE Trans. Antennas Propagation 2020, 68, 3328–3335. [Google Scholar] [CrossRef]
- Pirasteh, A.; Roshani, S.; Roshani, S. Design of a miniaturized class F power amplifier using capacitor loaded transmission lines. Frequenz 2020, 74, 145–152. [Google Scholar] [CrossRef]
- Lalbakhsh, A.; Afzal, M.U.; Hayat, T.; Esselle, K.P.; Manda, K. All-metal wideband metasurface for near-?eld transformation of medium-to-high gain electromagnetic sources. Sci. Rep. 2021, 11, 1–9. [Google Scholar]
- Lotfi, S.; Roshani, S.; Roshani, S.; Gilan, M.S. Wilkinson power divider with band-pass filtering response and harmonics suppression using open and short stubs. Frequenz 2020, 74, 169–176. [Google Scholar] [CrossRef]
- Lalbakhsh, A.; Ghaderi, A.; Mohyuddin, W.; Simorangkir, R.B.V.B.; Bayat-Makou, N.; Ahmad, M.S.; Lee, G.H.; Kim, K.W. A Compact C-Band Bandpass Filter with an Adjustable Dual-Band Suitable for Satellite Communication Systems. Electronics 2020, 9, 1088. [Google Scholar] [CrossRef]
- Hookari, M.; Roshani, S.; Roshani, S. Design of a low pass filter using rhombus-shaped resonators with an analyticallc equivalent circuit. Turkish J. Electr. Eng. Comput. Sci. 2020, 28, 865–874. [Google Scholar] [CrossRef]
- Yadollahi, A.; Nazemi, E.; Zolfaghari, A.; Ajorloo, A.M. Application of artificial neural network for predicting the optimal mixture of radiation shielding concrete. Progress Nuclear Energy 2016, 89, 69–77. [Google Scholar] [CrossRef]
- Roshani, M.; Phan, G.; Faraj, R.H.; Phan, N.H.; Roshani, G.H.; Nazemi, B.; Corniani, E.; Nazemi, E. Proposing a gamma radiation based intelligent system for simultaneous analyzing and detecting type and amount of petroleum by-products. Neural Eng. Technol. 2021, 53, 1277–1283. [Google Scholar] [CrossRef]
- Wang, Y.; Cheng, H.; Hu, Q.; Liu, L.; Jia, L.; Gao, S.; Wang, Y. Pore structure heterogeneity of Wufeng-Longmaxi Shale, Sichuan Basin, China: Evidence from gas physisorption and multifractal geometries. J. Petroleum Sci. Eng. 2022, 208, 109313. [Google Scholar] [CrossRef]
- Roshani, M.; Phan, G.; Roshani, G.H.; Hanus, R.; Nazemi, B.; Corniani, E.; Nazemi, E. Combination of X-ray tube and GMDH neural network as a nondestructive and potential technique for measuring characteristics of gas-oil-water three phase flows. Measurement 2021, 168, 108427. [Google Scholar] [CrossRef]
- Xu, G.F. Numerical simulation and factor analysis of petrochemical pipe erosion-corrosion failure. In IOP Conference Series: Materials Science and Engineering; IOP Publishing: Bristol, UK, 2016; Volume 129, p. 012033. [Google Scholar]
- Dolgii, I.E. Methods to enhance oil recovery in the process of complex field development of the Yarega oil and titanium deposit. J. Min. Inst. 2017, 231, 263–297. [Google Scholar]
- Aleksandrov, A.N.; Kishchenko, M.A.; Van, T.N. Simulating the formation of wax deposits in wells using electric submersible pumps. In Advances in Raw Material Industries for Sustainable Development Goals; CRC Press: London, UK, 2021; pp. 283–295. [Google Scholar]
- Nguyen, V.T.; Rogachev, M.K.; Aleksandrov, A.N. A new approach to improving efficiency of gas-lift wells in the conditions of the formation of organic wax deposits in the dragon field. J. Pet. Explor. Prod. Technol. 2020, 10, 3663–3672. [Google Scholar] [CrossRef]
- Sandyga, M.S.; Struchkov, I.A.; Rogachev, M.K. Formation damage induced by wax deposition: Laboratory investigations and modeling. J. Pet. Explor. Prod. Technol. 2020, 10, 2541–2558. [Google Scholar] [CrossRef]
- Sultanbekov, R.; Islamov, S.; Mardashov, D.; Beloglazov, I.; Hemmingsen, T. Research of the influence of marine residual fuel composition on sedimentation due to incompatibility. J. Mar. Sci. Eng. 2021, 9, 1067. [Google Scholar] [CrossRef]
- Kashnikov, Y.A.; Ashikhmin, S.G.; Kukhtinskii, A.E.; Shustov, D.V. The relationship of fracture toughness coefficients and geophysical characteristics of rocks of hydrocarbon deposits. J. Min. Inst. 2020, 1, 241. [Google Scholar] [CrossRef]
- Karpikov, A.V.; Aliev, R.I.; Babyr, N.V. An analysis of the effectiveness of hydraulic fracturing at YS1 of the Northern field. In IOP Conference Series: Materials, Science and Engineering; IOP Publishing: Bristol, UK, 2020; Volume 952, p. 012036. [Google Scholar]
- Belonogov, E.V.; Korovin, A.Y.; Yakovlev, A.A. Increase of the injectivity coefficient by dynamic development of injection wells. J. Min. Inst. 2019, 1, 238. [Google Scholar]
- Grigorev, M.B.; Tananykhin, D.S.; Poroshin, M.A. Sand management approach for a field with high viscosity oil. J. Appl. Eng. Sci. 2020, 18, 64–69. [Google Scholar] [CrossRef] [Green Version]
- Shagiakhmetov, A.M.; Podoprigora, D.G.; Terleev, A.V. The study of the dependence of the rheological properties of gelforming compositions on the crack opening when modeling their flow on a rotational viscometer. Period. Tche Quimica 2020, 17, 933–939. [Google Scholar] [CrossRef]
- Galkin, S.V.; Kochnev, A.A.; Zotikov, V.I. Predictive assessment of the effectiveness of radial drilling technology for the Bashkir production facilities of the Perm Territory fields. J. Min. Inst. 2019, 1, 238. [Google Scholar]
- Molchanov, A.A.; Ageev, P.G. Implementation of new technologies is a reliable way of extracting residual reserves of hydrocarbon deposits. J. Min. Inst. 2017, 1, 227. [Google Scholar]
- Prischepa, O.M.; Nefedov, Y.V.; Kochneva, O.E. Raw material base of hard-to-extract oil reserves of Russia (Matéria-prima base de reservas de óleo de difícil extração da Rússia). Periodico TCHE Quimica 2020, 17, 915–924. [Google Scholar]
- Morenov, V.; Leusheva, E.; Martel, A. Investigation of the fractional composition effect of the carbonate weighting agents on the rheology of the clayless drilling mud. Int. J. Eng. 2018, 31, 1152–1158. [Google Scholar]
- Nikitin, M.N.; Saychenko, L.A. The rheological properties of abnormally viscous oil. Pet. Sci. Technol. 2018, 36, 136–140. [Google Scholar] [CrossRef]
- Ghanbari, B. Abundant exact solutions to a generalized nonlinear Schrödinger equation with local fractional derivative. Math. Methods Appl. Sci. 2021, 44, 8759–8774. [Google Scholar] [CrossRef]
- Kharazmi, O.; Jahangard, S. A new family of lifetime distributions in terms of cumulative hazard rate function. Commun. Fac. Sci. Univ. Ankara Series A1Math. Stat. 2020, 69, 1–22. [Google Scholar] [CrossRef]
- Ghanbari, B. Chaotic behaviors of the prevalence of an infectious disease in a prey and predator system using fractional derivatives. Math. Methods Appl. Sci. 2021, 44, 9998–10013. [Google Scholar] [CrossRef]
- Kharazmi, O.; Saadatinik, A.; Jahangard, S. Odd hyperbolic cosine exponential-exponential (OHC-ee) distribution. Annals Data Sci. 2019, 6, 765–785. [Google Scholar] [CrossRef] [Green Version]
- Ghanbari, B. On novel nondifferentiable exact solutions to local fractional Gardner’s equation using an effective technique. Math. Method Appl. Sci. 2020, 44, 4673–4685. [Google Scholar] [CrossRef]
- Rashidisabet, H.; Thomas, P.J.; Ajilore, O.; Zulueta, J.; Moore, R.C.; Leow, A. A systems biology approach to the Digital behaviorome. Curr. Opin. Syst. Biol. 2020, 20, 8–16. [Google Scholar] [CrossRef]
- Nabti, A.; Ghanbari, B. Global Stability Analysis of a fractional SVEIR epidemic model. Math. Methods Appl. Sci. 2021, 44, 8577–8597. [Google Scholar] [CrossRef]
- Rezaei, T.; Aslmarand, S.M.; Snyder, R.; Khajavi, B.; Alsing, P.M.; Fanto, M.; Ahn, D.; Miller, W.A. Experimental realization of Schumacher’s information geometric Bell inequality. Physics Lett. A 2021, 405, 127444. [Google Scholar] [CrossRef]
- Ghanbari, B. A fractional system of delay differential equation with nonsingular kernels in modeling hand-foot-mouth disease. Adv. Diff. Eq. 2020, 2020. [Google Scholar] [CrossRef]
- Ghanbari, B. On approximate solutions for a fractional prey-predator model involving the Atangana-Baleanu derivative. Adv. Diff. Eq. 2020, 2020, 1–20. [Google Scholar] [CrossRef]
- Tian, J.; Liu, Y.; Zheng, W.; Yin, L. Smog prediction based on the deep belief - BP neural network model (DBN-BP). Urban Climate 2022, 41, 101078. [Google Scholar] [CrossRef]
- Daryayehsalameh, B.; Nabavi, M.; Vaferi, B. Modeling of CO2 capture ability of [bmim][bf4] ionic liquid using connectionist smart paradigms. Environ. Technol. Innov. 2021, 22, 101484. [Google Scholar] [CrossRef]
- Zhao, X.; Xia, H.; Pan, L.; Song, H.; Niu, W.; Wang, R.; Li, R.; Bian, X.; Guo, Y.; Qin, Y. Drought Monitoring over Yellow River Basin from 2003-2019 Using Reconstructed MODIS Land Surface Temperature in Google Earth Engine. Remote Sens. 2021, 13, 3748. [Google Scholar] [CrossRef]
- Etimita, O.O.; Beka, F.T. Heavy mineral analysis of Eocene Sands and sandstones of Nanka Formation, Cenozoic Niger delta petroleum province. Geol. Ecol. Landsc. 2019, 4, 251–256. [Google Scholar] [CrossRef] [Green Version]
- Singh, B.; Sihag, P.; Parsaie, A.; Angelaki, A. Comparative analysis of artificial intelligence techniques for the prediction of infiltration process. Geol. Ecol. Landsc. 2020, 5, 109–118. [Google Scholar] [CrossRef]
- Taylor, J.G. Neural Networks and Their Applications; John Wiley & Sons Ltd.: Brighton, UK, 1996. [Google Scholar]
- Gallant, A.R.; White, H. On Learning the Derivatives of an Unknown Mapping with Multilayer Feedforward Networks. Neural Networks 1992, 5, 129–138. [Google Scholar] [CrossRef] [Green Version]


| ANN Kind | MLP | |
|---|---|---|
| Classifier | Predictor | |
| No. of neurons in input layer | 6 | 6 |
| No. of neurons in the 1st hidden layer | 15 | 22 |
| No. of neurons in the 2nd hidden layer | 11 | 16 |
| No. of neurons in the 3rd hidden layer | - | 10 |
| No. of neurons in the output layer | 1 | 1 |
| No. of epoch | 680 | 530 |
| Activation function used for each hidden neuron | Tansig | Tansig |
| RMSE | MRE% | Data Set |
|---|---|---|
| 1.56 | 5.69 | Train |
| 1.46 | 3.23 | Validation |
| 1.83 | 4.19 | Test |
Publisher’s Note: MDPI stays neutral with regard to jurisdictional claims in published maps and institutional affiliations. |
© 2022 by the authors. Licensee MDPI, Basel, Switzerland. This article is an open access article distributed under the terms and conditions of the Creative Commons Attribution (CC BY) license (https://creativecommons.org/licenses/by/4.0/).
Share and Cite
Alanazi, A.K.; Alizadeh, S.M.; Nurgalieva, K.S.; Nesic, S.; Grimaldo Guerrero, J.W.; Abo-Dief, H.M.; Eftekhari-Zadeh, E.; Nazemi, E.; Narozhnyy, I.M. Application of Neural Network and Time-Domain Feature Extraction Techniques for Determining Volumetric Percentages and the Type of Two Phase Flow Regimes Independent of Scale Layer Thickness. Appl. Sci. 2022, 12, 1336. https://0-doi-org.brum.beds.ac.uk/10.3390/app12031336
Alanazi AK, Alizadeh SM, Nurgalieva KS, Nesic S, Grimaldo Guerrero JW, Abo-Dief HM, Eftekhari-Zadeh E, Nazemi E, Narozhnyy IM. Application of Neural Network and Time-Domain Feature Extraction Techniques for Determining Volumetric Percentages and the Type of Two Phase Flow Regimes Independent of Scale Layer Thickness. Applied Sciences. 2022; 12(3):1336. https://0-doi-org.brum.beds.ac.uk/10.3390/app12031336
Chicago/Turabian StyleAlanazi, Abdullah K., Seyed Mehdi Alizadeh, Karina Shamilyevna Nurgalieva, Slavko Nesic, John William Grimaldo Guerrero, Hala M. Abo-Dief, Ehsan Eftekhari-Zadeh, Ehsan Nazemi, and Igor M. Narozhnyy. 2022. "Application of Neural Network and Time-Domain Feature Extraction Techniques for Determining Volumetric Percentages and the Type of Two Phase Flow Regimes Independent of Scale Layer Thickness" Applied Sciences 12, no. 3: 1336. https://0-doi-org.brum.beds.ac.uk/10.3390/app12031336