
Measurement of the Machined Surface Diameter by a Laser Triangulation Sensor and Optimalization of Turning Conditions Based on the Diameter Deviation and Tool Wear by GRA and ANOVA

 ,
,  ,
, 
Abstract
:1. Introduction
2. Optimization of Input Factors Using the GRA Method and Analysis of the Significance of Factors According to ANOVA
| i = 1,…, m k = 1,…, n, | |
| m | is the number of experimental data, |
| n | is the number of response characteristics, |
| indicates the original sequence, | |
| indicates a sequence after data processing, | |
| highest value of , | |
| lowest value of , | |
| is the required value of . | |
| is the sequence deviation of the reference sequence and the comparison sequence , | |
| are the minimum and maximum values of the absolute differences (), | |
| is an identification coefficient, and is defined in scope and depends on the needs of the system. Usually, the value of () is 0.5. |
- is the GRG required for the i experiment,
- number of response characteristics.
- is the total mean of GRG,
- is the mean of GRG at the optimal level of each factor,
- s is the number of significant process factors.
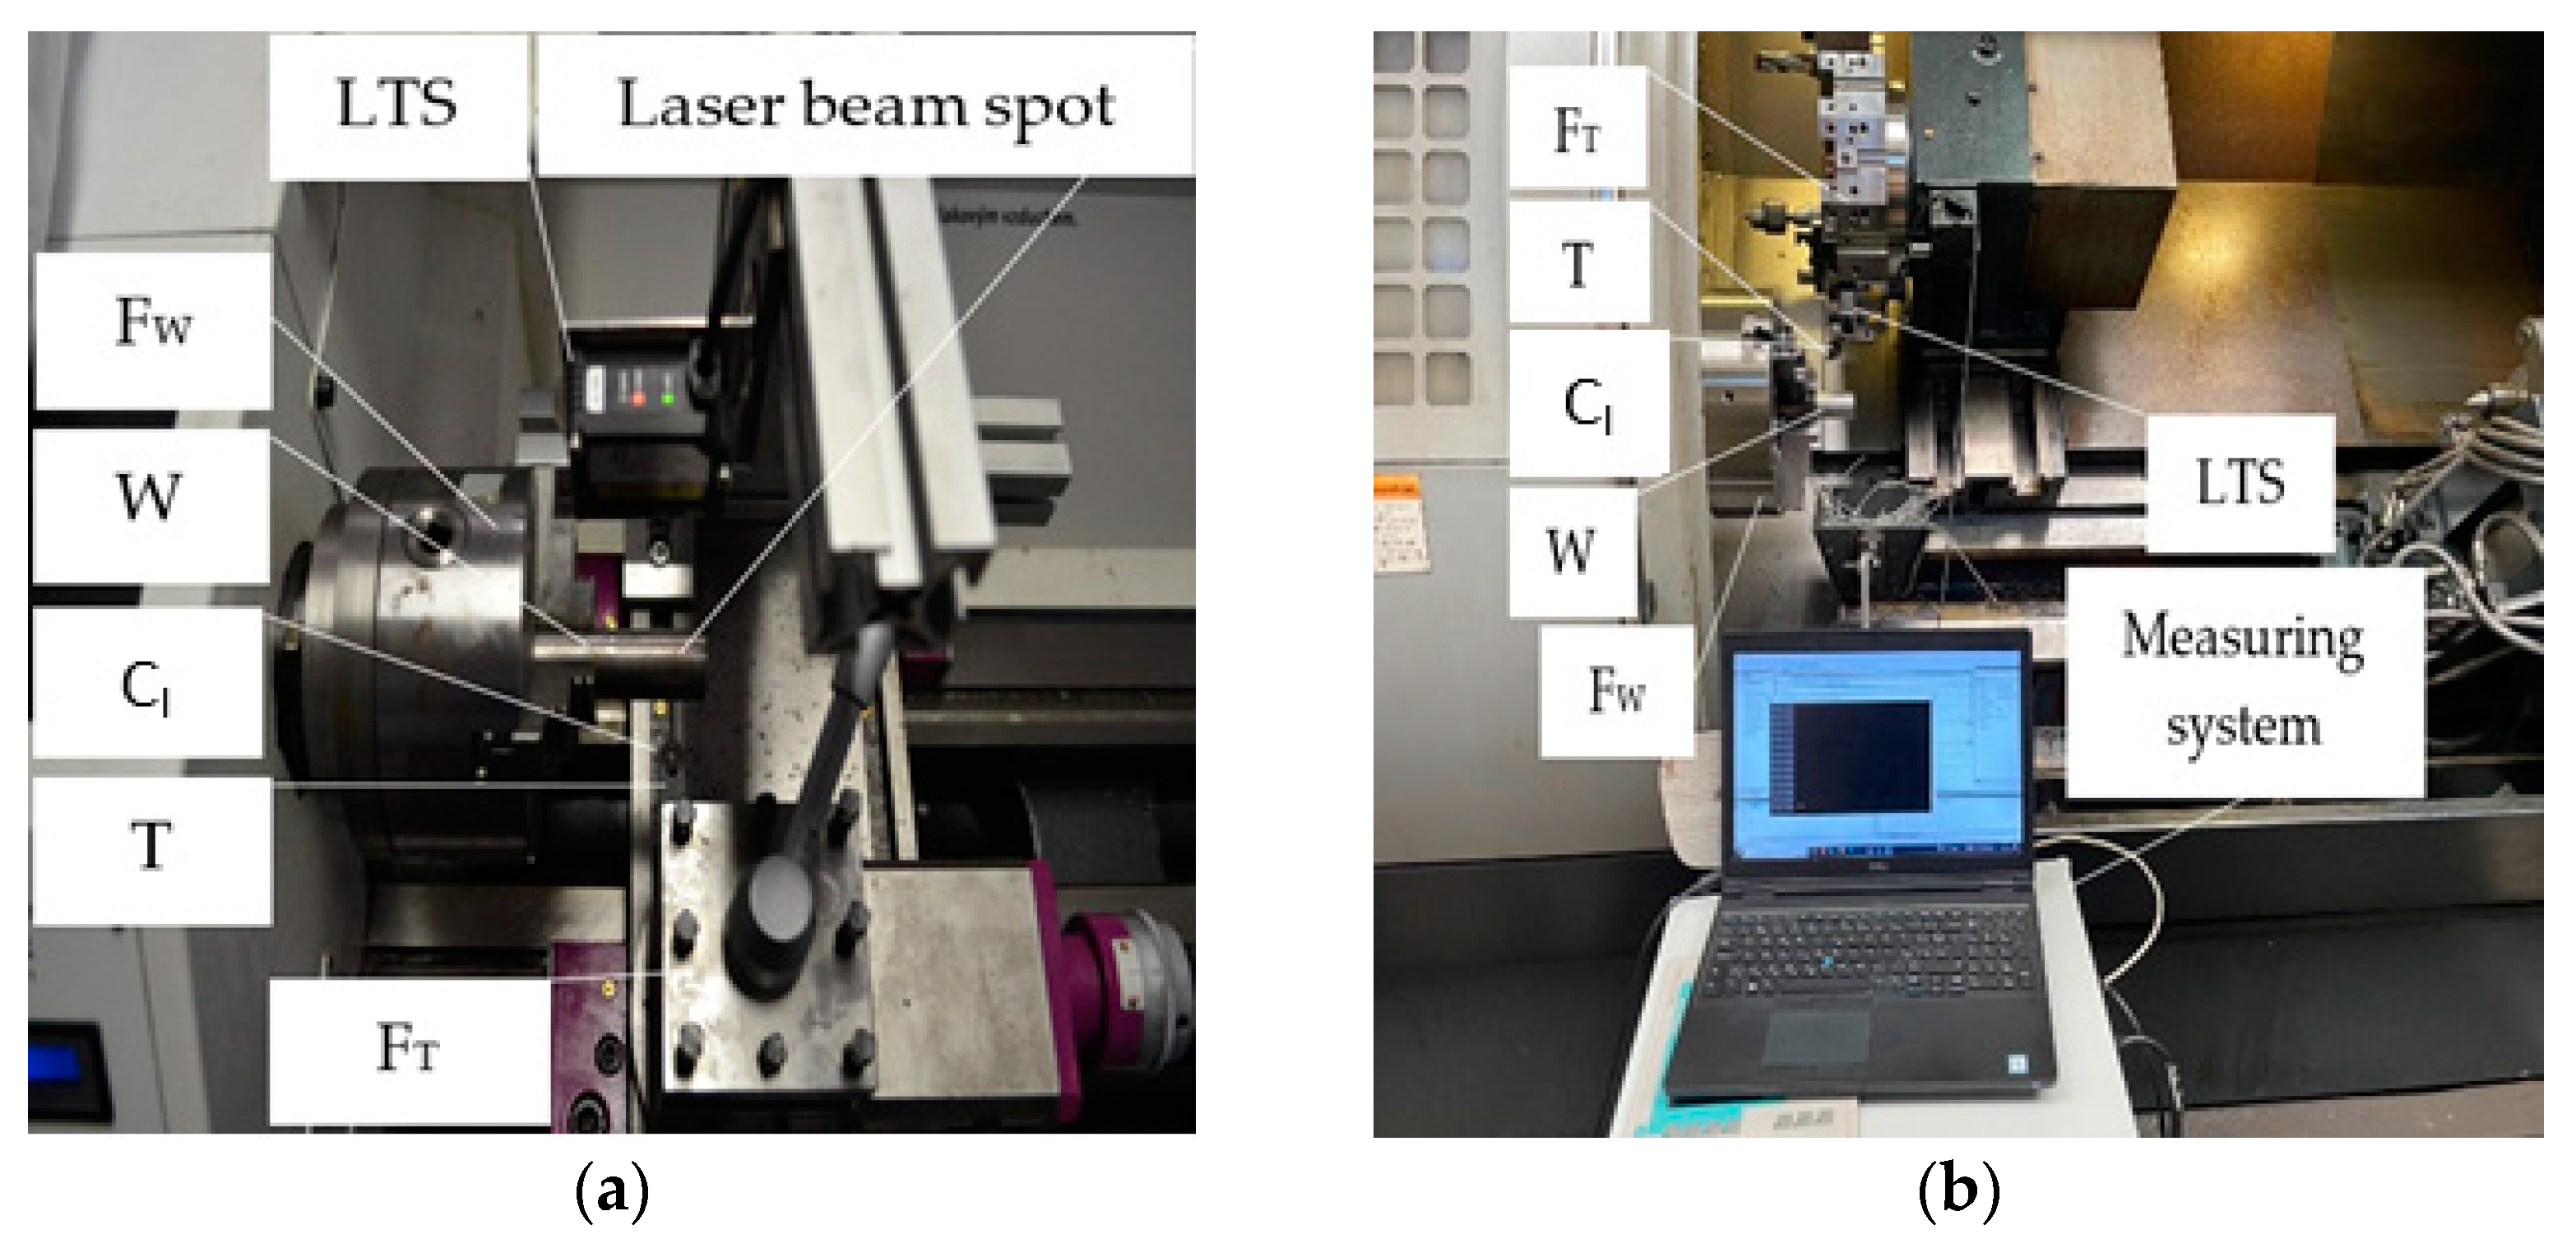
2.1. Experimental Design—Technological System
- M is (machine),
- T is cutting tool (consisting of tool holder—TH and cutting insert—CI),
- W is workpiece,
- F is fixture (consisting of fixture for cutting tool—FT, and fixture for workpiece—FW).
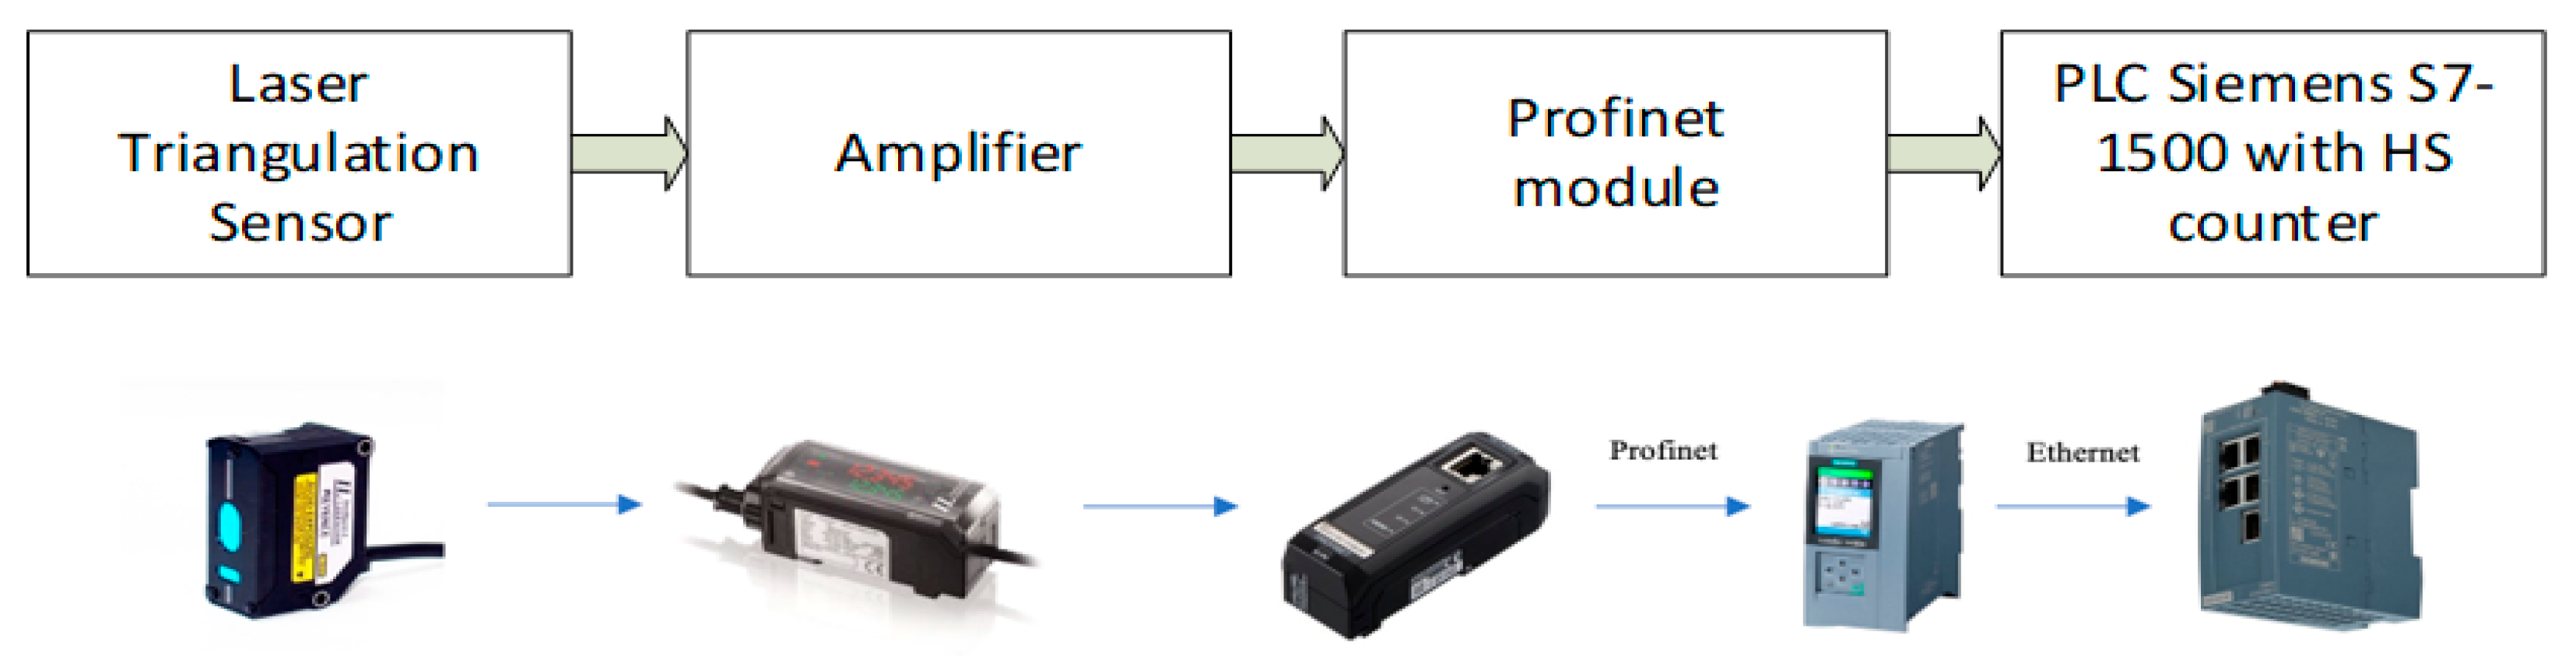
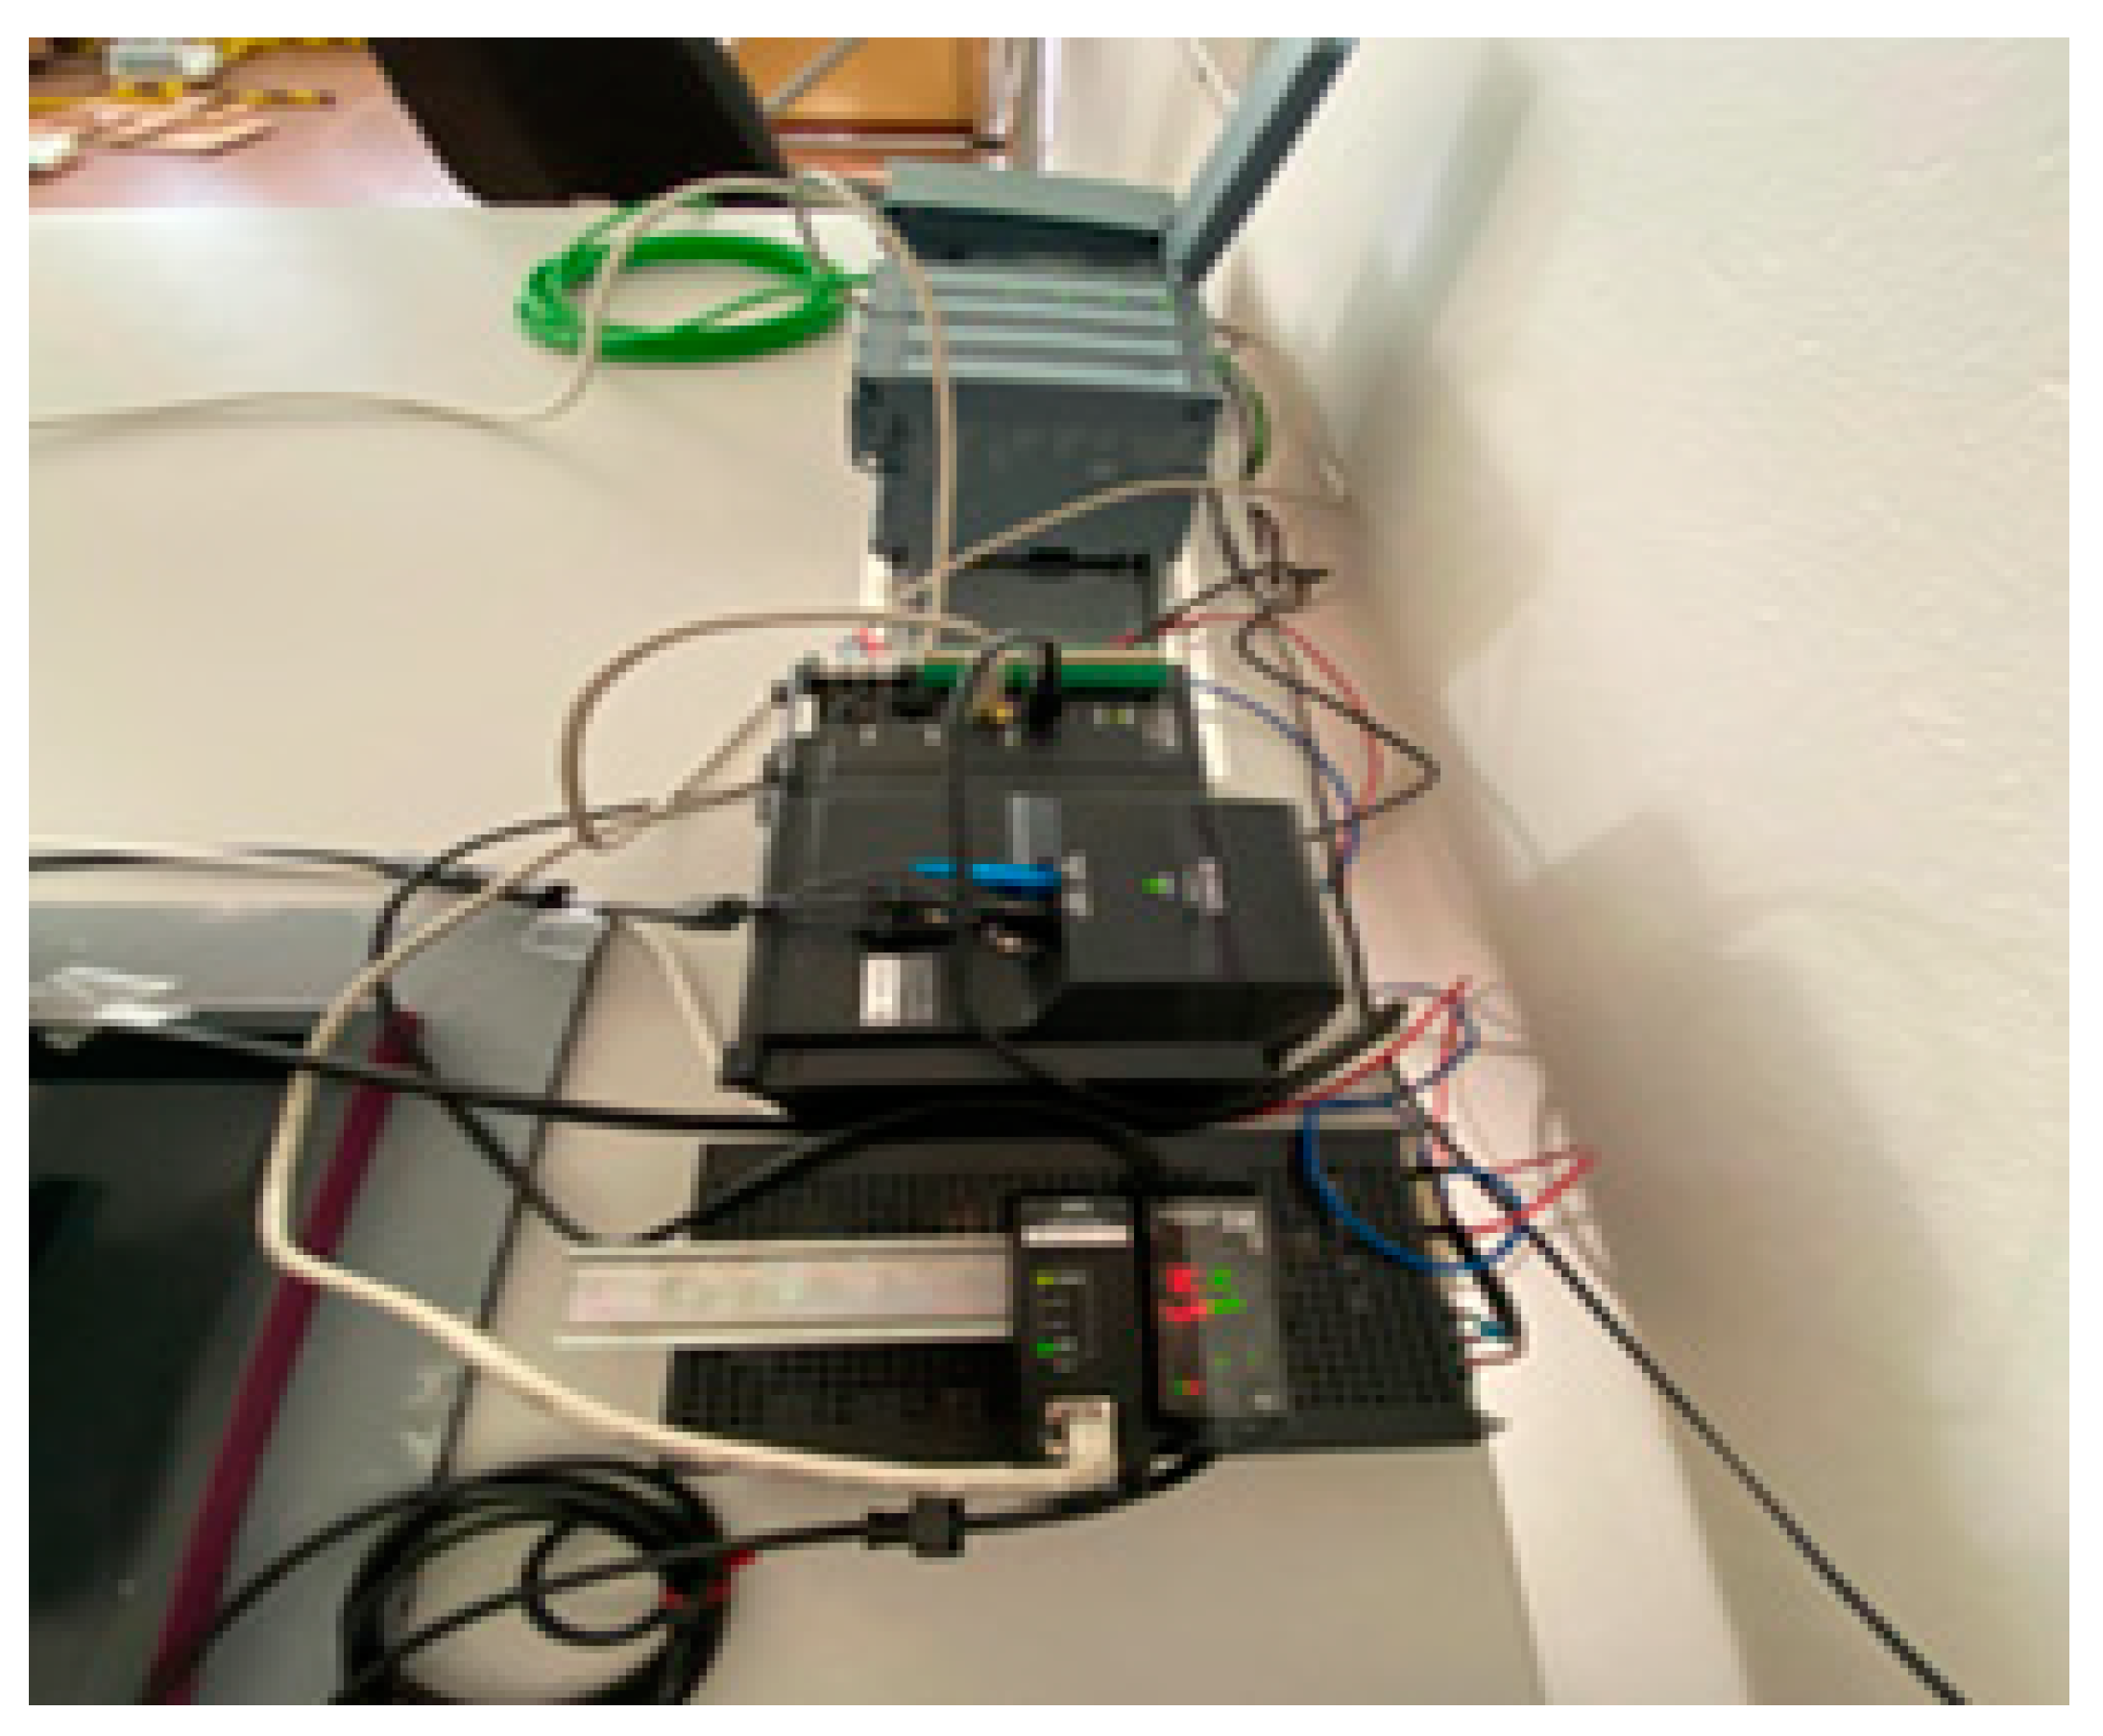
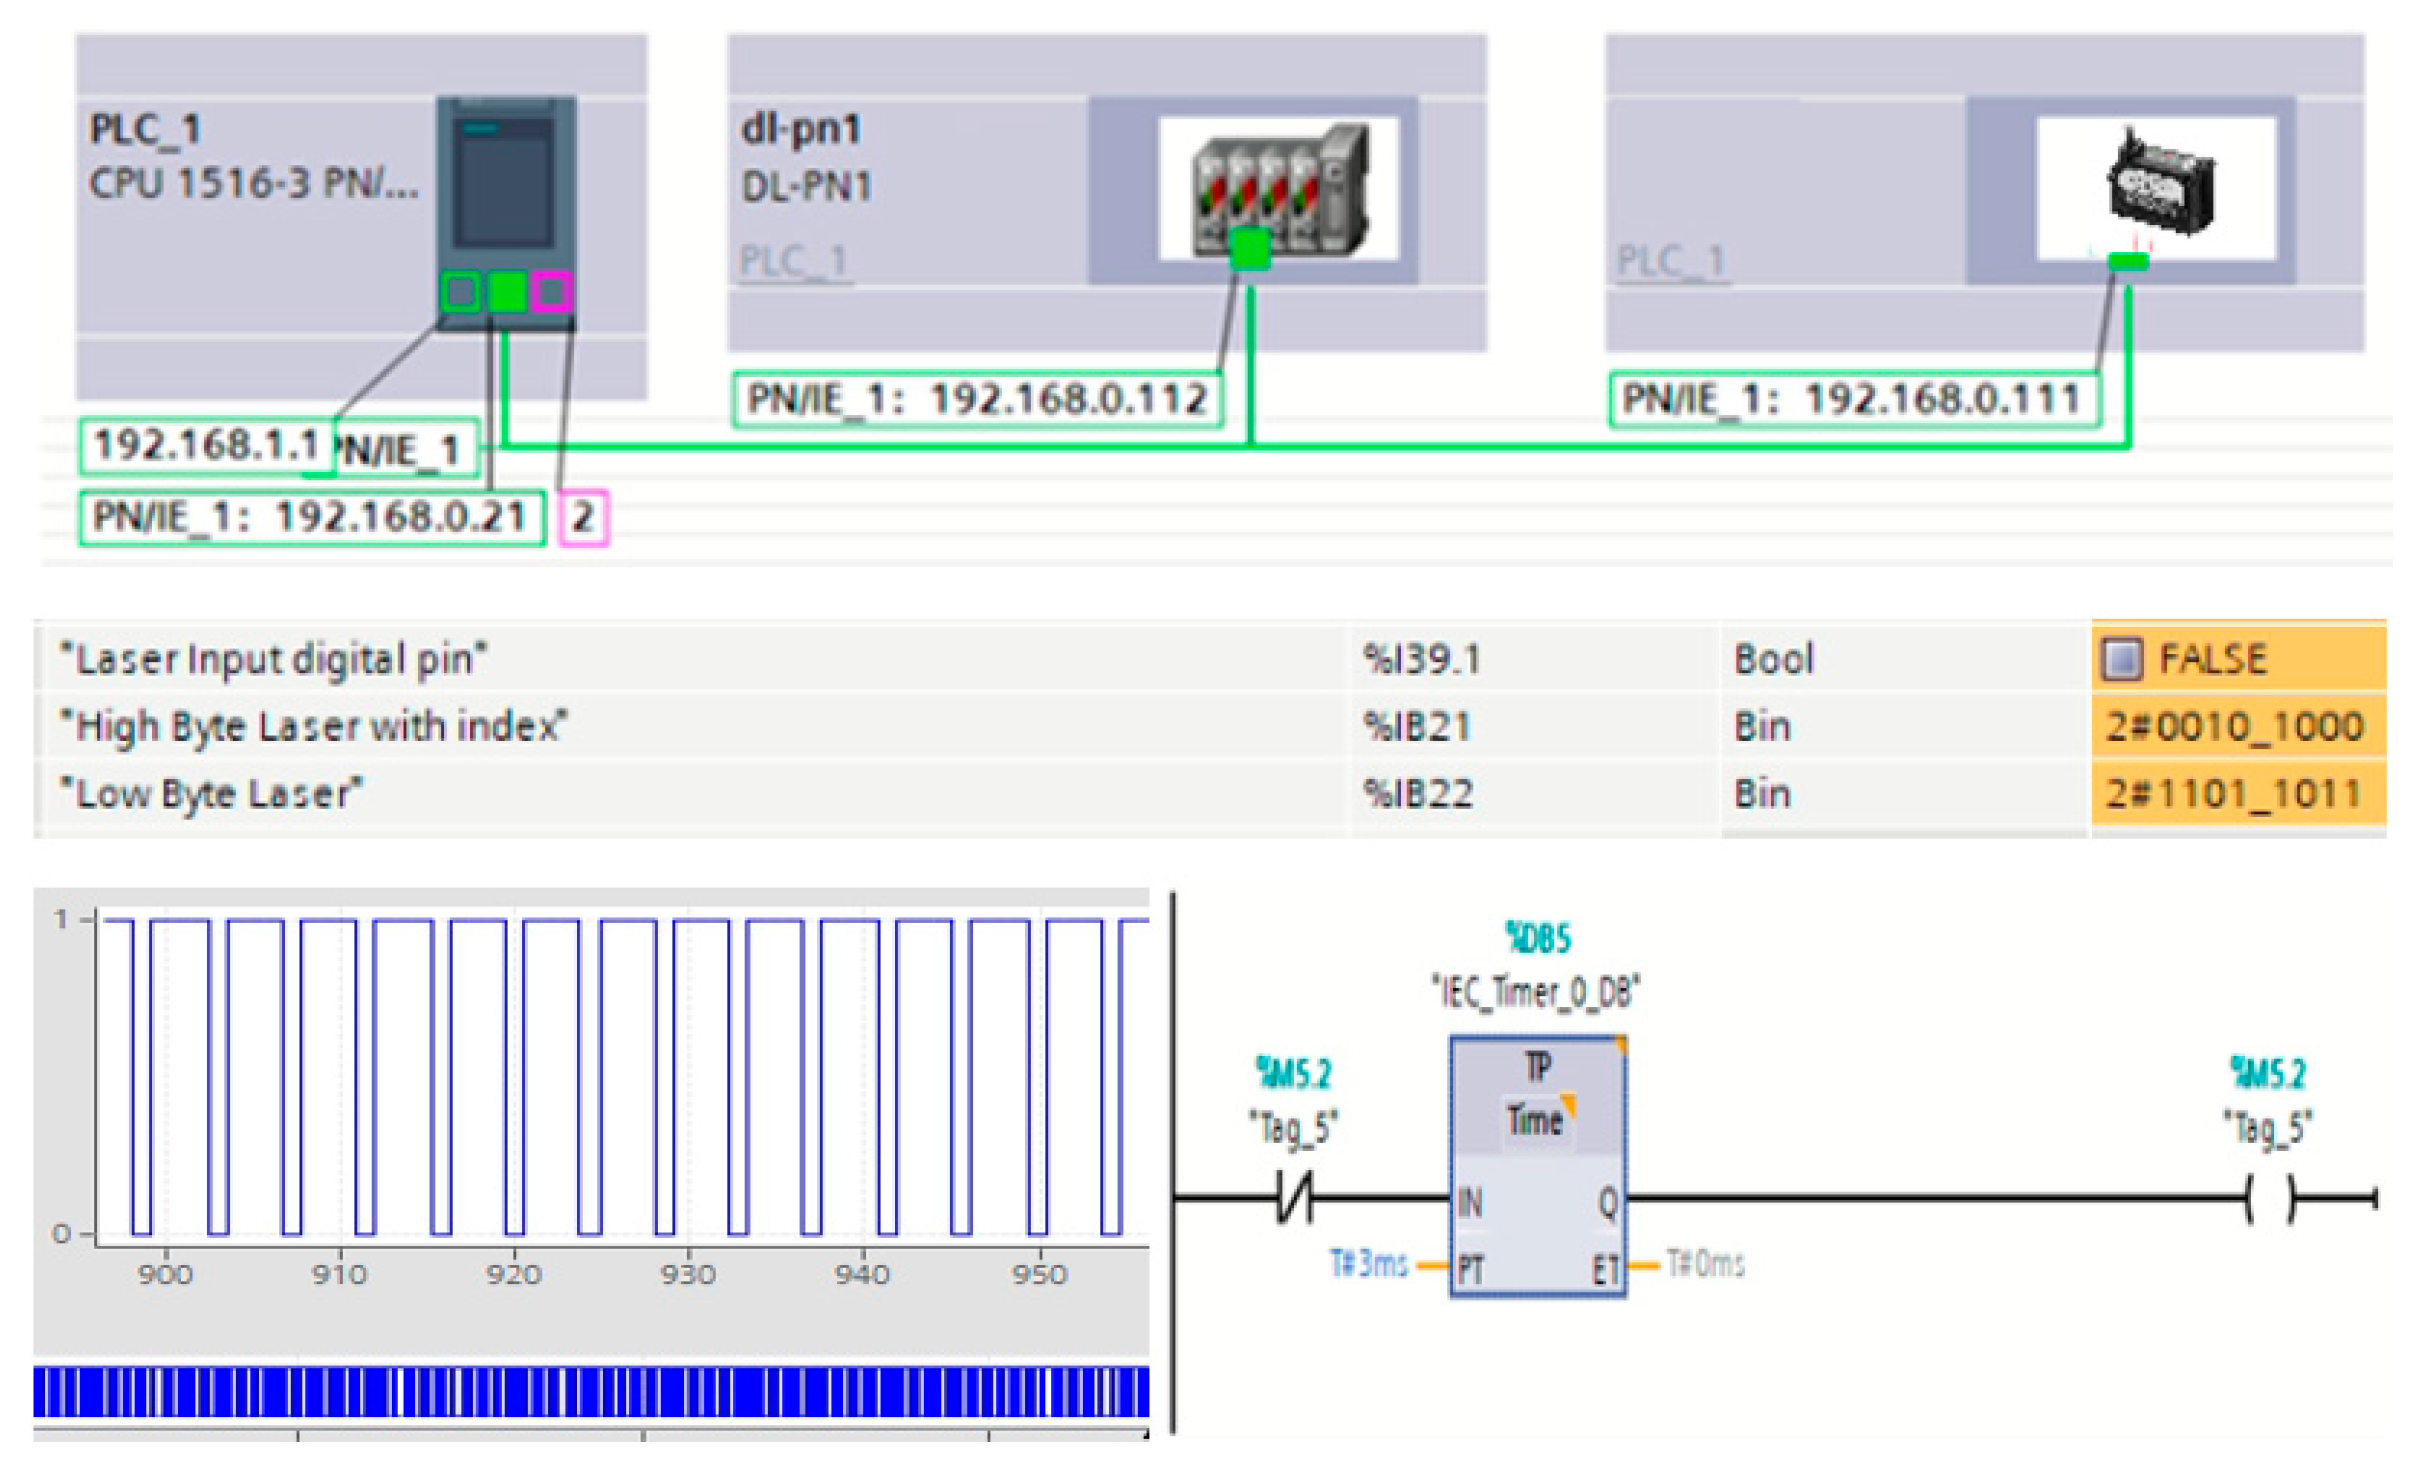
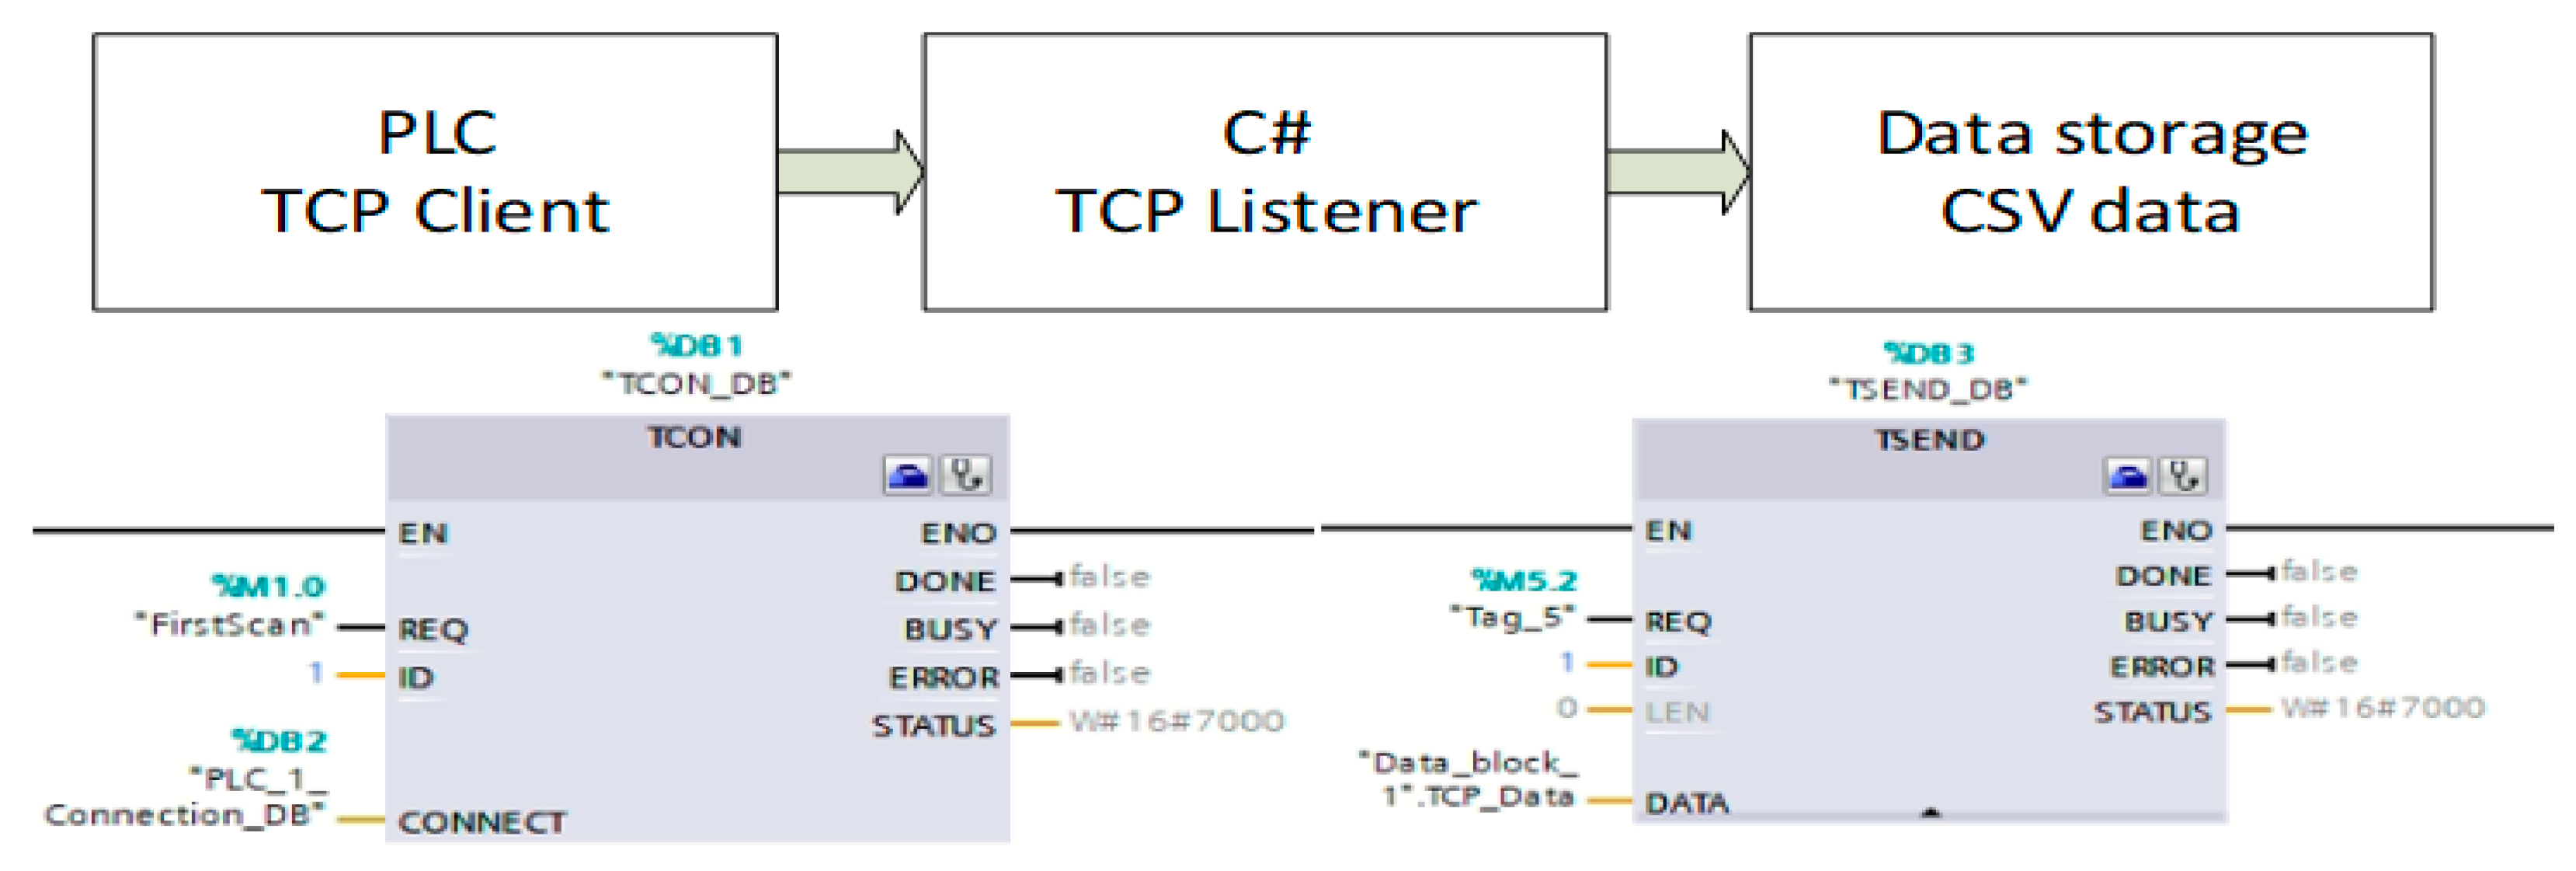
2.2. Experimental Design—Measuring System LTS
3. Description, Implementation and Results of Experiments
Application Results of GRA and ANOVA Methods
- Ensure compliance with the certified deviations of some dynamic modules of CNC machines (e.g., spindle);
- Limit the use of process media or provide suitable constructive protection of the sensor in the working area of the machine;
- The results may be distorted by red light: this did not affect the results in the experiments;
- Non-contact measurement method and speed of acquired data: high efficiency;
- Can be used for static and dynamic measurements;
- Since we always work with an electrical output signal of the sensor, it is necessary to solve the problem of interference of the sensor by electric or magnetic fields;
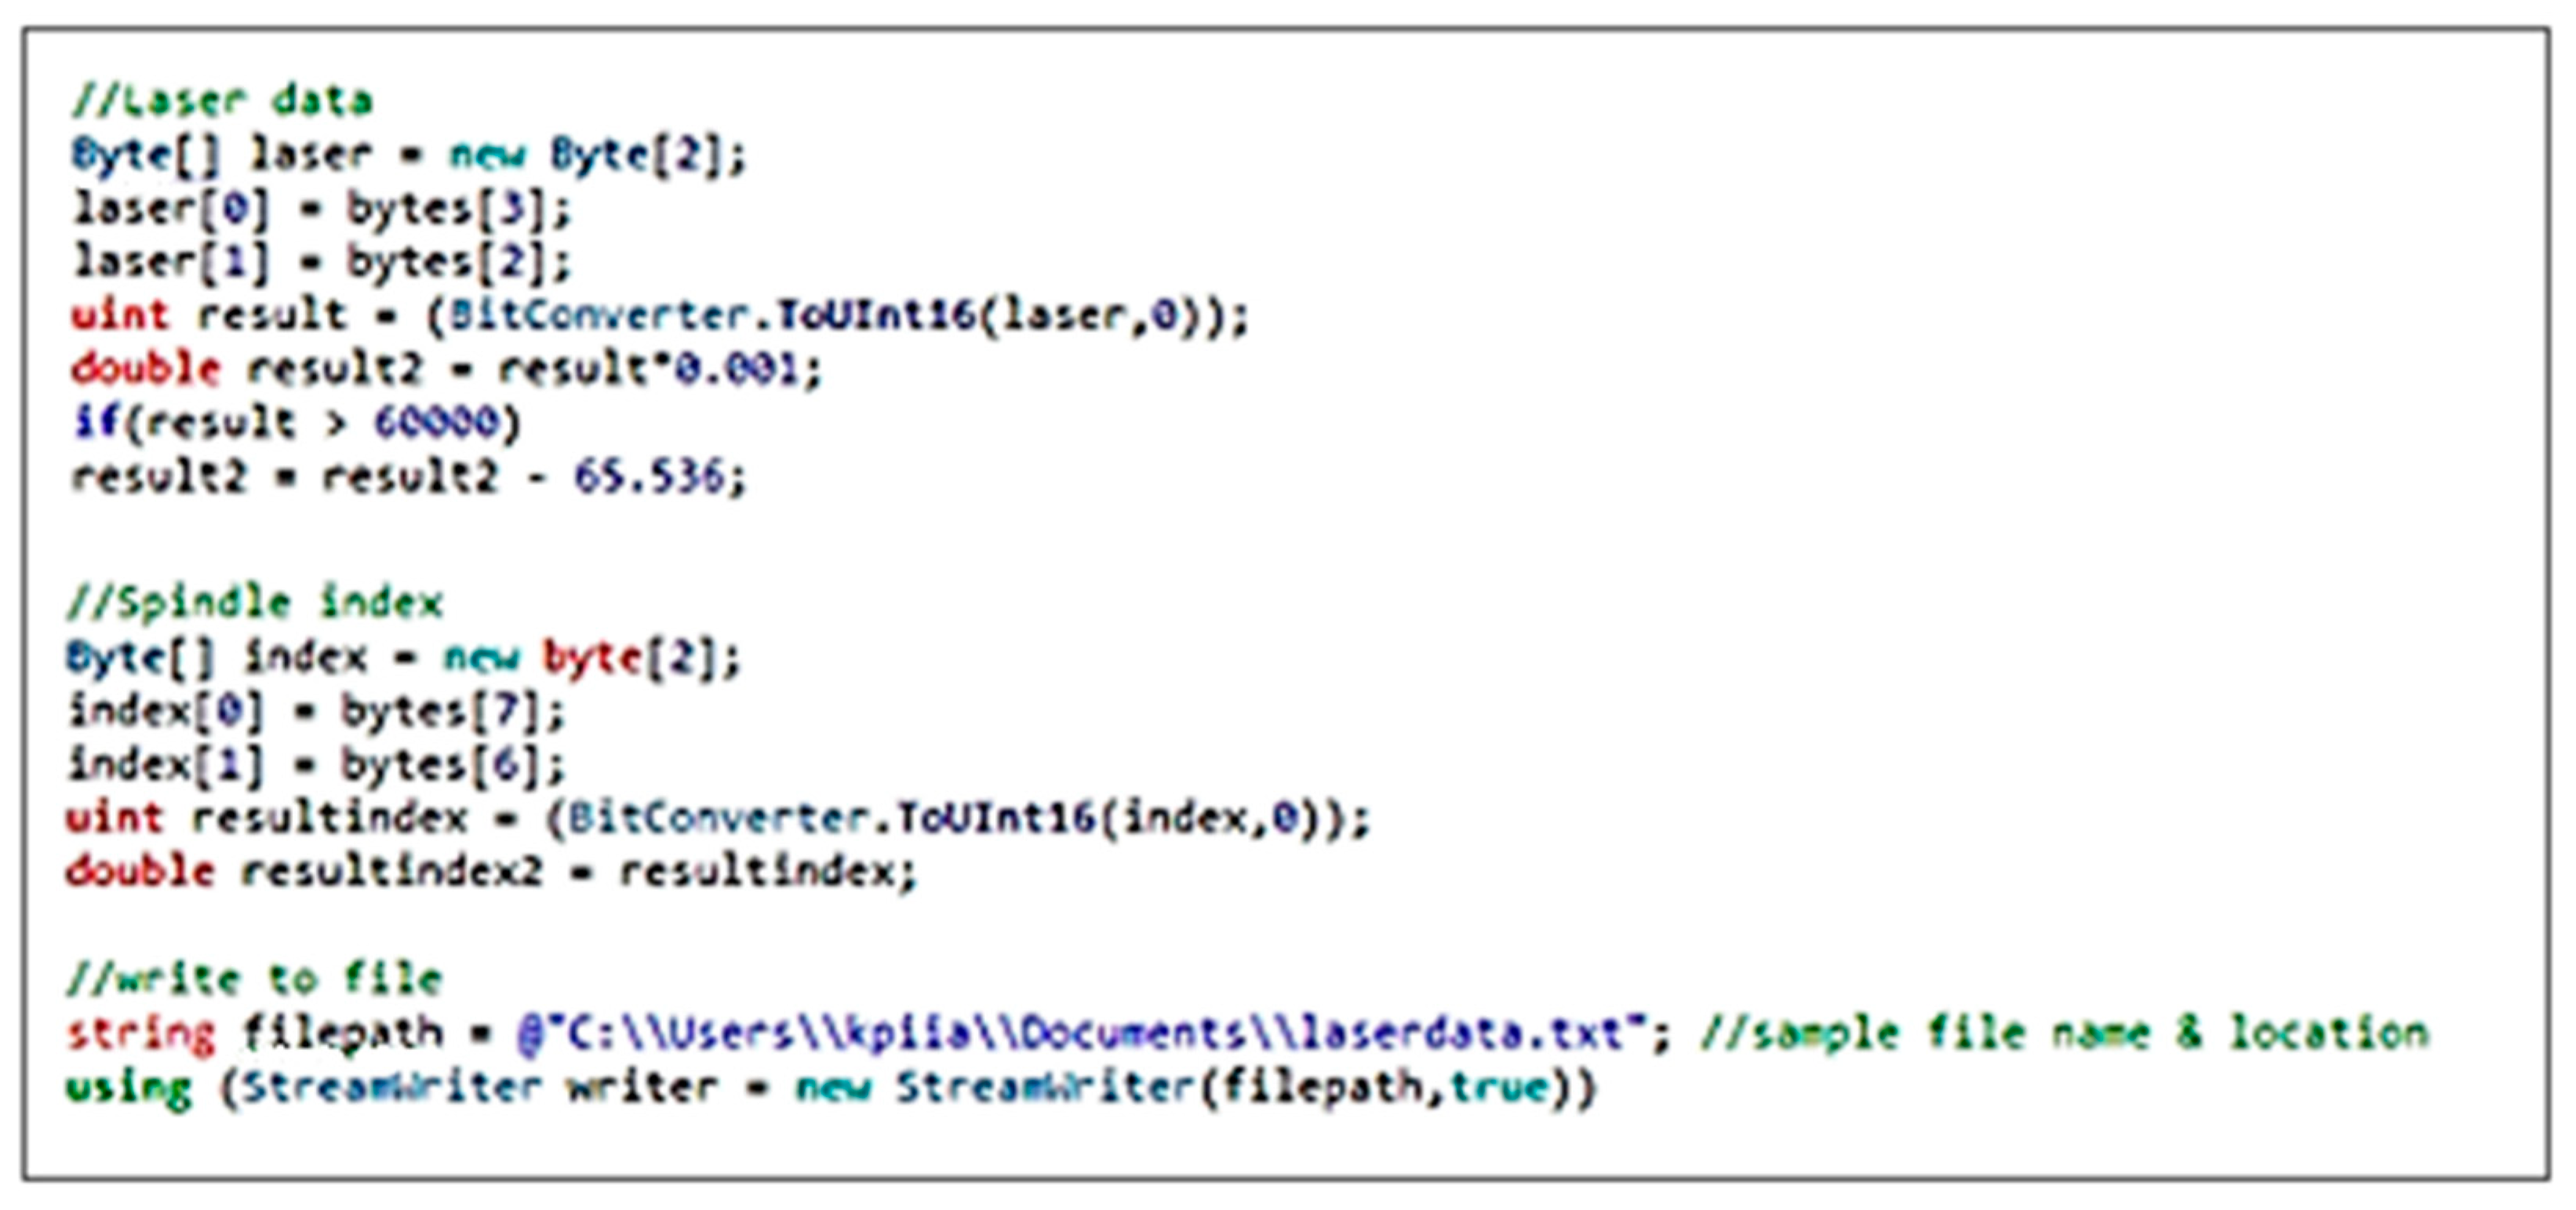
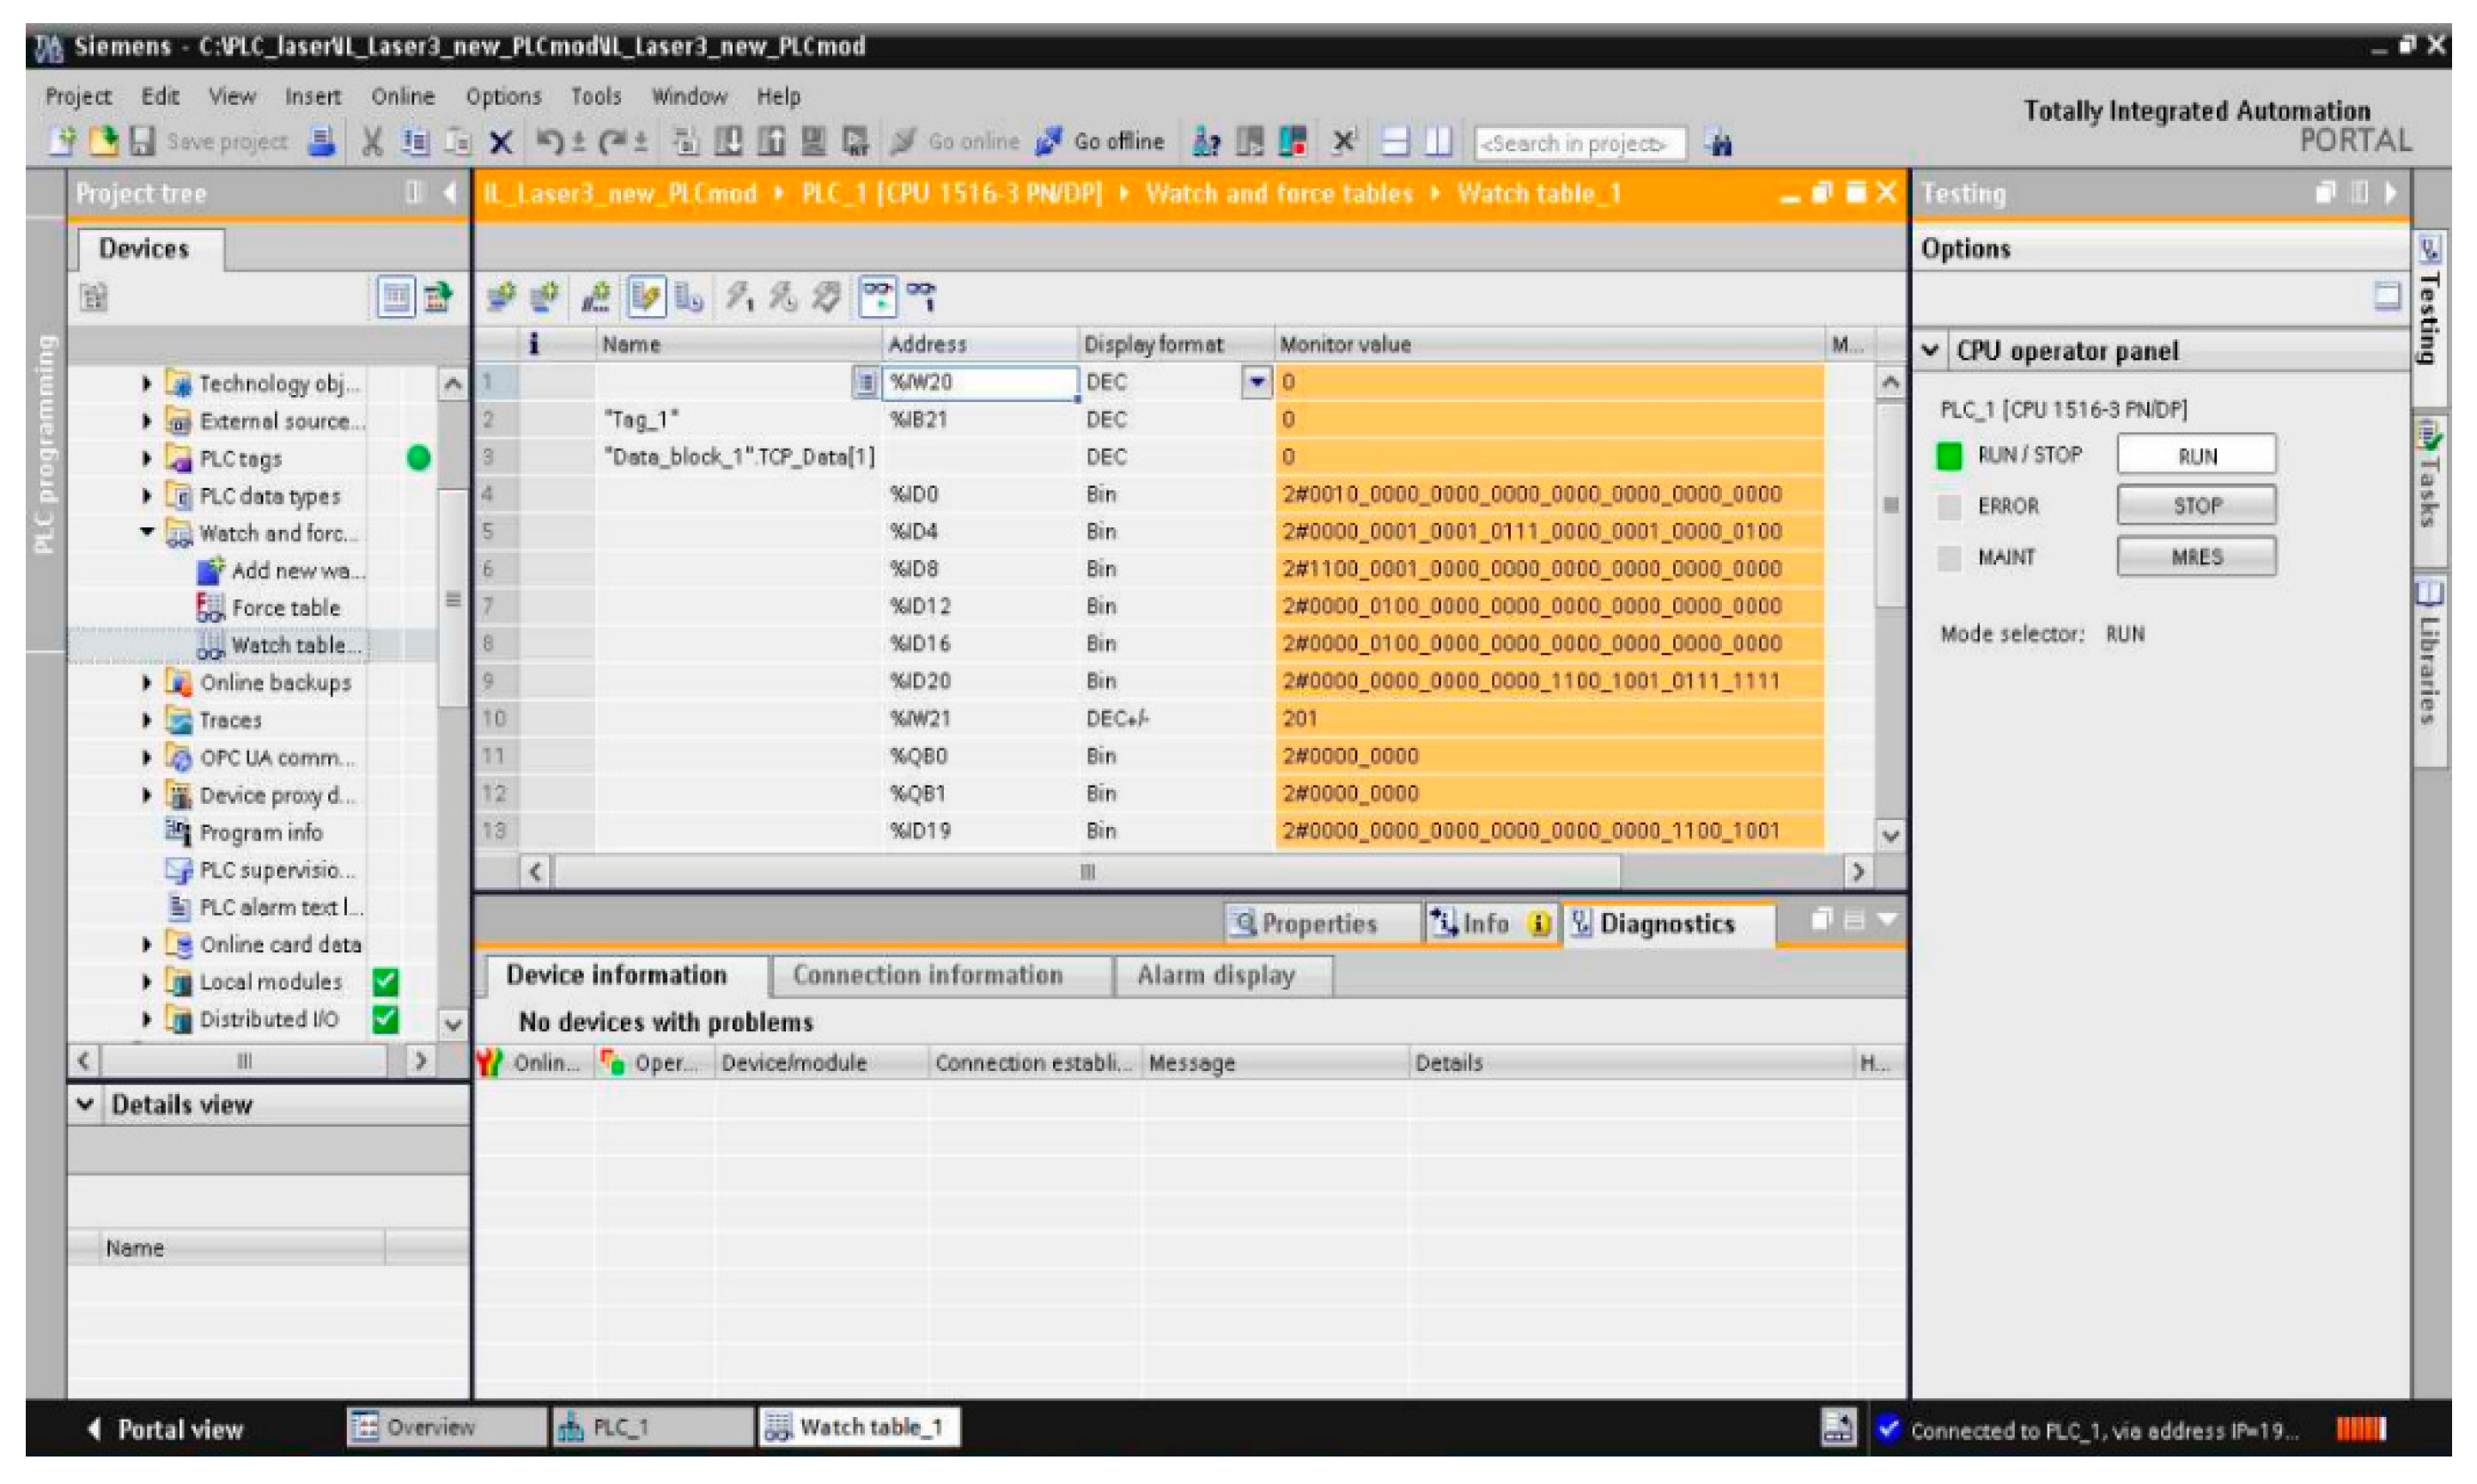
- Program can process, analyze, filter the acquired data according to Figure 13 and decide about the product, whether it was manufactured according to the specified technical requirements.
4. Discussion
5. Conclusions
Author Contributions
Funding
Institutional Review Board Statement
Informed Consent Statement
Data Availability Statement
Acknowledgments
Conflicts of Interest
References
- Phuyal, S.; Bista, D.; Bista, R. Challenges, Opportunities and Future Directions of Smart Manufacturing: A State of Art Review. Sustain. Future 2020, 2, 100023. [Google Scholar] [CrossRef]
- Javaid, M.; Haleem, A.; Singh, R.P.; Rab, S.; Suman, R. Significance of sensors for industry 4.0: Roles, capabilities, and applications. Sens. Int. 2021, 2, 100110. [Google Scholar] [CrossRef]
- Li, X.-Q.; Wang, Z.; Fu, L.-H. A Laser-Based Measuring System for Online Quality Control of Car Engine Block. Sensors 2016, 16, 1877. [Google Scholar] [CrossRef] [PubMed] [Green Version]
- Schmitt, J.; Bönig, J.; Borggräfe, T.; Beitinger, G.; Deuse, J. Predictive model-based quality inspection using Machine Learning and Edge Cloud Computing. Adv. Eng. Inform. 2020, 45, 101101. [Google Scholar] [CrossRef]
- Balestrieri, E.; Daponte, P.; De Vito, L.; Lamonaca, F. Sensors and Measurements for Unmanned Systems: An Overview. Sensors 2021, 21, 1518. [Google Scholar] [CrossRef]
- Yang, T.; Wang, Z.; Wu, Z.; Li, X.; Wang, L.; Liu, C. Calibration of Laser Beam Direction for Inner Diameter Measuring Device. Sensors 2017, 17, 294. [Google Scholar] [CrossRef] [Green Version]
- Giganto, S.; Martínez-Pellitero, S.; Cuesta, E.; Meana, V.M.; Barreiro, J. Analysis of Modern Optical Inspection Systems for Parts Manufactured by Selective Laser Melting. Sensors 2020, 20, 3202. [Google Scholar] [CrossRef]
- Plaza, E.G.; López, P.J.N.; González, E.M.B. Multi-Sensor Data Fusion for Real-Time Surface Quality Control in Automated Machining Systems. Sensors 2018, 18, 4381. [Google Scholar] [CrossRef] [Green Version]
- Kiss, A.K.; Bachrathy, D.; Stepan, G. Laser scanned patterns of machined surfaces. Procedia CIRP 2018, 77, 355–358. [Google Scholar] [CrossRef]
- Yuan, Y.; Jing, X.; Ehmann, K.F.; Zhang, D. Surface roughness modeling in micro end-milling. Int. J. Adv. Manuf. Technol. 2017, 95, 1655–1664. [Google Scholar] [CrossRef]
- Tofail, S.A.; Koumoulos, E.P.; Bandyopadhyay, A.; Bose, S.; O’Donoghue, L.; Charitidis, C. Additive manufacturing: Scientific and technological challenges, market uptake and opportunities. Mater. Today 2018, 21, 22–37. [Google Scholar] [CrossRef]
- Bose, S.; Ke, D.; Sahasrabudhe, H.; Bandyopadhyay, A. Additive manufacturing of biomaterials. Prog. Mater. Sci. 2017, 93, 45–111. [Google Scholar] [CrossRef] [PubMed]
- Chen, L.; Liu, C.; Li, Z.; Kang, Z. A New Triangulation Algorithm for Positioning Space Debris. Remote Sens. 2021, 13, 4878. [Google Scholar] [CrossRef]
- Selami, Y.; Tao, W.; Gao, Q.; Yang, H.; Zhao, H. A Scheme for Enhancing Precision in 3-Dimensional Positioning for Non-Contact Measurement Systems Based on Laser Triangulation. Sensors 2018, 18, 504. [Google Scholar] [CrossRef] [PubMed] [Green Version]
- Montavon, B.; Dahlem, P.; Peterek, M.; Ohlenforst, M.; Schmitt, R.H. Modelling Machine Tools using Structure Integrated Sensors for Fast Calibration. J. Manuf. Mater. Process. 2018, 2, 14. [Google Scholar] [CrossRef] [Green Version]
- Miklós, A.; Bachrathy, D.; Wohlfart, R.; Takács, D.; Porempovics, G.; Tóth, A.; Stépán, G. Hardware-in-the-loop experiment of turning. Procedia CIRP 2018, 77, 675–678. [Google Scholar] [CrossRef]
- You, J.-H.; Oh, S.; Park, J.-E.; Song, H.; Kim, Y.-K. A novel LiDAR sensor alignment inspection system for automobile productions using 1-D photodetector arrays. Measurement 2021, 183, 109817. [Google Scholar] [CrossRef]
- Frommknecht, A.; Kuehnle, J.; Effenberger, I.; Pidan, S. Multi-sensor measurement system for robotic drilling. Robot. Comput. Manuf. 2017, 47, 4–10. [Google Scholar] [CrossRef]
- Takushima, S.; Kawano, H.; Nakahara, H.; Kurokawa, T. On-machine multi-directional laser displacement sensor using scanning exposure method for high-precision measurement of metal-works. Precis. Eng. 2018, 51, 437–444. [Google Scholar] [CrossRef]
- Wojciechowski, S.; Wiackiewicz, M.; Krolczyk, G. Study on metrological relations between instant tool displacements and surface roughness during precise ball end milling. Measurement 2018, 129, 686–694. [Google Scholar] [CrossRef]
- Bombiński, S.; Kossakowska, J.; Jemielniak, K. Detection of accelerated tool wear in turning. Mech. Syst. Signal Process. 2021, 162, 108021. [Google Scholar] [CrossRef]
- Kossakowska, J.; Bombiński, S.; Ejsmont, K. Analysis of the Suitability of Signal Features for Individual Sensor Types in the Diagnosis of Gradual Tool Wear in Turning. Energies 2021, 14, 6489. [Google Scholar] [CrossRef]
- Wang, Y.; Bai, J.; Huang, G.; Zhou, Q.; Wang, X.; Li, X. High precision roundness measurement with two chromatic confocal sensors. In Optical Metrology and Inspection for Industrial Applications VIII; SPIE: Bellingham, WA, USA, 2021; pp. 171–176. [Google Scholar] [CrossRef]
- Zlámal, T.; Mrkvica, I.; Szotkowski, T.; Malotová, Š. The influence of surface treatment of PVD coating on its quality and wear resistant. Coatings 2019, 9, 439. [Google Scholar] [CrossRef] [Green Version]
- Peterka, J.; Pokorny, P.; Vaclav, S.; Patoprsty, B.; Vozar, M. Modification of Cutting Tools by Drag Finishing. MM Sci. J. 2020, 2020, 3822–3825. [Google Scholar] [CrossRef]
- Deng, J. Control problems of grey systems. Syst. Control Lett. 1982, 1, 288–294. Available online: https://0-www-sciencedirect-com.brum.beds.ac.uk/science/article/pii/S016769118280025X (accessed on 2 June 2021).
- Lin, C.L. Use of the Taguchi Method and Grey Relational Analysis to Optimize Turning Operations with Multiple Performance Characteristics. Mater. Manuf. Process. 2004, 19, 209–220. [Google Scholar] [CrossRef]
- Sivalingam, V.; Sun, J.; Mahalingam, S.K.; Nagarajan, L.; Natarajan, Y.; Salunkhe, S.; Nasr, E.A.; Davim, J.P.; Hussein, H.M.A.M. Optimization of Process Parameters for Turning Hastelloy X under Different Machining Environments Using Evolutionary Algorithms: A Comparative Study. Appl. Sci. 2021, 11, 9725. [Google Scholar] [CrossRef]
- Pervez, M.N.; Shafiq, F.; Sarwar, Z.; Jilani, M.M.; Cai, Y. Multi-Response Optimization of Resin Finishing by Using a Taguchi-Based Grey Relational Analysis. Materials 2018, 11, 426. [Google Scholar] [CrossRef] [Green Version]
- Mufarrih, A.; Istiqlaliyah, H.; Ilha, M.M. Optimization of Roundness, MRR and Surface Roughness on Turning Process using Taguchi-GRA. J. Physics Conf. Ser. 2019, 1179, 012099. [Google Scholar] [CrossRef]
- Li, N.; Chen, Y.-J.; Kong, D.-D. Multi-response optimization of Ti-6Al-4V turning operations using Taguchi-based grey relational analysis coupled with kernel principal component analysis. Adv. Manuf. 2019, 7, 142–154. [Google Scholar] [CrossRef] [Green Version]
- Chelladurai, S.J.S.; Suresh Sharma, K.; Kumar, G.; Kumar, M. Application of taguchi method coupled with GRA for optimization of drilling process parameters. In IOP Conference Series: Materials Science and Engineering, Proceedings of the 3rd International Conference on Futuristic Trends in Materials and Manufacturing (ICFTMM 2020), Greater Noida, India, 7–8 April 2021; IOP Publishing Ltd.: Bristol, UK, 2021; Volume 1149. [Google Scholar] [CrossRef]
- Kumar, R.S.; Kumar, S.S.; Murugan, K.; Hailegiorgis, S.M. Green Machining Characteristics Study of Al-6063 in CNC Milling Using Taguchi Method and Grey Relational Analysis. Adv. Mater. Sci. Eng. 2021, 2021, 4420250. [Google Scholar] [CrossRef]
- Tamizharasan, T.; Senthilkumar, N.; Selvakumar, V.; Dinesh, S. Taguchi’s methodology of optimizing turning parameters over chip thickness ratio in machining P/M AMMC. SN Appl. Sci. 2019, 1, 160. [Google Scholar] [CrossRef] [Green Version]
- Sylajakumari, P.A.; Ramakrishnasamy, R.; Palaniappan, G. Taguchi Grey Relational Analysis for Multi-Response Optimization of Wear in Co-Continuous Composite. Materials 2018, 11, 1743. [Google Scholar] [CrossRef] [PubMed] [Green Version]
- Puh, F.; Jurkovic, Z.; Perinić, M.; Brezocnik, M.; Buljan, S. Optimization of machining parameters for turning operation with multiple quality characteristics using Grey relational analysis. Teh. Vjesn. Tech. Gaz. 2016, 23, 377–382. [Google Scholar] [CrossRef]
- Kilickap, E.; Yardimeden, A.; Çelik, Y.H. Mathematical Modelling and Optimization of Cutting Force, Tool Wear and Surface Roughness by Using Artificial Neural Network and Response Surface Methodology in Milling of Ti-6242S. Appl. Sci. 2017, 7, 1064. [Google Scholar] [CrossRef] [Green Version]
- Filipescu, A.; Ionescu, D.; Filipescu, A.; Mincă, E.; Simion, G. Multifunctional Technology of Flexible Manufacturing on a Mechatronics Line with IRM and CAS, Ready for Industry 4.0. Processes 2021, 9, 864. [Google Scholar] [CrossRef]
- Židek, K.; Hošovský, A. Wireless Device Based on MEMS Sensors and Bluetooth Low Energy (LE/Smart) Technology for Diagnostics of Mechatronic Systems. Appl. Mech. Mater. 2013, 460, 13–21. [Google Scholar] [CrossRef]
- Židek, K.; Pitel, J. Smart 3D Pointing Device Based on MEMS Sensor and Bluetooth Low Energy. In Proceedings of the 2013 IEEE Symposium Series on Computational Intelligence (SSCI), Singapore, 17 October 2013; pp. 165–168. [Google Scholar]
- Kuruc, M.; Vopát, T.; Peterka, J.; Necpal, M.; Šimna, V.; Milde, J.; Jurina, F. The Influence of Cutting Parameters on Plastic Deformation and Chip Compression during the Turning of C45 Medium Carbon Steel and 62SiMnCr4 Tool Steel. Materials 2022, 15, 585. [Google Scholar] [CrossRef]


| Components | TS—A | TS—B |
|---|---|---|
| M | Optimum TU 2807 | Viper VT-28BL-1500s |
| W | Steel C45 EN 10083-2-91 | Steel C45 EN 10083-2-91 |
| CI | SCMT09T308 TTR | SCMT09T308 TTR |
| TH | SSDCN1212K12 M-A | SSDCN1212K12 M-A |
| FT | Tool holder | Tool holder |
| Fw | Workpiece holder (chuck) | Workpiece holder (chuck) |
| LTS | Laser triangulation sensor | Laser triangulation sensor |
| Steel C45 | % |
|---|---|
| C | 0.48 |
| Mn | 0.70 |
| Si | 0.20 |
| Cr | max 0.25 |
| Ni | max 0.30 |
| P | 0.040 |
| S | 0.040 |
| Factor Level | ap Depth of Cut (mm) | f Feed (mm per Rev.) | vc Cutting Speed (m/min) |
|---|---|---|---|
| 1. | 0.01 | 0.1 | 70 |
| 2. | 0.05 | 0.2 | 120 |
| 3. | 0.1 | 0.3 | 170 |
| 4. | 0.5 | 0.4 | 220 |
| Number of Experiment | ap | f | vc | VBB (mm) | Δd (mm) |
|---|---|---|---|---|---|
| 1 | 0.01 | 0.1 | 70 | 0.0601 | 0.0526 |
| 2 | 0.01 | 0.2 | 120 | 0.1254 | 0.0020 |
| 3 | 0.01 | 0.3 | 170 | 0.0518 | 0.1460 |
| 4 | 0.01 | 0.4 | 220 | 0.1239 | 0.0627 |
| 5 | 0.05 | 0.1 | 120 | 0.1141 | 0.0589 |
| 6 | 0.05 | 0.2 | 70 | 0.0260 | 0.0923 |
| 7 | 0.05 | 0.3 | 220 | 0.1638 | 0.0704 |
| 8 | 0.05 | 0.4 | 170 | 0.1181 | 0.0614 |
| 9 | 0.10 | 0.1 | 170 | 0.1843 | 0.0476 |
| 10 | 0.10 | 0.2 | 220 | 0.1839 | 0.1062 |
| 11 | 0.10 | 0.3 | 70 | 0.0698 | 0.0344 |
| 12 | 0.10 | 0.4 | 120 | 0.1136 | 0.0662 |
| 13 | 0.50 | 0.1 | 220 | 0.1990 | 0.1148 |
| 14 | 0.50 | 0.2 | 170 | 0.1301 | 0.0792 |
| 15 | 0.50 | 0.3 | 120 | 0.1073 | 0.0589 |
| 16 | 0.50 | 0.4 | 70 | 0.0284 | 0.0036 |
| Number of Experiment | Grey Relational Generation Values | Deviation Sequence | GRC | GRG | Rank | |||
|---|---|---|---|---|---|---|---|---|
| Ideal sequence | VBB | Δd | VBB | Δd | VBB | Δd | ||
| 1 | 1 | 1 | 1 | |||||
| 1. | 0.8029 | 0.6486 | 0.1971 | 0.3514 | 0.7172 | 0.5873 | 0.6523 | 5 |
| 2. | 0.4254 | 1.0000 | 0.5746 | 0.0000 | 0.4653 | 1.0000 | 0.7327 | 2 |
| 3. | 0.8509 | 0.0000 | 0.1491 | 1.0000 | 0.7703 | 0.3333 | 0.5518 | 6 |
| 4. | 0.4341 | 0.5785 | 0.5659 | 0.4215 | 0.4691 | 0.5426 | 0.5058 | 11 |
| 5. | 0.4908 | 0.6049 | 0.5092 | 0.3951 | 0.4954 | 0.5586 | 0.5270 | 8 |
| 6. | 1.0000 | 0.3729 | 0.0000 | 0.6271 | 1.0000 | 0.4436 | 0.7218 | 3 |
| 7. | 0.2035 | 0.5250 | 0.7965 | 0.4750 | 0.3856 | 0.5128 | 0.4492 | 14 |
| 8. | 0.4676 | 0.5875 | 0.5324 | 0.4125 | 0.4843 | 0.5479 | 0.5161 | 9 |
| 9. | 0.0850 | 0.6833 | 0.9150 | 0.3167 | 0.3533 | 0.6122 | 0.4828 | 12 |
| 10. | 0.0873 | 0.2764 | 0.9127 | 0.7236 | 0.3539 | 0.4086 | 0.3813 | 15 |
| 11. | 0.7468 | 0.7750 | 0.2532 | 0.2250 | 0.6639 | 0.6897 | 0.6768 | 4 |
| 12. | 0.4936 | 0.5542 | 0.5064 | 0.4458 | 0.4968 | 0.5286 | 0.5127 | 10 |
| 13. | 0.0000 | 0.2167 | 1.0000 | 0.7833 | 0.3333 | 0.3896 | 0.3615 | 16 |
| 14. | 0.3983 | 0.4639 | 0.6017 | 0.5361 | 0.4538 | 0.4826 | 0.4682 | 13 |
| 15. | 0.5301 | 0.6049 | 0.4699 | 0.3951 | 0.5155 | 0.5586 | 0.5370 | 7 |
| 16. | 0.9861 | 0.9889 | 0.0139 | 0.0111 | 0.9730 | 0.9783 | 0.9756 | 1 |
| Factors | Mean Grey Relational Grade | Max-Min | Rank | |||
|---|---|---|---|---|---|---|
| Level 1 | Level 2 | Level 3 | Level 4 | |||
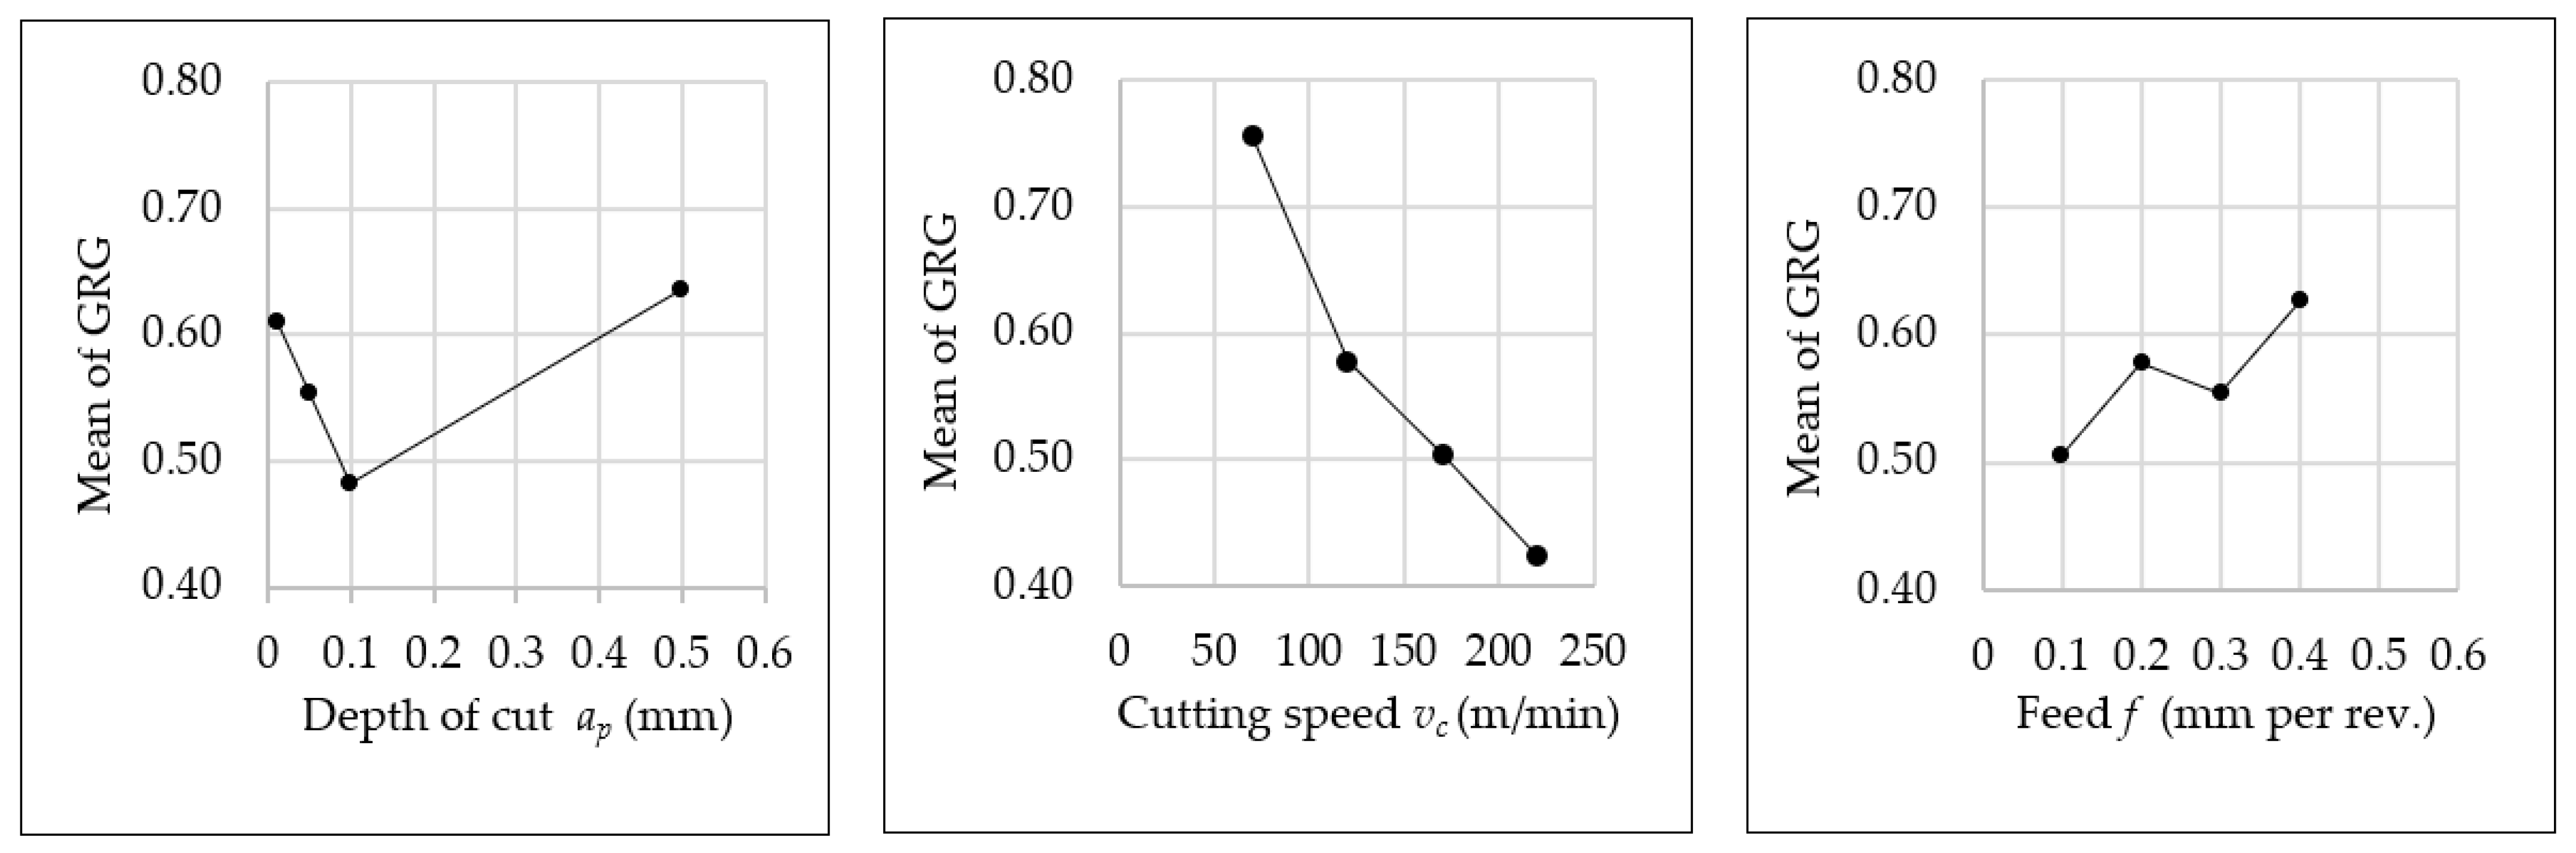
| ap | 0.6107 | 0.5536 | 0.4831 | 0.6367 | 0.1276 | 2 |
| f | 0.5060 | 0.5760 | 0.5537 | 0.6276 | 0.1216 | 3 |
| vc | 0.7566 | 0.5774 | 0.5048 | 0.4245 | 0.3321 | 1 |
| Source | DF | Seq SS | Adj SS | Adj MS | F-Value | p-Value | Remarks |
|---|---|---|---|---|---|---|---|
| ap | 3 | 0.0205 | 0.0205 | 0.0068 | 0.6286 | 0.6231 | Insignificant |
| f | 3 | 0.0329 | 0.0329 | 0.0110 | 1.0075 | 0.4521 | Insignificant |
| vc | 3 | 0.2463 | 0.2463 | 0.0821 | 7.5460 | 0.0181 | Significant |
| Error | 6 | 0.0653 | 0.0653 | 0.0109 | |||
| Total | 15 | 0.3650 |
| Initial Factor Settings | Optimal Cutting Factors | ||
|---|---|---|---|
| Prediction | Experiment | ||
| Level | ap 4-f 1-vc 4 | ap 4-f 4-vc 1 | ap 4-f 4-vc 1 |
| VBB | 0.1990 | 0.0983 | |
| Δd | 0.1148 | 0.0058 | |
| GRG | 0.3615 | 0.8855 | 0.7473 |
Publisher’s Note: MDPI stays neutral with regard to jurisdictional claims in published maps and institutional affiliations. |
© 2022 by the authors. Licensee MDPI, Basel, Switzerland. This article is an open access article distributed under the terms and conditions of the Creative Commons Attribution (CC BY) license (https://creativecommons.org/licenses/by/4.0/).
Share and Cite
Jurko, J.; Miškiv-Pavlík, M.; Hladký, V.; Lazorík, P.; Michalík, P.; Petruška, I. Measurement of the Machined Surface Diameter by a Laser Triangulation Sensor and Optimalization of Turning Conditions Based on the Diameter Deviation and Tool Wear by GRA and ANOVA. Appl. Sci. 2022, 12, 5266. https://0-doi-org.brum.beds.ac.uk/10.3390/app12105266
Jurko J, Miškiv-Pavlík M, Hladký V, Lazorík P, Michalík P, Petruška I. Measurement of the Machined Surface Diameter by a Laser Triangulation Sensor and Optimalization of Turning Conditions Based on the Diameter Deviation and Tool Wear by GRA and ANOVA. Applied Sciences. 2022; 12(10):5266. https://0-doi-org.brum.beds.ac.uk/10.3390/app12105266
Chicago/Turabian StyleJurko, Jozef, Martin Miškiv-Pavlík, Vratislav Hladký, Peter Lazorík, Peter Michalík, and Igor Petruška. 2022. "Measurement of the Machined Surface Diameter by a Laser Triangulation Sensor and Optimalization of Turning Conditions Based on the Diameter Deviation and Tool Wear by GRA and ANOVA" Applied Sciences 12, no. 10: 5266. https://0-doi-org.brum.beds.ac.uk/10.3390/app12105266