

Recognition of Earthquake Surface Ruptures Using Deep Learning

1
Key Laboratory of Earthquake Geodesy, Institute of Seismology, China Earthquake Administration, Wuhan 430071, China
2
Southern Marine Science and Engineering Guangdong Laboratory (Guangzhou), Guangzhou 511458, China
*
Author to whom correspondence should be addressed.
Appl. Sci. 2022, 12(22), 11638; https://0-doi-org.brum.beds.ac.uk/10.3390/app122211638
Submission received: 18 October 2022
/
Revised: 14 November 2022
/
Accepted: 15 November 2022
/
Published: 16 November 2022
(This article belongs to the Special Issue Applications of Machine Learning on Earth Sciences)
Abstract
:Investigating post-earthquake surface ruptures is important for understanding the tectonics of seismogenic faults. The use of unmanned aerial vehicle (UAV) images to identify post-earthquake surface ruptures has the advantages of low cost, fast data acquisition, and high data processing efficiency. With the rapid development of deep learning in recent years, researchers have begun using it for image crack detection. However, due to the complex background and diverse characteristics of the surface ruptures, it remains challenging to quickly train an effective automatic earthquake surface rupture recognition model on a limited number of samples. This study proposes a workflow that applies an image segmentation algorithm based on convolutional neural networks (CNNs) to extract cracks from post-earthquake UAV images. We selected the 16-layer visual geometry group (VGG16) network as the primary network architecture. Then, we improved the VGG16 network and deleted several convolutional layers to reduce computation and memory consumption. Moreover, we added dilated convolution and atrous spatial pyramid pooling (ASPP) to make the network perform well in the surface crack identification of post-earthquake UAV images. We trained the proposed method using the data of the MS 7.4 Maduo earthquake and obtained a model that could automatically identify and draw small and irregular surface ruptures from high-resolution UAV images.
1. Introduction
Earthquakes directly manifest the latest activities of active faults, and strong earthquakes can produce tens to hundreds of kilometers of surface ruptures and various fault-displaced landforms [1]. Coseismic surface rupture zones refer to the surface rupture and deformation of the epicenter fault, which is characterized by a narrow band along the seismogenic fault [2]. The spatial distribution and deformation characteristics of coseismic rupture zones are the intuitive geomorphological manifestations of deep fault activity on the surface of the earth. They record earthquake ruptures and fault movements and reflect regional stress and crustal movement [3]. Therefore, investigating post-earthquake surface rupture zones is important for understanding the tectonics of seismogenic faults.
Sub-meter optical remote-sensing images (Quickbird, WorldView-2/3, aerial remote-sensing images, and unmanned aerial vehicle (UAV) images) can be used to identify the linear traces of steep seismic sills, most surface rupture basic units, and the plane combination characteristics of strike-slip earthquakes, making them an ideal information source for the rapid identification of post-earthquake surface ruptures [4]. In particular, UAV images with a centimeter-level spatial resolution can identify all types of surface ruptures at a centimeter scale. Furthermore, UAV photogrammetry technology applied in terrain surveys is low cost, highly safe, and easy to operate. The UAV data are easy to obtain and process. The structure from motion (SFM) algorithm of PhotoScan software can quickly process UAV photos into centimeter-level digital elevation models and orthophoto images. The results can meet the needs of the quantitative parameter extraction of coseismic surface ruptures and structure research in an earthquake emergency. Relevant scholars have used high-resolution UAV data to analyze giant coseismic surface rupture zones [5,6]. Their analysis results provide direct evidence for ascertaining the geometric, kinematic, and dynamic characteristics of the seismogenic fault. However, artificial visual interpretation and traditional image processing are the primary methods for finely interpreting high-precision UAV photos of earthquake surface ruptures. Manual visual interpretation is time-consuming and labor-intensive, and its recognition accuracy is highly dependent on the ability of experts. Ideally, traditional image processing methods, such as edge detection [7] and Gabor filtering [8], only have high detection accuracy if the crack has good continuity and high contrast. However, external disturbances can easily affect the results of traditional methods [9]. Unfortunately, the distribution of cracks and noise interference are complex and diverse, which leads to poor results in traditional crack detection algorithms.
The crack identification method based on deep learning does not require the pre-definition of crack features or image preprocessing but learns and automatically extracts features through samples to identify and extract cracks. Recently, deep learning has achieved great success in image processing and other fields, and several results have been achieved in combination with deep learning for crack identification (such as road crack detection [10], bridge inspection [11], house crack detection [12], and fault identification [13]). Hsieh and Tsai [14] divided the current crack identification and extraction algorithms into three categories based on deep learning: (1) image classification [15,16], (2) target detection [17], and (3) image segmentation [18]. However, neither the image classification algorithm nor the target detection algorithm can directly extract cracks from the image at the pixel level. The two methods must combine traditional image segmentation techniques, such as edge detection, to complete the pixel-level extraction of cracks. However, compared with traditional digital image processing technologies, these algorithms can remove most background noise in the image for better crack identification results. The image segmentation algorithm can directly extract cracks from the original image. In addition, this algorithm can generate pixel-level predictions of cracks in the image. In other words, each pixel in the image is classified as cracked or non-cracked.
This study applies the image segmentation algorithm based on deep learning to extract cracks from post-earthquake remote-sensing images. The fully convolutional network (FCN) model [19] is the most commonly used model for crack segmentation. FCN converts the fully connected layer into a convolutional layer on the basis of the VGG network, and an upsampling operation is performed on the feature map by transposed convolution. Then, the feature map is restored to the original size so that each pixel of the image is predicted and the crack image segmentation is realized. Liu et al. [20] applied the U-Net network to concrete crack detection; compared with the FCN network, the U-Net network can achieve higher accuracy through a smaller training set. U-net is an improved image segmentation network based on FCN. The network adopts a symmetric structure of encoding–decoding and uses skip connections to fuse low-level semantic features and high-level semantic features. U-Net greatly improves the segmentation accuracy of the model and is widely used in medical image segmentation [21]. DeepCrack [22] is a new model that utilizes a deep hierarchical neural network for crack segmentation at the pixel level. The DeepCrack model uses the first 13 layers, which correspond to the first 13 layers in VGG-16, but the fully connected layers and fifth pooling layer are removed to achieve meaningful side-output with different scales and decreased memory requirements and computation time.
Earthquake surface rupture identification based on deep learning is a challenging issue.
- (1)
- Compared with crack identification in roads, houses, and concrete buildings, the background of post-surface earthquake surface rupture images is more complex. The surface ruptures of the Maduo MS 7.4 earthquake are distributed in different geographic regions, such as mountains, grasslands, swamps, alluvial fans, and dunes.
- (2)
- The characteristics of post-earthquake surface ruptures have complex shapes and changeable directions, which commonly have oblique, arc-shaped, and cluster-shaped distributions. In addition, post-earthquake surface ruptures can appear in any position and direction, making them difficult to distinguish.
This study applies the deep learning semantic segmentation method to segment the remote-sensing images of earthquake surface ruptures. In addition, we create a series of improvements to the VGG16 model [23] based on the characteristics of post-earthquake surface rupture images to improve the extraction accuracy of surface ruptures in the remote-sensing images. Based on the proposed deep learning method, we could automatically identify and draw small and irregular surface ruptures from high-resolution UAV images to achieve the high-efficiency, high-precision, and intelligent detection of post-earthquake surface rupture damage.
2. Data
2.1. Study Area
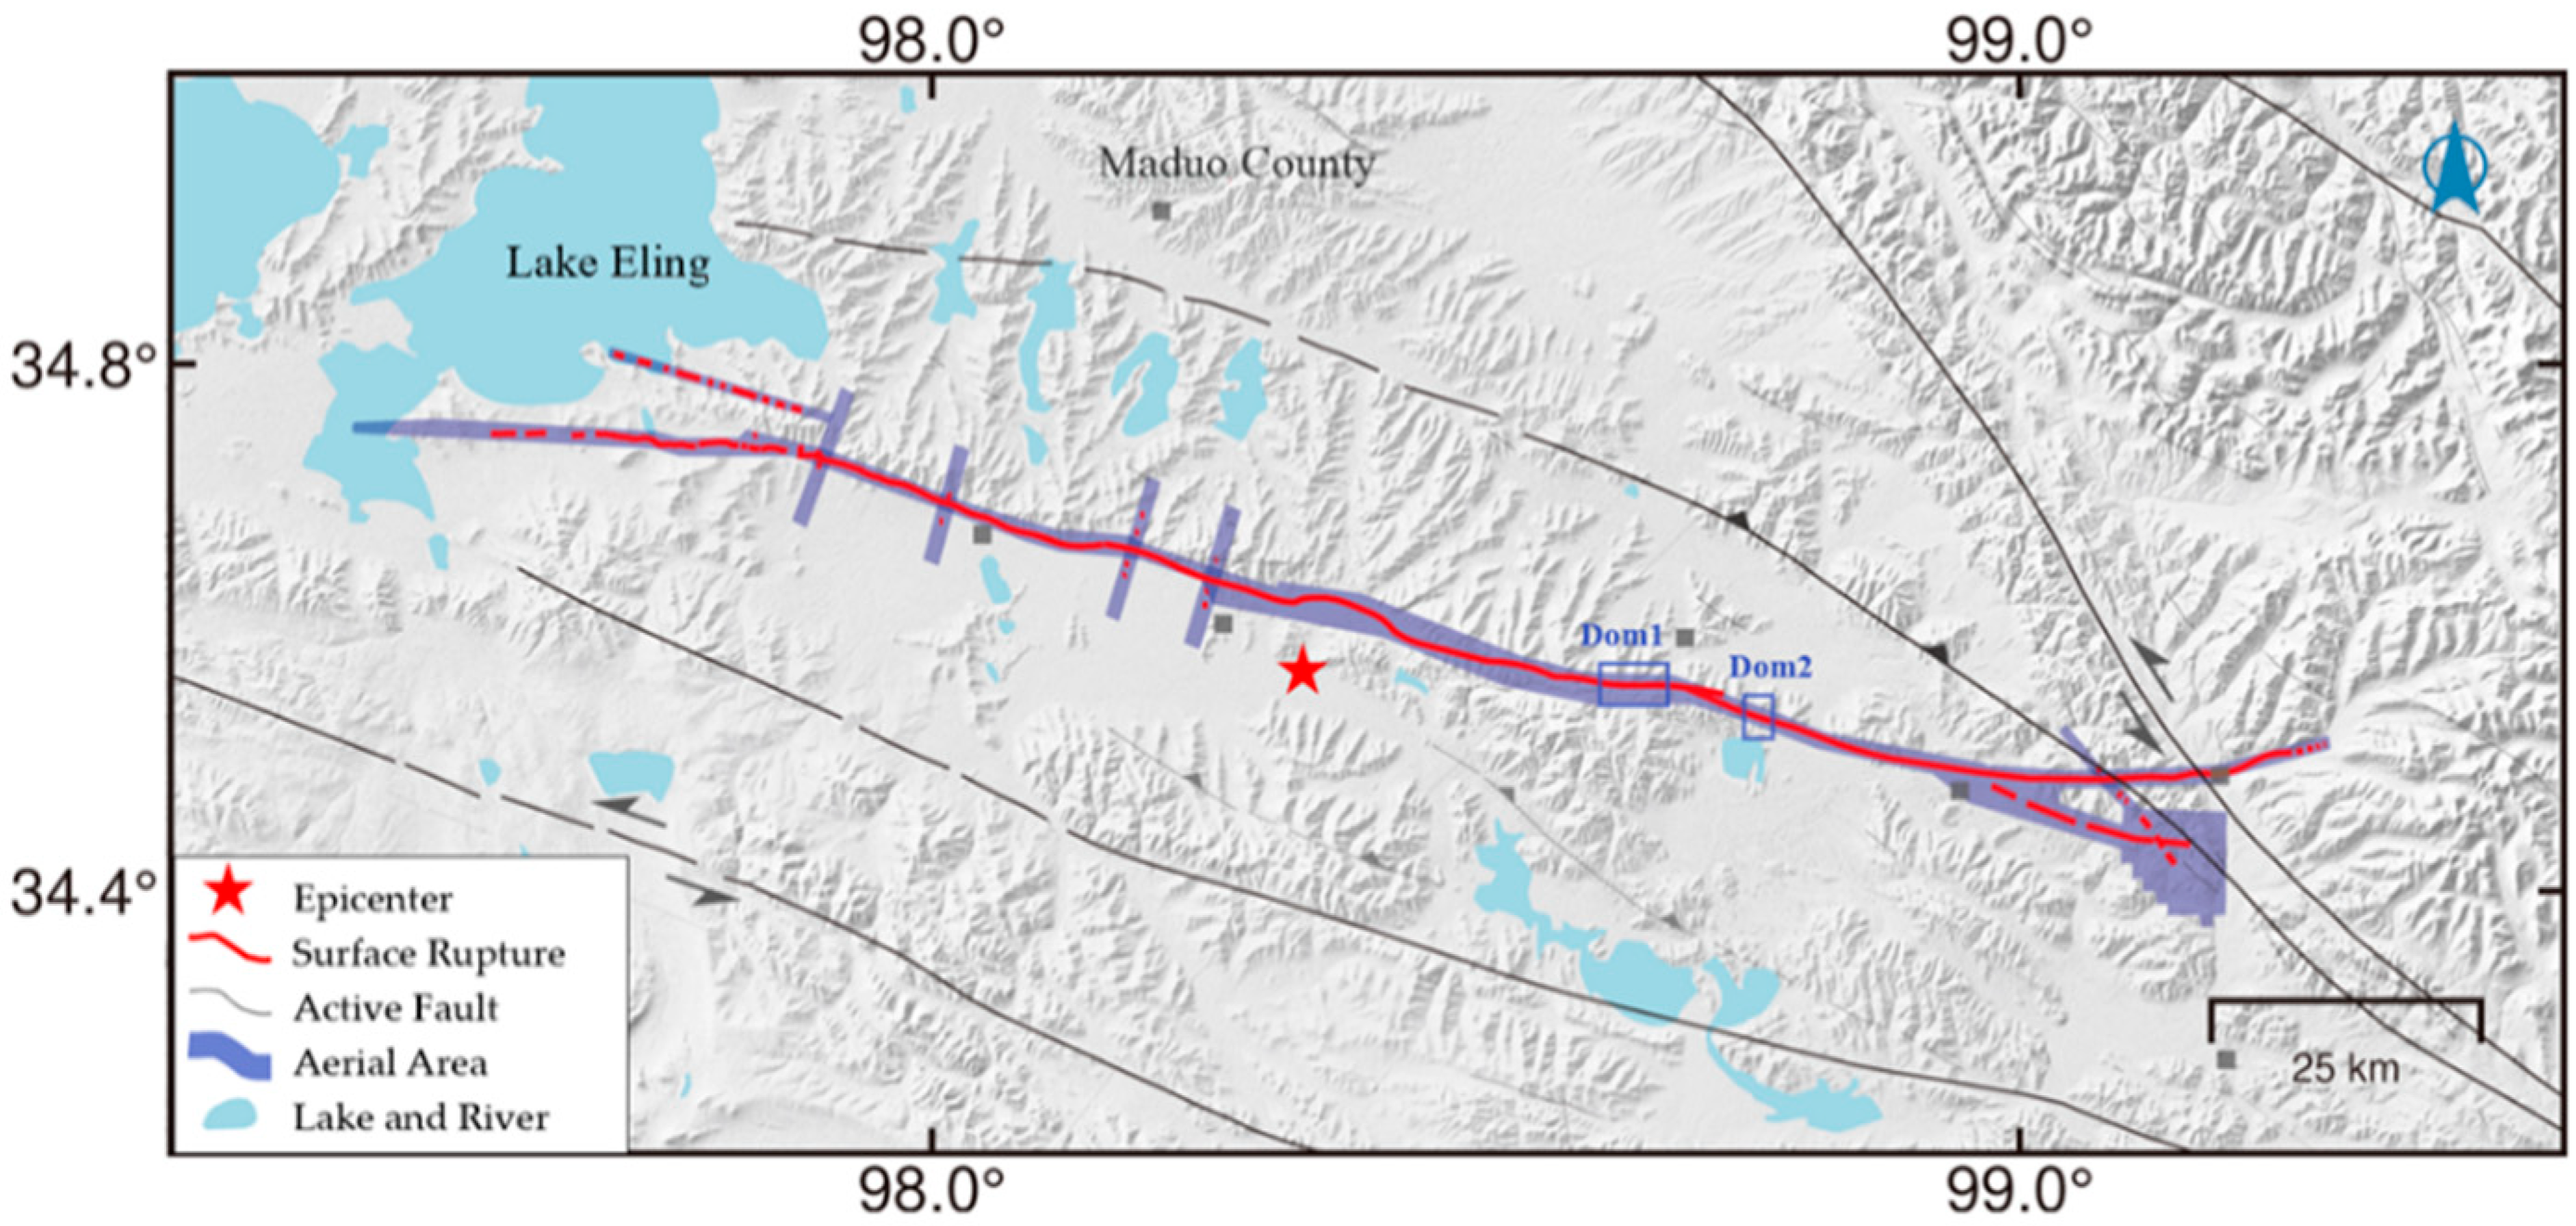
An MS 7.4 earthquake occurred in Maduo County, Guoluo Tibetan Autonomous Prefecture, Qinghai Province, on 22 May 2021. This earthquake ruptured along the southern branch of the known East Kunlun Fault Zone and the Jiangcuo fault [24].
The coseismic surface ruptures were an oblique combination of tension, tension-shear, shear, compression, bulge, extrusion ridges, and goose-shaped tension fissures (Figure 1). These ruptures were distributed in mountainous areas, grasslands, swamps, alluvial fans, and several dunes at an altitude of 4200–4600 m (Figure 2).
2.2. UAV Images and Digital Orthophoto Map (DOM)
After the Maduo MS 7.4 earthquake on 22 May 2021, our research team used medium-sized hybrid-wing and small multi-rotor UAVs to conduct photogrammetry of the post-earthquake surface rupture (Figure 1). We took the aerial photos using a CW-15 DAPENG UAV, which carries a 61-megapixel CA103 ortho camera. CWCommander application software is used for flight planning and monitoring. In order to improve data accuracy, we set up the RTK ground base station to calibrate the UAV Pos attitude data. Using PhotoScan software, we obtained DOMs by quickly stitching the UAV photogrammetry. The quality of UAV photography images depends on external conditions, such as the terrain of the photography area, wind directions, flight altitudes, the overlap of adjacent photos, and the number of photos in a specific area. These factors result in different resolutions of UAV images, especially on a high plateau with undulating and complex terrain and changeable weather [25]. Furthermore, we chose the densest processing for point cloud generation to obtain high-accuracy DOMs. As a result, the final DOM resolution of the entire ruptured segment was 2–7 cm/pix, and the resolution of most images was 3–5 cm/pix. The centimeter-level high-resolution DOM could clearly show the spatial distribution of the coseismic surface rupture zone, based on which the surface rupture can be accurately interpreted. Figure 3 shows the image interpretation and its corresponding field situation.
2.3. Machine Learning Samples
Machine learning samples are the basis of the deep learning model, and their quantity and quality can directly affect the training of the deep learning model. The model learns the target features through input samples and adjusts parameters in real-time to match the input samples during the training process. How well the model learns the features is directly related to its overall performance. There are currently no relevant public datasets for identifying earthquake surface rupture targets; therefore, collecting relevant samples and making sample sets of earthquake surface ruptures before detection is necessary.
Based on the high-resolution UAV images and field survey data, we used ArcGIS software to mark the fractured area manually. Unfortunately, directly loading images to the deep learning network would cause memory overflow; thus, the image must be cropped into patches before inputting them into the network. The repetition rate of the cropping sliding window was 0.1, and the final image block size was 256 × 256.
Manually labeled samples are limited, and the post-earthquake rupture targets of the image are small compared to unbroken areas. As a result, we could only acquire a limited number of labeled rupture samples. For deep learning models, too few training samples can lead to model overfitting. Therefore, increasing the number of samples through sample enhancement is necessary to avoid such situations. We applied methods to augment the data, such as image rotation, image flip, color transformation, and image stretching [26].
3. Methods
3.1. Deep Learning Network Model
After preparing the sample data, a suitable deep learning network must be built for identifying surface cracks in high-resolution UAV images. The purpose is to identify tiny linear targets, indicating surface cracks, using the trained deep learning model in the UAV image.
Therefore, the receptive field should be increased to obtain more image features and combine multi-scale information to achieve better segmentation results when designing the network. A good network structure can achieve qualified results with a small number of samples if we balance the cost of manual interpretation of the samples and the timeliness of the post-earthquake disaster assessment.
This study selected the 16-layer visual geometry group (VGG16) network as the primary network architecture. Then, we improved and optimized the network, constructing a deep learning semantic segmentation network that can directly realize the end-to-end recognition of surface cracks in high-resolution UAV images. The VGG network series is a very mature network structure that has shown outstanding results in image classification and object detection tasks [27].
We improved the VGG16 network and deleted several convolutional layers to reduce computation and memory consumption. Moreover, we added dilated convolution and spatial pyramid pooling (ASPP) to make the network perform well in surface crack identification. The network architecture is shown in Figure 4. The comparison of the number of parameters and Giga Floating Point Operations (GFLOPs) is shown in Table 1. After the improvement, our network only contained about 2.54 million parameters and performed 6.4 GFLOPs.
The following improvements were made based on the VGG16 network architecture. First, the network was transformed into an FCN to achieve end-to-end semantic segmentation. Then, the step of the 3 × 3 convolution kernel was set as 1 in the front part of the entire network. The next convolutional layer consisted of convolution kernels with a size of 1 × 1 and a step of 1.
The filter size of the pooling layer was 2 × 2, and the step of the Pool1 layer was 2. However, to achieve dilated convolution, we set layers Pool2 and Pool3 (step of 1) and adopt the rectified linear activation function (ReLU). The first and second layers of the entire network still used standard convolution.
For a larger receptive field in the extracted feature map, the third convolutional layer used dilated convolution. In addition, to alleviate the grid effect caused by dilated convolution, the network adopted a hybrid dilated convolution (HDC) design [28].
To identify small and large objects in the crack identification process, we designed the dilation rate to increase from low to high and follow the rules proposed by Wang et al. [28]. Therefore, we set dilation rates of [1,3,5] for each layer. Then, to implement an FCN, we applied the convolution kernels with a size of 1 × 1 and convolutions with a step size of 1 for the fourth, fifth, and sixth layers of the original fully connected layer.
We used an atrous spatial pyramid pooling (ASPP) module to achieve multi-scale fusion and obtain more information [29] (Figure 5). In the FC4 layer, four sets of different dilated convolutions with dilation rates of 6, 12, 18, and 24 were used, respectively, the FC5 layers and FC6 layers were connected, and the fusion of pixel addition was performed.
Finally, the SoftMax function was applied to obtain the predicted probability label map. Good results can be obtained by direct bilinear upsampling on the probability map. The label class determines the segmentation results of cracks in high-resolution drone images with the highest SoftMax probability at each pixel.
3.2. Training Methods of Models
After building the model architecture, we set the model initialization method, activation function, loss function, and parameter update method. During the training process, the Xavier method was applied to initialize all the training values; downsampling was performed by max pooling for the pooling layer, and the ReLU activation function was used.
In addition, the dropout method was used to reduce overfitting in the neural network. Each class of the SoftMax loss function can output a normalized probability in the last layer of the network. Therefore, we classified the classes by their probabilities and restored the classification results to the original image size through bilinear upsampling. We used the adaptive moment estimation (Adam) optimizer to train our network.
For each pixel in the input image of the high-resolution UAV image, the output of the corresponding training model is expressed as the posterior probability that the pixel belongs to the crack. Our crack identification was a pixel binary classification task performed on high-resolution UAV images. Typically, the binary segmentation task for common images is to use a binary cross-entropy loss function, as shown in Equation (1), where N denotes the number of pixels in the input image. The term represents the true binary labels and represents the prediction probabilities computed from the SoftMax function.
For most classification problems, the deep learning samples have a balanced distribution and apply regular cross-entropy loss functions. However, crack identification in high-resolution UAV images is a binary classification issue, and the number of cracks and non-cracks is highly unbalanced, i.e., there are significantly more non-crack samples than crack samples. Zero prediction is a good solution for loss function convergence in crack segmentation problems. Therefore, by applying the regular cross-entropy loss function, the network would quickly converge in the wrong direction and make many zero predictions. To solve the problem of unbalanced samples, we weighted the loss function and used the weighted cross-entropy loss [30] function, which can be expressed as:
where α is the ratio of non-cracks to the samples in the training data; the network model can converge accurately by adjusting the weights in the loss function.
4. Results and Analysis
After determining the deep learning network and training method, we used the data from the study area to train and test the network. The experimental test platform was a Dell Precision T3610 motherboard with Intel(R) Xeon(R) CPU E5-1660 [email protected] GHz (12 CPUs), ~3.7 GHz, and an NVIDIA Quadro K600 graphics card. The environment for deep learning was built using the Google deep learning framework TensorFlow with a primary programming language, Python. In addition, GPU acceleration was used to perform high-performance computing.
The experimental data of two regions, maduoDom1 and maduoDom2, were used for testing. As shown in Figure 6, the red lines are artificially marked surface cracks. In the maduoDom1 data, we cropped 1155 high-resolution UAV images and removed the data without cracks. Finally, we extracted 507 images with cracks, randomly selected 480 UAV images with crack labels for training, and used the remaining 27 UAV images for testing. Similarly, for the maduoDom2 data, we extracted 176 images with cracks from the cropped 348 high-resolution UAV images and randomly selected 150 and 26 UAV images and their crack labels to train and test the model. While training the crack recognition model with two datasets, we set the learning rate to 0.001. For the maduoDom1 array, 12 blocks were selected as a batch, and the entire training data set was trained for 26 epochs. For the maduoDom2 data, ten blocks were selected as a batch, and 18 training epochs were performed. The entire model training process randomly selected training images to test the results after several epochs.
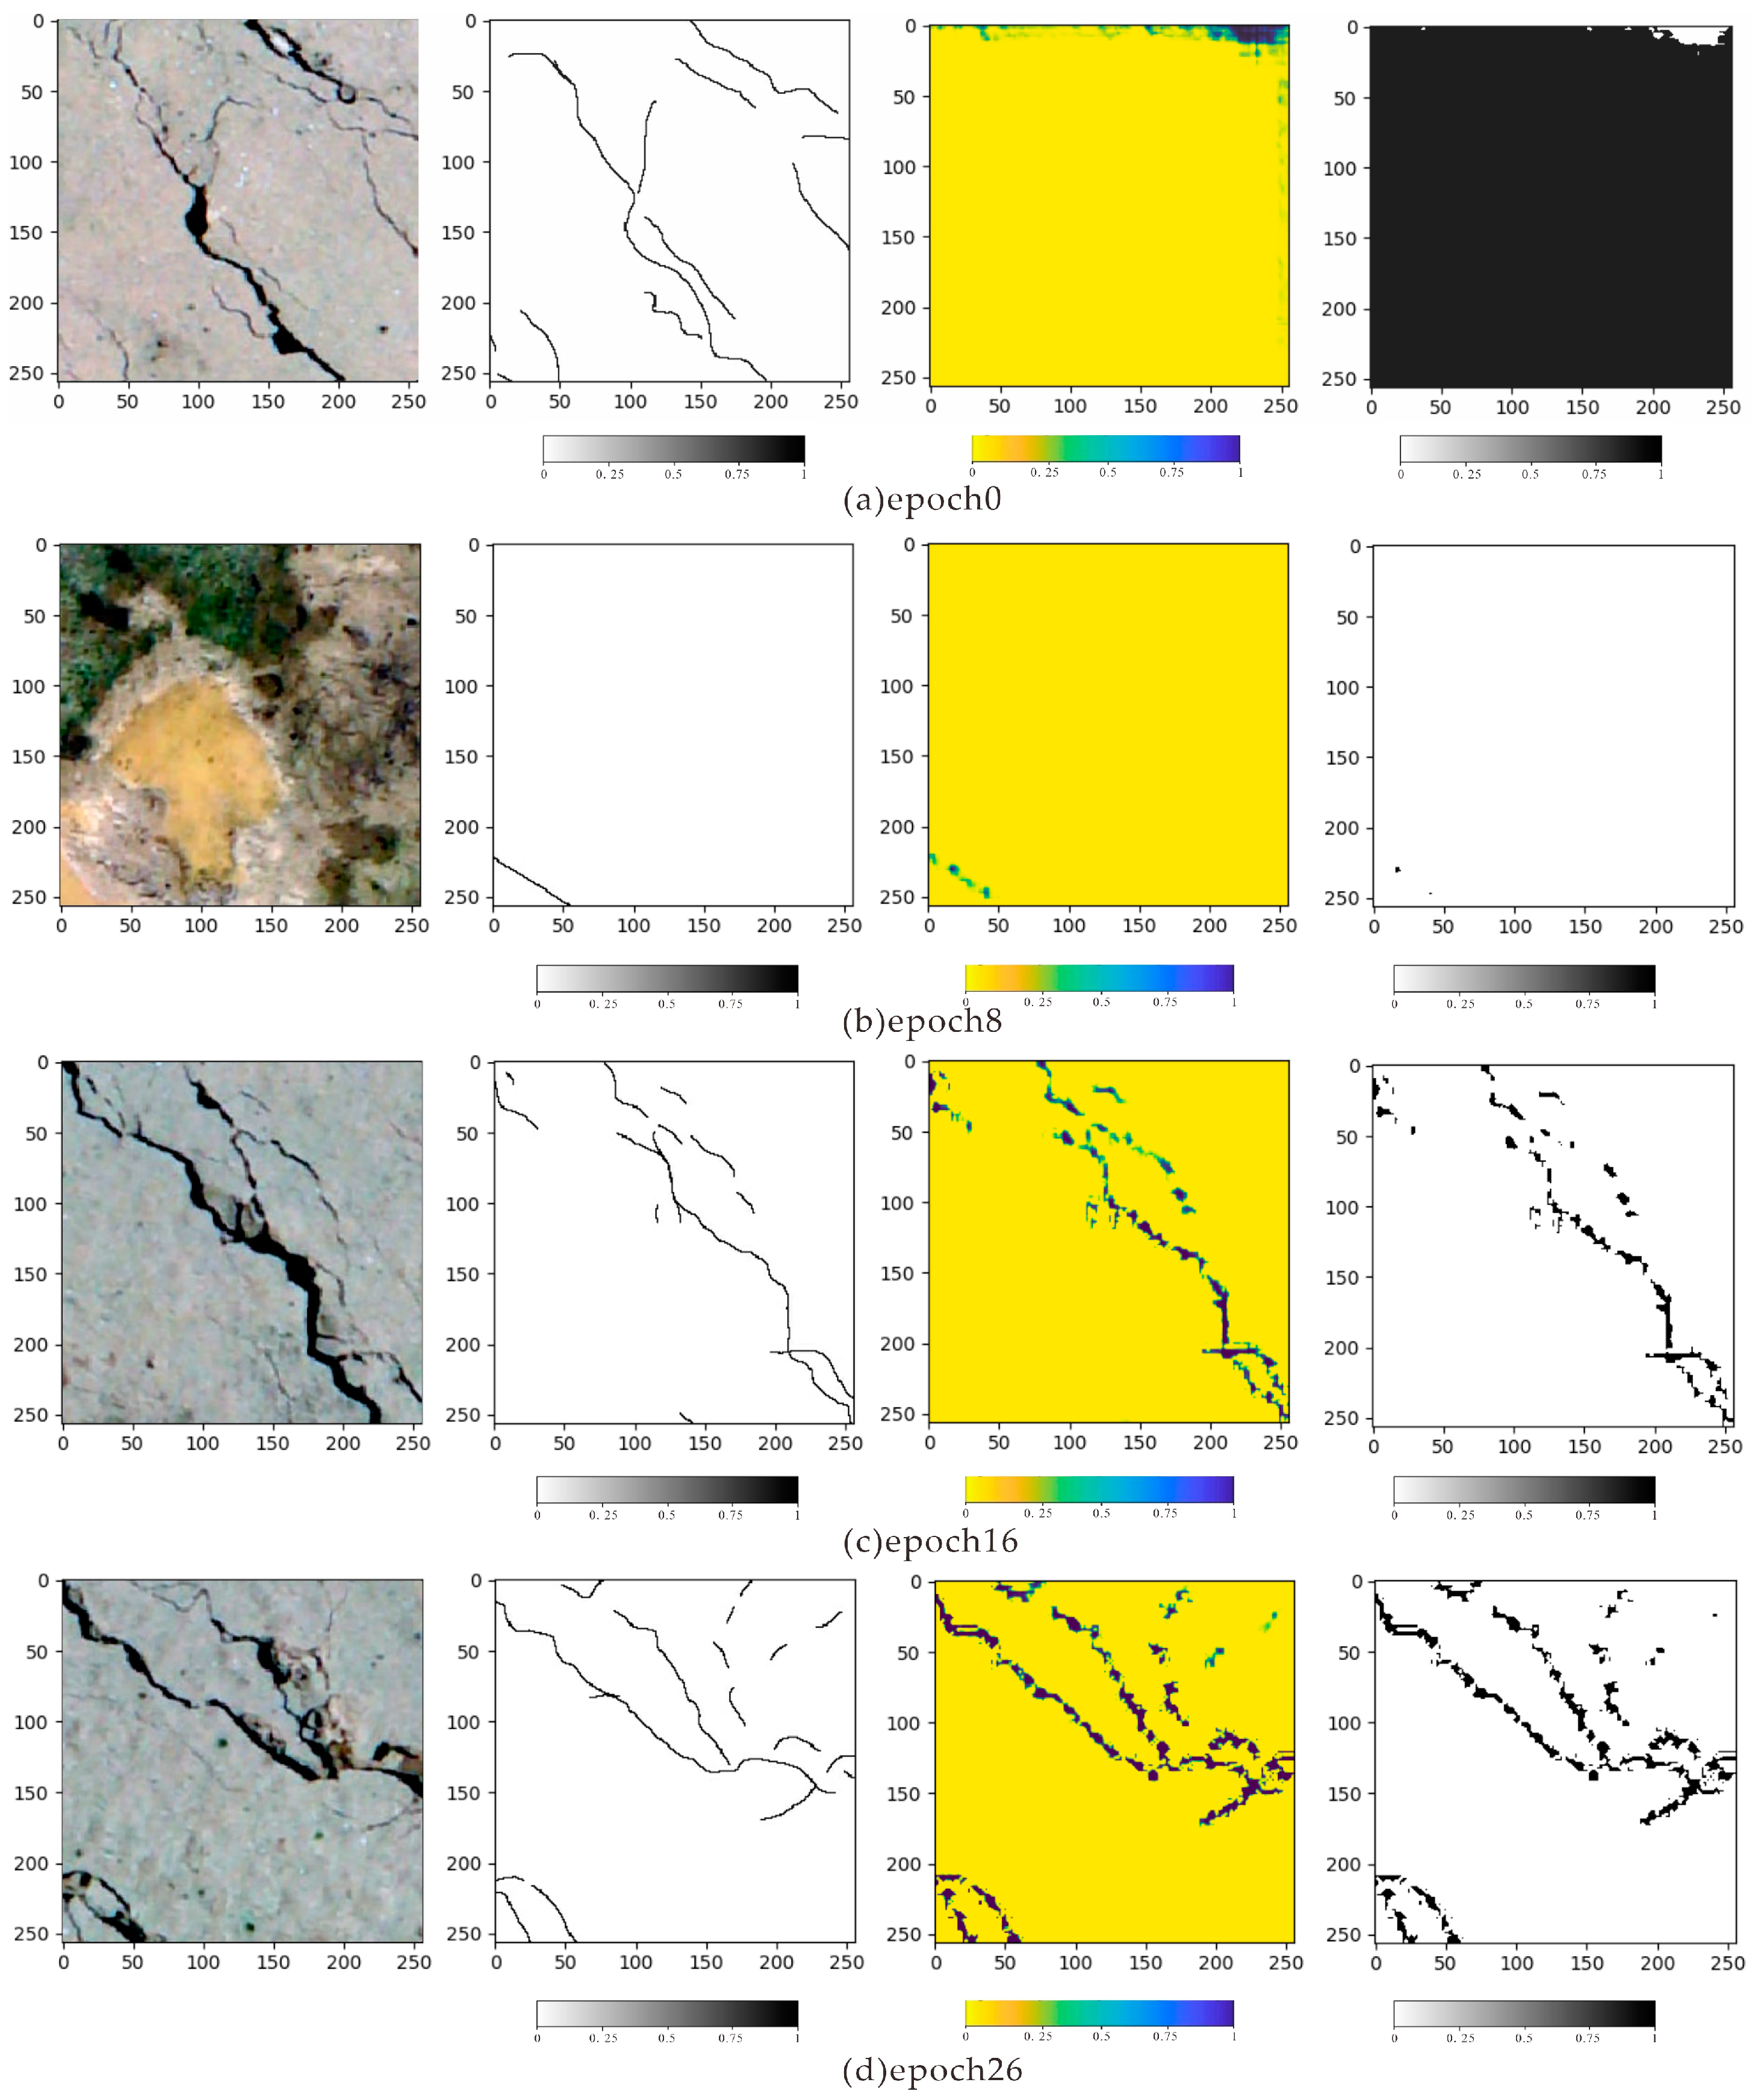
The training process of the maduoDom1 data is shown in Figure 7. Each row depicts a high-resolution UAV image, a label, the current prediction crack probability, and the prediction results. Figure 7a is a comparison of the predicted results after all learning parameters are initialized by Xavier. Figure 7b shows the crack identification result after the eighth epoch training. Here, the crack location has been identified, but many parts are still missing in the result. Figure 7c shows the crack identification results after 16 epochs. Most cracks could be identified, and the missing parts gradually became smaller. Figure 7d shows the crack identification result after the 26 epochs, which could accurately identify the crack location and is similar to the actual situation.
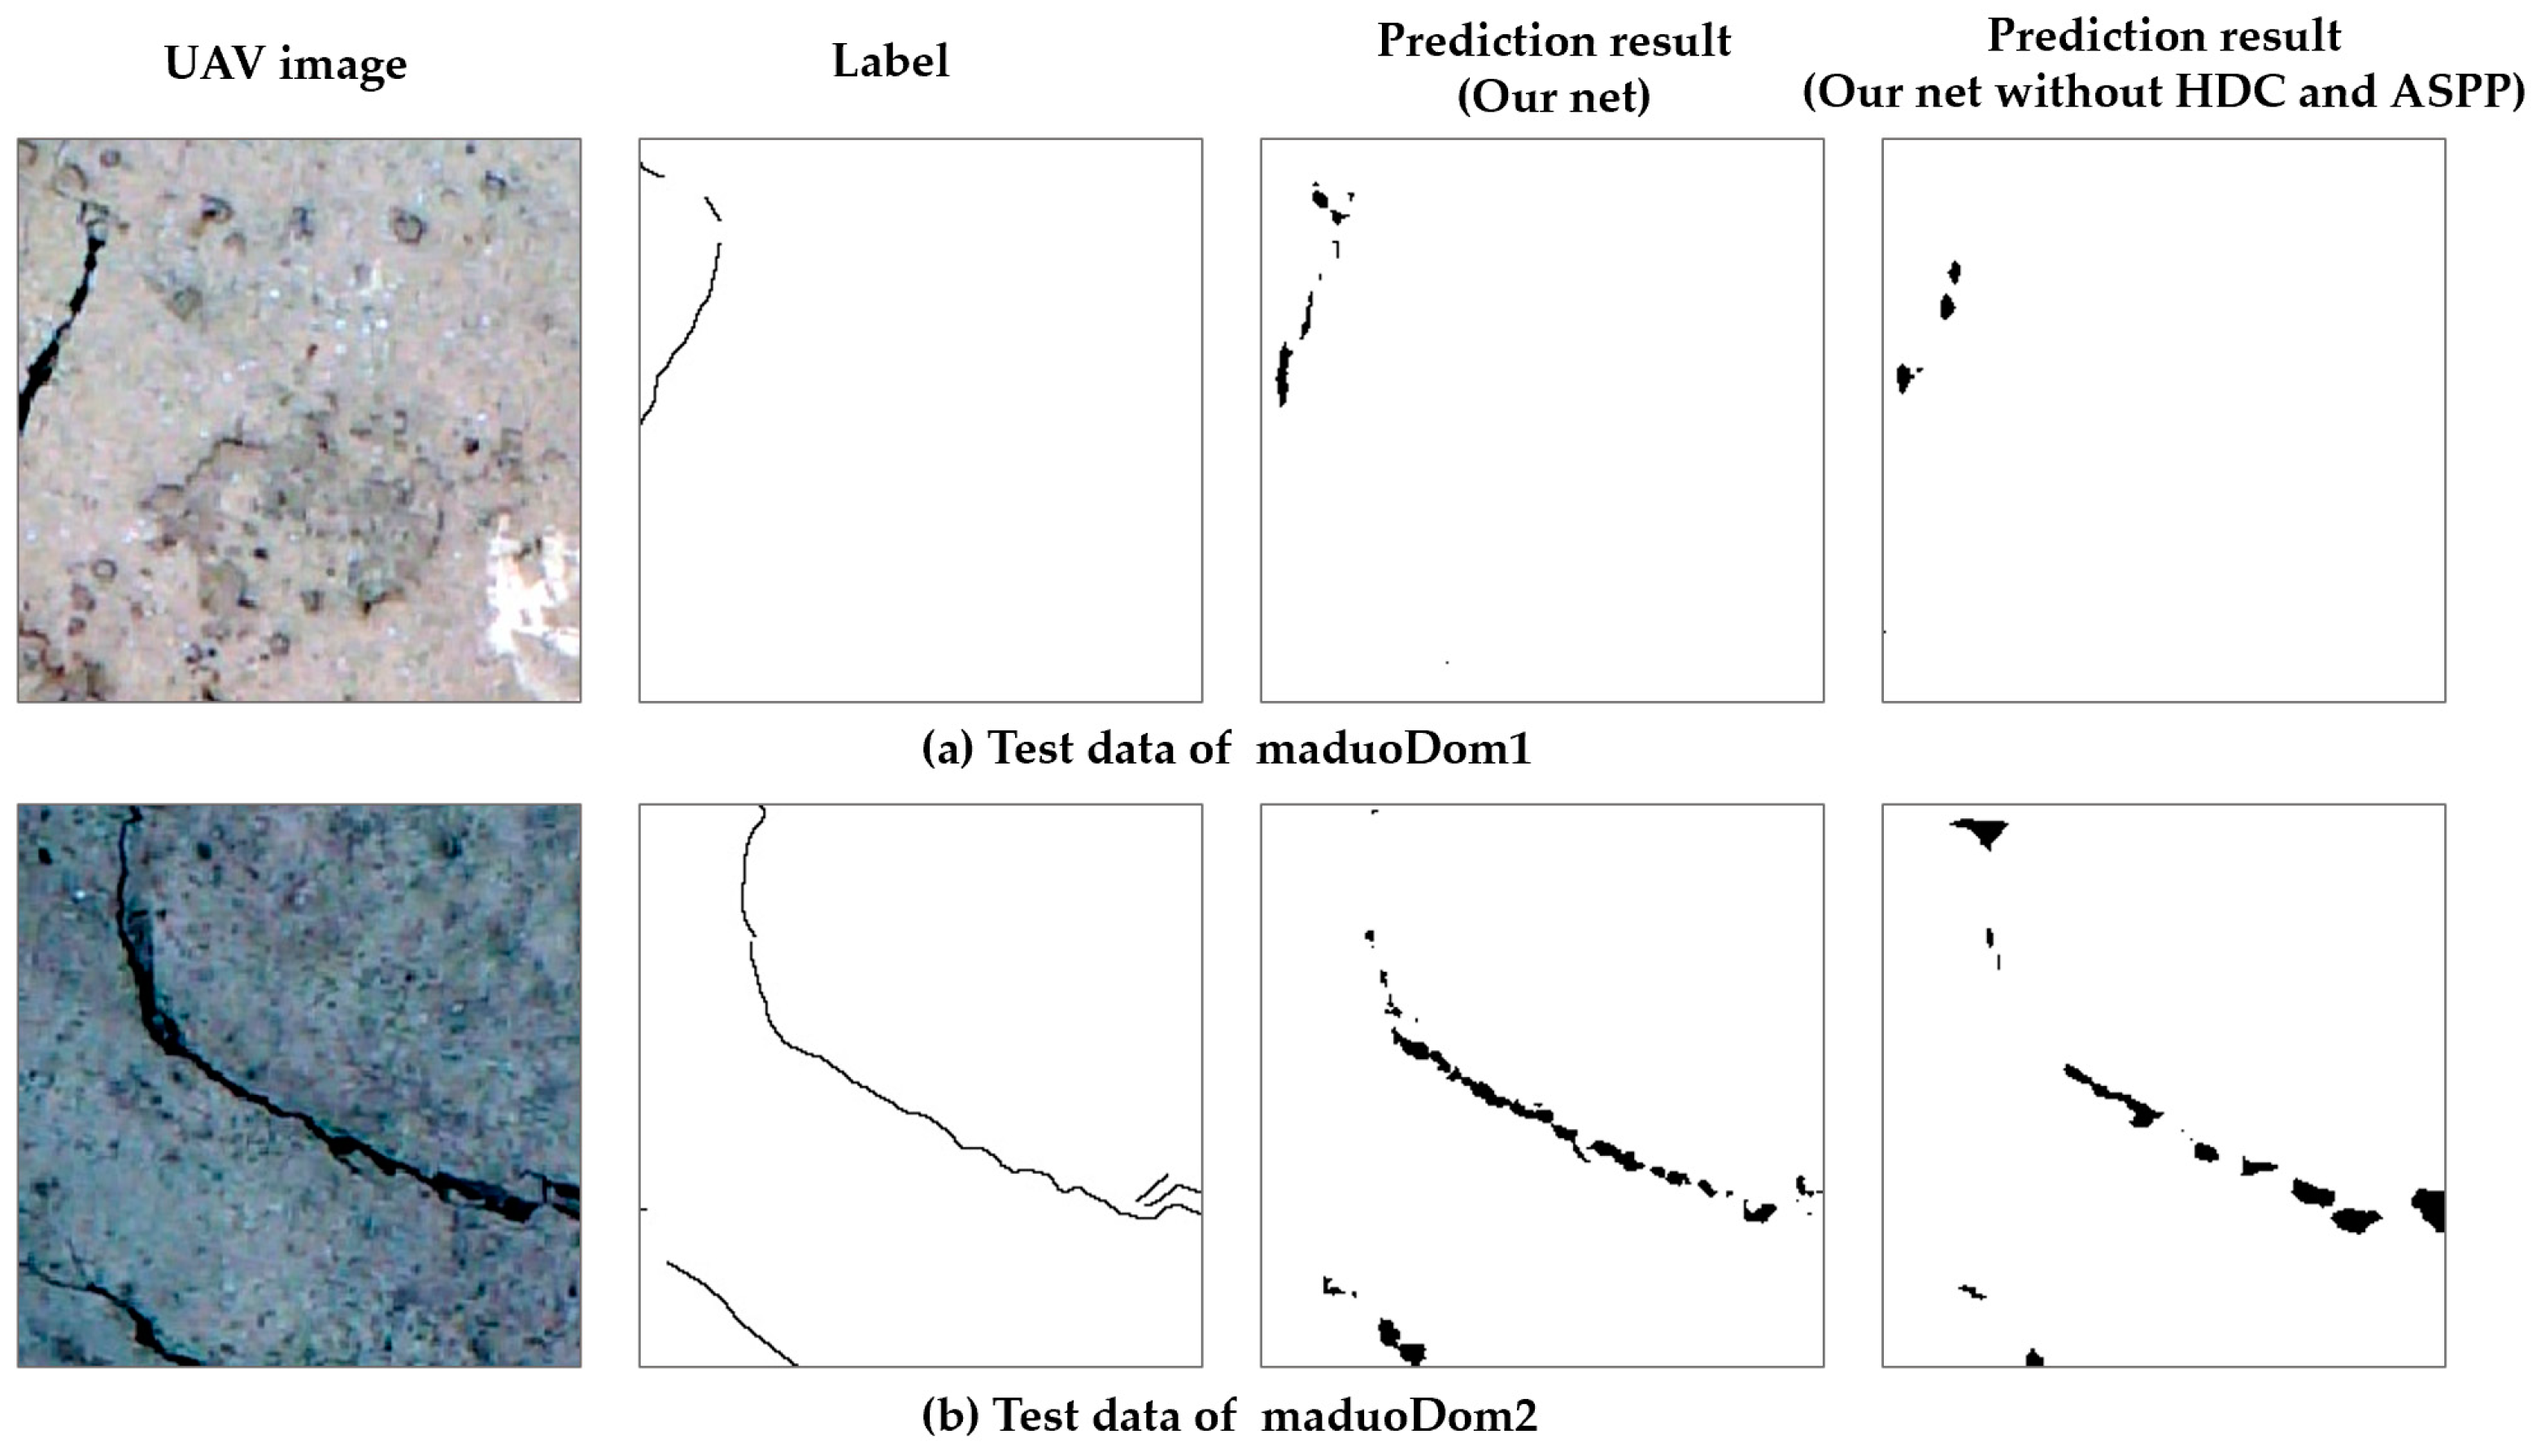
After training, we used the trained models to predict cracks in the two datasets and test the crack identification effect of the model. In addition, we randomly selected two image identification results from the prediction results for comparison (Figure 8). Unfortunately, the crack details were still lacking, and the results were not entirely consistent with the original labels. The trained model can, however, accurately determine the location of the cracks, and the required computational time is very short (a high-resolution crack prediction could be made within 1 s). In addition, we quantitatively evaluated the recognition results of the two datasets (Table 2). The commonly used evaluation indicators for deep learning semantic segmentation, such as evaluation index accuracy rate, F1 value, and average intersection ratio, were calculated. Compared with the original labels in the test data, the trained model had a reasonable accuracy rate of more than 97%. Furthermore, the F1 value exceeded 0.51, and the mIoU value exceeded 0.50. These evaluation results showed that the deep learning model obtained by training could perform well in the crack identification problem. In order to compare the differences in the recognition results of different network structures, we constructed a model where the HDC and ASPP structures were removed, the Conv3 layer and FC4 layer were replaced by ordinary convolution, and other structures remained unchanged. The model was trained to identify cracks under the same conditions. The comparison results are shown in Figure 8, where it can be seen that our network can predict more effective crack information than the network without HDC and ASPP. We also drew the ROC curves of the two models in the maduoDom1 and maduoDom2 training sets and test sets, respectively, as shown in Figure 9. We can see that our network performance is better.
Deep learning can accurately identify the crack areas in high-resolution UAV data. Nevertheless, small cracks remain difficult to identify. Therefore, we attempted to study whether the size of the crack area impacts the identification ability of the model. We marked the cracks with bold lines to increase the crack area and trained the deep learning model with new samples. For maduoDom1 and maduoDom2, the processing results using the bold-marked cracks are shown in Figure 10.
First, we obtained 533 and 187 UAV high-resolution aerial images with bold labels in the maduoDom1 and maduoDom2 data, respectively. Then, we randomly selected 500 samples from the bold-labeled maduoDom1 data for training and 33 images for testing. We also randomly selected 160 samples for training and 27 images for testing in the bold-labeled maduoDom2 data.
After the labels were changed to bold labels, the constructed semantic segmentation network was trained with the two processed datasets, and the optimal prediction model was obtained based on the loss value. The model converged faster during training with bold crack labels than without. After obtaining the optimal model, we performed crack identification and prediction for the two models in the two datasets. One of the identification results is shown in Figure 11. The recognition effect was significantly improved: both the crack position and the fitness were extremely accurate. Furthermore, the cracks predicted by the model were similar to the labels, indicating that the bold labeling of crack samples is conducive to improving the crack identification ability of the model. Similarly, we quantitatively evaluated the prediction effect of the two datasets (Table 2). The accuracy of the evaluation results in the test set exceeded 0.86. Compared with the original model trained with non-bold labels, the model trained with the bold crack labels displayed lower accuracy but better fitness of the cracks. In addition, the F1 and mIoU values in the test set were greatly improved because the crack area increases with the bold labels and the model can identify more cracks. Similarly, for the bold-labeled data, we also trained the model that removed HDC and ASPP structures from the network we improved. The prediction results of the different networks are shown in Figure 11. Our network structure trained on bold-labeled data still has good crack recognition results.
5. Conclusions
Identifying and analyzing coseismic surface ruptures based on UAV images will have problems such as high calculation costs, heavy workloads, intense subjectivity, and sensitivity to noise. Taking the data of the MS 7.4 Maduo earthquake as an example, we proposed a deep learning method to identify cracks and constructed a deep learning semantic segmentation network. We trained the deep learning model using the data from the study area and obtained a model that could identify cracks in UAV images, with an excellent recognition effect in the test experiments.
Based on our results, we concluded that:
- (1)
- Our deep learning method could accurately and quickly identify cracks in high-precision UAV images. Although there were a number of false and missed identifications, it efficiently mapped the major surface ruptures produced by the Maduo earthquake using a relatively small number of labeled samples.
- (2)
- The expansion processing of cracks could improve the crack identification effect of the deep learning method.
- (3)
- The deep learning method has great potential in identifying cracks from high-precision UAV aerial surveys and can give accurate results of crack identification from sufficient data after appropriate training.
Author Contributions
Data curation, X.C. and X.L.; Formal analysis, X.C.; Methodology, X.C. and G.H.; Software, G.H.; Writing—review and editing, X.C. All authors have read and agreed to the published version of the manuscript.
Funding
This work was supported by the Science for Earthquake Resilience, China Earthquake Administration (Grant No. XH22003C), and the PI Project of Southern Marine Science and Engineering Guangdong Laboratory (Guangzhou) (Grant No. GML2020GD0802).
Institutional Review Board Statement
Not applicable.
Informed Consent Statement
Not applicable.
Data Availability Statement
Not applicable.
Acknowledgments
We gratefully thank Jing Liu-Zeng at the Institute of Surface-Earth System Science, Tianjin University, for providing the UAV image data.
Conflicts of Interest
The authors declare no conflict of interest.
References
- Biasi, G.; Wesnousky, S. Steps and gaps in ground ruptures: Empirical bounds on rupture propagation. Bull. Seismol. Soc. Am. 2016, 106, 1110–1124. [Google Scholar] [CrossRef]
- Wells, D.L.; Coppersmith, K.J. New empirical relationships among magnitude, rupture length, rupture width, rupture area, and surface displacement. Bull. Seismol. Soc. Am. 1994, 84, 974–1002. [Google Scholar] [CrossRef]
- Dolan, J.F.; Haravitch, B.D. How well do surface slip measurements track slip at depth in large strike-slip earthquakes? The importance of fault structural maturity in controlling on-fault slip versus off-fault surface deformation. Earth Planet. Sci. Lett. 2014, 388, 38–47. [Google Scholar] [CrossRef] [Green Version]
- Wei, Y.M.; Li, J.N.; Chen, Y.; Gao, J. Research on optical remote sensing characteristics of coseismic surface rupture of different types of seismogenic faults. Quat. Sci. 2021, 41, 1513–1531. [Google Scholar] [CrossRef]
- Yuan, Z.; Li, T.; Su, P.; Sun, H.; Ha, G.; Guo, P.; Thompson, J.J. Large Surface—Rupture Gaps and Low Surface Fault Slip of the 2021 Mw 7.4 Maduo Earthquake Along a Low—Activity Strike—Slip Fault, Tibetan Plateau. Geophys. Res. Lett. 2022, 49, e2021GL096874. [Google Scholar] [CrossRef]
- Nikolakopoulos, K.G.; Koukouvelas, I. Post-earthquake response based on UAV, GNSS and TLS technologies: A recent example from Elassona earthquakes in Thessaly, Central Greece. In Earth Resources and Environmental Remote Sensing/GIS Applications XII; SPIE: Bellingham, WA, USA, 2021. [Google Scholar] [CrossRef]
- Canny, J. A computational approach to edge detection. IEEE Trans. Pattern Anal. Mach. Intell. 1986, 8, 679–698. [Google Scholar] [CrossRef]
- Movellan, J.R. Tutorial on Gabor filters. Open Source Doc. 2002, 40, 1–23. Available online: https://inc.ucsd.edu/mplab/75/media//gabor.pdf (accessed on 17 October 2022).
- Liu, Y.F.; Fan, J.S.; Nie, J.G.; Kong, S.Y.; Qi, Y. Review and prospect of digital-image-based crack detection of structure surface. China Civ. Eng. J. 2021, 54, 79–98. [Google Scholar] [CrossRef]
- Li, Y.X.; Ma, J.M.; Zhao, Z.Y.; Shi, G. A Novel Approach for UAV Image Crack Detection. Sensors 2022, 22, 3305. [Google Scholar] [CrossRef]
- Ayele, Y.Z.; Aliyari, M.; Griffiths, D.; Droguett, E.L. Automatic crack segmentation for UAV-assisted bridge inspection. Energies 2020, 13, 6250. [Google Scholar] [CrossRef]
- Silva, W.D.; Lucena, D.D. Concrete Cracks Detection Based on Deep Learning Image Classification. Proceedings 2018, 2, 489. [Google Scholar] [CrossRef] [Green Version]
- Yan, Z.; Zhang, Z.; Liu, S.Y. Improving performance of seismic fault detection by fine-tuning the convolutional neural network pre-trained with synthetic samples. Energies 2021, 14, 3650. [Google Scholar] [CrossRef]
- Hsieh, Y.A.; Tsai, Y.J. Machine learning for crack detection: Review and model performance comparison. J. Comput. Civ. Eng. 2020, 34, 04020038. [Google Scholar] [CrossRef]
- Kim, B.; Cho, S. Automated vision-based detection of cracks on concrete surfaces using a deep learning technique. Sensors 2018, 18, 3452. [Google Scholar] [CrossRef] [PubMed] [Green Version]
- Li, B.X.; Wang, K.C.P.; Zhang, A.; Yang, E.H.; Wang, G.L. Automatic classification of pavement crack using deep convolutional neural network. Int. J. Pavement Eng. 2020, 21, 457–463. [Google Scholar] [CrossRef]
- Mandal, V.; Uong, L.; Yaw, A.G. Automated road crack detection using deep convolutional neural networks. In Proceedings of the 2018 IEEE International Conference on Big Data (Big Data), Seattle, WA, USA, 10–13 December 2018. [Google Scholar] [CrossRef]
- Tabernik, D.; Šela, S.; Skvarč, J.; Skočaj, D. Segmentation-based deep-learning approach for surface-defect detection. J. Intell. Manuf. 2020, 31, 759–776. [Google Scholar] [CrossRef] [Green Version]
- Long, J.; Shelhamer, E.; Darrell, T. Fully convolutional networks for semantic segmentation. In Proceedings of the 2015 IEEE Conference on Computer Vision and Pattern Recognition (CVPR), Boston, MA, USA, 7–12 June 2015. [Google Scholar] [CrossRef] [Green Version]
- Liu, Z.Q.; Cao, Y.W.; Wang, Y.Z.; Wang, W. Computer vision-based concrete crack detection using U-net fully convolutional networks. Autom. Constr. 2019, 104, 129–139. [Google Scholar] [CrossRef]
- Ronneberger, O.; Fischer, P.; Brox, T. U-Net: Convolutional Networks for Biomedical Image Segmentation. In Proceedings of the Medical Image Computing and Computer-MICCAI 2015, Munich, Germany, 5–9 October 2015. [Google Scholar] [CrossRef]
- Liu, Y.H.; Yao, J.; Lu, X.H.; Xie, R.P.; Li, L. DeepCrack: A deep hierarchical feature learning architecture for crack segmentation. Neurocomputing 2019, 338, 139–153. [Google Scholar] [CrossRef]
- Simonyan, K.; Zisserman, A. Very deep convolutional networks for large-scale image recognition. arXiv 2015, arXiv:1409.1556. [Google Scholar] [CrossRef]
- Gai, H.L.; Yao, S.H.; Yang, L.P.; Kang, T.B.; Yin, X.; Chen, T.; Li, X. Characteristics and causes of coseismic surface rupture triggered by the “5.22” MS 7.4 Earthquake in Maduo, Qinghai, and their significance. J. Geomech. 2021, 27, 899–912. [Google Scholar] [CrossRef]
- Wang, W.X.; Shao, Y.X.; Yao, W.Q.; Liu, J.; Han, L.F.; Liu, X.L.; Gao, Y.P.; Wang, Z.J.; Qin, K.X.; Tu, H.W. Rapid extraction of features and indoor reconstruction of 3D structures of Madoi MW7. 4 earthquake surface ruptures based on photogrammetry method. Seismol. Geol. 2022, 44, 524–540. [Google Scholar] [CrossRef]
- Xu, H.; Su, X.; Wang, Y.; Cai, H.; Cui, K.; Chen, X. Automatic bridge crack detection using a convolutional neural network. Appl. Sci. 2019, 9, 2867. [Google Scholar] [CrossRef] [Green Version]
- Hu, G.; Hu, Z.W.; Liu, J.P.; Cheng, F.; Peng, D.C. Seismic Fault Interpretation Using Deep Learning-Based Semantic Segmentation Method. IEEE Geosci. Remote Sens. Lett. 2020, 19, 7500905. [Google Scholar] [CrossRef]
- Wang, P.Q.; Chen, P.F.; Yuan, Y.; Liu, D.; Huang, Z.H.; Hou, X.D.; Cottrell, G. Understanding convolution for semantic segmentation. In Proceedings of the 2018 IEEE Winter Conference on Applications of Computer Vision (WACV), Lake Tahoe, NV, USA, 12–15 March 2018. [Google Scholar] [CrossRef] [Green Version]
- Chen, L.C.; Papandreou, G.; Schroff, F.; Adam, H. Rethinking atrous convolution for semantic image segmentation. arXiv 2017, arXiv:1706.05587. [Google Scholar] [CrossRef]
- Rajpurkar, P.; Irvin, J.; Zhu, K.L.; Yang, B.; Mehta, H.; Duan, T.; Ding, D.; Bagul, A.; Langlotz, C.; Shpanskaya, K.; et al. CheXNet: Radiologist-level pneumonia detection on chest X-Rays with deep learning. arXiv 2017, arXiv:1711.05225. [Google Scholar] [CrossRef]
Figure 1.
Topography of the study area.

Figure 2.
Different forms of coseismic surface ruptures.

Figure 3.
Post-earthquake UAV orthophoto image and field photos.

Figure 4.
Network architecture.

Figure 5.
Atrous spatial pyramid pooling module.

Figure 6.
Study area of the experimental data.

Figure 7.
Training process of the crack identification model by applying maduoDom1.

Figure 8.
Prediction results of different network architectures for maduoDom1 and maduoDom2.

Figure 9.
ROC curves of the models.

Figure 10.
Data processing with bold labels.

Figure 11.
Prediction results of different network architectures for maduoDom1 and maduoDom2 with bold-labeled cracks.
Figure 11.
Prediction results of different network architectures for maduoDom1 and maduoDom2 with bold-labeled cracks.


Table 1.
Parameters and GFLOPs for common models and our network.
| Model | Parameters (Million) | GFLOPs |
|---|---|---|
| AlexNet | 60.97 | 0.7 |
| VGG-16 | 138.36 | 15.5 |
| VGG-19 | 143.67 | 19.6 |
| ResNET50 | 25.61 | 3.9 |
| ResNET101 | 44.66 | 7.6 |
| Our Net | 2.54 | 6.4 |
Table 2.
Quantitative evaluation results of crack identification in the four datasets.
| Data | Accuracy | F1 | mIoU |
|---|---|---|---|
| maduoDom1 with fine labels | 0.9817 | 0.5193 | 0.5031 |
| maduoDom2 with fine labels | 0.9780 | 0.5211 | 0.5027 |
| maduoDom1 with bold labels | 0.8644 | 0.7616 | 0.6412 |
| maduoDom2 with bold labels | 0.8785 | 0.6326 | 0.5369 |
Publisher’s Note: MDPI stays neutral with regard to jurisdictional claims in published maps and institutional affiliations. |
© 2022 by the authors. Licensee MDPI, Basel, Switzerland. This article is an open access article distributed under the terms and conditions of the Creative Commons Attribution (CC BY) license (https://creativecommons.org/licenses/by/4.0/).
Share and Cite
MDPI and ACS Style
Chen, X.; Hu, G.; Liu, X. Recognition of Earthquake Surface Ruptures Using Deep Learning. Appl. Sci. 2022, 12, 11638. https://0-doi-org.brum.beds.ac.uk/10.3390/app122211638
AMA Style
Chen X, Hu G, Liu X. Recognition of Earthquake Surface Ruptures Using Deep Learning. Applied Sciences. 2022; 12(22):11638. https://0-doi-org.brum.beds.ac.uk/10.3390/app122211638
Chicago/Turabian StyleChen, Xiaolin, Guang Hu, and Xiaoli Liu. 2022. "Recognition of Earthquake Surface Ruptures Using Deep Learning" Applied Sciences 12, no. 22: 11638. https://0-doi-org.brum.beds.ac.uk/10.3390/app122211638
Note that from the first issue of 2016, this journal uses article numbers instead of page numbers. See further details here.