Article

Strong Earthquake-Prone Areas in the Eastern Sector of the Arctic Zone of the Russian Federation

by
Alexei D. Gvishiani
1,2,
Boris A. Dzeboev
1,3,*,
Boris V. Dzeranov
1,3,
Ernest O. Kedrov
1,
Anna A. Skorkina
1,4 and
Izabella M. Nikitina
1
1
Geophysical Center of the Russian Academy of Sciences (GC RAS), 119296 Moscow, Russia
2
Schmidt Institute of Physics of the Earth of the Russian Academy of Sciences (IPE RAS), 119296 Moscow, Russia
3
Geophysical Institute, Vladikavkaz Scientific Center RAS (GPI VSC RAS), 362002 Vladikavkaz, Russia
4
Institute of Earthquake Prediction Theory and Mathematical Geophysics of the Russian Academy of Sciences (IEPT RAS), 117997 Moscow, Russia
*
Author to whom correspondence should be addressed.
Submission received: 26 October 2022 / Revised: 15 November 2022 / Accepted: 22 November 2022 / Published: 23 November 2022
(This article belongs to the Collection Geoinformatics and Data Mining in Earth Sciences)

Abstract

:
This paper continues the series of publications by the authors on the recognition of areas prone to the strongest, strong, and significant earthquakes using the FCAZ system-analytical method. The areas prone to earthquakes with M ≥ 5.5 in the eastern sector of the Arctic zone of the Russian Federation were recognized. It is shown that certain potential high seismicity zones are well confined to the boundaries of the Eurasian, North American, and Okhotsk tectonic plates. In addition, according to the results of the FCAZ recognition, some areas located at a sufficient distance from the main tectonic structures of the studied region were also recognized as highly seismic. The results of the study, among other factors, justify the use of the assessment of the completeness magnitude in the catalog for choosing the set of recognition objects for the FCAZ method.

1. Introduction

The development of the Arctic zone of the Russian Federation (AZRF) is an important area of economic and scientific progress for the country. This is determined, first of all, by the significant reserves of minerals in the Russian Arctic. Today, the region produces oil (80% of the total volume in the country), natural gas (93%), nickel and copper (90%), diamonds and gold (33%), platinum, palladium, cobalt, tin, manganese, coal, etc. [1]. The relevance of scientific research in the Russian Arctic is growing due to climate change caused by global warming and the accelerated melting of Arctic ice [2,3,4,5].
Assessment of the hazards of geodynamical nature plays a significant role in determining the strategy for the industrial development of promising regions, which undoubtedly includes the Russian Arctic [6]. The central role here belongs to seismic hazard, which is taken into account both in determining urban planning policy and in planning industrial and infrastructure network facilities.
In this paper, the area of seismic hazard assessment is the eastern sector of the Russian Arctic. In its oceanic part, the Eurasian basin, the Gakkel Ridge, and the Canadian basin can be identified. They are divided by the Lomonosov and the Alfa–Mendeleev Ridges, which are separated from each other by the Makarov Basin and the small Mendeleev abyssal plain.
The continental part is represented by accretion–collision structures. Among them is the Verkhoyansk Range, which frames the Siberian platform from the east. This is followed by is the Chersky Range. Further to the east, there is a series of arched ranges of Koryakia and Chukotka [7,8] (Figure 1).
Seismogenic zones in the continental part are represented by the boundary between the North American and Eurasian plates (Figure 1). The latter consists of several structures extending from the Laptev Sea and the mouth of the river Lena to the coast of Okhotsk and the Isthmus of Kamchatka. The transverse extent of seismogenic structures exceeds 1000 km. Some researchers distinguish here a collage of microplates, including the Amur, Okhotsk, and Bering plates [9]. Some authors trace here several seismogenic structures, including the Laptev Sea, Kharaulakh, Cherskiy seismotectonic zones, and the Arctic–Asian seismic belt [8,10].
Over the past two decades, a number of strong earthquakes with a magnitude M ≥ 6.0 have occurred in the studied region (Figure 2). Among them is the Olyutorsk earthquake on 20.04.2006 with M = 7.6; the earthquake on 24.06.2012 near the northeastern coast of the Kamchatka Peninsula with M = 6.0; two earthquakes with M = 6.5 and M = 6.3 that occurred consecutively on 30.04.2010 in the Bering Sea; Ilin-Tas (Abyi) earthquake on 14 February 2013 with M = 6.6; earthquake on 09.01.2020 with M = 6.4 near the border of Kamchatka and Chukotka [11,12,13,14], and others (Figure 1 and Figure 2). Sufficiently detailed information about strong earthquakes in the Russian Arctic that occurred before the mid-1970s can be found in [15]. The foregoing emphasizes the existing high seismic hazard of the region and substantiates the urgency of the problem of determining areas in the eastern sector of the Arctic zone of the Russian Federation within which strong earthquakes can occur.
A large number of scientific papers are devoted to the analysis of the seismic regime of the Arctic zone of Russia and the construction of corresponding seismic hazard maps (see, for example, [17,18,19,20,21], and others). Here it is necessary to note the systematically updated set of maps of the General Seismic Zoning (GSZ) [22,23,24,25,26] on the scale of the whole of Russia. On the GSZ maps that regulate construction in the country, the territory of the Russian Arctic belongs to zones with an estimated intensity of five to six or more points [27]. Nevertheless, the question of the boundaries of the zones prone to strong earthquakes in the Russian Arctic remains open. This article is devoted to its study.
Since the 1970s, seismic hazard assessment studies have been actively applying pattern recognition methods [28,29,30]. Created in the mid-2010s and currently being developed, the FCAZ (formalized clustering and zoning) system analysis method turned out to be universal and effective [29,31]. Its application is based on topological filtering of a point set of epicenters of sufficiently weak earthquakes, which serve as recognition objects. FCAZ is based on the composition of DPS (discrete perfect sets) [32,33] and E2XT [31] algorithms. The subject of the FCAZ study is the nontrivial recognition of areas prone to strong (the strongest, significant) earthquakes in the studied region [34].
The objective of this study is to recognize strong earthquake-prone areas in the eastern sector of the Russian Arctic (Figure 1). Recognition is performed using the FCAZ method.

2. Materials and Methods

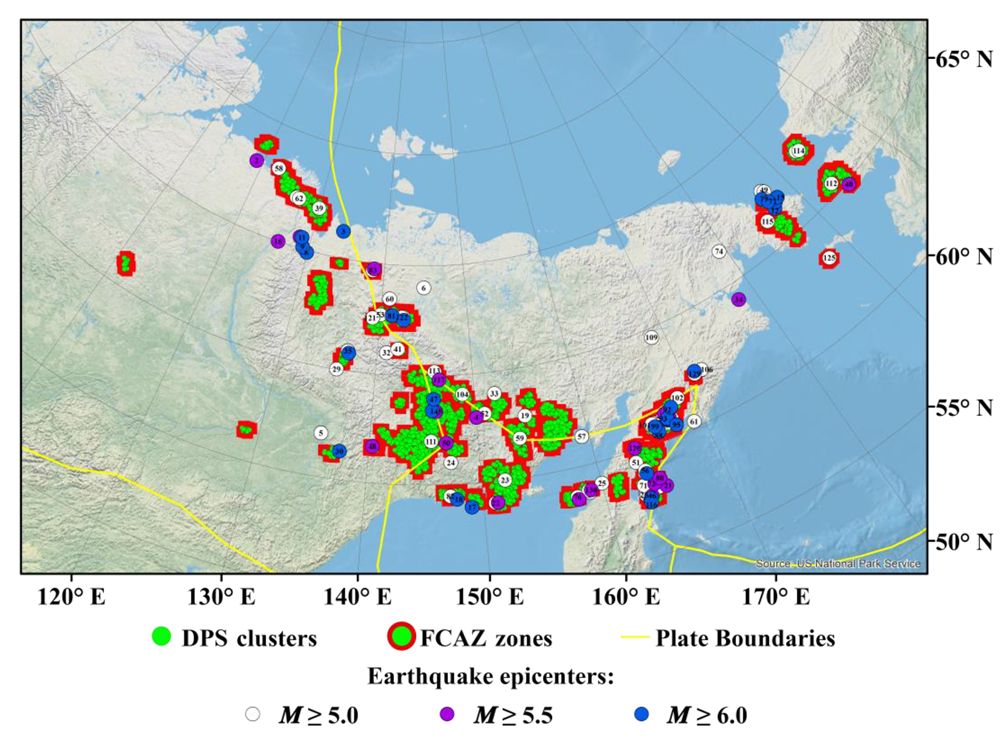
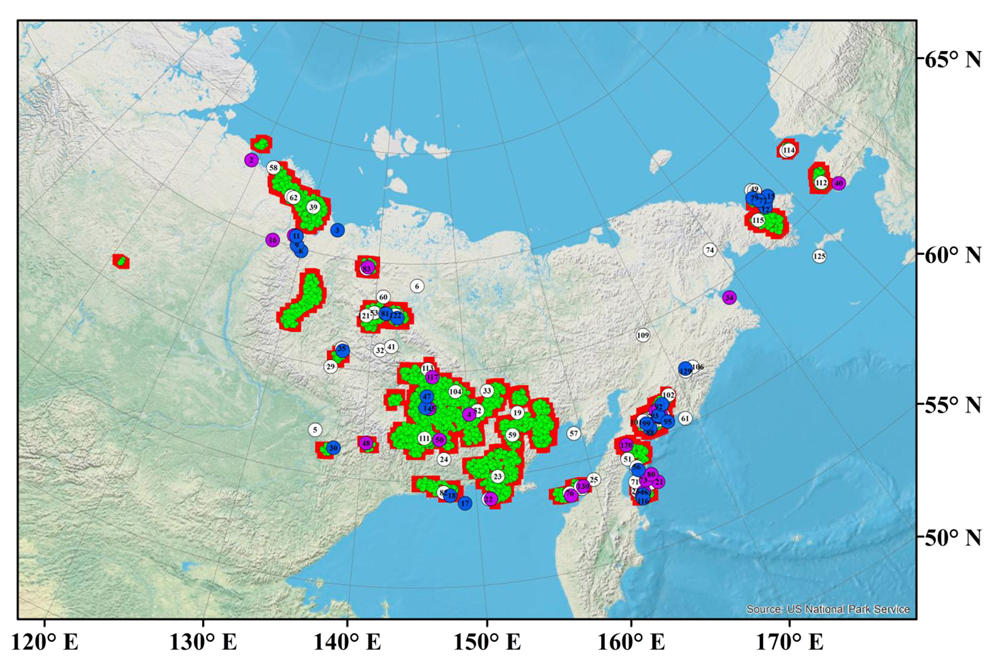
2.1. System-Analytical Method FCAZ

The system-analytical method FCAZ (formalized clustering and zoning) was created in 2012–2016 at the Geophysical Center of the Russian Academy of Sciences [31,33,34,35,36,37,38,39,40,41] (and others). Some ideas of the mathematical construction of the method can be observed in earlier publications [42,43,44]. The basic idea of the FCAZ study is the topological filtrational clustering of the seismic catalog—a finite set W of epicenters of known earthquakes in the studied region. As already noted, FCAZ makes it possible to efficiently recognize areas prone to the strongest, strong, and significant earthquakes [29].
The FCAZ system represents a sequential application of 2 algorithms: DPS (discrete perfect sets) [31,32,33,37,45,46] and E2XT [31,34]. In a finite set W of the Euclidean space, DPS selects regions with a given density level α. The output is a set of points that is α-dense in each of its elements. The task of the DPS algorithm is to construct such a set W(α) that its density is not less than the level α at all its points. The DPS algorithm, in particular, is effective in the current task because it “attracts” recognition objects (earthquake epicenters) into dense clusters, leaving no isolated points [35].
At the next, second stage of FCAZ recognition, the E2XT algorithm formalizes and implements the construction of a unique mapping of discrete DPS clusters into flat zones of nonzero measure, inside and at the boundaries of which earthquakes with a magnitude MM0 can occur [31]. Here M0 is a given magnitude threshold, which depends on the seismic regime of the considered region [29] and determines which earthquakes we consider strong.
The algorithms that form FCAZ have a number of input parameters: DPS-q < 0 to calculate the localization radius and the maximum density level β ∈ [−1, 1] to determine the required density level of DPS clusters α(β); E2XT-v < 0 and w < 0 to calculate the scannability of DPS clusters and the connectivity of calculated flat high seismicity zones [33]. Another parameter for DPS is the number of iterations of applying the algorithm in one task. In 2016, the DPS and E2XT algorithms were equipped with artificial intelligence blocks [31]. The latter allows it to automatically choose the optimal values of the free parameters. This makes the result of FCAZ recognition more objective and reproducible [34].
Previously, using the FCAZ method, earthquake-prone area recognition in the following seismically hazardous regions of the world was successfully performed:
  • The mountain belt of the Andes of South America (M0 = 7.75) [31,34];
  • Pacific coast of the Kamchatka Peninsula (M0 = 7.75) [34,35,36] and the Kuril Islands (M0 = 7.75);
  • California (M0 = 6.5) [34,36,37];
  • Cisbaikalia–Transbaikalia (M0 = 5.5; M0 = 5.75, M0 = 6.0) [34,39];
  • Altai-Sayan (M0 = 5.5) [34,40];
  • Caucasus (M0 = 5.0) [31,33,34,37,38];
  • Crimean Peninsula and northwestern Caucasus (M0 = 4.5; M0 = 5.0) [34,41].
In these regions, the reliability of the FCAZ results was assessed using control experiments of the “seismic history” type [29]. Naturally, the recognized high seismicity zones were also compared with the location of the actual epicenters of the strongest, strong, and significant earthquakes that occurred after the end of the catalog used for recognition [31]. Thus, in each of the 8 regions noted above, a high degree of reliability of FCAZ recognition was substantiated [34].
A detailed description of the mathematical and algorithmic construction of the FCAZ method and the results obtained earlier with its help is given in [31,33,34].

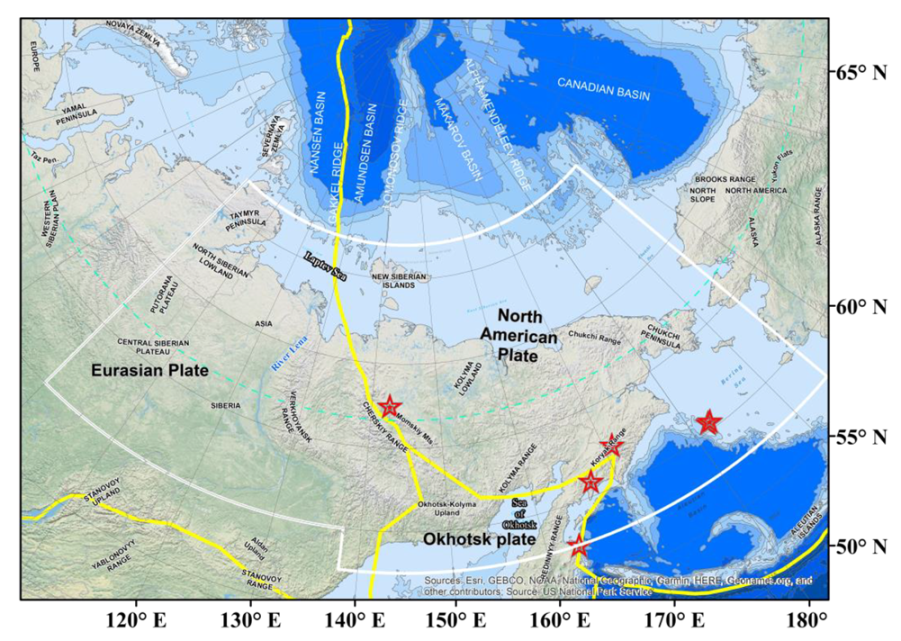
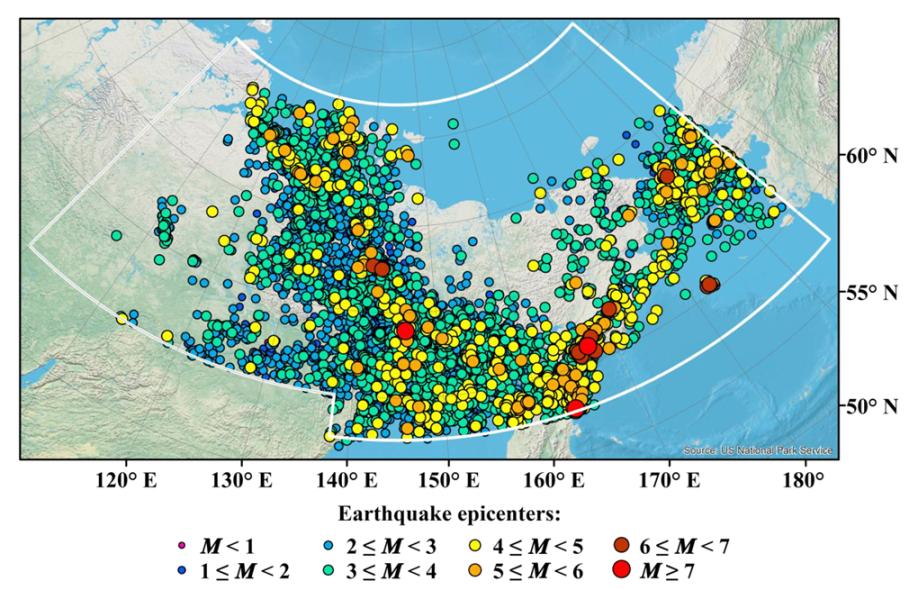
2.2. Earthquake Catalog of the Eastern Sector of the Arctic Zone of the Russian Federation

The basis for the recognition of potential high seismicity zones by the FCAZ method is the most complete earthquake catalog of the studied region. In this paper, epicenters from the original, integrated earthquake catalog of the eastern sector of the Arctic zone of the Russian Federation are used as recognition objects. The catalog contains information on 23,254 seismic events for the period 1962–2020 [16]. It was created by the system analysis method as a result of a formalized combination of earthquake data from the regional catalogs of the Geophysical Survey of the Russian Academy of Sciences (GS RAS, http://www.gsras.ru/new/eng/catalog/, accessed on 1 October 2022) and the International Seismological Center (ISC, http://www.isc.ac.uk/, accessed on 1 October 2022).
Different seismic agencies can both register and skip events. This happens due to network configurations, the specifics of processing methods, as well as the procedures for transferring information to data centers. When catalogs are merged, the problem of identifying and removing the resulting duplicates naturally arises. The problem is complicated by the need to distinguish duplicates from aftershocks [47] since the latter are also events close in space and time. The problem of merging these catalogs was solved using the author’s technique [48]. It is based on a modification of the nearest neighbor method [49,50] for the recognition of duplicates. Namely, correspondence is built for events from two catalogs, after which earthquakes are classified into unique and duplicates using the Euclidean metric. Consistent application of the technique makes it possible to combine any number of earthquake catalogs [48].
When creating an integrated earthquake catalog of the eastern sector of the Arctic zone of the Russian Federation [16], the following were sequentially combined:
  • The regional catalog of Yakutia from the annual journal “Earthquakes in Northern Eurasia”
  • The regional catalog of the northeast of Russia from the annual journal “Earthquakes in Northern Eurasia”
  • The earthquake catalog of Kamchatka of the Kamchatka Branch of GS RAS
  • The ISC catalog, which is a composite catalog containing data from many world and Russian agencies
Different agencies define, generally speaking, different magnitude types of seismic events. At the same time, for a rigorous formulation of the problem of earthquake-prone areas recognition, which is determined by the threshold M0, it is necessary to provide all records of the catalog with a magnitude of the same type. In this regard, the magnitude scale in the integrated catalog was unified [16]. This was undertaken for the first time with the problems of the FCAZ cycle. This was a fundamental step forward in the development of the system analysis method.
When analyzing various magnitude scales, preference is usually given to the moment magnitude: M = MW [16,51,52]. In the integrated catalog, MW was defined only for earthquakes with M > 5.0. For events with magnitudes up to M ≈ 4.0, the magnitude mb was mainly defined, and in such cases, M = mb. Weak earthquakes had magnitudes defined by local networks, with a large variety in their types [16]. Most of the weak earthquakes had an energy class estimate, and only for 7% of the events were other types of magnitude calculated. In this regard, the following magnitude priority system was used in the integrated catalog [16]:
  • M = MWGCMT or
  • M = MSISC for strong earthquakes before 1976 or
  • M = mbISC or
  • M = b × KSa, regression coefficients a and b are given in [16]
  • M = b × MLa, regression coefficients a and b are given in [16].
The formalized construction of the author’s technique for merging earthquake catalogs is described in detail in [48]. The stages of merging the integrated catalog of the eastern sector of the Arctic zone of the Russian Federation and unifying the magnitude scales are described in [16]. The catalog is available to the public on the website of the World Data Center for Solid Earth Physics, Moscow, at http://www.wdcb.ru/arctic_antarctic/arctic_seism.html, (accessed on 24 October 2022). The map of earthquake epicenters from the integrated catalog is presented in Figure 2.
The catalog of strong earthquakes of the eastern sector of the Russian Arctic, starting from 1900, was formed based on 3 main sources: the integrated catalog [16], New Catalog of Strong Earthquakes in the USSR from Ancient Times through 1977 (hereinafter “New Catalog…”) [15] and the catalog of the International Seismological Center (ISC).
It should be noted that in the “New Catalog...” [15] there are many cases when coordinates of strong earthquakes correspond to low-seismicity areas, according to modern instrumental data. In the description of the “New Catalog...” it is said that “the least reliable is the assessment in the presence of intensity data in one observation site. In such cases, the value obtained under the assumption that the source was located under the given observation site at the average depth for the region was taken as its lower limit. The value corresponding to the epicenter at the nearest point of a large seismically active zone was taken as the upper limit, and the average was taken as the final estimate. The error in such cases could be two units.
Accordingly, it was decided not to include in the formed catalog of strong earthquakes the events with the accuracy of ±2 of the indicated magnitude in the “New Catalog...”. Thus, 53 events were taken from the “New Catalog...”, given in the sections “Arctic Basin,” “Chukotka,” “Kamchatka,” and “Yakutia and the North-East.” At the same time, even though data from international agencies have already been used in compiling the “New Catalog…”, we have identified several cases where the final magnitude estimate was lower than the available instrumental estimate. In such cases, preference was given to the highest magnitude, namely, the recalculated MS according to the ISC data [53].
All events with M ≥ 5.0 were selected from the integrated instrumental catalog [16]. In this case, events with MW ≥ 5.0 or MS ≥ 5.0 were included in the formed catalog of strong earthquakes automatically, and M = Mw or M = MS, respectively. For events with mb ≥ 5.0, an additional check was carried out, after which such events fell into one of two categories:
  • If there was an estimate of MS ≥ 5.0, earthquakes were included in the formed catalog of strong events, and M = MS, since the saturation effect of magnitudes for mb ≥ 5.0 is known.
  • If there was an estimate of MS < 5.0, earthquakes were not included in the catalog of strong earthquakes. Indeed, such a combination of MS-mb often corresponds to deep earthquakes, for which the applicability of the FCAZ method is not clear, since devastating consequences after deep events are observed rarely.
Thus, the formed catalog of strong earthquakes includes 166 events with M ≥ 5.0. Due to the remoteness of many seismic stations from the studied region, as well as its relatively weaker seismicity, it was decided to consider earthquakes with M ≥ 5.0 for the studied region as strong.
Due to the a priori lack of objects for FCAZ recognition, strong events, the epicenters of which are located outside the area covered by the integrated catalog, were excluded from consideration [16] (limited by the white frame in Figure 1 and Figure 2). Strong events in the waters of the seas and oceans at a relatively long distance from the coast were also excluded. The final catalog of strong earthquakes used in this work contains 130 events with M ≥ 5.0 (Table 1). The epicenters of such earthquakes are shown in Figure 3.

3. Results

As the magnitude threshold MR, starting from which the earthquake epicenters are used as objects of FCAZ recognition of strong earthquake-prone areas, was chosen, MR = 2.5. The combined catalog contains 10,486 crustal events with M ≥ 2.5, which made up the set of recognition objects W.
At the first step of the set W, which is a subset of the set of earthquake epicenters shown in Figure 2, the topological filtering algorithm DPS was applied. Three iterations of the algorithm were performed. The optimal values (q1 = −2.0, q2 = −2.5, q3 = −2.5; β1 = 0.1, β2 = 0.1, β3 = 0.05) of the input parameters of the algorithm were chosen by artificial intelligence blocks [34]. DPS clusters (Figure 3) included 67.2% of the epicenters of earthquakes with M ≥ 2.5 used in the problem as objects of FCAZ recognition. In other words, D P S W = 67.2 % W .
In the second step, the E2XT algorithm was applied to the recognized DPS clusters. The optimal values (v = −4.0 и w = −2.25; the geographical grid spacing is 0.25°) of its input parameters were also selected automatically using blocks [31]. In Figure 3, a combination of green and red colors shows the result—the strong earthquake-prone areas in the eastern sector of the Russian Arctic, recognized by the FCAZ method.
As can be seen from Figure 3, the recognized FCAZ zones are in good agreement with the location of the epicenters of historical and instrumental earthquakes with M ≥ 5.0 (Table 1). In addition, certain potential high seismicity zones (Figure 3) are well confined to the boundaries of the Eurasian, North American, and Okhotsk tectonic plates. In the zone of contact of all three plates and the Okhotsk Plate with the North American Plate (Figure 3), the FCAZ system recognized very large FCAZ zones containing half of the known strong earthquakes (Table 1). This is especially true for the northeastward elongated margin of the Okhotsk Plate, where more than a third of the known events with M ≥ 6.0 occurred. Furthermore, FCAZ zones are recognized within the Cherskiy Range, which is one of the main geomorphological structures (Figure 1) of the region. Within this range, a fairly large number of instrumentally registered strong earthquakes are known (Figure 3). The consistency of FCAZ zones with the boundaries of tectonic plates is a significant argument in favor of the reliability of the recognition [9,54].
Out of 130 events with M ≥ 5.0, only 19 (14.6%) epicenters are located outside the FCAZ zones. Note that 14 of them occurred before 1962, i.e., long before the start of systematic instrumental observations of the seismicity of the region. Their epicenters and magnitudes were determined with a significant error [15]. Thus, for six events with M = 5.0–5.2, the magnitude error is ±0.5–0.7, and for eight events, the epicenter coordinates are determined with an error of ±1–2° [15]. At the same time, exactly half of the latter is located at the very border of the recognized FCAZ zones. Thus, with a high probability, some of the earthquakes that make up “missed target” errors may not be such.
Let us now consider the epicenters of stronger earthquakes. Out of 54 considered events with M ≥ 5.5 8 epicenters (14.8%) are located outside the zones recognized by the FCAZ method. All such events occurred before 1957, i.e., before the beginning of the instrumental earthquake catalog, and therefore, belong to the historical part of the used catalog of strong earthquakes (Table 1). The coordinates of their epicenters were determined with an error from 0.5° to 2°. At the same time, half of the events have magnitudes M = 5.5–5.8, estimated with an error of ±0.3–0.5. Thus, it is very likely that some events that did not fall into the FCAZ zones may not be missed targets of recognition.
Let us consider the case where M0 = 6.0. In turn, four (14.8%) out of 27 events with M ≥ 6.0 are errors of the “missed target” type. Here, all missed earthquakes occurred before 1930. The coordinates of their epicenters were determined with an error of ±0.5°–1°, and the magnitudes—±0.5. The latter is also confirmed by the work [55], where for these events the estimates of magnitudes are given that are 0.2–0.4 less than in [15] (Table 1). It should also be noted that three of the four missed epicenters are located within a fairly small area (the maximum distance between the epicenters is ≈80 km). These events have the same magnitude estimates and occurred within three and a half months (the first two with a difference of less than five hours). These three events should likely be considered as one missed target of recognition. Thus, interpreting the result (Figure 3) for earthquakes with M ≥ 6.0, we can speak of only two (8.0%) misses.
Considering only strong events that occurred after the start of systematic seismological observations in 1962 (the beginning of the used instrumental catalog), and which have reliable instrumental estimates of the magnitude and coordinates of the epicenter, we have the following positive results. Out of 95 earthquakes with M ≥ 5.0, epicenters of five (5.26%) are located outside the FCAZ zones, and for earthquakes with M ≥ 5.5 and M ≥ 6.0, in this case, there are no “missed target” errors.
It should be noted that, according to the ANSS and EMSC catalogs, after the end of the integrated catalog used for FCAZ recognition, events with M ≥ 5.0 have not yet occurred in the continental part of the studied region (the catalog ends in 2020). Therefore, the use of a direct control sample to assess the reliability of this recognition is impossible.
Figure 3 shows that the recognized FCAZ zones contain not only the epicenters of earthquakes with M ≥ 5.0, which are directly confined to the boundaries of the Eurasian, North American, and Okhotsk tectonic plates; they also contain some events that occurred at a sufficient distance from the main tectonic structures of the studied region. This emphasizes the nontriviality of the result of the performed FCAZ recognition. Note that the FCAZ zones occupy only ≈ 10% of the continental part of the region within which recognition was performed (shown by the white frame in Figure 1 and Figure 2) and contain 68.4% of events with M ≥ 3.0, 68.9% with M ≥ 3.5, 70.5% with M ≥ 4.0, and 69.8% with M ≥ 4.5 from those available in the instrumental catalog used for recognition. This once again indicates the nontriviality of the obtained result of FCAZ recognition (Figure 3).
Note that FCAZ zones for M0 = 5.0, M0 = 5.5, and M0 = 6.0 declare the same territory as hazardous. Moreover, if the percentage of “missed target” errors is equal when considering all strong events from Table 1 their number is reduced to zero for earthquakes with M ≥ 5.5 and M ≥ 6.0 when the historical part of the catalog (which contains possible significant errors in determining the coordinates of epicenters and estimating magnitudes) is discarded. The foregoing allows us to interpret the recognized FCAZ zones (Figure 3) as areas prone to earthquakes with M ≥ 5.5 in the eastern sector of the Arctic zone of the Russian Federation.
Note that the result of FCAZ recognition shown in Figure 3 can be interpreted in another way. For example, the territory of the studied region not covered by recognized high seismicity zones can be considered as areas where only earthquakes with a magnitude M < 5.0 can occur. Thus, according to the results of this work, strong earthquakes cannot occur in ≈90% of the territory of the eastern sector of the Arctic zone of the Russian Federation. At the same time, the hazardous areas of ≈ 10% are outlined in Figure 3.
In the eastern sector of the Russian Arctic, it is impossible to perform control experiments of the “seismic history” type [29], which substantiate the reliability of FCAZ recognition by demonstrating the stability of the recognized zones in space and time. This is due to the lack of recognition objects (earthquake epicenters with M ≥ 2.5) to perform control experiments on in such a large territory as the studied region of the eastern sector of the Russian Arctic. As mentioned above, there were no strong events in the region that could form material for conducting a pure experiment (checking the correspondence between the recognized FCAZ zones and the epicenters of earthquakes that occurred after the end of the catalog, which is a set of recognition objects).
To substantiate the reliability and optimality of the recognized FCAZ zones (Figure 3), we compared them with the zones recognized using other (smaller) values of the MR threshold, which determines a set of objects. In other words, the number of recognition objects varied. Figure 4, Figure 5, Figure 6 and Figure 7 show the FCAZ zones prone to strong earthquakes in the eastern sector of the Russian Arctic, mapped using thresholds: MR = 2.0, MR = 1.5, MR = 1.0, and MR = 0.5, which determine the set W ¯ .
From Figure 5, Figure 6 and Figure 7, it can be seen that FCAZ zones recognized using MR = 1.5, MR = 1.0, and MR = 0.5 have almost the same number of “missed target” errors as the main variant (Figure 3). Outside the recognized zones are located 20 out of 130 earthquake epicenters with M ≥ 5.0, 11 out of 54 with M ≥ 5.5, and five out of 27 with M ≥ 6.0. It should be noted that the area of these zones is 25–30% larger than the area of FCAZ zones in Figure 3. That is, in the case of low values of the MR threshold, the number of false alarms increases, which negatively affects the recognition reliability. In this case, the values MR = 1.5, MR = 1.0, and MR = 0.5 are significantly less than the magnitude Mc (completeness magnitude) in the catalog [56,57,58]. This means, with such values of MR, the set of recognition objects is an incomplete sample of earthquake epicenters, with a high probability containing numerous errors in the values of seismicity parameters. The latter affects the result of FCAZ recognition.
The high seismicity zones recognized using MR = 2.0 (Figure 4) are comparable in area to the main FCAZ zones (Figure 3). The area difference is less than 1%. At the same time, we note that these zones have the following number of “missed target” errors: 22 earthquake epicenters with M ≥ 5.0, 14 with M ≥ 5.5, and seven with M ≥ 6.0, which is significantly more than the main variant.
Zone analysis in Figure 3, Figure 4, Figure 5, Figure 6 and Figure 7, the results of comparison of their areas, and statistics of “missed target” errors show that the FCAZ zones recognized using the threshold MR = 2.5 with the smallest area of false alarms are in the best agreement with the epicenters of known strong earthquakes in the studied region. This substantiates the reliability of the interpretation of high seismicity zones shown in Figure 3 as earthquake-prone areas with M ≥ 5.5 in the eastern sector of the Arctic zone of the Russian Federation. It should also be noted that the obtained results substantiate the correct choice of the threshold value MR based on the assessment of the completeness magnitude Mc in the catalog.

4. Conclusions

In this paper, using the FCAZ system-analytical method, strong earthquake-prone areas in the eastern sector of the Arctic zone of the Russian Federation were recognized. As shown in the text of the article and Figure 3, FCAZ zones are in good agreement with the epicenters of earthquakes with M ≥ 5.5 and M ≥ 6.0. Interpreting FCAZ zones as areas prone to earthquakes with M ≥ 5.5, and substantiating their reliability, it should be noted that they can also be interpreted as areas prone to events with M ≥ 6.0. This is confirmed by the statistics of “missed target” errors given in the paper.
For the first time, the high seismicity zones determined by the FCAZ method were interpreted for two thresholds M0 when recognizing in the Crimean Peninsula and the northwestern Caucasus [41]. In the same paper [41], a mathematical theory was constructed which makes it possible to represent FCAZ zones as a fuzzy set to consider areas in which earthquakes with a magnitude of M 0 1 M < M 0 2 can occur.
Another important result was obtained in the present paper. The classification shown in Figure 3 turns out to be stable for the variation of the threshold M0 in the interval ∆M0 ≈ 1 (5.0 ≤ M0 ≤ 6.0). Such stability of the solution for the M0 threshold, which was not observed in previous FCAZ regions, serves as a weighty argument in favor of the reliability of the solution presented in Figure 3.
Note that the results of this paper point to the need to use the completeness magnitude estimate Mc in the catalog as the magnitude threshold MR (starting from which the earthquake epicenters are used as FCAZ recognition objects). This will make it possible to use in FCAZ recognition the data set that is the most complete and contains the minimum number of errors in the values of the seismicity parameters of the considered high seismicity region.

Author Contributions

Conceptualization, A.D.G.; data curation, B.A.D., B.V.D., A.A.S. and I.M.N.; formal analysis, A.D.G., B.A.D., B.V.D., E.O.K. and A.A.S.; investigation, B.A.D., E.O.K. and I.M.N.; methodology, A.D.G. and B.A.D.; software, B.A.D.; supervision, A.D.G.; validation, B.V.D., E.O.K., A.A.S. and I.M.N.; visualization, B.V.D., E.O.K. and I.M.N.; writing—original draft, A.D.G., B.A.D., B.V.D., E.O.K., A.A.S. and I.M.N. All authors have read and agreed to the published version of the manuscript.

Funding

The reported study was funded by the Russian Science Foundation, project number 21-77-30010, System analysis of geophysical process dynamics in the Russian Arctic and their impact on the development and operation of the railway infrastructure.

Institutional Review Board Statement

Not applicable.

Informed Consent Statement

Not applicable.

Data Availability Statement

Not applicable.

Acknowledgments

This work employed data provided by the Shared Research Facility, the Analytical Geomagnetic Data Center of the Geophysical Center of RAS (http://ckp.gcras.ru/ accessed on: 23 October 2022).

Conflicts of Interest

The authors declare no conflict of interest.

References

  1. Shelomentsev, V.N. The Legal Aspects of the Development and Protection of the Arctic; Scientific Bulletin of the Moscow State Technical University: Moscow, Russia, 2015; Volume 216, pp. 113–117. [Google Scholar]
  2. Bogorodskiy, P.V.; Demidov, N.E.; Filchuk, K.V.; Marchenko, A.V.; Morozov, E.G.; Nikulina, A.L.; Pnyushkov, A.V.; Ryzhov, I.V. Growth of landfast ice and its thermal interaction with bottom sediments in the Braganzavägen Gulf (West Spitsbergen). Russ. J. Earth Sci. 2020, 20, ES6005. [Google Scholar] [CrossRef]
  3. Marchenko, A.V.; Morozov, E.G.; Ivanov, A.V.; Elizarova, T.G.; Frey, D.I. Ice thickening caused by freezing of tidal jet. Russ. J. Earth Sci. 2021, 2, ES2004. [Google Scholar] [CrossRef]
  4. Morozov, P.A.; Berkut, A.I.; Vorovsky, P.L.; Morozov, F.P.; Pisarev, S.V. Measuring sea ice thickness with the LOZA georadar. Russ. J. Earth Sci. 2021, 21, ES4003. [Google Scholar] [CrossRef]
  5. Sharmar, V.; Markina, M. Evaluation of interdecadal trends in sea ice, surface winds and ocean waves in the Arctic in 1980–2019. Russ. J. Earth Sci. 2021, 21, ES2002. [Google Scholar] [CrossRef]
  6. Spyros, A.; Arnold, M.; Gert, J. Geohazards and Pipelines. State-of-the-Art Design Using Experimental, Numerical and Analytical Methodologies. In Geohazards and Pipelines; Springer Nature: Berlin/Heidelberg, Germany, 2021. [Google Scholar] [CrossRef]
  7. Artyushkov, E.V.; Chekhovich, P.A. Geodynamics of the Lomonosov Ridge in the Central Arctic. Russ. J. Earth Sci. 2019, 19, ES1004. [Google Scholar] [CrossRef] [Green Version]
  8. Vernikovsky, V.; Shemin, G.; Deev, E.; Metelkin, D.; Matushkin, N.; Pervukhina, N. Geodynamics and Oil and Gas Potential of the Yenisei-Khatanga Basin (Polar Siberia). Minerals 2018, 8, 510. [Google Scholar] [CrossRef] [Green Version]
  9. Zonenshain, L.P.; Kuzmin, M.I.; Natapov, L.M. Tectonics of Lithospheric Plates of the USSR; Nedra Publishers: Moscow, Russia, 1990; p. 328. [Google Scholar]
  10. Imaev, V.S.; Imaeva, L.P.; Kozmin, B.M.; Mackey, K.; Fujita, K. Seismotectonic processes along boundary of lithospheric plates of Northeast Asia and Alaska. Geol. Pac. Ocean 2000, 15, 211–232. [Google Scholar]
  11. Chebrov, V.N. The Olyutorskii earthquake of April 20, 2006: Organizing surveys, observations, problems, and results. J. Volcanol. Seismol. 2010, 4, 75–78. [Google Scholar] [CrossRef]
  12. Lander, A.V.; Levina, V.I.; Ivanova, E.I. The earthquake history of the Koryak Upland and the aftershock process of the MW7.6 April 20(21), 2006 Olyutorskii earthquake. J. Volcanol. Seismol. 2010, 4, 87–100. [Google Scholar] [CrossRef]
  13. Rogozhin, E.A.; Ovsyuchenko, A.N.; Marakhanov, A.V.; Novikov, S.S. A geological study of the epicentral area of the April 20(21), 2006 Olyutorskii earthquake. J. Volcanol. Seismol. 2010, 4, 79–86. [Google Scholar] [CrossRef]
  14. Shibaev, S.V.; Kozmin, B.M.; Imaev, V.S.; Imaeva, L.P.; Petrov, A.F.; Starkova, N.N. The February 14, 2013 Ilin-Tas (Abyi) earthquake (Mw=6.7), Northeast Yakutia. Russ. J. Earth Sci. 2020, 2, 92–102. (In Russian) [Google Scholar] [CrossRef]
  15. Kondorskaya, N.V.; Shebalin, N.V.; Khrometskaya, Y.A.; Gvishiani, A.D. New Catalog of Strong Earthquakes in the USSR from Ancient Times through 1977; Report SE-31; World Data Center A for Solid Earth Geophysics, NOAA: Boulder, CO, USA, 1982; 608p. [Google Scholar]
  16. Gvishiani, A.D.; Vorobieva, I.A.; Shebalin, P.N.; Dzeboev, B.A.; Dzeranov, B.V.; Skorkina, A.A. Integrated Earthquake Catalog of the Eastern Sector of the Russian Arctic. Appl. Sci. 2022, 12, 5010. [Google Scholar] [CrossRef]
  17. Assinovskaya, B.A. Seismic hazard assessment of the Barents sea region. Inzhenernye Izyskaniya. 2021, 15, 76–88. (In Russian) [Google Scholar] [CrossRef]
  18. Assinovskaya, B.A.; Panas, N.M.; Ovsov, M.K.; Antonovskaya, G.N. Preliminary seismic hazard assessment of the Arctic Gakkel ridge and surrounding. Russ. J. Seismol. 2019, 1, 35–45. (In Russian) [Google Scholar] [CrossRef]
  19. Imaev, V.S.; Imaeva, L.P.; Koz’min, B.M. Seismotectonics of Yakutia; GEOS: Moscow, Russia, 2000; p. 226. [Google Scholar]
  20. Imaeva, L.P.; Imaev, V.S.; Koz’min, B.M. Dynamics of the Zones of Strong Earthquake Epicenters in the Arctic–Asian Seismic Belt. Geosciences 2019, 9, 168. [Google Scholar] [CrossRef] [Green Version]
  21. Imaeva, L.P.; Kolodeznikov, I.I. Seismotectonics of the Northeastern Sector of Russian Arctic; Publishing House of the Siberian Branch of the Russian Academy of Sciences: Novosibirsk, Russia, 2017. [Google Scholar]
  22. Giardini, D. The Global Seismic Hazard Assessment Program (GSHAP)—1992/1999. Ann. Geofis. 1999, 42, 957–974. [Google Scholar] [CrossRef]
  23. Giardini, D.; Grunthal, G.; Shedlock, K.M.; Zhang, P. The GSHAP Global Seismic Hazard Map. Ann. Geofis. 1999, 42, 1225–1228. [Google Scholar] [CrossRef]
  24. Ulomov, V.I. General seismic zoning of the territory of Russian Federation: GSZ-2012. Seism. Instrum. 2014, 50, 290–304. [Google Scholar] [CrossRef]
  25. Ulomov, V.I. Seismic hazard of Northern Eurasia. Ann. Geofis. 1999, 42, 1023–1038. [Google Scholar] [CrossRef]
  26. Ulomov, V.I.; Peretokin, S.A.; Medvedeva, N.S.; Akatova, K.N.; Danilova, T.I. Seismological aspects of general seismic zoning for the territory of the Russian Federation territory (OSR-97, OSR-2012, and OSR-2014 Maps). Seism. Instrum. 2015, 51, 311–328. [Google Scholar] [CrossRef]
  27. Shebalin, P.N.; Gvishiani, A.D.; Dzeboev, B.A.; Skorkina, A.A. Why Are New Approaches to Seismic Hazard Assessment Required? Dokl. Earth Sci. 2022, 507, 930–935. [Google Scholar] [CrossRef]
  28. Gorshkov, A.I.; Soloviev, A.A. Recognition of earthquake-prone areas in the Altai-Sayan-Baikal region based on the morphostructural zoning. Russ. J. Earth Sci. 2021, 21, ES1005. [Google Scholar] [CrossRef]
  29. Gvishiani, A.D.; Soloviev, A.A.; Dzeboev, B.A. Problem of Recognition of Strong-Earthquake-Prone Areas: A State-of-the-Art Review. Izv. Phys. Solid Earth 2020, 56, 1–23. [Google Scholar] [CrossRef]
  30. Kossobokov, V.G.; Soloviev, A.A. Pattern recognition in problems of seismic hazard assessment. Chebyshevskii Sb. 2018, 19, 55–90. (In Russian) [Google Scholar] [CrossRef]
  31. Gvishiani, A.D.; Dzeboev, B.A.; Agayan, S.M. FCAZm intelligent recognition system for locating areas prone to strong earthquakes in the Andean and Caucasian mountain belts. Izv. Phys. Solid Earth 2016, 52, 461–491. [Google Scholar] [CrossRef]
  32. Agayan, S.M.; Bogoutdinov, S.h.R.; Dzeboev, B.A.; Dzeranov, B.V.; Kamaev, D.A.; Osipov, M.O. DPS Clustering: New Results. Appl. Sci. 2022, 12, 9335. [Google Scholar] [CrossRef]
  33. Gvishiani, A.; Dzeboev, B.; Agayan, S. A new approach to recognition of the earthquake-prone areas in the Caucasus. Izv. Phys. Solid Earth 2013, 49, 747–766. [Google Scholar] [CrossRef]
  34. Dzeboev, B.A.; Gvishiani, A.D.; Agayan, S.M.; Belov, I.O.; Karapetyan, J.K.; Dzeranov, B.V.; Barykina, Y.V. System-Analytical Method of Earthquake-Prone Areas Recognition. Appl. Sci. 2021, 11, 7972. [Google Scholar] [CrossRef]
  35. Dzeboev, B.A.; Agayan, S.M.; Zharkikh, Y.I.; Krasnoperov, R.I.; Barykina, Y.V. Strongest Earthquake-Prone Areas in Kamchatka. Izv. Phys. Solid Earth 2018, 54, 284–291. [Google Scholar] [CrossRef]
  36. Dzeboev, B.A.; Karapetyan, J.K.; Aronov, G.A.; Dzeranov, B.V.; Kudin, D.V.; Karapetyan, R.K.; Vavilin, E.V. FCAZ-recognition based on declustered earthquake catalogs. Russ. J. Earth Sci. 2020, 20, ES6010. [Google Scholar] [CrossRef]
  37. Gvishiani, A.; Dobrovolsky, M.; Agayan, S.; Dzeboev, B. Fuzzy-based clustering of epicenters and strong earthquake-prone areas. Environ. Eng. Manag. J. 2013, 12, 1–10. [Google Scholar] [CrossRef]
  38. Gvishiani, A.D.; Dzeboev, B.A. Assessment of seismic hazard in choosing of a radioactive waste disposal location. Min. J. 2015, 10, 39–43. (In Russian) [Google Scholar] [CrossRef]
  39. Gvishiani, A.D.; Dzeboev, B.A.; Belov, I.O.; Sergeyeva, N.A.; Vavilin, E.V. Successive Recognition of Significant and Strong Earthquake-Prone Areas: The Baikal–Transbaikal Region. Dokl. Earth Sci. 2017, 477, 1488–1493. [Google Scholar] [CrossRef]
  40. Gvishiani, A.D.; Dzeboev, B.A.; Sergeyeva, N.A.; Belov, I.O.; Rybkina, A.I. Significant Earthquake-Prone Areas in the Altai–Sayan Region. Izv. Phys. Solid Earth 2018, 54, 406–414. [Google Scholar] [CrossRef]
  41. Gvishiani, A.D.; Dzeboev, B.A.; Sergeyeva, N.A.; Rybkina, A.I. Formalized Clustering and the Significant Earthquake-Prone Areas in the Crimean Peninsula and Northwest Caucasus. Izv. Phys. Solid Earth 2017, 53, 353–365. [Google Scholar] [CrossRef]
  42. Gvishiani, A.; Dubois, J. Artificial Intelligence and Dynamic Systems for Geophysical Applications; Springer: Berlin/Heidelberg, Germany, 2002; p. 350. [Google Scholar] [CrossRef]
  43. Gvishiani, A.D.; Mikhailov, V.O.; Agayan, S.M.; Bogoutdinov, S.R.; Graeva, E.M.; Diament, M.; Galdeano, A. Artificial intelligence algorithms for magnetic anomaly clustering. Izv. Phys. Solid Earth. 2002, 38, 545–559. [Google Scholar]
  44. Widiwijayanti, C.; Mikhailov, V.; Diament, M.; Deplus, C.; Louat, R.; Tikhotsky, S.; Gvishiani, A. Structure and evolution of the Molucca Sea area: Constraints based on interpretation of a combined sea-surface and satellite gravity dataset. Earth Planet. Sci. Lett. 2003, 215, 35–150. [Google Scholar] [CrossRef]
  45. Agayan, S.; Bogoutdinov, S.; Kamaev, D.; Kaftan, V.; Osipov, M.; Tatarinov, V. Theoretical Framework for Determination of Linear Structures in Multidimensional Geodynamic Data Arrays. Appl. Sci. 2021, 11, 11606. [Google Scholar] [CrossRef]
  46. Agayan, S.M.; Bogoutdinov, S.R.; Dobrovolsky, M.N. Discrete perfect sets and their application in cluster analysis. Cybern. Syst. Anal. 2014, 50, 176–190. [Google Scholar] [CrossRef]
  47. Shebalin, P.N.; Baranov, S.V.; Dzeboev, B.A. The Law of the Repeatability of the Number of Aftershocks. Dokl. Earth Sci. 2018, 481, 963–966. [Google Scholar]
  48. Vorobieva, I.; Gvishiani, A.; Dzeboev, B.; Dzeranov, B.; Barykina, Y.; Antipova, A. Nearest Neighbor Method for Discriminating Aftershocks and Duplicates When Merging Earthquake Catalogs. Front. Earth Sci. SI Nat. Clust. Earthq. Process. Var. Scales Lab. Exp. Large Earthq. 2022, 10, 820277. [Google Scholar] [CrossRef]
  49. Zaliapin, I.; Ben-Zion, Y. Earthquake clusters in southern California. I: Identification and stability. J. Geophys. Res. Solid Earth 2013, 118, 2847–2864. [Google Scholar] [CrossRef]
  50. Zaliapin, I.; Ben-Zion, Y. A global classification and characterization of earthquake clusters. Geophys. J. Int. 2016, 207, 608–634. [Google Scholar] [CrossRef] [Green Version]
  51. Hanks, T.C.; Kanamori, H. A Moment Magnitude Scale. J. Geophys. Res. Solid Earth 1979, 84, 2348–2350. [Google Scholar] [CrossRef]
  52. Kanamori, H. The Energy Release in Great Earthquakes. J. Geophys. Res. 1977, 82, 2981–2987. [Google Scholar] [CrossRef] [Green Version]
  53. Storchak, D.A.; Di Giacomo, D.; Bondár, I.; Engdahl, E.R.; Harris, J.; Lee, W.H.; Bormann, P. Public release of the ISC–GEM global instrumental earthquake catalogue (1900–2009). Seismol. Res. Lett. 2013, 84, 810–815. [Google Scholar] [CrossRef] [Green Version]
  54. Shebalin, N.V. Seismicity as a Tectonic Process. In Modern Tectonic Activity of the Earth and Seismicity; Nauka: Moscow, Russia, 1987; pp. 22–37. (In Russian) [Google Scholar]
  55. Atlas of earthquakes in the USSR. In The Results of Observations of the Network of Seismic Stations of the USSR in 1911–1957; AS USSR: Moscow, Russia, 1962; 336p. (In Russian)
  56. Mignan, A.; Werner, M.J.; Wiemer, S.; Chen, C.-C.; Wu, Y.-M. Bayesian estimation of the spatially varying completeness magnitude of earthquake catalogs. Bull. Seismol. Soc. Am. 2011, 101, 1371–1385. [Google Scholar] [CrossRef]
  57. Vorobieva, I.; Narteau, C.; Shebalin, P.; Beauducel, F.; Nercessian, A.; Clouard, V.; Bouin, M.-P. Multiscale mapping of completeness magnitude of earthquake catalogs. Bull. Seismol. Soc. Am. 2013, 103, 2188–2202. [Google Scholar] [CrossRef] [Green Version]
  58. Wiemer, S.; Wyss, M. Minimum Magnitude of Completeness in Earthquake Catalogs: Examples from Alaska, the Western United States, and Japan. Bull. Seismol. Soc. Am. 2000, 90, 859–869. [Google Scholar] [CrossRef]
Figure 1. The main structures of the eastern sector of the Russian Arctic. The yellow line is the boundaries of tectonic plates, the light green dotted line is the polar circle, and the red stars are the epicenters of earthquakes with M ≥ 6.0 that occurred over the past two decades. The white frame shows the boundaries of the studied region.
Applsci 12 11990 g001
Figure 2. The integrated earthquake catalog of the Eastern Sector of the Arctic zone of the Russian Federation (1962–2020) [16]. The white frame shows the boundaries of the region (coincides with the region marked in Figure 1), for which the catalog was created and within which FCAZ recognition was performed.
Applsci 12 11990 g002
Figure 3. FCAZ zones prone to earthquakes in the eastern sector of the Russian Arctic and epicenters of earthquakes with M ≥ 5.0.
Applsci 12 11990 g003
Figure 4. FCAZ zones prone to earthquakes (calculated at MR = 2.0) in the eastern sector of the Russian Arctic and earthquake epicenters with M ≥ 5.0. Designations as in Figure 3.
Applsci 12 11990 g004
Figure 5. FCAZ zones prone to earthquakes (calculated at MR = 1.5) in the eastern sector of the Russian Arctic and earthquake epicenters with M ≥ 5.0. Designations as in Figure 3.
Applsci 12 11990 g005
Figure 6. FCAZ zones prone to earthquakes (calculated at MR = 1.0) in the eastern sector of the Russian Arctic and earthquake epicenters with M ≥ 5.0. Designations as in Figure 3.
Applsci 12 11990 g006
Figure 7. FCAZ zones prone to earthquakes (calculated at MR = 0.5) in the eastern sector of the Russian Arctic and earthquake epicenters with M ≥ 5.0. Designations as in Figure 3.
Applsci 12 11990 g007
Table 1. The catalog of earthquakes with M ≥ 5.0 in the eastern sector of the Russian Arctic (1900–2020).
No.DateφλM
1.18.03.191363.4145.86.2
2.07.06.191473.0119.05.5
3.30.11.191871.2134.06.4
4.13.03.192463.0150.05.5
5.27.05.192462.0135.55.2
6.18.02.192569.0145.05.0
7.07.01.192782.0126.05.1
8.14.11.192769.9129.96.8
9.14.11.192770.1129.26.8
10.15.11.192770.5128.55.8
11.03.02.192870.5128.86.2
12.21.02.192866.5−173.06.9
13.24.02.192867.2−173.46.3
14.26.02.192866.7−172.56.5
15.01.05.192866.8−172.06.2
16.16.08.192870.0126.05.6
17.15.07.193158.9149.06.2
18.10.10.193159.3147.86.6
19.14.08.193262.8154.65.4
20.03.11.193659.0151.25.7
21.21.09.193758.0165.05.6
22.22.01.194359.0151.05.0
23.20.01.194460.0152.05.0
24.14.02.194461.0147.45.0
25.25.06.194559.0160.05.0
26.07.01.195157.9163.25.2
27.09.01.195181.0126.55.6
28.12.02.195165.8137.06.5
29.04.04.195165.0136.05.2
30.14.04.195161.3137.47.1
31.29.04.195181.5131.05.3
32.07.195466.0141.05.0
33.10.12.195564.0152.05.2
34.27.09.195764.2178.25.7
35.30.10.195965.9019136.87725.3
36.04.03.196267.5−172.95.0
37.19.04.196269.7372138.70825.7
38.20.05.196372.1598126.47045.0
39.21.07.196471.9745129.97325.4
40.13.12.196464.8511−165.7195.5
41.09.09.196866.1953142.1925.1
42.22.11.196957.6661163.51267.5
43.27.11.196958.0029163.28775.0
44.23.12.196957.6163.415.8
45.05.06.197063.3638146.16135.6
46.19.06.197057.77163.655.5
47.18.05.197163.9304145.96337.0
48.30.09.197161.6821140.30415.8
49.05.10.197167.3875−172.6895.3
50.13.01.197261.9098147.0635.7
51.03.08.197259.4635163.23625.4
52.19.06.197463.1401150.81635.0
53.21.01.197667.6968140.01025.1
54.21.01.197658.8296163.79616.2
55.22.01.197658.8758163.68175.3
56.17.02.197758.9873163.7595.1
57.19.08.197961.3151159.3345.3
58.01.02.198073.0967122.52275.3
59.08.11.198161.8134153.81025.4
60.22.11.198468.4472140.9515.1
61.10.09.198560.2631169.15385.2
62.01.03.199172.1393126.87035.3
63.08.03.199160.828167.07546.6
64.08.03.199160.8046167.14955.9
65.10.03.199160.9156167.2525.2
66.12.03.199160.7718167.17245.4
67.17.04.199160.7056166.97195.3
68.17.04.199160.6803166.93275.2
69.18.04.199160.8177167.02885.5
70.27.04.199160.7949167.10155.3
71.12.06.199158.3428163.26465.3
72.17.07.199260.8576167.32095.2
73.26.03.199458.2648164.12915.5
74.02.10.199566.5262179.28145.2
75.07.07.199658.5323157.82795.7
76.08.08.199658.6572157.77335.1
77.24.10.199666.9183−173.0416.0
78.03.01.199760.7922167.43445.4
79.24.03.199767.1386−173.1975.0
80.15.04.199858.433164.68875.8
81.07.01.199967.6958141.29965.2
82.07.01.200159.4549147.25775.4
83.25.01.200569.6608138.56565.1
84.20.04.200660.8802167.04647.6
85.20.04.200660.8857167.28485.9
86.21.04.200661.1195166.99065.8
87.21.04.200660.5932166.20155.4
88.21.04.200660.4496165.95876.1
89.21.04.200661.3001167.75246.0
90.21.04.200660.6778165.8865.2
91.21.04.200660.9465166.88565.0
92.22.04.200661.1619167.30845.5
93.26.04.200660.9509166.65785.0
94.29.04.200660.9127165.7995.2
95.29.04.200660.4481167.62326.6
96.29.04.200660.6655166.07645.2
97.09.05.200660.6836165.95125.7
98.18.05.200660.7608165.98455.0
99.22.05.200660.7339165.80816.6
100.22.05.200660.7847165.99615.3
101.24.05.200660.8614165.50755.0
102.06.09.200661.5752168.62935.3
103.04.10.200660.6272165.77935.0
104.19.10.200664.1002148.83375.2
105.11.01.200760.8981165.61735.0
106.24.05.200762.2792171.74045.3
107.13.04.200867.6428−166.865.2
108.22.06.200867.6952141.39336.1
109.21.04.200964.5778168.68585.0
110.08.05.200958.0536164.37645.4
111.02.08.201061.9985145.66765.3
112.21.05.201165.4772−166.8575.0
113.16.11.201165.1751146.09325.1
114.21.02.201267.5811−166.5615.1
115.26.03.201266.2727−174.5455.1
116.24.06.201257.5012163.41456.0
117.20.01.201364.8134146.5545.6
118.14.02.201367.5173142.70176.7
119.05.03.201367.661142.62655.1
120.13.03.201360.1064163.50955.8
121.10.05.201367.5282139.14385.2
122.25.08.201467.6471142.46125.0
123.06.03.201760.8706167.26335.0
124.12.06.201760.9257167.23645.1
125.16.01.201863.1535−172.2935.0
126.27.08.201858.7283158.85445.0
127.26.12.201958.8313158.79255.2
128.09.01.202062.358171.06116.4
129.09.01.202062.2438170.98055.2
130.01.09.202058.82159.0025.6
Publisher’s Note: MDPI stays neutral with regard to jurisdictional claims in published maps and institutional affiliations.

