
Characteristics of Desert Precipitation in the UAE Derived from a Ceilometer Dataset


1
Department of Meteorology, University of Reading, Reading RG6 6BB, UK
2
Met Office, Fitzroy Rd., Exeter EX1 3PB, UK
*
Author to whom correspondence should be addressed.
Atmosphere 2021, 12(10), 1245; https://0-doi-org.brum.beds.ac.uk/10.3390/atmos12101245
Submission received: 13 August 2021
/
Revised: 14 September 2021
/
Accepted: 19 September 2021
/
Published: 24 September 2021
(This article belongs to the Special Issue Aerosol, Cloud, Precipitation Processes and Interactions Observed with Ground-Based Remote Sensing Measurements)
Abstract
:Understanding rainfall in arid and water-scarce regions is central to the efficient use of water resources in agriculture, irrigation, and domestic food security. This work presents a new dataset with which to study precipitation processes in arid regions, utilising two years (2018–2020) of ceilometer observations made at Al Ain International Airport in the desert region of Al Ain, United Arab Emirates (UAE), where the annual rainfall is 76 mm. Ceilometer data provide a novel method by which to study both the evolution of water droplets from the cloud base down to the surface and the local circumstances required for rain to successfully reach the surface. In this work, we explore how successful precipitation depends on the initial size of the droplets and the thermodynamic profile below the cloud. For 64 of the 105 rain events, the droplet diameters ranged from 0.60 to 3.75 mm, with a mean of 1.84 mm. We find that smaller droplets, higher cloud bases, reduced cloud depths, and colder cloud bases all act to prevent successful precipitation, instead yielding virga (28 out of the 105 rain generating events). We identify how these multiple regional factors combine—specifically, we identify clouds deeper than 2.9 km, droplet diameters greater than 2 mm, and a midpoint below-cloud RH profile greater than 50%—to give successful rainfall, which may ultimately lead to more efficient rainfall enhancing measures, such as cloud seeding.
1. Introduction
1.1. Background
The generation of precipitation in arid regions is, by definition, rare. It requires moisture availability, cloud processes that can grow droplets to large sizes, and conditions in which droplets can reach the surface without evaporating. For precipitation to occur at all therefore requires a fortuitous combination of circumstances, all of which individually have a low probability, and may also occur intermittently. Understanding details of rainfall generation in these conditions is important for weather forecasting and the evaluation of artificial interventions to increase rainfall. The United Arab Emirates (UAE) offers an environment in which arid rainfall generation can be investigated, due to its proximity to the Arabian Gulf, but with contrasting areas of desert and mountains.
Despite the generation of clouds (on average, 24% of the time at Al Ain, UAE [1]) successful rainfall in the UAE is still a rare phenomenon. Cloud droplet number concentrations are typically substantial, likely due to the abundance of aerosol particles on which the water droplets form. Previous aircraft observations in the UAE have shown cloud droplet number concentrations ranging from 100–1000 cm−3, with summer clouds generally containing higher droplet concentrations (typically 400–800 cm−3) than winter clouds [2], but the droplets are small. For instance, Wehbe et al. [3] report on recent aircraft observations of warm cumulus clouds, which are dominated by small droplets with diameters less than 10 μm and only minimal concentrations of intermediate sized droplets (10–30 μm). Combined with narrow size distributions, it is difficult for droplets to grow to raindrop sizes, as Rosenfeld and Gutman [4] and other works (e.g., [5]) suggest that an effective droplet radius larger than 14 μm is needed to trigger collision–coalescence processes and warm rain generation. In the UAE, there is also a seasonal variation in aerosol concentrations, whereby winter aerosol concentrations near the surface are generally greater than in summer due to less convective mixing, with lower boundary layer heights (typically 1.5 km during winter and >3.5 km during summer) [6]. Hence, the cloud condensation nuclei (CCN) concentrations inside clouds, and therefore the potential to grow cloud droplets to rain droplet sizes, also depend on the aerosol in the boundary layer through which updrafts pass to the clouds [3].
Previous and current research on cloud and precipitation processes have produced a number of sophisticated cloud parcel microphysics models (e.g., [7]), and cloud resolving large eddy simulation models (e.g., [8]), which can be used to study small scale interactions between cloud droplets and aerosol particles, simulating processes such as the condensation and evaporation of water vapor onto aerosols, droplet activation and condensational growth, and collision and coalescence between droplets. Precipitation rates calculated from such models are often solely for the cloud base (e.g., [9]), and few studies focus on the precipitation rate reaching the surface (which is affected by droplet evaporation), which is the most important region in water-scarce regions of the world. The issue of droplet evaporation in arid regions produces major discrepancies between the number and size of droplets leaving the cloud base and those detected at the ground [10]. This is a known problem in radar-derived estimates of precipitation [10]. Previous experimental campaigns to investigate rainfall evaporation have attempted to track the droplet size distribution along the path of the falling droplets in mountainous regions (e.g., [11,12]), and radar reflectivity measurements have also estimated rainfall evaporation [13,14]. These studies all reported a decrease in precipitation rate with a decreasing height. More recent observational campaigns of evaporative processes beneath clouds have typically investigated the evaporation of drizzle from marine stratocumulus (e.g., [15,16,17,18]), often using in situ data from aircraft and surface based radar data, but few have focused on the evaporation of rainfall in arid areas. Here, we aim to improve the lack of detailed cloud microphysical data in such regions for precipitation studies.
In this paper, we present a new dataset for precipitation studies from a relatively understudied region of the world—the United Arab Emirates (UAE). We employ the novel technique of using ground-based ceilometer data to record and monitor precipitation events at a high spatial and temporal resolution. Observing these events from the surface allows for the path of falling droplets to be monitored and assessed for droplet evaporation effects. The ceilometer backscatter data are used to determine droplet fall speeds and sizes in order to characterise microphysical properties of UAE rainfall. This method has advantages over rainfall rates derived from conventional weather radars, which are insensitive to small droplet sizes, and also other surface-based methods, such as rain gauges, which depend on successful precipitation in order to work. To our knowledge, this is the first dataset from the UAE to monitor precipitation events using a ceilometer; the high vertical resolution data allow us to investigate the different contributions necessary for successful precipitation in this arid region.
Herein, we combine new data taken from a range of sources (surface-based ceilometer, satellite, and reanalysis) to determine the anatomy of a successful rainfall event in the UAE. Section 1.2 provides more information on the local climatology, with Section 1.3 providing an observed example of a typical rainfall event. Section 2.1 examines the role of droplet evaporation on the survival of droplets to the surface. Section 2.2 introduces a method to retrieve the raindrop size from the surface ceilometer measurements and Section 3 presents the results in the form of a statistical analysis from the new dataset of all observed rainfall events within the 2 year observation time period. Section 4 and Section 5 provide discussion and conclusions.
1.2. Climatological Aspects
Clouds occur in the UAE during the winter (November–March) and summer (June–August), although they are more common in winter [19]. In the summer, predominantly anticyclonic conditions occur, often with a weak easterly flow bringing winds from the Gulf of Oman [2]. Most of the rainfall in the summer months is convective; for example, is triggered over the Al Hajar mountains to the east [20,21]. A major component of the development of convective activity in the UAE is the sea breeze, which forms on 77% of days annually, mostly during the summer months [22]. The sea breeze is generated by temperature differences between land and sea regions, caused by differential solar heating, and tends to originate from the westerly coastline of the UAE, bringing moist sea air hundreds of km inland towards the desert regions. In the winter, mostly westerly and north-westerly flows bring troughs, depressions, and occasional fronts into the UAE, which can provide significant rainfall. The occasional crossover of pressure troughs from the eastern Mediterranean, as well as localised trough fronts from central Iran, occur during this period, in addition to the Red Sea Trough extending from the southwest [23]. Most of the weather systems are weak in terms of convective instability, producing extensive cloud cover, but only light rain and drizzle. Ice-driven precipitation processes are prevalent in winter clouds in the UAE [2]. Strong synoptic events that trigger flash floods do occur but are rare [24], leading to annual rainfall in the UAE being highly variable. Accurate rainfall data in this region have previously been difficult to obtain [25], but a variety of related observations are increasingly becoming available, such as satellite data (e.g., [26]) and combined hydrological data products [27].
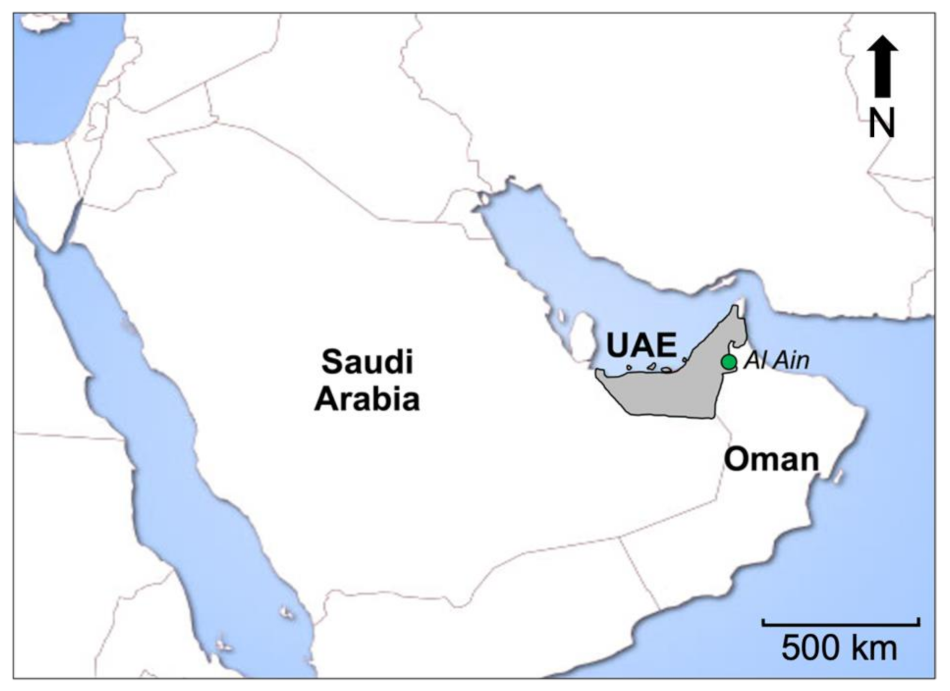
New data have been obtained from equipment specially installed in the UAE at the low rainfall site of Al Ain (annual rainfall 76 mm), which is examined here to investigate the different contributions necessary for a successful precipitation event. The suite of surface measurement equipment was installed at Al Ain International Airport (24°15’ N, 55°37’ E, see Figure 1), and ran for two years between 2018 and 2020. The data principally considered here are from a Vaisala CL31 ceilometer, which determines a vertical profile of backscatter, at least to the cloud base (other instruments operating at the site are described in [28]). Supporting cloud information was derived from the UAE’s National Center for Meteorology (NCM) C-band weather radar network and from EUMETSAT Meteosat 8, a geostationary satellite centred at 41.5° N over the Indian Ocean. Associated tropospheric thermodynamic profiles (including temperature and relative humidity, RH) were extracted from the European Centre for Medium Range Weather Forecasts (ECMWF) ERA5 reanalysis dataset [29].
1.3. Example Rainfall Event
Climatologically, the greatest precipitation at Al Ain occurs during February and March [2]. During its period of operation, 2018–2020, the ceilometer provided 476 days of complete data, in which there was a total of 57.5 h of rain (0.5%). Of 105 rainfall events, 97 occurred during February to April. A typical day with multiple rainfall events is shown in Figure 2.
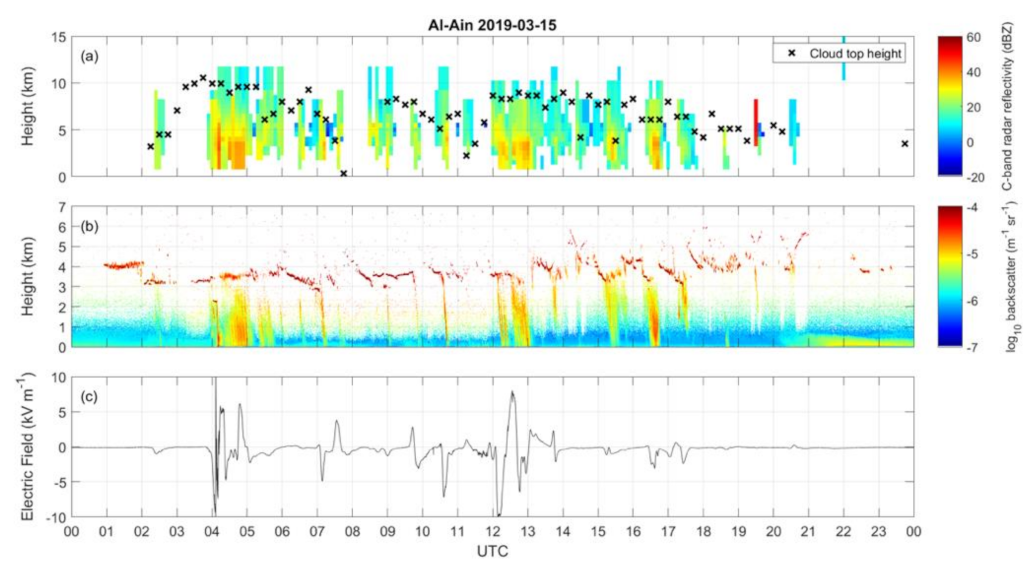
Figure 2 shows the C-band microwave radar reflectivity (dBZ), the ceilometer lidar backscatter profile, and the vertical electric field strength for the instrumented site at Al Ain International Airport on 15 March 2019. These observations are typical for a day when intermittent rain occurs and is one of 28 days upon which rain was observed throughout the study period. Reflectivity values exceeding 30 dBZ and below 5 km are considered indicative of falling precipitation. Using an empirical reflectivity–rainfall rate approximation [30], rainfall rates of 2.7 mm h−1 and 11.5 mm h−1 can be estimated from the 30 dBZ and 40 dBZ values, respectively. The rainfall is also observed in the ground-based ceilometer retrieval in Figure 2b. Figure 2a also shows the vertical extent of the clouds that result in the precipitation, some of which attain thicknesses of up to ~8 km. The cloud base height of 3 to 4 km is also typical of days upon which rain occurs at this location (the mean cloud base height is 3.5 km for all rain events studied), which is somewhat higher than cloud bases commonly experienced at mid-latitudes. The convective and mixed-phase nature of the cloud is evident from the variability apparent in the local electric field, Figure 2c, with fields of up to ~10 kV m−1 observed during rain events.
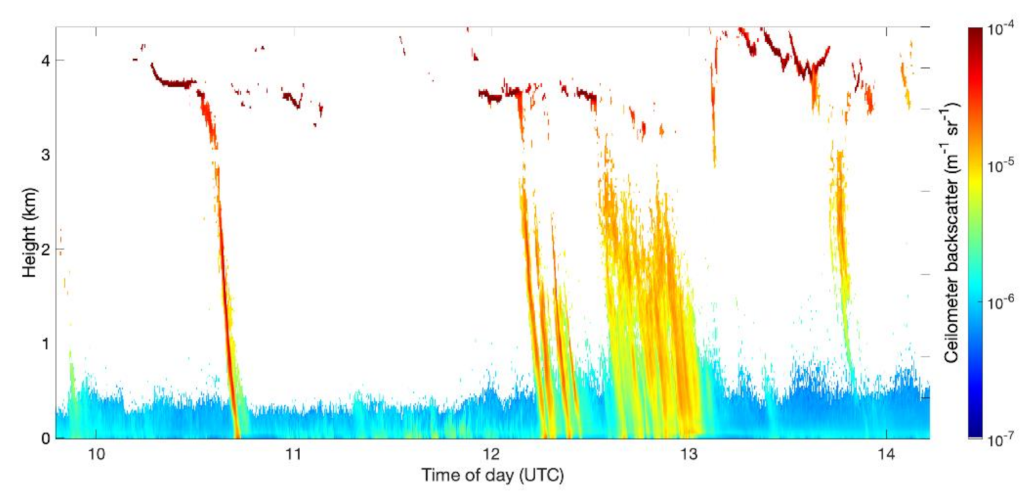
Figure 3 shows a subset of the Figure 2b data from 15 March 2019. The backscatter in the lowermost ~500–1000 m is dominated by aerosols in the boundary layer, such as fine windblown dust. The cloud base is apparent as the intermittent dark red backscatter at around 3.5 to 4 km altitude. Clouds above this are obscured from the ceilometer but can be determined to be several kilometres thick in places from the radar data in Figure 2a. Where rain occurs, this is evident in the ceilometer backscatter below the cloud base as a region of substantial backscatter, sloping at an angle to the vertical, which is related to the fall speed. Several such precipitation events occurred on 15 March 2019. As previously highlighted, some precipitation events produce droplets that evaporate before they reach the ground, i.e. virga, such as the event at around 1345 UTC. An “unsuccessful” precipitation event for the purposes of this study is therefore classified as yielding backscatter less than 5 × 10⁻⁶ m−1 sr−1 at the surface.
2. Materials and Methods
2.1. Theoretical Considerations: Droplet Evaporation
The occurrence of unsuccessful precipitation events, in which water droplets are generated and fall, but evaporate before they reach the ground, motivates an investigation into the lifetime of droplets in the deep unsaturated environment beneath a cloud, and the droplet size necessary to resist evaporation. For a water droplet of radius a, its rate of evaporation is given as
by Prupaccher and Klett [31], as their equation 13–64. The direction of the water vapour flux is determined by the ambient environmental temperature T∞, the ambient environmental vapour pressure e∞, the droplet temperature Ta, and the saturation vapour pressure ea at Ta. Further quantities in this expression are the density of water ⍴w (1000 kg m−3), the diffusion coefficient of water vapour Dv (2.91 × 10⁻⁵ m2 s−1), the relative molecular mass Mr of water (0.018 kg mol−1), the universal gas constant R (8.31 J K−1 mol−1), and a ventilation coefficient fV. This equation can be integrated with time to find the droplet radius at a time t, a(t), if an initial radius a0 at t = 0 is known. In order to find this, an expression for Ta is also needed, as provided by Prupaccher and Klett’s equation 13–23. This set of coupled equations has been integrated using an adaptive step-size Runge–Kutta method [32], with the ventilation coefficient disregarded (i.e., assuming fV = 1).
In the case of a falling droplet, the droplet size found from Equation (1) can be used to find the fall speed, and therefore the total distance travelled and the total fall time can also be found. If an individual droplet is released from the cloud base at t = 0 with a specified initial size in given thermodynamic conditions, Equation (1) can be solved to find the evolution of the droplet size. As the droplet size changes only slowly, the fall speed can be assumed to be the terminal velocity, which can be calculated from a size–velocity relationship (e.g., [33]) in response to the instantaneous droplet size. If the droplet falls into air having different thermodynamic properties, the conditions in Equation (1) will change, modifying the droplet evaporation and, in turn, the terminal velocity.
For these calculations, the environmental conditions have been specified by a set of vertical temperature and humidity profiles extracted from the ERA5 meteorological reanalysis [29]). ERA5 is produced by assimilating satellite, surface site, radiosonde, and aircraft data on a global scale to reproduce an accurate representation of the atmosphere with a 30 km horizontal resolution. As ERA5’s vertical resolution is of the order 20–200 m between the surface and 3.5 km, a continuous vertical profile of Ta is linearly interpolated to allow the es(Ta) term in Equation (1) to be found at each height. Adjustment to a new terminal velocity typically occurs over a few tens of metres (and therefore with a timescale <10 s for a droplet falling at 5 m s−1), whereas evaporation occurs more slowly (with timescales ~100 s). Fall speed and evaporation can therefore be approximated as decoupled, hence the droplet’s terminal velocity can be re-evaluated at each time step in size.
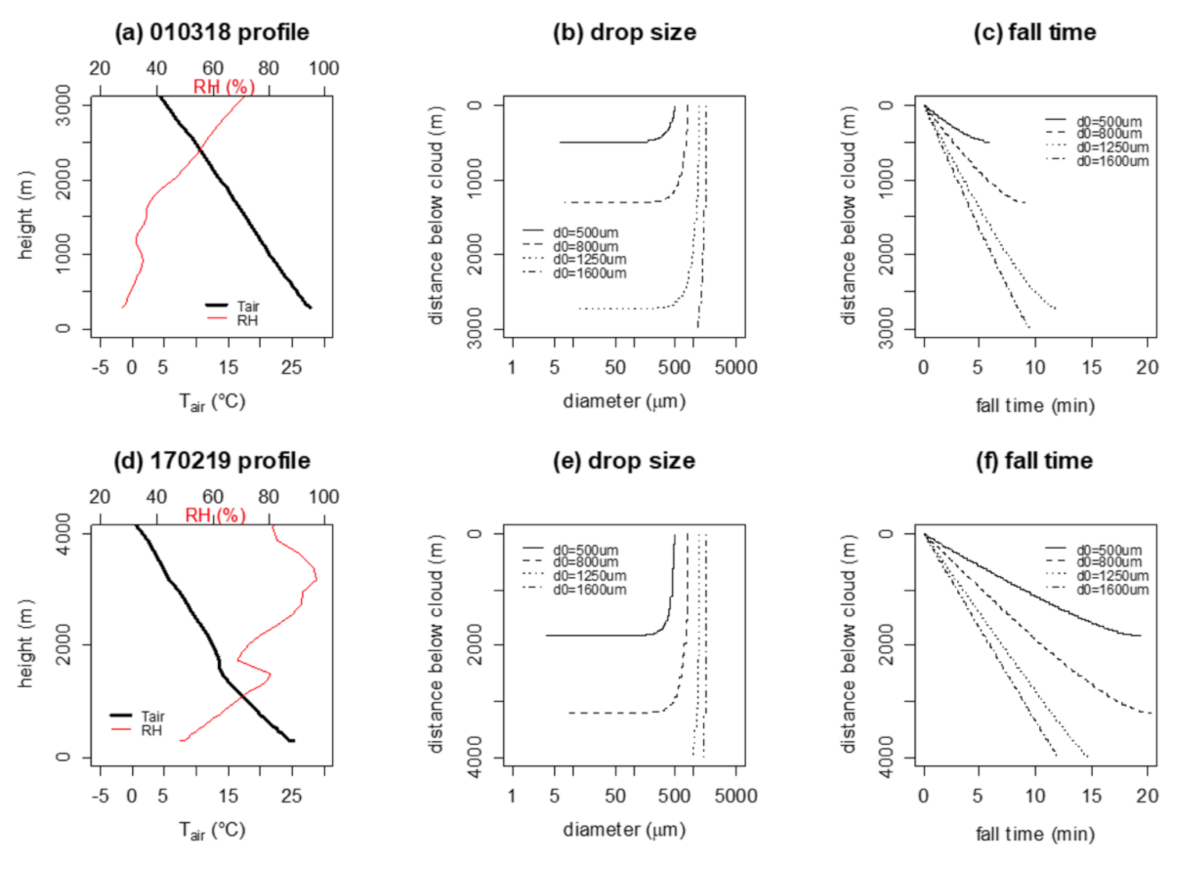
Figure 4 shows two cases for environmental conditions beneath a cloud that are less humid (thermodynamic profile (a)) and more humid (thermodynamic profile (d)), obtained from ERA5 for the time at which precipitation was recorded on the two days of interest at the Al Ain site (note that the cloud base height was different in these two cases, at 3 km and 4 km, respectively). The distances fallen by droplets beneath the cloud base in these two thermodynamic situations are shown in (b) and (e), plotted against droplet size. These show how the droplet size changes as the droplet falls, and that droplets with small initial sizes when leaving cloud base can evaporate before reaching the ground. It is clear that a droplet of the same size will descend further before being lost by evaporation in the more humid profile than the relatively drier profile. Hence, to reach the surface in a drier profile, the droplet needs to be larger. In the two cases presented, the minimum droplet diameters for survival to the surface were 1.35 mm (drier case) and 1.00 mm (moister case). The time taken to reach the surface in each case is given in (c) and (e) for different droplet sizes. Those droplets that begin to shrink fall more slowly and only fall a further few hundred meters before they finally evaporate; those droplets that do survive to the surface typically have a lifetime of 10 min, depending on the cloud base height.
In summary, the cloud base height above several km generates such a long path that only droplets above a certain size will survive in order to reach the surface. The details of the thermodynamic profile beneath the cloud determines the minimum droplet size released at cloud base that will successfully reach the surface, and therefore produces a requirement of the cloud to generate sufficiently large droplets. For droplets sufficiently large to survive, there is little change in their size during the descent, but for those that begin to shrink (typically at approximately 0.5 mm diameter), they can rapidly disappear.
2.2. Droplet Size Retrieval
The ceilometer observations made at Al Ain allow the droplet sizes to be determined. As droplet diameter and droplet terminal velocity are closely related (e.g., [33,34]), if the vertical fall speed found using the ceilometer is assumed to represent the terminal velocity, the droplet diameter can be inferred. For this, the fall time and distance travelled by droplets are measured by selecting two data points on the leading edge of the backscatter profile, such as those on Figure 3 seen curving to the right; the points are selected on a threshold backscatter value of 5 × 10⁻⁶ m−1 sr−1, and the fall speed V is calculated. In each case, the determination is made as close as possible to the cloud base, in order to derive the droplet size as it is released from the cloud.
Estimates of the droplet sizes can then be found from the observed fall speed V, which is assumed to be equal to the terminal velocity VT. First, VT is converted to its equivalent value V0 at standard conditions (20 °C and 1013 hPa) using Equations (2) and (3), as outlined in Foote and du Toit [34].
where
T0 and ρ0 are temperature and air density, respectively, at standard conditions. ρ is found from the local thermodynamic profile (P, T, and RH), interpolated to the height at which the fall speed is found, using the ERA5 reanalysis data [29]) at the hourly time step closest to the local rainfall event time.
Having found V0, the droplet diameter d is determined from the polynomial of Equation (4)
where the coefficients for bj are given in Table 1 of Foote and du Toit [34]. Using this approach, it was possible to derive the cloud leaving rain droplet sizes for 64 of the 105 rain events, which varied from 0.60 to 3.75 mm, with a mean of 1.84 mm.
3. Results
To analyse the rainfall events, a range of different cloud data from different sources are brought together. The ceilometer provides the cloud base height directly, and the retrieval process described in Section 5 allows for the raindrop size to be inferred. The thermodynamic information from ERA5 provides the cloud temperature and the profile of the below-cloud environment. Cloud depth is also relevant, as deeper clouds are more likely to be mixed-phase, with vigorous vertical motion enhancing the droplet sizes.
Whilst the C-band radar in Figure 2 provides a cross-sectional view of the cloud, its operating frequency is most sensitive to precipitable hydrometeors and will not be influenced by the small droplets and ice crystals at the cloud top. To estimate the cloud depth, therefore, the cloud top height is found from EUMETSAT Meteosat 8, a geostationary satellite positioned at 41.5° E over the Indian Ocean. For this, the 15 min scan closest in time to each rainfall event for the Al Ain geospatial coordinates is selected. The cloud base height derived from the CL31 ceilometer before the precipitation event is extracted and subtracted from the satellite-derived cloud top height in order to yield the cloud depth. It is assumed that the entire depth contains cloud, such as in Figure 2.
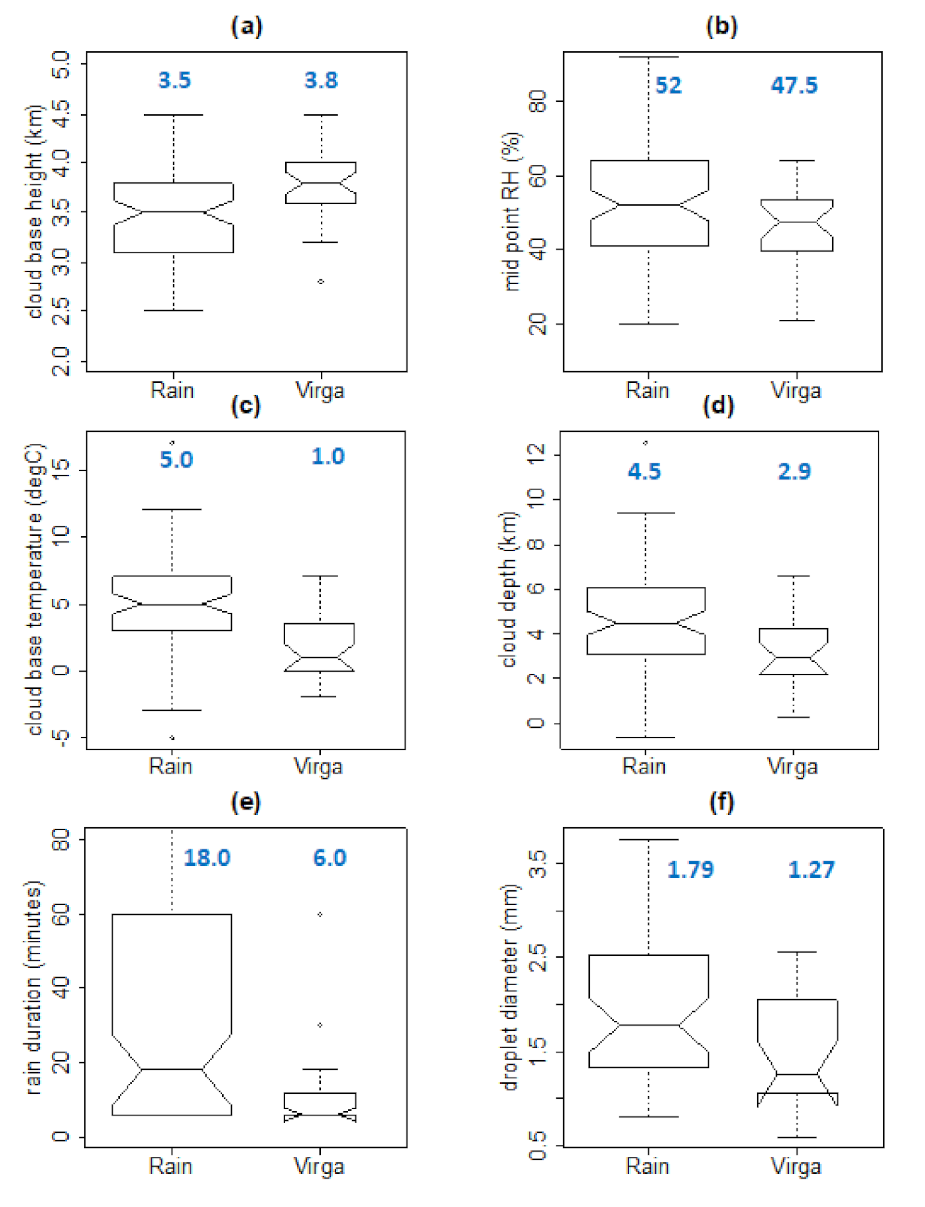
Figure 5 summarises the cloud properties from potential rain-producing clouds at Al Ain, as determined from a combination of the ceilometer, radar, and ERA5. Data for the cloud base temperature and the midpoint RH (which is the relative humidity midway between the cloud base and surface) were obtained from ERA5. Of 105 individual falling droplet events, 77 events occur in which the droplets reach the ground, and are therefore defined as precipitation, and, in 28 events, the droplets evaporate before reaching the ground, generating virga. The values in blue represent the median values from the boxplots for each of the “rain” and “virga” events separately.
Figure 5a demonstrates the altitude range of cloud bases at Al Ain, with a median of 3.5 km for clouds successfully generating precipitation, and 3.8 km for virga-producing clouds. The virga events are associated with a reduced relative humidity (RH) at the midpoint of the vertical profile between the cloud base and the ground. Figure 5b shows that the midpoint relative humidity (RH) is reduced during virga events (47.5%) compared to rain events (52%). Figure 5c demonstrates that there is also a statistically significant difference in the cloud base temperature between rain and virga events. Rain events have warmer cloud bases (median 5 °C) than virga clouds (median 1 °C). This is linked with the higher cloud base of the virga-generating clouds, which, in many cases, are likely to be colder. The depth of the falling droplet cloud layer is examined in Figure 5d, which demonstrates that rain-producing clouds are generally deeper (median 4.5 km) than clouds that produce virga (median 2.9 km). This is consistent with the expectation that deeper clouds are more efficient at producing precipitation [35], as they typically contain more liquid water, generating larger cloud droplets and raindrops that are more likely to survive evaporation. Rainfall-related characteristics of the Al Ain droplet-producing clouds are further examined in Figure 5e,f. Figure 5e shows the large variability in the duration of rain events (defined as the duration between the backscatter value exceeding 5 × 10⁻⁶ m−1 sr−1) at Al Ain, from 6 min to 6 h. Virga events are briefer than rain events (with median durations of 6 min and 18 min, respectively). Using the ceilometer method to retrieve the droplet diameter, Figure 5f demonstrates smaller droplet diameters in virga events (median 1.27 mm) than for the successful rainfall events (median 1.79 mm). In addition, a sustained precipitation event may itself increase the humidity beneath the cloud, reducing the prospects for droplet evaporation. In summary, the clouds that only produce virga rather than rainfall are higher in altitude, thinner, colder, and short lived. They represent a category of marginal cloud events unable to generate sufficiently large droplets that are able to survive in order to reach the surface.
4. Discussion
This work identifies several controlling factors that are required for a successful rain event through examining a specific event and summarising all of the events statistically. The results show that the microphysical conditions within the cloud, the height and depth of the cloud, and the thermodynamic conditions beneath the cloud are all important in successful precipitation. These factors have to conspire favourably to, firstly, produce large droplets, and, secondly, provide thermodynamic conditions in which the droplet can survive in order to reach the surface. The combination of requirements, for which the individual probabilities are small, is the reason why, despite the presence of clouds, successful rain events are rare at the Al Ain site.
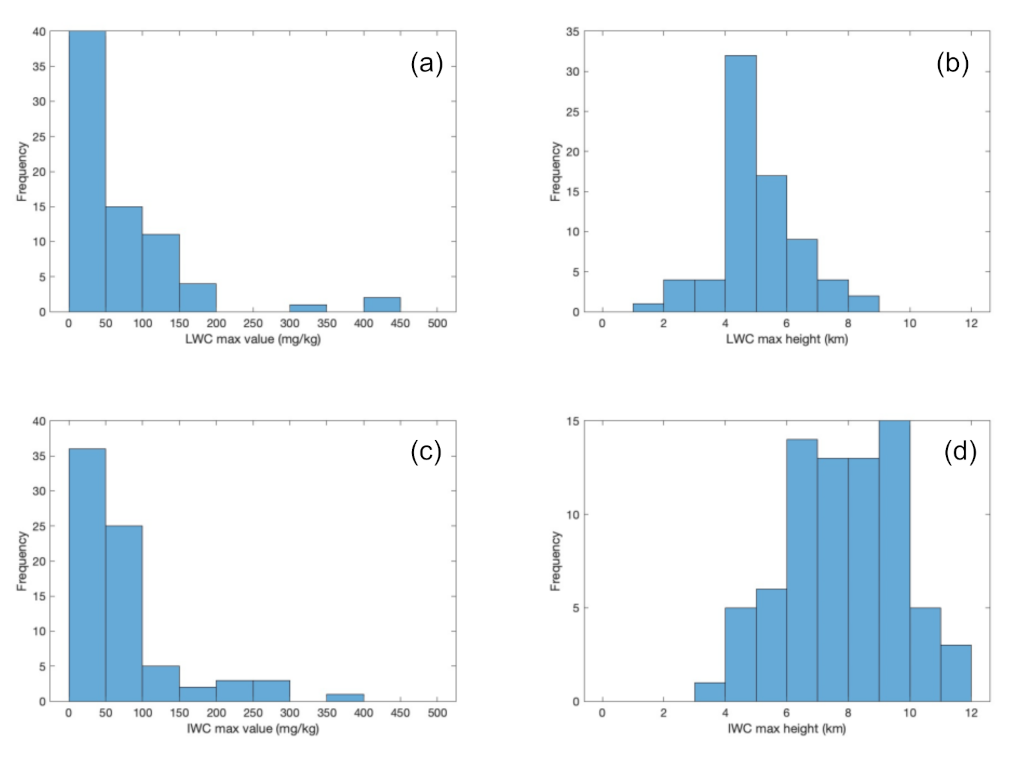
The first condition that must be fulfilled is the generation of droplets that are sufficiently large enough to fall from the cloud. For this, droplets need to grow both homogeneously and through droplet–droplet collisions. The clouds observed in this study are invariably mixed-phase, often with large ice concentrations in the upper cloud observed in the satellite-derived profiles. The greatest ice water concentrations (IWC) are observed as occurring mainly between 6 and 10 km altitudes, and peak liquid water concentrations (LWC) are observed as occurring between 4 and 6 km (Figure 6). It is likely that the ice is feeding the lower cloud as conditions allow at the freezing level, which occurs within the cloud for the majority of falling droplet events considered. As stated earlier, the median virga and rain droplet diameters attained are 1.27 to 1.79 mm, respectively, which are, in principle, able to survive to the surface even within a sub-saturated environment.
Once droplets have been released from the cloud base, they must survive the journey to the surface in order to yield precipitation. Beneath the cloud base, a falling droplet experiences an increasing temperature and decreasing RH (as seen in example profiles in Figure 4a,d), both of which facilitate evaporation. Whether or not this results in virga or precipitation depends on the droplets’ initial size and the conditions through which they fall. Relatively large droplets from relatively lower, deeper, and warmer clouds lead to a greater probability that successful rainfall will result (Figure 5).
The principle processes key to successfully generating precipitation therefore occur within the cloud. When those conditions are fulfilled, it is only for the borderline rain/virga cases that the below-cloud conditions play a determining role in whether or not the rain event is successful. Where within-cloud conditions are sufficient, relatively large droplets, commonly of around 2 mm diameter, but up to >4 mm in some cases, are necessary to be sufficiently resistant to evaporation in order to reach the surface. As seen in Figure 5a,f, it is the smaller droplets from higher cloud bases that lead to virga.
This knowledge becomes important in considerations of interventions in order to increase the probability of successful rainfall. To increase the chances of rainfall, the production of large droplets (>1.5 mm) that will survive the temperature and RH conditions in the region below the cloud is essential with sub-millimetre droplets and drizzle, which, when produced at the cloud base, will never survive evaporation in order to reach the surface. This sets a criterion for targeted interventions in the form of rain enhancement processes, such as cloud seeding, which is routinely attempted by the UAE’s National Center for Meteorology. Although no detailed observations of cloud seeding effects on hydrometeor size distributions or cloud microphysics modelling studies of this are available yet for the UAE environment, recent observational and modelling efforts on the seeding of warm marine stratocumulus clouds in California [9] have demonstrated an effect of cloud seeding on the hydrometeor size distribution. Tonttila et al. [9] show a clear increase in concentrations of droplets around the 100–200 µm range initially (demonstrating a conversion from cloud droplets to drizzle sizes), followed by an increase in the sub-millimetre diameters after around an hour after seeding. Very few raindrop diameters of >1 mm were observed. Although the results of such modelling studies are not directly applicable to clouds in the UAE environment (due to differences in the microphysical properties of the clouds, cloud depths, heights, and turbulent properties, as well as differences in concentrations of the seeding material), any similar enhancement in the hydrometeor size distribution at the cloud base in the UAE would be unlikely to result in any precipitation detected at the surface in such arid regions.
5. Conclusions
The study described here presents a new collection of data over two years from the United Arab Emirates (UAE)—a region of the world where detailed microphysical observations of precipitation events are only beginning. The novel use of ceilometer data demonstrates an effective method to study the path of falling raindrops from the cloud base to the surface, which is not possible using more readily available data, such as from weather radar or surface-based precipitation gauge networks. The dependence of rainfall on the cloud properties, temperature and relative humidity of the within- and below-cloud regions, cloud base height, droplet activation, and growth processes is generally well understood in mid-latitudes, but there are unusual constraints in arid regions, such as the UAE. This is an important consideration for water management for both habitation, agricultural irrigation, and industrial activity in these regions [36].
At Al Ain, where clouds are relatively rare compared with mid-latitudes, this paper demonstrates that a significant proportion of the potential precipitation events lead instead to only short-lived virga occurrences. Understanding the underlying processes statistically and physically can therefore explain why and where rainfall reaches the surface, and a more informed approach can be taken towards the interventions, such as cloud seeding and related technologies.
As shown here, the factors involved in successful rainfall generation can be divided into two categories: those occurring within the cloud, and those occurring below the cloud. Those occurring within the cloud are concluded to be more important in their influence upon whether or not a rain event can be considered successful. Crucial in the determination of whether rain will reach the surface, with respect to both aspects, is the cloud base height. Cloud base heights are characteristically high in the study region, commonly occurring at around 3–4 km. Within-cloud processes that are affected begin with droplet nucleation, with the availability of CCN associated with aerosols in the boundary layer potentially depleted. Cold cloud bases and high ice concentrations in the upper clouds contribute to facilitating droplet growth to 1–2 mm, which is sufficient to fall as rain, but not always to reach the surface. With a high cloud base, the longer droplet lifetime required increases the chance of evaporation. Fall times are commonly ~10 min and, within dry sub-saturated air, virga may result. Only the larger droplets released from the cloud base are likely to reach the surface; smaller droplets, higher cloud bases, smaller cloud depths, and lower cloud base temperatures all favour the occurrence of a rain event terminating as virga.
In terms of interventions with the aim of increasing the rainfall incidence at the surface, these findings directly inform decision making surrounding cloud seeding operations using hygroscopic nuclei to enhance CCN activity. They indicate that seeding clouds deeper than 2.9 km or longer lived than 6 min is a minimum requirement to enhance rainfall through the generation of large droplets. In addition, if it is known that the local thermodynamic profiles below the clouds are likely to only result in virga, the decision can be made to not use valuable cloud seeding resources. Such findings may therefore help cloud seeding resources, both logistical in terms of the aircraft and resources in terms of the material dispersed, to be targeted more efficiently.
Author Contributions
Conceptualization, R.G.H. and M.W.A.; methodology, M.W.A., K.A.N., R.G.H. and G.J.M.; software, M.W.A., R.G.H. and G.J.M.; validation, M.W.A.; formal analysis, M.W.A. and R.G.H.; investigation, M.W.A., K.A.N. and R.G.H.; resources, R.G.H. and M.W.A.; data curation, M.W.A.; writing—original draft preparation, M.W.A. and R.G.H.; writing—review and editing, M.W.A., K.A.N., R.G.H. and G.J.M.; visualization, M.W.A., R.G.H. and G.J.M.; supervision, R.G.H.; project administration, R.G.H. and K.A.N.; funding acquisition, R.G.H. and K.A.N. All authors have read and agreed to the published version of the manuscript.
Funding
This material is based on work supported by the National Center of Meteorology, Abu Dhabi, UAE under the UAE Research Program for Rain Enhancement Science (UAEREP). M.W.A. acknowledges funding under the Science and Technology Facilities Council STFC (ST/R000921/1). K.A.N. acknowledges an Independent Research Fellowship funded by the Natural Environment Research Council NERC (NE/L011514/1) and (NE/L011514/2).
Institutional Review Board Statement
Not applicable.
Informed Consent Statement
Not applicable.
Data Availability Statement
ECMWF data are available from ECMWF MARS archive. EUMETSAT Meteosat 8 data is available from http://www.eumetsat.int/ (accessed on 19 September 2021). Ceilometer and electric field data can be accessed from the University of Reading data repository at https://researchdata.reading.ac.uk (accessed on 19 September 2021).
Acknowledgments
The authors acknowledge the support of the National Center of Meteorology, Abu Dhabi, and Al Ain international airport for the deployment and maintenance of field equipment.
Conflicts of Interest
The authors declare no conflict of interest.
References
- Yousef, L.A.; Temimi, M.; Wehbe, Y.; Al Mandous, A. Total cloud cover climatology over the United Arab Emirates. Atmos. Sci. Lett. 2019, 20, 2. [Google Scholar] [CrossRef]
- National Center of Meteorology and Seismology, UAE. Rainfall Enhancement Assessment Program, United Arab Emirates (2001–2005). 2005 Report. Available online: http://www.gccmet.net/libraries/download/5 (accessed on 18 September 2021).
- Wehbe, Y.; Tessendorf, S.A.; Weeks, C.; Bruintjes, R.; Xue, L.; Rasmussen, R.M.; Lawson, P.; Woods, S.; Temimi, M. Analysis of aerosol-cloud interactions and their implications for precipitation formation using aircraft observations over the United Arab Emirates. Atmos. Chem. Phys. Disc. 2021, 1–28. [Google Scholar] [CrossRef]
- Rosenfeld, D.; Gutman, G. Retrieving microphysical properties near the tops of potential rain clouds by multispectral analysis of AVHRR data. Atmos. Res. 1994, 34, 259–283. [Google Scholar] [CrossRef]
- Brenguier, J.L.; Chaumat, L. Droplet spectra broadening in cumulus clouds. Part I: Broadening in adiabatic cores. J. Atmos. Sci. 2001, 58, 628–641. [Google Scholar] [CrossRef]
- Filioglou, M.; Giannakaki, E.; Backman, J.; Kesti, J.; Hirsikko, A.; Engelmann, R.; O’Connor, E.; Leskinen, J.T.T.; Shang, X.X.; Korhonen, H.; et al. Optical and geometrical aerosol particle properties over the United Arab Emirates. Atmos. Chem. Phys. 2020, 20, 8909–8922. [Google Scholar] [CrossRef]
- Roelofs, G.J.; Kamphuis, V. Cloud processing, cloud evaporation and Angström exponent. Atmos. Chem. Phys. 2009, 9, 71–80. [Google Scholar] [CrossRef] [Green Version]
- Tonttila, J.; Maalick, Z.; Raatikainnen, T.; Kokkola, H.; Kuhn, T.; Romakkaniemi, S. UCLALES-SALSA v1.0: A large-eddy model with interactive sectional microphysics for aerosol, clouds and precipitation. Geosci. Model Dev. 2017, 10, 169–188. [Google Scholar] [CrossRef] [Green Version]
- Tonttila, J.; Afzalifar, A.; Kokkola, H.; Raatikainen, T.; Korhonen, H.; Romakkaniemi, S. Precipitation enhancement in stratocumulus clouds through airbourne seeding: Sensitivity analysis by UCLALES–SALSA. Atmos. Chem. Phys. 2020, 21, 1035–1048. [Google Scholar] [CrossRef]
- Li, X.; Srivastava, R.C. An analytical solution for raindrop evaporation and its application to radar rainfall measurements. J. Appl. Meteorol. 2001, 40, 1607–1616. [Google Scholar] [CrossRef]
- Gori, E.G.; Joss, J. Changes of shape of raindrop size distributions simultaneously observed along a mountain slope. J. Rech. Atmos. 1980, 14, 289–300. [Google Scholar]
- Levin, Z.; Feingold, G.; Tzivion, S.; Waldvogel, A. The Evolution of Raindrop Spectra: Comparisons between modeled and observed spectra along a mountain slope in Switzerland. J. Appl. Meteorol. 1991, 30, 893–900. [Google Scholar] [CrossRef] [Green Version]
- Leary, C.A.; Houze, R.A. Melting and evaporation of hydrometeors in precipitation from the anvil clouds of deep tropical convection. J. Atmos. Sci. 1979, 36, 669–679. [Google Scholar] [CrossRef] [Green Version]
- Rosenfeld, D.; Mintz, Y. Evaporation of Rain Falling from Convective Clouds as Derived from Radar Measurements. J. Appl. Meteorol. 1988, 27, 209–215. [Google Scholar] [CrossRef] [Green Version]
- Comstock, K.K.; Wood, R.; Yuter, S.E.; Bretherton, C.S. Reflectivity and rain rate in and below drizzling stratocumulus. Q. J. Roy. Meteorol. Soc. 2004, 130, 2891–2918. [Google Scholar] [CrossRef] [Green Version]
- Austin, P.; Wang, Y.; Pincus, R.; Kujala, V. Precipitation in stratocumulus clouds: Observational and modeling results. J. Atmos. Sci. 1995, 52, 2329–2352. [Google Scholar] [CrossRef] [Green Version]
- Vali, G.; Kelly, R.D.; French, J.; Haimov, S.; Leon, D.; McIntosh, R.E.; Pazmany, A. Finescale structure and microphysics of coastal stratus. J. Atmos. Sci. 1998, 55, 3540–3564. [Google Scholar] [CrossRef]
- Stevens, B.; Lenschow, D.H.; Vali, G.; Gerber, H.; Bandy, A.; Blomquist, B.; Brenguier, J.L.; Bretherton, C.S.; Burnet, F.; Campos, T.; et al. Dynamics and chemistry of marine stratocumulus: DYCOMS-II. Bull. Am. Meteorol. Soc. 2003, 84, 579–594. [Google Scholar] [CrossRef]
- Kumar, K.N.; Suzuki, K. Assessment of seasonal cloud properties in the United Arab Emirates and adjoining regions from geostationary satellite data. Remote Sens. Environ. 2019, 228, 90–104. [Google Scholar] [CrossRef]
- Branch, O.; Behrendt, A.; Gong, Z.; Schwitalla, T.; Wulfmeyer, V. Convection Initiation over the Eastern Arabian Peninsula. Meteorol. Z. 2020, 29, 67–77. [Google Scholar] [CrossRef]
- Wehbe, Y.; Ghebreyesus, D.; Temimi, M.; Milewski, A.; Al Mandous, A. Assessment of the consistency among global precipitation products over the United Arab Emirates. J. Hydrol. Reg. Stud. 2017, 12, 122–135. [Google Scholar] [CrossRef]
- Eager, R.E.; Raman, S.; Wootten, A.; Westphal, D.L.; Reid, J.S.; Al Mandoos, A. A climatological study of the sea and land breezes in the Arabian Gulf region. J. Geophys. Res. Atmos. 2008, 113, D15106. [Google Scholar] [CrossRef] [Green Version]
- Wehbe, Y.; Temimi, M. A remote sensing-based assessment of water resources in the Arabian Peninsula. Remote Sens. 2021, 13, 247. [Google Scholar] [CrossRef]
- Wehbe, Y.; Temimi, M.; Weston, M.; Chaouch, N.; Branch, O.; Schwitalla, T.; Wulfmeyer, V.; Zhan, X.; Liu, J.; Al Mandous, A. Analysis of an extreme weather event in a hyper-arid region using WRF-Hydro coupling, station, and satellite data. Nat. Hazards Earth Syst. Sci. 2019, 19, 1129–1149. [Google Scholar] [CrossRef] [Green Version]
- Wehbe, Y.; Temimi, M.; Ghebreyesus, D.T.; Milewski, A.; Norouzi, H.; Ibrahim, E. Consistency of precipitation products over the Arabian Peninsula and interactions with soil moisture and water storage. Hydrol. Sci. J. 2018, 63, 408–425. [Google Scholar] [CrossRef]
- Yousef, L.A.; Temimi, M.; Molini, A.; Weston, M.; Wehbe, Y.; Al Mandous, A. Cloud cover over the Arabian Peninsula from global remote sensing and reanalysis products. Atmos. Res. 2020, 238, 104866. [Google Scholar] [CrossRef]
- Wehbe, Y.; Temimi, M.; Adler, R.F. Enhancing precipitation estimates through the fusion of weather radar, satellite retrievals, and surface parameters. Remote Sens. 2020, 12, 1342. [Google Scholar] [CrossRef] [Green Version]
- Nicoll, K.A.; Harrison, R.G.; Marlton, G.J.; Airey, M.W. Consistent dust electrification from Arabian Gulf sea breezes. Environ. Res. Lett. 2020, 15, 084050. [Google Scholar] [CrossRef]
- Hersbach, H.; Bell, B.; Berrisford, P.; Hirahara, S.; Horányi, A.; Muñoz-Sabater, J.; Nicolas, J.; Peubey, C.; Radu, R.; Schepers, D.; et al. The ERA5 global reanalysis. Q. J. R. Meteorol. Soc. 2020, 146, 1999–2049. [Google Scholar] [CrossRef]
- Wilson, J.W.; Brandes, E.A. Radar measurement of rainfall—A summary. Bull. Am. Meteorol. Soc. 1979, 60, 1048–1060. [Google Scholar] [CrossRef] [Green Version]
- Pruppacher, H.; Klett, J. Microphysics of Clouds and Precipitation; Kluwer Academic Publishers: Amsterdam, The Netherlands, 1997. [Google Scholar]
- Press, W.H.; Teukolsky, S.A.; Vetterling, W.T.; Flannery, B.P. Numerical Recipes: The Art of Scientific Computing, 3rd ed.; Cambridge University Press: Cambridge, UK, 2007. [Google Scholar]
- Gunn, R.; Kinzer, G.D. The terminal velocity of fall for water droplets in stagnant air. J. Meteorol. 1949, 6, 243–248. [Google Scholar] [CrossRef] [Green Version]
- Foote, G.B.; du Toit, P.S. Terminal velocity of raindrops aloft. J. Appl. Meteorol. 1969, 8, 249–253. [Google Scholar] [CrossRef] [Green Version]
- Cotton, W.; Bryan, G.; Van den Heever, S. Storm and Cloud Dynamics; Academic Press: Cambridge, MA, USA, 2010; Volume 99. [Google Scholar]
- Almazroui, A.; Farrah, S. The UAE seeks leading position in global rain enhancement research. J. Weather Modif. 2017, 49, 54–59. [Google Scholar]
Figure 1.
Map of the Arabian Peninsula showing the location of Al Ain (green dot) in the UAE (grey coloured region). Modified from www.freeworldmaps.net (accessed on 18 September 2020).
Figure 1.
Map of the Arabian Peninsula showing the location of Al Ain (green dot) in the UAE (grey coloured region). Modified from www.freeworldmaps.net (accessed on 18 September 2020).

Figure 2.
Time series of (a) C-band radar reflectivity (dBZ), (b) ceilometer lidar backscatter, and (c) vertical electric field strength for the measurement site at Al Ain airport, UAE, on 15 March 2019 (the crosses in (a) show the derived cloud top height using Meteosat8 data, as described in the text).

Figure 3.
Detail of Figure 2b showing ceilometer backscatter during successive rain generating events between 1000 and 1400 UTC on 15 March 2019, highlighting instances of precipitation (e.g., ~1045 UTC) and virga (e.g., ~1345 UTC).
Figure 3.
Detail of Figure 2b showing ceilometer backscatter during successive rain generating events between 1000 and 1400 UTC on 15 March 2019, highlighting instances of precipitation (e.g., ~1045 UTC) and virga (e.g., ~1345 UTC).

Figure 4.
Calculated fall speed properties of droplets using Equation (1), assuming thermodynamic profiles from the ECMWF reanalysis for periods at Al Ain when rain was observed, (a) 1200 UTC 1 March 2018 and (d) 1000 UTC 17 February 2019. (b) and (e) show calculated droplet size variations with distance beneath cloud base for droplets leaving the cloud with a range of initial diameters falling at terminal velocity in the conditions of (a) and (d); (c) and (f) show the associated fall times for the same initial droplet sizes (the locally observed cloud base heights were 3 km and 4 km, respectively).

Figure 5.
Cloud-related parameters divided into rainfall (77 events) and virga (28 events) at Al Ain, for (a) cloud base height, (b) relative humidity halfway between cloud base and surface, (c) cloud base temperature, (d) cloud depth, (e) rain duration, and (f) droplet diameter (box plots show the median and the interquartile range, with notches the confidence range on the medians; box width is proportional to number of cases). Median values are shown by the blue text at the top of each plot.

Figure 6.
Satellite-derived cloud data for the Al Ain events considered. Frequency of (a) liquid water content (LWC) maximum and (c) ice water content (IWC) maximum for all rain events. Height of maximum LWC maximum (b) and IWC maximum (d) for all rain events.
Figure 6.
Satellite-derived cloud data for the Al Ain events considered. Frequency of (a) liquid water content (LWC) maximum and (c) ice water content (IWC) maximum for all rain events. Height of maximum LWC maximum (b) and IWC maximum (d) for all rain events.

Publisher’s Note: MDPI stays neutral with regard to jurisdictional claims in published maps and institutional affiliations. |
© 2021 by the authors. Licensee MDPI, Basel, Switzerland. This article is an open access article distributed under the terms and conditions of the Creative Commons Attribution (CC BY) license (https://creativecommons.org/licenses/by/4.0/).
Share and Cite
MDPI and ACS Style
Airey, M.W.; Nicoll, K.A.; Harrison, R.G.; Marlton, G.J. Characteristics of Desert Precipitation in the UAE Derived from a Ceilometer Dataset. Atmosphere 2021, 12, 1245. https://0-doi-org.brum.beds.ac.uk/10.3390/atmos12101245
AMA Style
Airey MW, Nicoll KA, Harrison RG, Marlton GJ. Characteristics of Desert Precipitation in the UAE Derived from a Ceilometer Dataset. Atmosphere. 2021; 12(10):1245. https://0-doi-org.brum.beds.ac.uk/10.3390/atmos12101245
Chicago/Turabian StyleAirey, Martin W., Keri A. Nicoll, R. Giles Harrison, and Graeme J. Marlton. 2021. "Characteristics of Desert Precipitation in the UAE Derived from a Ceilometer Dataset" Atmosphere 12, no. 10: 1245. https://0-doi-org.brum.beds.ac.uk/10.3390/atmos12101245
Note that from the first issue of 2016, this journal uses article numbers instead of page numbers. See further details here.