Article

A New Method for the Assessment of the Oxidative Potential of Both Water-Soluble and Insoluble PM

by
Maria Agostina Frezzini
,
Gianluca Di Iulio
,
Caterina Tiraboschi
,
Silvia Canepari
and
Lorenzo Massimi
*
Department of Environmental Biology, Sapienza University of Rome, P.le Aldo Moro 5, 00185 Rome, Italy
*
Author to whom correspondence should be addressed.
Submission received: 26 January 2022 / Revised: 16 February 2022 / Accepted: 17 February 2022 / Published: 19 February 2022

Abstract

:
Water-soluble and insoluble fractions of airborne particulate matter (PM) exhibit different toxicological potentials and peculiar mechanisms of action in biological systems. However, most of the research on the oxidative potential (OP) of PM is focused exclusively on its water-soluble fraction, since experimental criticisms were encountered for detaching the whole PM (soluble and insoluble species) from field filters. However, to estimate the actual potential effects of PM on human health, it is essential to assess the OP of both its water-soluble and insoluble fractions. In this study, to estimate the total OP (TOP), an efficient method for the detachment of intact PM10 from field filters by using an electrical toothbrush was applied to 20 PM10 filters in order to obtain PM10 water suspensions to be used for the DCFH, AA and DTT oxidative potential assays (OPDCFH, OPAA and OPDTT). The contribution of the insoluble PM10 to the TOP was evaluated by comparing the TOP values to those obtained by applying the three OP assays to the water-soluble fraction of 20 equivalent PM10 filters. The OP of the insoluble fraction (IOP) was calculated as the difference between the TOP and the WSOP. Moreover, each PM10 sample was analyzed for the water-soluble and insoluble fractions of 10 elements (Al, Cr, Cs, Cu, Fe, Li, Ni, Rb, Sb, Sn) identified as primary elemental tracers of the main emission sources in the study area. A principal component analysis (PCA) was performed on the data obtained to identify the predominant sources for the determination of TOP, WSOP, and IOP. Results showed that water-soluble PM10 released by traffic, steel plant, and biomass burning is mainly responsible for the generation of the TOP as well as of the WSOP. This evidence gave strength to the reliability of the results from OP assays performed only on the water-soluble fraction of PM. Lastly, the IOPDCFH and IOPDTT were found to be principally determined by insoluble PM10 from mineral dust.

Graphical Abstract

1. Introduction

Air pollution is widely recognized as a key topic in public health protection actions [1,2]. Exposure to particulate matter (PM) is one of the major global health concerns [3,4], since it may adversely affect human health, leading to the development of several chronic and acute pathologies, such as cardiovascular and respiratory diseases, lung cancer, bronchitis, diabetes, and neurodevelopmental disorders [5,6,7,8]. A growing number of epidemiological studies reported associations of PM pollution with health effects also at low levels, often below current air quality standards [9,10]. Therefore, the evaluation of exposure to PM and associated health risks is crucial for planning targeted mitigation strategies and policies to protect human health.
The main cytotoxicity mechanism involved in developing damaging health effects and promoting chronic diseases is the ability of PM to induce oxidative stress, due to the interaction between cells and particles and the production of excess reactive species, such as reactive oxygen species (ROS), reactive nitrogen species (RNS) and reactive carbon species (RCS), which can upset the balance of intracellular oxidants and antioxidants [11,12,13]. PM can trigger oxidative responses by different pathways, such as the introduction of particle-bound ROS into the respiratory system, or the introduction of redox-active species inducing the catalytic generation of reactive species and, thus, the depletion of antioxidants [14,15,16].
Acellular assays have been widely used to measure the oxidative potential (OP) of particles in order to provide a proxy of the oxidative properties of PM [17], as they are recognized as valid exposure metrics to investigate the effects of PM on living organisms [18]. OP is frequently measured by the ascorbic acid assay (OPAA), which provides a measure of the particle-induced depletion of chemical proxies for the cellular ascorbic acid antioxidant, and by the dithiothreitol assay (OPDTT) that is based on the PM-catalyzed electron transfer from a chemical surrogate of cellular reducing agents (i.e., adenine dinucleotide, NADH, and nicotinamide adenine dinucleotide phosphate, NADPH) to O2 [17,19,20,21]. In addition, the dichlorofluorescein assay (OPDCFH) is often applied to determine OP of PM samples, although the assay was originally used to monitor ROS formation in the cellular environment [22,23]. When applied in acellular assays, DCFH responds to the ROS already present in particles, and not to the ROS formed by redox processes (as AA and DTT assays). Indeed, it measures particle-bound ROS, which are inherently adherent to the particles, releasing a fluorescent intensity that is converted into equivalent H2O2 to express the final ROS concentration [22]. Therefore, the DCFH assay is conventionally included in OP assays in several works in this research field [17,24,25,26]. Each OP assay is sensitive to different oxidative properties of PM, and appears to have different relationships with health outcomes [16,17,27]. Therefore, there are no appropriate criteria for choosing the most representative assay and the synergic application is frequently suggested [28,29,30].
Water-soluble and insoluble fractions of PM exhibit different mechanisms of action in biological systems [30,31,32], and while it has been shown that insoluble species can contribute significantly to the toxicological potential of PM [27,30,33], most of the literature OP data refer only to the PM water-soluble fraction, which is considered more bioavailable [34,35]. Insoluble species have shown an intrinsically high redox activity and the capability of exerting a wide spectrum of negative health endpoints, such as the generation of oxidative stress markers in human cells, the disruption of the cell membrane, and the induction of cellular DNA damage [11,36,37,38,39]. Therefore, various studies have suggested that insoluble components of PM may play an important role in generating oxidative damage and highlight the need to investigate the OP of insoluble particles [27,28,40,41]. However, the application of the OP assays to insoluble PM is very difficult, and thus it is still not clear how much insoluble PM may contribute to the OP.
In recent work, the contribution of insoluble components to the OP was evaluated directly on the aqueous suspension of PM10 field filters, without any preliminary filtration step, by adding reagents of each assay directly in contact with the sampled filter immersed in the extraction solution [15,42]. However, uncertainty associated with the measurements was observed and was probably due to the operative limits of performing OP assays directly on particles too embedded in the membrane filters. On the other hand, Wang et al. (2013) and Daher et al. (2011) evaluated the redox activity of PM by collecting particles directly into a liquid medium through a BioSampler, and by applying OP assays to the unfiltered aqueous suspension [40,43]. However, the OP of PM is still mainly quantified by offline assays in extracts of aerosol particles collected on filters [25,44]. In other studies, the contribution of PM insoluble species to the OP was evaluated using ultrasounds or organic solvents for the extraction of the insoluble fraction of PM [30,33,45]. However, ultrasounds have been shown to induce the formation of ROS in the solution, while organic solvents may themselves alter the OP of PM, introducing a bias in the toxicological assessment. Moreover, it has been demonstrated that different extraction procedures generate significant differences in the measured OP of PM [19], thus leading to misinterpretation of the results obtained. These studies have considered separately the contribution of the water-soluble and/or insoluble fraction to the OP. However, with the aim of investigating the possible toxicological effects related to PM exposure under real-world conditions, it would be useful to apply OP assays directly to a PM water suspension for the assessment of the overall OP of PM (water-soluble and insoluble species).
To this aim, a non-invasive, simple, and efficient method, recently validated by Massimi et al. [46] for the recovery of the elements in PM10, was used for the detachment and suspension in water of intact PM10 from field filters by using an electrical toothbrush [47,48]. The retrieved PM10 water suspension was used for the assessment of the overall OPDCFH, OPAA, and OPDTT of intact PM10 samples (water-soluble and insoluble fraction) and for the evaluation of the real contribution of insoluble particles to PM redox properties.

2. Materials and Methods

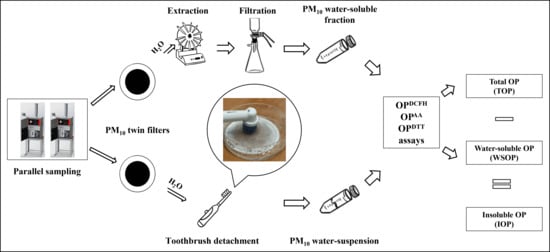
2.1. Sampling Site and Procedure

PM10 filters were collected in the city of Terni, in Central Italy, in the Region of Umbria (42°34′ N; 12°39′ E) at the sampling site Prisciano (PR) of the Environmental Protection Agency of Umbria Region (ARPA Umbria). The sampling site was selected for its proximity to a steel plant (geographical coordinates: 42°34′20.30″ N; 12°40′44.23″ E) and for the high documented concentration of several toxic elements present mainly in the insoluble fraction of PM10 [49,50].
Two single-line samplers (Giano sampler, Dadolab Srl, Cinisello B., Milan, Italy), equipped with sampling heads for PM10 certified UNI EN 12341 (2014) [51] and polytetrafluoroethylene membrane filters (PTFE; 47 mm diameter, pore size 2 µm, Cobetter Filtration Equipment Co., Ltd., Hangzhou, China), worked in parallel at 2.3 m3/h to collect 24-h PM10 filters for 20 days, from 5 to 24 May 2021. In total, 20 couples of twin PM10 field filters were collected and analyzed.

2.2. Analytical Procedure

PM10 filters collected from one of the two sample lines were processed by following a previously optimized and detailed chemical fractionation procedure, involving the water-extraction of PM10 filters and the acid digestion of the residue, followed by elemental analysis of both the water-soluble and insoluble fractions [49,50,52,53]. After the removal of the supporting polymethyl pentene ring from each sampled filter, PM10 filters were immersed in 10 mL of deionized water (produced by Arioso UP 900 Integrate Water Purification System, Seoul, Korea) and then extracted by rotating agitation (Rotator, Glas-Col, Hangzhou Yooning Instrunents, Hangzhou, Zhejiang, China) for 30 min at 60 rpm. The obtained solution was then filtered through a nitrocellulose filter (NC filter; pore size 0.45 µm, Merck Millipore Ltd., Billerica, MA, USA) to obtain the PM10 water-soluble fraction. Subsequently, the PM10 filters containing the residue and the nitrocellulose filter used for the filtration were acid-digested in a microwave oven (Ethos Touch Control with Q20 rotor, Milestone, Sorisole, Bergamo, Italy) using 2 mL of HNO3 (67%, Promochem, Wesel, Germany) and 1 mL of H2O2 (30% Suprapur, Merck Millipore Ltd., Billerica, MA, USA). The digested solutions were diluted to 50 mL with deionized water and filtered by nitrocellulose syringe filters (diameter 25 mm, pore size 0.45 µm, GVS Filter Technology, Morecambe, England, UK) to obtain the PM10 insoluble fraction. Water-soluble and insoluble fractions of PM10 samples were analyzed for the determination of 10 elements (Al, Cr, Cs, Cu, Fe, Li, Ni, Rb, Sb, Sn) in the two fractions using quadrupole inductively coupled plasma mass spectrometry (ICP-MS, Bruker 820-MS, Billerica, MA, USA). Further information about the instrumental conditions and performance of the method is reported in Astolfi et al. [54]. The analyzed elements were selected as they were already identified as primary elemental tracers of the predominant emission sources in the Terni basin [49,50]. The minimum detection limit (MDL), concentrations, the mean and standard deviation of PM10 mass, and of the elements analyzed in the water-soluble and insoluble fraction of PM10 collected at PR are reported in Table 1. PM10 mass concentration data were obtained from ARPA Umbria reports available online (www.arpa.umbria.it, accessed on 25 January 2022). Average solubility percentages (%) of the elements in the 20 PM10 samples are shown in Figure 1.
Equivalent PM10 filters from the second sample line were instead subjected to PM10 toothbrush detachment and suspension in water, as thoroughly described in Massimi et al. [46]. This method has been already applied only by Süring et al. [47,48], who used this procedure to quantify allergen-loaded particles in PM10 by flow cytometry. Briefly, each filter was put in a polystyrene Petri dish of 50 mm diameter and overlaid with 10 mL of deionized water. Subsequently, the filter was held with PTFE tweezers and brushed for 2 min using an electrical toothbrush with a sensitive brush head (Braun, Germany, Oral-B Vitality Sensitive). The obtained total PM10 water suspension was then used in this study for the application of the three OP assays. The performance of this method for the recovery of the elements in PM10 was evaluated by Massimi et al. [46] after applying the chemical fractionation procedure described above to the obtained PM10 water suspensions and to equivalent PM10 samples not subjected to the toothbrush detachment, revealing an efficiency of approximatively 70% for the recovery of the elements. Moreover, this method is described in Süring et al. [47,48].

2.3. Oxidative Potential Measurements

The OPDCFH, OPAA, and OPDTT assays were used to assess the OP of the 20 pairs of PM10 equivalent samples.To obtain the water-soluble OP (WSOP) and total OP (TOP, water-soluble and insoluble PM10), the three OP assays were simultaneously applied to the water-soluble fraction of PM10 filters obtained by following the chemical fractionation procedure described in Section 2.2, and to the PM10 aqueous suspension retrieved by applying the toothbrush detachment to the equivalent PM10 filters. Furthermore, the OP of the insoluble fraction (IOP) was calculated as the difference between the TOP and the WSOP. The average contribution percentages (%) of the two solubility fractions to the TOPDCFH, TOPAA, and TOPDTT are shown in Figure 1. The OP analytical measurements performed in this study followed the validated and frequently used procedures [26,42,50] largely described below.

2.3.1. OPAA

For both the PM10 equivalent samples, the OPAA followed the method reported by Fang et al. [21]. Phosphate buffer measuring 300 µL (0.5 mM) and 100 µL of AA reagent (2 mM; Sigma–Aldrich, St. Louis, MO, USA) was added to 2.5 mL of sample solution. Then, the absorbance of the reaction mixture was recorded at 265 nm wavelength at different reaction times (0, 10, and 20 min) using UV-Vis absorption spectrometry (Varian Cary 50 Bio UV-Vis; Varian Inc., Palo Alto, CA, USA). Blanks were always measured in parallel. OPAA was calculated as the AA depletion rate per sampled volume (nmol AA min−1·m−3) according to Equation (1).
ơ AA = ơ Abs   × N 0 Abs 0   ,   OP AA = ơ AA s ơ AA b V a   V e   ×   V S
where ơAbs is the slope of the absorbance of operative blanks vs. time (min−1), Abs0 is the initial absorbance calculated from the intercept of the linear regression of absorbance vs. time, N0 is the number of AA moles added into the reaction mixture (200 nmol), ơAAs and ơAAb are the rates of AA consumption for the sample and for the blank, respectively (nmol·min−1), Ve and Va are the extraction volume and sample volume added to the reaction mixture, respectively, and Vs is the PM sampled volume (m3).

2.3.2. OPDTT

To perform OPDTT, the solution of PM10 equivalent samples was split into three aliquots of 0.7 mL each (2.1 mL in total), then incubated at 37 °C with 0.1 mL of DTT (1 mM; Sigma–Aldrich, USA) and 0.2 mL of potassium phosphate buffer (1 M). Then, 1 mL of trichloroacetic acid (10% TCA; Sigma–Aldrich, USA) was added to the mixture at different reaction times (0, 10, and 20 min) to stop the DTT reaction. An aliquot of the reaction mixture (1 mL) was taken and mixed with 2 mL of tris-buffer (0.08 M, containing EDTA 4 mM) and with 50 µL of 5,5-dithiobis-2-nitrobenzoic acid (DTNB; Sigma–Aldrich, USA) to form 2-nitro-5-mercaptobenzoic acid (TNB) for a colorimetric reaction with the residual DTT. The obtained solution was then measured at 412 nm using the UV-Vis spectrometer. Furthermore, blanks were measured in parallel to samples. OPDTT was expressed as DTT consumption rate per sampled PM volume (nmol DTT min−1·m−3), according to Equation (2).
ơ DTT = ơ Abs   × N 0 Abs 0   ,   OP DTT = ơ DTT s ơ DTT b V a   V e   ×     V s
where ơAbs is the slope of the absorbance of operative blanks vs. time (min−1), Abs0 is the initial absorbance calculated from the intercept of the linear regression of absorbance vs. time, N0 is the number of DTT moles added in the reaction mixture (100 nmol), ơDTTs and ơDTTb are the rates of DTT consumption for the sample and for the blank, respectively (nmol·min−1), Ve and Va are the extraction volume and sample volume added to the reaction mixture, respectively, and Vs is the PM sampled volume (m3).

2.3.3. OPDCFH

DCFH solution was prepared by dissolving 4.873 mg of the 2′,7′-dichlorofluorescein diacetate (DCFH-DA; Sigma–Aldrich, USA) in 5 mL of ethanol (EtOH, 96%) in the dark. Then, 20 mL NaOH 0.01 M were added to favor the de-acetalization reaction. The obtained solution was kept in the dark at room temperature for at least 30 min before use. DCFH reagent measuring 125 µL (5 µM) and 5 mL of HRP (0.5 units mL−1) dissolved in a sodium phosphate buffer (pH 7.4; 25 mM) were added to 1.5 mL of the solution of PM10 equivalent samples. The reaction mixture was placed in the thermostatically controlled water bath at 37 °C for 5 min. The DCFH became fluorescent dichlorofluorescein (DCF) upon reaction with ROS. Hence, the concentration of DCF was measured using fluorescent spectroscopy (Jasco FP-920; excitation at 427 nm, emission at 530 nm). Standard H2O2 solutions (5 × 10⁻⁸, 1 × 10⁻⁷, 2 × 10⁻⁷, 5 × 10⁻⁷, and 1 × 10⁻⁶ M) were used to obtain a calibration curve to convert the fluorescence intensity into H2O2 equivalents, which were used as indicators of the reactive species reactivity, thus obtaining OPDCFH values (nmol H2O2 m−3).

2.4. Data Analysis

The paired sample t-test was used to observe the significance of the differences between WSOP and TOP results obtained by each OP method applied to the 20 couples of equivalent PM10 samples in order to evaluate the significance of the contribution of insoluble particles to the generation of the TOP. A p-value less than 0.05 was considered statistically significant.
A principal component analysis (PCA) was carried out on the matrix of the data (580 data points) composed of 20 PM10 samples and 29 variables: OPDCFH, OPAA and OPDTT for the water-soluble OP (WSOPAA, WSOPDTT and WSOPDCFH), insoluble OP (IOPAA, IOPDTT and IOPDCFH) and total OP (TOPAA, TOPDTT and TOPDCFH), and 10 elements in the water-soluble (Al_ws, Cr_ws, Cs_ws, Cu_ws, Fe_ws, Li_ws, Ni_ws, Rb_ws, Sb_ws, Sn_ws) and insoluble fraction (Al_i, Cr_i, Cs_i, Cu_i, Fe_i, Li_i, Ni_i, Rb_i, Sb_i, Sn_i) of the PM10 samples. The matrix of the data was transformed by column mean centering and row and column autoscaling to correct variations in the different scaling of the variables before performing the PCA [55,56]. The principal component analysis was performed using the statistical software CAT (Chemometric Agile Tool) based on the R-project for statistical computing, Ver. 3.0, 32-bit.

3. Results and Discussion
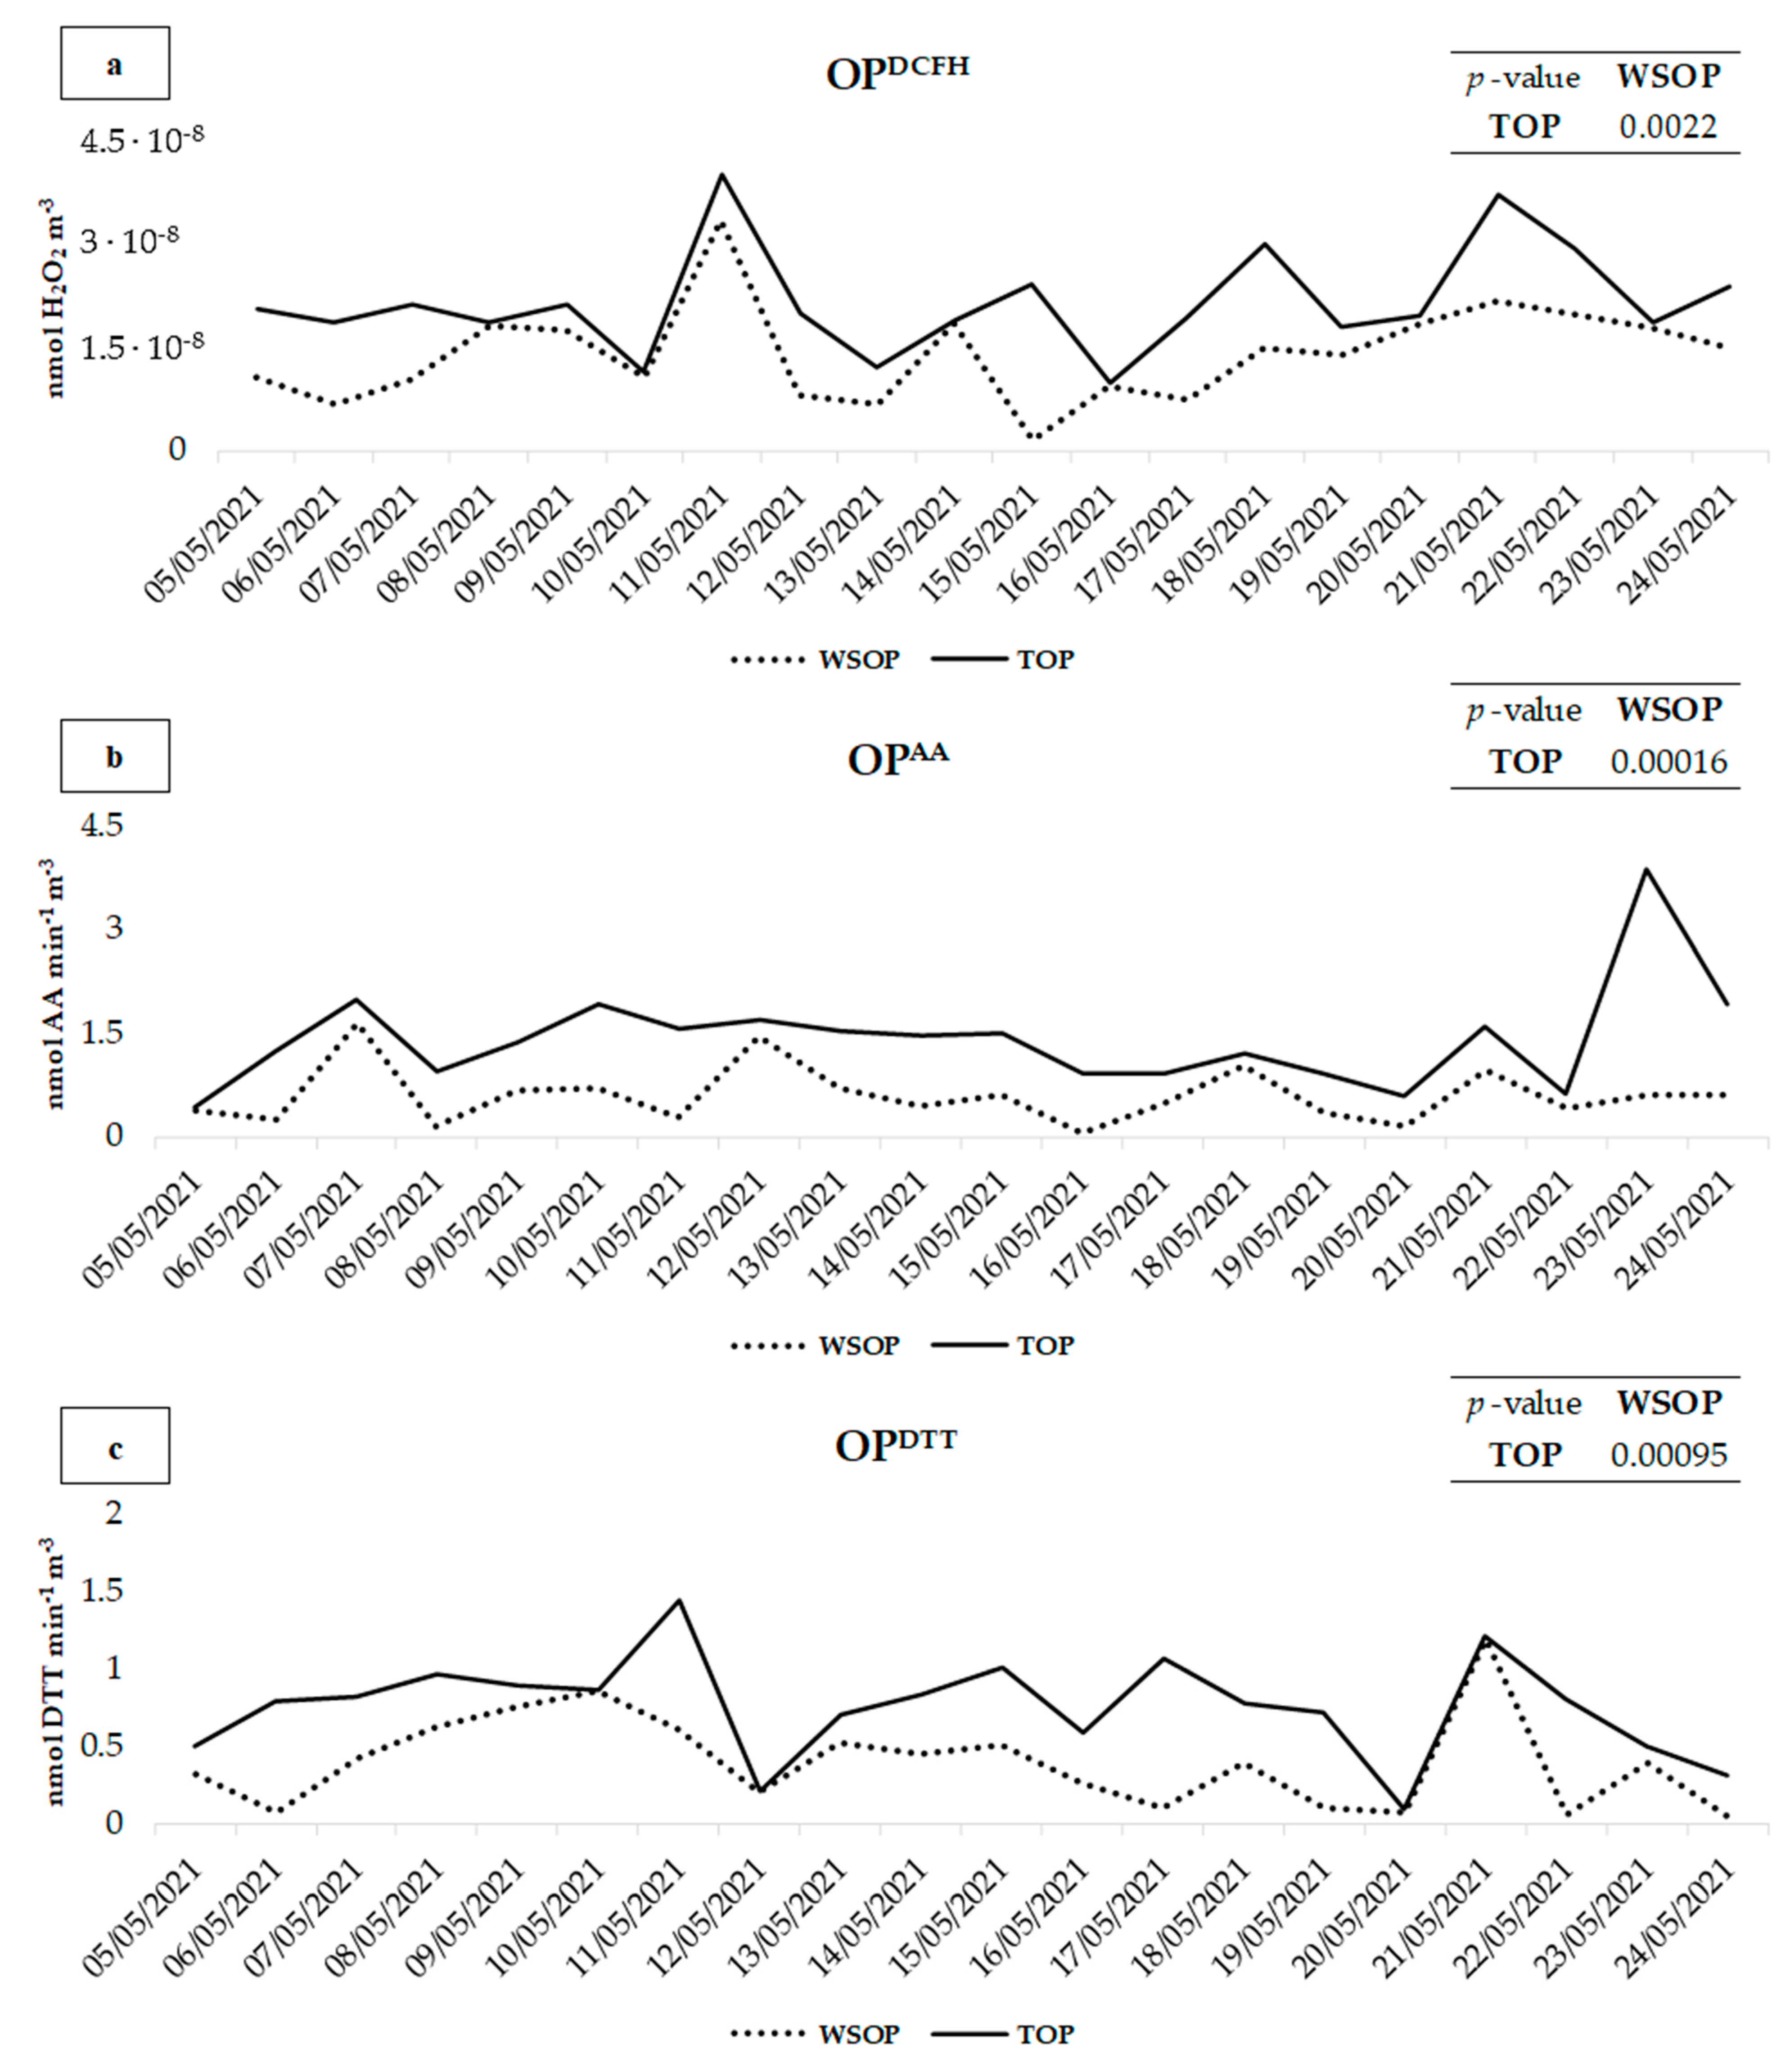
3.1. WSOP vs. TOP

The contribution of the PM10 insoluble fraction to the TOP was assessed comparing the results obtained by the OPDCFH, OPAA, and OPDTT assays performed on the water-soluble fraction of PM10 (WSOP) to the results achieved by applying the three assays to the aqueous suspension of intact PM10 (water-soluble and insoluble PM10; TOP). WSOP, TOP, and IOP (insoluble OP obtained from the difference between TOP and WSOP) obtained results are shown in Figure 2 and reported in Table 2 along with the percentage of the contribution of IOP to TOP.
TOP values were found to be significantly higher with respect to those of the WSOP for all the three OP assays. In detail, for the OPDCFH, OPAA, and OPDTT assays, the p-value between the TOP and the WSOP is 0.00016, 0.00096, and 0.0022, respectively, confirming a significant contribution of the PM insoluble fraction to the redox properties of the 20 PM10 samples.
OPAA (Figure 2b) showed higher values for both the WSOP and the TOP on 7, 10, 11, 21, and 23 May, when the highest concentrations of water-soluble Cu were recorded (Table 1), to which the OPAA is well-known to be selectively responsive [21,57,58].
On 23 May, TOPAA was significantly higher than WSOPAA (3.9 and 0.59, respectively). This was probably due to the higher contribution of crustal dust to PM10. In fact, on that day, much higher concentrations of all the elements released in the insoluble fraction of PM10 by resuspension of coarse mineral dust [59,60,61], such as Al, Cs, Fe, Li e Rb (Table 1), were recorded. It is well-known that OPAA predominantly responds to coarse particles [26,62], and it is assumed that a relevant contribution to the TOP was due to a higher contribution of soil dust on this day.
OPDCFH and OPDTT showed higher TOP with respect to WSOP on 21 and 17 May, respectively, when the highest concentrations of crustal dust elements were recorded, which therefore confirms a significant contribution of soil dust to the TOP. Both the assays exhibited the highest WSOP and TOP on 11 and 21 May, when higher concentrations of Fe, Cr, and Ni from the steel plant [49,63], and Cu, Sb, and Sn from traffic [64,65,66] were released in water-soluble PM10. Although the insoluble fraction of these elements (especially Fe, to which the DTT was highly sensitive) [67] presented significantly higher concentrations, the OP assays appeared to be predominantly responsive to their water-soluble fraction, which therefore plays a crucial role in the generation of the TOP.
The discussed findings partially agree with the findings of Frezzini et al. [42], which revealed that the insoluble fraction of PM provided a significant contribution to the TOPAA and left open questions regarding the TOPDCFH and TOPDTT, forwhich the insoluble fraction did not seem to contribute significantly to the TOP, probably due to issues related to the experimental procedure. In detail, the OPAA values were significantly influenced by the PM insoluble fraction, probably due to the higher sensitivity of this assay to the coarser insoluble particles [26,50]. These particles may have moved from the PTFE filters immersed in the aqueous solution during the extraction procedure, and reacted with the solutions used for the OPAA assay. Conversely, the insoluble fraction did not determine a significantly higher OPDCFH and OPDTT. This might be explained by the higher sensitivity of these two assays through the fine PM particles [67,68], which are almost predominantly soluble in water [61] and, accordingly, contributed more to WSOP rather than to TOP. Another possible explanation is that particles were probably fixed too deeply in the immersed PTFE filter to fully react with the reagents of the OPDCFH and OPDTT assays to generate significantly higher TOP with respect to WSOP.
The application of the TOP assays directly to the aqueous suspension of intact particles detached from PM10 filters overcame the operative limits of performing OP assays directly on solutions containing the immersed PM filter. In fact, the described method allowed the authors to detach and carry in suspension a high fraction of the particles sampled on the filter, approximatively 70% in reference to the recovery of the elements [46].
These results revealed the non-negligible contribution of the insoluble particles to the TOPDCFH and TOPDTT, in agreement with previous findings that demonstrated the relevance of the PM insoluble fraction to the total OP of PM [27,28,45].

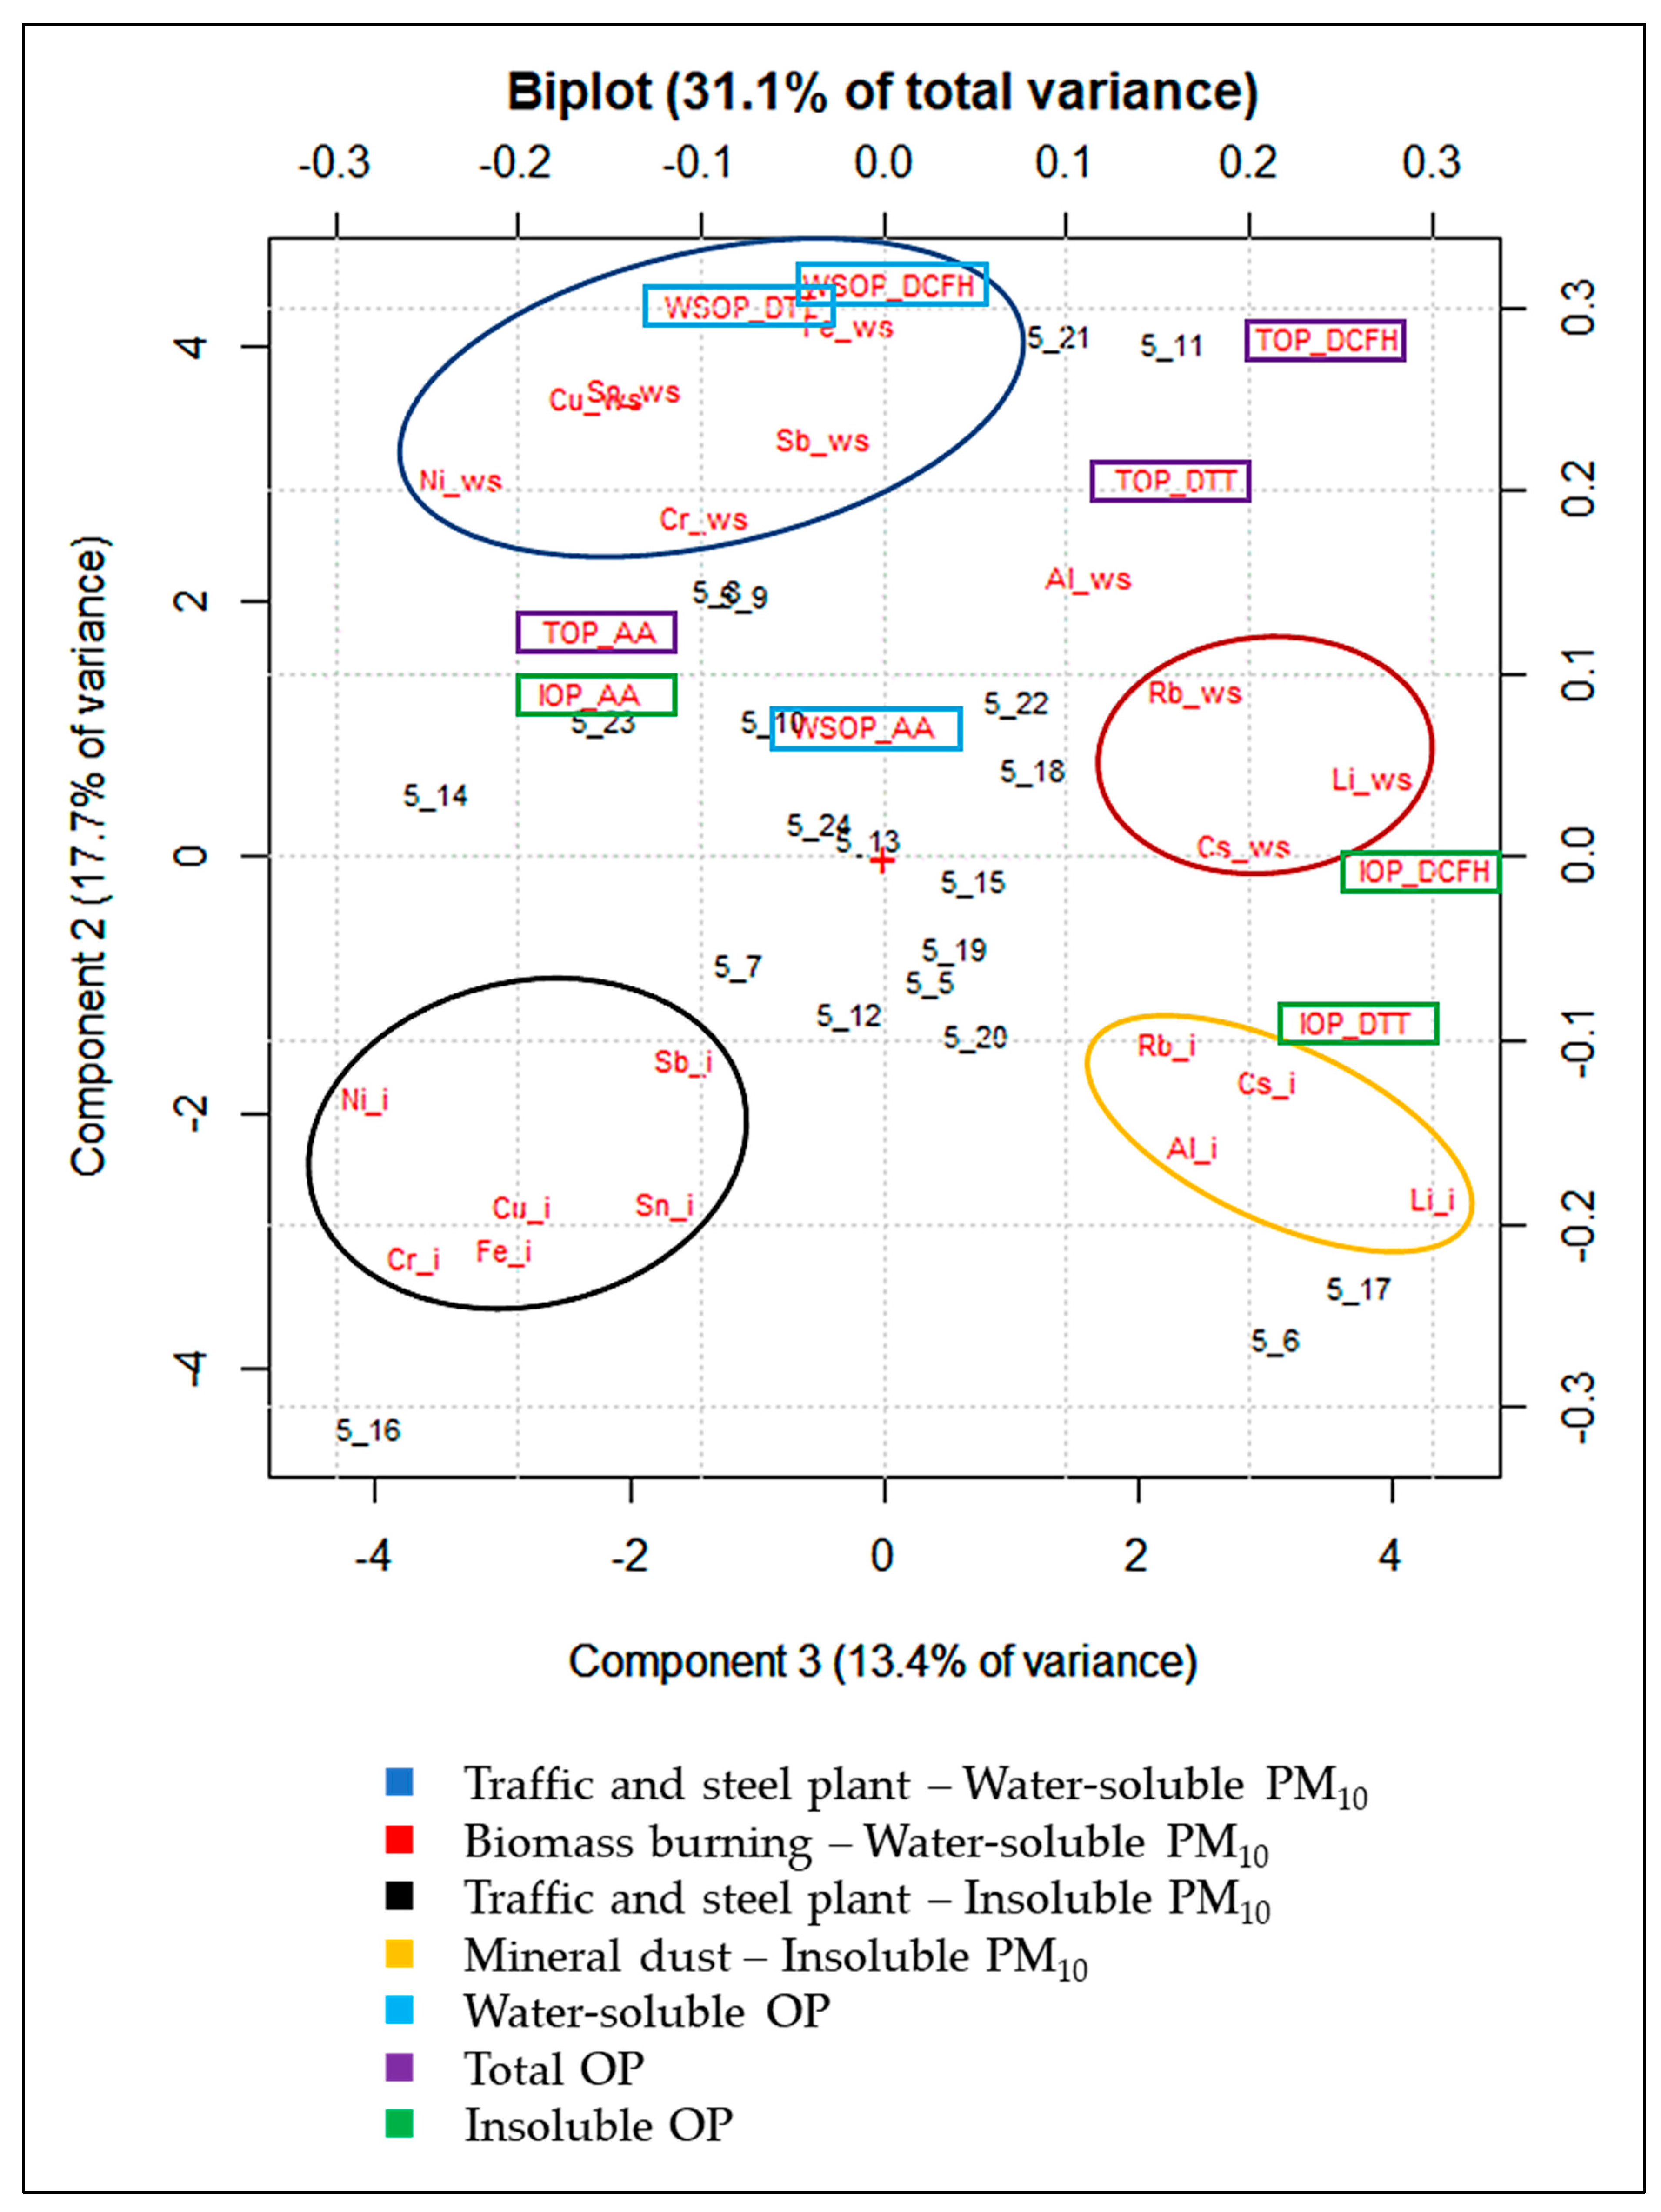
3.2. Principal Component Analysis

To identify tracers of emission sources that can determine the above-discussed OP results, explorative PCA was performed on the WSOP, TOP, and IOP values for OPAA, OPDTT, and OPDCFH, and the element concentrations in the water-soluble and insoluble fraction of the 20 PM10 samples. Five significant components accounting for 78.4% were obtained from the PCA. The variance explained by each component is of 29.7%, 17.6%, 13.3%, 9.1% and 8.5%, respectively.
The biplot of PC1/PC2 is reported in Supplementary Materials (Figure S1), along with the scores and loadings obtained from the PCA (Table S1). The first component (PC1), which represents 29.7% of the total variance, separates out the samples (scores) in which the highest element concentrations (loadings) were recorded, and largely explains the data variability due to daily variations in atmospheric conditions. However, PC1 only distinguishes samples in which the highest concentrations of all the considered variables were found, as distinct from those characterized by the lowest concentrations. On the contrary, PC2, and PC3, which represent, respectively, 17.6% and 13.3% of the total variance, separate the variables depending on their concentration variability among the sampling days. PC2/PC3 are graphically summarized in the biplot of Figure 3.
PC2 and PC3 account for 31.1% of the total variance. In the biplot, the variables are grouped in 4 main clusters, each one containing tracers of a specific emission source. The cluster on the lower-left part of the biplot includes the insoluble elements typically released by the steel plant and by non-exhaust traffic, such as brake abrasion (Cu_i, Cr_i, Fe_i, Ni_i, Sb_i, and Sn_i) [64,65,66,69,70]. The cluster on the upper-left part of the biplot contains the same elemental tracers of the group described above in their water-soluble fraction (Cu_ws, Cr_ws, Fe_ws, Ni_ws, Sb_ws, and Sn_ws). The group on the upper-right part of the biplot contains the water-soluble elements mainly released by biomass burning emission sources (Cs_ws, Li_ws, and Rb_ws) [66,71,72,73]. Lastly, the cluster on the lower-right part of the biplot includes insoluble elements considered as tracers of mineral dust (Al_i, Cs_i, Li_i, and Rb_i) [50,74,75].
Results show that all the three OP assays for the WSOP and TOP are included in the group of traffic and steel plant water-soluble tracers and in the same direction of biomass burning elemental tracers along PC2. On the other hand, WSOP and TOP assays do not seem to respond to the insoluble fraction of the elements released by traffic and the steel plant. This constitutes a first indication that the total OP is dominated by the water-soluble species present in the solution (Figure 1). Although it is known that WSOPAA and WSOPDTT respond predominantly to transition metals, such as Cu and Fe [62,67,76], the TOP, when using both the assays, was found to be sensitive mainly to the water-soluble fraction of these elements, even if Cu and Fe, as well as the other non-exhaust traffic and steel plant elemental tracers, were almost exclusively in their insoluble fraction (Figure 1). Moreover, the predominant dependence of OPDCFH and OPDTT on traffic, steel plant, and biomass burning water-soluble particles and the higher sensitivity of OPAA to non-exhaust traffic is confirmed [50,77,78,79]. The response of the OPDCFH and OPDTT assays to biomass burning tracers confirms previous findings [21,50,80,81] and highlights the central role of the water-soluble species in determining PM redox properties, even when TOP is considered.
This represents a key finding, since it gives strength to the reliability of the OP results, even if performed only on the water-soluble fraction of PM10. Overall, the application of the OP assays to the intact particles detached from PM10 filters (water-soluble and insoluble fraction) reveals that water-soluble PM10 released by traffic, steel plant, and biomass burning was primarily responsible for the generation of the TOP.
Finally, it is worth noting that IOPDTT and IOPDCFH are clustered with the insoluble Al, Cs, Li, and Rb, tracers of mineral dust, thus showing that considering only the insoluble fraction of PM10, OPDTT, and OPDCFH are mainly responsive to soil particles [26,50,82,83]. The results obtained in this study are compared and tabulated with the findings of existing works in the literature in Supplementary Materials (Table S2).

4. Conclusions

It is well known that the different PM components are responsible for several effects that can trigger harmful oxidative reactions and inflammation on living organisms, contributing to genotoxicity and cytotoxic mechanisms responsible for cell damage. However, most of the studies conducted so far have exclusively evaluated the toxicity of the water-soluble fraction of PM, which is considered more bioavailable and is more easily extractable. Since it has been shown that insoluble species can contribute significantly to the toxicological potential of PM, the evaluation of the OP of both PM fractions (water-soluble and insoluble) is essential for the assessment of the total health risk induced by PM.
The application of an innovative method for the detachment and suspension in water of intact PM10 (water-soluble and insoluble species) from the sampled filters allowed us to evaluate the total OP of PM10 collected at a highly polluted industrial site, and to identify specifically the contribution to the OP of every single fraction (water-soluble and insoluble). By performing explorative PCA, it was possible to evaluate the response of the OPDCFH, OPAA, and OPDTT assays to the various elemental fractions, and to identify the different emission sources responsible for the WSOP, TOP, and IOP.
The results confirmed the different sensitivity of the three OP assays to the various PM10 components. In particular, the dependence of OPDCFH and OPDTT on traffic, steel plant, and biomass burning water-soluble particles, and the sensitivity of OPAA to non-exhaust traffic, was reinforced.
Moreover, the application of the OP assays to the intact particles detached from PM10 filters (water-soluble and insoluble fraction) reveals that water-soluble PM10 released by traffic, steel plant, and biomass burning is primarily responsible for the generation of the TOP. This represents a key finding since it gives strength to the reliability of the OP results, even if performed only on the water-soluble fraction of PM10. In addition, the insoluble fraction of PM10 was found to be able to contribute to the IOPDCFH and IOPDTT, which seem to respond to mineral particles.
Further studies will have to be carried out to verify these results and to confirm the representativeness of the WSOP and TOP assays by comparison with biological endpoints.

Supplementary Materials

The following are available online at https://0-www-mdpi-com.brum.beds.ac.uk/article/10.3390/atmos13020349/s1, Figure S1. Biplot of PC1/PC2 from the PCA performed on the WSOP, TOP and IOP values for OPAA, OPDTT and OPDCFH, and element concentrations in the water-soluble (_ws) and insoluble (_i) fraction of the 20 PM10 samples; Table S1. Scores and loadings of the five significant components obtained by performing the PCA on the matrix of the data (580 data points) composed of 20 PM10 samples and 29 variables; Table S2. Results of this study compared with other findings available in the literature.

Author Contributions

Conceptualization, S.C. and L.M.; Data curation, M.A.F. and L.M.; Formal analysis, M.A.F., G.D.I., C.T. and L.M.; Supervision, S.C. and L.M.; Writing—original draft, M.A.F.; Writing—review & editing, L.M. All authors have read and agreed to the published version of the manuscript.

Funding

This work was funded by the project AR1201729D771A87 (Principal Investigator: M.A.F.), and by the project AR22117A865EF484 (Principal Investigator: L.M.) financed by Sapienza University of Rome.

Institutional Review Board Statement

Not applicable.

Informed Consent Statement

Not applicable.

Data Availability Statement

Not applicable.

Acknowledgments

The authors gratefully thank the Terni district of the Environmental Protection Agency of Umbria Region (ARPA Umbria) with special regard to Mara Galletti and Marco Pompei for their support in the sampling of PM10 at the Prisciano (PR) site.

Conflicts of Interest

The authors declare no conflict of interest.

References

  1. World Health Organization. WHO Global Air Quality Guidelines: Particulate Matter (PM2. 5 and PM10), Ozone, Nitrogen Dioxide, Sulfur Dioxide and Carbon Monoxide: Executive Summary; WHO: Geneva, Switzerland, 2021. [Google Scholar]
  2. Shaddick, G.; Thomas, M.L.; Mudu, P.; Ruggeri, G.; Gumy, S. Half the world’s population are exposed to increasing air pollution. NPJ Clim. Atmos. Sci. 2020, 3, 23. [Google Scholar] [CrossRef]
  3. IARC. IARC Working Group on the Evaluation of Carcinogenic Risks to Humans. Outdoor Air Pollution. IARC Monogr. Eval. Carcinog. Risks Hum. 2016, 109, 9. [Google Scholar]
  4. Burnett, R.; Chen, H.; Szyszkowicz, M.; Fann, N.; Hubbell, B.; Pope, C.A., 3rd; Apte, J.S.; Brauer, M.; Cohen, A.; Weichenthal, S.; et al. Global estimates of mortality associated with long-term exposure to outdoor fine particulate matter. Proc. Natl. Acad. Sci. USA 2018, 115, 9592–9597. [Google Scholar] [CrossRef] [Green Version]
  5. Janghorbani, M.; Momeni, F.; Mansourian, M. Systematic review and metaanalysis of air pollution exposure and risk of diabetes. Eur. J. Epidemiol. 2014, 29, 231–242. [Google Scholar] [CrossRef] [PubMed]
  6. Losacco, C.; Perillo, A. Particulate matter air pollution and respiratory impact on humans and animals. Environ. Sci. Pollut. Res. 2018, 25, 33901–33910. [Google Scholar] [CrossRef] [PubMed]
  7. Costa, L.G.; Cole, T.B.; Dao, K.; Chang, Y.-C.; Coburn, J.; Garrick, J.M. Effects of air pollution on the nervous system and its possible role in neurodevelopmental and neurodegenerative disorders. Pharmacol. Ther. 2020, 210, 107523. [Google Scholar] [CrossRef] [PubMed]
  8. Zhang, L.; Xu, H.; Fang, B.; Wang, H.; Yang, Z.; Yang, W.; Hao, Y.; Wang, X.; Wang, Q.; Wang, M. Source Identification and Health Risk Assessment of Polycyclic Aromatic Hydrocarbon-Enriched PM 2.5 in Tangshan, China. Environ. Toxicol. Chem. 2020, 39, 458–467. [Google Scholar] [CrossRef]
  9. Liu, S.; Jørgensen, J.T.; Ljungman, P.; Pershagen, G.; Bellander, T.; Leander, K.; Magnusson, P.K.; Rizzuto, D.; Hvidtfeldt, U.A.; Raaschou-Nielsen, O.; et al. Long-term exposure to low-level air pollution and incidence of asthma: The ELAPSE project. Eur. Respir. J. 2021, 57, 2003099. [Google Scholar] [CrossRef]
  10. Chen, J.; Hoek, G. Long-term exposure to PM and all-cause and cause-specific mortality: A systematic review and meta-analysis. Environ. Int. 2020, 143, 105974. [Google Scholar] [CrossRef]
  11. Liu, L.; Zhou, Q.; Yang, X.; Li, G.; Zhang, J.; Zhou, X.; Jiang, W. Cytotoxicity of the soluble and insoluble fractions of atmospheric fine particulate matter. J. Environ. Sci. 2020, 91, 105–116. [Google Scholar] [CrossRef]
  12. Øvrevik, J. Oxidative potential versus biological effects: A review on the relevance of cell-free/abiotic assays as predictors of toxicity from airborne particulate matter. Int. J. Mol. Sci. 2019, 20, 4772. [Google Scholar] [CrossRef] [PubMed] [Green Version]
  13. Di Meo, S.; Reed, T.T.; Venditti, P.; Victor, V.M. Role of ROS and RNS Sources in Physiological and Pathological Conditions. Oxid. Med. Cell. Longev. 2016, 2016, 1245049. [Google Scholar] [CrossRef] [PubMed]
  14. Nozza, E.; Valentini, S.; Melzi, G.; Vecchi, R.; Corsini, E. Advances on the immunotoxicity of outdoor particulate matter: A focus on physical and chemical properties and respiratory defence mechanisms. Sci. Total Environ. 2021, 780, 146391. [Google Scholar] [CrossRef] [PubMed]
  15. Gao, D.; Mulholland, J.A.; Russell, A.G.; Weber, R.J. Characterization of water-insoluble oxidative potential of PM2.5 using the dithiothreitol assay. Atmos. Environ. 2020, 224, 117327. [Google Scholar] [CrossRef]
  16. Molina, C.; Toro, A.; Manzano, C.A.R.; Canepari, S.; Massimi, L.; Leiva-Guzmán, M. Airborne aerosols and human health: Leapfrogging from mass concentration to oxidative potential. Atmosphere 2020, 11, 917. [Google Scholar] [CrossRef]
  17. Bates, J.T.; Fang, T.; Verma, V.; Zeng, L.; Weber, R.J.; Tolbert, P.E.; Abrams, J.Y.; Sarnat, S.E.; Klein, M.; Mulholland, J.A.; et al. Review of Acellular Assays of Ambient Particulate Matter Oxidative Potential: Methods and Relationships with Composition, Sources, and Health Effects. Environ. Sci. Technol. 2019, 53, 4003–4019. [Google Scholar] [CrossRef]
  18. Borm, P.J.A.; Kelly, F.; Künzli, N.; Schins, R.P.F.; Donaldson, K. Oxidant generation by particulate matter: From biologically effective dose to a promising, novel metric. Occup. Environ. Med. 2007, 64, 73–74. [Google Scholar] [CrossRef] [Green Version]
  19. Pietrogrande, M.C.; Bacco, D.; Trentini, A.; Russo, M. Effect of filter extraction solvents on the measurement of the oxidative potential of airborne PM2.5. Environ. Sci. Pollut. Res. 2021, 28, 29551–29563. [Google Scholar] [CrossRef]
  20. Crobeddu, B.; Baudrimont, I.; Deweirdt, J.; Sciare, J.; Badel, A.; Camproux, A.-C.; Bui, L.C.; Baeza-Squiban, A. Lung Antioxidant Depletion: A Predictive Indicator of Cellular Stress Induced by Ambient Fine Particles. Environ. Sci. Technol. 2020, 54, 2360–2369. [Google Scholar] [CrossRef]
  21. Fang, T.; Verma, V.; Bates, J.T.; Abrams, J.; Klein, M.; Strickland, M.J.; Sarnat, S.E.; Chang, H.H.; Mulholland, J.A.; Tolbert, P.E.; et al. Oxidative potential of ambient water-soluble PM2.5 in the southeastern United States: Contrasts in sources and health associations between ascorbic acid (AA) and dithiothreitol (DTT) assays. Atmos. Chem. Phys. 2016, 16, 3865–3879. [Google Scholar] [CrossRef] [Green Version]
  22. Huang, W.; Baumgartner, J.; Zhang, Y.; Wang, Y.; Schauer, J.J. Source apportionment of air pollution exposures of rural Chinese women cooking with biomass fuels. Atmos. Environ. 2015, 104, 79–87. [Google Scholar] [CrossRef]
  23. Halliwell, B.; Whiteman, M. Measuring reactive species and oxidative damagein vivoand in cell culture: How should you do it and what do the results mean? J. Cereb. Blood Flow Metab. 2004, 142, 231–255. [Google Scholar] [CrossRef] [PubMed] [Green Version]
  24. Zhang, Z.-H.; Hartner, E.; Utinger, B.; Gfeller, B.; Paul, A.; Sklorz, M.; Czech, H.; Yang, B.X.; Su, X.Y.; Jakobi, G.; et al. Are reactive oxygen species (ROS) a suitable metric to predict toxicity of carbonaceous aerosol particles? Atmos. Chem. Phys. 2021, 22, 1793–1809. [Google Scholar] [CrossRef]
  25. Daellenbach, K.R.; Uzu, G.; Jiang, J.; Cassagnes, L.-E.; Leni, Z.; Vlachou, A.; Stefenelli, G.; Canonaco, F.; Weber, S.; Segers, A.; et al. Sources of particulate-matter air pollution and its oxidative potential in Europe. Nature 2020, 587, 414–419. [Google Scholar] [CrossRef] [PubMed]
  26. Simonetti, G.; Conte, E.; Perrino, C.; Canepari, S. Oxidative potential of size-segregated PM in an urban and an industrial area of Italy. Atmos. Environ. 2018, 187, 292–300. [Google Scholar] [CrossRef]
  27. Piacentini, D.; Falasca, G.; Canepari, S.; Massimi, L. Potential of PM-selected components to induce oxidative stress and root system alteration in a plant model organism. Environ. Int. 2019, 132, 105094. [Google Scholar] [CrossRef]
  28. Conte, E.; Canepari, S.; Frasca, D.; Simonetti, G. Oxidative potential of selected PM components. Multidiscip. Digit. Publ. Inst. Proc. 2017, 1, 108. [Google Scholar] [CrossRef] [Green Version]
  29. Rao, L.; Zhang, L.; Wang, X.; Xie, T.; Zhou, S.; Lu, S.; Liu, X.; Lu, H.; Xiao, K.; Wang, W.; et al. Oxidative Potential Induced by Ambient Particulate Matters with Acellular assays: A Review. Processes 2020, 8, 1410. [Google Scholar] [CrossRef]
  30. Gao, D.; Fang, T.; Verma, V.; Zeng, L.; Weber, R.J. A method for measuring total aerosol oxidative potential (OP) with the dithiothreitol (DTT) assay and comparisons between an urban and roadside site of water-soluble and total OP. Atmos. Meas. Tech. 2017, 10, 2821–2835. [Google Scholar] [CrossRef] [Green Version]
  31. Verma, V.; Fang, T.; Xu, L.; Peltier, R.E.; Russell, A.G.; Ng, N.L.; Weber, R.J. Organic Aerosols Associated with the Generation of Reactive Oxygen Species (ROS) by Water-Soluble PM2.5. Environ. Sci. Technol. 2015, 49, 4646–4656. [Google Scholar] [CrossRef]
  32. Yi, S.; Zhang, F.; Qu, F.; Ding, W. Water-insoluble fraction of airborne particulate matter (PM10) induces oxidative stress in human lung epithelial A549 cells. Environ. Toxicol. 2012, 29, 226–233. [Google Scholar] [CrossRef] [PubMed]
  33. Fang, T.; Zeng, L.; Gao, D.; Verma, V.; Stefaniak, A.B.; Weber, R.J. Ambient Size Distributions and Lung Deposition of Aerosol Dithiothreitol-Measured Oxidative Potential: Contrast between Soluble and Insoluble Particles. Environ. Sci. Technol. 2017, 51, 6802–6811. [Google Scholar] [CrossRef] [PubMed]
  34. Gao, D.; Ripley, S.; Weichenthal, S.; Pollitt, K.J.G. Ambient particulate matter oxidative potential: Chemical determinants, associated health effects, and strategies for risk management. Free Radic. Biol. Med. 2020, 151, 7–25. [Google Scholar] [CrossRef] [PubMed]
  35. Mukhtar, A.; Limbeck, A. Recent developments in assessment of bio-accessible trace metal fractions in airborne particulate matter: A review. Anal. Chim. Acta 2013, 774, 11–25. [Google Scholar] [CrossRef] [PubMed]
  36. Yan, Z.; Wang, J.; Li, J.; Jiang, N.; Zhang, R.; Yang, W.; Yao, W.; Wu, W. Oxidative stress and endocytosis are involved in upregulation of interleukin-8 expression in airway cells exposed to PM2.5. Environ. Toxicol. 2016, 31, 1869–1878. [Google Scholar] [CrossRef] [PubMed]
  37. Zou, Y.; Jin, C.; Su, Y.; Li, J.; Zhu, B. Water soluble and insoluble components of urban PM2.5 and their cytotoxic effects on epithelial cells (A549) in vitro. Environ. Pollut. 2016, 212, 627–635. [Google Scholar] [CrossRef]
  38. Knaapen, A.M.; Shi, T.; Borm, P.J.; Schins, R.P. Soluble metals as well as the insoluble particle fraction are involved in cellular DNA damage induced by particulate matter. In Oxygen/Nitrogen Radicals: Cell Injury and Disease; Springer: Boston, MA, USA, 2002; pp. 317–326. [Google Scholar]
  39. Soukup, J.M.; Becker, S. Human Alveolar Macrophage Responses to Air Pollution Particulates Are Associated with Insoluble Components of Coarse Material, Including Particulate Endotoxin. Toxicol. Appl. Pharmacol. 2001, 171, 20–26. [Google Scholar] [CrossRef] [PubMed]
  40. Daher, N.; Ning, Z.; Cho, A.K.; Shafer, M.; Schauer, J.J.; Sioutas, C. Comparison of the Chemical and Oxidative Characteristics of Particulate Matter (PM) Collected by Different Methods: Filters, Impactors, and BioSamplers. Aerosol Sci. Technol. 2011, 45, 1294–1304. [Google Scholar] [CrossRef]
  41. McWhinney, R.D.; Badali, K.; Liggio, J.; Li, S.-M.; Abbatt, J.P.D. Filterable Redox Cycling Activity: A Comparison between Diesel Exhaust Particles and Secondary Organic Aerosol Constituents. Environ. Sci. Technol. 2013, 47, 3362–3369. [Google Scholar] [CrossRef]
  42. Frezzini, M.A.; De Francesco, N.; Massimi, L.; Canepari, S. Effects of operating conditions on PM oxidative potential assays. Atmos. Environ. 2022, 268, 118802. [Google Scholar] [CrossRef]
  43. Wang, D.; Pakbin, P.; Shafer, M.M.; Antkiewicz, D.; Schauer, J.J.; Sioutas, C. Macrophage reactive oxygen species activity of water-soluble and water-insoluble fractions of ambient coarse, PM2.5 and ultrafine particulate matter (PM) in Los Angeles. Atmos. Environ. 2013, 77, 301–310. [Google Scholar] [CrossRef]
  44. Fuller, S.; Wragg, F.; Nutter, J.; Kalberer, M. Comparison of on-line and off-line methods to quantify reactive oxygen species (ROS) in atmospheric aerosols. Atmos. Environ. 2014, 92, 97–103. [Google Scholar] [CrossRef] [Green Version]
  45. Verma, V.; Rico-Martinez, R.; Kotra, N.; King, L.; Liu, J.; Snell, T.W.; Weber, R.J. Contribution of Water-Soluble and Insoluble Components and Their Hydrophobic/Hydrophilic Subfractions to the Reactive Oxygen Species-Generating Potential of Fine Ambient Aerosols. Environ. Sci. Technol. 2012, 46, 11384–11392. [Google Scholar] [CrossRef] [PubMed]
  46. Massimi, L.; Astolfi, M.L.; Canepari, S. Simple and Efficient Method to Detach Intact PM10 from Field Filters: Elements Recovery Assessment. 2022; Under Review. [Google Scholar]
  47. Süring, K.; Bach, S.; Höflich, C.; Straff, W. Flow Cytometric Analysis of Particle-bound Bet v 1 Allergen in PM10. J. Vis. Exp. 2016, 117, e54721. [Google Scholar] [CrossRef] [Green Version]
  48. Süring, K.; Bach, S.; Bossmann, K.; Wolter, E.; Neumann, A.; Straff, W.; Höflich, C. PM10 contains particle-bound allergens: Dust analysis by Flow Cytometry. Environ. Technol. Innov. 2016, 5, 60–66. [Google Scholar] [CrossRef]
  49. Massimi, L.; Simonetti, G.; Buiarelli, F.; Di Filippo, P.; Pomata, D.; Riccardi, C.; Ristorini, M.; Astolfi, M.L.; Canepari, S. Spatial distribution of levoglucosan and alternative biomass burning tracers in atmospheric aerosols, in an urban and industrial hotspot of Central Italy. Atmos. Res. 2020, 239, 104904. [Google Scholar] [CrossRef]
  50. Massimi, L.; Ristorini, M.; Simonetti, G.; Frezzini, M.A.; Astolfi, M.L.; Canepari, S. Spatial mapping and size distribution of oxidative potential of particulate matter released by spatially disaggregated sources. Environ. Pollut. 2020, 266, 115271. [Google Scholar] [CrossRef] [PubMed]
  51. ASRO. SR EN 12341: 2014. Air Quality–Determination of the PM10 Fraction of Suspended Particulate Matter. Reference Method and Field Test Procedure to Demonstrate Reference Equivalence of Measurements Methods. 2014. Available online: https://magazin.asro.ro/en/standard/8734 (accessed on 25 January 2022).
  52. Canepari, S.; Cardarelli, E.; Pietrodangelo, A.; Strincone, M. Determination of metals, metalloids and non-volatile ions in airborne particulate matter by a new two-step sequential leaching procedure Part A: Experimental design and optimization. Taanta 2006, 69, 581–587. [Google Scholar] [CrossRef]
  53. Canepari, S.; Cardarelli, E.; Pietrodangelo, A.; Strincone, M. Determination of metals, metalloids and non-volatile ions in air-borne particulate matter by a new two-step sequential leaching procedure: Part B: Validation on equivalent real samples. Talanta 2006, 69, 588–595. [Google Scholar] [CrossRef]
  54. Astolfi, M.L.; Protano, C.; Marconi, E.; Massimi, L.; Brunori, M.; Piamonti, D.; Migliara, G.; Vitali, M.; Canepari, S. A new rapid treatment of human hair for elemental determination by inductively coupled mass spectrometry. Anal. Methods 2020, 12, 1906–1918. [Google Scholar] [CrossRef]
  55. Conti, M.E.; Iacobucci, M.; Cucina, D.; Mecozzi, M. Multivariate statistical methods applied to biomonitoring studies. Int. J. Environ. Pollut. 2007, 29, 333. [Google Scholar] [CrossRef]
  56. Massimi, L.; Ristorini, M.; Eusebio, M.; Florendo, D.; Adeyemo, A.; Brugnoli, D.; Canepari, S. Monitoring and Evaluation of Terni (Central Italy) Air Quality through Spatially Resolved Analyses. Atmosphere 2017, 8, 200. [Google Scholar] [CrossRef] [Green Version]
  57. Calas, A.; Uzu, G.; Kelly, F.J.; Houdier, S.; Martins, J.M.F.; Thomas, F.; Molton, F.; Charron, A.; Dunster, C.; Oliete, A.; et al. Comparison between five acellular oxidative potential measurement assays performed with detailed chemistry on PM10 samples from the city of Chamonix (France). Atmos. Chem. Phys. 2018, 18, 7863–7875. [Google Scholar] [CrossRef] [Green Version]
  58. Janssen, N.A.; Yang, A.; Strak, M.; Steenhof, M.; Hellack, B.; Gerlofs-Nijland, M.E.; Kuhlbusch, T.; Kelly, F.; Harrison, R.; Brunekreef, B.; et al. Oxidative potential of particulate matter collected at sites with different source characteristics. Sci. Total Environ. 2014, 472, 572–581. [Google Scholar] [CrossRef] [Green Version]
  59. Massimi, L.; Pietrodangelo, A.; Frezzini, M.A.; Ristorini, M.; De Francesco, N.; Sargolini, T.; Amoroso, A.; Di Giosa, A.; Canepari, S.; Perrino, C. Effects of COVID-19 lockdown on PM10 composition and sources in the Rome Area (Italy) by elements’ chemical fractionation-based source apportionment. Atmos. Res. 2021, 266, 105970. [Google Scholar] [CrossRef]
  60. Lokorai, K.; Ali-Khodja, H.; Khardi, S.; Bencharif-Madani, F.; Naidja, L.; Bouziane, M. Influence of mineral dust on the concentration and composition of PM10 in the city of Constantine. Aeolian Res. 2021, 50, 100677. [Google Scholar] [CrossRef]
  61. Canepari, S.; Astolfi, M.; Catrambone, M.; Frasca, D.; Marcoccia, M.; Marcovecchio, F.; Massimi, L.; Rantica, E.; Perrino, C. A combined chemical/size fractionation approach to study winter/summer variations, ageing and source strength of atmospheric particles. Environ. Pollut. 2019, 253, 19–28. [Google Scholar] [CrossRef]
  62. Perrone, M.R.; Bertoli, I.; Romano, S.; Russo, M.; Rispoli, G.; Pietrogrande, M.C. PM2.5 and PM10 oxidative potential at a Central Mediterranean Site: Contrasts between dithiothreitol- and ascorbic acid-measured values in relation with particle size and chemical composition. Atmos. Environ. 2019, 210, 143–155. [Google Scholar] [CrossRef]
  63. Owoade, K.O.; Hopke, P.; Olise, F.S.; Ogundele, L.T.; Fawole, O.; Olaniyi, B.H.; Jegede, O.O.; Ayoola, M.A.; Bashiru, M.I. Chemical compositions and source identification of particulate matter (PM 2.5 and PM 2.5–10) from a scrap iron and steel smelting industry along the Ife–Ibadan highway, Nigeria. Atmos. Pollut. Res. 2015, 6, 107–119. [Google Scholar] [CrossRef]
  64. Harrison, R.M.; Allan, J.; Carruthers, D.; Heal, M.R.; Lewis, A.C.; Marner, B.; Murrells, T.; Williams, A. Non-exhaust vehicle emissions of particulate matter and VOC from road traffic: A review. Atmos. Environ. 2021, 262, 118592. [Google Scholar] [CrossRef]
  65. Hicks, W.; Beevers, S.; Tremper, A.H.; Stewart, G.; Priestman, M.; Kelly, F.J.; Lanoiselle, M.; Lowry, D.; Green, D.C. Quanti-fication of non-exhaust particulate matter traffic emissions and the impact of COVID-19 lockdown at London Marylebone Road. Atmosphere 2021, 12, 190. [Google Scholar] [CrossRef]
  66. Massimi, L.; Ristorini, M.; Astolfi, M.L.; Perrino, C.; Canepari, S. High resolution spatial mapping of element concentrations in PM10: A powerful tool for localization of emission sources. Atmos. Res. 2020, 244, 105060. [Google Scholar] [CrossRef]
  67. Charrier, J.G.; Anastasio, C. On dithiothreitol (DTT) as a measure of oxidative potential for ambient particles: Evidence for the importance of soluble transition metals. Atmos. Chem. Phys. 2012, 12, 9321–9333. [Google Scholar] [CrossRef] [Green Version]
  68. King, L.E.; Weber, R.J. Development and testing of an online method to measure ambient fine particulate reactive oxygen species (ROS) based on the 2’,7’-dichlorofluorescin (DCFH) assay. Atmos. Meas. Tech. 2013, 6, 1647–1658. [Google Scholar] [CrossRef] [Green Version]
  69. Charron, A.; Polo-Rehn, L.; Besombes, J.-L.; Golly, B.; Buisson, C.; Chanut, H.; Marchand, N.; Guillaud, G.; Jaffrezo, J.-L. Identification and quantification of particulate tracers of exhaust and non-exhaust vehicle emissions. Atmos. Chem. Phys. 2019, 19, 5187–5207. [Google Scholar] [CrossRef] [Green Version]
  70. Thorpe, A.; Harrison, R.M. Sources and properties of non-exhaust particulate matter from road traffic: A review. Sci. Total Environ. 2008, 400, 270–282. [Google Scholar] [CrossRef]
  71. Li, W.; Ge, P.; Chen, M.; Tang, J.; Cao, M.; Cui, Y.; Hu, K.; Nie, D. Tracers from Biomass Burning Emissions and Identification of Biomass Burning. Atmosphere 2021, 12, 1401. [Google Scholar] [CrossRef]
  72. Pietrogrande, M.C.; Bertoli, I.; Clauser, G.; Dalpiaz, C.; Dell’Anna, R.; Lazzeri, P.; Lenzi, W.; Russo, M. Chemical composition and oxidative potential of atmospheric particles heavily impacted by residential wood burning in the alpine region of northern Italy. Atmos. Environ. 2021, 253, 118360. [Google Scholar] [CrossRef]
  73. Karbowska, B. Presence of thallium in the environment: Sources of contaminations, distribution and monitoring methods. Environ. Monit. Assess. 2016, 188, 640. [Google Scholar] [CrossRef] [Green Version]
  74. Pant, P.; Harrison, R.M. Estimation of the contribution of road traffic emissions to particulate matter concentrations from field measurements: A review. Atmos. Environ. 2013, 77, 78–97. [Google Scholar] [CrossRef]
  75. Canepari, S.; Perrino, C.; Olivieri, F.; Astolfi, M.L. Characterisation of the traffic sources of PM through size-segregated sampling, sequential leaching and ICP analysis. Atmos. Environ. 2008, 42, 8161–8175. [Google Scholar] [CrossRef]
  76. Guo, H.-B.; Li, M.; Lyu, Y.; Cheng, T.-T.; Xv, J.; Li, X. Size-resolved particle oxidative potential in the office, laboratory, and home: Evidence for the importance of water-soluble transition metals. Environ. Pollut. 2019, 246, 704–709. [Google Scholar] [CrossRef] [PubMed]
  77. Fusaro, L.; Salvatori, E.; Winkler, A.; Frezzini, M.A.; De Santis, E.; Sagnotti, L.; Canepari, S.; Manes, F. Urban trees for bio-monitoring atmospheric particulate matter: An integrated approach combining plant functional traits, magnetic and chemical properties. Ecol. Indic. 2021, 126, 107707. [Google Scholar] [CrossRef]
  78. Calas, A.; Uzu, G.; Besombes, J.-L.; Martins, J.M.; Redaelli, M.; Weber, S.; Charron, A.; Albinet, A.; Chevrier, F.; Brulfert, G.; et al. Seasonal Variations and Chemical Predictors of Oxidative Potential (OP) of Particulate Matter (PM), for Seven Urban French Sites. Atmosphere 2019, 10, 698. [Google Scholar] [CrossRef] [Green Version]
  79. Pietrogrande, M.C.; Russo, M.; Zagatti, E. Review of PM Oxidative Potential Measured with Acellular Assays in Urban and Rural Sites across Italy. Atmosphere 2019, 10, 626. [Google Scholar] [CrossRef] [Green Version]
  80. Hakimzadeh, M.; Soleimanian, E.; Mousavi, A.; Borgini, A.; De Marco, C.; Ruprecht, A.A.; Sioutas, C. The impact of biomass burning on the oxidative potential of PM2.5 in the metropolitan area of Milan. Atmos. Environ. 2020, 224, 117328. [Google Scholar] [CrossRef]
  81. Hedayat, F.; Stevanovic, S.; Miljevic, B.; Bottle, S.; Ristovski, Z. Review-evaluating the molecular assays for measuring the oxidative potential of particulate matter. Chem. Ind. Chem. Eng. Q. 2015, 21, 201–210. [Google Scholar] [CrossRef] [Green Version]
  82. Altuwayjiri, A.; Pirhadi, M.; Kalafy, M.; Alharbi, B.; Sioutas, C. Impact of different sources on the oxidative potential of ambient particulate matter PM10 in Riyadh, Saudi Arabia: A focus on dust emissions. Sci. Total Environ. 2022, 806, 150590. [Google Scholar] [CrossRef]
  83. Almeida, S.M.; Pio, C.A.; Freitas, M.C.; Reis, M.A.; Trancoso, M.A. Source apportionment of fine and coarse particulate matter in a sub-urban area at the Western European Coast. Atmos. Environ. 2005, 39, 3127–3138. [Google Scholar] [CrossRef]
Figure 1. Average solubility percentages (%) of the elements in the 20 PM10 samples collected at PR and average contribution percentages (%) of the two solubility fractions to the TOPDCFH, TOPAA, and TOPDTT.
Atmosphere 13 00349 g001
Figure 2. Comparison of OPAA (a), OPDTT (b), and OPDCFH (c) values between the TOP and WSOP of PM10 samples collected at PR.
Atmosphere 13 00349 g002
Figure 3. Biplot of PC2/PC3 from the PCA performed on the WSOP, TOP, and IOP values for OPAA, OPDTT, and OPDCFH, and element concentrations in the water-soluble (_ws) and insoluble (_i) fraction of the 20 PM10 samples.
Atmosphere 13 00349 g003
Table 1. Minimum detection limit (MDL), concentrations, mean and standard deviation of PM10 mass, and of the elements analyzed in the water-soluble and insoluble fraction of the 20 PM10 samples collected at PR. PM10 mass concentration was not detected (N.D.) on 17, 18, and 24 May 2021.
Water-Soluble Fraction (ws)Insoluble Fraction (i)
PM10AlCrCsCuFeLiNiRbSbSnAlCrCsCuFeLiNiRbSbSn
UoMµg·m−3ng·m−3ng·m−3ng·m−3ng·m−3ng·m−3ng·m−3ng·m−3ng·m−3ng·m−3ng·m−3ng·m−3ng·m−3ng·m−3ng·m−3ng·m−3ng·m−3ng·m−3ng·m−3ng·m−3ng·m−3
MDL51.70.0630.000760.0333.30.0450.0310.0180.0510.464.71.90.000540.44220.0180.710.0390.0740.11
05/05/202126212.50.0170.737.60.270.40.340.0590.065178970.058106610.22310.390.391.1
06/05/202137231.60.0270.716.90.900.380.450.0480.0484471350.152011571.3590.970.552
07/05/2021362540.0251.790.450.80.430.140.0763712460.142316180.041740.9512.5
08/05/202120291.80.0111.3100.220.530.20.140.36117520.03574410.12230.230.321.5
09/05/202124302.60.011.1120.120.690.360.140.16143690.039134020.13370.450.240.99
10/05/202121101.10.0120.93100.150.410.410.20.13148520.0516.73060.1590.590.30.68
11/05/202121634.10.0281.5160.680.60.70.230.223551090.11108790.4240.710.681.5
12/05/202125202.20.0291.48.20.460.470.410.0510.0412241140.072179440.3520.430.51.7
13/05/202129112.20.0221.37.10.660.680.370.050.05158440.03493840.34210.260.220.68
14/05/202120282.30.0291.38.60.171.10.380.110.241242020.0332311010.111840.160.462.2
15/05/2021187.21.20.0090.425.50.050.330.160.100.04351390.0114.12270.041150.110.190.52
16/05/2021132520.0120.7990.150.450.330.0840.042775080.0583127910.231510.450.882.8
17/05/2021N.D.281.50.0350.198.30.570.150.550.0430.0314721530.13149450.8400.710.512.2
18/05/2021N.D.242.70.0190.887.80.280.310.250.0620.072121630.0386.84090.22130.230.250.8
19/05/202120151.10.00670.353.40.170.130.140.0480.1557160.0131.81380.0783.90.150.110.34
20/05/202110581.20.0150.728.60.400.350.30.0520.0443331010.069106040.56340.540.360.92
21/05/202133563.20.0381.8151.150.920.60.150.112281020.081167960.36640.460.421.3
22/05/2021311420.0120.91120.110.350.310.450.083182880.0465.53440.17100.390.510.71
23/05/202117265.20.011.1130.300.490.370.240.0843771810.0841211850.39360.620.651.3
24/05/2021N.D.92.10.0120.98.30.150.510.240.10.074127950.0345.33350.137.10.340.240.56
Mean24262.30.019190.370.50.360.120.112251230.064127830.3440.460.441.3
Std. Dev.7.7161.10.010.433.10.290.240.140.10.0851271070.047.56130.29470.250.240.72
Table 2. WSOP, TOP, and IOP values for the OPDCFH, OPAA, and OPDTT assays applied to the 20 PM10 samples collected at PR.
DCFHAADTT
WSOPTOPIOPIOP/TOPWSOPTOPIOPIOP/TOPWSOPTOPIOPIOP/TOP
UoMnmol H2O2 m3%nmol AA min−1·m−3%nmol DTT min−1·m−3%
MDL1.1 × 10−100.00960.0058
05/05/20211.1 × 10−82.2 × 10−81.1 × 10−8490.370.420.051120.320.490.1735
06/05/20216.8 × 10−91.9 × 10−81.2 × 10−8630.251.20.99800.0770.790.7190
07/05/20211.1 × 10−82.2 × 10−81.1 × 10−8511.62.10.36180.430.820.3948
08/05/20211.8 × 10−81.9 × 10−84.7 × 10−1020.160.940.78830.630.970.3435
09/05/20211.7 × 10−82.1 × 10−83.9 × 10−9180.671.40.69510.750.890.1415
10/05/20211.1 × 10−81.2 × 10−88.7 × 10−1080.691.91.2640.860.860.00150.17
11/05/20213.4 × 10−84.1 × 10−86.6 × 10−9160.281.61.3820.611.40.8358
12/05/20218.2 × 10−92.1 × 10−81.2 × 10−8591.51.70.25150.190.220.029
13/05/20216.9 × 10−91.2 × 10−85.2 × 10−9430.691.50.84550.520.710.1927
14/05/20211.9 × 10−81.9 × 10−84.4 × 10−1020.461.51.1690.460.840.3845
15/05/20211.5 × 10−92.4 × 10−82.3 × 10−8940.621.50.89590.511.10.4949
16/05/20219.3 × 10−99.9 × 10−96.3 × 10−1060.040.890.86960.260.590.3356
17/05/20217.4 × 10−91.9 × 10−81.2 × 10−8620.470.910.44480.111.10.9690
18/05/20211.5 × 10−83.1 × 10−81.5 × 10−8501.11.20.18150.390.780.3950
19/05/20211.4 × 10−81.8 × 10−84.3 × 10−9230.330.920.59640.00110.720.7299
20/05/20211.9 × 10−81.9 × 10−81.1 × 10−950.140.580.44760.0790.110.02121
21/05/20212.2 × 10−83.3 × 10−81.6 × 10−8420.961.60.65411.191.20.0221.8
22/05/20211.9 × 10−82.9 × 10−89.8 × 10−9330.420.620.21330.0560.810.7593
23/05/20211.8 × 10−81.8 × 10−88.1 × 10−1040.593.93.3850.410.510.1122
24/05/20211.5 × 10−82.4 × 10−88.9 × 10−9370.591.91.3690.040.310.2786
Mean1.4 × 10−82.2 × 10−87.6 × 10−9350.591.40.82580.390.760.3648
Std. Dev.7.1 × 10−97.7 × 10−96.2 × 10−9810.420.740.69930.310.320.391
Publisher’s Note: MDPI stays neutral with regard to jurisdictional claims in published maps and institutional affiliations.

