

Real-Time Jaundice Detection in Neonates Based on Machine Learning Models


1
Electrical Engineering Technical College, Middle Technical University, Baghdad 10022, Iraq
2
Al Elwiya Maternity Teaching Hospital, Baghdad 10068, Iraq
3
School of Engineering, University of South Australia, Adelaide, SA 5095, Australia
*
Author to whom correspondence should be addressed.
BioMedInformatics 2024, 4(1), 623-637; https://0-doi-org.brum.beds.ac.uk/10.3390/biomedinformatics4010034
Submission received: 4 December 2023
/
Revised: 14 February 2024
/
Accepted: 20 February 2024
/
Published: 24 February 2024
(This article belongs to the Special Issue Feature Papers in Applied Biomedical Data Science)
Abstract
:Introduction: Despite the many attempts made by researchers to diagnose jaundice non-invasively using machine learning techniques, the low amount of data used to build their models remains the key factor limiting the performance of their models. Objective: To build a system to diagnose neonatal jaundice non-invasively based on machine learning algorithms created based on a dataset comprising 767 infant images using a computer device and a USB webcam. Methods: The first stage of the proposed system was to evaluate the performance of four machine learning algorithms, namely support vector machine (SVM), k nearest neighbor (k-NN), random forest (RF), and extreme gradient boost (XGBoost), based on a dataset of 767 infant images. The algorithm with the best performance was chosen as the classifying algorithm in the developed application. The second stage included designing an application that enables the user to perform jaundice detection for a patient under test with the minimum effort required by capturing the patient’s image using a USB webcam. Results: The obtained results of the first stage of the machine learning algorithms evaluation process indicated that XGBoost outperformed the rest of the algorithms by obtaining an accuracy of 99.63%. The second-best algorithm was the RF algorithm, which had an accuracy of 98.99%. Following RF, with a slight difference, was the k-NN algorithm. It achieved an accuracy of 98.25%. SVM scored the lowest performance among the above three algorithms, with an accuracy of 96.22%. Based on these obtained results, the XGBoost algorithm was chosen to be the classifier of the proposed system. In the second stage, the jaundice application was designed based on the model created by the XGBoost algorithm. This application ensured it was user friendly with as fast a processing time as possible. Conclusion: Early detection of neonatal jaundice is crucial due to the severity of its complications. A non-invasive system using a USB webcam and an XGBoost machine learning technique was proposed. The XGBoost algorithm achieved 99.63% accuracy and successfully diagnosed 10 out of 10 NICU infants with very little processing time. This denotes the efficiency of machine learning algorithms in healthcare in general and in monitoring systems specifically.
Keywords:
jaundice; hyperbilirubinemia; phototherapy; skin color analysis; real-time; SVM; K-NN; RF; XGBoost1. Introduction
The sclera of the eye and body skin discoloration to yellow are the main apparent symptoms of neonatal jaundice [1]. Jaundice is caused by high bilirubin levels in the patient’s blood due to an immature liver, known as hyperbilirubinemia [2]. The severity of jaundice classifies it as one of the top causes of neonatal mortality and permanent disorders. Statistics show that hyperbilirubinemia caused 114,000 deaths and 75,000 brain dysfunction cases in neonates over a decade ago [3]. Diagnosis of hyperbilirubinemia can be achieved by collecting blood samples from the patient in a total serum bilirubin (TSB) test [4]. As this type of test is invasive and causes stress and discomfort to the patient, a non-invasive way is preferred. Transcutaneous bilirubin (TcB) is a non-invasive technique for bilirubin calculation [5]; however, this method is not available in all healthcare institutes [6].
Researchers have started implementing image-processing techniques for diagnosing jaundice in recent years. For example, an approach by Ayden et al. (2016) [7] used artificial intelligence as a classifier for 80 images of infants taken by a smartphone camera. They used an image segmentation technique to achieve color balance using an 8-colored card put on a specific area of the baby’s skin for calibration. Afterward, they used color map transformation and feature extraction on the baby’s skin color and the calibration card in the RGB (red, green, blue), YCrCb (Y: luminance, CrCb: chrominance), and LAB color space. Then, k-NN and support vector regression models were applied to the acquired data to estimate the bilirubin levels. These results show better quality results with less processing time using artificial intelligence techniques. Nevertheless, it required an 8-colored card for calibration.
In another study conducted in 2018, Munkholm et al. [8] introduced a technique for transcutaneous bilirubin measurement that employed the camera of an iPhone 6 as the primary data collection tool. They affixed a dermatoscope, which includes a magnifier, a light source, and a transparent plate for unobstructed skin lesion inspection, to the smartphone. A Wratten filter was inserted between the smartphone and the dermatoscope to minimize hemoglobin reflectance and facilitate the sensing of bilirubin-emitted wavelengths. The findings indicated that photographs taken with a smartphone and a dermatoscope and applied to a neonate’s glabella yielded promising evidence for neonatal hyperbilirubinemia testing. However, it did not reach the level of validity required for clinical application.
In 2018, Kawano et al. [9] proposed a non-invasive method for neonatal jaundice detection using RGB color and a threshold value to extract the facial area, subsequently isolating the eye and mouth maps. For jaundice detection, two image features were utilized: the first involved measuring average skin hue information, while the second involved assessing color dispersion, as normal skin color remains consistent but varies in jaundice cases. Eigenvalues of the variance-covariance matrix were then computed to determine whether skin color exhibited dispersion. The researchers faced limitations in extracting skin areas, and the study was conducted on 64 infants only.
The method introduced in [9] is straightforward and can potentially improve its performance. However, it faced challenges in accurately extracting the skin area, particularly in cases where eyebrows and eyes could not be effectively removed using an eye chart, resulting in unsuccessful outcomes. Another study by Endang et al. (2019) [10] used a digital camera to capture images of neonates for estimating risk zones. The captured images were preprocessed by using a median filter to remove imperfections and color correction to decrease color saturation, which was achieved by referencing a color card featuring the primary colors red, green, and blue. Subsequently, the images were converted into three distinct color spaces: RGB, HSV, and YCbCr. Despite its simplicity and a strong correlation with the data, the proposed system exhibited a 17% error rate, resulting in an accuracy level of only 67%.
In a study by Warkaa et al. (2021) [11], the researchers conducted an investigation aimed at diagnosing neonatal jaundice through a graphical user interface designed with the MATLAB program. The study employed diverse color models, including RGB, HSV, and YCbCr (Luminance, Chrominance), as part of its analytical methods and produced promising outcomes; however, it had limitations, primarily due to a restricted sample size for normal and jaundiced infants, without consideration of lighting conditions.
Hashim et al. [12] attempted to employ image-processing techniques for jaundice diagnosis using skin color analysis. The suggested system tackled many challenges by implementing an effective skin detection method that does not depend on particular areas such as the face or sclera. It further utilizes the Cb channel within the YCbCr color space to assess skin color, mitigating the influence of ambient lighting on outcomes. Moreover, it integrates a flexible threshold for jaundice diagnosis, granting control over the desired bilirubin level for phototherapy, all while upholding a high diagnostic accuracy at an economical cost. However, the study encountered limitations due to the limited availability of neonatal images, which led the researchers to work with only two manikins and 20 infant images without accounting for lighting conditions, and they utilized “if” and “elseif” commands in MATLAB rather than machine learning models, which constrained the results when input data fell outside the predefined condition range.
In 2022, the researchers [13] proposed a method for detecting hyperbilirubinemia by analyzing the skin color of infants’ chest images taken by a smartphone camera. These images were taken under specific conditions, using lighting, infant position, and a standard colored chart beside each infant as references. The acquired images were then transferred to a computer and analyzed using ImageJ software (ver. 1.52k, National Institute of Health, USA). The researchers analyzed color intensities by implementing the regression method of bilirubin levels and RGB values. They concluded that blue had the highest correlation with bilirubin levels; the yellower the skin of the chest was, the lower the blue intensity and the higher the bilirubin levels. This study showed some limitations. The number of patients was limited to 31 infants, and the images had to be taken under specific conditions (for instance, in an infant position with a clear chest view, in a specific lighting environment, and using a standard colored chart). In addition to the previously mentioned processes, most were performed manually, susceptible to human error and requiring more time.
Later that year, the same researchers applied the same setup as in their first study but used a different part of the patient’s body: the arm of the infant [14]. The same issues appeared in their study, and they had to take several pictures of the same patient’s arm to get the best image. Additionally, the study depended on using a standard color chart in each image for image correction.
A recent study by Sreedha et al. (2023) [15] presented another jaundice detection method using computer vision and the application of multiple machine learning models for image augmentation, mask segmentation, and color detection. They proposed a novel metric, weighted average yellowness (WAY). They used the yellow color value from the CMYK (cyan, magenta, yellow, key/black) color space to determine the degree of yellow color of the sclera in 35 eye images acquired from the World Wide Web. Depending on empirical observation, the value of WAY determines whether the patient under test is jaundiced or healthy. The study used multiple machine learning models to extract the yellow color. However, the study was used to detect jaundice through sclera color alone, and that is a difficult measure to take when dealing with uncooperative neonatal infants.
In [16], the researchers attempted to estimate bilirubin levels using a smartphone camera to scan patients’ sclera. The study was performed on 102 participants. The researchers created a mobile application, “jScan”. The application’s operation was based on three phases. The first phase was region of interest selection using the sclera segmentation model. The second phase estimated bilirubin levels using RGB and the yellow index values acquired from the first phase. Then, a regression model was applied to predict bilirubin levels. The third stage was the application creation stage, where the user must download the application to start the test. This study’s results were promising. However, it lacked data to enhance predictions and was intended to be used on adults only.
The authors of this paper made their first attempt at creating a machine learning model using a random forest model to diagnose jaundice in neonates in early 2023 [17]. They collected 411 images of normal and jaundiced neonates, and created a graphical user interface (GUI) using a MATLAB program that enabled them to test for jaundice on still images. The results were promising; however, the study lacked data and did not compare performance with other machine learning models. Moreover, the study was conducted on still images of patients acquired from separate camera modules and then downloaded to the computer for processing. In other words, more effort was required and it was time consuming.
Later that year, the same authors were able to collect 760 images of normal and jaundiced neonates and publish them in [18]. They built three models, each model based on a specific machine learning model, and made a performance comparison between those models. These models were k-NN, RF, and XGBoost. However, the proposed study relied on the MATLAB GUI, which required the MATLAB program to be installed on the computer running that GUI. Moreover, the research did not include the use of external hardware and did not perform live tests.
Therefore, the current study proposed a new jaundice detection application based on different machine learning models, including SVM, k-NN, RF, and XGBoost, based on the collected data from [18] to achieve real-time jaundice detection directly from a camera module connected to the computer without the time-consuming efforts of capturing the images on a separate imaging device and having to download them to the computer. This was accomplished using an installable application for Windows-running computers that does not require the MATLAB program to be installed, and using a webcam connected to the computer device via a USB port, an Arduino microcontroller, a digital relay, and a blue LED light, taking into consideration the accuracy, infant position, and lighting conditions.
The remainder of this paper is organized as follows: Section 2 describes the methods and materials of the proposed system, including data collection, experimental setup, and system design. Section 3 illustrates the experimental results obtained from different machine learning models and the implementation of real-time testing for infants inside the neonatal intensive care unit (NICU). Finally, Section 4 discusses the conclusion and future works.
2. Materials and Methods
2.1. Data Collection
The proposed system was based on the dataset of images acquired from the Normal Jaundice Newborns (NJN) dataset found in [18]. These images were captured in Al-Elwiya Maternity Teaching Hospital, an affiliation of Al Rusafa Health Directorate under the Iraqi Ministry of Health, Baghdad, Iraq. The dataset comprises 767 normal and jaundiced infant images for training machine learning models. The ages of infants ranged from 2 to 12 days, and they had different skin tones and weights. The training tests were done on 563 normal and 204 jaundiced infants, all according to the Declaration of Helsinki guidelines (Finland 1964) with the clearance ethics granted by the research committee in Al Rusafa Directorate of Health, Ministry of Health and Environment, Baghdad, Iraq (Protocol number: 2022019). A written parental approval for each infant was also obtained. Real-time tests were conducted on ten infants inside the NICU.
2.2. Experimental Setup
The proposed system used a full-HD webcam connected to a laptop with a MATLAB program (version R2023a) to run the interface with an Arduino Uno microcontroller to control the operation of a blue LED therapy lamp. The camera provided video recording with 1080 × 1920 resolution. The microcontroller turned on the blue light lamp if the infant under test had jaundice; otherwise, it turned it off.
The first step of this proposed system was creating models for the machine learning algorithms: SVM, k-NN, RF, and XGBoost. The models were based on the NJN dataset [18]. The creation of these models was performed with the MATLAB application using fitcsvm for SVM, fitcknn for k-NN, fitensemble for RF, and xgb.train for XGBoost (via the XGBoost MATLAB interface). The training file, which is an Excel sheet in CSV format, was loaded to the code of each method. The rows of the datasheet represented the feature values and the class of each sample (in this case, the patient). The columns represented the features, which were the R, G, B, Y, Cr, Cb, and class. The class referred to the actual status of the infant (i.e., normal or jaundiced).
2.3. System Design
Various image processing methods were utilized in this system to extract and examine relevant features of interest in real time. These methods encompassed skin detection, selecting regions of interest (ROI), analyzing skin color, and transforming color spaces. The flowchart in Figure 1 illustrates the overall structure of the proposed imaging system.
2.3.1. Skin Detection and ROI Selection
Skin color change is one of the leading clinical symptoms of jaundice. Skin detection is the primary and the most optimum technique in this proposed system to achieve real-time diagnosis rather than manually selecting the ROI. Skin pixels are the primary targets in this process but, due to the variety of skin tones of the human race, not the sole factor; multiple techniques can be implemented to achieve skin detection [19]. The proposed system suggests using three methods: LAB color space transformation, thresholding, and image processing techniques, which are implemented using the MATLAB program. The skin detection process starts by capturing an RGB image from the live feed provided by the camera, then converting it to LAB color space, where “L” represents the brightness, “A” indicates green-red colors, and “B” shows blue-yellow colors, and the LAB color space identifies each color regardless of how it is displayed. Then, OTSU thresholding is applied to each LAB channel value in gray level and binary. The input to this thresholding technique is the thresholding value and grayscale image. If the pixel intensity value exceeds the threshold, the output pixel will be white; otherwise, it will be black. This thresholding technique categorizes each pixel independently of its adjacent pixels, resulting in an image in binary mode [20]. Structural operations were applied to the output binary image from the thresholding stage to enhance the image and separate skin pixels from the rest of the unwanted pixels. Following this process, an erosion filter was used to neglect the undesired pixels (that is, skin pixels) by setting them to one, and the rest of the unwanted pixels were set to zero. Thus, the resultant output would consist of skin pixels only. The proposed study used a MATLAB model to achieve ROI selection.
2.3.2. Image Analysis
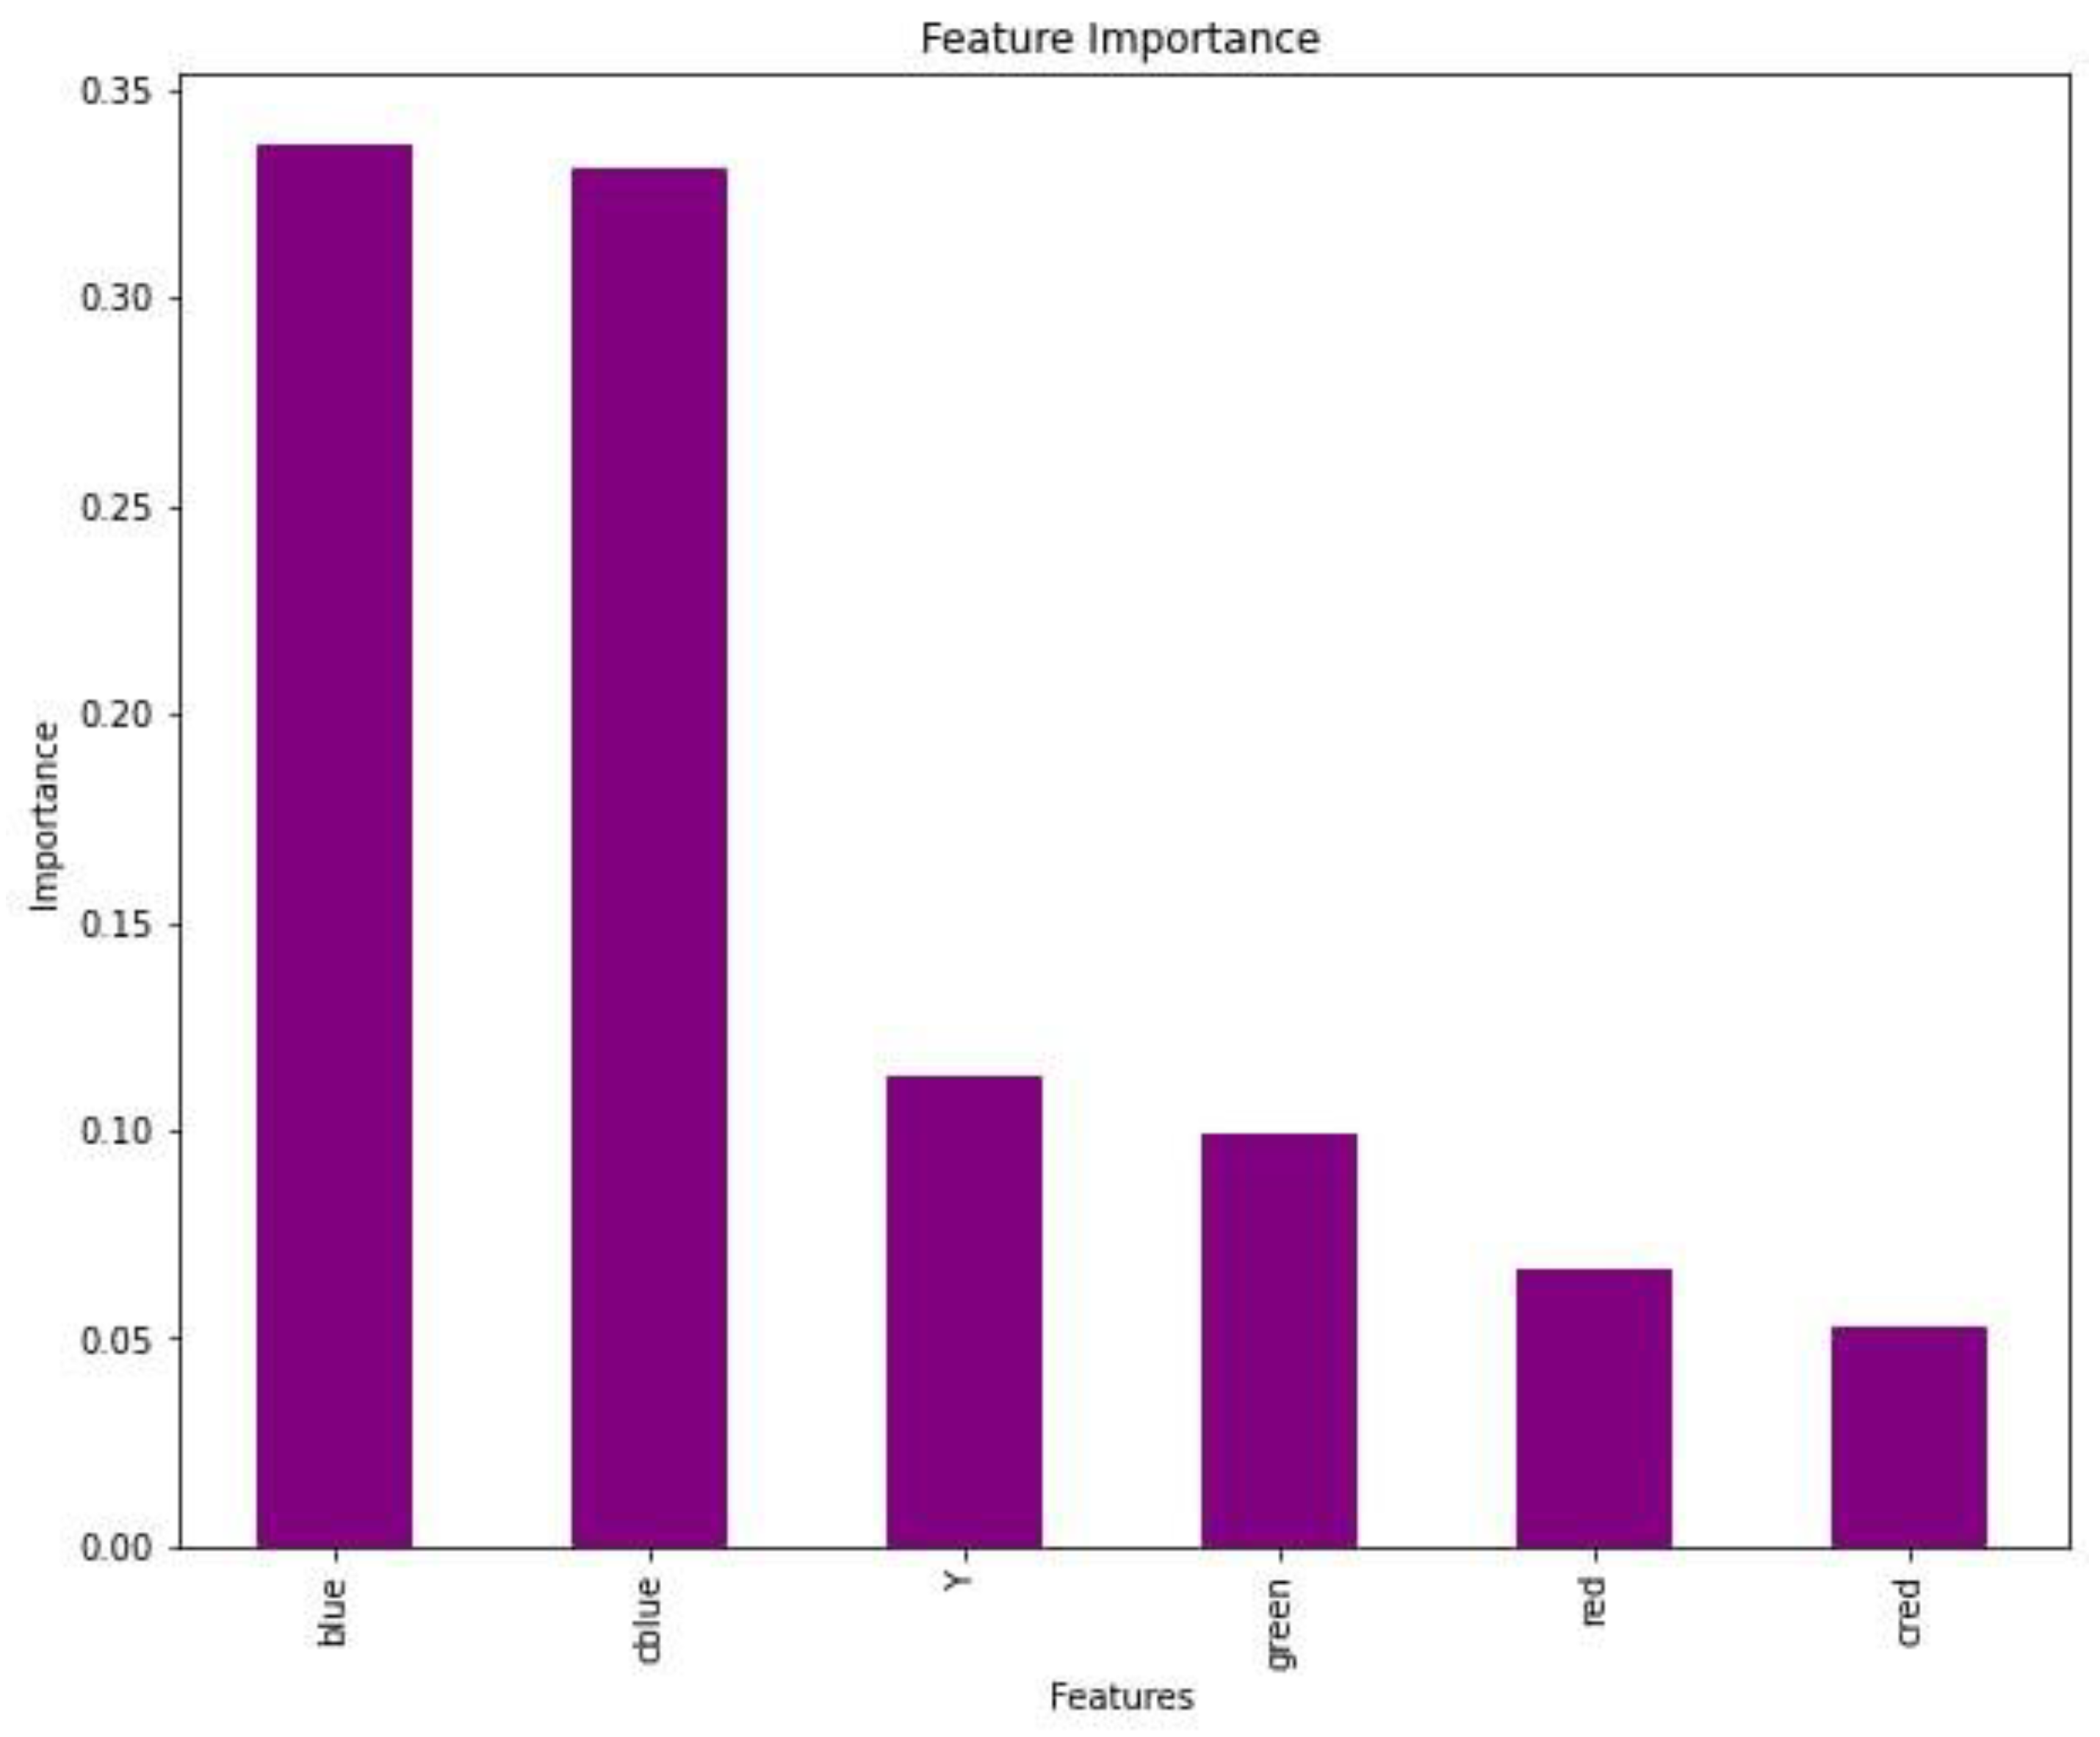
Following skin detection and ROI selection, skin color analysis was applied to the resulting skin image using RGB and YCrCb color models [21]. The YCrCb color space gives the advantage of neglecting the luminance component, which leads to false diagnosis, since the values of Y and CrCb components are stored in different channels. The B in RGB and Cb in YCrCb channels are the primary channels for detecting yellow [22]. Thus, as mentioned earlier, the thresholding technique is applied to the B and Cb channels to achieve real-time jaundice detection, since those two channels have the highest feature importance among the channels, as illustrated in Figure 2. After the image analysis process is completed, the intensities from different channel values are fed to different machine learning models to train the system with predefined values. Based on the trainable model, the infant will be classified as normal or jaundiced. Based on this diagnosis, the microcontroller will activate or deactivate the UV lamp above the infant.
2.3.3. Matlab App Designer
This study used MATLAB version 2023a with the App Designer tool to design a user-friendly font. App Designer is an improved MATLAB graphical user interface (GUI) version. It is a feature-rich development environment that enables users to design and deploy custom apps without advanced programming skills. The App Designer utilizes a model trained with four models: SVM, k-NN, RF, and XGBoost. Subsequently, the GUI is converted into a Windows-based application that can be installed on other Windows operating system-equipped computers, eliminating the necessity to install MATLAB.
The GUI is designed to prioritize user-friendliness and simplicity. Commencing with the application’s launch and webcam connection, initiating real-time monitoring is effortlessly accomplished by clicking the “Capture Video” button. To assess the current condition of the infant under surveillance, the user must select the “Snapshot” button. Subsequently, the program will autonomously designate the pertinent ROI and furnish an evaluation of the infant’s status, disclosing whether they are normal or exhibiting signs of jaundice. Additionally, the GUI presents RGB and YCrCb values alongside a histogram for further examination.
2.4. Implementation of Machine Learning Models as Classifiers
2.4.1. Support Vector Machine (SVM)
The SVM model is a powerful and widely used machine learning method introduced by Cortes et al. [23]. The method is used in both classification and regression tasks. Its fundamental principle is to find an optimal hyperplane that maximizes the margin between data points belonging to different classes, thus enabling effective separation. The fundamental operation of the SVM classifier when assessing two classes is shown in Figure 3. In this scenario, the feature points are designated as part of either the positive or negative class. SVM processes these feature points and constructs hyperplanes that separate them into their respective classes. The optimal hyperplane or decision boundary is the one that is best suited for effectively separating these feature points. The margin signifies the distance between the decision boundary and the nearest data points. Support vectors are those feature points closest to the optimal hyperplane at a minimum distance from it [24].
2.4.2. k-Nearest Neighbor (k-NN)
The k-NN technique is a straightforward yet highly effective classification method utilized across various domains. Operating as a non-parametric approach, it identifies the k nearest neighbors of a given data record, forming a local neighborhood around it. However, the efficacy of the k-NN method hinges on the appropriate selection of the value for k, which functions as a bias parameter. The model undergoes multiple iterations to ascertain the optimal k value and evaluates its performance. The optimal choice for k, resulting in the best classification performance, is then selected [25]. The k-NN model operates based on three primary principles: it computes the distances between neighbors, identifies the k nearest neighbors to address the trade-off between bias and variance, which helps solve the overfitting/underfitting issue, and finally, it casts votes to determine the labels. Similar to what is depicted in Figure 4, the fresh data point (located inside the circular area, colored yellow) can be classified as either class 01 (represented by the purple polygon) or class 02 (represented by the blue diamond). With a choice of k = 3, the new data point falls into class 02 due to the greater concentration of class 02 data points within the circle. Specifically, there are two blue diamonds (class 02) and one purple polygon (class 01) within the second circle [26].
2.4.3. Random Forest (RF)
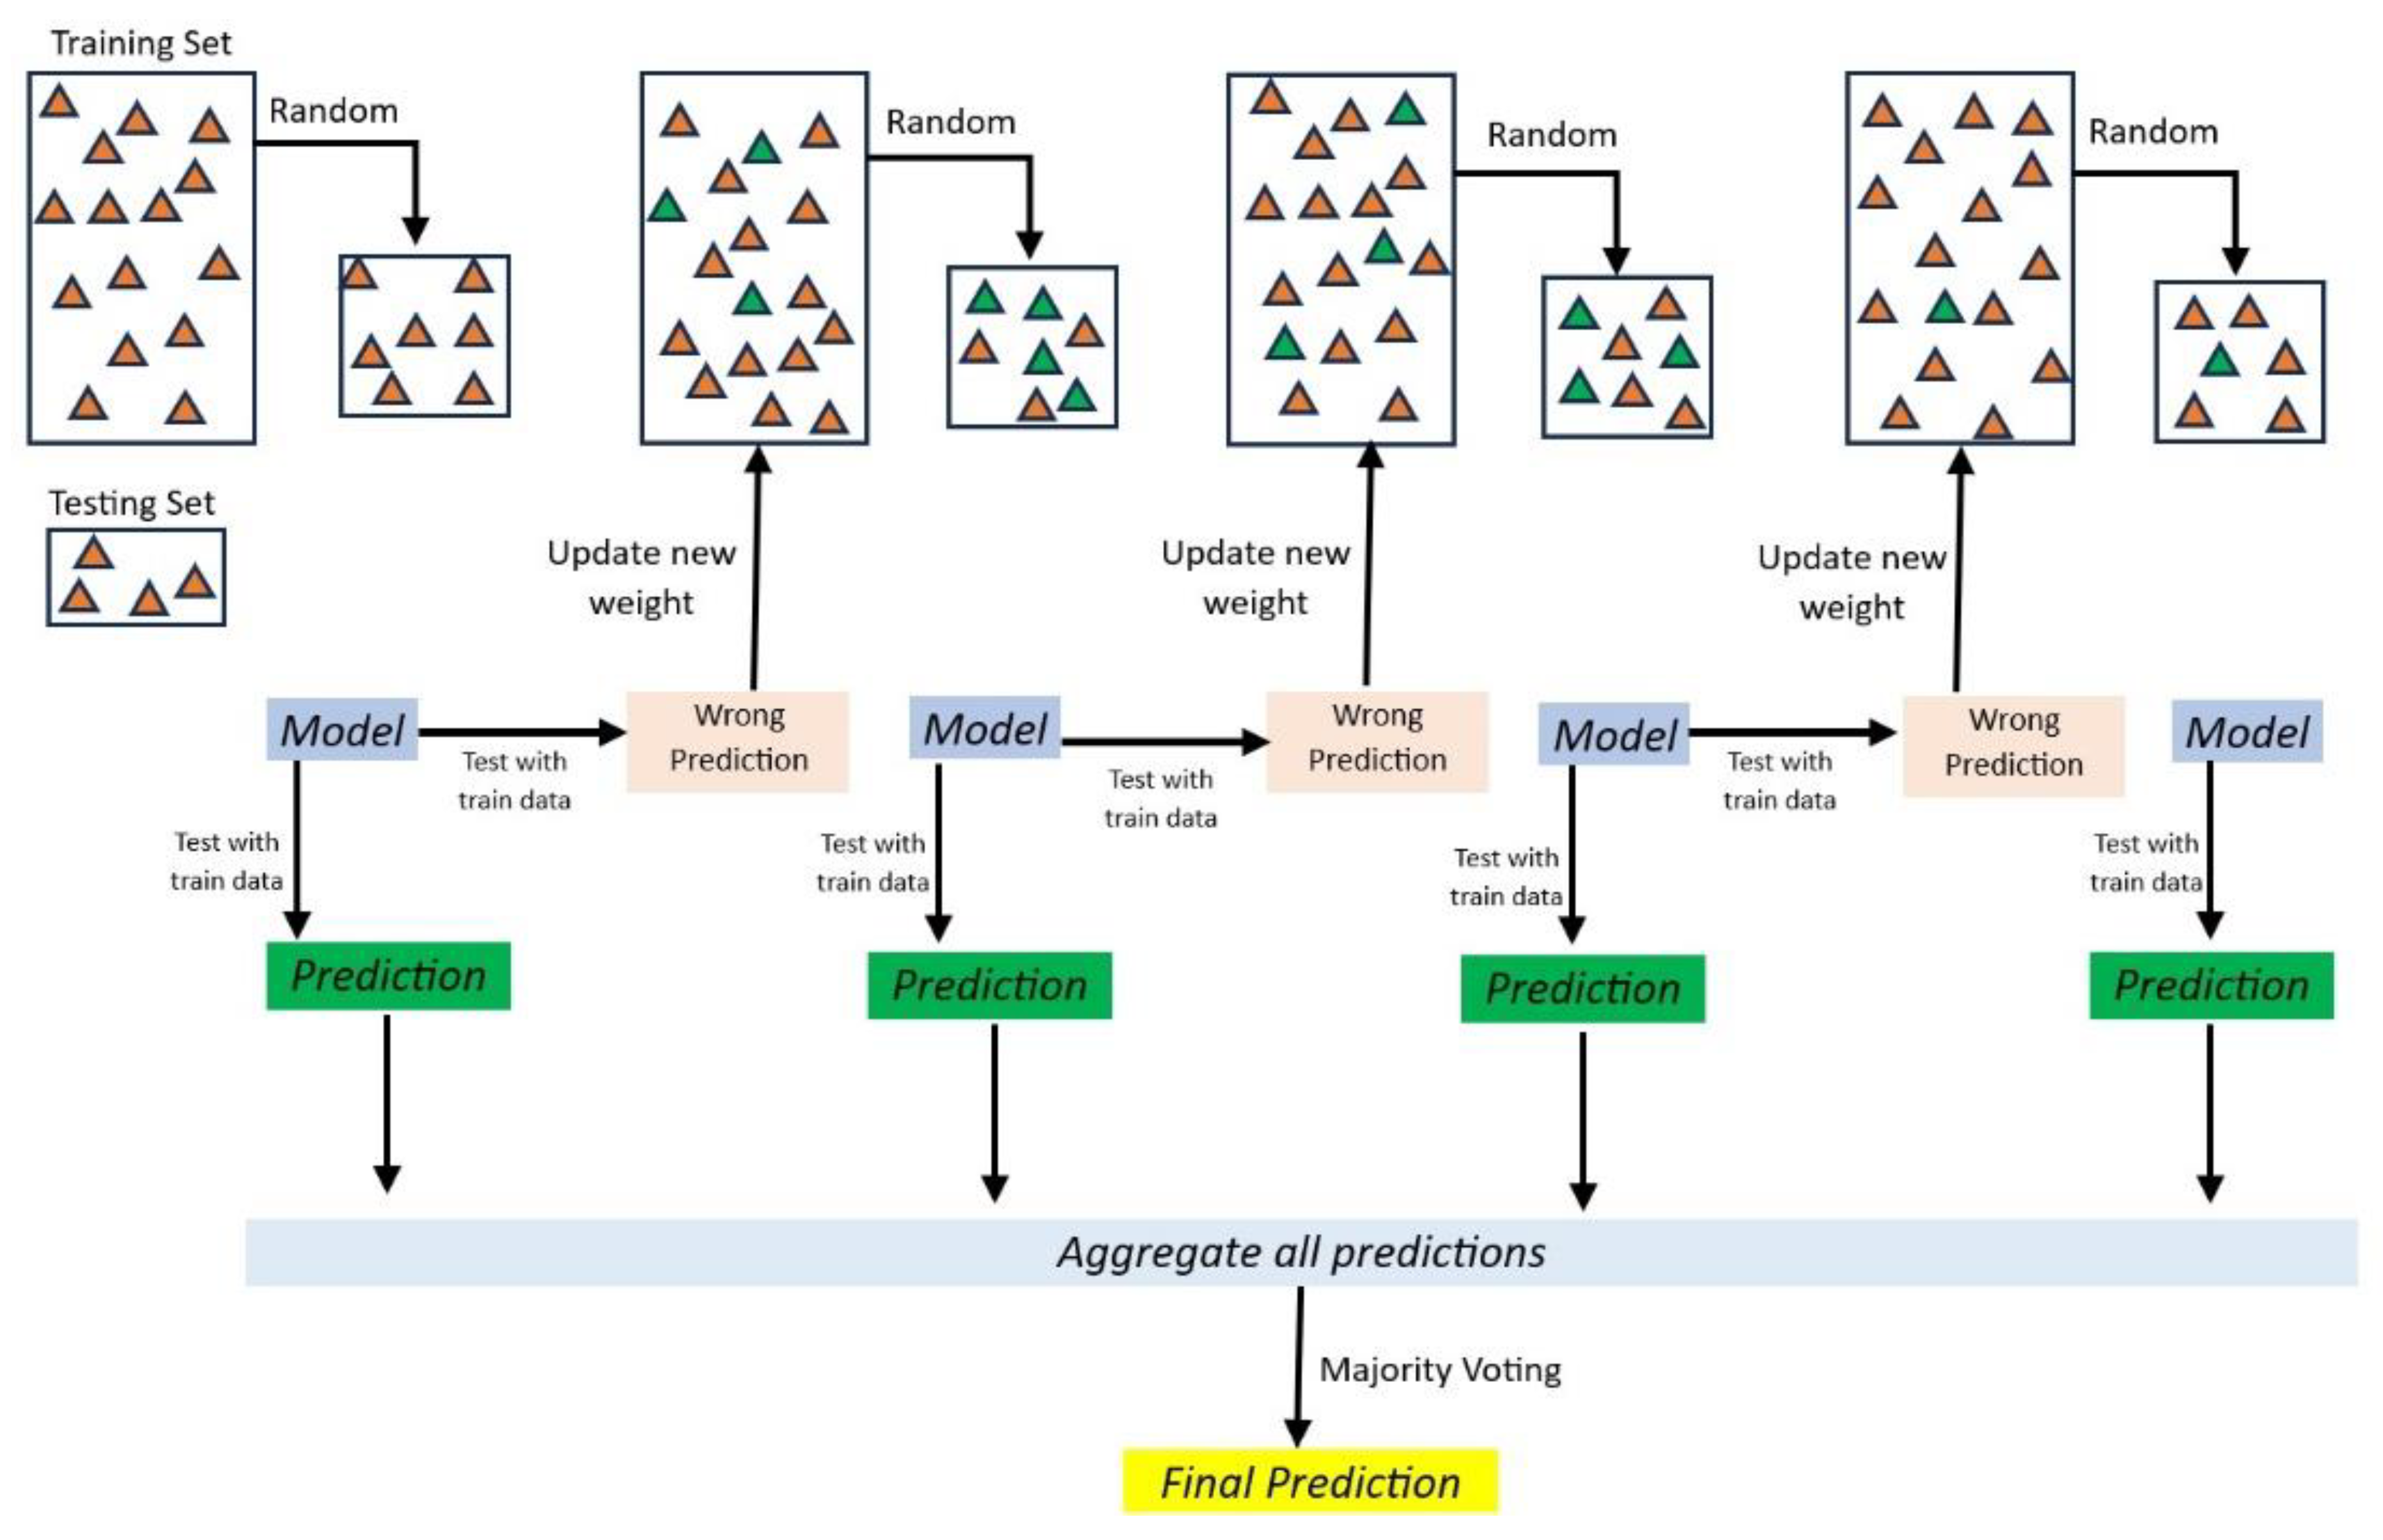
The RF model is an artificial intelligence method known for its efficient and optimal performance in pattern recognition [27] that was introduced by Breiman and Adele [28]. It represents a powerful ensemble learning technique in machine learning and data science. As illustrated in Figure 5, it operates by constructing “n” of decision trees, each trained on a random subset of the training data, and employing bootstrapped aggregating (bagging) for variance reduction [29].
2.4.4. Extreme Gradient Boost (XGBoost)
XGBoost is an improved iteration of gradient boosting based on the principles of the decision tree ensemble machine learning technique, specifically utilizing simple learners or stumps. While decision trees, in their basic form, are generally easy to understand and conceptualize, grasping an intuitive understanding of the next generation of tree-based models can be challenging [30]. The fundamental functionality of XGBoost centers on optimizing the objective function’s value, enabling it to offer efficient solutions to various data-centric scientific problems with heightened precision and reduced computational time [27]. Diverging from the conventional gradient boost model, XGBoost introduces a non-sequential approach to incorporating simple learners [30]. Additionally, the XGBoost model includes several strategies to effectively harness the CPU’s resources, enhancing speed and performance [31]. Figure 6 illustrates the processing of XGBoost for a given dataset.
2.5. Evaluation Metrics
The assessment of machine learning models and models relies heavily on evaluation metrics, which are essential for gauging their performance and efficacy. These metrics offer quantitative means of evaluating the models’ predictive capacity by making a comparison of their predictions to actual values. This section introduced five evaluation metrics: accuracy, precision, recall, F1 score, and MCC. Each of these metrics imparts distinctive insights into the model’s performance and contributes to different facets of evaluation.
Accuracy, a commonly adopted metric, measures how accurate a model’s predictions are. It is computed as the ratio of correctly predicted samples to the total number of samples within the dataset, as expressed below:
where TP (true positive) denotes the count of accurately predicted positive samples, while TN (true negative) signifies the count of correctly predicted negative samples. FP (false positive) corresponds to the count of falsely predicted positive samples, and FN (false negative) pertains to the count of inaccurately predicted negative samples.
Accuracy = (TP + TN)/(TP + FP + TN + FN)
Precision is a metric that emphasizes the correctness of the model’s positive predictions. It quantifies the ratio of accurately predicted positive samples among all positive predictions, as illustrated below:
Precision = TP/(TP + FP)
Recall, also called sensitivity or the true positive rate, assesses the model’s capability to detect positive samples correctly. It represents the ratio of accurately predicted positive samples to the entire population of actual positive samples, as depicted below:
Recall = TP/(TP + FN)
The F1 score is a metric that achieves a balance between precision and recall. It offers a harmonic mean of both precision and recall, making it especially valuable when handling datasets with imbalanced class distributions, as indicated below:
F1 = (2 × (precision × recall))/(precision + recall)
The F1 score falls within the range of 0 to 1, with a value of 1 signifying a flawless equilibrium between precision and recall, whereas a value of 0 signifies subpar performance.
Finally, the MCC is a performance metric widely used in machine learning for evaluating classification models. It provides a comprehensive measure of a model’s performance by considering not only true positive and true negative predictions but also false positives and false negatives, as shown in the following equation:
MCC = (TP × TN − FP × FN)/√((TP + FP)(TP + FN)(TN + FP)(TN + FN))
The MCC ranges from −1 to +1, where a value of +1 indicates perfect agreement between the model’s predictions and the actual labels, 0 signifies random agreement, and −1 denotes total disagreement.
3. Experimental Results and Discussion
This section evaluated the performance of four different machine learning models—SVM, k-NN, RF, and XGBoost—for classifying images into two classes: “class 1” for normal and “class 2” for jaundiced infants. The color intensity data for RGB and YCbCr from each infant’s selected ROI were collected and recorded in an Excel file named “train.csv” to assess the acquired data. The data evaluation process employed various metrics, namely accuracy, precision, recall, F1 score, and MCC, as shown in Table 1. These metrics evaluated the data’s performance across the four machine learning models. These methods used 80% of the dataset for training purposes and reserved the remaining 20% for testing.
The performance metrics of different classification techniques based on various evaluation criteria are illustrated in Table 1. The SVM demonstrated good performance with a relatively high accuracy of 96.22%. It had a balanced precision-recall trade-off, with precision at 95.74% and recall at 98.38%. The F1 score, which combines precision and recall, was 97.03%. The MCC of 0.9189 indicated a positive correlation between predicted and actual classifications, suggesting overall good performance. The k-NN performed even better in terms of accuracy (98.25%) and had higher precision (97.84%) and recall (99.41%) compared with SVM. The F1 score was also higher, at 98.61%, whereas the MCC of 0.9625 indicated a strong positive correlation, suggesting that k-NN performed very well. The RF model presented excellent performance, with high accuracy (98.99%), precision (99.12%), and recall (99.26%). The F1 score of 99.19% indicated a good balance between precision and recall. The MCC of 0.9759 reflected a strong positive correlation, suggesting that RF was a highly effective classification technique. XGBoost demonstrated outstanding performance, with the highest accuracy (99.63%), precision (99.57%), and recall (99.85%) among the techniques. The F1 score of 99.71% indicated an excellent balance between precision and recall, whereas the MCC of 0.9921 suggested an almost perfect positive correlation, indicating that XGBoost was highly effective and reliable for classification tasks. All of the techniques performed well, but XGBoost was the top performer in accuracy, precision, recall, F1 score, and MCC. It is well suited for tasks where high classification performance is critical. The construction of a confusion matrix for each model is illustrated in Figure 7.
Following these results, the designed GUI was created based on the XGBoost model, since it performed the best among the techniques used in this study. Subsequently, live tests were conducted on 10 NICU patients, and the results showed a 100% match with the TSB tests recorded in the case sheet of each patient, as illustrated in Table 2. Examples of real-time monitoring of two infants from the designed GUI operation for normal and jaundiced infants are shown in Figure 8a,b, while the GUI was linked to the Arduino Uno microcontroller to drive UV phototherapy lighting.
Table 2 shows that the ultimate diagnosis generated by the proposed system aligns with patients’ diagnoses, determined by their TSB levels and age, per the values outlined by the American Academy of Pediatrics (AAP) illustrated in Figure 9.
Implementing artificial intelligence and machine learning techniques (AI/ML) in medical devices has been the main aim of researchers to develop systems that can help healthcare professionals provide better and quicker results. On 19 October 2023, the FDA revealed a list of 691 approved AI/ML-enabled medical devices. The approval rate has acquired significance since 2016, thus emphasizing the importance of using AI/ML techniques in healthcare. However, most of these approved devices focus on dealing with adults. Only 3% of the provided list deals with pediatrics [33]. This study aimed to implement multiple AI/ML techniques, evaluate each method, and use the one with the best performance to acquire jaundice diagnosis in real time with the highest accuracy possible. The proposed system can help healthcare professionals minimize the use of the current invasive methods, which can pose complications and are time consuming. It can be used alongside other monitoring devices, such as temperature and SPO2, and does not affect the clinical workflow; thus, it aids rather than complicates clinical decision-making. Moreover, the devised system remains unaffected by variations, including hardware changes, temperature fluctuations, varying humidity, changes in lighting conditions (daylight/nighttime), and the use of different webcam models, since the system is based on imaging techniques and the model was based on images of infants captured under different lighting conditions. If the camera module was placed inside the infant incubator, the humidity inside the incubator could potentially lead to blurry images, but that was unlikely to occur, since the system was tested from outside the translucent cover of the incubator.
Regardless of the good performance, this study encountered complexities in acquiring precise and dependable neonatal images within the NICU setting. These complexities stemmed from multiple factors, encompassing inconsistent lighting conditions, disparities in camera configurations, the challenge of capturing images of agitated or uncooperative infants, and the limited diversity of skin tones within the dataset (attributed to the exclusive collection from a specific geographical region). The culmination of these factors introduced fluctuations in image quality, potentially compromising the efficacy of classification techniques and thereby diminishing the precision and reliability of the study’s outcomes.
4. Conclusions
The significance of early detection of neonatal jaundice cannot be neglected, given its potential for severe complications in infants. Avoiding invasive methods becomes crucial in preventing pain, stress, and infections while determining bilirubin levels. In this context, computer-assisted technologies have emerged as a promising alternative to traditional approaches in the medical field. The proposed system successfully developed an application for jaundice detection using a USB-connected webcam to achieve direct real-time jaundice detection of neonates in different positions and lighting conditions rather than having images from an external source, which is time consuming and requires more effort, without the need for invasive tests. The proposed system extracted skin color intensities from 767 infant photos and was fed different machine learning models for testing and validation. The method demonstrated that XGBoost provided the highest achievable accuracy, at 99.63% classification, among the tested models. RF and k-NN had close accuracy scores, of 98.99% and 98.25%. SVM had the lowest accuracy score, of 96.22%. By adopting the XGBoost algorithm, future work can explore its implementation on various platforms, such as telemedicine and healthcare applications, aiming to reduce hospital visits. Thus, the proposed imaging system holds the potential to revolutionize neonatal jaundice diagnosis, providing a non-invasive and efficient solution for early detection and improved infant care.
Author Contributions
Conceptualization, A.A.-N.; data curation, A.Y.A.; formal analysis, A.Y.A.; funding acquisition, J.C.; investigation, A.Y.A. and A.A.-N.; methodology, A.Y.A., S.L.M., A.A.-N. and J.C.; project administration, S.L.M., A.A.-N. and J.C.; resources, A.Y.A.; software, A.Y.A. and A.A.-N.; supervision, S.L.M. and A.A.-N.; validation, A.Y.A.; visualization, S.L.M.; writing—original draft, A.Y.A.; writing—review and editing, S.L.M., A.A.-N. and J.C. All authors have read and agreed to the published version of the manuscript.
Funding
This research received no external funding.
Institutional Review Board Statement
The study was conducted in accordance with the Declaration of Helsinki and approved by the research committee of the Al Rusafa Directorate of Health, Iraqi Ministry of Health and Environment, Baghdad, Iraq (Protocol number: 2022019) for studies involving humans.
Informed Consent Statement
Informed consent was obtained from all subjects involved in the study.
Data Availability Statement
The data presented in this study are available on request from the corresponding author.
Acknowledgments
The authors wish to express their thanks and appreciation to Al Elwiya Maternity Teaching Hospital for supplying the necessary data for this study.
Conflicts of Interest
The authors declare no conflicts of interest.
References
- Dzulkifli, F.A.; Mashor, M.Y.; Khalid, K. Methods for determining bilirubin level in neonatal jaundice screening and monitoring: A literature review. J. Eng. Res. Educ. 2018, 10, 1–10. [Google Scholar]
- Brits, H.; Adendorff, J.; Huisamen, D.; Beukes, D.; Botha, K.; Herbst, H.; Joubert, G. The prevalence of neonatal jaundice and risk factors in healthy term neonates at National District Hospital in Bloemfontein. Afr. J. Prim. Health Care Fam. Med. 2018, 10, 1–6. [Google Scholar] [CrossRef]
- Bhutani, V.; Zipursky, A.; Blencowe, H.; Khanna, R.; Sgro, M.; Ebbesen, F.; Bell, J.; Mori, R.; Slusher, T.; Fahmy, N.; et al. Neonatal hyperbilirubinemia and rhesus disease of the newborn: Incidence and impairment estimates for 2010 at regional and global levels. Pediatr. Res. 2013, 74, 86–100. [Google Scholar] [CrossRef]
- Hyperbilirubinemia, S.o. Management of hyperbilirubinemia in the newborn infant 35 or more weeks of gestation. Pediatrics 2004, 114, 297–316. [Google Scholar] [CrossRef]
- Mansouri, M.; Mahmoodnejad, A.; Taghizadeh Sarvestani, R.; Gharibi, F. A comparison between transcutaneous bilirubin (TcB) and total serum bilirubin (TSB) measurements in term neonates. Int. J. Pediatr. 2015, 3, 633–641. [Google Scholar]
- Alsaedi, S.A. Transcutaneous bilirubin measurements can be used to measure bilirubin levels during phototherapy. Int. J. Pediatr. 2018, 2018, 4856390. [Google Scholar] [CrossRef]
- Aydın, M.; Hardalaç, F.; Ural, B.; Karap, S. Neonatal jaundice detection system. J. Med. Syst. 2016, 40, 1–11. [Google Scholar] [CrossRef]
- Munkholm, S.B.; Krøgholt, T.; Ebbesen, F.; Szecsi, P.B.; Kristensen, S.R. The smartphone camera as a potential method for transcutaneous bilirubin measurement. PLoS ONE 2018, 13, e0197938. [Google Scholar] [CrossRef]
- Kawano, S.; Zin, T.T.; Kodama, Y. A Study on Non-contact and Non-invasive Neonatal Jaundice Detection and Bilirubin Value Prediction. In Proceedings of the 2018 IEEE 7th Global Conference on Consumer Electronics (GCCE), Nara, Japan, 9–12 October 2018; pp. 401–402. [Google Scholar]
- Juliastuti, E.; Nadhira, V.; Satwika, Y.W.; Aziz, N.A.; Zahra, N. Risk zone estimation of newborn jaundice based on skin color image analysis. In Proceedings of the 2019 6th International Conference on Instrumentation, Control, and Automation (ICA), Bandung, Indonesia, 31 July–2 August 2019; pp. 176–181. [Google Scholar]
- Hashim, W.; Al-Naji, A.; Al-Rayahi, I.A.; Oudah, M. Computer vision for jaundice detection in neonates using graphic user interface. In Proceedings of the IOP Conference Series: Materials Science and Engineering, Sanya, China, 12–14 November 2021; p. 012076. [Google Scholar]
- Hashim, W.; Al-Naji, A.; Al-Rayahi, I.A.; Alkhaled, M.; Chahl, J. Neonatal jaundice detection using a computer vision system. Designs 2021, 5, 63. [Google Scholar] [CrossRef]
- Anggraeni, M.D.; Fatoni, A.; Rahmawati, E.; Nartiningsih, I. Estimation of Neonatal Jaundice from the Chest Images Captured with a Smartphone. In Proceedings of the Soedirman International Conference on Mathematics and Applied Sciences (SICOMAS 2021), Purwokerto, Indonesia, 20–21 October 2022; pp. 23–26. [Google Scholar]
- Anggraeni, M.D.; Fatoni, A.; Rahmawati, E. Non-invasive neonatal jaundice determination using smartphone camera. In Proceedings of the AIP Conference Proceedings, Purwokerto, Indonesia, 9 September 2021. [Google Scholar]
- Sreedha, B.; Nair, P.R.; Maity, R. Non-invasive early diagnosis of jaundice with computer vision. Procedia Comput. Sci. 2023, 218, 1321–1334. [Google Scholar] [CrossRef]
- Prajapati, J.; Das, D.; Venkanna, U.; Mahapatra, R.; Wasnik, P.N. jScan: Smartphone-assisted Bilirubin Quantification and Jaundice Screening. IEEE Sens. J. 2023, 23, 26654–26661. [Google Scholar] [CrossRef]
- Abdulrazzak, A.Y.; Mohammed, S.L.; Al-Naji, A.; Chahl, J. Computer-Aid System for Automated Jaundice Detection. J. Tech. 2023, 5, 8–15. [Google Scholar] [CrossRef]
- Abdulrazzak, A.Y.; Mohammed, S.L.; Al-Naji, A. NJN: A Dataset for the Normal and Jaundiced Newborns. BioMedInformatics 2023, 3, 543–552. [Google Scholar] [CrossRef]
- Kolkur, S.; Kalbande, D.; Shimpi, P.; Bapat, C.; Jatakia, J. Human skin detection using RGB, HSV and YCbCr color models. arXiv 2017, arXiv:1708.02694. [Google Scholar]
- Bangare, S.L.; Dubal, A.; Bangare, P.S.; Patil, S. Reviewing Otsu’s method for image thresholding. Int. J. Appl. Eng. Res. 2015, 10, 21777–21783. [Google Scholar] [CrossRef]
- Adib, M.A.H.M.; Rahim, M.H.A.; Sahat, I.M.; Hasni, N.H.M. Pediatrics Technology Applications: Enhance the Bilirubin Jaundice (BiliDice) Device for Neonates Using Color Sensor. In Proceedings of the Recent Trends in Mechatronics Towards Industry 4.0: Selected Articles from iM3F 2020, Pekan, Malaysia, 6 August 2020; pp. 839–847. [Google Scholar]
- Chowdhary, A.K.; Dutta, S.; Ghosh, R. Neonatal Jaundice Detection using Colour Detection Method. Int. Adv. Res. J. Sci. Eng. Technol. 2017, 46, 197–203. [Google Scholar]
- Cortes, C.; Vapnik, V. Support-vector networks. Mach. Learn. 1995, 20, 273–297. [Google Scholar] [CrossRef]
- Harirchian, E.; Kumari, V.; Jadhav, K.; Raj Das, R.; Rasulzade, S.; Lahmer, T. A machine learning framework for assessing seismic hazard safety of reinforced concrete buildings. Appl. Sci. 2020, 10, 7153. [Google Scholar] [CrossRef]
- Guo, G.; Wang, H.; Bell, D.; Bi, Y.; Greer, K. KNN model-based approach in classification. In Proceedings of the On The Move to Meaningful Internet Systems 2003: CoopIS, DOA, and ODBASE: OTM Confederated International Conferences, CoopIS, DOA, and ODBASE 2003, Catania, Sicily, Italy, 3–7 November 2003; pp. 986–996. [Google Scholar]
- Hasan, M.J.; Kim, J.-M. A hybrid feature pool-based emotional stress state detection algorithm using EEG signals. Brain Sci. 2019, 9, 376. [Google Scholar] [CrossRef] [PubMed]
- Nguyen, H.; Bui, X.-N.; Bui, H.-B.; Cuong, D.T. Developing an XGBoost model to predict blast-induced peak particle velocity in an open-pit mine: A case study. Acta Geophys. 2019, 67, 477–490. [Google Scholar] [CrossRef]
- Breiman, L. Random forests. Mach. Learn. 2001, 45, 5–32. [Google Scholar] [CrossRef]
- Breiman, L. Bagging predictors. Mach. Learn. 1996, 24, 123–140. [Google Scholar] [CrossRef]
- Kabiraj, S.; Raihan, M.; Alvi, N.; Afrin, M.; Akter, L.; Sohagi, S.A.; Podder, E. Breast cancer risk prediction using XGBoost and random forest algorithm. In Proceedings of the 2020 11th International Conference on Computing, Communication and Networking Technologies (ICCCNT), Kharagpur, India, 1–3 July 2020; pp. 1–4. [Google Scholar]
- Ramraj, S.; Uzir, N.; Sunil, R.; Banerjee, S. Experimenting XGBoost algorithm for prediction and classification of different datasets. Int. J. Control. Theory Appl. 2016, 9, 651–662. [Google Scholar]
- Kemper, A.R.; Newman, T.B.; Slaughter, J.L.; Maisels, M.J.; Watchko, J.F.; Downs, S.M.; Grout, R.W.; Bundy, D.G.; Stark, A.R.; Bogen, D.L. Clinical practice guideline revision: Management of hyperbilirubinemia in the newborn infant 35 or more weeks of gestation. Pediatrics 2022, 150, e2022058859. [Google Scholar] [CrossRef]
- Joshi, G.; Jain, A.; Araveeti, S.R.; Adhikari, S.; Garg, H.; Bhandari, M. FDA approved Artificial Intelligence and Machine Learning (AI/ML)-enabled medical devices: An updated landscape. Electronics 2024, 13, 498. [Google Scholar] [CrossRef]
Figure 1.
Flowchart of the proposed imaging system.

Figure 2.
Feature importance bar chart for the RGB and YCbCr channels.

Figure 3.
The Mechanism of SVM.

Figure 4.
k-NN model illustration.

Figure 5.
Illustration of the random forest model.

Figure 6.
Illustration of the XGBoost classifier with a gradient tree.

Figure 7.
The confusion matrix using the (a) k-NN, (b) SVM, (c) RF, and (d) XGBoost techniques.

Figure 8.
Two cases results using the MATLAB App Designer: (a) normal; and (b) jaundiced.

Figure 9.
The relation between TSB levels and the age of the infant [32].
Figure 9.
The relation between TSB levels and the age of the infant [32].


Table 1.
The results were obtained from the machine learning models used in the proposed study.
| Technique | Accuracy | Precision | Recall | F1 Score | MCC |
|---|---|---|---|---|---|
| SVM | 96.22% | 95.74% | 98.38% | 97.03% | 0.9189 |
| k-NN | 98.25% | 97.84% | 99.41% | 98.61% | 0.9625 |
| RF | 98.99% | 99.12% | 99.26% | 99.19% | 0.9759 |
| XGBoost | 99.63% | 99.57% | 99.85% | 99.71% | 0.9921 |
Table 2.
The conducted tests and each infant’s age, TSB level, and diagnosis.
| Patient | Age in Days | TSB mg/dL | Diagnosis |
|---|---|---|---|
| 1 | 2 | 13.3 | Jaundiced |
| 2 | 6 | 13.7 | Normal |
| 3 | 5 | 19.2 | Jaundiced |
| 4 | 1 | 4.9 | Normal |
| 5 | 2 | 5.4 | Normal |
| 6 | 3 | 14.8 | Jaundiced |
| 7 | 6 | 13.2 | Normal |
| 8 | 6 | 9.4 | Normal |
| 9 | 2 | 9.9 | Jaundiced |
| 10 | 5 | 13.4 | Normal |
Disclaimer/Publisher’s Note: The statements, opinions and data contained in all publications are solely those of the individual author(s) and contributor(s) and not of MDPI and/or the editor(s). MDPI and/or the editor(s) disclaim responsibility for any injury to people or property resulting from any ideas, methods, instructions or products referred to in the content. |
© 2024 by the authors. Licensee MDPI, Basel, Switzerland. This article is an open access article distributed under the terms and conditions of the Creative Commons Attribution (CC BY) license (https://creativecommons.org/licenses/by/4.0/).
Share and Cite
MDPI and ACS Style
Abdulrazzak, A.Y.; Mohammed, S.L.; Al-Naji, A.; Chahl, J. Real-Time Jaundice Detection in Neonates Based on Machine Learning Models. BioMedInformatics 2024, 4, 623-637. https://0-doi-org.brum.beds.ac.uk/10.3390/biomedinformatics4010034
AMA Style
Abdulrazzak AY, Mohammed SL, Al-Naji A, Chahl J. Real-Time Jaundice Detection in Neonates Based on Machine Learning Models. BioMedInformatics. 2024; 4(1):623-637. https://0-doi-org.brum.beds.ac.uk/10.3390/biomedinformatics4010034
Chicago/Turabian StyleAbdulrazzak, Ahmad Yaseen, Saleem Latif Mohammed, Ali Al-Naji, and Javaan Chahl. 2024. "Real-Time Jaundice Detection in Neonates Based on Machine Learning Models" BioMedInformatics 4, no. 1: 623-637. https://0-doi-org.brum.beds.ac.uk/10.3390/biomedinformatics4010034