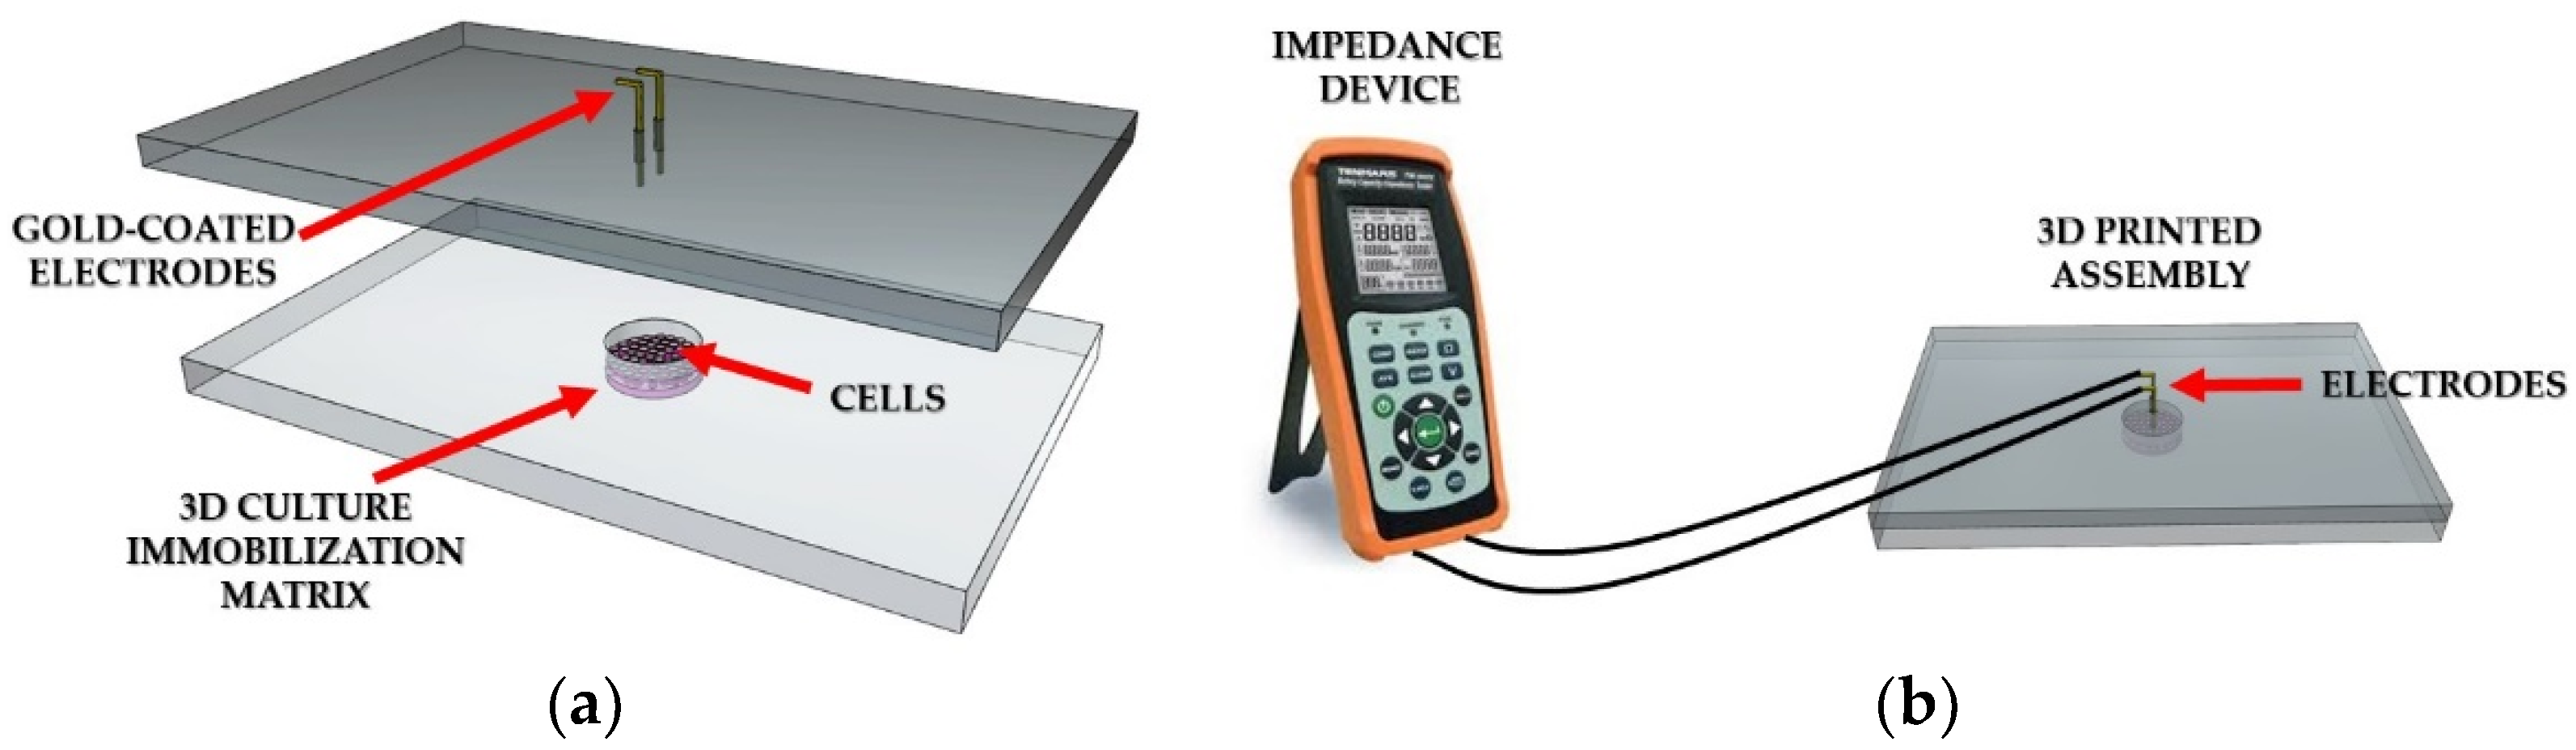
Figure 1.
Experimental setup. (a) Representation of the cell chamber filled with 3D cell immobilization matrix; (b) Connection of the LCR meter to the 3D printed well.
Figure 1.
Experimental setup. (a) Representation of the cell chamber filled with 3D cell immobilization matrix; (b) Connection of the LCR meter to the 3D printed well.
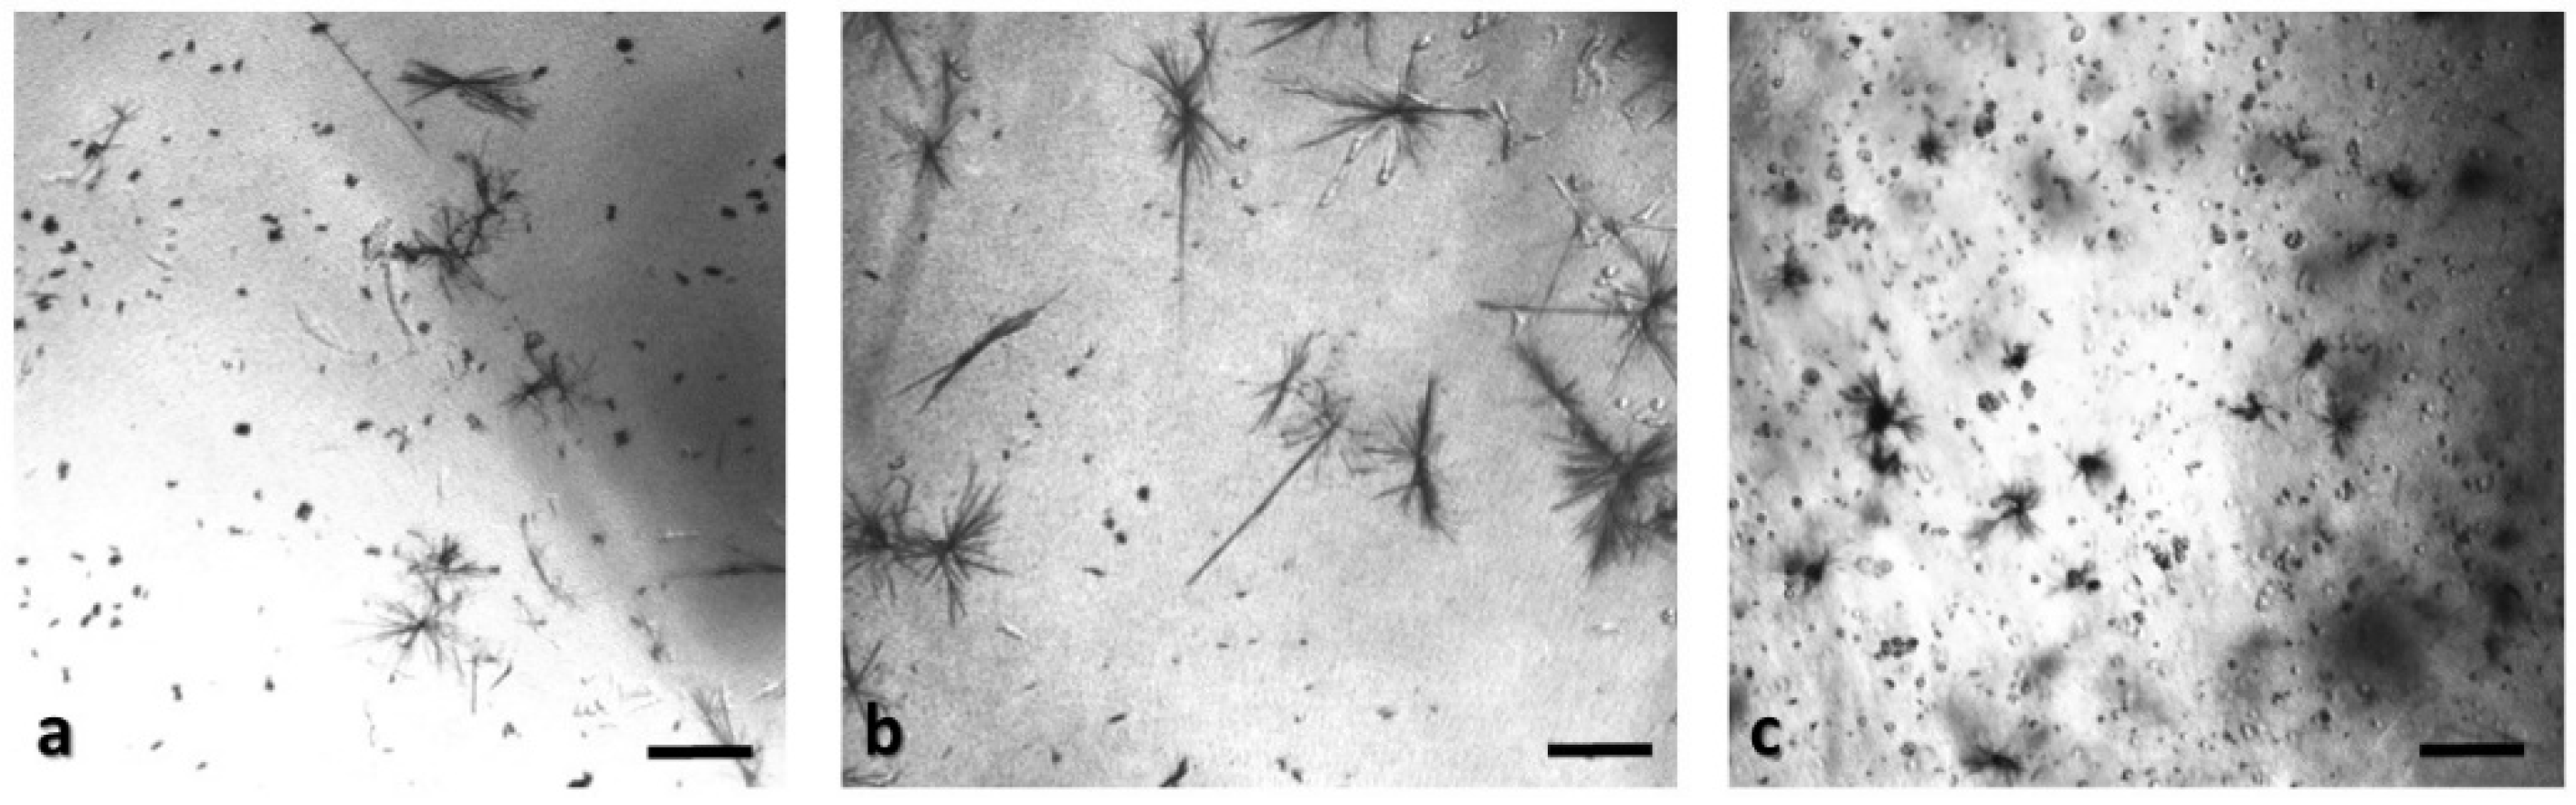
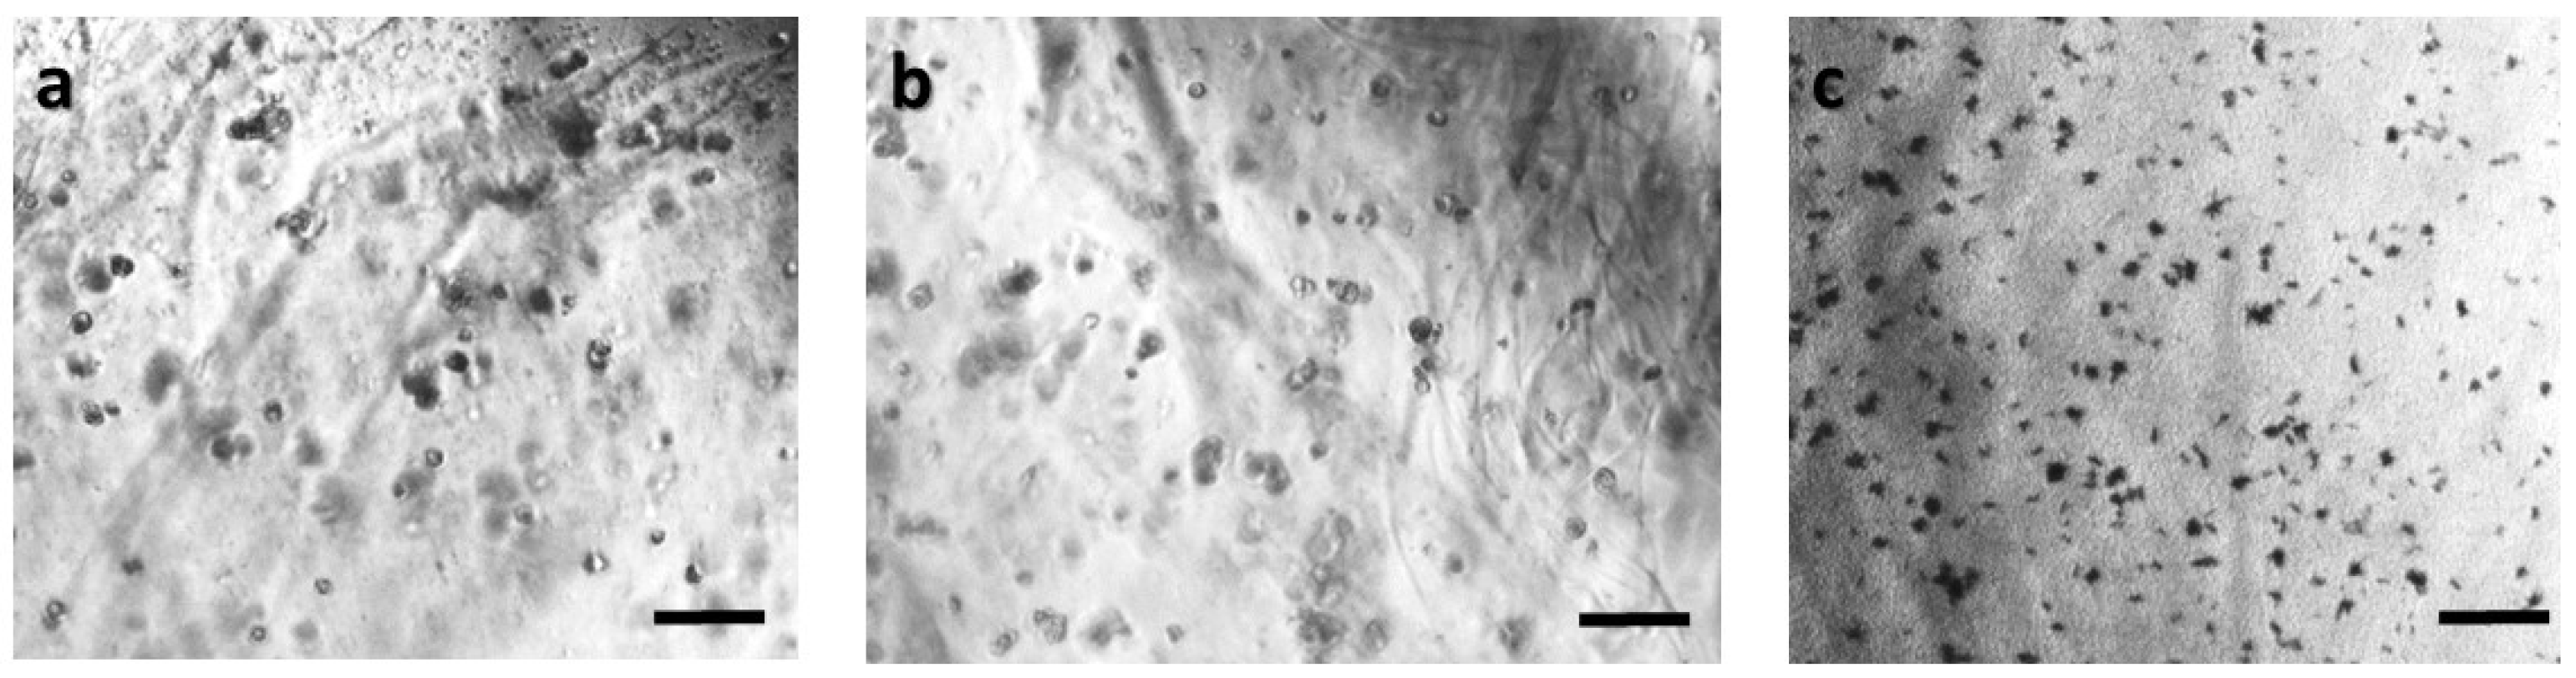
Figure 2.
Panoramic view of SK-N-SH immobilized cells in 3D matrix after treatment with MTT for 24 h, showing the viability in three different population densities: (a) 50,000 cells; (b) 100,000 cells; and (c) 200,000 cells. Scale bars = 50 μm.
Figure 2.
Panoramic view of SK-N-SH immobilized cells in 3D matrix after treatment with MTT for 24 h, showing the viability in three different population densities: (a) 50,000 cells; (b) 100,000 cells; and (c) 200,000 cells. Scale bars = 50 μm.
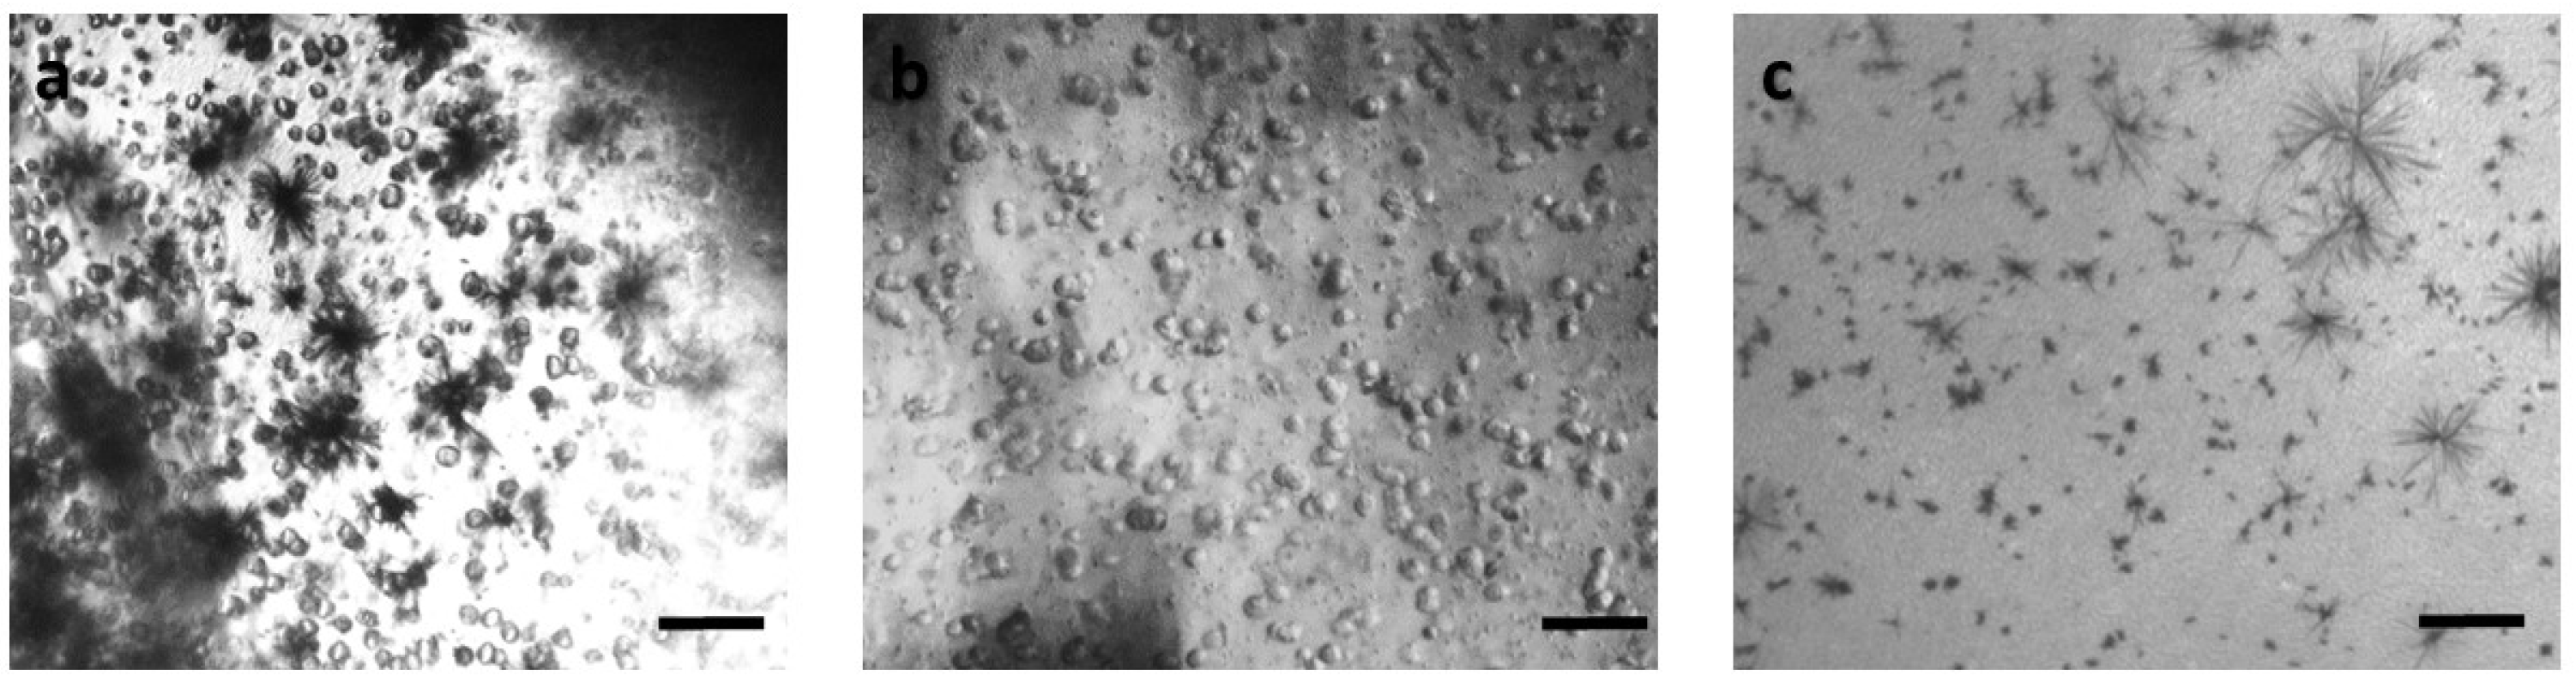
Figure 3.
Panoramic view of HEK293 immobilized cells in 3D matrix after treatment with MTT for 24 h showing the viability in three different population densities: (a) 50,000 cells; (b) 100,000 cells; and (c) 200,000 cells. Scale bars = 50 μm.
Figure 3.
Panoramic view of HEK293 immobilized cells in 3D matrix after treatment with MTT for 24 h showing the viability in three different population densities: (a) 50,000 cells; (b) 100,000 cells; and (c) 200,000 cells. Scale bars = 50 μm.
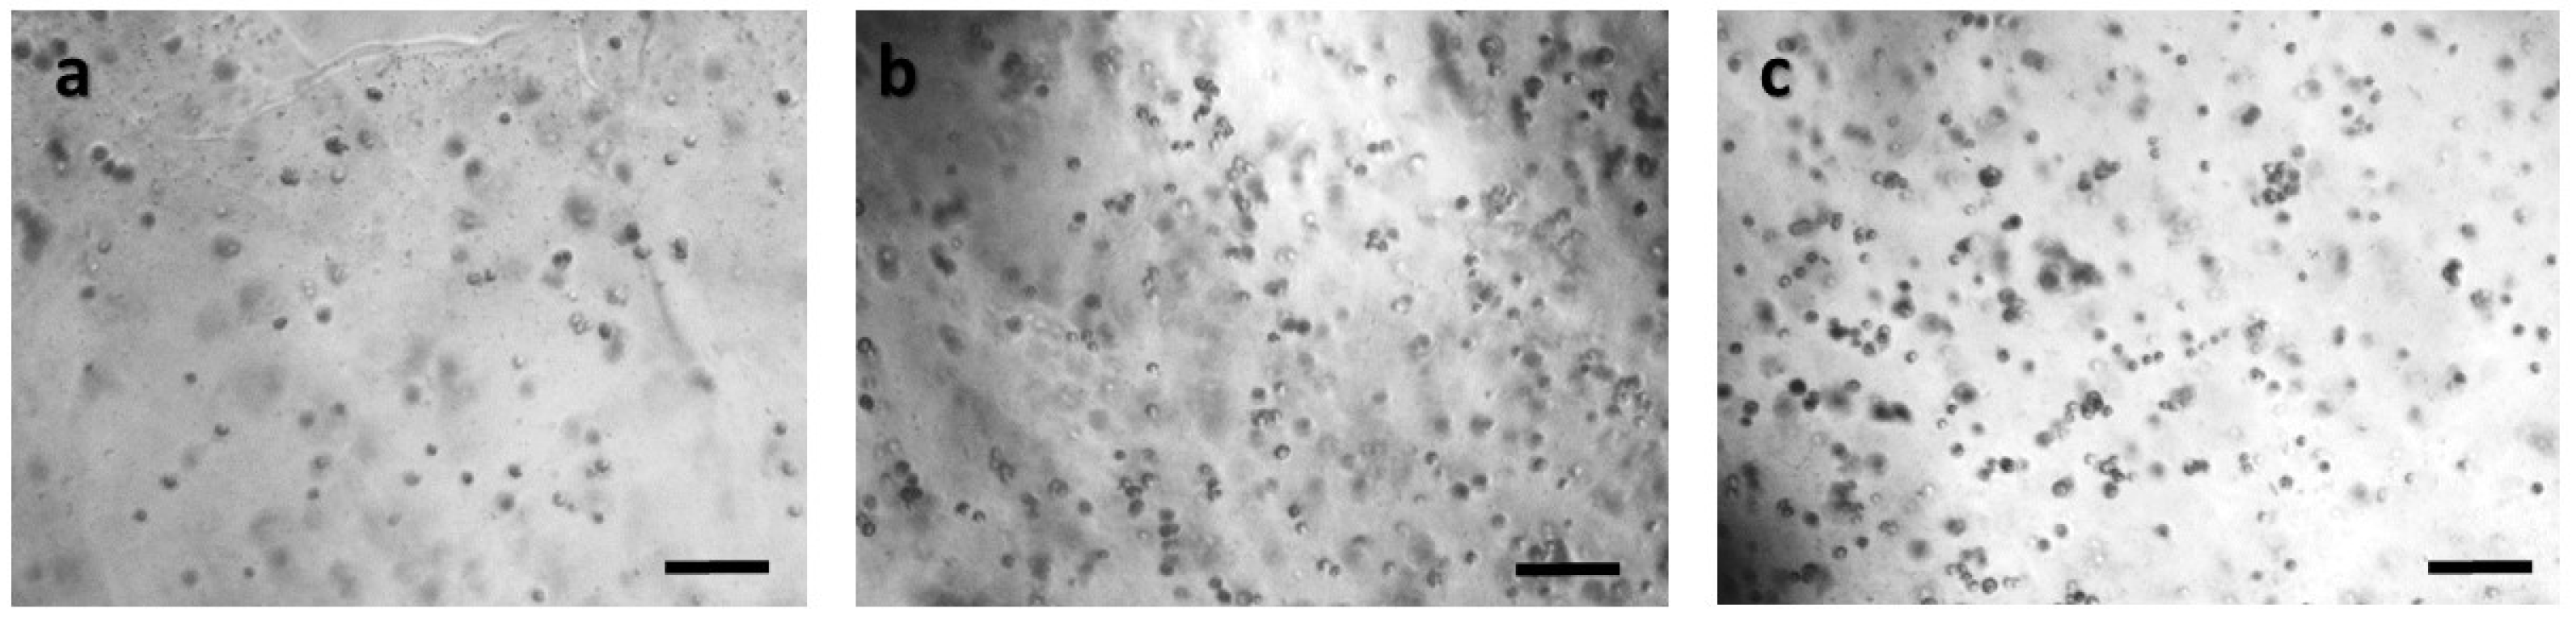
Figure 4.
Panoramic view of HeLa immobilized cells in 3D matrix after treatment with MTT for 24 h showing the viability in three different population densities: (a) 50,000 cells; (b) 100,000 cells; and (c) 200,000 cells/100 μL. Scale bars = 50 μm.
Figure 4.
Panoramic view of HeLa immobilized cells in 3D matrix after treatment with MTT for 24 h showing the viability in three different population densities: (a) 50,000 cells; (b) 100,000 cells; and (c) 200,000 cells/100 μL. Scale bars = 50 μm.
Figure 5.
Panoramic view of MCF-7 immobilized cells in 3D matrix after treatment with MTT for 24 h showing the viability in three different population densities: (a) 50,000 cells; (b) 100,000 cells; and (c) 200,000 cells/100 μL. Scale bars = 50 μm.
Figure 5.
Panoramic view of MCF-7 immobilized cells in 3D matrix after treatment with MTT for 24 h showing the viability in three different population densities: (a) 50,000 cells; (b) 100,000 cells; and (c) 200,000 cells/100 μL. Scale bars = 50 μm.
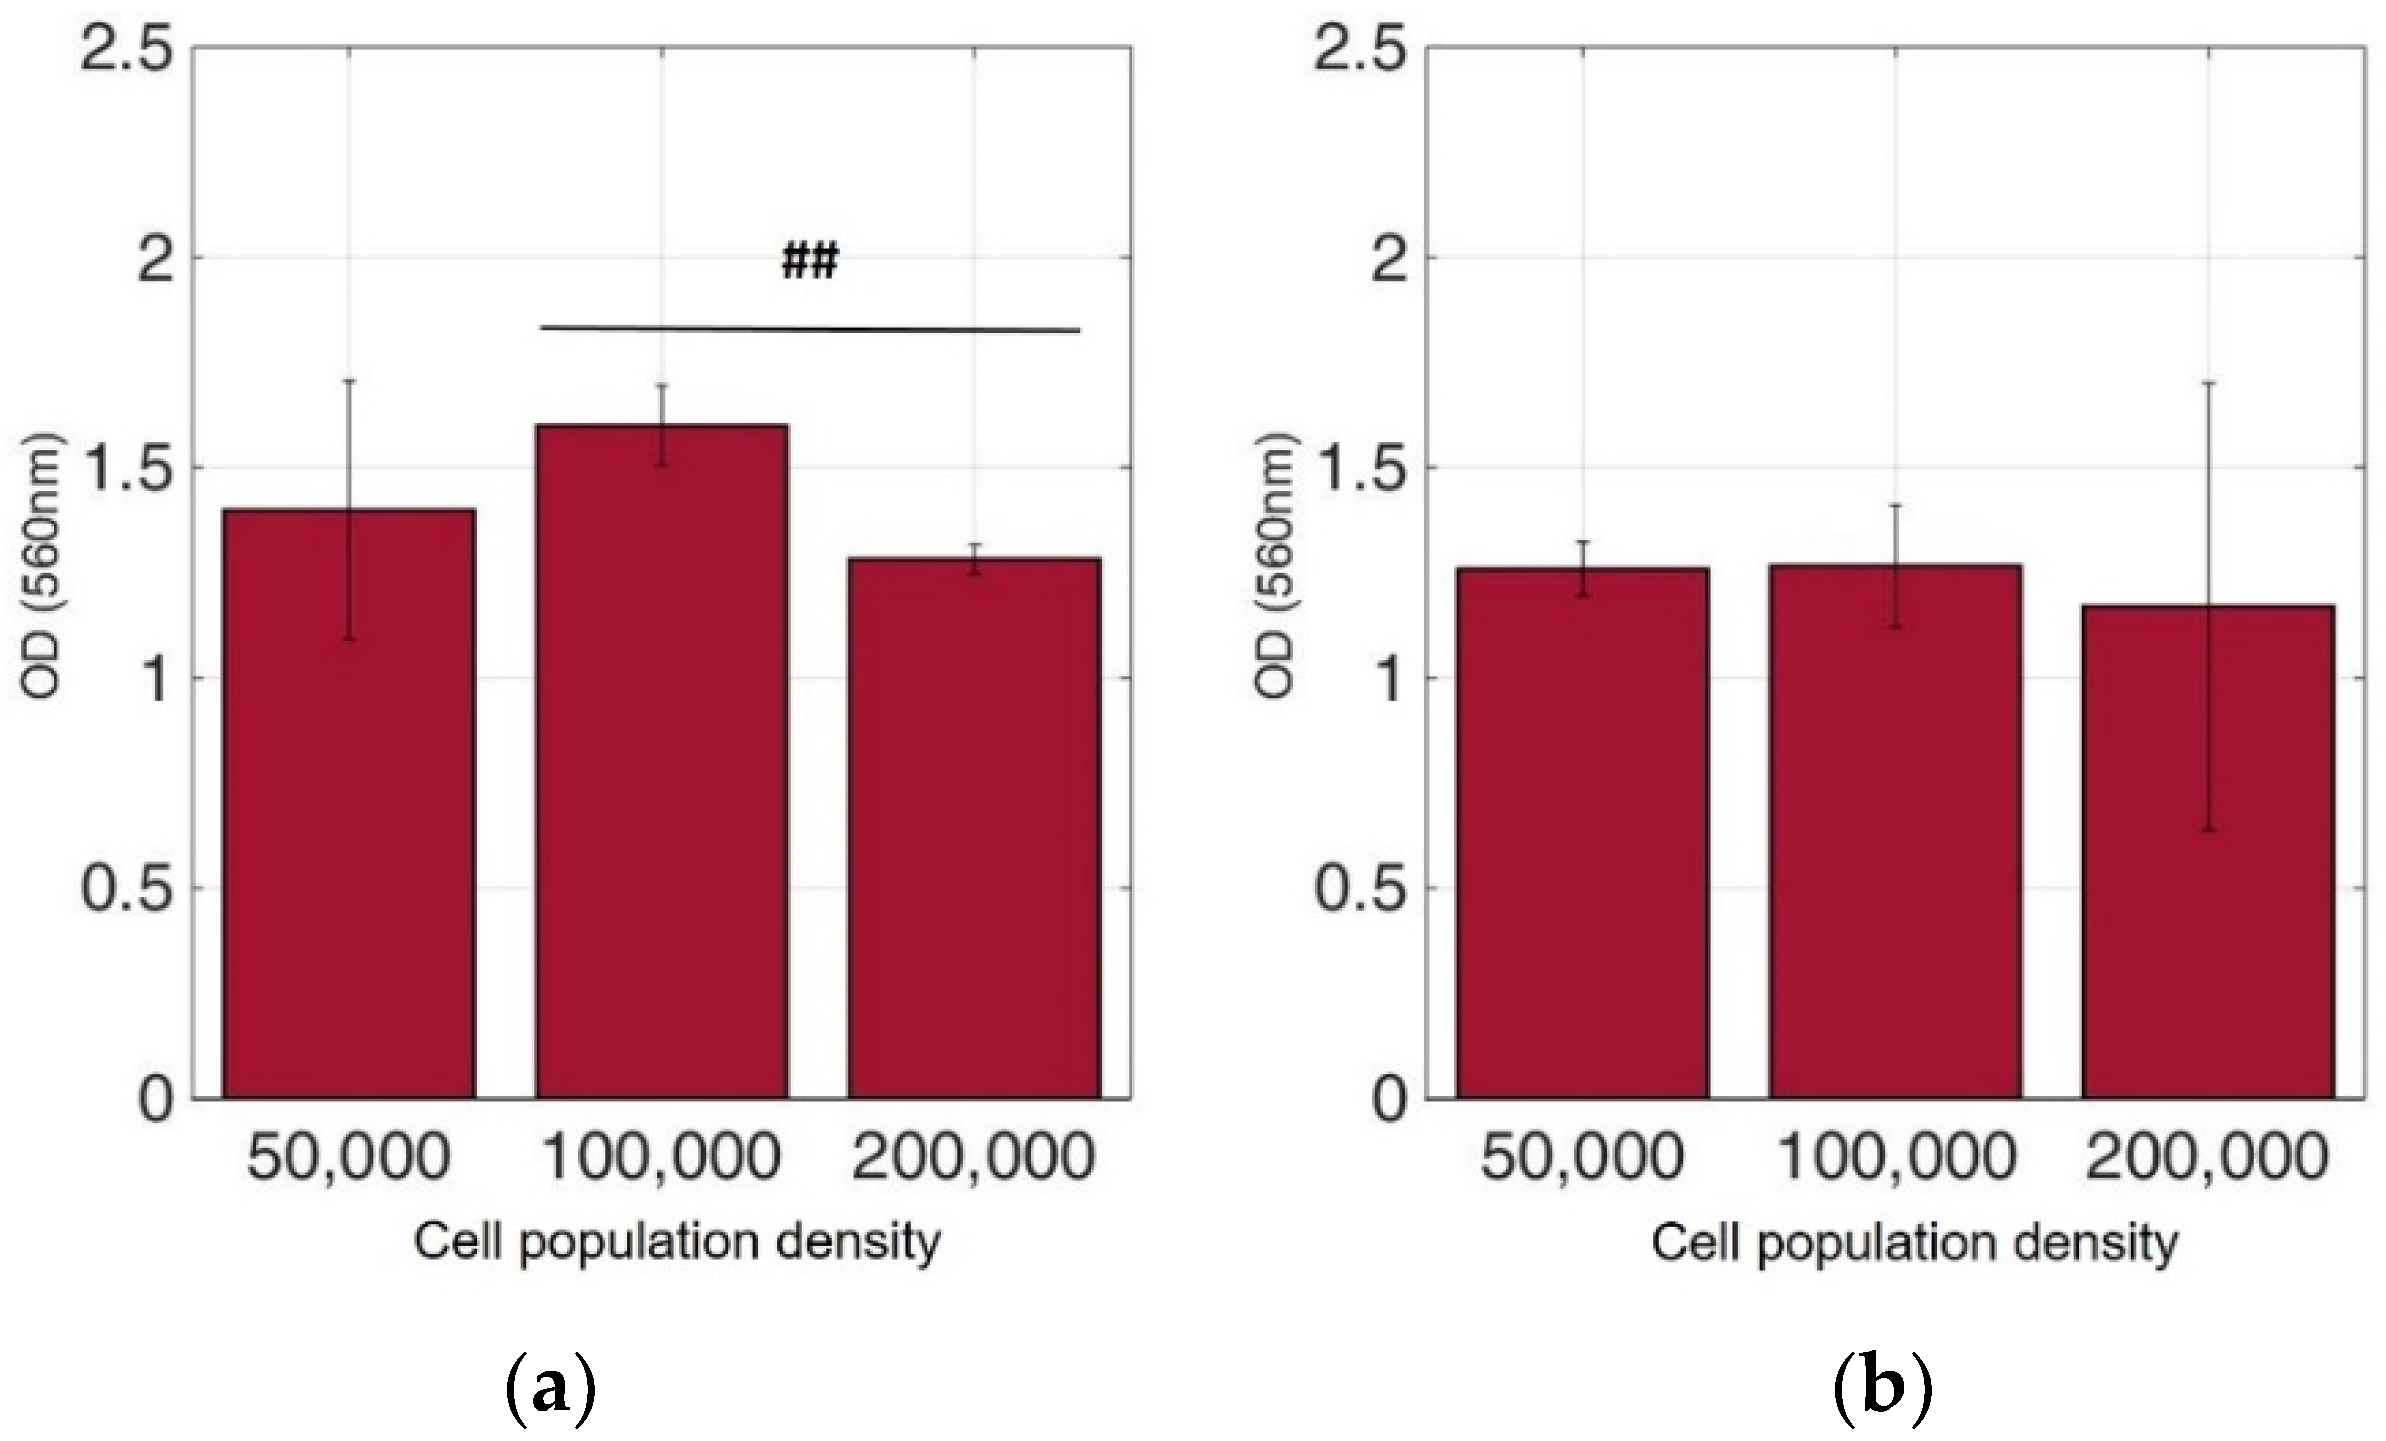
Figure 6.
Cellular viability of SK-N-SH cells immobilized in 3D matrix after treatment with MTT for 24 h showing the viability in three different population densities (50,000, 100,000, and 200,000 cells/100 μL) ± STD: (a) untreated cells (control); (b) cells treated with 5-FU. ## < 0.01 significantly different from 100,000 cells/100 μL.
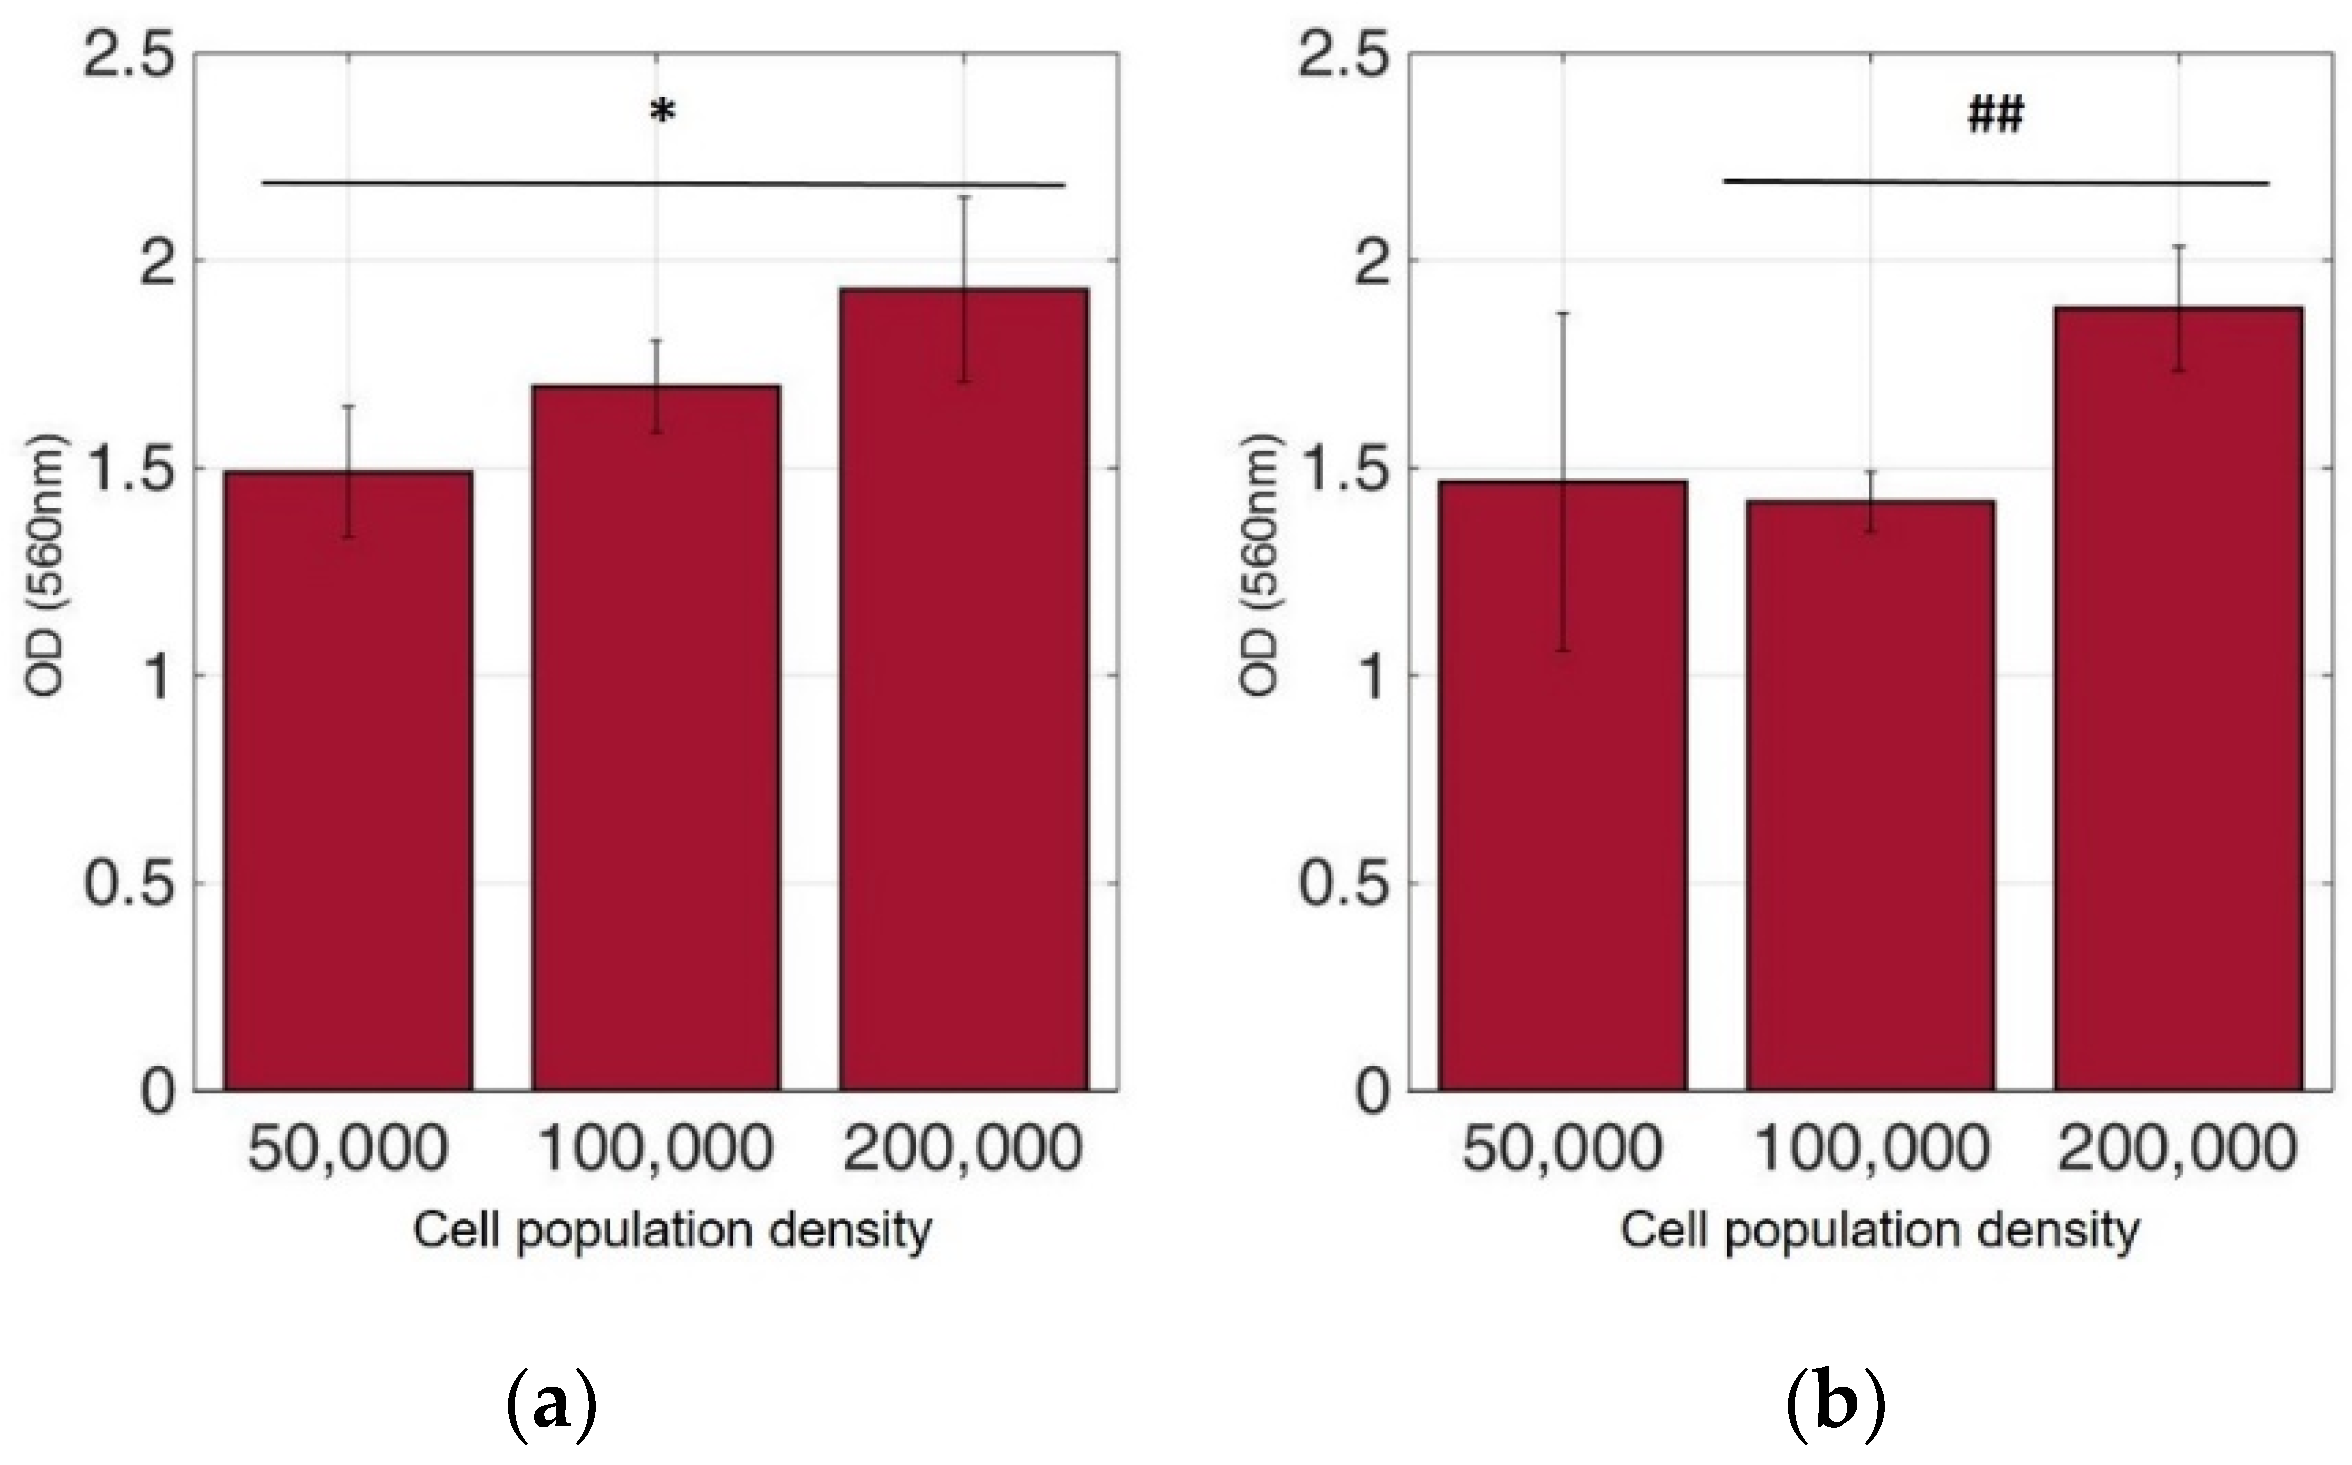
Figure 7.
Cellular viability of HEK293 cells immobilized in 3D matrix after treatment with MTT for 24 h showing the viability in three different population densities (50,000, 100,000, and 200,000 cells/100 μL) ± STD: (a) untreated cells (control); (b) cells treated with 5-FU. * < 0.05 significantly different from 50,000 cells, ## < 0.01 significantly different from 100,000 cells/100 μL.
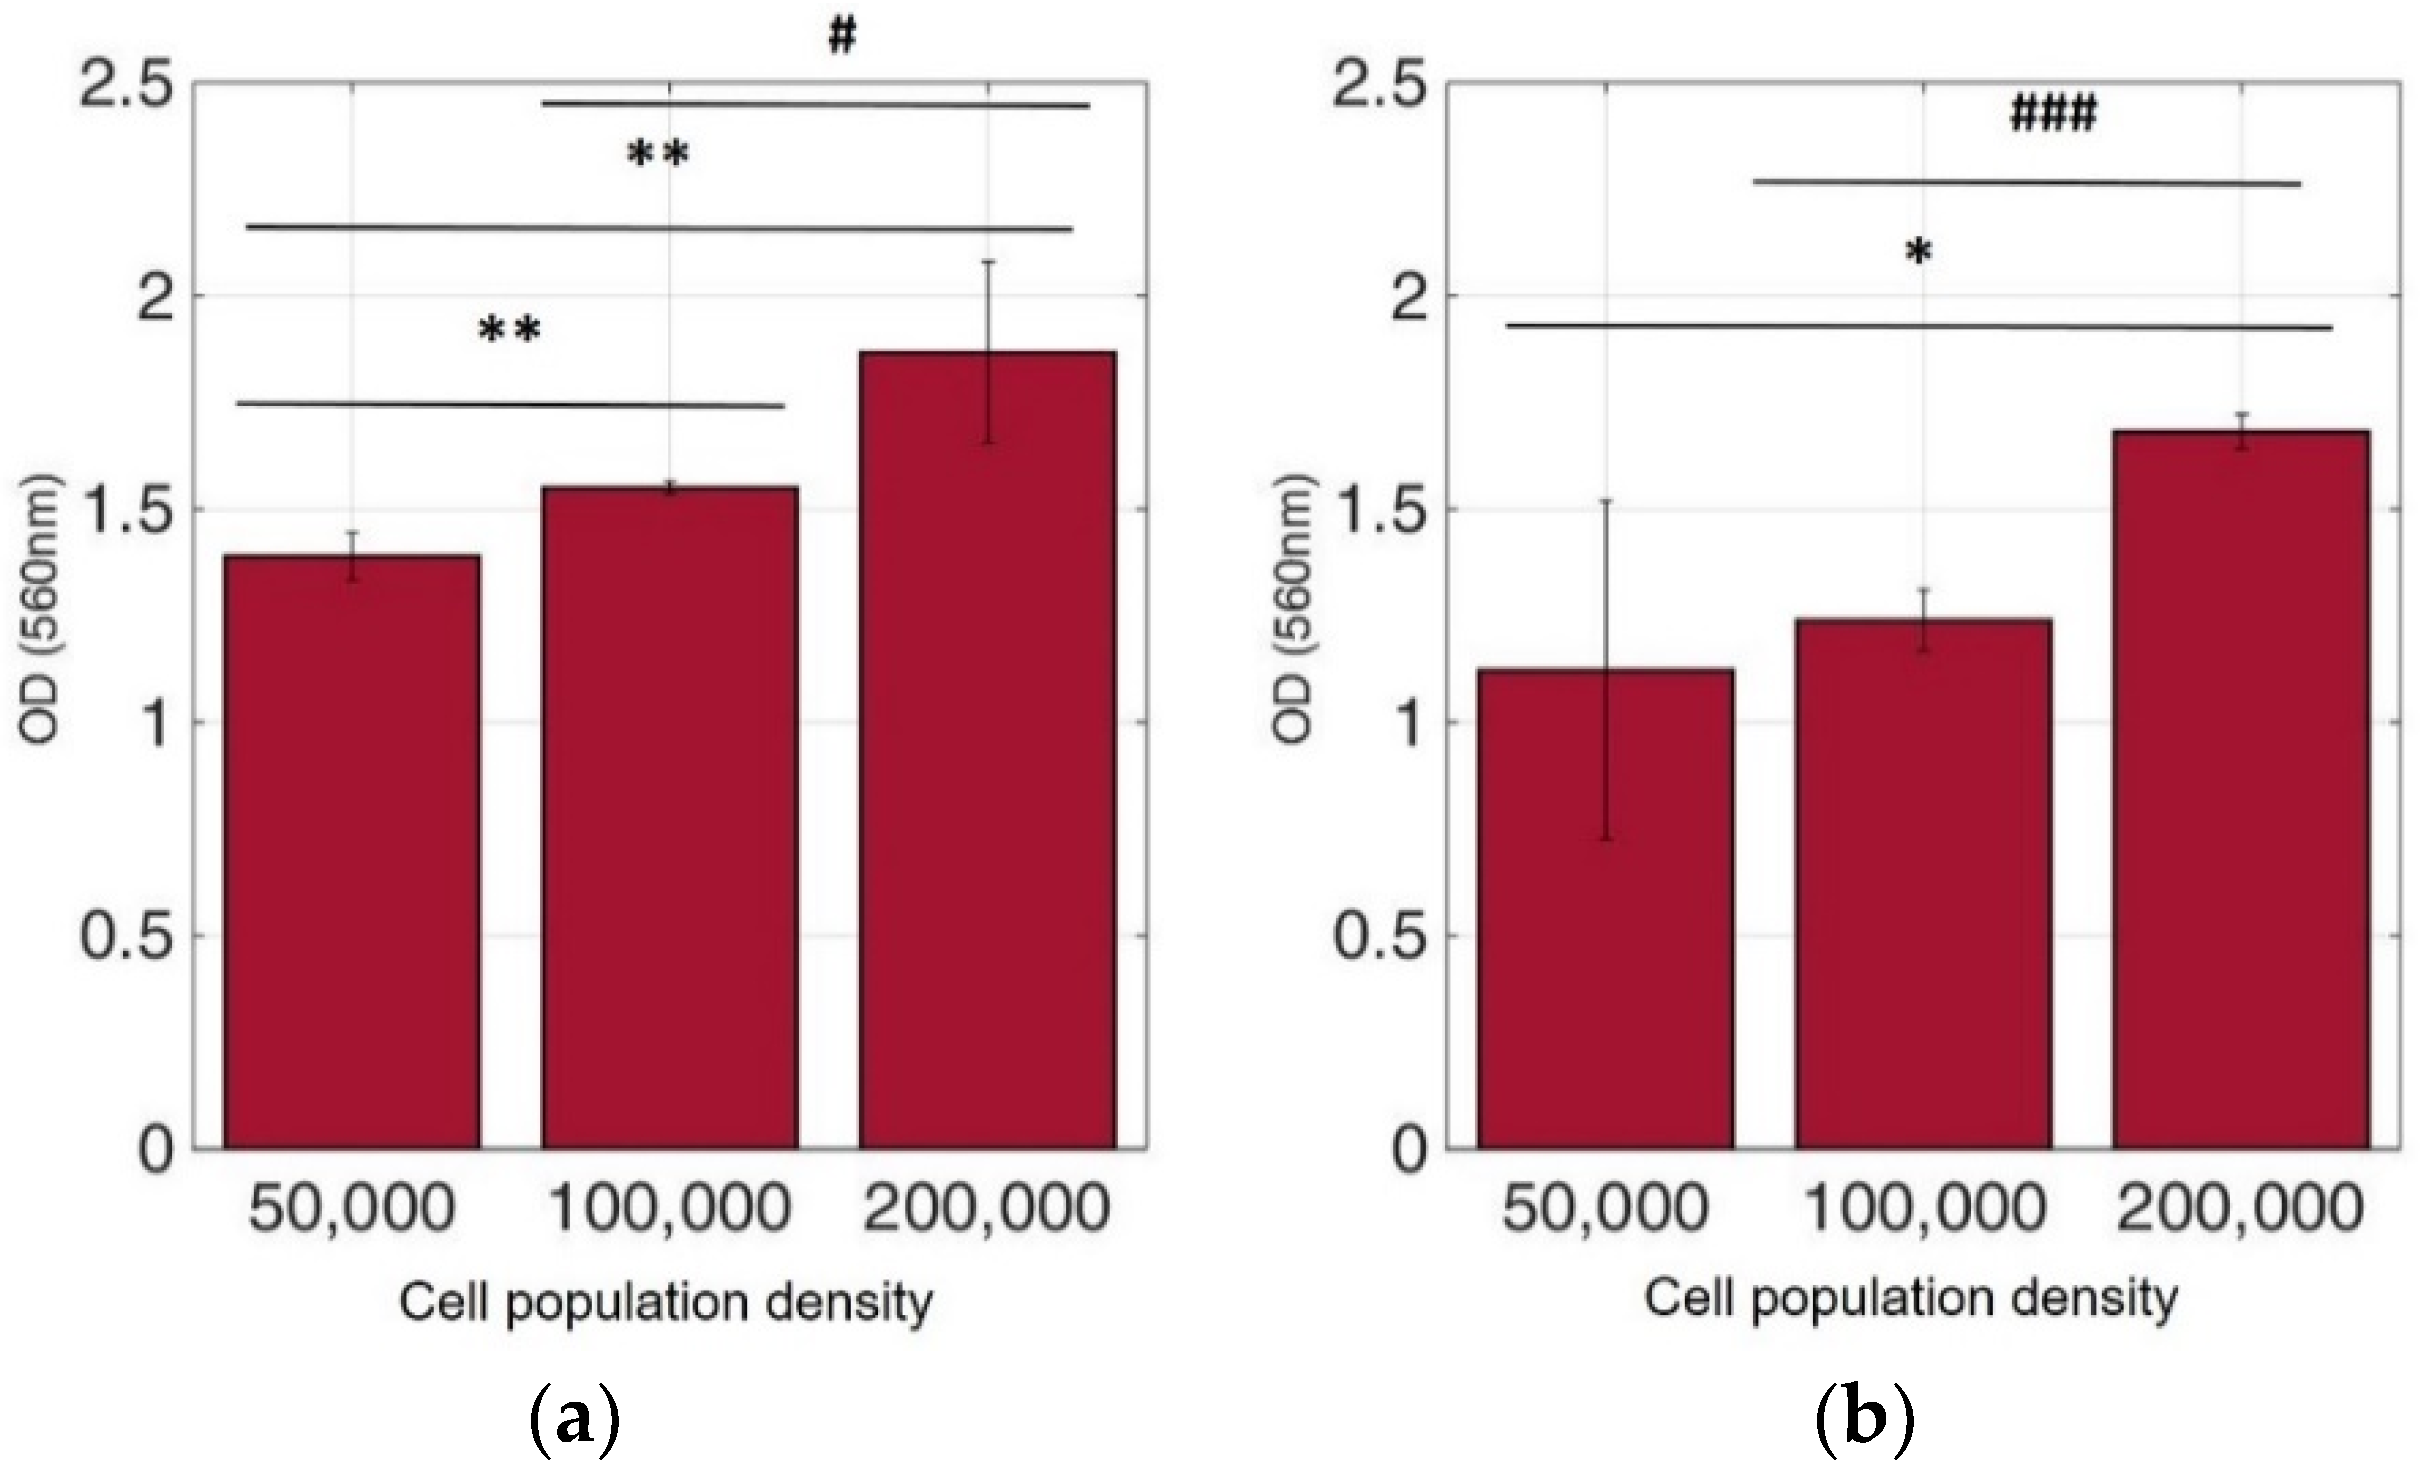
Figure 8.
Cellular viability of HeLa cells immobilized in 3D matrix after treatment with MTT for 24 h showing the viability in three different population densities (50,000, 100,000, and 200,000 cells/100 μL) ± STD: (a) untreated cells (control); (b) cells treated with 5-FU. * < 0.05, ** < 0.01 significantly different from 50,000 cells, # < 0.05, ### < 0.001 significantly different from 100,000 cells/100 μL.
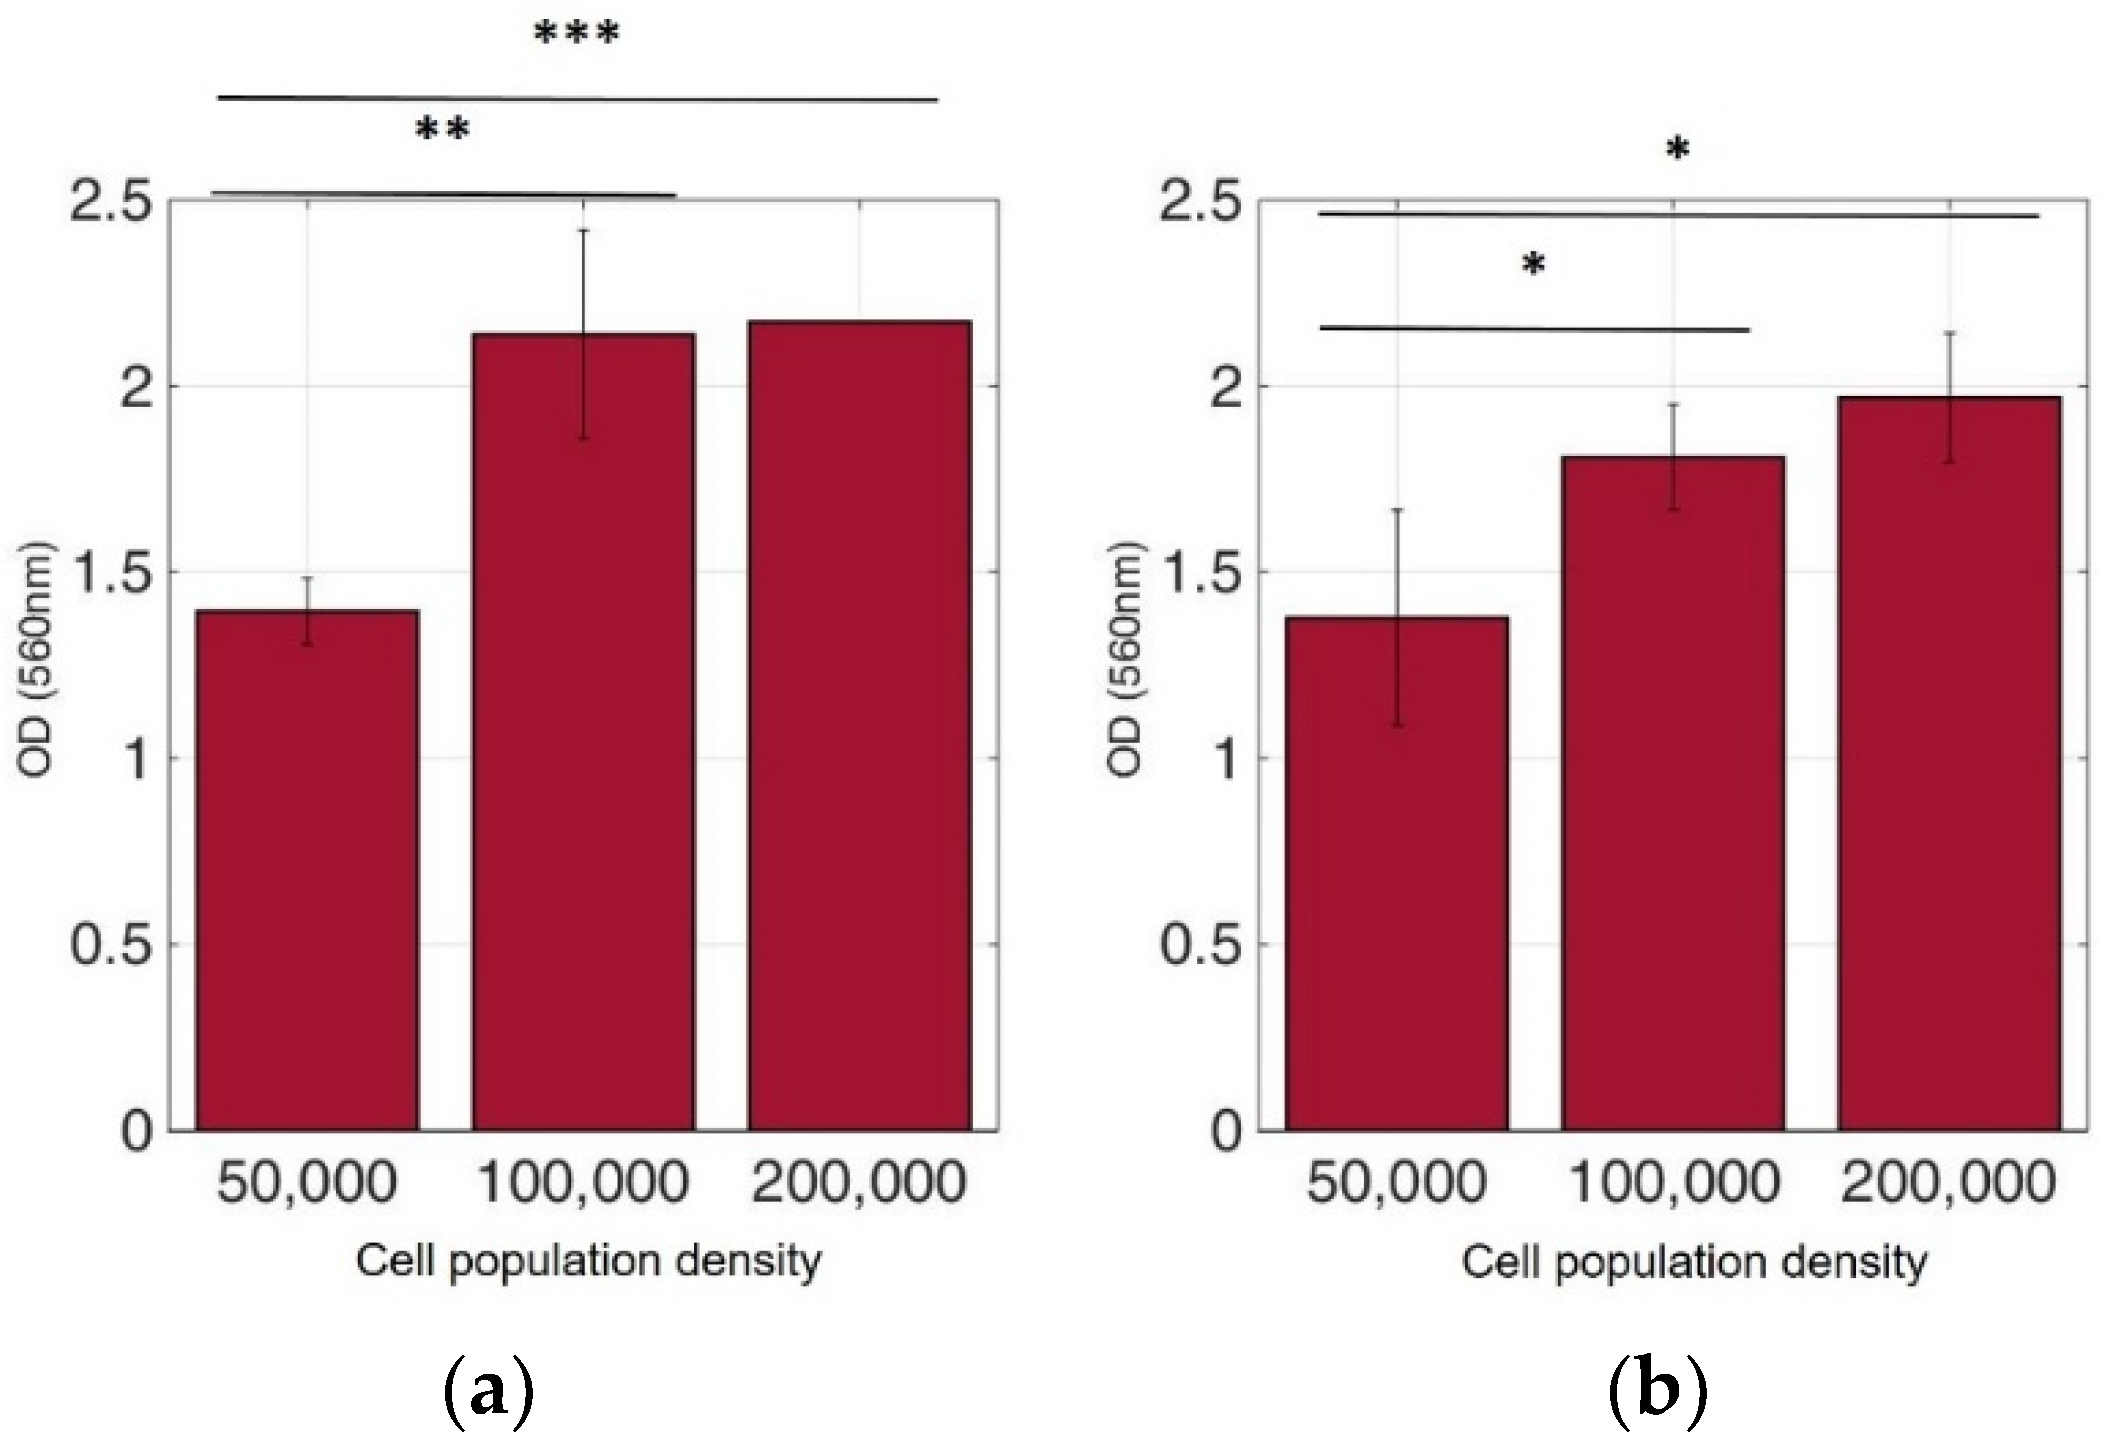
Figure 9.
Cellular viability of MCF-7 cells immobilized in 3D matrix after treatment with MTT for 24 h showing the viability in three different population densities (50,000, 100,000, and 200,000 cells/100 μL) ± STD: (a) untreated cells (control); (b) cells treated with 5-FU. * < 0.05, ** < 0.01, *** < 0.001 significantly different from 50,000 cells.
Figure 10.
Normalized values of the mean impedance magnitude for untreated (control) immobilized SK-N-SH cancer cell lines tested at three frequencies (1 KHz, 10 KHz, 100 KHz) for three different population densities ± STD: (a) 50,000 cells; (b) 100,000 cells and (c) 200,000 cells/100 μL.
Figure 10.
Normalized values of the mean impedance magnitude for untreated (control) immobilized SK-N-SH cancer cell lines tested at three frequencies (1 KHz, 10 KHz, 100 KHz) for three different population densities ± STD: (a) 50,000 cells; (b) 100,000 cells and (c) 200,000 cells/100 μL.
Figure 11.
Normalized values of the mean impedance magnitude for untreated (control) immobilized HEK293 cancer cell lines tested at three frequencies (1 KHz, 10 KHz, 100 KHz) for three different population densities ± STD: (a) 50,000 cells; (b) 100,000 cells and (c) 200,000 cells/100 μL.
Figure 11.
Normalized values of the mean impedance magnitude for untreated (control) immobilized HEK293 cancer cell lines tested at three frequencies (1 KHz, 10 KHz, 100 KHz) for three different population densities ± STD: (a) 50,000 cells; (b) 100,000 cells and (c) 200,000 cells/100 μL.
Figure 12.
Normalized values of the mean impedance magnitude for untreated (control) immobilized HeLa cancer cell lines tested at three frequencies (1 KHz, 10 KHz, 100 KHz) for three different population densities ± STD: (a) 50,000 cells; (b) 100,000 cells and (c) 200,000 cells/100 μL.
Figure 12.
Normalized values of the mean impedance magnitude for untreated (control) immobilized HeLa cancer cell lines tested at three frequencies (1 KHz, 10 KHz, 100 KHz) for three different population densities ± STD: (a) 50,000 cells; (b) 100,000 cells and (c) 200,000 cells/100 μL.
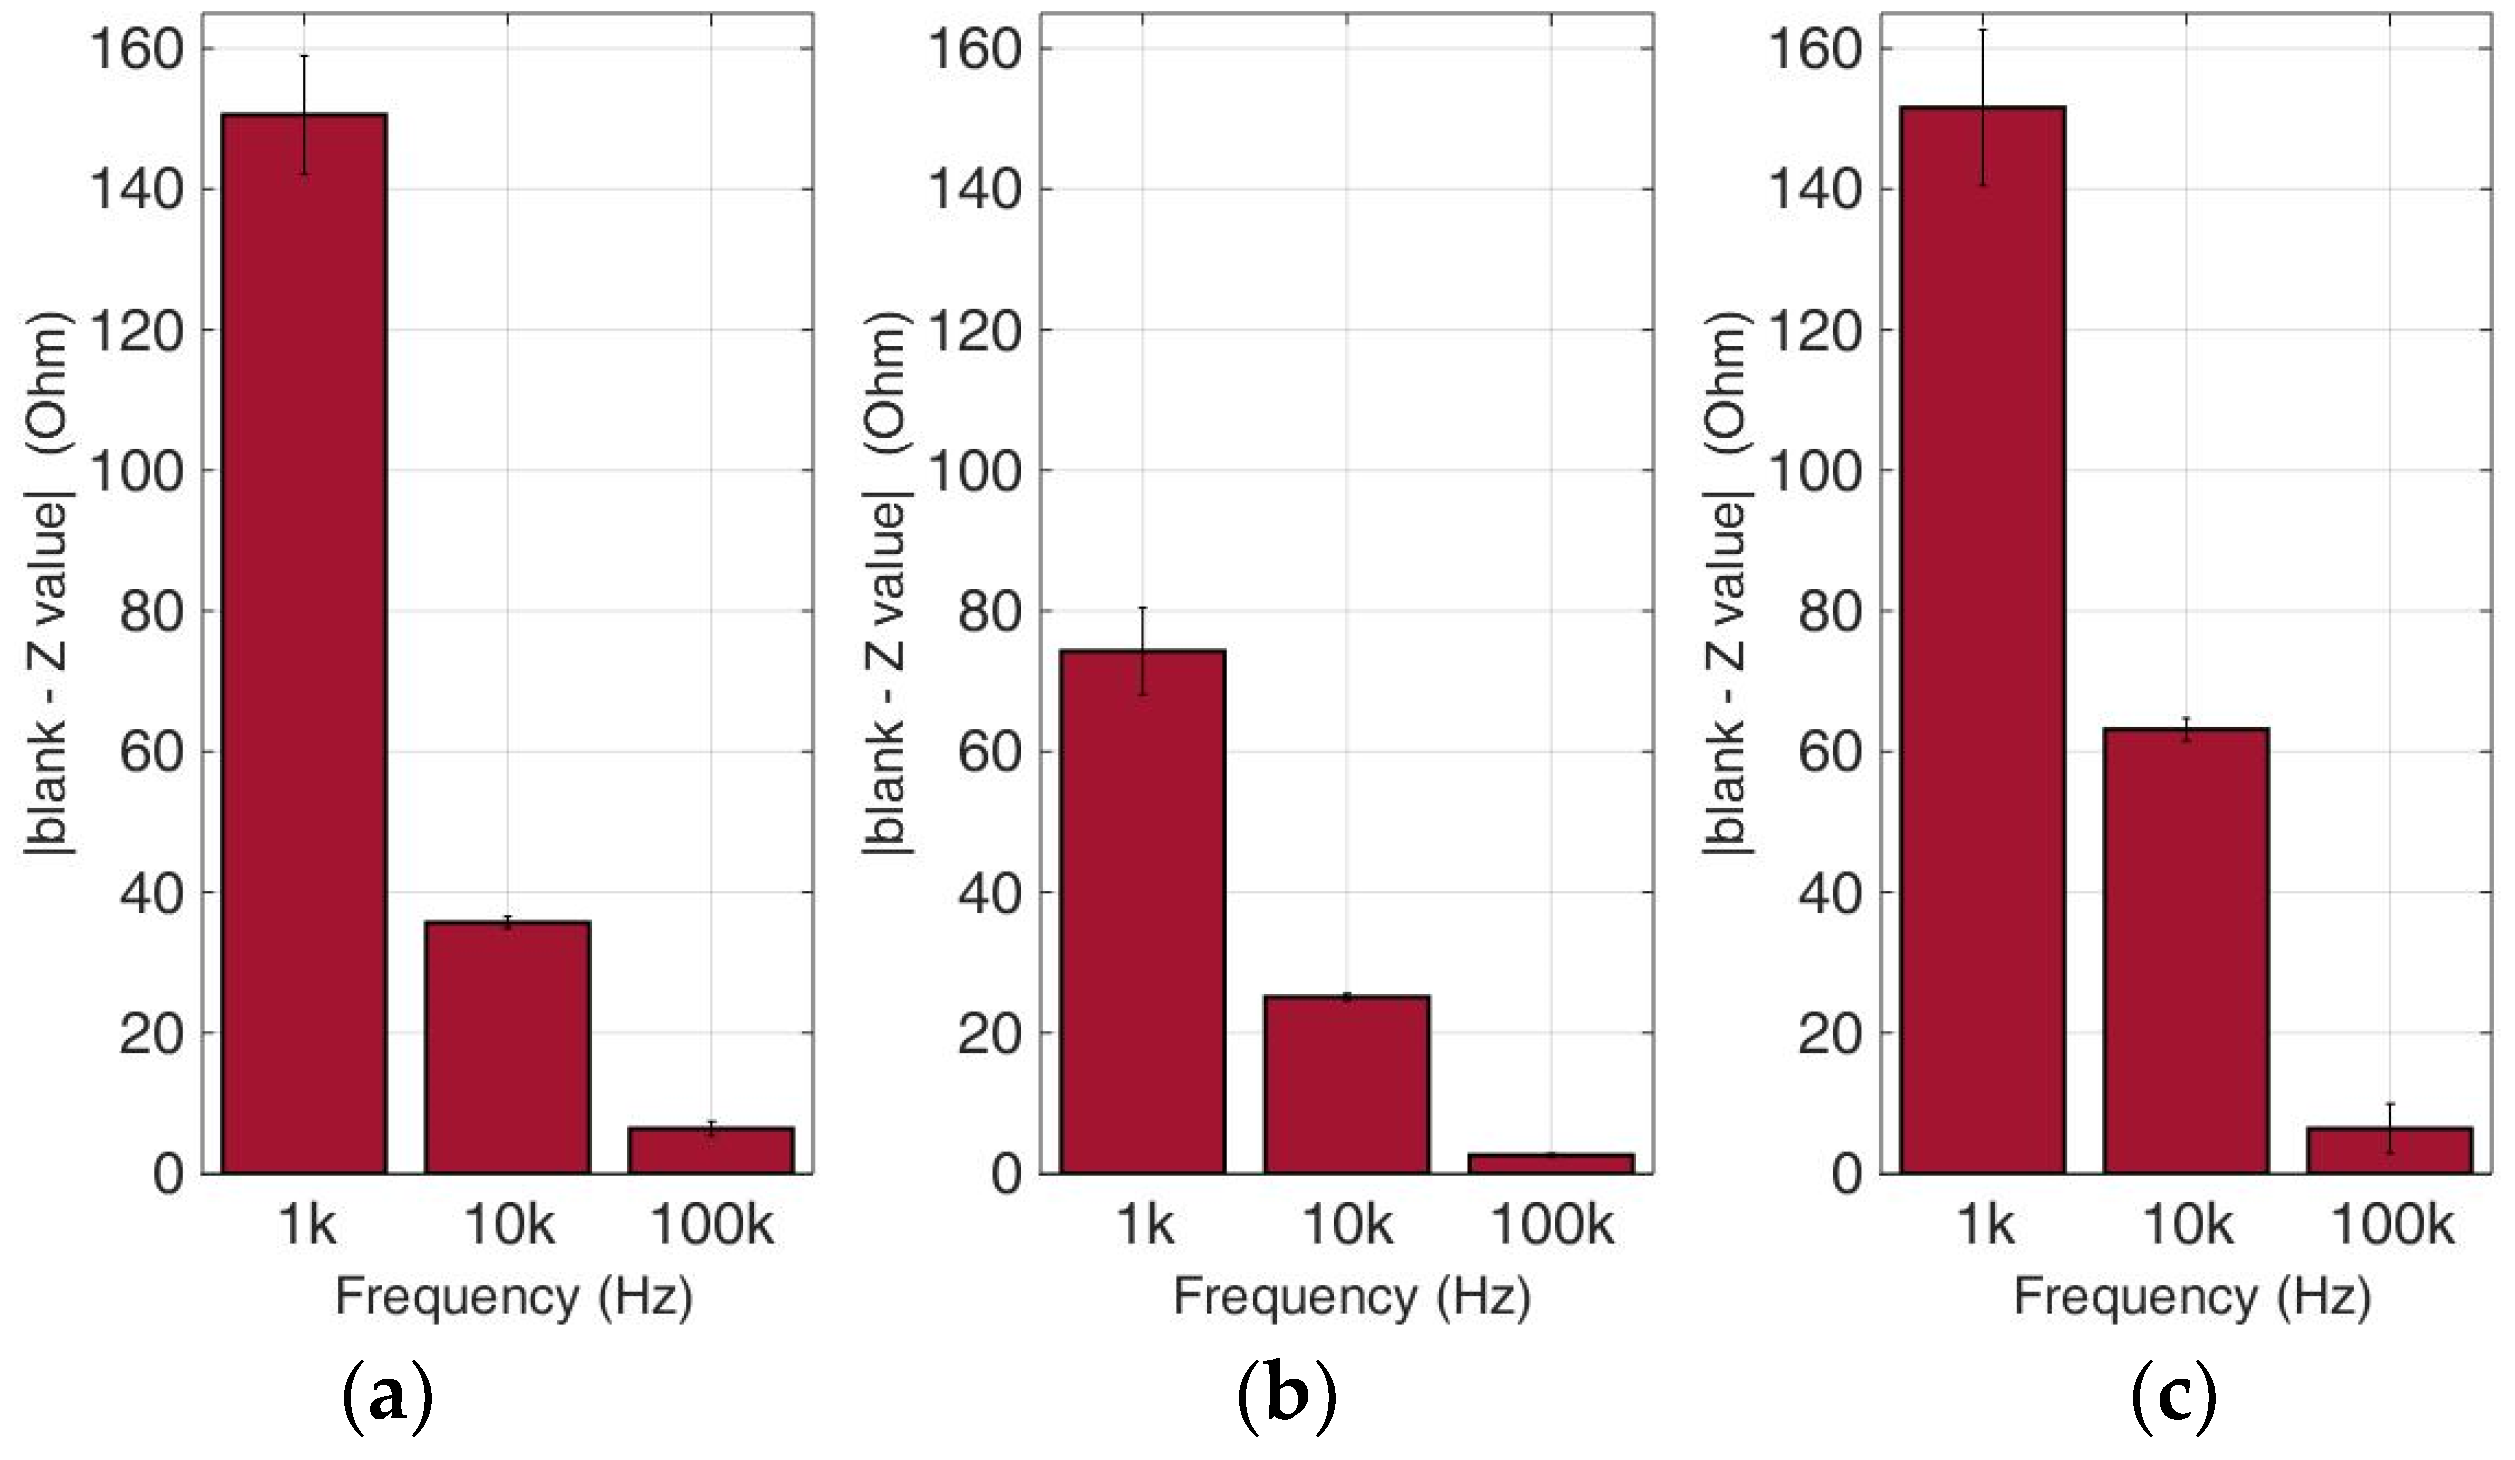
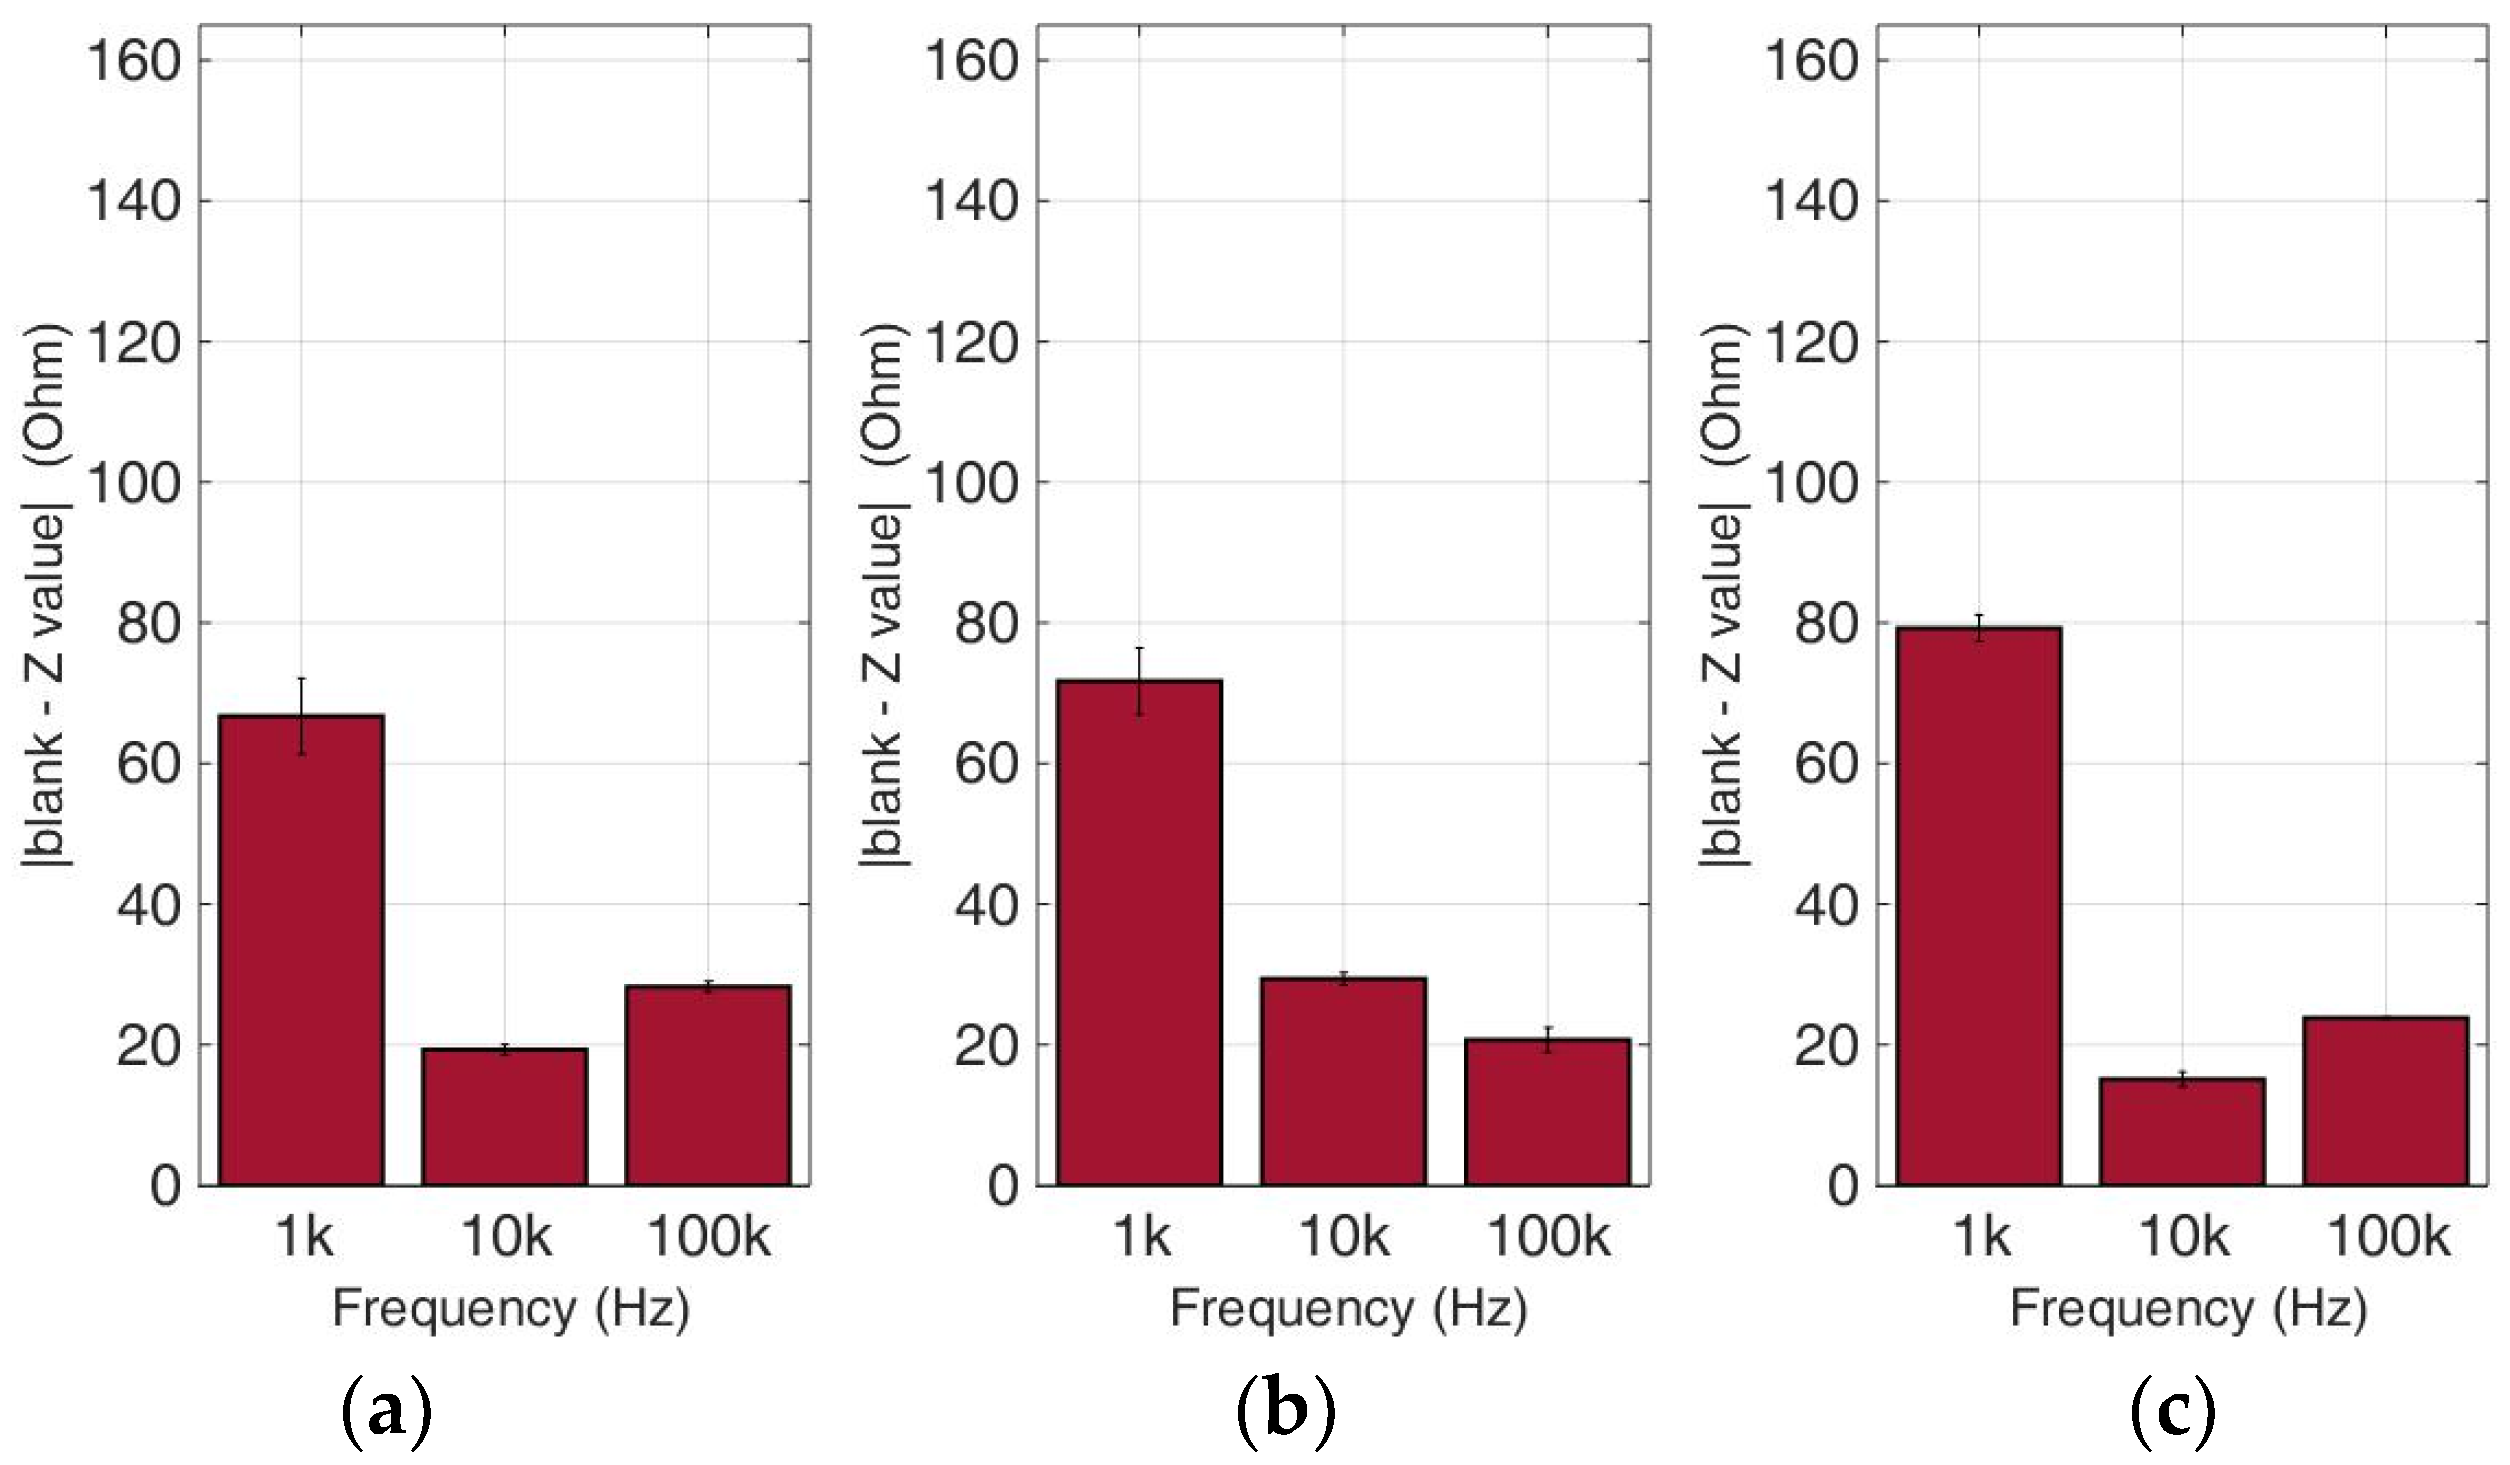
Figure 13.
Normalized values of the mean impedance magnitude for untreated (control) immobilized MCF-7 cancer cell lines tested at three frequencies (1 KHz, 10 KHz, 100 KHz) for three different population densities: (a) 50,000 cells; (b) 100,000 cells and (c) 200,000 cells/100 μL.
Figure 13.
Normalized values of the mean impedance magnitude for untreated (control) immobilized MCF-7 cancer cell lines tested at three frequencies (1 KHz, 10 KHz, 100 KHz) for three different population densities: (a) 50,000 cells; (b) 100,000 cells and (c) 200,000 cells/100 μL.
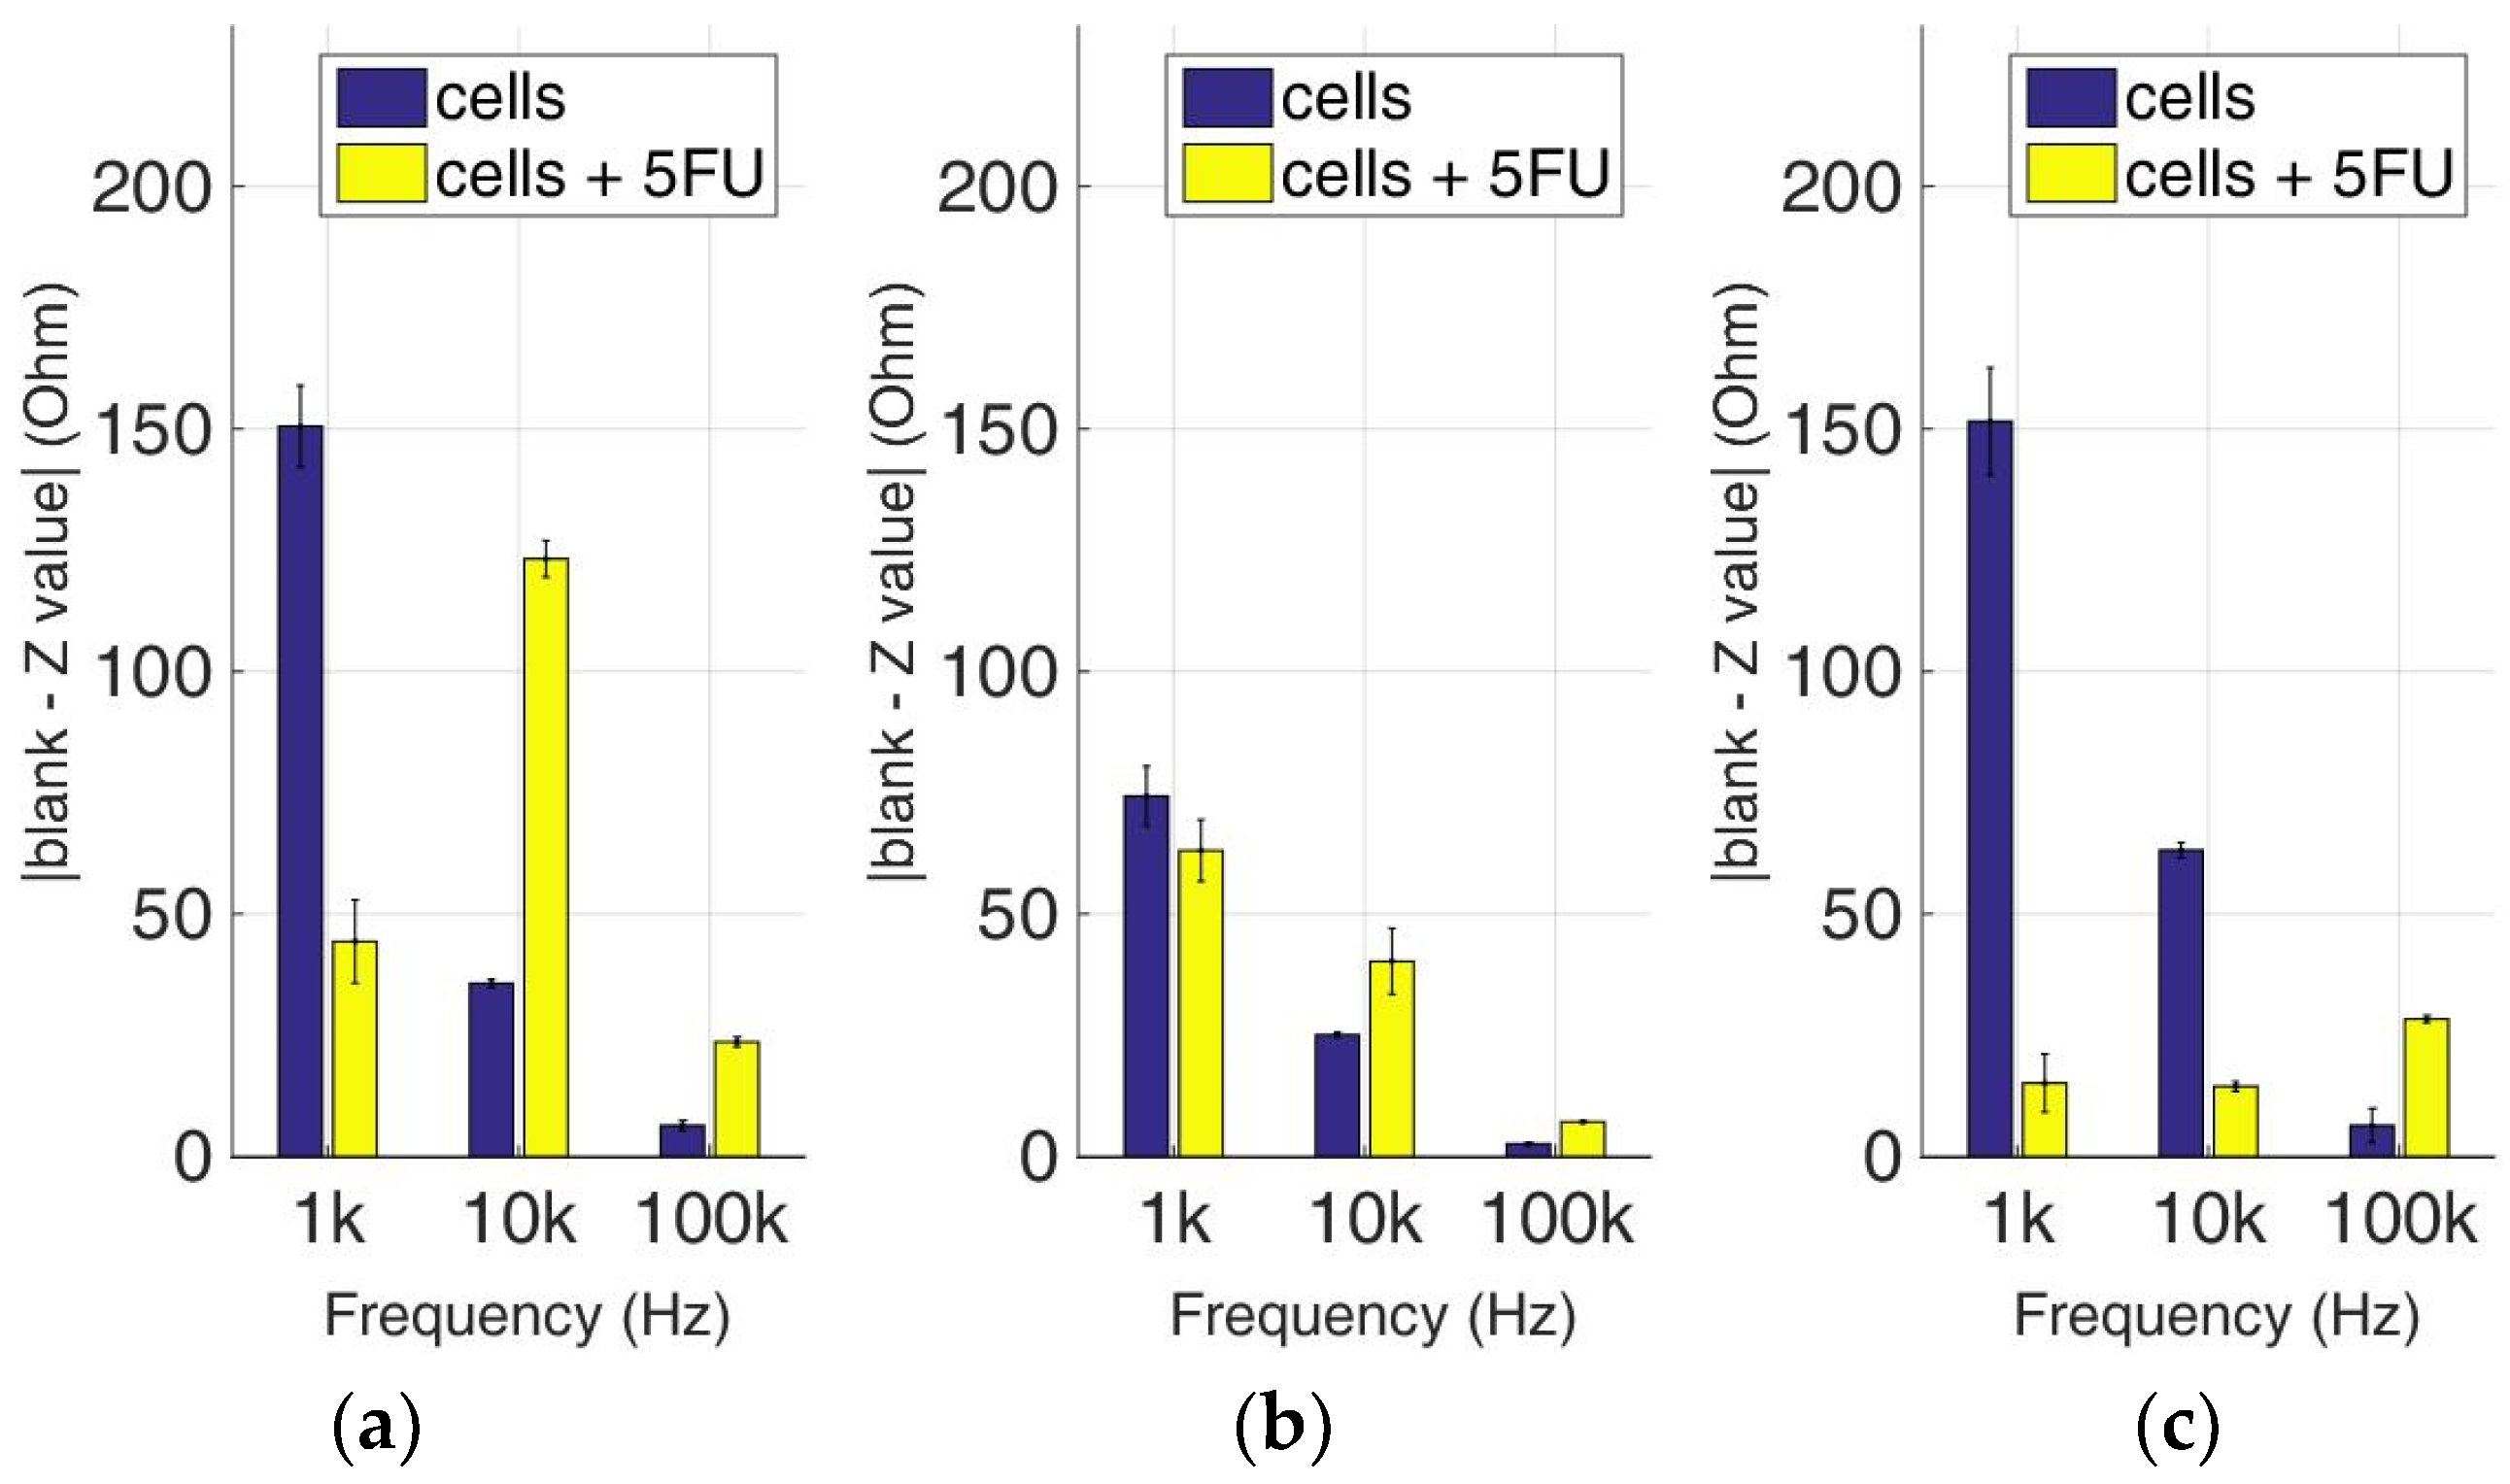
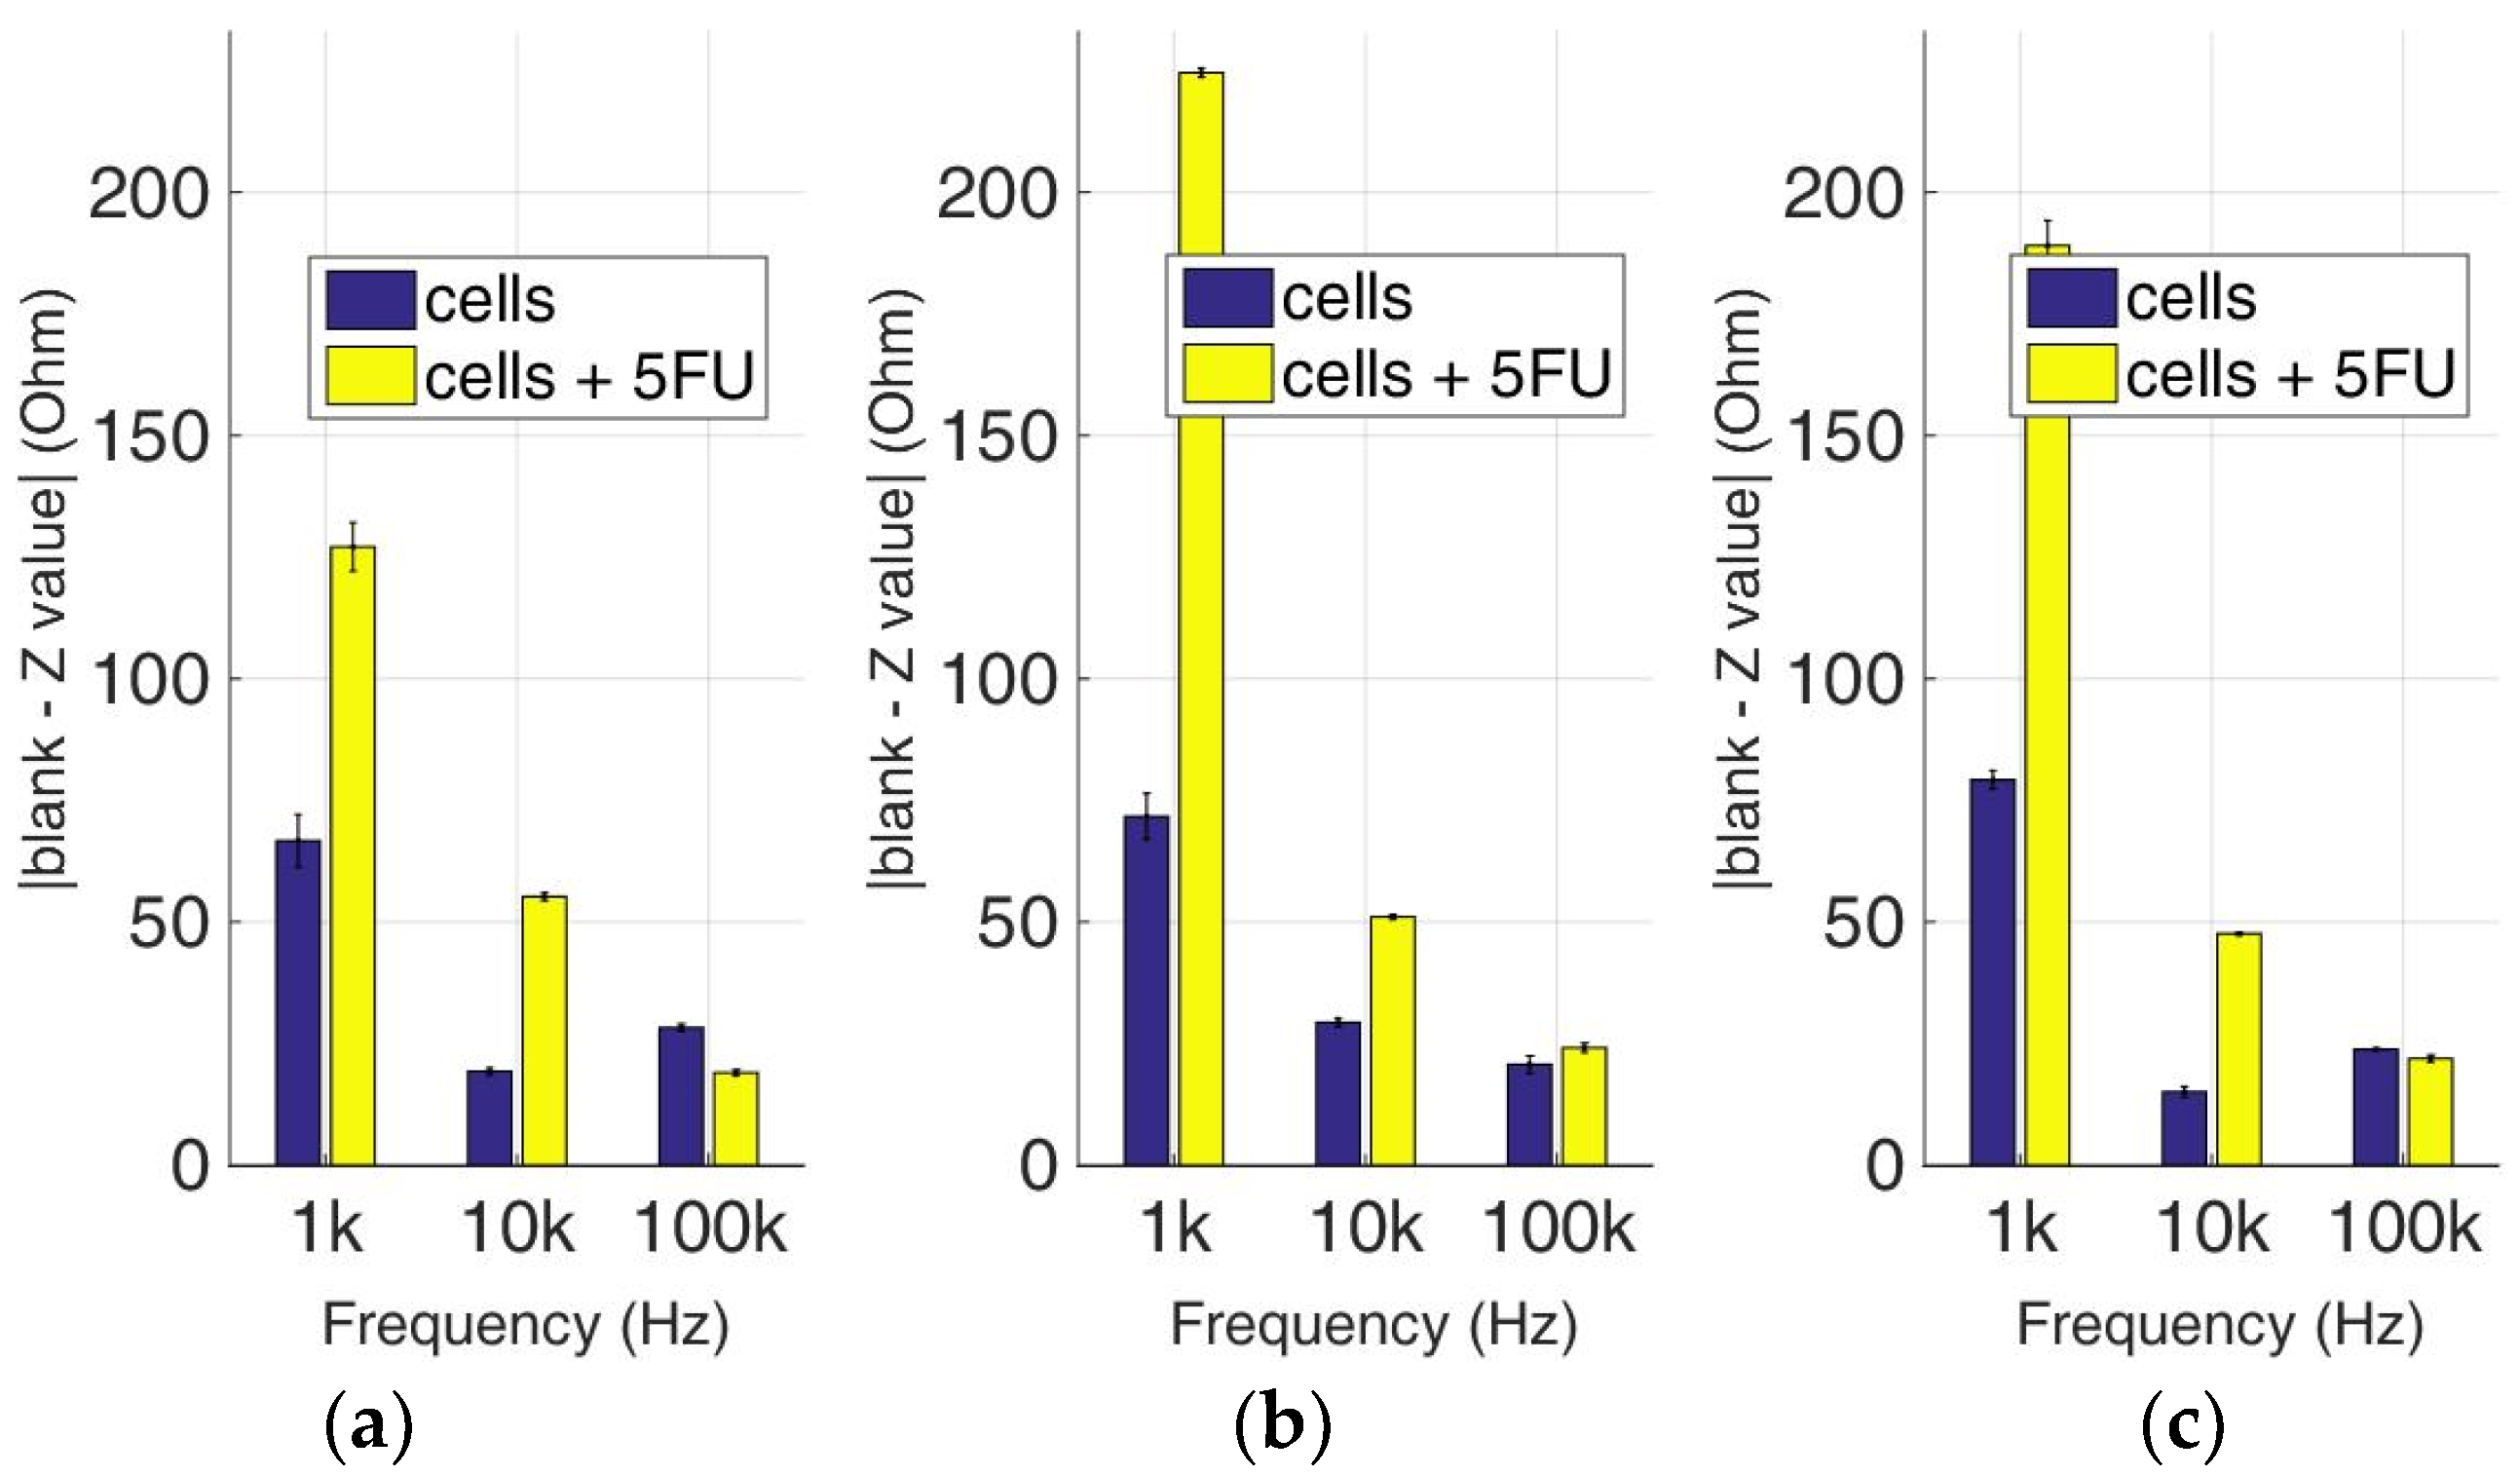
Figure 14.
Normalized values of the mean impedance magnitude for control immobilized SK-N-SH cells (blue bars) and immobilized SK-N-SH cells treated with 5-FU (yellow bars), tested at three different cell population densities ± STD: (a) 50,000; (b) 100,000 and (c) 200,000/100 μL for three different frequencies (1 KHz, 10 KHz, and 100 KHz).
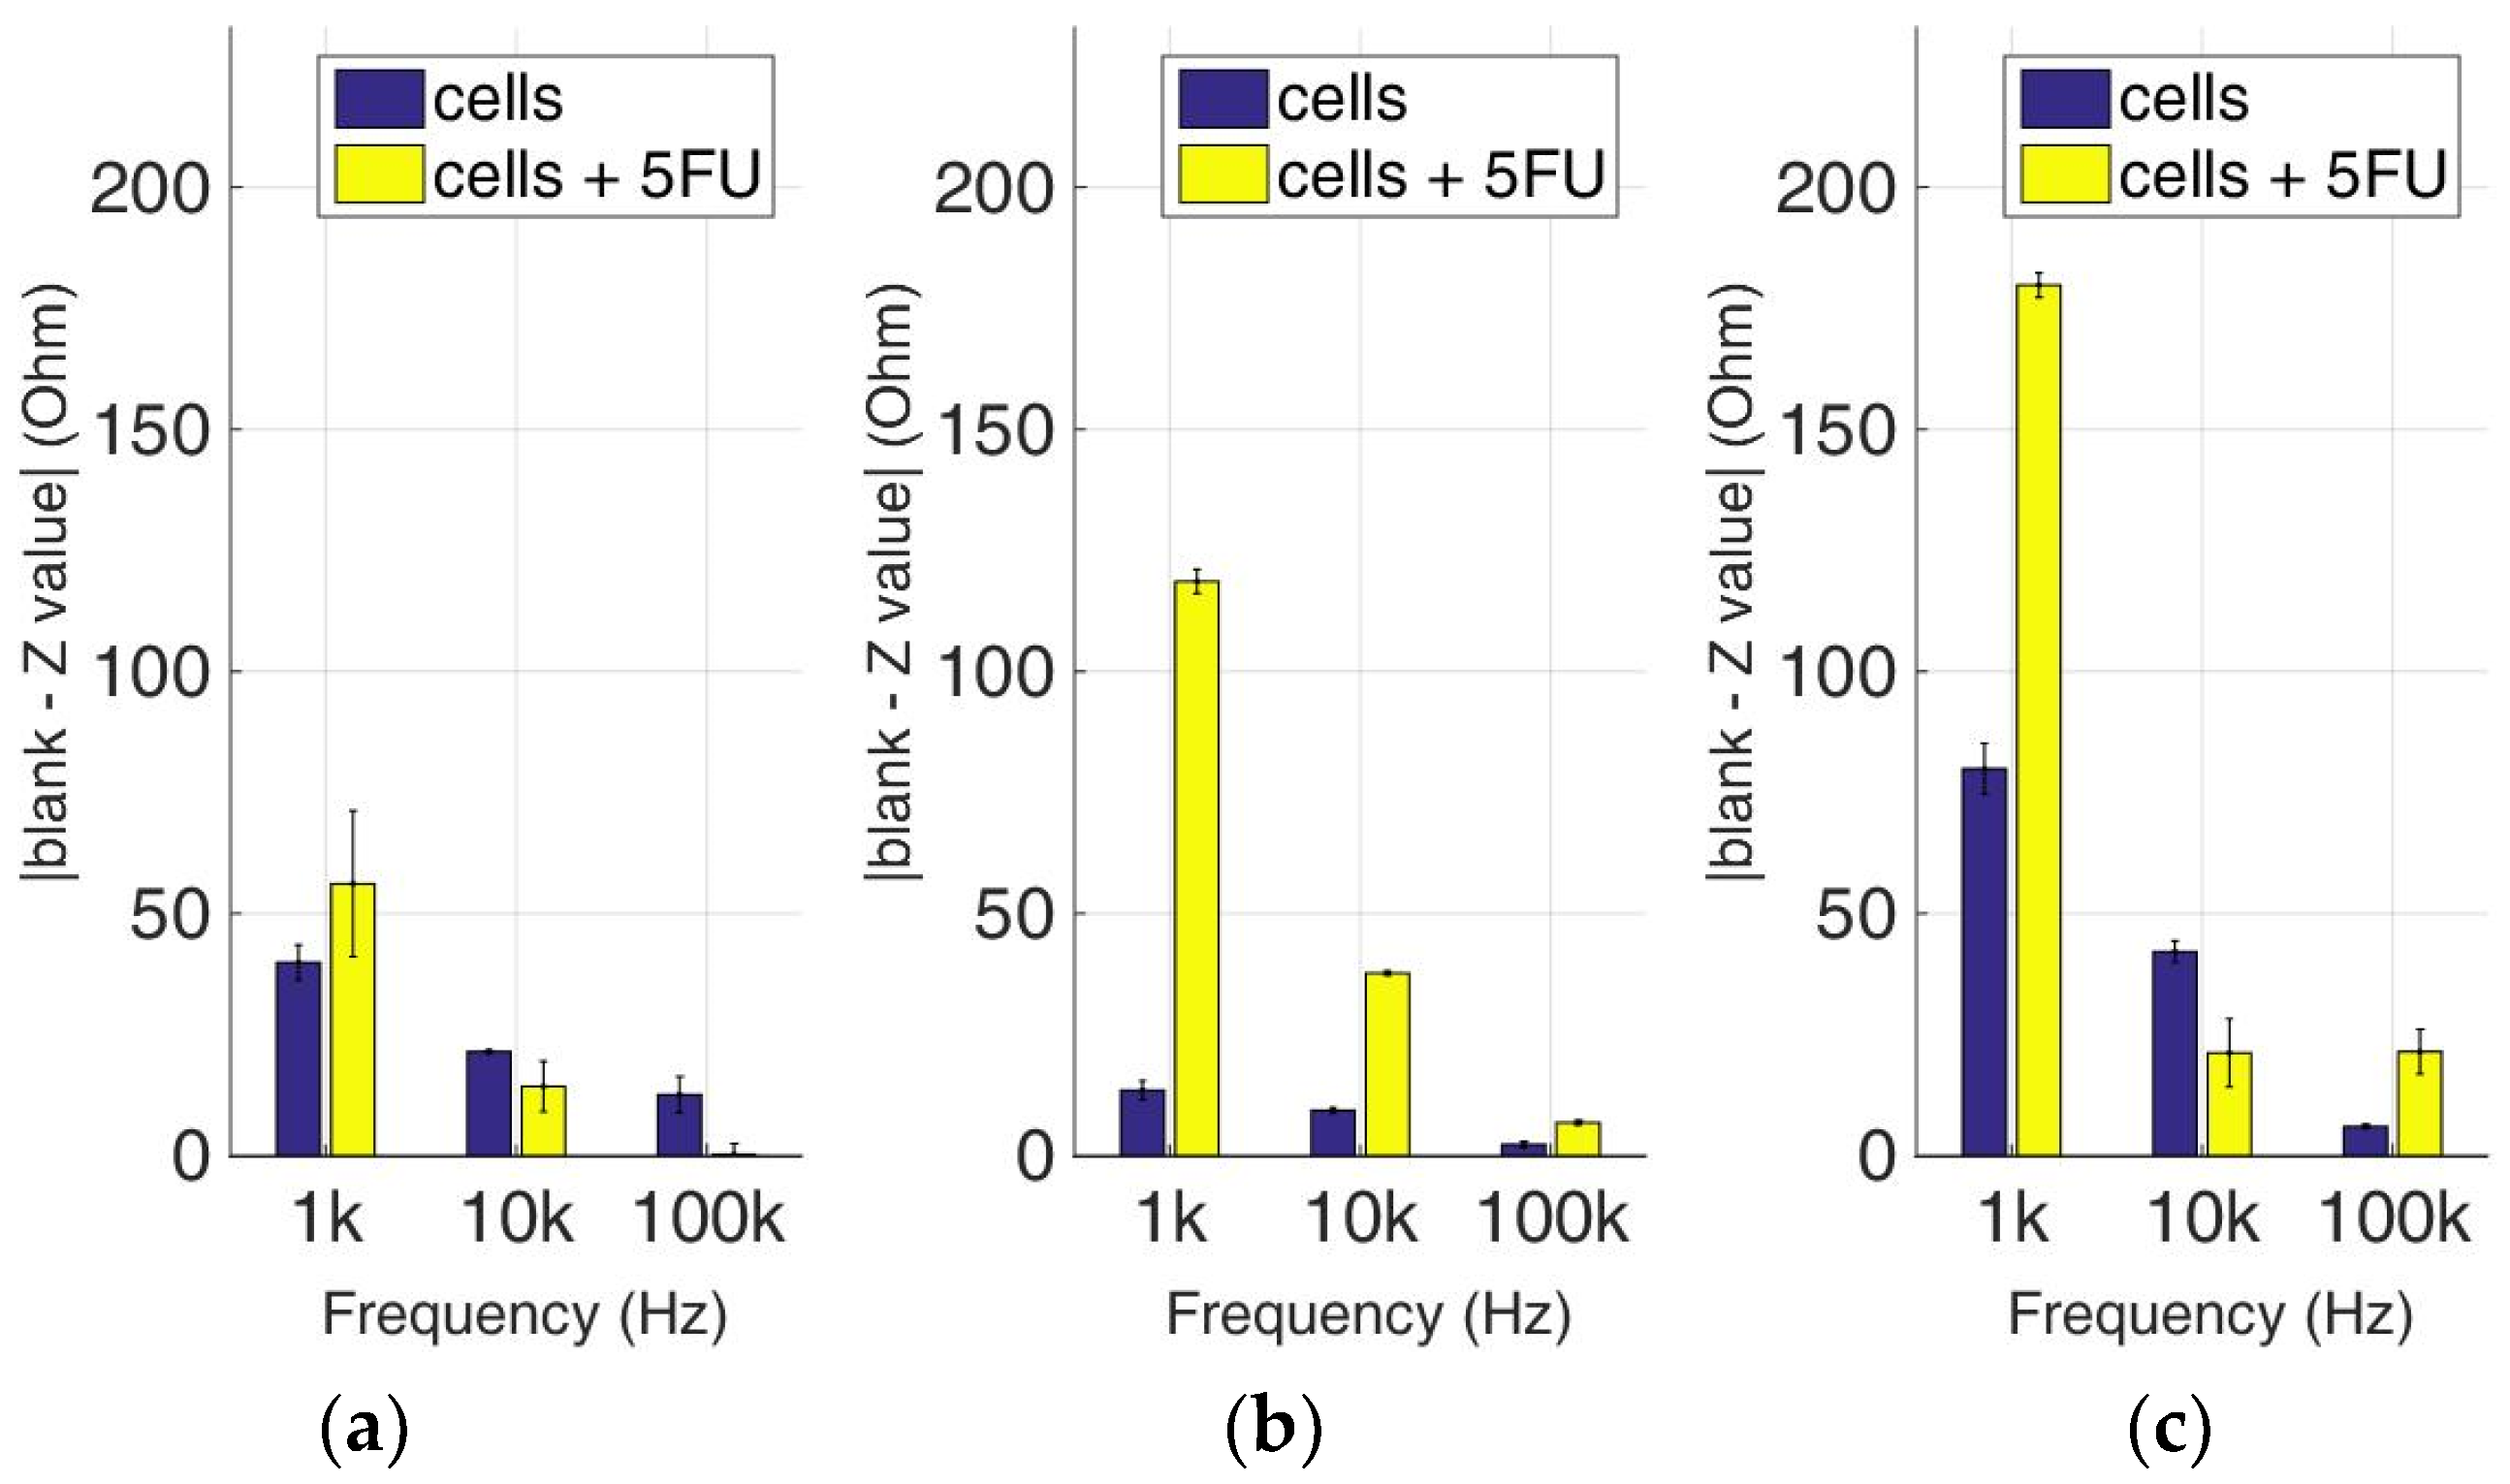
Figure 15.
Normalized values of the mean impedance magnitude for control immobilized HEK293 cells (blue bars) and immobilized HEK293 cells treated with 5-FU (yellow bars), tested at three different cell population densities ± STD: (a) 50,000; (b) 100,000 and (c) 200,000/100 μL for three different frequencies (1 KHz, 10 KHz, and 100 KHz).
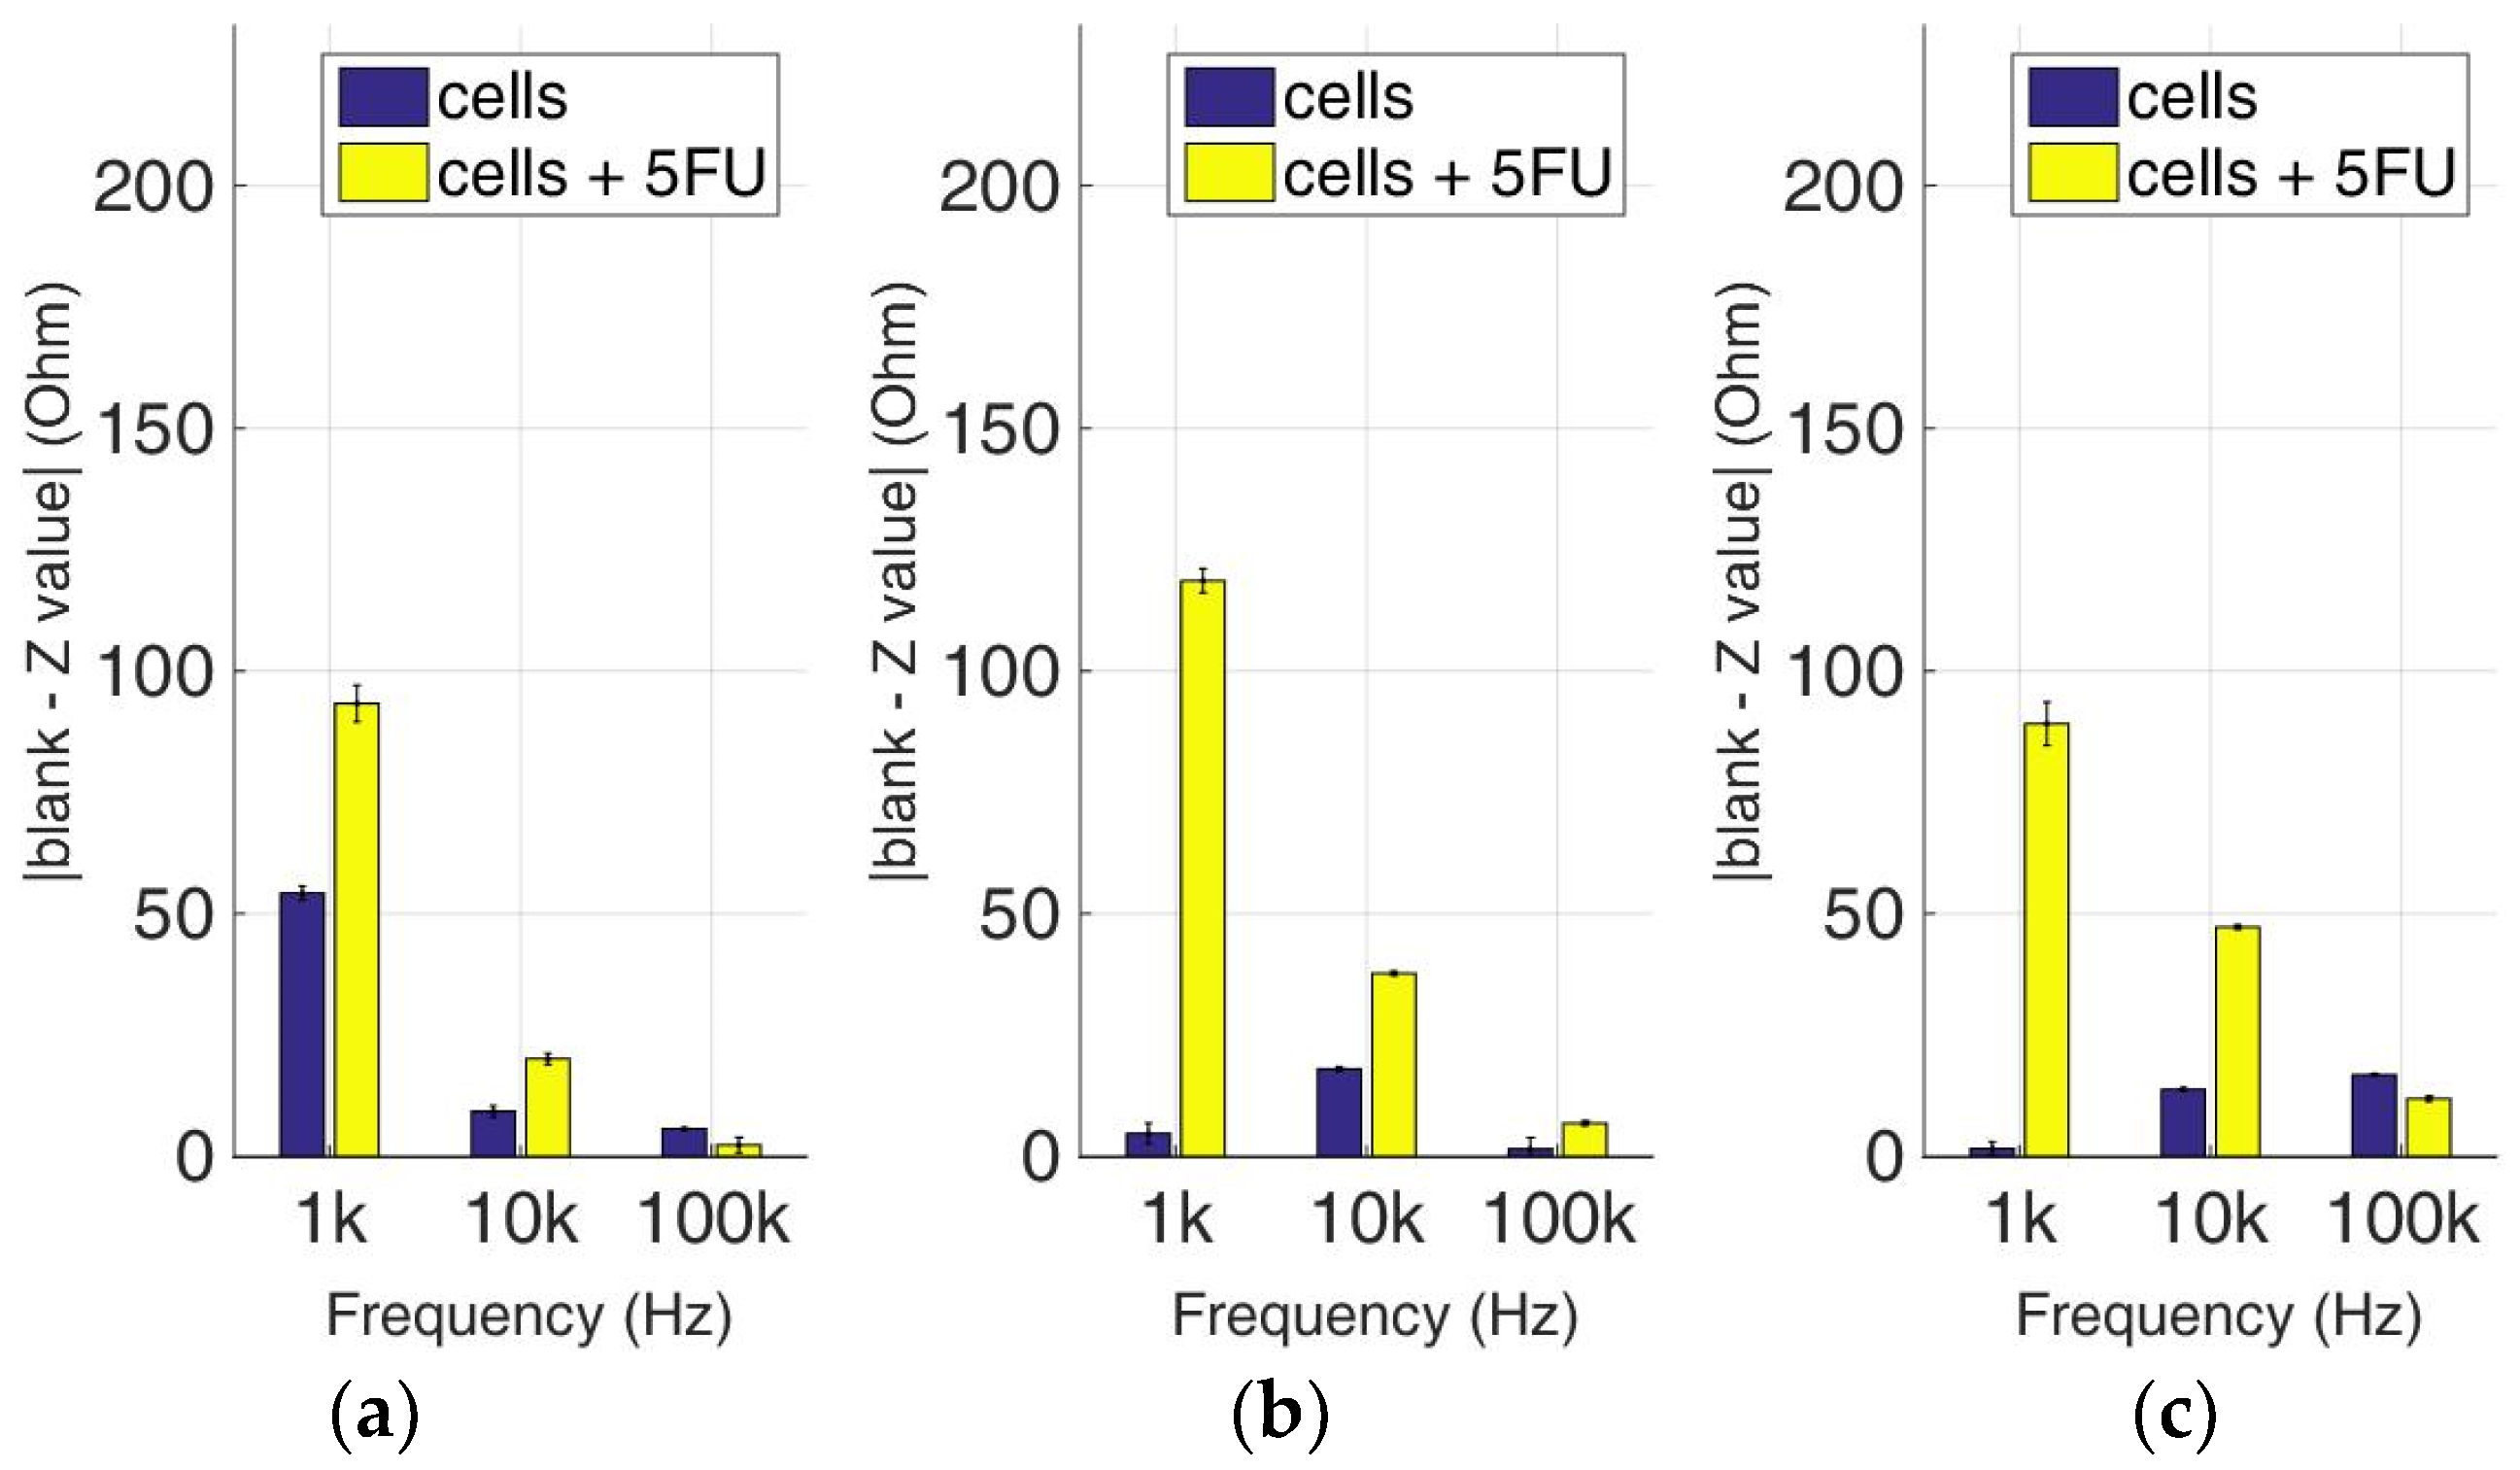
Figure 16.
Normalized values of the mean impedance magnitude for control immobilized HeLa cells (blue bars) and immobilized HeLa cells treated with 5-FU (yellow bars), tested at three different cell population densities ± STD: (a) 50,000; (b) 100,000 and (c) 200,000/100 μL for three different frequencies (1 KHz, 10 KHz, and 100 KHz).
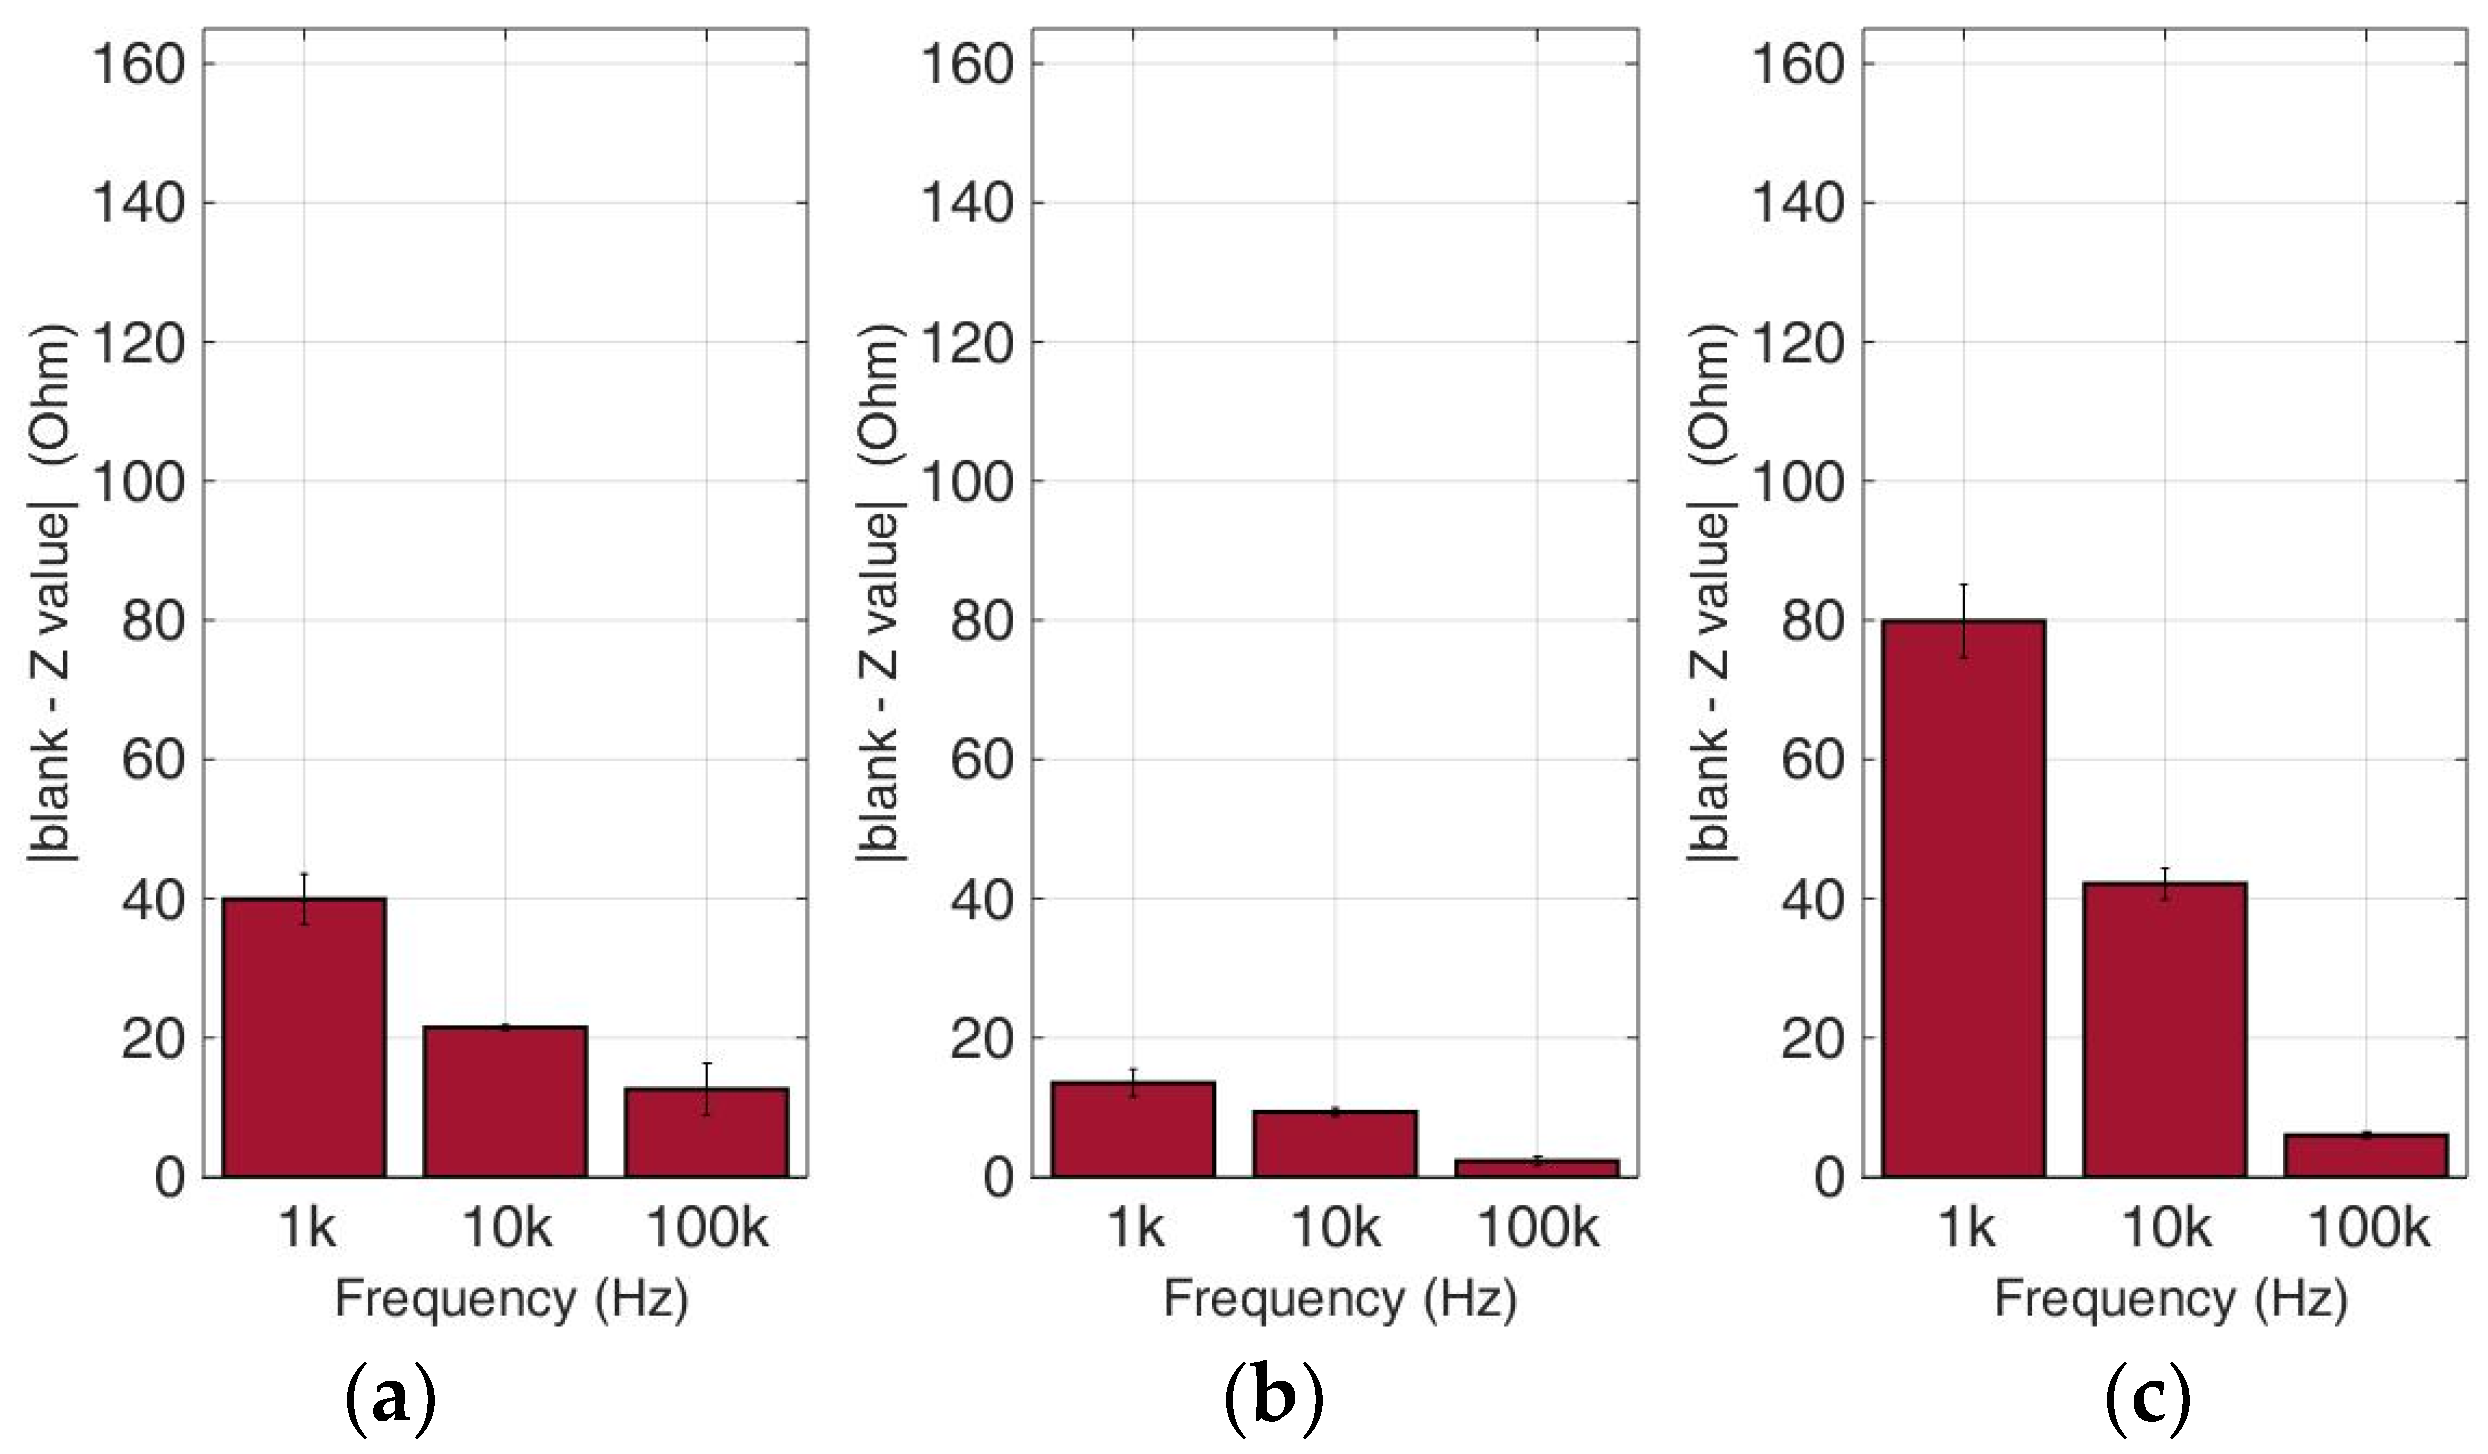
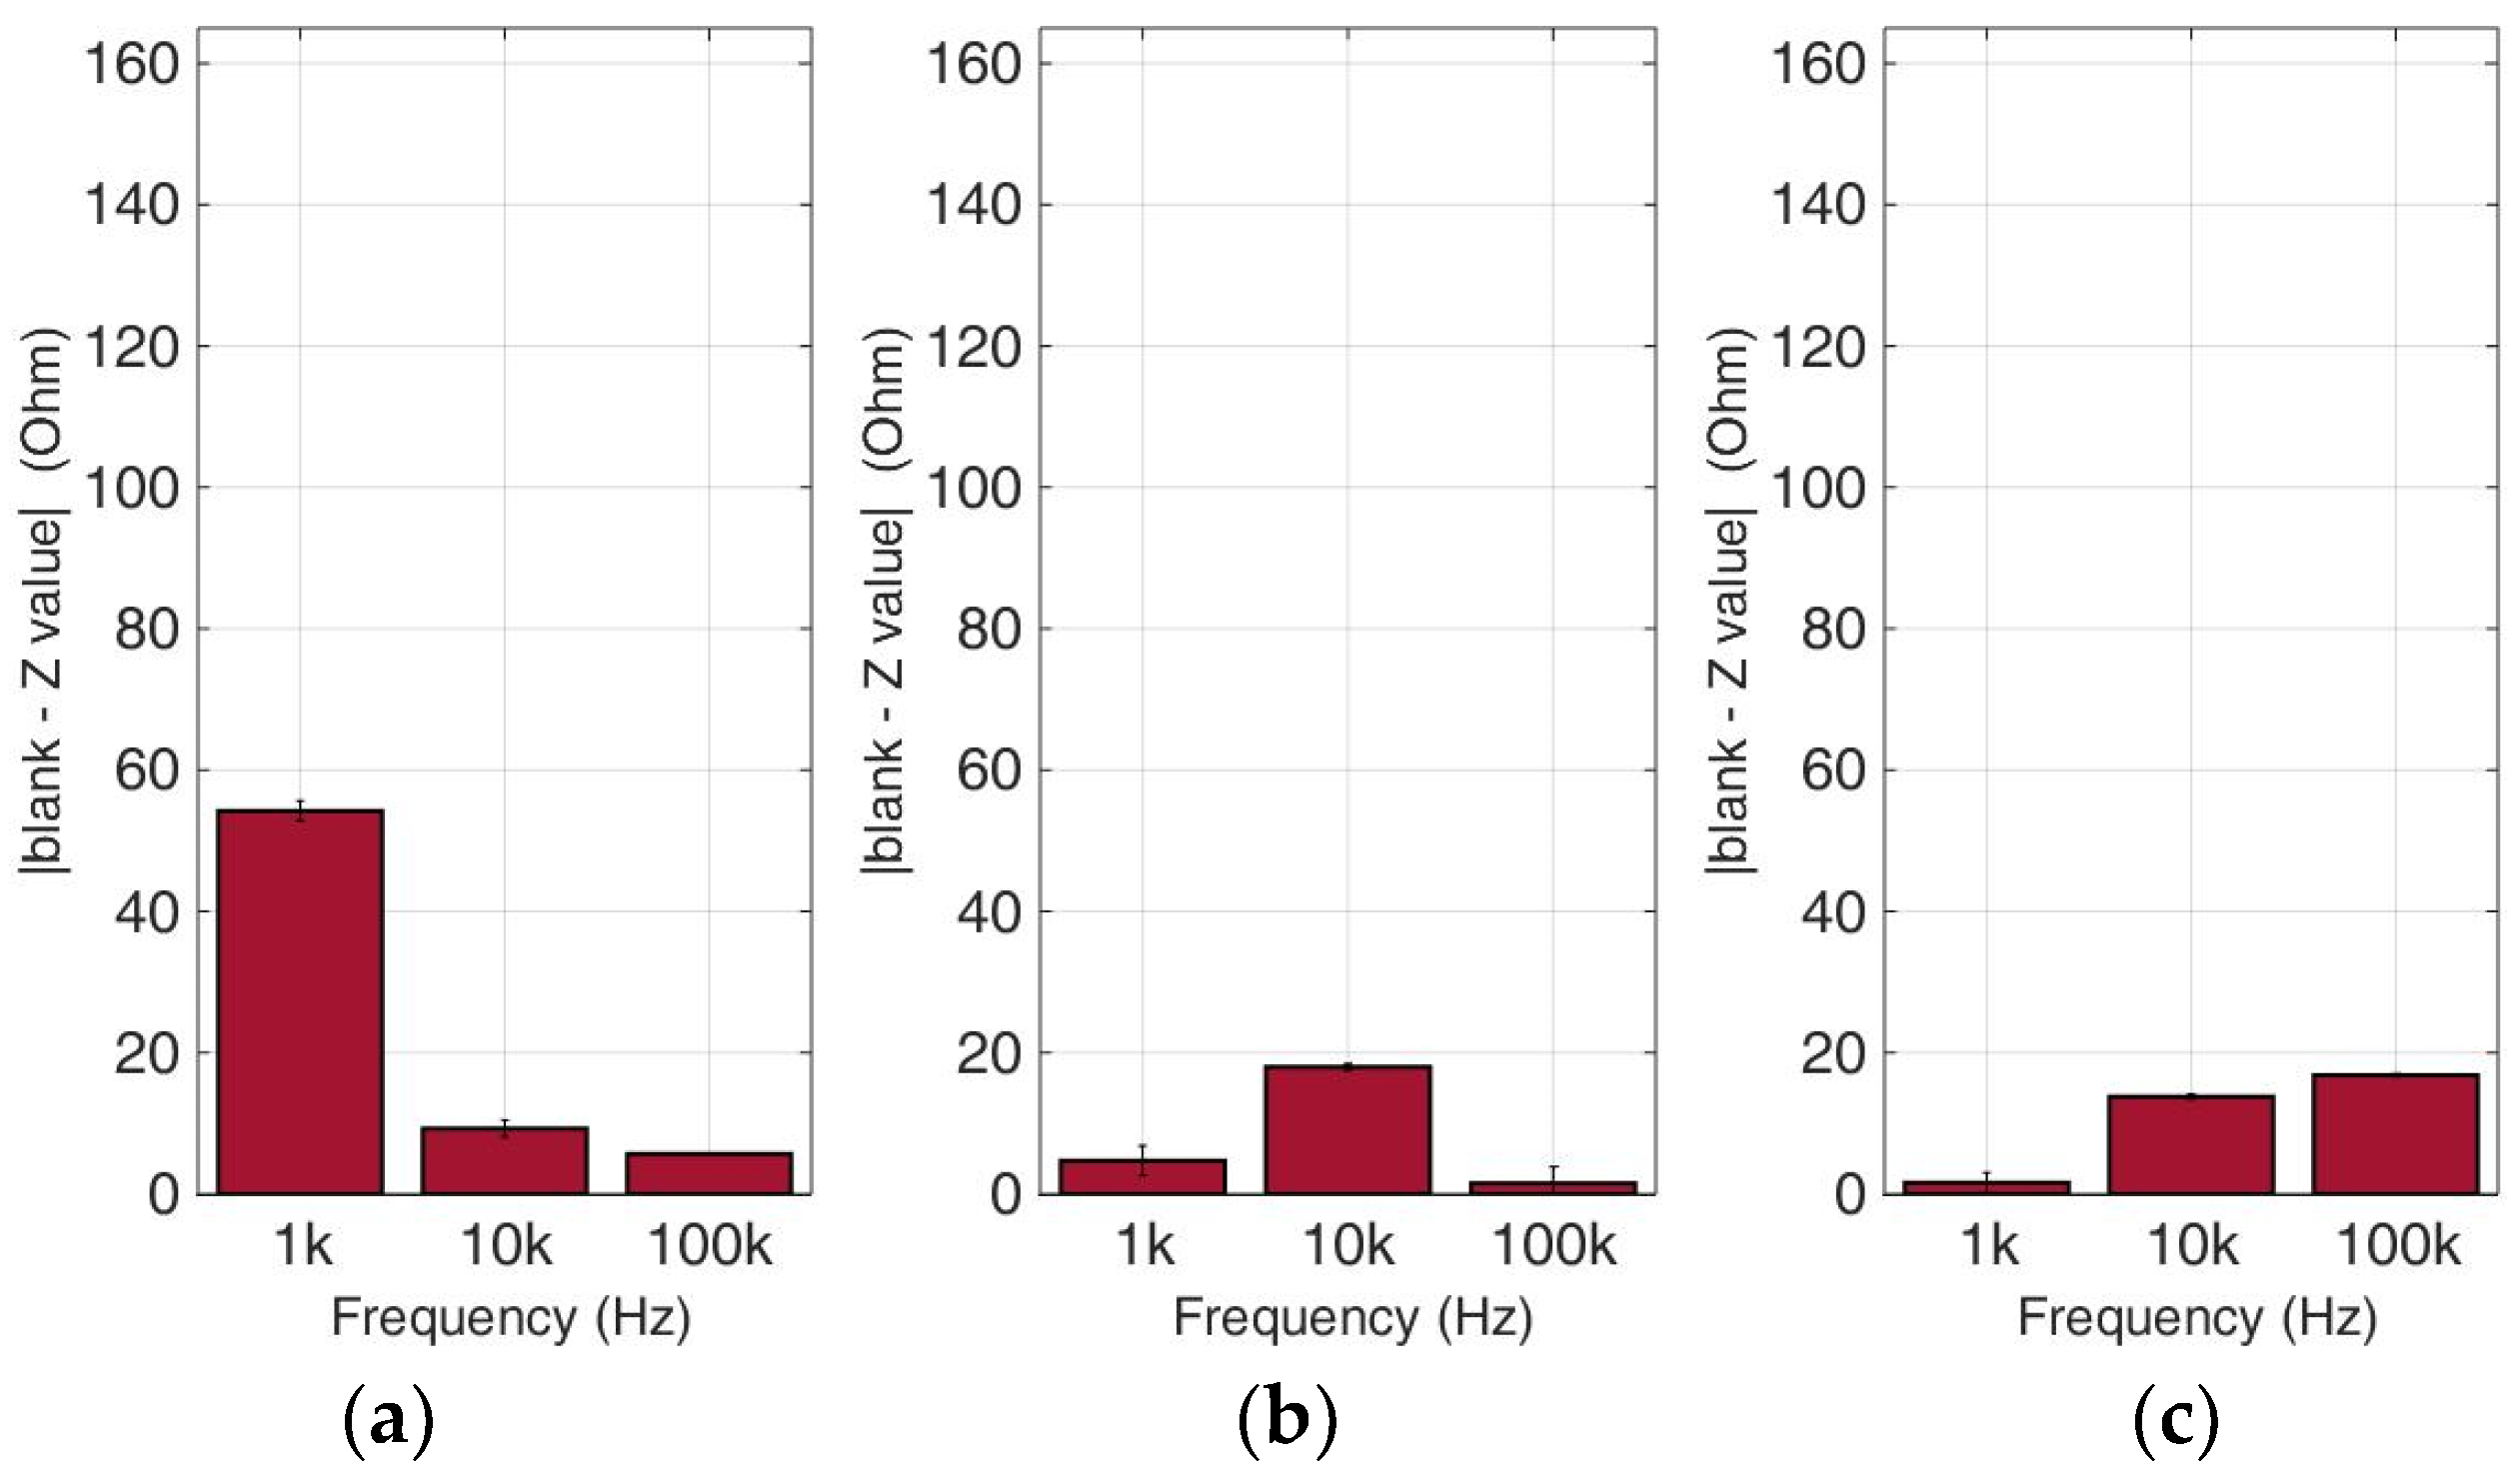
Figure 17.
Normalized values of the mean impedance magnitude for control immobilized MCF-7 cells (blue bars) and immobilized MCF-7 cells treated with 5-FU (yellow bars), tested at three different cell population densities ± STD: (a) 50,000; (b) 100,000 and (c) 200,000/100 μL for three different frequencies (1 KHz, 10 KHz, and 100 KHz).
Table 1.
5-FU concentrations added to each cell culture.
Table 1.
5-FU concentrations added to each cell culture.
| | SK-N-SH | HEK293 | HeLa | MCF-7 |
|---|
| 5-FU concentration (μΜ) | 7.5 | 20 | 150 | 150 |
Table 2.
Significant differences (Student’s T-test) between cell populations before and after treatment with 5-FU. **< 0.01, *** < 0.001.
Table 2.
Significant differences (Student’s T-test) between cell populations before and after treatment with 5-FU. **< 0.01, *** < 0.001.
| | 50,000 Cells | 100,000 Cells | 200,000 Cells |
|---|
| SK-N-SH | - | ** | - |
| HEK293 | - | ** | - |
| HeLa | - | *** | - |
| MCF-7 | - | - | - |
Table 3.
Significant differences (Student’s T-test) in cell viability between different cell lines X cell population densities before and after treatment with 5-FU. * < 0.05, **< 0.01, *** < 0.001.
Table 3.
Significant differences (Student’s T-test) in cell viability between different cell lines X cell population densities before and after treatment with 5-FU. * < 0.05, **< 0.01, *** < 0.001.
| | Cells | Cells Treated with 5-FU |
|---|
| | 50,000 Cells | 100,000 Cells | 200,000 Cells | 50,000 Cells | 100,000 Cells | 200,000 Cells |
|---|
| SK-N-SH–HEK293 | - | - | * | - | - | * |
| SK-N-SH–HeLa | - | - | ** | - | - | - |
| SK-N-SH–MCF-7 | - | * | *** | - | *** | * |
| HEK293–HeLa | - | * | - | - | ** | * |
| HEK293–MCF-7 | - | * | - | - | ** | - |
| HeLa–MCF-7 | - | ** | * | - | ** | * |
Table 4.
Significant differences (Student’s T-test) between population densities for the SK-N-SH cell line before and after treatment with 5-FU. **< 0.01, *** < 0.001.
Table 4.
Significant differences (Student’s T-test) between population densities for the SK-N-SH cell line before and after treatment with 5-FU. **< 0.01, *** < 0.001.
| | Cells | Cells Treated with 5-FU |
|---|
| | 1 KHz | 10 KHz | 100 KHz | 1 KHz | 10 KHz | 100 KHz |
|---|
| 50,000–100,000 | *** | *** | ** | ** | *** | *** |
| 50,000–200,000 | - | *** | - | *** | *** | *** |
| 100,000–200,000 | *** | *** | - | *** | ** | *** |
Table 5.
Significant differences (Student’s T-test) between population densities for HEK293 cell line before and after treatment with 5-FU. * < 0.05, **< 0.01, *** < 0.001.
Table 5.
Significant differences (Student’s T-test) between population densities for HEK293 cell line before and after treatment with 5-FU. * < 0.05, **< 0.01, *** < 0.001.
| | Cells | Cells Treated with 5-FU |
|---|
| | 1 KHz | 10 KHz | 100 KHz | 1 KHz | 10 KHz | 100 KHz |
|---|
| 50,000–100,000 | *** | *** | ** | *** | *** | ** |
| 50,000–200,000 | *** | *** | * | *** | - | ** |
| 100,000–200,000 | *** | *** | *** | *** | * | ** |
Table 6.
Significant differences (Student’s T-test) between population densities for HeLa cell line before and after treatment with 5-FU. * < 0.05, **< 0.01, *** < 0.001.
Table 6.
Significant differences (Student’s T-test) between population densities for HeLa cell line before and after treatment with 5-FU. * < 0.05, **< 0.01, *** < 0.001.
| | Cells | Cells Treated with 5-FU |
|---|
| | 1 KHz | 10 KHz | 100 KHz | 1 KHz | 10 KHz | 100 KHz |
|---|
| 50,000–100,000 | *** | *** | * | *** | *** | ** |
| 50,000–200,000 | *** | ** | *** | - | *** | *** |
| 100,000–200,000 | * | *** | *** | *** | *** | *** |
Table 7.
Significant differences (Student’s T-test) between population densities for MCF-7 cell line before and after treatment with 5-FU. * < 0.05, **< 0.01, *** < 0.001.
Table 7.
Significant differences (Student’s T-test) between population densities for MCF-7 cell line before and after treatment with 5-FU. * < 0.05, **< 0.01, *** < 0.001.
| | Cells | Cells Treated with 5-FU |
|---|
| | 1 KHz | 10 KHz | 100 KHz | 1 KHz | 10 KHz | 100 KHz |
|---|
| 50,000–100,000 | - | *** | ** | *** | *** | *** |
| 50,000–200,000 | ** | *** | *** | *** | *** | *** |
| 100,000–200,000 | * | *** | * | *** | *** | ** |


