
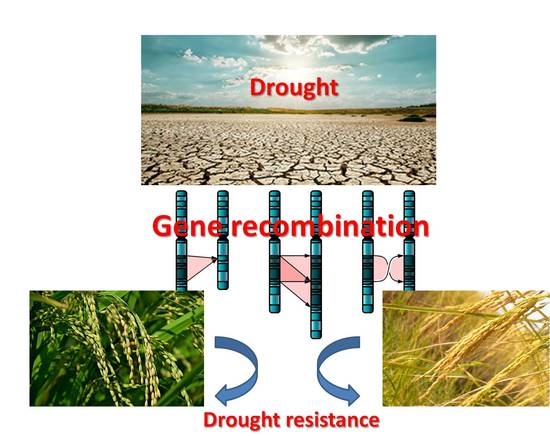
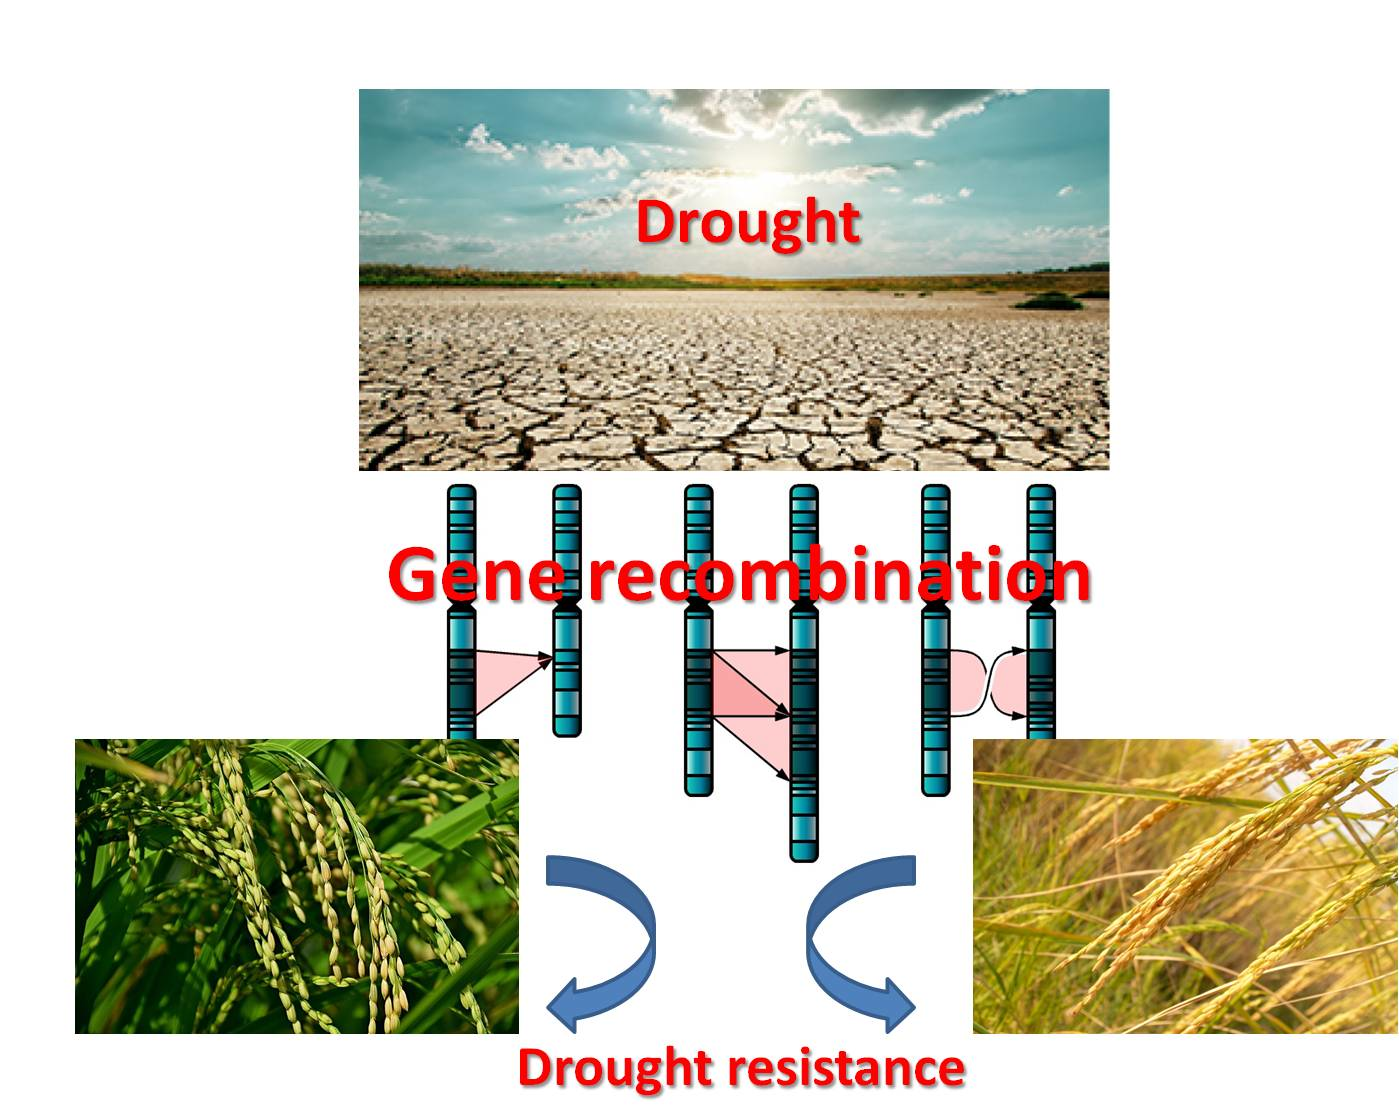
Drought Resistance Loci in Recombinant Lines of Iranian Oryza sativa L. in Germination Stage

 ,
,  ,
, 
Abstract
:
1. Introduction
2. Materials and Methods
2.1. Phenotypic Evaluations
2.2. Genotypic Evaluations
2.3. QTL Linkage and Analysis Map
3. Results
4. Discussion
5. Conclusions
Author Contributions
Funding
Institutional Review Board Statement
Informed Consent Statement
Data Availability Statement
Conflicts of Interest
References
- Kumar, A.; Memo, M.; Mastinu, A. Plant behaviour: An evolutionary response to the environment? Plant. Biol. 2020, 22, 961–970. [Google Scholar] [CrossRef]
- Rad, S.V.; Valadabadi, S.A.R.; Pouryousef, M.; Saifzadeh, S.; Zakrin, H.R.; Mastinu, A. Quantitative and Qualitative Evaluation of Sorghum bicolor L. under Intercropping with Legumes and Different Weed Control Methods. Horticulturae 2020, 6, 78. [Google Scholar] [CrossRef]
- Reza Yousefi, A.; Rashidi, S.; Moradi, P.; Mastinu, A. Germination and Seedling Growth Responses of Zygophyllum fabago, Salsola kali L. and Atriplex canescens to PEG-Induced Drought Stress. Environments 2020, 7, 107. [Google Scholar] [CrossRef]
- Zangani, E.; Afsahi, K.; Shekari, F.; Mac Sweeney, E.; Mastinu, A. Nitrogen and Phosphorus Addition to Soil Improves Seed Yield, Foliar Stomatal Conductance, and the Photosynthetic Response of Rapeseed (Brassica napus L.). Agriculture 2021, 11, 483. [Google Scholar] [CrossRef]
- Mardani, Z.; Rabiei, B.; Sabouri, H.; Sabouri, A. Mapping of QTLs for Germination Characteristics under Non-stress and Drought Stress in Rice. Rice Sci. 2013, 20, 391–399. [Google Scholar] [CrossRef]
- Kulkarni, S.R.; Balachandran, S.M.; Ulaganathan, K.; Balakrishnan, D.; Praveen, M.; Prasad, A.S.H.; Fiyaz, R.A.; Senguttuvel, P.; Sinha, P.; Kale, R.R.; et al. Molecular mapping of QTLs for yield related traits in recombinant inbred line (RIL) population derived from the popular rice hybrid KRH-2 and their validation through SNP genotyping. Sci. Rep. 2020, 10, 1–21. [Google Scholar] [CrossRef] [PubMed]
- Aghajanlou, F.; Mirdavoudi, H.; Shojaee, M.; Mac Sweeney, E.; Mastinu, A.; Moradi, P. Rangeland Management and Ecological Adaptation Analysis Model for Astragalus curvirostris Boiss. Horticulturae 2021, 7, 67. [Google Scholar] [CrossRef]
- Karimmojeni, H.; Rahimian, H.; Alizadeh, H.; Yousefi, A.R.; Gonzalez-Andujar, J.L.; Mac Sweeney, E.; Mastinu, A. Competitive Ability Effects of Datura stramonium L. and Xanthium strumarium L. on the Development of Maize (Zea mays) Seeds. Plants 2021, 10, 1922. [Google Scholar] [CrossRef] [PubMed]
- Mahdavi, A.; Moradi, P.; Mastinu, A. Variation in Terpene Profiles of Thymus vulgaris in Water Deficit Stress Response. Molecules 2020, 25, 1091. [Google Scholar] [CrossRef] [Green Version]
- Moradi, P.; Aghajanloo, F.; Moosavi, A.; Monfared, H.H.; Khalafi, J.; Taghiloo, M.; Khoshzaman, T.; Shojaee, M.; Mastinu, A. Anthropic Effects on the Biodiversity of the Habitats of Ferula gummosa. Sustainability 2021, 13, 7874. [Google Scholar] [CrossRef]
- Naservafaei, S.; Sohrabi, Y.; Moradi, P.; Mac Sweeney, E.; Mastinu, A. Biological Response of Lallemantia iberica to Brassinolide Treatment under Different Watering Conditions. Plants 2021, 10, 496. [Google Scholar] [CrossRef]
- Kim, Y.; Chung, Y.S.; Lee, E.; Tripathi, P.; Heo, S.; Kim, K.H. Root Response to Drought Stress in Rice (Oryza sativa L.). Int. J. Mol. Sci. 2020, 21, 1513. [Google Scholar] [CrossRef] [PubMed] [Green Version]
- Gupta, A.K.; Dhua, S.; Sahu, P.P.; Abate, G.; Mishra, P.; Mastinu, A. Variation in Phytochemical, Antioxidant and Volatile Composition of Pomelo Fruit (Citrus grandis (L.) Osbeck) during Seasonal Growth and Development. Plants 2021, 10, 1941. [Google Scholar] [CrossRef]
- Khush, G.S. What it will take to Feed 5.0 Billion Rice consumers in 2030. Plant Mol. Biol. 2005, 59, 1–6. [Google Scholar] [CrossRef]
- Mastinu, A.; Bonini, S.A.; Rungratanawanich, W.; Aria, F.; Marziano, M.; Maccarinelli, G.; Abate, G.; Premoli, M.; Memo, M.; Uberti, D. Gamma-oryzanol Prevents LPS-induced Brain Inflammation and Cognitive Impairment in Adult Mice. Nutrients 2019, 11, 728. [Google Scholar] [CrossRef] [Green Version]
- Rungratanawanich, W.; Cenini, G.; Mastinu, A.; Sylvester, M.; Wilkening, A.; Abate, G.; Bonini, S.A.; Aria, F.; Marziano, M.; Maccarinelli, G.; et al. gamma-Oryzanol Improves Cognitive Function and Modulates Hippocampal Proteome in Mice. Nutrients 2019, 11, 753. [Google Scholar] [CrossRef] [Green Version]
- Kang, H.; Sridhar, V.; Mainuddin, M.; Trung, L.D. Future rice farming threatened by drought in the Lower Mekong Basin. Sci. Rep. 2021, 11, 9383. [Google Scholar] [CrossRef] [PubMed]
- Pandey, V.; Shukla, A. Acclimation and Tolerance Strategies of Rice under Drought Stress. Rice Sci. 2015, 22, 147–161. [Google Scholar] [CrossRef] [Green Version]
- Baisakh, N.; Yabes, J.; Gutierrez, A.; Mangu, V.; Ma, P.; Famoso, A.; Pereira, A. Genetic Mapping Identifies Consistent Quantitative Trait Loci for Yield Traits of Rice under Greenhouse Drought Conditions. Genes 2020, 11, 62. [Google Scholar] [CrossRef] [Green Version]
- Abate, G.; Zhang, L.L.; Pucci, M.; Morbini, G.; Mac Sweeney, E.; Maccarinelli, G.; Ribaudo, G.; Gianoncelli, A.; Uberti, D.; Memo, M.; et al. Phytochemical Analysis and Anti-Inflammatory Activity of Different Ethanolic Phyto-Extracts of Artemisia annua L. Biomolecules 2021, 11, 975. [Google Scholar] [CrossRef]
- Coleman, C.E.; Yuan, X.; Wen, B. Seed germination response to high temperature and water stress in three invasive Asteraceae weeds from Xishuangbanna, SW China. PLoS ONE 2018, 13, e0191710. [Google Scholar] [CrossRef] [Green Version]
- Guo, T.; Yang, J.; Li, D.; Sun, K.; Luo, L.; Xiao, W.; Wang, J.; Liu, Y.; Wang, S.; Wang, H.; et al. Integrating GWAS, QTL, mapping and RNA-seq to identify candidate genes for seed vigor in rice (Oryza sativa L.). Mol. Breed. 2019, 39, 87. [Google Scholar] [CrossRef]
- Mastinu, A.; Bonini, S.A.; Premoli, M.; Maccarinelli, G.; Mac Sweeney, E.; Zhang, L.L.; Lucini, L.; Memo, M. Protective Effects of Gynostemma pentaphyllum (var. Ginpent) against Lipopolysaccharide-Induced Inflammation and Motor Alteration in Mice. Molecules 2021, 26, 570. [Google Scholar] [CrossRef]
- Henry, A.; Wehler, R.; Grondin, A.; Franke, R.; Quintana, M. Environmental and physiological effects on grouping of drought-tolerant and susceptible rice varieties related to rice (Oryza sativa) root hydraulics under drought. Ann. Bot. 2016, 118, 711–724. [Google Scholar] [CrossRef] [Green Version]
- Zaman, N.K.; Abdullah, M.Y.; Othman, S.; Zaman, N.K. Growth and Physiological Performance of Aerobic and Lowland Rice as Affected by Water Stress at Selected Growth Stages. Rice Sci. 2018, 25, 82–93. [Google Scholar] [CrossRef]
- Vassilevska-Ivanova, R.; Shtereva, L.; Kraptchev, B.; Karceva, T. Response of sunflower (Helianthus annuus L) genotypes to PEG-mediated water stress. Open Life Sci. 2014, 9, 1206–1214. [Google Scholar] [CrossRef] [Green Version]
- Verma, H.; Borah, J.L.; Sarma, R.N. Variability Assessment for Root and Drought Tolerance Traits and Genetic Diversity Analysis of Rice Germplasm using SSR Markers. Sci. Rep. 2019, 9, 16513. [Google Scholar] [CrossRef] [PubMed] [Green Version]
- Sabouri, A.; Toorchi, M.; Rabiei, B.; Aharizad, S.; Moumeni, A.; Singh, R. Identification and mapping of QTLs for agronomic traits inindica—indicacross of rice (Oryza sativa L.). Cereal Res. Commun. 2010, 38, 317–326. [Google Scholar] [CrossRef]
- Bunnag, S.; Pongthai, P. Selection of Rice (Oryza sativa L.) Cultivars Tolerant to Drought Stress at the Vegetative Stage under Field Conditions. Am. J. Plant Sci. 2013, 4, 1701–1708. [Google Scholar] [CrossRef] [Green Version]
- MacMillan, K.; Emrich, K.; Piepho, H.P.; Mullins, C.E.; Price, A.H. Assessing the importance of genotype x environment interaction for root traits in rice using a mapping population II: Conventional QTL analysis. TAG. Theor. Appl. Genetics. Theor. Und Angew. Genet. 2006, 113, 953–964. [Google Scholar] [CrossRef] [PubMed]
- Wang, Z.; Wang, J.; Bao, Y.; Wu, Y.; Zhang, H. Quantitative trait loci controlling rice seed germination under salt stress. Euphytica 2010, 178, 297–307. [Google Scholar] [CrossRef]
- Lamaoui, M.; Jemo, M.; Datla, R.; Bekkaoui, F. Heat and Drought Stresses in Crops and Approaches for Their Mitigation. Front. Chem. 2018, 6. [Google Scholar] [CrossRef] [PubMed]
- Kirigwi, F.M.; Van Ginkel, M.; Brown-Guedira, G.; Gill, B.S.; Paulsen, G.M.; Fritz, A.K. Markers associated with a QTL for grain yield in wheat under drought. Mol. Breed. 2007, 20, 401–413. [Google Scholar] [CrossRef]
- Pinto, R.S.; Reynolds, M.P.; Mathews, K.L.; McIntyre, C.L.; Olivares-Villegas, J.-J.; Chapman, S.C. Heat and drought adaptive QTL in a wheat population designed to minimize confounding agronomic effects. Theor. Appl. Genet. 2010, 121, 1001–1021. [Google Scholar] [CrossRef] [PubMed] [Green Version]
- Gill, S.S.; Tuteja, N. Reactive oxygen species and antioxidant machinery in abiotic stress tolerance in crop plants. Plant Physiol. Biochem. 2010, 48, 909–930. [Google Scholar] [CrossRef]
- Kadam, S.; Singh, K.; Shukla, S.; Goel, S.; Vikram, P.; Pawar, V.; Gaikwad, K.; Khanna-Chopra, R.; Singh, N. Genomic associations for drought tolerance on the short arm of wheat chromosome 4B. Funct. Integr. Genom. 2012, 12, 447–464. [Google Scholar] [CrossRef]
- Michel, B.E.; Kaufmann, M.R. The Osmotic Potential of Polyethylene Glycol 6000. Plant Physiol. 1973, 51, 914–916. [Google Scholar] [CrossRef] [PubMed]
- Joshi, R.; Shukla, A.; Sairam, R.K. In vitro screening of rice genotypes for drought tolerance using polyethylene glycol. Acta Physiol. Plant. 2011, 33, 2209–2217. [Google Scholar] [CrossRef]
- Temnykh, S.; Park, W.D.; Ayres, N.; Cartinhour, S.; Hauck, N.; Lipovich, L.; Cho, Y.G.; Ishii, T.; McCouch, S.R. Mapping and genome organization of microsatellite sequences in rice (Oryza sativa L.). Theor. Appl. Genet. 2000, 100, 697–712. [Google Scholar] [CrossRef]
- Chen, H.; An, R.; Tang, J.-H.; Cui, X.-H.; Hao, F.-S.; Chen, J.; Wang, X.-C. Over-expression of a vacuolar Na+/H+ antiporter gene improves salt tolerance in an upland rice. Mol. Breed. 2007, 19, 215–225. [Google Scholar] [CrossRef]
- McCouch, S.R.; Teytelman, L.; Xu, Y.; Lobos, K.B.; Clare, K.; Walton, M.; Fu, B.; Maghirang, R.; Li, Z.; Xing, Y.; et al. Development and mapping of 2240 new SSR markers for rice (Oryza sativa L.). DNA Res. Int. J. Rapid Publ. Rep. Genes Genomes 2002, 9, 199–207. [Google Scholar] [CrossRef]
- Manly, K.F.; Olson, J.M. Overview of QTL mapping software and introduction to map manager QT. Mamm. Genome Off. J. Int. Mamm. Genome Soc. 1999, 10, 327–334. [Google Scholar] [CrossRef]
- Tian, R.; Jiang, G.-H.; Shen, L.-H.; Wang, L.-Q.; He, Y.-Q. Mapping quantitative trait loci underlying the cooking and eating quality of rice using a DH population. Mol. Breed. 2005, 15, 117–124. [Google Scholar] [CrossRef]
- Woźnicka, A.; Melosik, I.; Morozowska, M. Quantitative and qualitative differences in morphological traits of endocarps revealed between Cornus L. species. Plant Syst. Evol. 2014, 301, 291–308. [Google Scholar] [CrossRef] [Green Version]
- Lander, E.S.; Botstein, D. Mapping mendelian factors underlying quantitative traits using RFLP linkage maps. Genetics 1989, 121, 185–199. [Google Scholar] [CrossRef]
- Zhang, Z.H.; Qu, X.S.; Wan, S.; Chen, L.H.; Zhu, Y.G. Comparison of QTL controlling seedling vigour under different temperature conditions using recombinant inbred lines in rice (Oryza sativa). Ann. Bot. 2005, 95, 423–429. [Google Scholar] [CrossRef] [Green Version]
- Abler, B.S.B.; Edwards, M.D.; Stuber, C.W. Isoenzymatic Identification of Quantitative Trait Loci in Crosses of Elite Maize Inbreds. Crop Sci. 1991, 31, 267–274. [Google Scholar] [CrossRef]
- Paterson, A.H.; Wing, R.A. Genome mapping in plants. Curr. Opin. Biotechnol. 1993, 4, 142–147. [Google Scholar] [CrossRef]
- Veldboom, L.R.; Lee, M.; Woodman, W.L. Molecular marker-facilitated studies in an elite maize population: I. Linkage analysis and determination of QTL for morphological traits. Theor. Appl. Genet. 1994, 88, 7–16. [Google Scholar] [CrossRef]
- Hu, S.-P.; Yang, H.; Zou, G.-H.; Liu, H.-Y.; Liu, G.-L.; Mei, H.-W.; Cai, R.; Li, M.-S.; Luo, L.-J. Relationship Between Coleoptile Length and Drought Resistance and Their QTL Mapping in Rice. Rice Sci. 2007, 14, 13–20. [Google Scholar] [CrossRef]
- Najeeb, S.; Ali, J.; Mahender, A.; Pang, Y.L.; Zilhas, J.; Murugaiyan, V.; Vemireddy, L.R.; Li, Z. Identification of main-effect quantitative trait loci (QTLs) for low-temperature stress tolerance germination- and early seedling vigor-related traits in rice (Oryza sativa L.). Mol. Breed. New Strateg. Plant Improv. 2020, 40, 10. [Google Scholar] [CrossRef] [PubMed] [Green Version]
- Jain, M.; Tyagi, A.K.; Khurana, J.P. Constitutive expression of a meiotic recombination protein gene homolog, OsTOP6A1, from rice confers abiotic stress tolerance in transgenic Arabidopsis plants. Plant Cell Rep. 2008, 27, 767–778. [Google Scholar] [CrossRef]
- Liu, C.; Chen, K.; Zhao, X.; Wang, X.; Shen, C.; Zhu, Y.; Dai, M.; Qiu, X.; Yang, R.; Xing, D.; et al. Identification of genes for salt tolerance and yield-related traits in rice plants grown hydroponically and under saline field conditions by genome-wide association study. Rice 2019, 12, 88. [Google Scholar] [CrossRef]
- Teng, S.; Zeng, D.; Qian, Q.; Kunihifo, Y.; Huang, D.; Zhu, L. QTL analysis of rice low temperature germinability. Chin. Sci. Bull. 2001, 46, 1800–1803. [Google Scholar] [CrossRef]
- Lilley, J.M.; Fukai, S. Effect of timing and severity of water deficit on four diverse rice cultivars II. Physiological responses to soil water deficit. Field Crop. Res. 1994, 37, 215–223. [Google Scholar] [CrossRef]
- Kato, Y.; Kamoshita, A.; Yamagishi, J.; Imoto, H.; Abe, J. Growth of Rice (Oryza Sativa L.) Cultivars Under Upland Conditions with Different Levels of Water Supply3. Root System Development, Soil Moisture Changeand Plant Water Status. Plant Prod. Sci. 2015, 10, 3–13. [Google Scholar] [CrossRef] [Green Version]
- Horii, H.; Nemoto, K.; Miyamoto, N.; Harada, J. Quantitative trait loci for adventitious and lateral roots in rice. Plant Breed. 2006, 125, 198–200. [Google Scholar] [CrossRef]
- Srividhya, A.; Vemireddy, L.R.; Sridhar, S.; Jayaprada, M.; Ramanarao, P.V.; Hariprasad, A.S.; Reddy, H.K.; Anuradha, G.; Siddiq, E. Molecular mapping of QTLs for yield and its components under two water supply conditions in rice (Oryza sativa L.). J. Crop. Sci. Biotechnol. 2011, 14, 45–56. [Google Scholar] [CrossRef]
- Kamoshita, A.; Zhang, J.; Siopongco, J.; Sarkarung, S.; Nguyen, H.T.; Wade, L.J. Effects of Phenotyping Environment on Identification of Quantitative Trait Loci for Rice Root Morphology under Anaerobic Conditions. Crop Sci. 2002, 42, 255–265. [Google Scholar] [CrossRef]
- Khaleghnezhad, V.; Yousefi, A.R.; Tavakoli, A.; Farajmand, B.; Mastinu, A. Concentrations-dependent effect of exogenous abscisic acid on photosynthesis, growth and phenolic content of Dracocephalum moldavica L. under drought stress. Planta 2021, 253, 127. [Google Scholar] [CrossRef]


| Source of Variation | Freedom Degree | Means of Square | |||
|---|---|---|---|---|---|
| Germination Percentage (%) | Coleoptile Length (cm) | Radicle Dry Weight (g) | Plumule Dry Weight (g) | ||
| Normal | |||||
| Genotype | 119 | 6.860 ** | 1.690 ** | 36.919 ** | 22.422 ** |
| Error | 240 | 2.394 | 0.244 | 0.299 | 0.249 |
| Coefficient of variation | 1.586 | 11.306 | 5.377 | 5.782 | |
| −4.5 bar stress | |||||
| Genotype | 119 | 262.698 ** | 0.362 ** | 6.517 ** | 5.347 ** |
| Error | 240 | 45.111 | 0.198 | 1.418 | 0.692 |
| Coefficient of variation | 9.403 | 29.925 | 23.350 | 22.567 | |
| −9.0 bar stress | |||||
| Genotype | 119 | 131.387 ** | 0.368 ** | 12.510 ** | 6.444 ** |
| Error | 240 | 24.844 | 0.012 | 0.120 | 0.097 |
| Coefficient of variation | 6.969 | 8.488 | 10.402 | 10.285 | |
| Stress | Dependent Variable | Variable Entered the Model | B | Beta | SE | F | R2 |
|---|---|---|---|---|---|---|---|
| No stress | percentage of germination | coleoptile length | 99.290 | −0.198 | 0.182 | 4.792 | 0.039 |
| −4.5 bar | percentage of germination | plumule weight | 4.009 | 0.572 | 0.529 | 57.349 | 0.327 |
| −9.0 bar | percentage of germination | plumule weight | 2.356 | 0.522 | 0.354 | 44.189 | 0.272 |
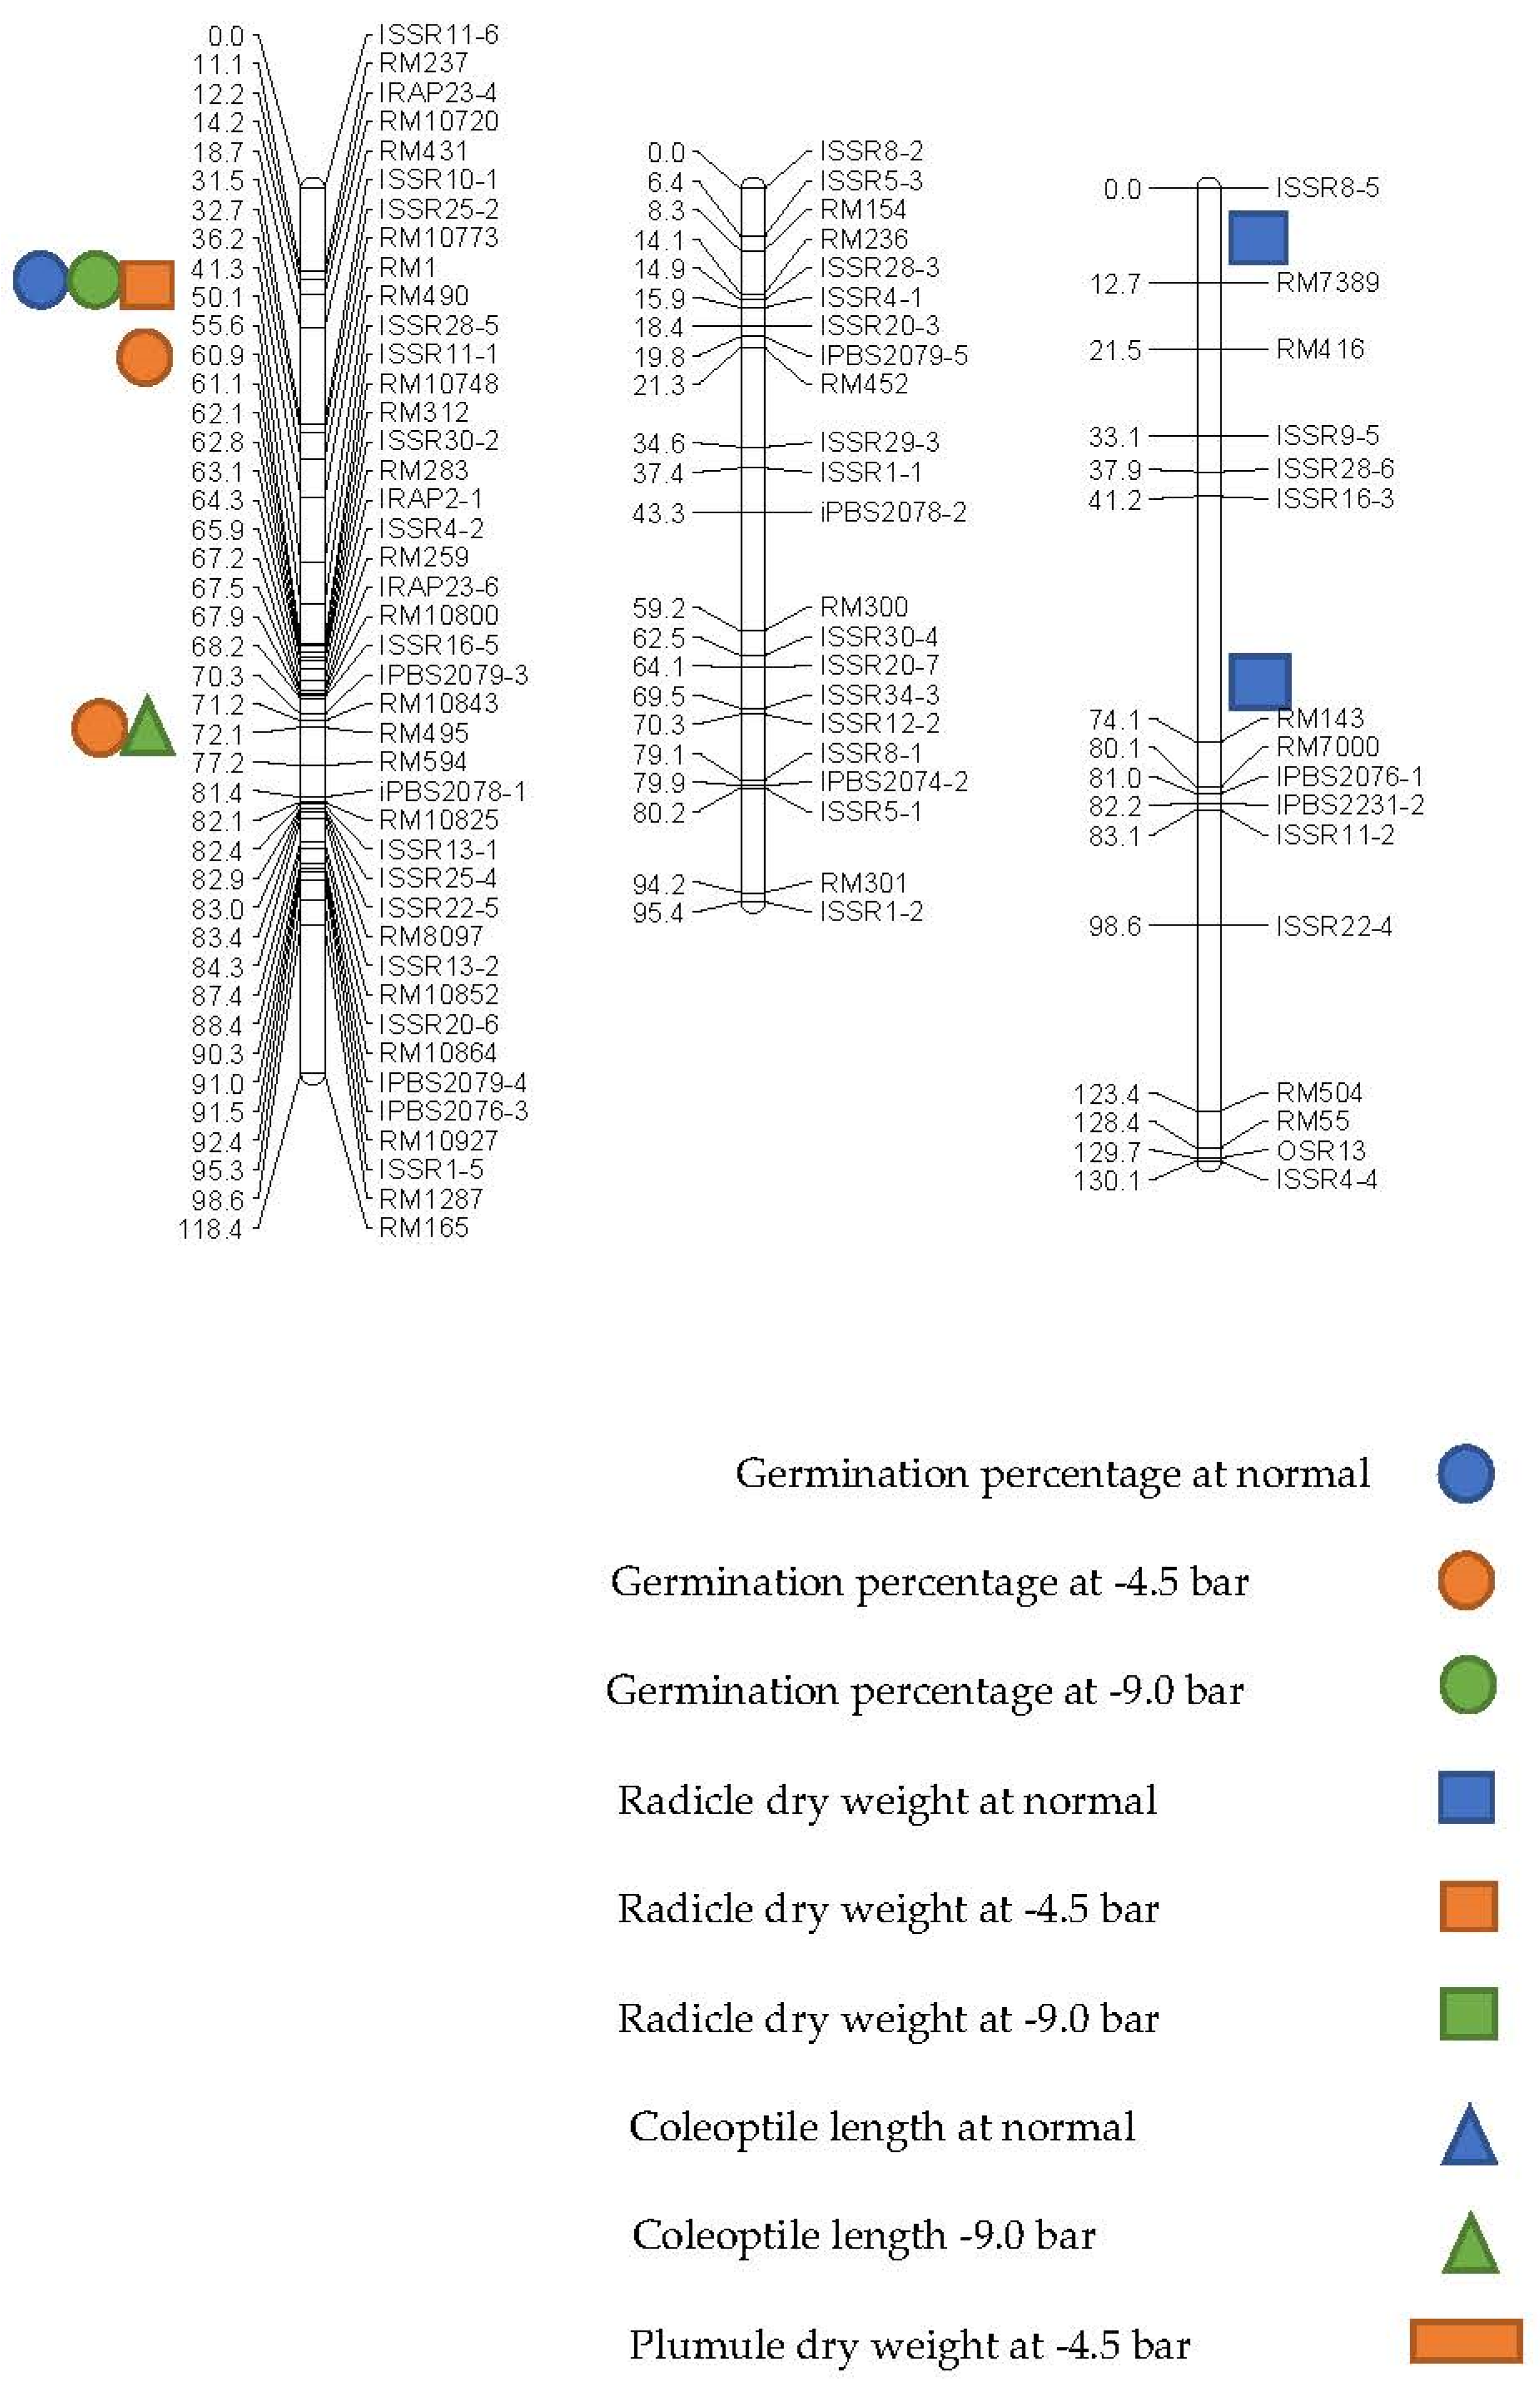
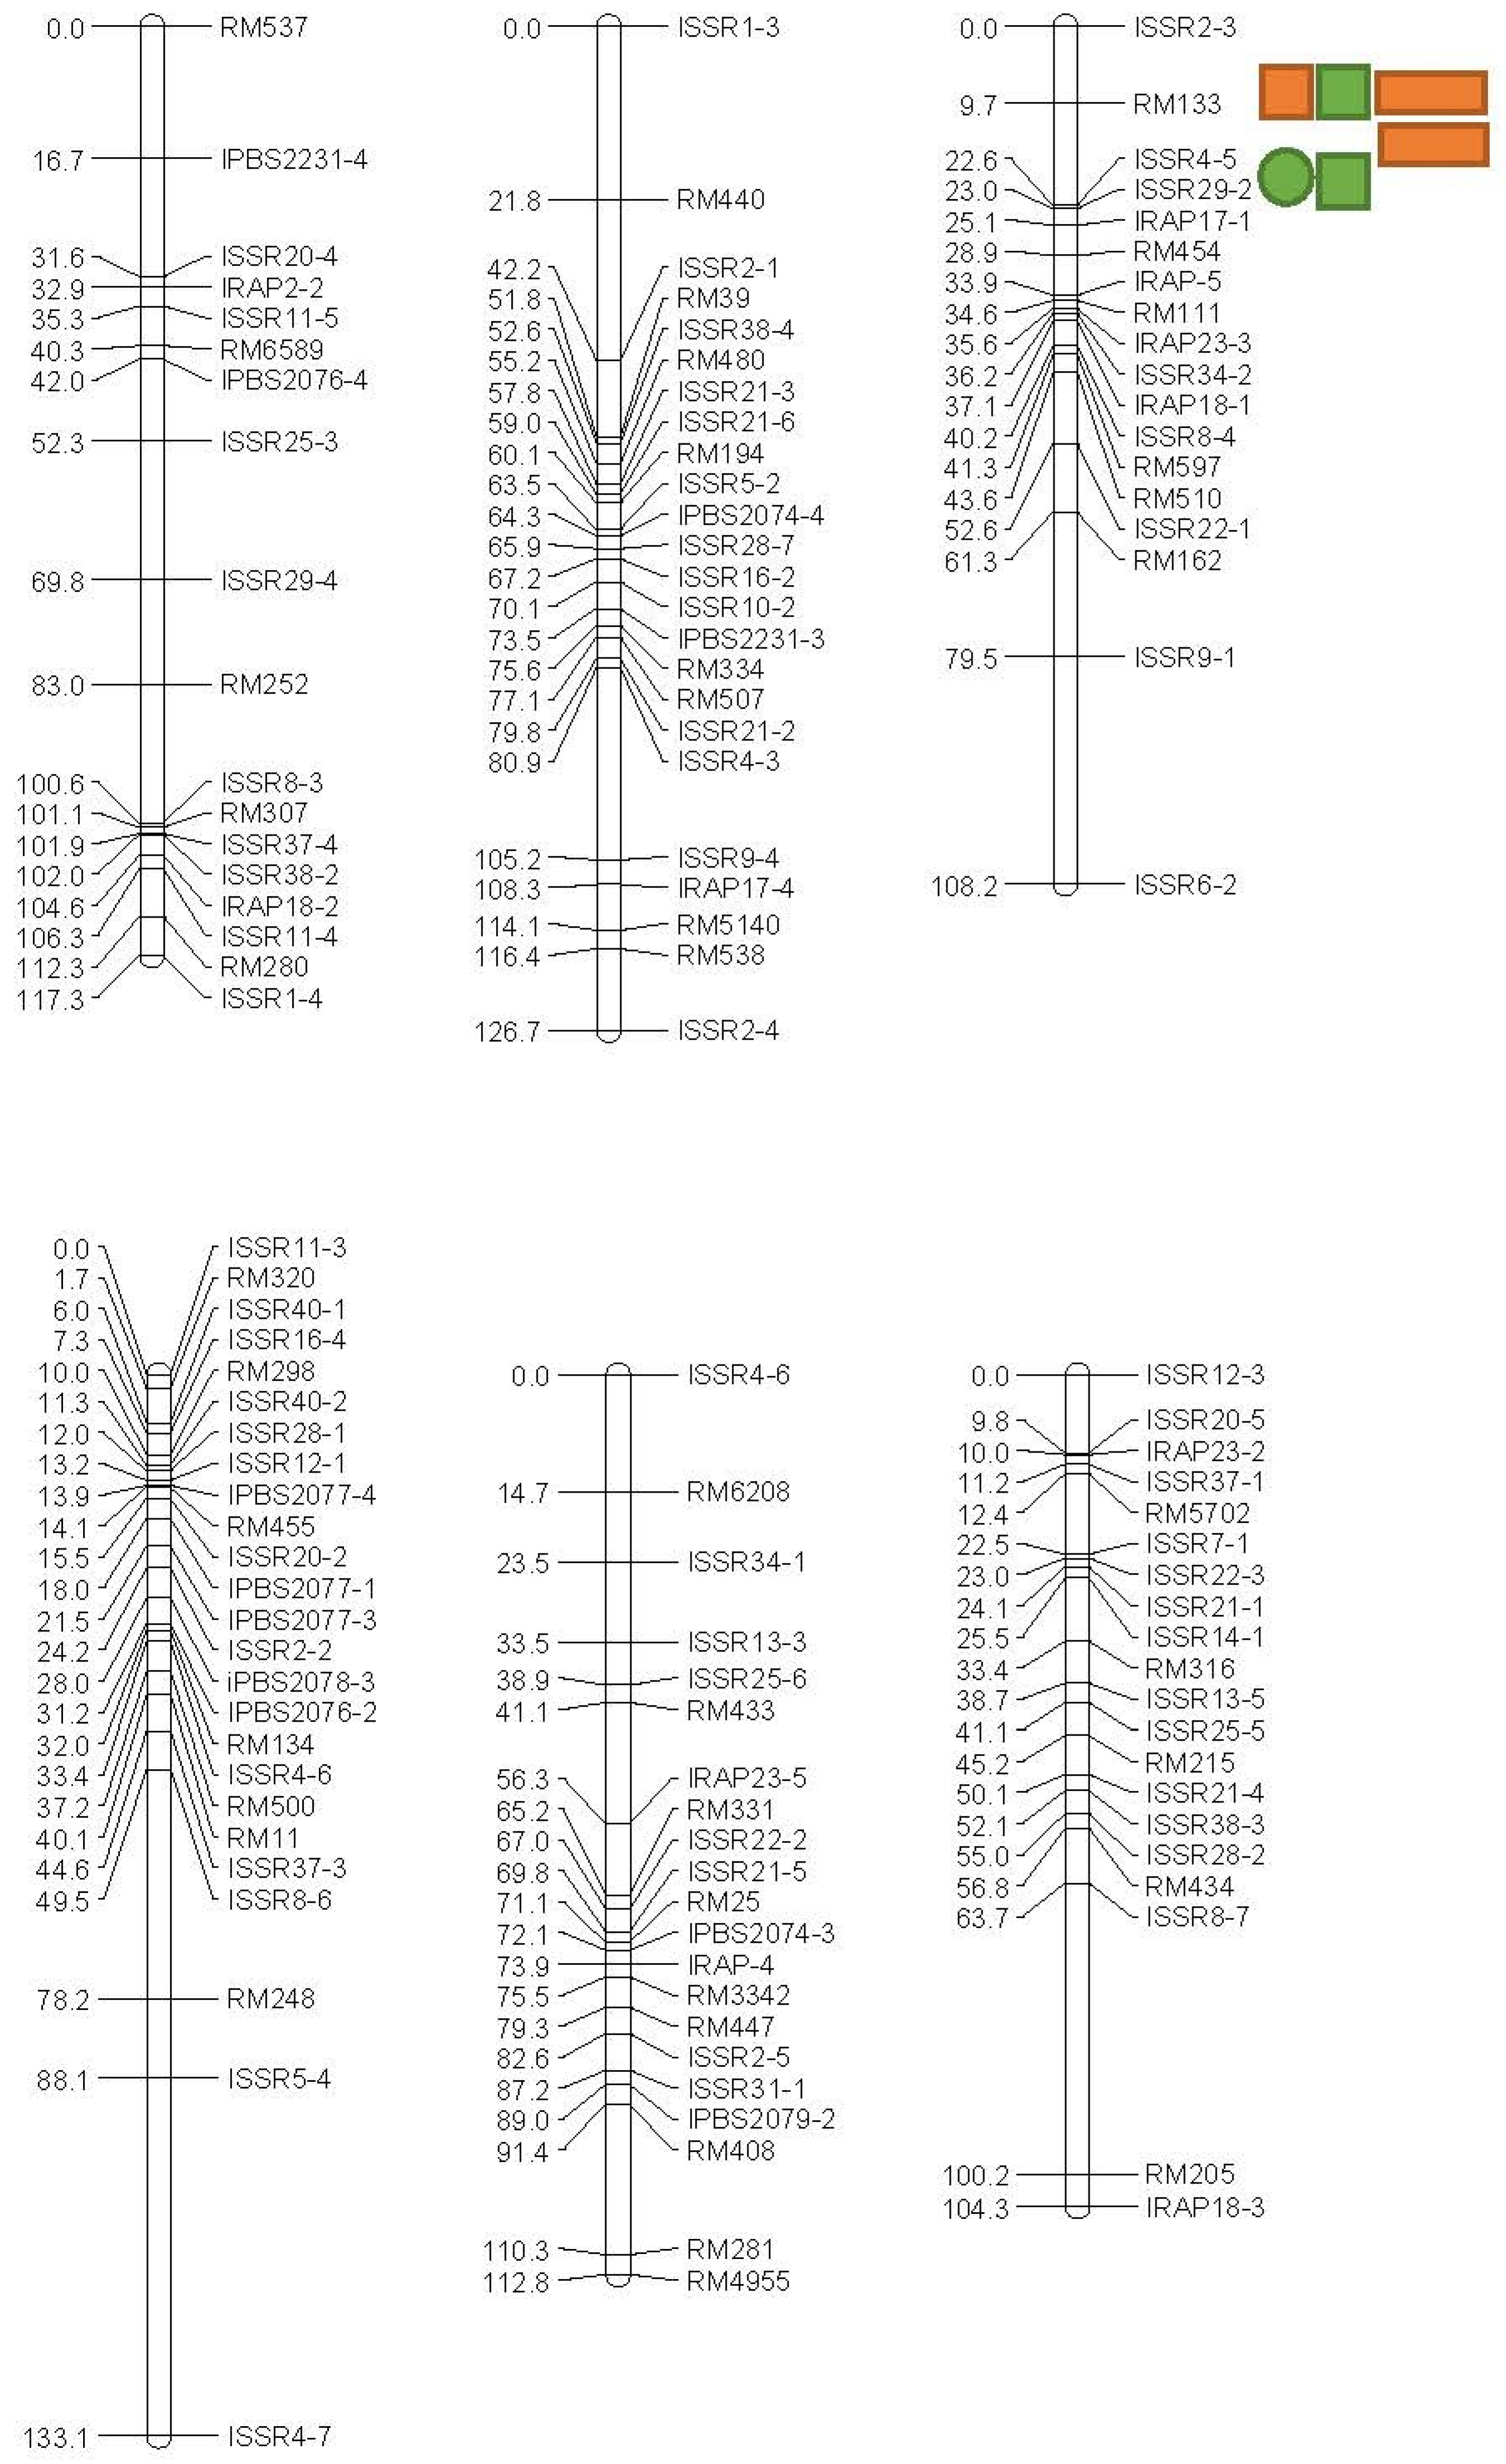
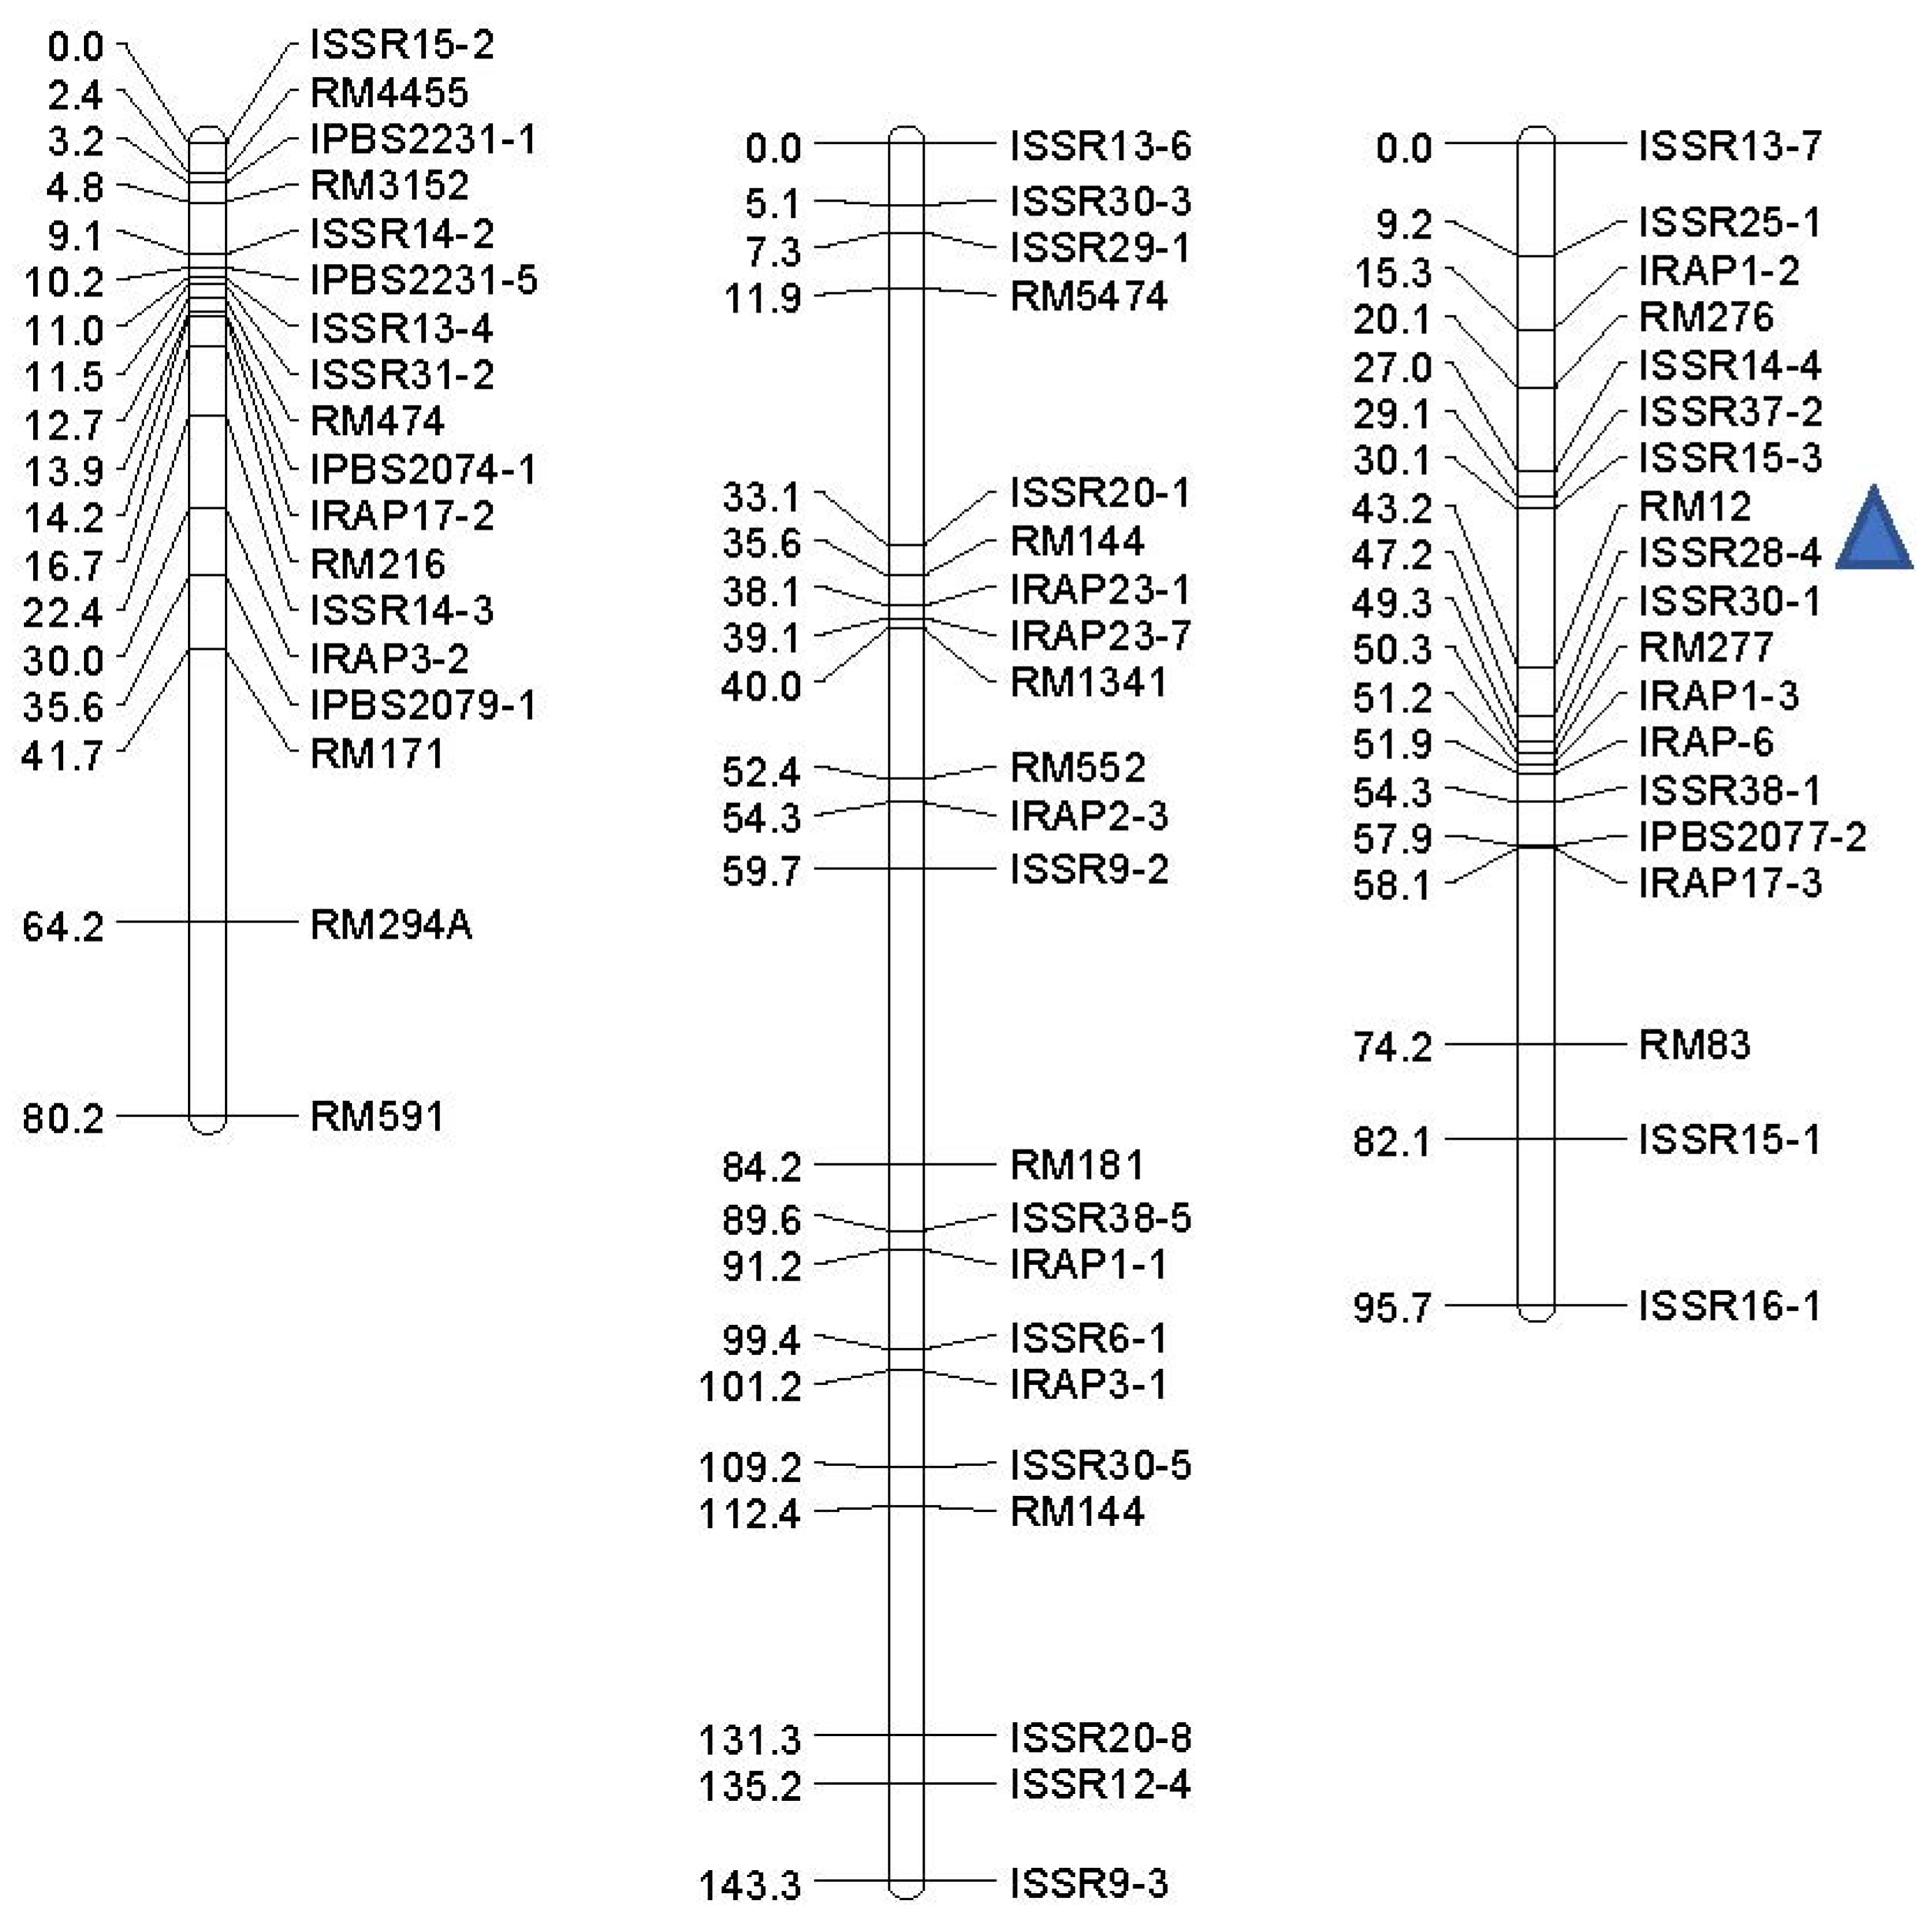
| Trait | QTL | Markers Interval a | Chr. | Position (cM) b | LOD | Additive Effect | (R2) c (%) | DPE d |
|---|---|---|---|---|---|---|---|---|
| Non-stress | ||||||||
| GP (%) | qGP-1 | ISSR28-5-ISSR11-1 | 1 | 60 | 2.34 | −3.476 | 15.5 | Ahi |
| RDW (gr) | qRDW-1 | ISSR16-3-RM143 | 3 | 68 | 2.47 | −1.274 | 14 | Ahi |
| qRDW-3 | ISSR8-5-RM7389 | 3 | 6 | 2.274 | −1.65 | 14.5 | Ahi | |
| COL (cm) | qCOL-12 | RM12-ISSR28-4 | 12 | 46 | 2.193 | −0.292 | 13.9 | Ahi |
| −4.5 bar | ||||||||
| GP (%) | qGP-1a | RM1-RM490 | 1 | 42 | 6.257 | 4.78 | 21.3 | Ned |
| qGP-1b | RM10843-RM495 | 1 | 72 | 5.407 | 4.664 | 18.7 | Ned | |
| RDW (gr) | qRDW-6 | ISSR2-3-RM133 | 6 | 8 | 4.161 | 0.734 | 14.8 | Ned |
| qRDW-1 | RM1-RM490 | 1 | 42 | 4.085 | 0.621 | 14.5 | Ned | |
| PDW (gr) | qPDW-1 | RM1-RM490 | 1 | 42 | 13.426 | 0.937 | 40.3 | Ned |
| qPDW-6a | ISSR2-3-RM133 | 6 | 8 | 8.68 | 0.922 | 2.73 | Ned | |
| qPDW-6b | RM133-ISSR4-5 | 6 | 18 | 8.579 | 2.228 | 28.1 | Ned | |
| −9.0 bar | ||||||||
| GP (%) | qGP-1 | RM1-RM490 | 1 | 42 | 5.105 | 3.086 | 17.8 | Ned |
| qGP-6 | RM133-ISSR4-5 | 6 | 10 | 4.803 | 2.993 | 16.8 | Ned | |
| COL (cm) | qCOL-1 | RM495-RM594 | 1 | 76 | 5.174 | 0.177 | 18 | Ned |
| RDW (gr) | qRDW-1 | RM1-RM490 | 1 | 42 | 11.276 | 1.338 | 35.1 | Ned |
| qRDW-6a | ISSR2-3-RM133 | 6 | 8 | 8.32 | 1.385 | 27.3 | Ned | |
| qRDW-6b | RM133-ISSR4-5 | 6 | 22 | 8.899 | 20.883 | 26.1 | Ned | |
Publisher’s Note: MDPI stays neutral with regard to jurisdictional claims in published maps and institutional affiliations. |
© 2021 by the authors. Licensee MDPI, Basel, Switzerland. This article is an open access article distributed under the terms and conditions of the Creative Commons Attribution (CC BY) license (https://creativecommons.org/licenses/by/4.0/).
Share and Cite
Noryan, M.; Hervan, I.M.; Sabouri, H.; Kojouri, F.D.; Mastinu, A. Drought Resistance Loci in Recombinant Lines of Iranian Oryza sativa L. in Germination Stage. BioTech 2021, 10, 26. https://0-doi-org.brum.beds.ac.uk/10.3390/biotech10040026
Noryan M, Hervan IM, Sabouri H, Kojouri FD, Mastinu A. Drought Resistance Loci in Recombinant Lines of Iranian Oryza sativa L. in Germination Stage. BioTech. 2021; 10(4):26. https://0-doi-org.brum.beds.ac.uk/10.3390/biotech10040026
Chicago/Turabian StyleNoryan, Morteza, Islam Majidi Hervan, Hossein Sabouri, Faroukh Darvish Kojouri, and Andrea Mastinu. 2021. "Drought Resistance Loci in Recombinant Lines of Iranian Oryza sativa L. in Germination Stage" BioTech 10, no. 4: 26. https://0-doi-org.brum.beds.ac.uk/10.3390/biotech10040026