
A Gabor Filter-Based Protocol for Automated Image-Based Building Detection

 ,
,  , ,
, , 
Abstract
:1. Introduction
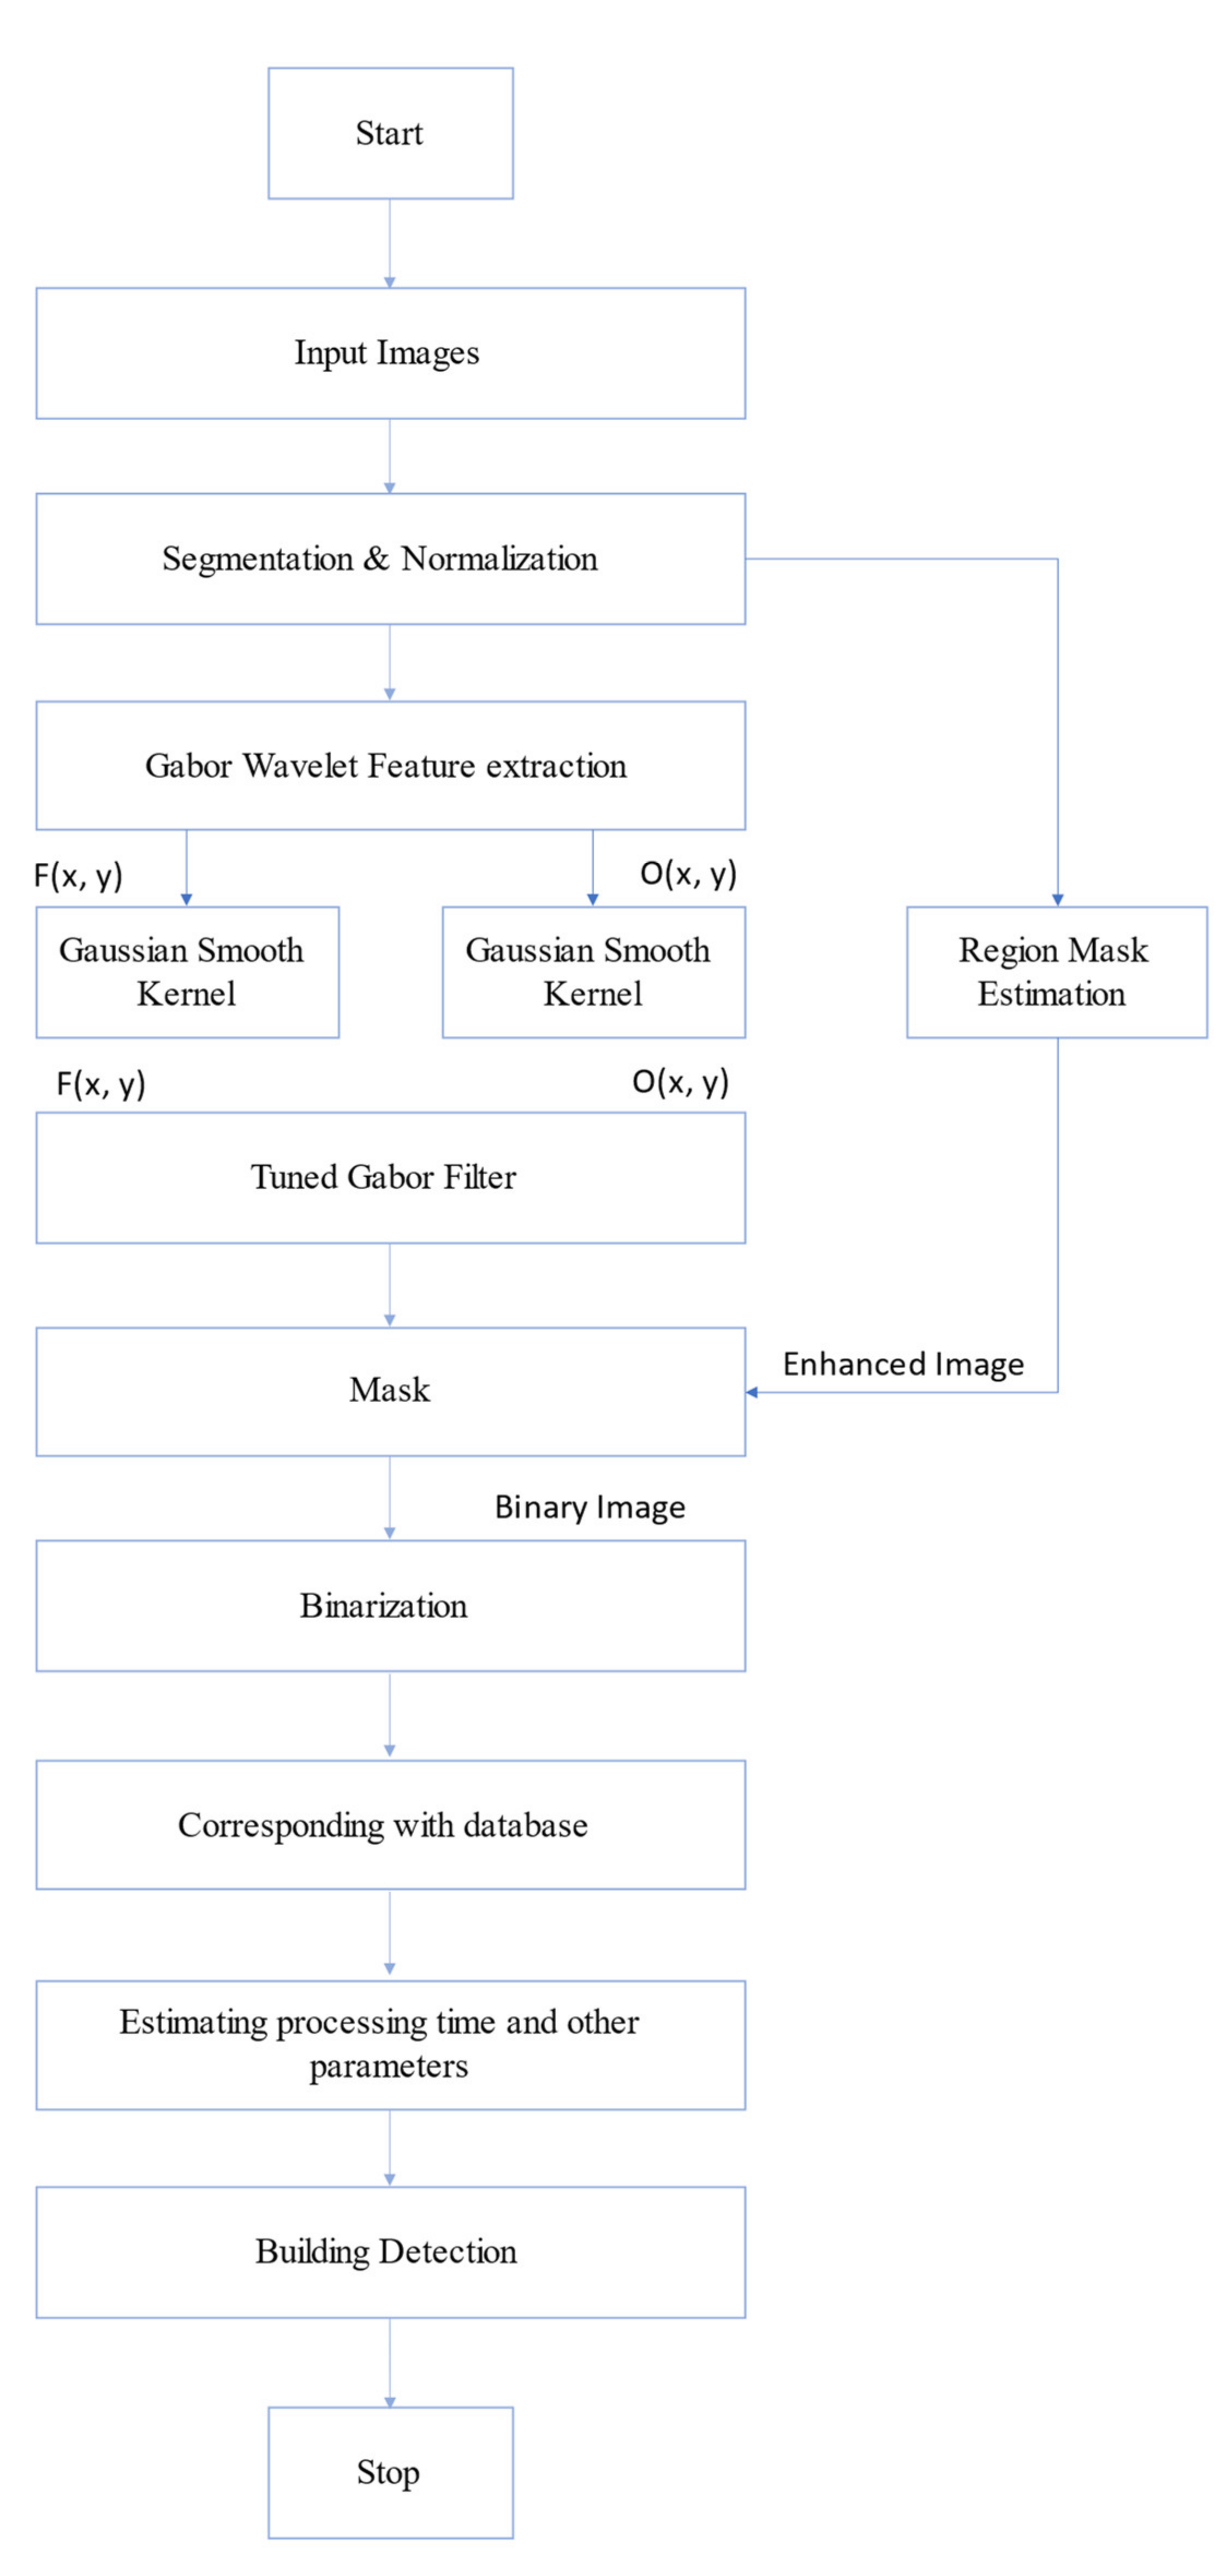
2. Methodology
2.1. Data Collection
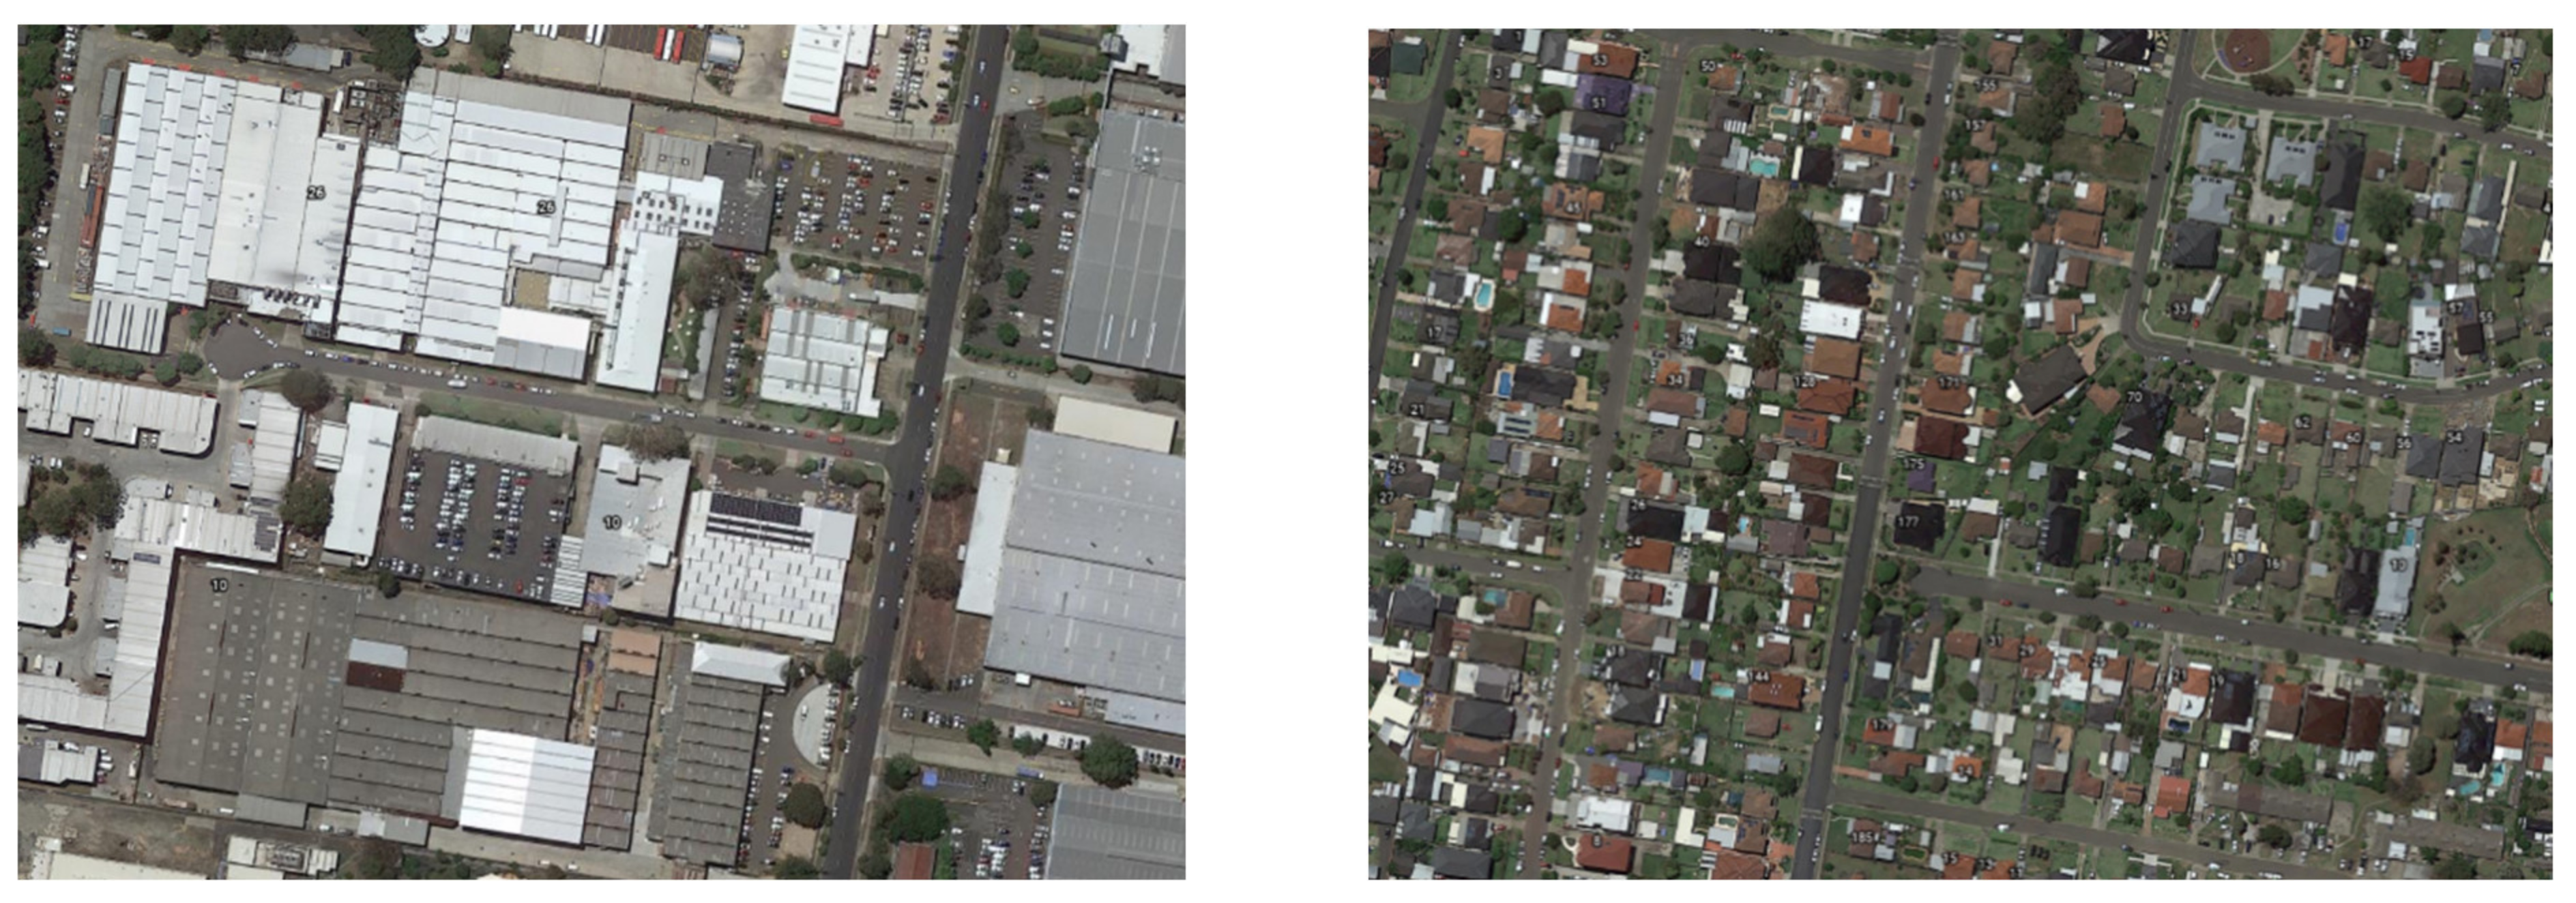
2.2. Study Area and Training UAV Datasets
2.3. Classification of Datasets
3. Local Feature Extraction
3.1. Gabor Feature Extraction
3.2. Parameter Control Points
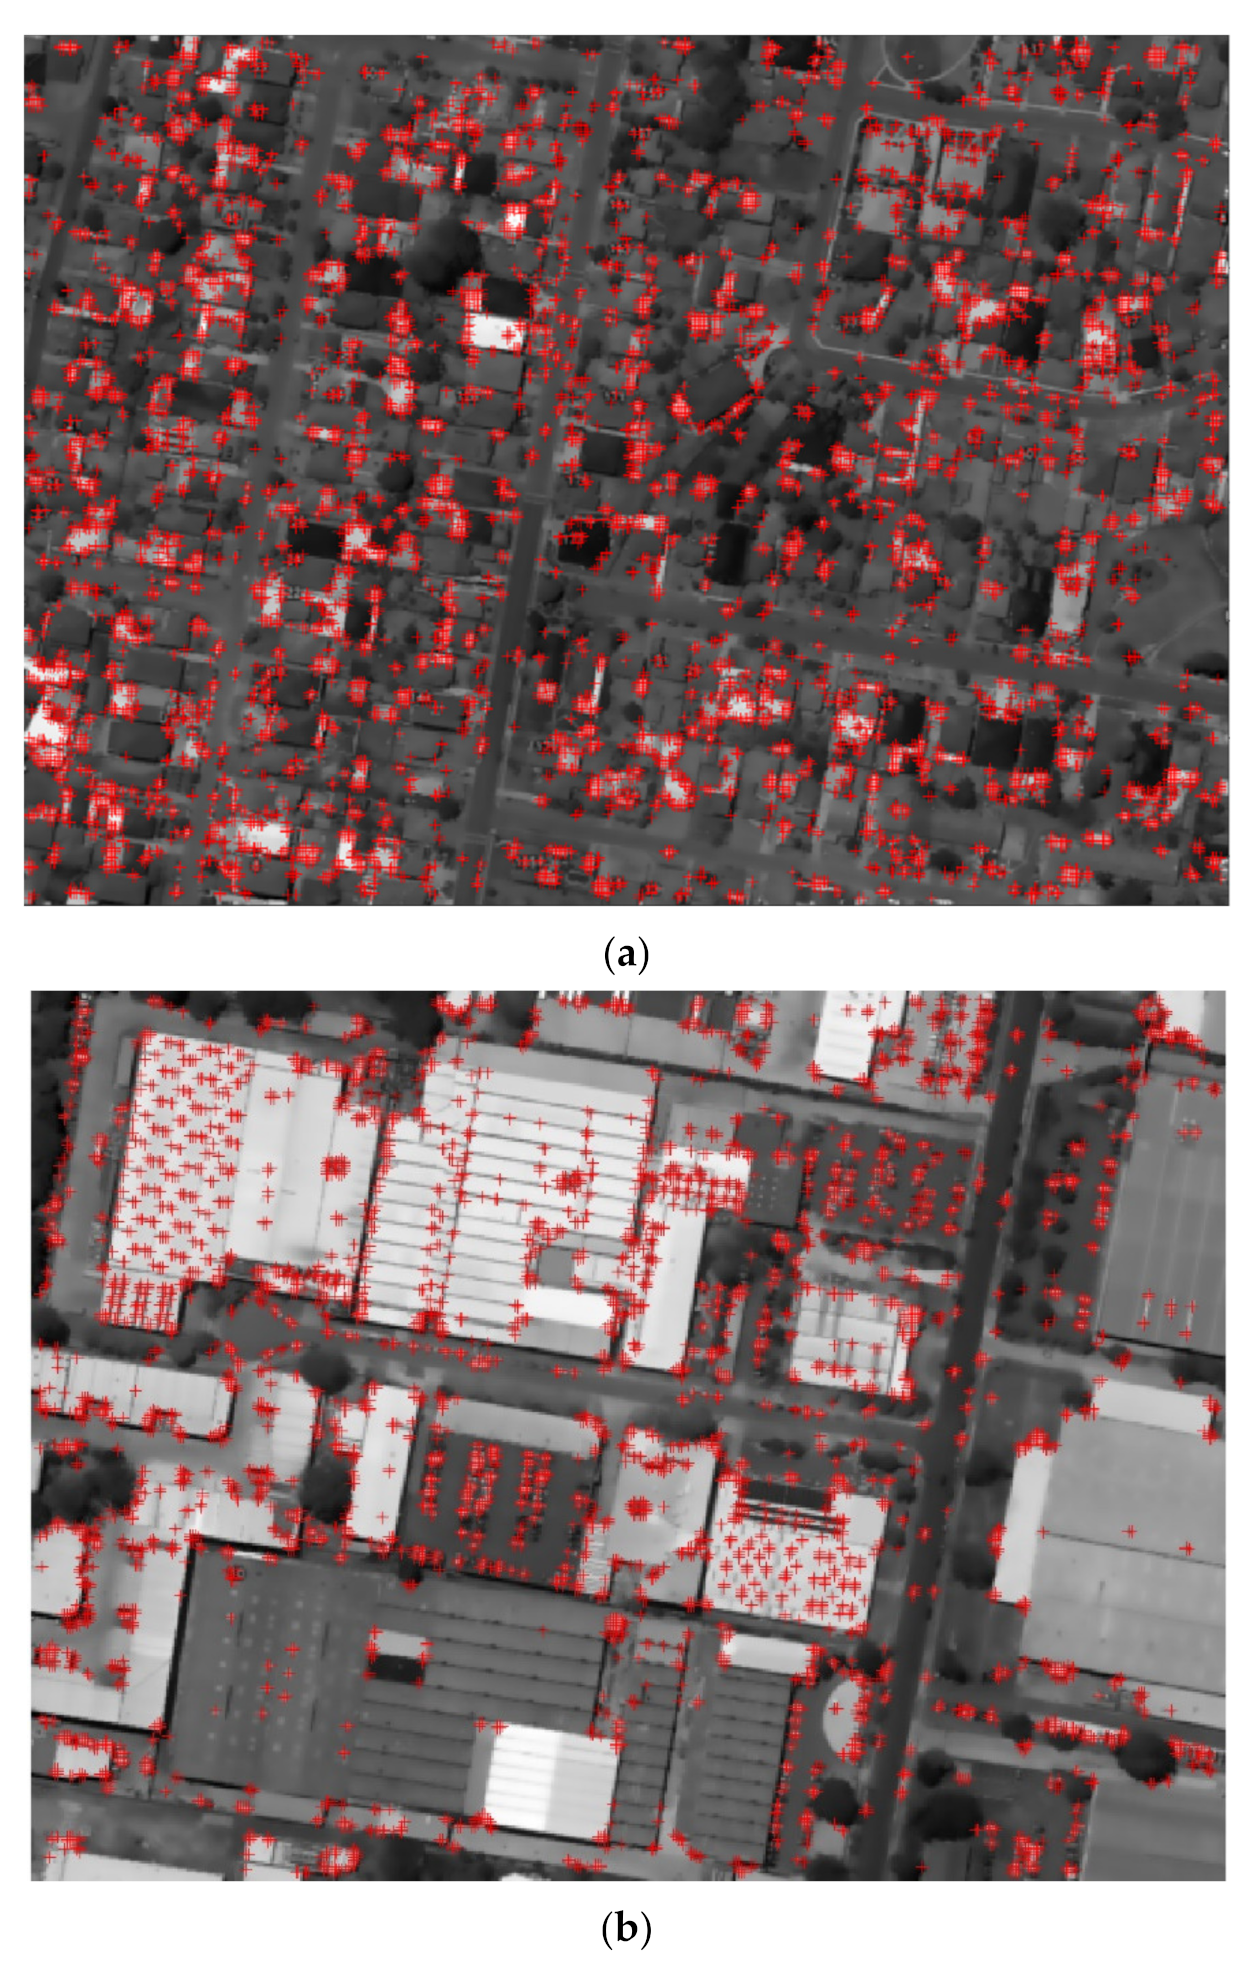
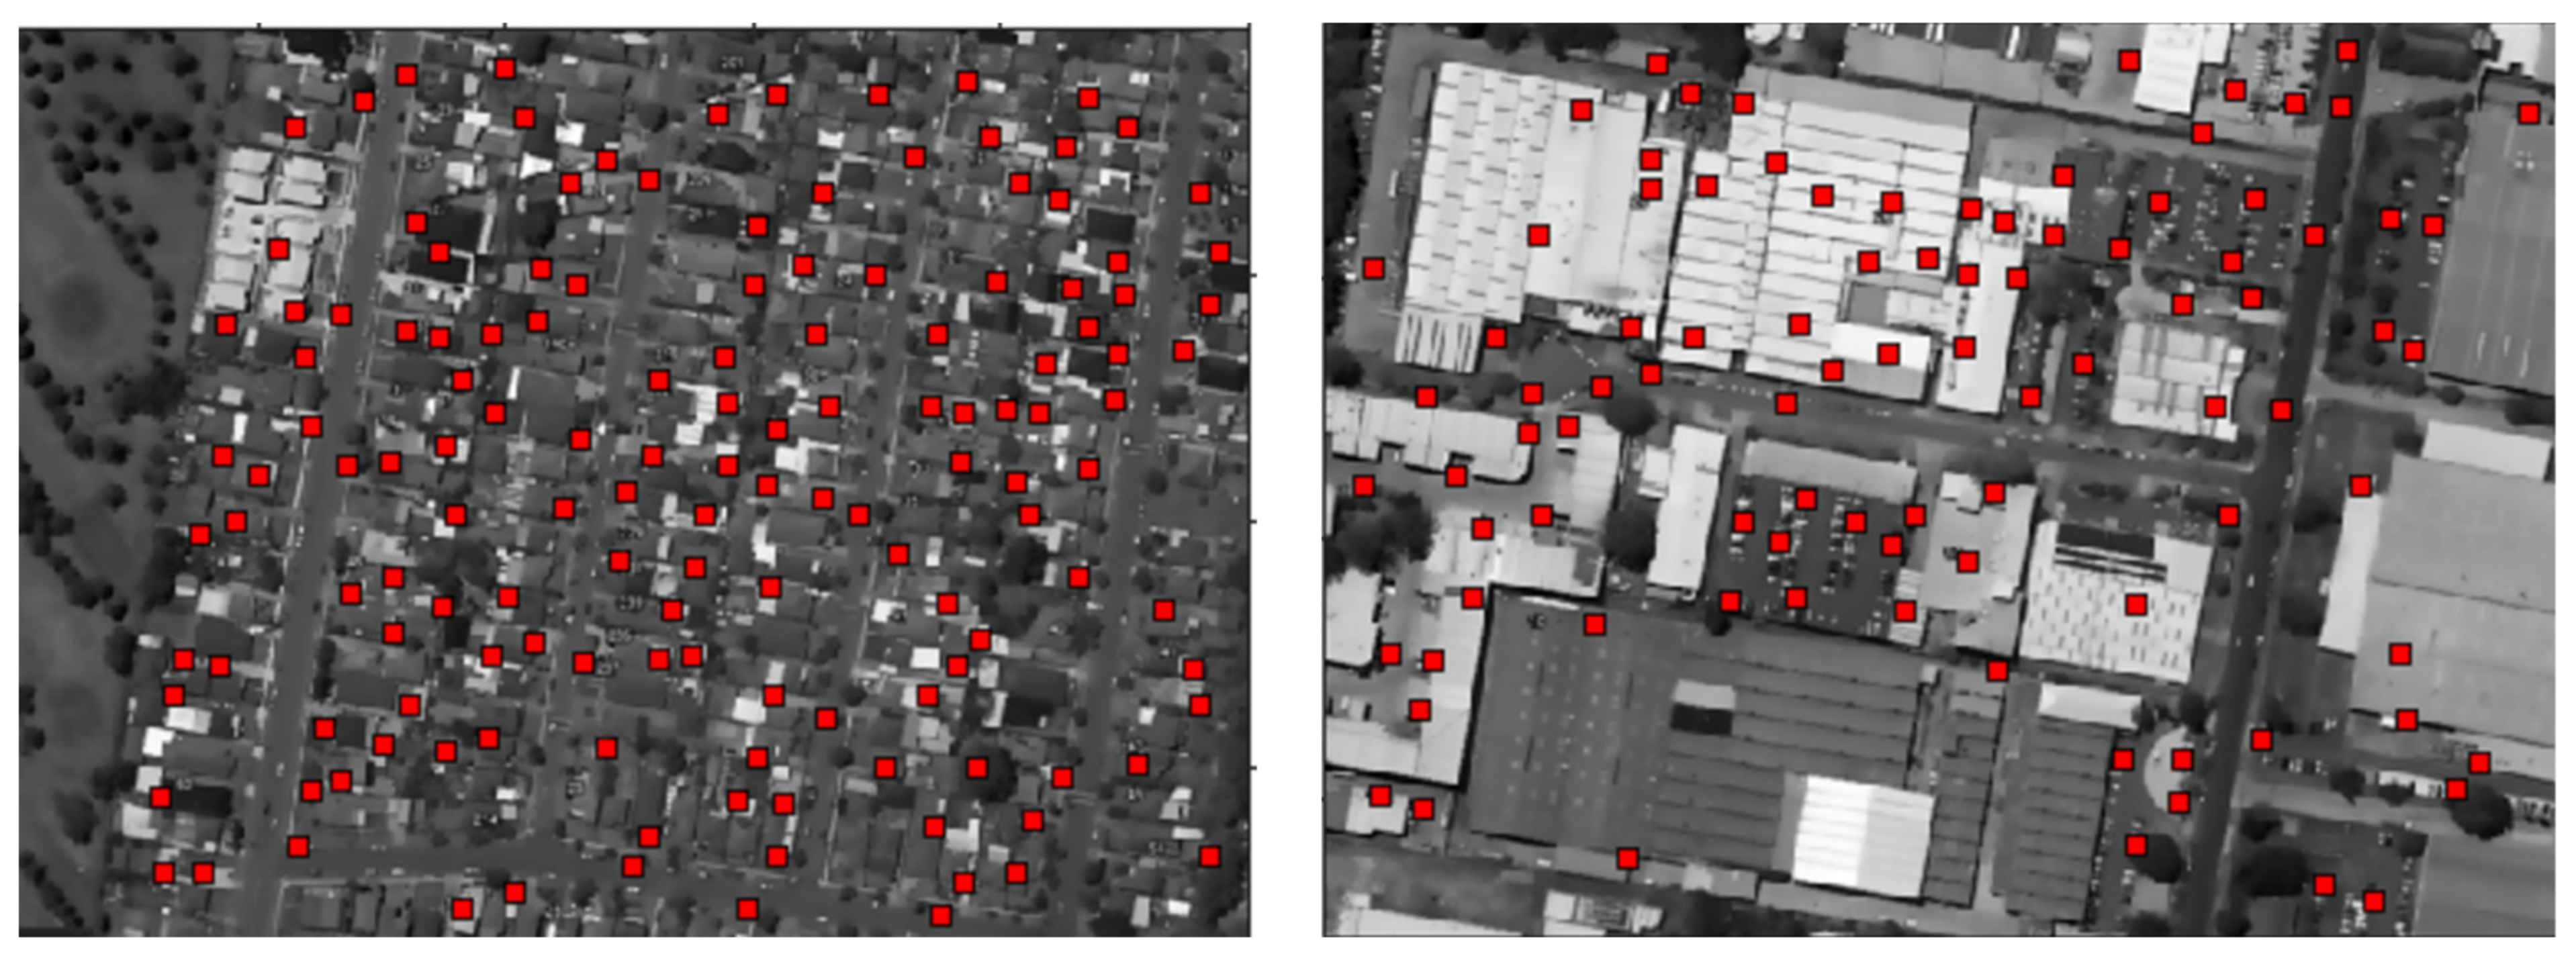
3.3. Gabor Local Feature Point Extraction
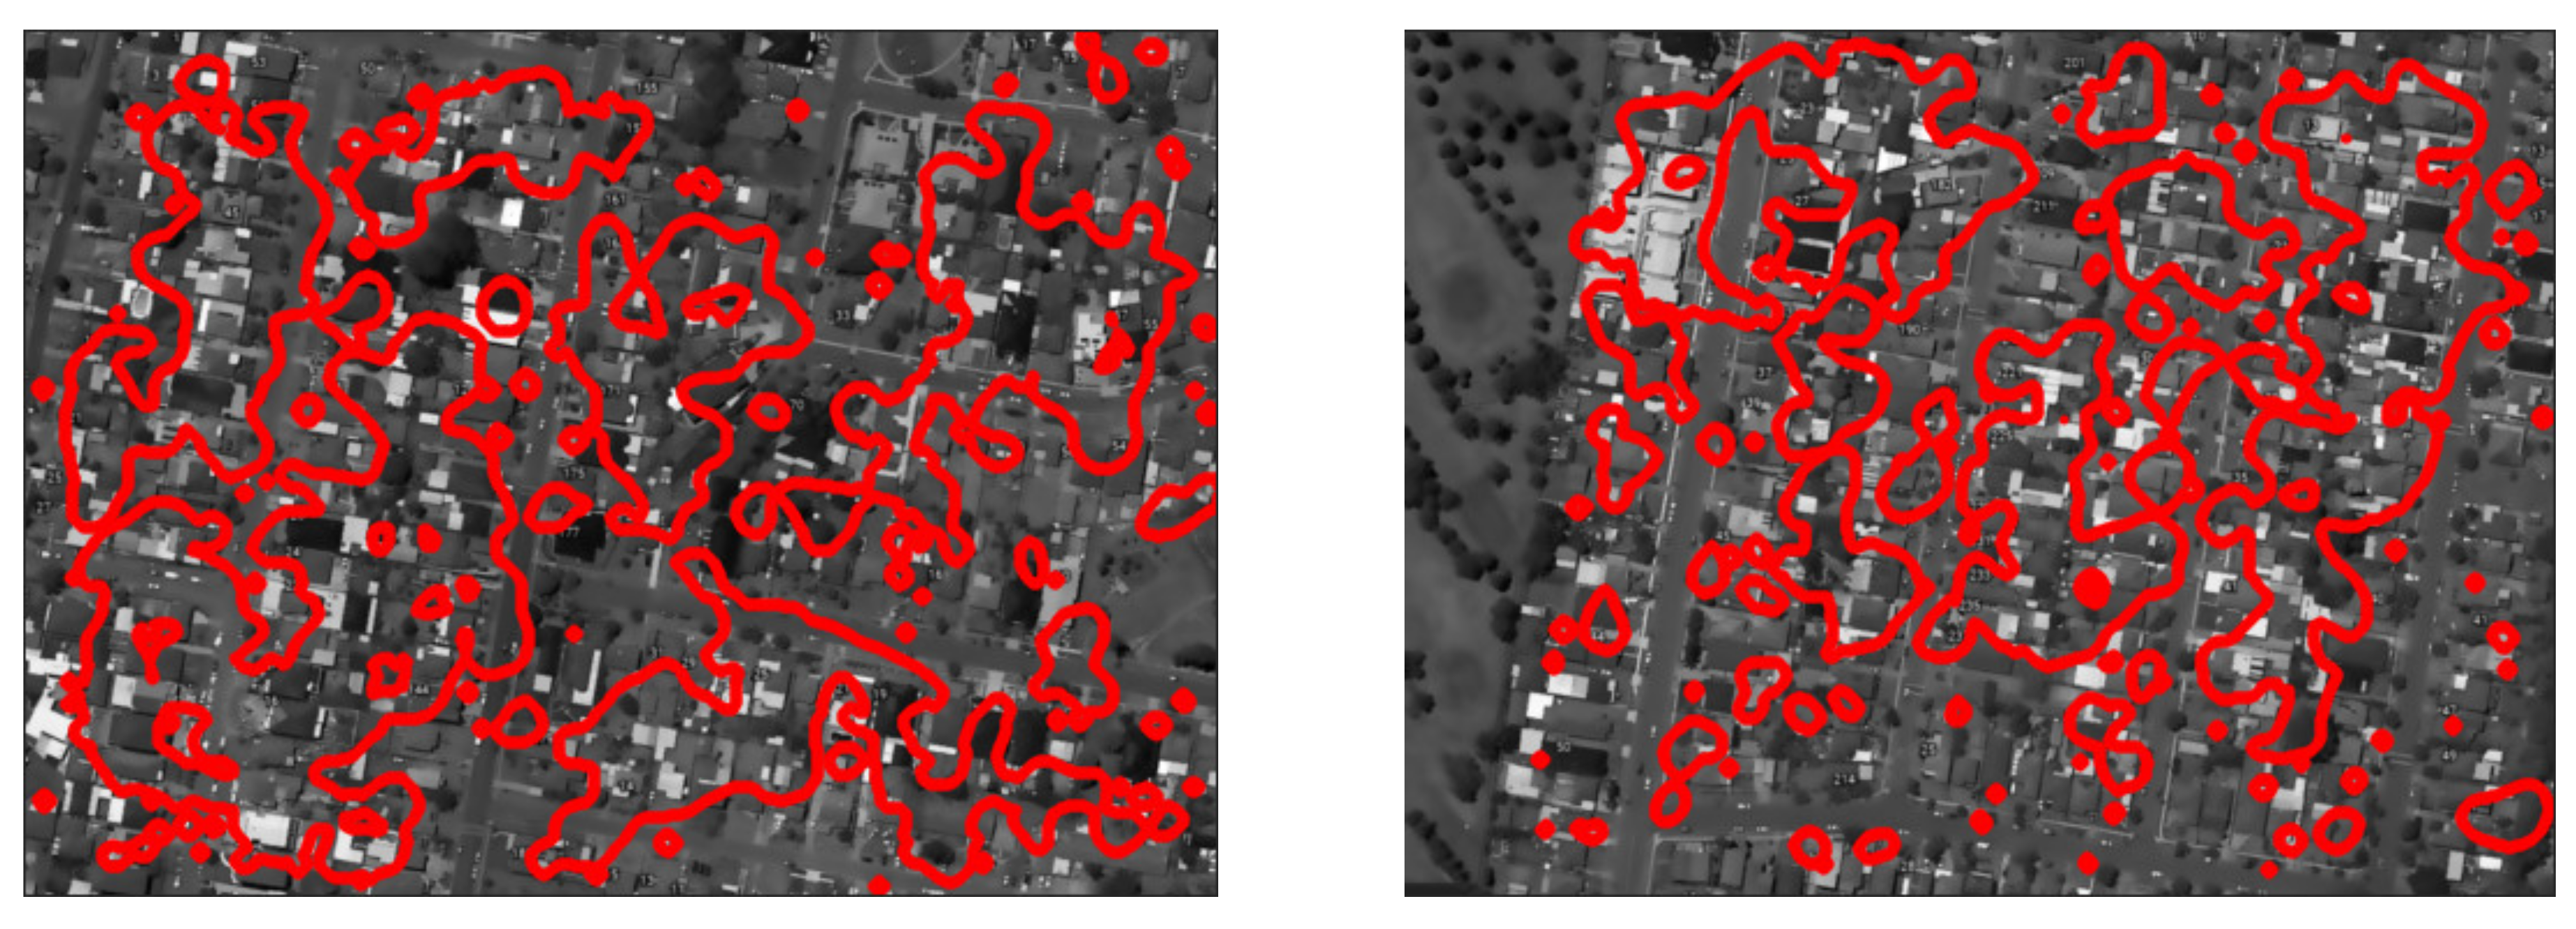
4. Building Detection
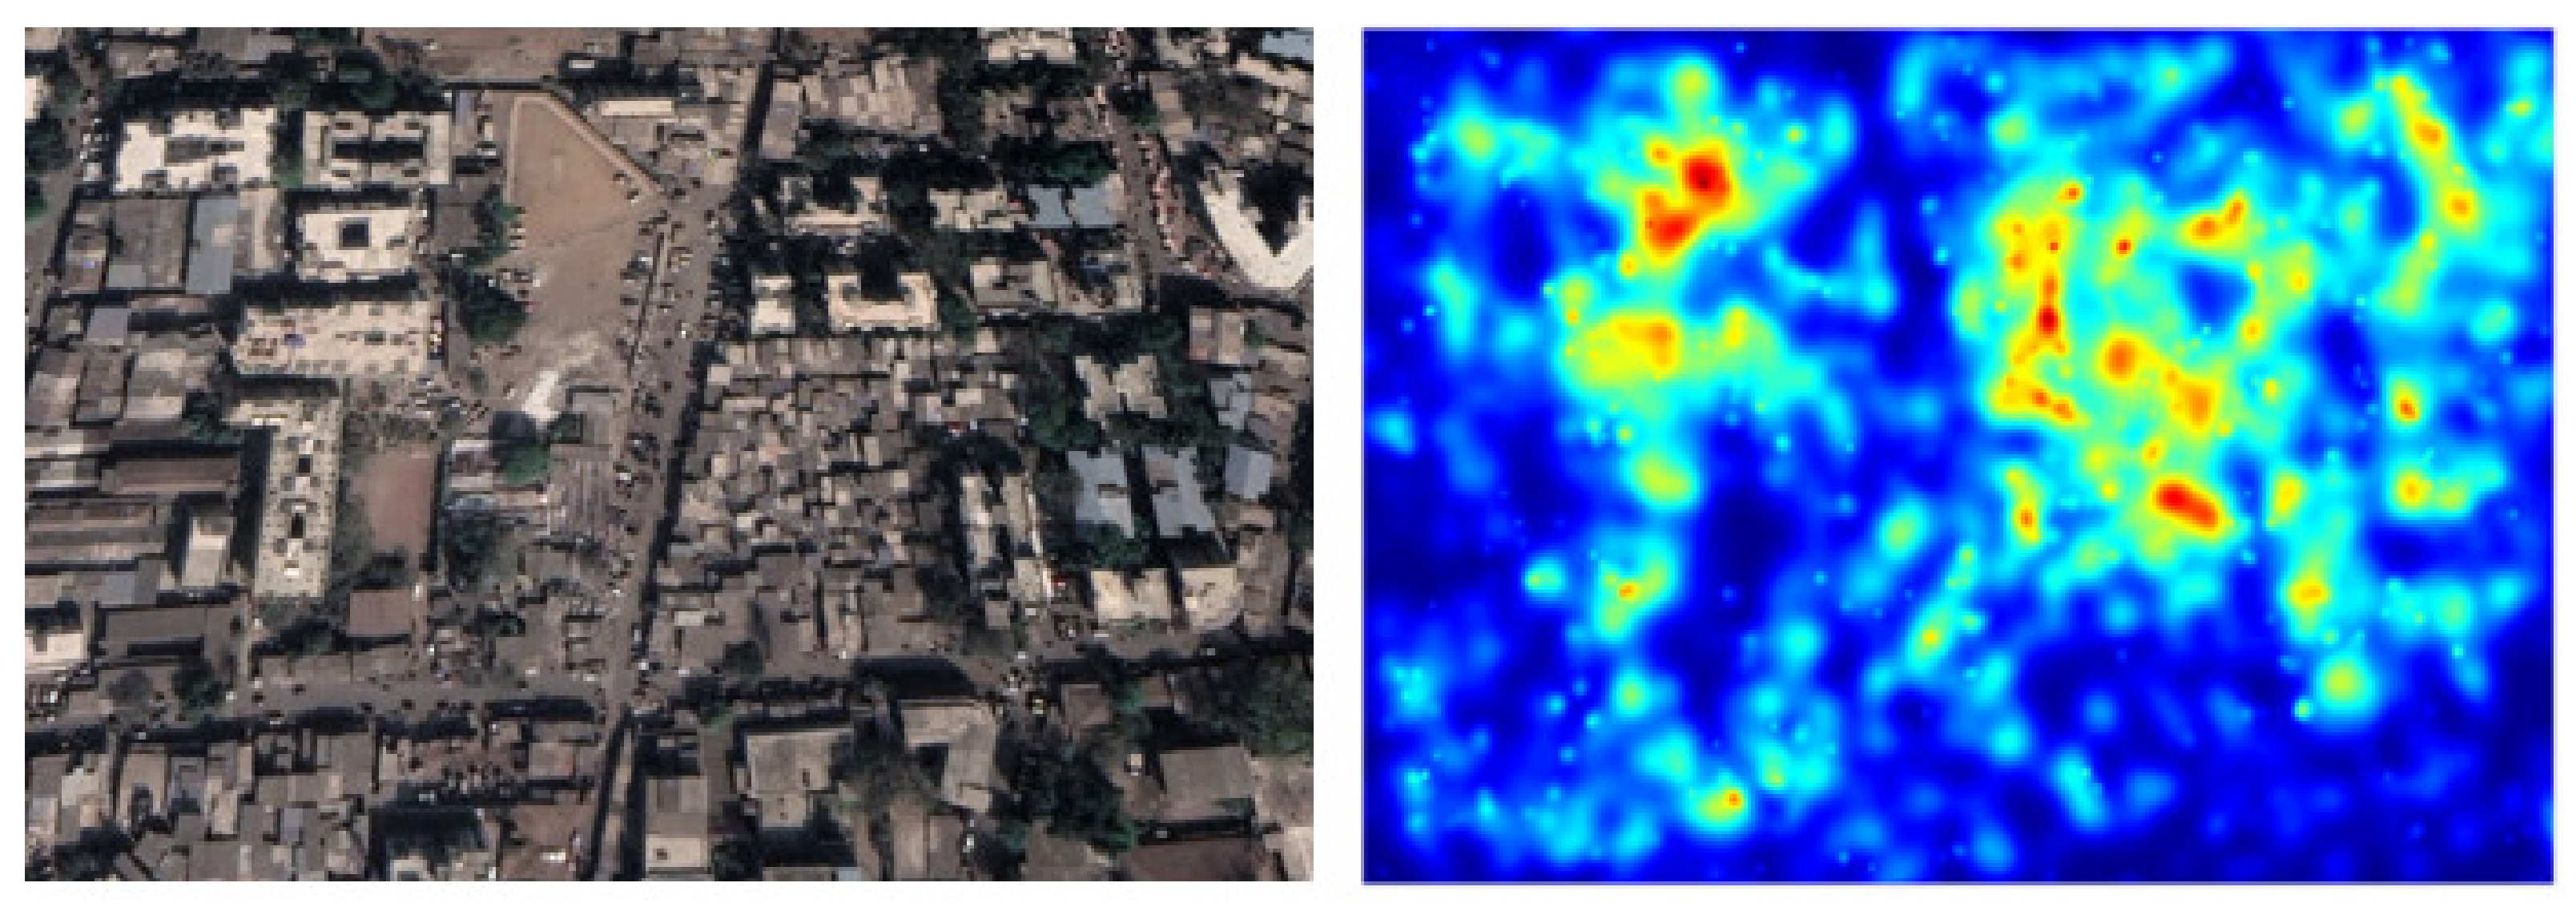
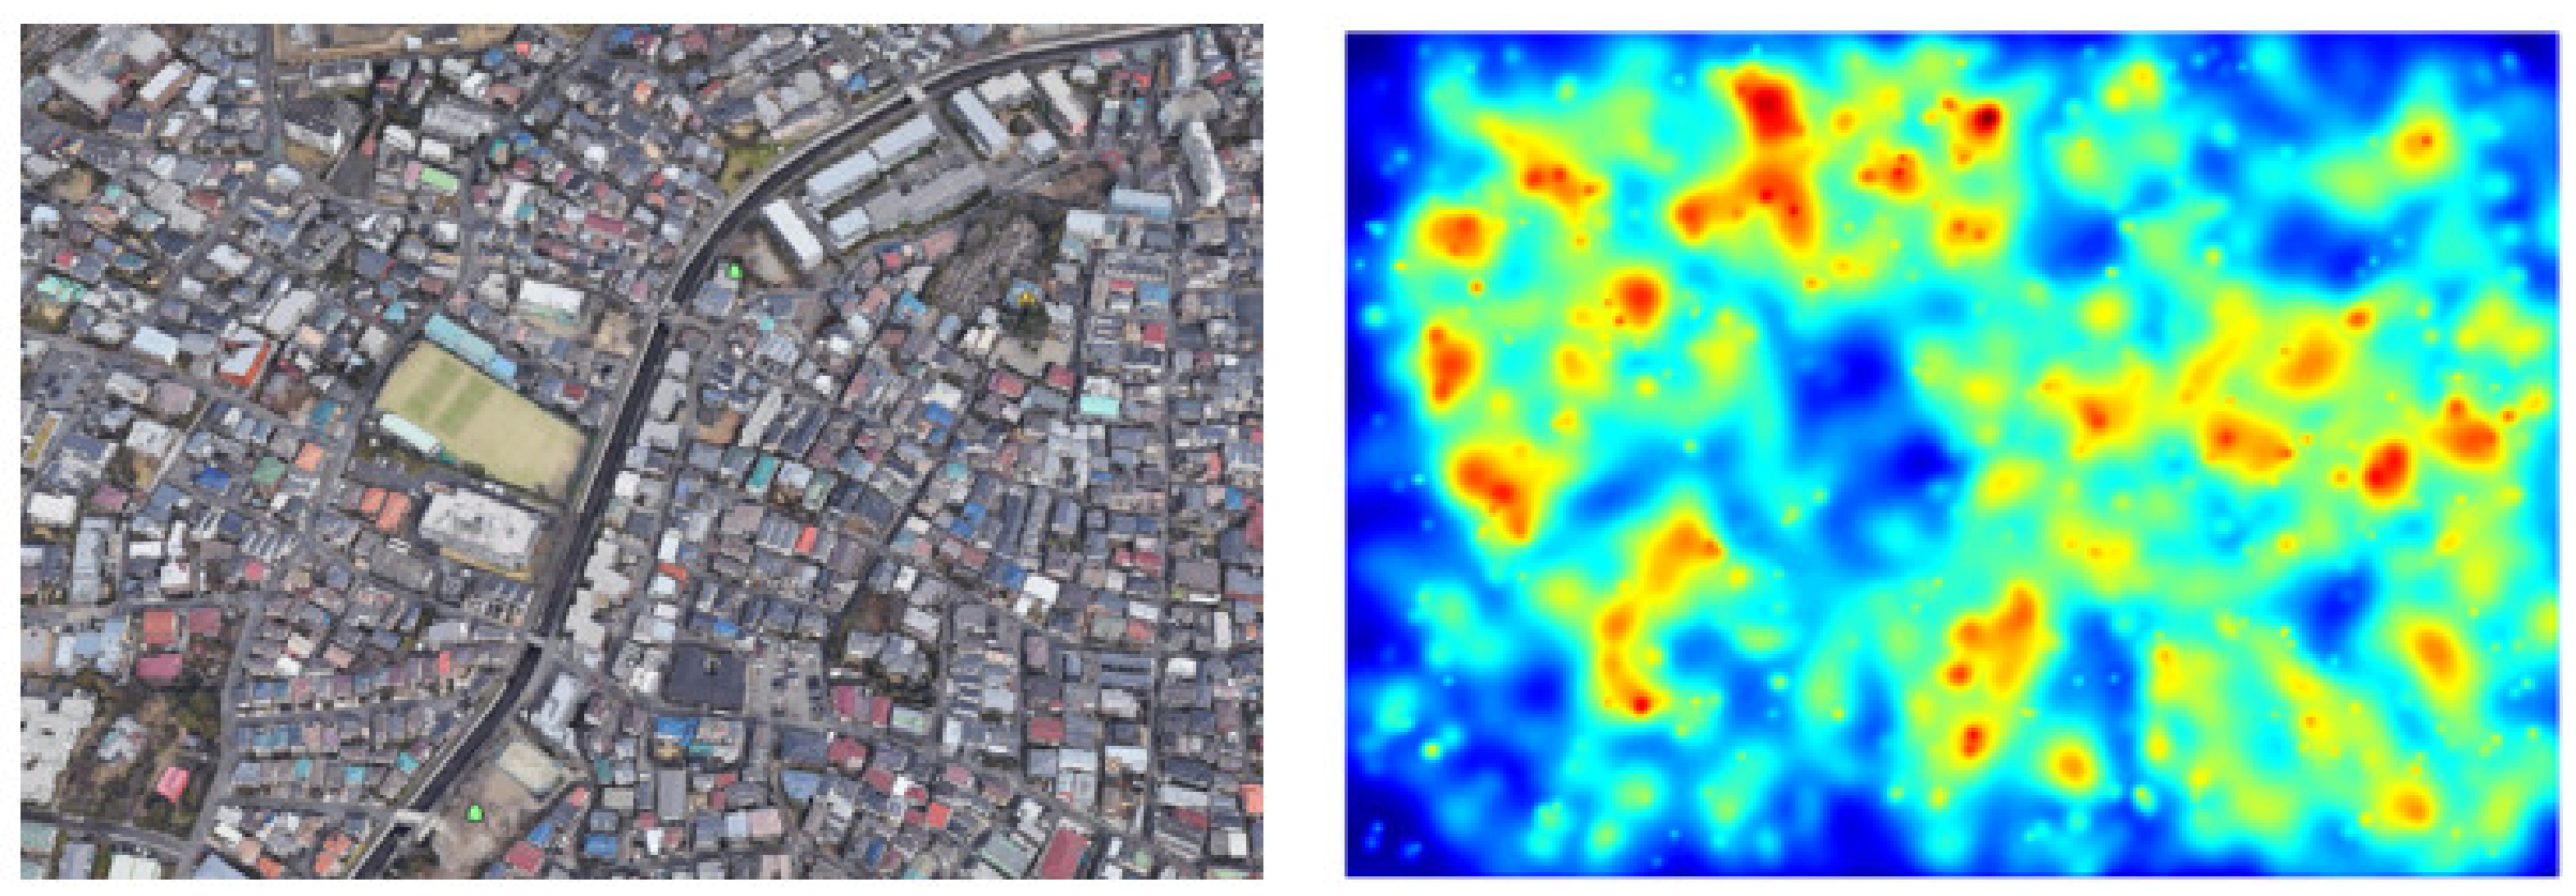
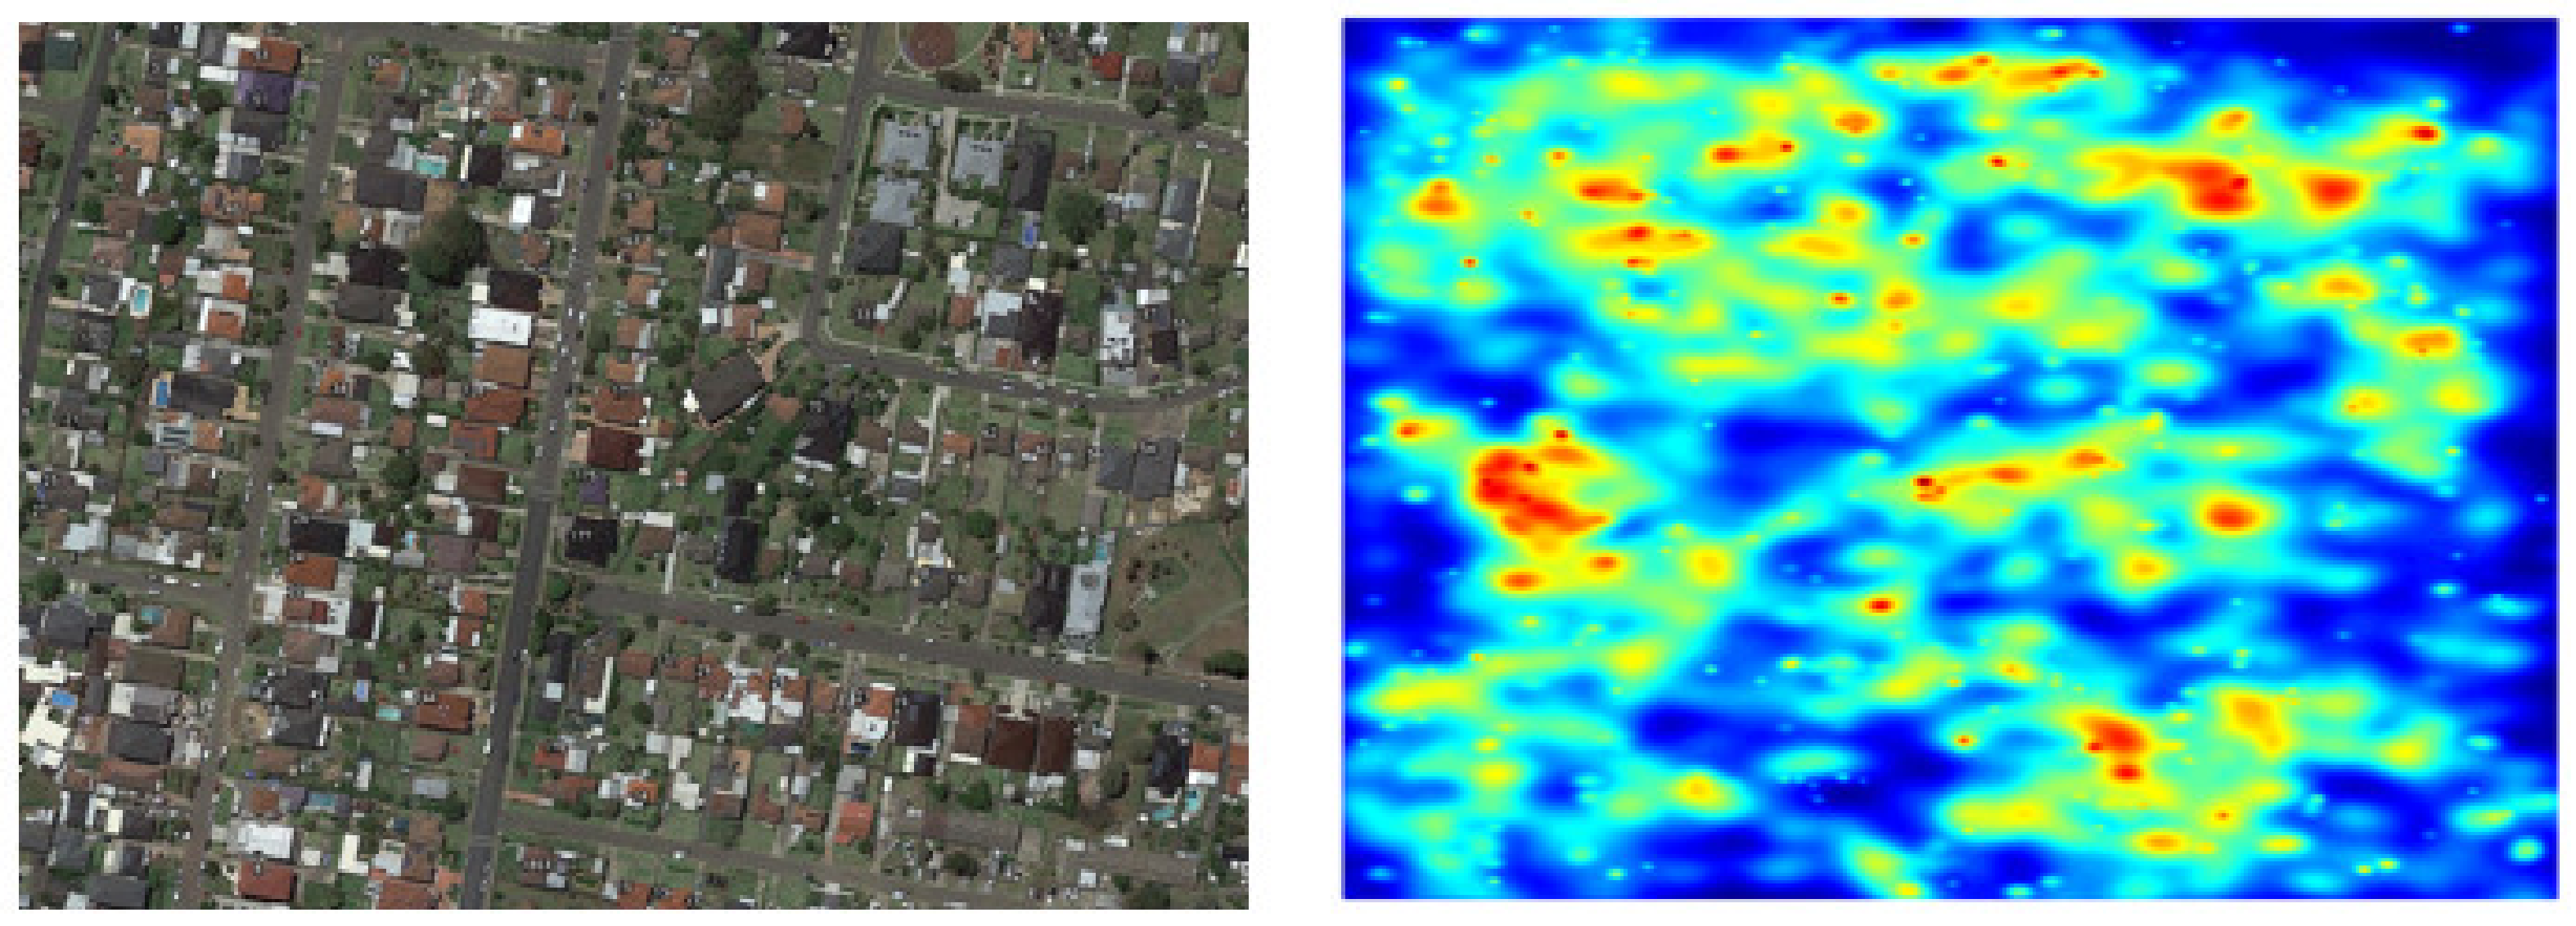
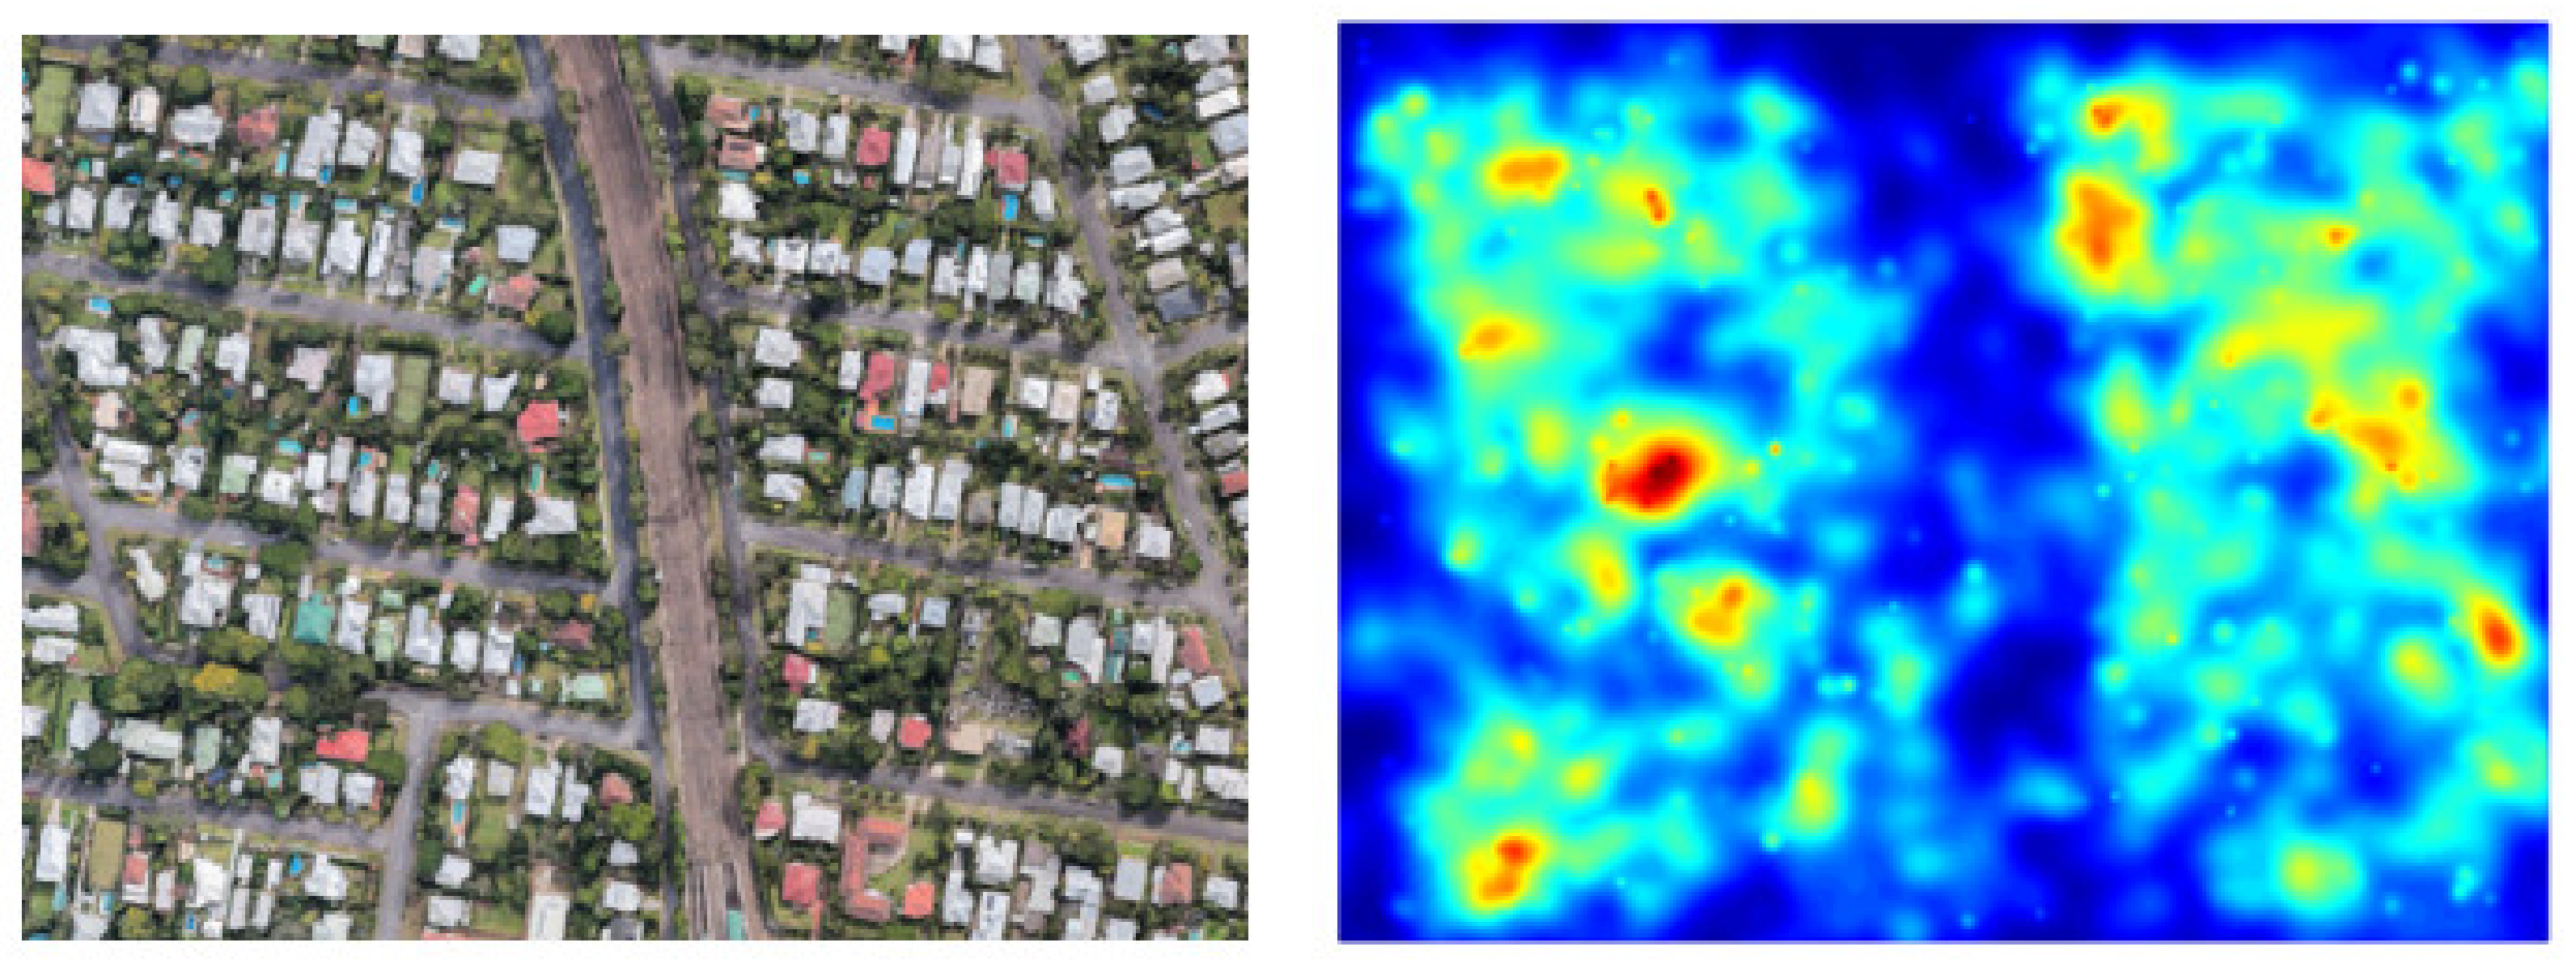
5. Density Flow
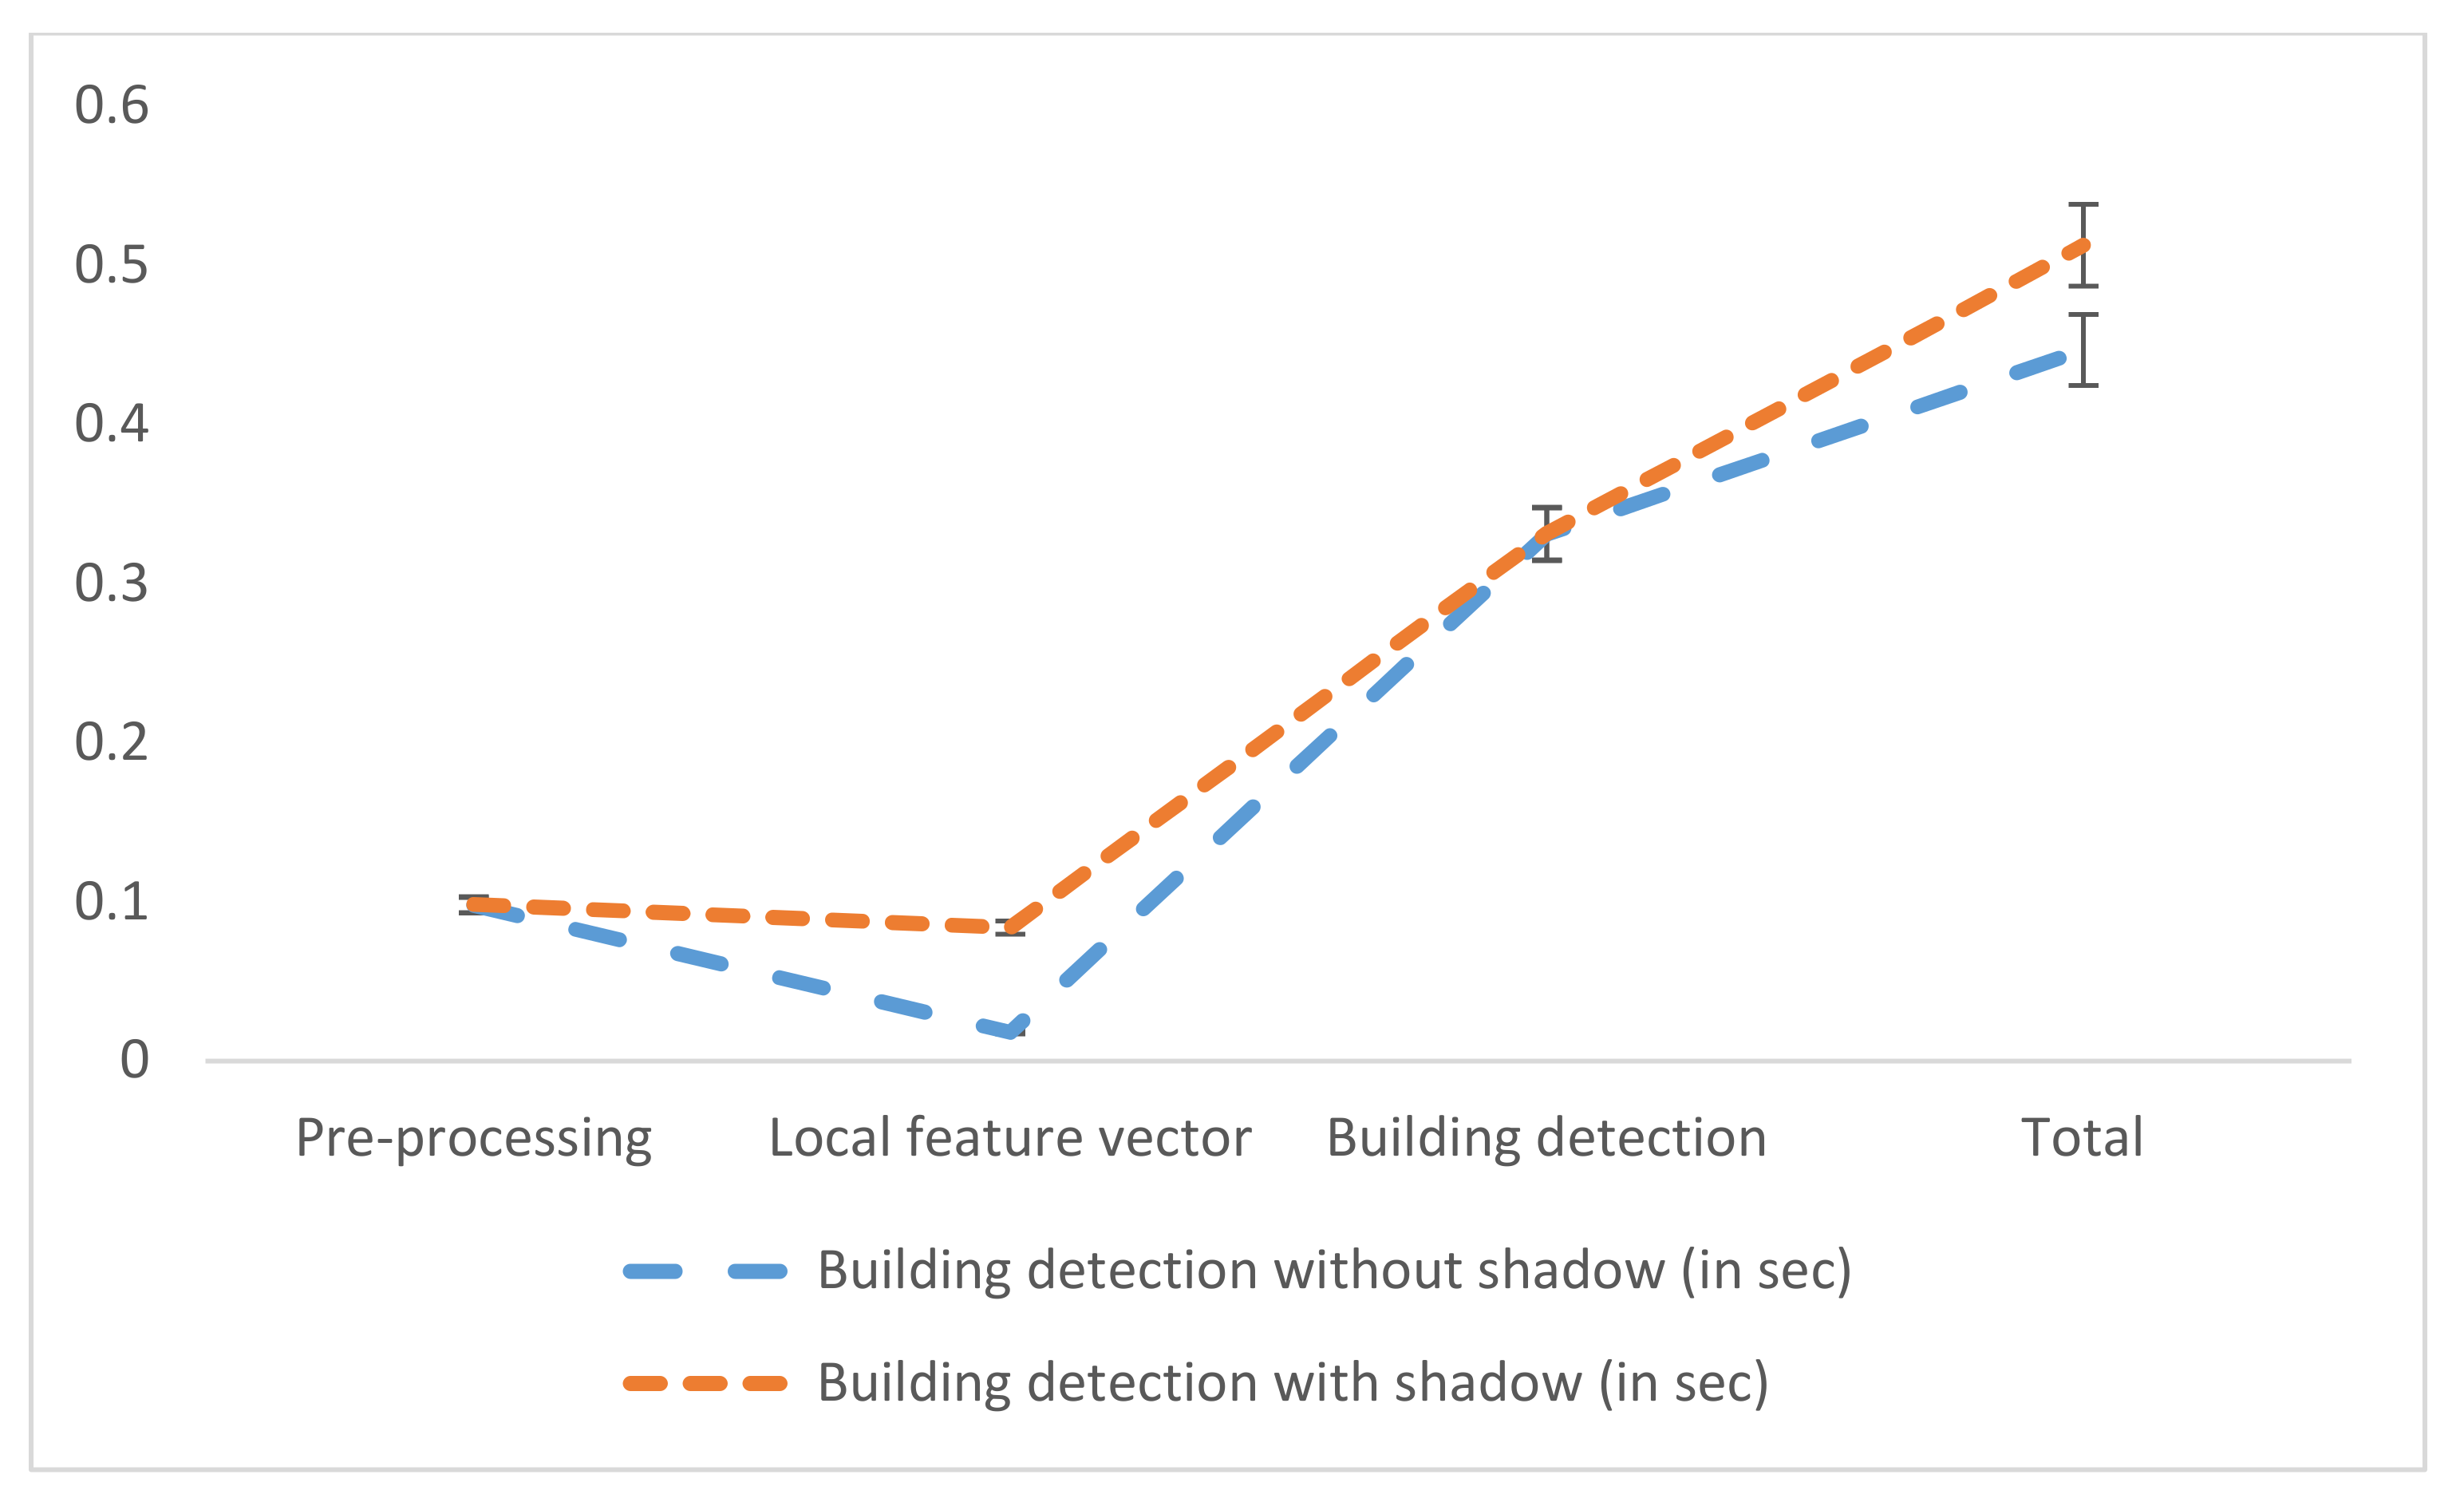
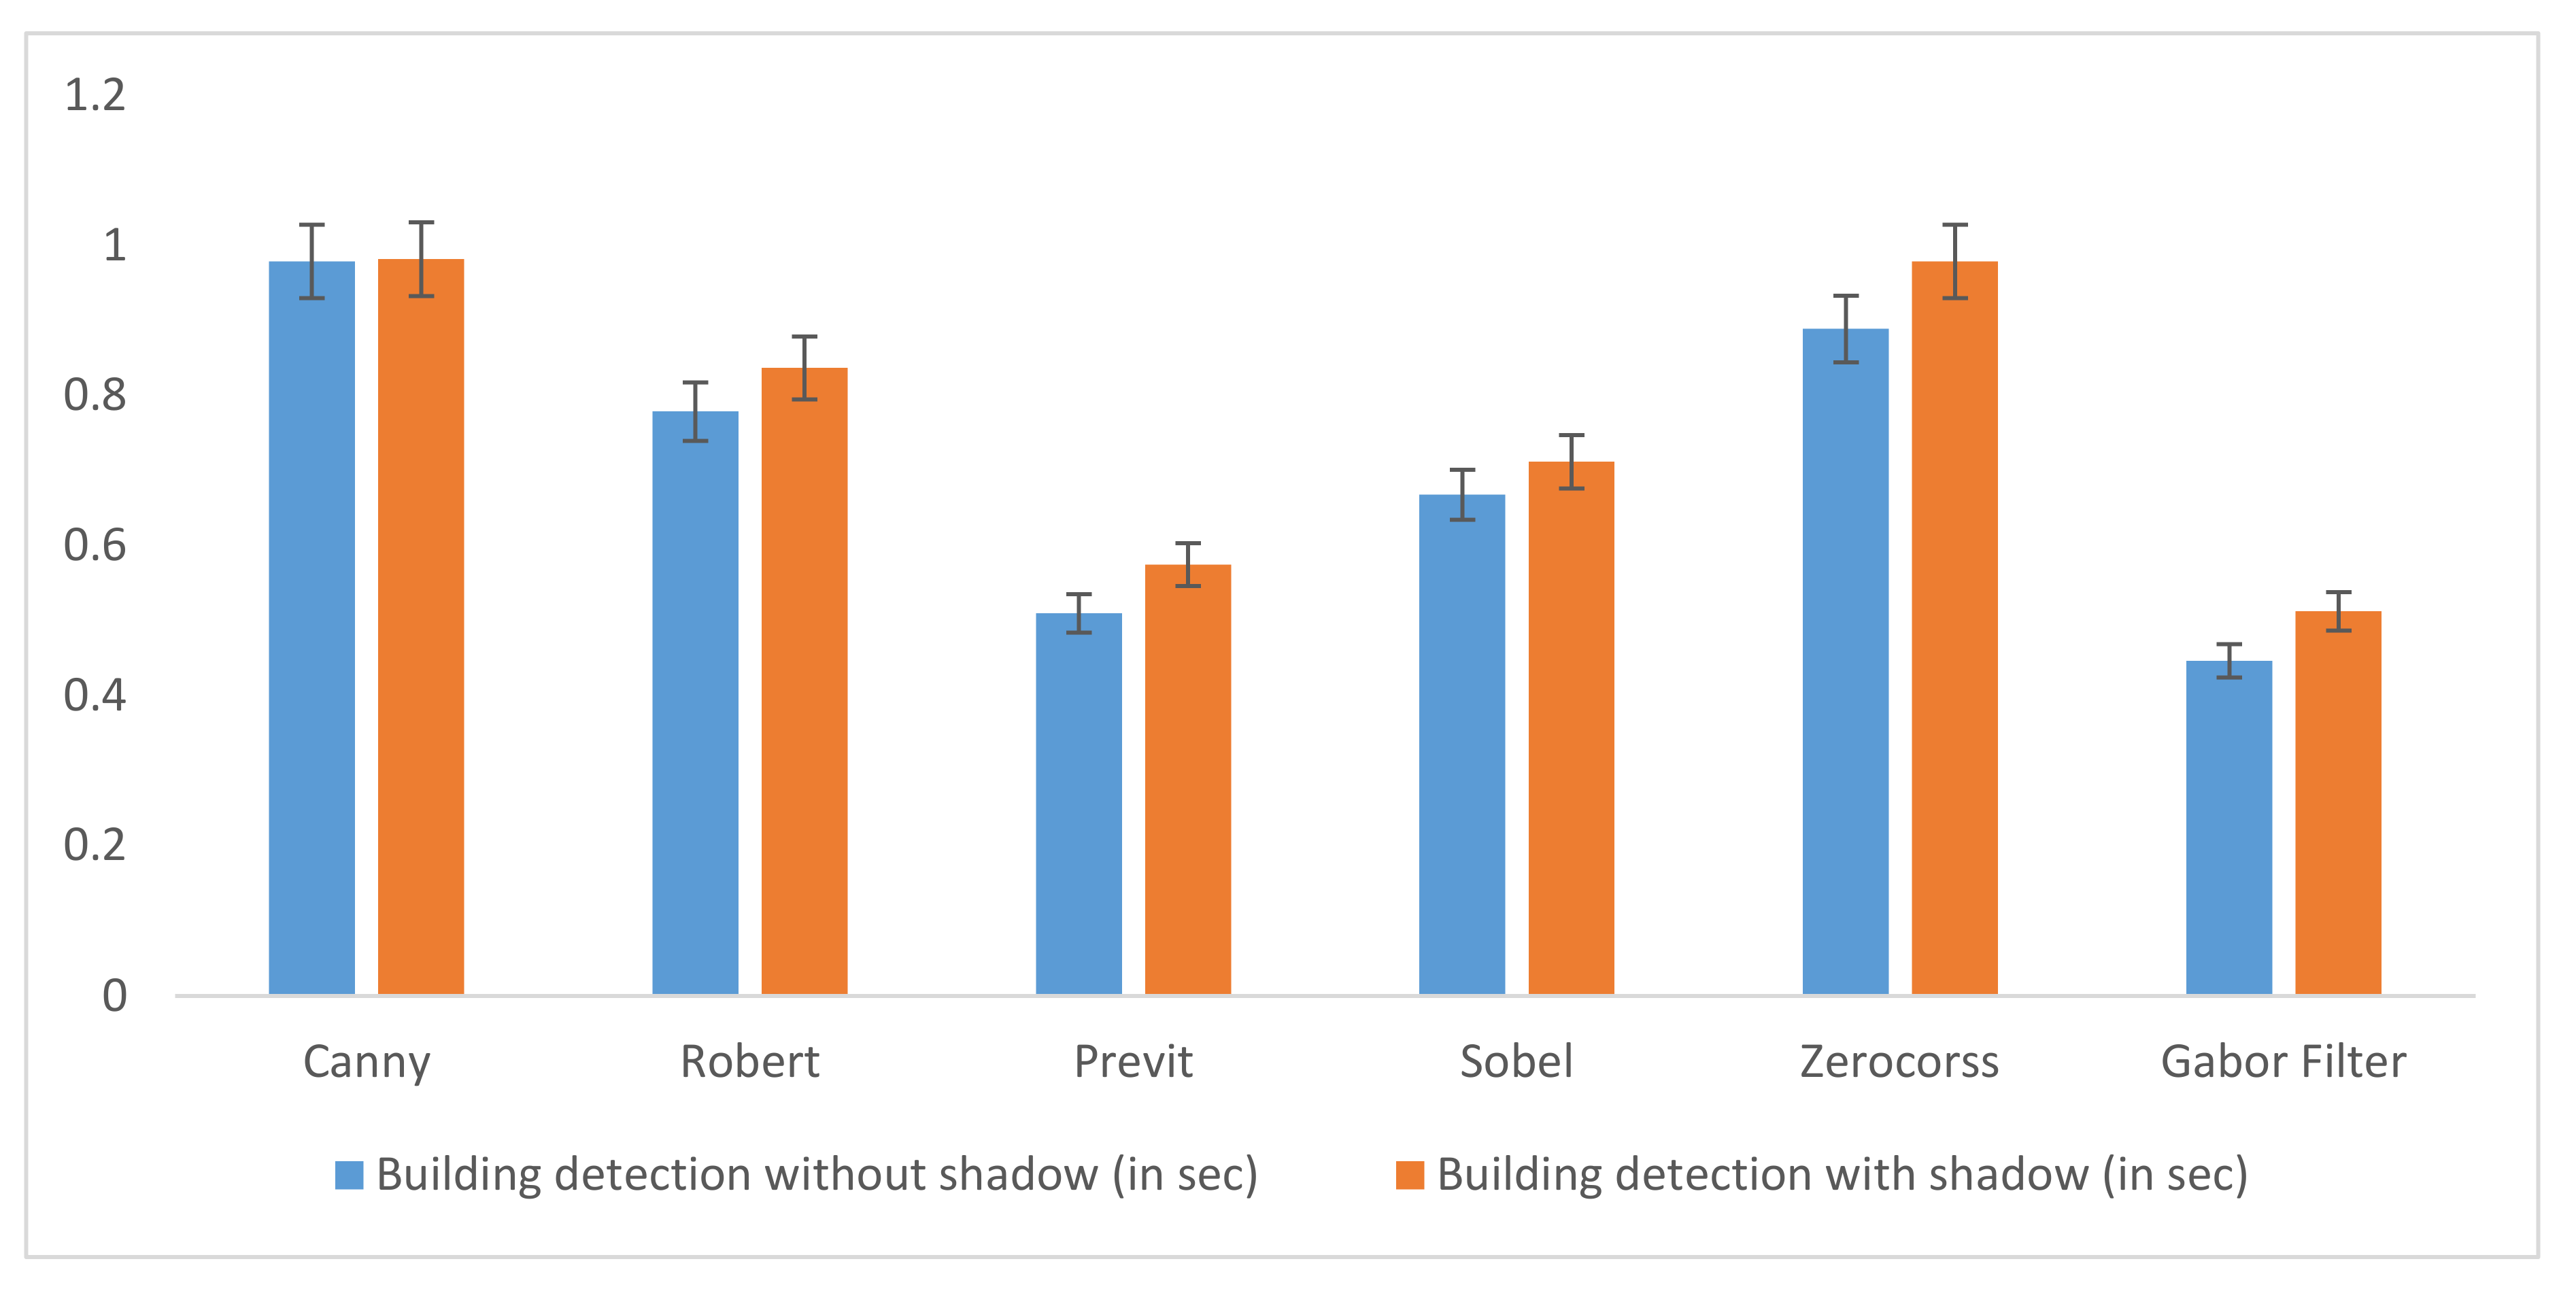
6. Computational Time
7. Conclusions
Author Contributions
Funding
Institutional Review Board Statement
Informed Consent Statement
Data Availability Statement
Conflicts of Interest
References
- Zakharov, A.; Tuzhilkin, A.; Zhiznyakov, A. Automatic building detection from satellite images using spectral graph theory. In Proceedings of the 2015 International Conference on Mechanical Engineering, Automation and Control Systems (MEACS), Tomsk, Russia, 1–4 December 2015; pp. 1–5. [Google Scholar]
- Benedek, C.; Shadaydeh, M.; Kato, Z.; Szirányi, T.; Zerubia, J. Multilayer Markov Random Field models for change detection in optical remote sensing images. ISPRS J. Photogramm. Remote Sens. 2015, 107, 22–37. [Google Scholar] [CrossRef] [Green Version]
- Segl, K.; Kaufmann, H. Detection of small objects from high-resolution panchromatic satellite imagery based on supervised image segmentation. IEEE Trans. Geosci. Remote Sens. 2001, 39, 2080–2083. [Google Scholar] [CrossRef]
- Molinier, M.; Laaksonen, J.; Väätäinen, S.; Häme, T. Self-organising maps for change detection and monitoring of human activity in satellite imagery. In Proceedings of the ESA-EUSC 2006 Image Information Mining for Security and Intelligence, Madrid, Spain, 27–29 November 2006. [Google Scholar]
- Munawar, H.; Khan, S.; Anum, N.; Qadir, Z.; Kouzani, A.; Mahmud, M.P. Post-Flood Risk Management and Resilience Building Practices: A Case Study. Appl. Sci. 2021, 11, 4823. [Google Scholar] [CrossRef]
- Munawar, H.S.; Hammad, A.; Ullah, F.; Ali, T.H. After the flood: A novel application of image processing and machine learning for post-flood disaster management. In Proceedings of the 2nd International Conference on Sustainable Development in Civil Engineering (ICSDC 2019), Jamshoro, Pakistan, 5–7 December 2019; pp. 5–7. [Google Scholar]
- Benediktsson, J.A.; Pesaresi, M.; Arnason, K. Classification and feature extraction for remote sensing images from urban areas based on morphological transformations. IEEE Trans. Geosci. Remote Sens. 2003, 41, 1940–1949. [Google Scholar] [CrossRef] [Green Version]
- Benediktsson, J.A.; Palmason, J.; Sveinsson, J.R. Classification of hyperspectral data from urban areas based on extended morphological profiles. IEEE Trans. Geosci. Remote Sens. 2005, 43, 480–491. [Google Scholar] [CrossRef]
- Li, M.; Stein, A.; Bijker, W.; Zhan, Q. Region-based urban road extraction from VHR satellite images using Binary Partition Tree. Int. J. Appl. Earth Obs. Geoinf. 2016, 44, 217–225. [Google Scholar] [CrossRef]
- Akçay, H.G.; Aksoy, S. Automatic Detection of Geospatial Objects Using Multiple Hierarchical Segmentations. IEEE Trans. Geosci. Remote Sens. 2008, 46, 2097–2111. [Google Scholar] [CrossRef]
- Munawar, H.S.; Khan, S.I.; Qadir, Z.; Kouzani, A.Z.; Mahmud, M.A. Insight into the Impact of COVID-19 on Australian Transportation Sector: An Economic and Community-Based Perspective. Sustainability 2021, 13, 1276. [Google Scholar] [CrossRef]
- Lacroix, V.; Idrissa, M.; Hincq, A.; Bruynseels, H.; Swartenbroekx, O. SPOT5 Images for Urbanization Detection. Proc. Int. Conf. PRL 2006, 27, 226–233. [Google Scholar]
- Ruhang, X.; Zhilin, L.; Yong, H.; Xiaoyu, Z. Identifying city PV roof resource based on Gabor filter. IOP Conf. Ser. Earth Environ. Sci. 2017, 69, 012157. [Google Scholar] [CrossRef]
- Qadir, Z.; Khan, S.I.; Khalaji, E.; Munawar, H.S.; Al-Turjman, F.; Mahmud, M.P.; Le, K. Predicting the energy output of hybrid PV–wind renewable energy system using feature selection technique for smart grids. Energy Rep. 2021. [Google Scholar] [CrossRef]
- Kyrki, V.; Kamarainen, J.-K.; Kälviäinen, H. Simple Gabor feature space for invariant object recognition. Pattern Recognit. Lett. 2004, 25, 311–318. [Google Scholar] [CrossRef]
- Idrissa, M.; Lacroix, V.; Hincq, A.; Bruynseels, H.; Swartenbroekx, O. SPOT5 images for urbanization detection. In Proceedings of the Advanced Concepts for Intelligent Vision Systems, Bordeaux, France, 28 September–2 October 2009. [Google Scholar]
- Zhao, H.; Xiao, P.; Feng, X. Optimal Gabor filter-based edge detection of high spatial resolution remotely sensed images. J. Appl. Remote Sens. 2017, 11, 15019. [Google Scholar] [CrossRef]
- Wu, J.; Wei, P.; Yuan, X.; Shu, Z.; Chiang, Y.-Y.; Fu, Z.; Deng, M. A New Gabor Filter-Based Method for Automatic Recognition of Hatched Residential Areas. IEEE Access 2019, 7, 40649–40662. [Google Scholar] [CrossRef]
- Sirmacek, B.; Unsalan, C. Urban-Area and Building Detection Using SIFT Keypoints and Graph Theory. IEEE Trans. Geosci. Remote Sens. 2009, 47, 1156–1167. [Google Scholar] [CrossRef]
- Praptono, N.H.; Sirait, P.; Fanany, M.I.; Arymurthy, A.M. An automatic detection method for high density slums based on regularity pattern of housing using Gabor filter and GINI index. In Proceedings of the 2013 International Conference on Advanced Computer Science and Information Systems (ICACSIS), Bali, Indonesia, 28–29 September 2013; pp. 347–351. [Google Scholar]
- Aamir, M.; Pu, Y.-F.; Rahman, Z.; Tahir, M.; Naeem, H.; Dai, Q. A Framework for Automatic Building Detection from Low-Contrast Satellite Images. Symmetry 2018, 11, 3. [Google Scholar] [CrossRef] [Green Version]
- Ling, X.; Zhang, Y.; Xiong, J.; Huang, X.; Chen, Z. An image matching algorithm integrating global SRTM and im-age segmentation for multi-source satellite imagery. Remote Sens. 2016, 8, 672. [Google Scholar] [CrossRef] [Green Version]
- Sowmya, A.; Trinder, J. Modelling and representation issues in automated feature extraction from aerial and satel-lite images. ISPRS J. Photogramm. Remote Sens. 2000, 55, 34–47. [Google Scholar] [CrossRef]
- San, D.K.; Turker, M. Building Extraction from High-Resolution Satellite Images Using Hough Transform; International Society of Photogrammetry and Remote Sensing: Hannover, Germany, 2010. [Google Scholar]
- Li, W.; He, C.; Fang, J.; Zheng, J.; Fu, H.; Yu, L. Semantic Segmentation-Based Building Footprint Extraction Using Very High-Resolution Satellite Images and Multi-Source GIS Data. Remote Sens. 2019, 11, 403. [Google Scholar] [CrossRef] [Green Version]
- Li, S.; Tang, H.; Huang, X.; Mao, T.; Niu, X. Automated Detection of Buildings from Heterogeneous VHR Satellite Images for Rapid Response to Natural Disasters. Remote Sens. 2017, 9, 1177. [Google Scholar] [CrossRef] [Green Version]
- Boonpook, W.; Tan, Y.; Ye, Y.; Torteeka, P.; Torsri, K.; Dong, S. A Deep Learning Approach on Building Detection from Unmanned Aerial Vehicle-Based Images in Riverbank Monitoring. Sensors 2018, 18, 3921. [Google Scholar] [CrossRef] [PubMed] [Green Version]
- Munawar, H.S. Image and Video Processing for Defect Detection in Key Infrastructure. In Machine Vision Inspection Systems; Wiley: Hoboken, NJ, USA, 2020; Volume 1, pp. 159–177. [Google Scholar]
- Munawar, H.S.; Zhang, J.; Li, H.; Mo, D.; Chang, L. Mining Multispectral Aerial Images for Automatic Detection of Strategic Bridge Locations for Disaster Relief Missions. In Transactions on Petri Nets and Other Models of Concurrency XV; Springer Science and Business Media LLC: Berlin, Germany, 2019; pp. 189–200. [Google Scholar]
- Huang, T.S.; Yang, G.J.; Tang, G.Y. A fast two-dimensional median filtering algorithm. IEEE Trans. Acoust. Speech Signal Process. 1979, 27, 13–18. [Google Scholar] [CrossRef] [Green Version]
- Lee, C.-J.; Wang, S.-D. Fingerprint feature extraction using Gabor filters. Electron. Lett. 1999, 35, 288. [Google Scholar] [CrossRef] [Green Version]
- Munawar, H.S.; Qayyum, S.; Ullah, F.; Sepasgozar, S. Big Data and its Applications in Smart Real Estate and the Disaster Management Life Cycle: A Systematic Analysis. Big Data Cogn. Comput. 2020, 4, 4. [Google Scholar] [CrossRef] [Green Version]
- Li, W.; Mao, K.; Zhang, H.; Chai, T. Selection of Gabor filters for improved texture feature extraction. In Proceedings of the 2010 IEEE International Conference on Image Processing, Hong Kong, China, 26–29 September 2010; pp. 361–364. [Google Scholar]
- Alshehhi, R.; Marpu, P.R.; Woon, W.L.; Mura, M.D. Simultaneous extraction of roads and buildings in remote sensing imagery with convolutional neural networks. ISPRS J. Photogramm. Remote Sens. 2017, 130, 139–149. [Google Scholar] [CrossRef]
- Sarwar, S.S.; Panda, P.; Roy, K. Gabor filter assisted energy efficient fast learning convolutional neural net-works. In Proceedings of the 2017 IEEE/ACM International Symposium on Low Power Electronics and Design (ISLPED), Taipei, Taiwan, 24–26 July 2017; pp. 1–6. [Google Scholar]
- Munawar, H.S. Flood Disaster Management: Risks, Technologies, and Future Directions. In Machine Vision in-Spection Systems: Image Processing, Concepts, Methodologies and Applications; John Wiley & Sons Inc.: Hoboken, NJ, USA, 2020; Volume 1, pp. 115–146. [Google Scholar]
- Munawar, H.S. An Overview of Reconfigurable Antennas for Wireless Body Area Networks and Possible Future Prospects. Int. J. Wirel. Microw. Technol. 2020, 10, 1–8. [Google Scholar] [CrossRef] [Green Version]
- Shen, X.; Wang, M.; Peng, K.; Xiong, S. A building extraction method via Gabor filter and mul-ti-orientation π local binary pattern operator. In Proceedings of the Twelfth International Conference on Graphics and Image Processing (ICGIP 2020 International Society for Optics and Photonics, Xi’an, China, 13–15 November 2020; Volume 11720, p. 117201W. [Google Scholar]
- Hu, X.; Zhang, P.; Xiao, Y. Military Object Detection Based on Optimal Gabor Filtering and Deep Feature Pyramid Network. In Proceedings of the 2019 International Conference on Artificial Intelligence and Computer Science, Wuhan, China, 12–13 July 2019; pp. 524–530. [Google Scholar]
- Tan, K.; Zhang, Y.; Wang, X.; Chen, Y. Object-Based Change Detection Using Multiple Classifiers and Multi-Scale Uncertainty Analysis. Remote Sens. 2019, 11, 359. [Google Scholar] [CrossRef] [Green Version]
- Moftah, H.M.; Mohamed, T.M. A Novel Fuzzy Bat Based Ambulance Detection and Traffic Counting Approach. J. Cybersecur. Inf. Manag. 2021, 1, 41–54. [Google Scholar]
- Jothi, S.A.; Dhatchayani, K.; Devi, G.R.; Raja, M.R. VLSI Implementation of Gabor Filter in Image Detection–Research Direction. Int. J. Circuit Theory Appl. 2017, 10, 133–138. [Google Scholar]
- Plodpradista, P.; Keller, J.M.; Ho DK, C.; Popescu, M. Tuning log Gabor filter bank using genetic algo-rithm-based optimization. In Detection and Sensing of Mines, Explosive Objects, and Obscured Targets XXII; International Society for Optics and Photonics: Bellingham, WA, USA, 2017; Volume 10182, p. 101821C. [Google Scholar]
- Reji, A.A.A.; Muruganantham, S. Building Detection from Satellite Images for Urban Planning Using MATLAB-Based Pattern Matching Method. Int. J. Creat. Interfaces Comput. Graph. 2019, 10, 17–28. [Google Scholar] [CrossRef]
- Munawar, H.S. Reconfigurable Origami Antennas: A Review of the Existing Technology and its Future Prospects. Int. J. Wirel. Microw. Technol. 2020, 10, 34–38. [Google Scholar] [CrossRef]


| Sydney | Tokyo | Mumbai | Newcastle |
|---|---|---|---|
| 0.90 | 0.88 | 0.82 | 0.93 |
| Steps | Building Detection without Shadow (in Sec) | Building Detection with Shadow (in Sec) |
|---|---|---|
| Pre-processing | 0.0979 | 0.0982 |
| Local feature vector | 0.0179 | 0.0837 |
| Building detection | 0.3310 | 0.3315 |
| Total | 0.4468 | 0.5126 |
| Accuracy (Building detection) | 91.2% | 93.5% |
| Methods | Building Detection without Shadow (in Sec) | Building Detection with Shadow (in Sec) |
|---|---|---|
| Canny | 0.979 | 0.982 |
| Robert | 0.779 | 0.837 |
| Previt | 0.510 | 0.575 |
| Sobel | 0.668 | 0.712 |
| Zerocorss | 0.889 | 0.979 |
| Gabor Filter | 0.4468 | 0.5126 |
Publisher’s Note: MDPI stays neutral with regard to jurisdictional claims in published maps and institutional affiliations. |
© 2021 by the authors. Licensee MDPI, Basel, Switzerland. This article is an open access article distributed under the terms and conditions of the Creative Commons Attribution (CC BY) license (https://creativecommons.org/licenses/by/4.0/).
Share and Cite
Munawar, H.S.; Aggarwal, R.; Qadir, Z.; Khan, S.I.; Kouzani, A.Z.; Mahmud, M.A.P. A Gabor Filter-Based Protocol for Automated Image-Based Building Detection. Buildings 2021, 11, 302. https://0-doi-org.brum.beds.ac.uk/10.3390/buildings11070302
Munawar HS, Aggarwal R, Qadir Z, Khan SI, Kouzani AZ, Mahmud MAP. A Gabor Filter-Based Protocol for Automated Image-Based Building Detection. Buildings. 2021; 11(7):302. https://0-doi-org.brum.beds.ac.uk/10.3390/buildings11070302
Chicago/Turabian StyleMunawar, Hafiz Suliman, Riya Aggarwal, Zakria Qadir, Sara Imran Khan, Abbas Z. Kouzani, and M. A. Parvez Mahmud. 2021. "A Gabor Filter-Based Protocol for Automated Image-Based Building Detection" Buildings 11, no. 7: 302. https://0-doi-org.brum.beds.ac.uk/10.3390/buildings11070302