
Knowledge Map of Urban Morphology and Thermal Comfort: A Bibliometric Analysis Based on CiteSpace


School of Human Settlements and Civil Engineering, Xi’an Jiaotong University, Xi’an 710049, China
*
Author to whom correspondence should be addressed.
Buildings 2021, 11(10), 427; https://0-doi-org.brum.beds.ac.uk/10.3390/buildings11100427
Submission received: 28 August 2021
/
Revised: 18 September 2021
/
Accepted: 18 September 2021
/
Published: 23 September 2021
(This article belongs to the Special Issue Research on Urban Heat Island and Heavily Polluted Cities)
Abstract
:In the context of global climate change, urban morphology is closely related to thermal comfort and contributes to sustainable urban development. Academics started to pay attention to related topics and carried out many studies during the last decades. This paper aims to summarize the research achievements and the development track for future studies. The Web of Science database and CiteSpace were used in this paper to conduct a bibliometric analysis of 556 studies in related fields from 1993 to 2020. Using a three-level co-occurrence analysis of 446 keywords, 1187 cocited literature clusters, and 15 landmark studies, the research topics and mainstream research frameworks were identified. The results show that with the increasing participation of disciplines such as computer science, ecology, and chemistry, the purpose of future research will shift to a focus on anthropogenic heat emissions, energy consumption, air pollution, and other aspects, and new research tools will be needed. In addition to building-scale and block-scale morphology, urban-scale morphology and green infrastructure will become the focus in the future. This study provides a systematic review of research about urban morphology and thermal comfort, which can inspire other researchers and policy makers.
1. Introduction
According to the World Urbanization Prospects 2018 report issued by the United Nations, more than half the world’s population currently lives in cities. In 2050, the global urbanization rate is expected to reach 68% [1]. Population growth and urban development have caused a series of negative impacts on urban environments, such as global warming [2], climate change [3], air pollution [4], and traffic congestion [5]. One of the most serious problems is the deterioration of the urban thermal environment [6], which results in the urban heat island (UHI) effect. This refers to a phenomenon in which the air or surface temperature in a city is higher than that in surrounding rural areas [7]. The UHI effect increases urban energy consumption and deteriorates the ecological environment, directly affecting human health.
Urban morphology studies are focusing on the formation of human settlements and the process of urban formation and transformation, which seeks to categorize the spatial structure and character of the urban form. Urban morphology information is an important indicator for urban planning, information management, and urban climatic applications [8]. Rapidly increasing urbanization takes place when a large portion of the population migrates from rural to urban areas. The urban built environment begins to develop toward high density and three-dimensionality. High-density urban development has changed the characteristics of the underlying urban surface [9] and urban morphology, affecting the urban energy balance and human thermal comfort [10]. According to the American Society of Heating, Refrigerating, and Air-Conditioning Engineers (ASHRAE) thermal comfort refers to “that condition of mind that expresses satisfaction with the thermal environment and is assessed by subjective evaluation” [11]. Commonly used thermal indices include predicted mean vote (PMV) [12], physiological equivalent temperature (PET) [13], and universal thermal climate index (UTCI) [14]. Shakoor reviewed the relationship between summertime temperature and mortality and showed that the risk of mortality increases by 1 to 3% with a 1 °C increase in mean temperature [15]. For example, the 2003 heatwaves in southern Europe caused about 15,000 deaths in France [16] and about 25,000 to 70,000 deaths in Europe. With more frequent severe occurrences of extreme weather such as heatwaves, citizens are facing a continuous health risk [17].
Many studies have been conducted on the relationship between urban morphology and urban thermal comfort in different climatic regions, combined with the field measurement and numerical simulation techniques [18], for analysis according to different climatic scales [19]. The results show that urban morphology is closely related to urban thermal comfort, and changes in urban morphology will lead to different levels of thermal comfort [20]. Furthermore, improper urban forms will exacerbate extreme high-temperature events in cities [21]. Urban morphology directly affects thermal comfort by affecting solar radiation, average radiation temperature, wind speed, and the formation of different shadows. In addition, in high-density urban areas, in order to meet indoor and outdoor thermal comfort needs, a large amount of energy needs to be consumed, which increases anthropogenic heat emission and affects thermal comfort [22]. Consequently, improving urban thermal comfort in terms of urban morphology has become a key issue in the field of urban planning and climate research.
Many research topics and findings have been generated, and a certain amount of literature reviews have accumulated around these topics, which have made significant contributions to the field, such as climate background, research methods, correlation research, and strategy research. The topics covered in these reviews include related research against the background of a warm and humid climate [23], computational fluid dynamics (CFD) simulation methods [24,25], thermal comfort indices [26], research on the effects of green spaces with regard to thermal comfort [27], research on thermal comfort on different scales in cities [28,29,30,31], strategy research [25,30,32,33,34], and the effectiveness of green roof technology in alleviating thermal comfort [35].
Recently, with the emergence of visual bibliometric analysis technology, the use of knowledge graphs to visualize systematic reviews in a certain field has shown an increasing trend [36]. There have been several bibliometric analysis reviews on urban climate-related fields, including urban planning and environmental governance under global climate change [2,37], the application of local climate zone (LCZ) in urban sustainability [38], and the role of street space in residents’ health [39]; however, there has not yet been a review of the overall research progress of urban morphology in terms of thermal comfort. It is necessary to sort out the related literature; identify the mainstream research framework; and determine the research themes, frontiers, and trends in this field. Therefore, based on bibliometric analysis, we carried out a systematic review of the related literature on urban morphology and thermal comfort in order to help relevant researchers to grasp the research progress in journals, countries, research fields, and keyword co-occurrence and cocitation and promote urban thermal comfort improvement and mitigation.
2. Materials and Methods
2.1. Materials
In order to ensure the integrity and academic of the analyzed literature, we selected the core collection in Web of Science as a database, which includes Science Citation Index Expanded (SCI-E), Social Science Citation Index (SSCI), Arts & Humanities Citation Index (A&HCI), Conference Proceedings Citation Index—Science (CPCI-S), Conference Proceedings Citation Index—Social Science & Humanities (CPCI-SSH), Emerging Sources Citation Index (ESCI), and Current Chemical Reactions (CCR). We selected “Topic” as retrieval type, which can search title, abstract, author keywords, and keywords plus from the database. As the academic expression of “urban morphology” also uses “urban geometry” and “urban form “, the retrieval topic was “urban morphology” or “urban geometry” or “urban form” and “thermal comfort”. The retrieval time span was unlimited (1900 to present), and the retrieval date was 11 December 2020. Three retrievals yielded 203,259,330 articles. After deduplication of the search results, 556 valid publications were finally obtained, contributed by 1528 authors from 70 countries and 608 research institutions, covering the period 1993 to 2020. All documents were exported to CiteSpace 5.7 for calculation and analysis.
2.2. Methods
Knowledge mapping, a cutting-edge analysis method in bibliometrics and scientometrics, can intuitively express the results of quantitative analysis of subject knowledge in visual form. The current knowledge mapping analysis tools include HistCite, SCI2, VOSviewer, and CiteSpace [40]. CiteSpace is a widely used Java platform-based knowledge mapping software developed by Chaomei Chen at Drexel University, USA, which can perform cocitation, co-occurrence, and collaboration network analysis of database literature and visually and intuitively express the evolutionary trends, knowledge association status, and research frontiers [36]. CiteSpace has been applied in more than 60 research fields, including computer science, information science, medicine, engineering, and business economics [41].
We used CiteSpace to visually analyze the literature in the field of urban morphology and thermal comfort. The results of the study focused on six aspects: temporal distribution of the publications, journal cocitations, country co-occurrence distribution, keyword co-occurrence, literature cocitation networks, and landmark literature. Reference cocitation analysis was initially proposed by Small [42]. Its specific principle is that if two papers are jointly cited by a third paper, then the two papers form a cocitation relationship. Cocitation networks cover the fundamentals of urban morphology and thermal comfort in different periods, and the correspondence between citing papers and cited ones represents the frontier of literature in the field. In CiteSpace, the log-likelihood ratio (LLR) algorithm is used to extract noun terms from the titles of these documents to name the research contents corresponding to the clusters [43]. Cluster analysis of cocitation references can clearly reflect the research framework of urban morphology and thermal comfort and provides evidence for the development of this field. The different parameters in the results reflect the frequency and academic influence of each node.
3. Results
3.1. Analysis of Developments in the Research Field
3.1.1. Literature Development Trends
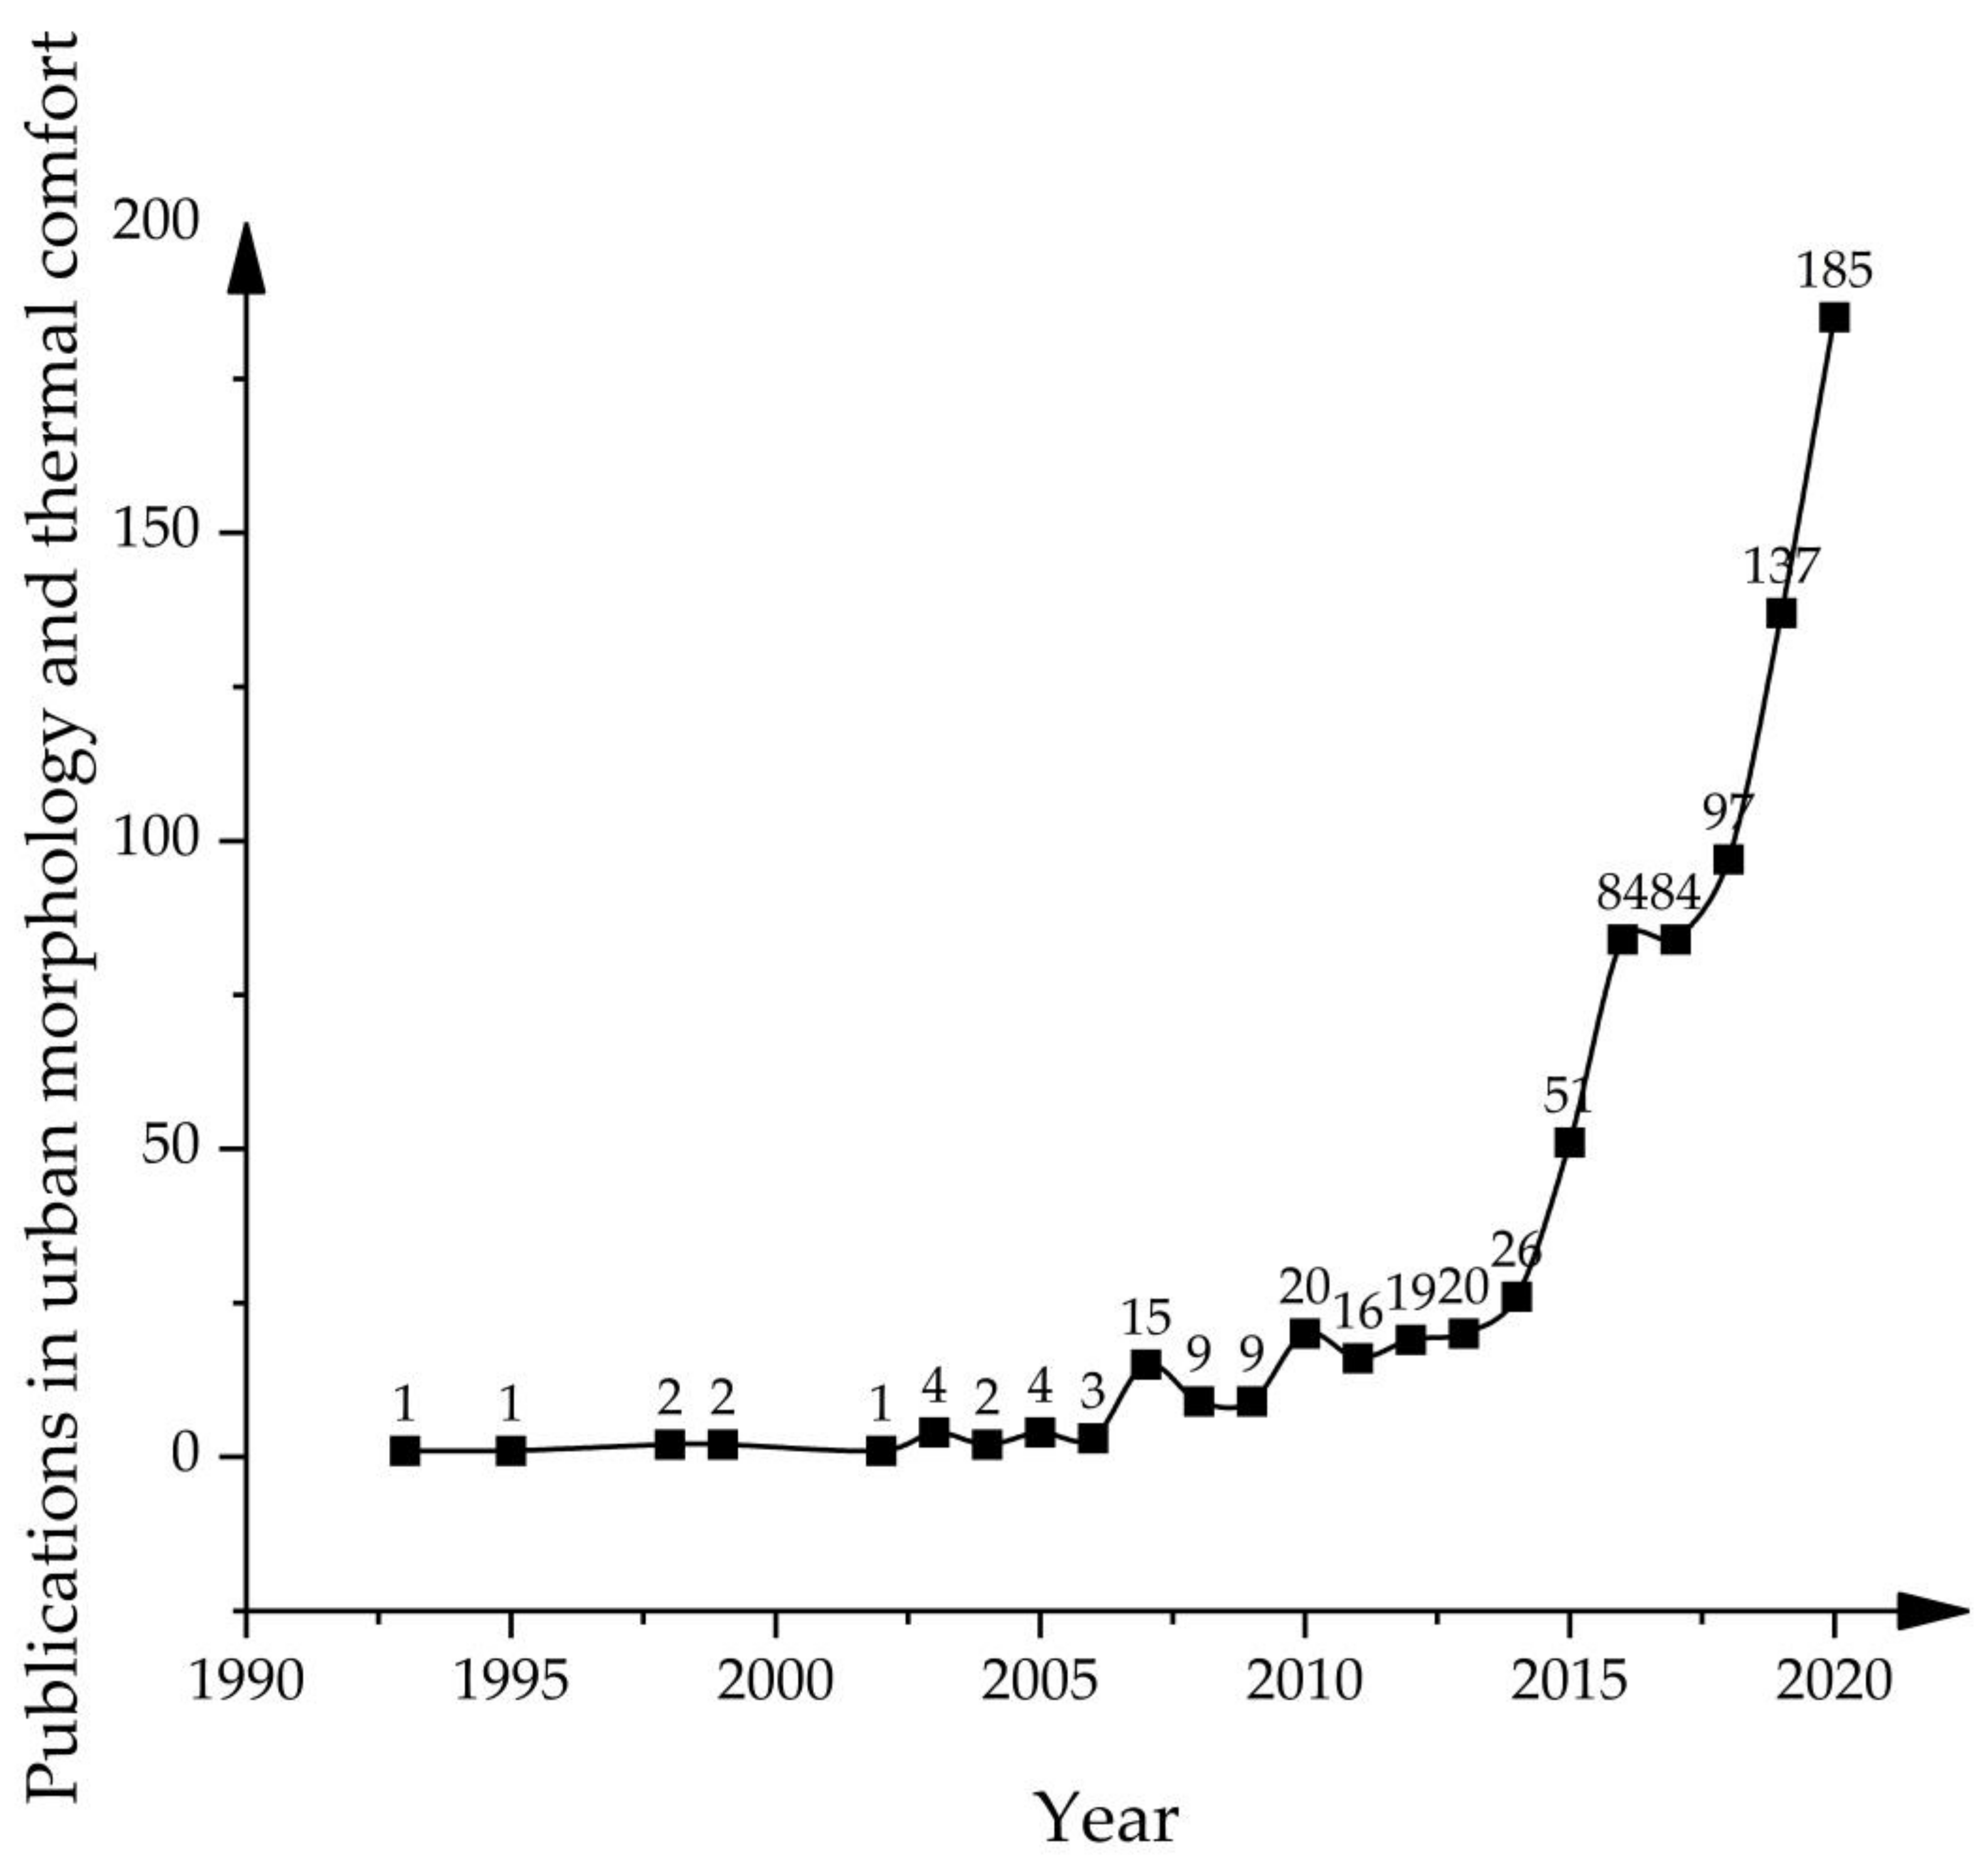
The number of publications is an important indicator of the development tendency in urban morphology and thermal comfort research. The annual distribution of articles together with their cumulative numbers is plotted in Figure 1, where it can be seen that research in this field shows an exponential growth trend year by year. In particular, 2007 and 2015 are important years; the number of papers before 2007 was very small, and the subject had not yet attracted the attention of the academic community. The number of papers in urban morphology and thermal comfort research from 2007 to 2014 increased to a certain extent, but the yearly number is relatively stable, with an average of 17 papers per year, indicating that this field began to attract the attention of the academic community. Since 2015, the number of publications has shown substantial and rapid growth year by year, with an average number of annual publications of 117 articles and an average annual growth rate of 21.6%, indicating that research in urban morphology and thermal comfort has attracted widespread attention from the academic community and has become a research hotspot.
3.1.2. Cited Journals
The node type was set to cited journal and the time slice was set to 1 year to generate a cocited map of journals. The node value was 742 and the connection value was 1502, which means that 742 journals were cited in this field and 1502 academic relationships were generated. These were sorted by the number of citations of journals, and the top three journals cited were Building and Environment, Energy and Buildings, and Landscape and Urban Planning. According to the centrality ranking, the top three journals with academic influence were ASHRAE Transactions, Energy and Buildings, and Boundary-Layer Meteorology. The top 10 journals mainly focus on architecture, environment, energy, landscape, urban planning, biometeorology, climatology, and sustainable society, reflecting that these topics are the main research directions in this field, as shown in Table 1.
3.1.3. Geographic Distribution
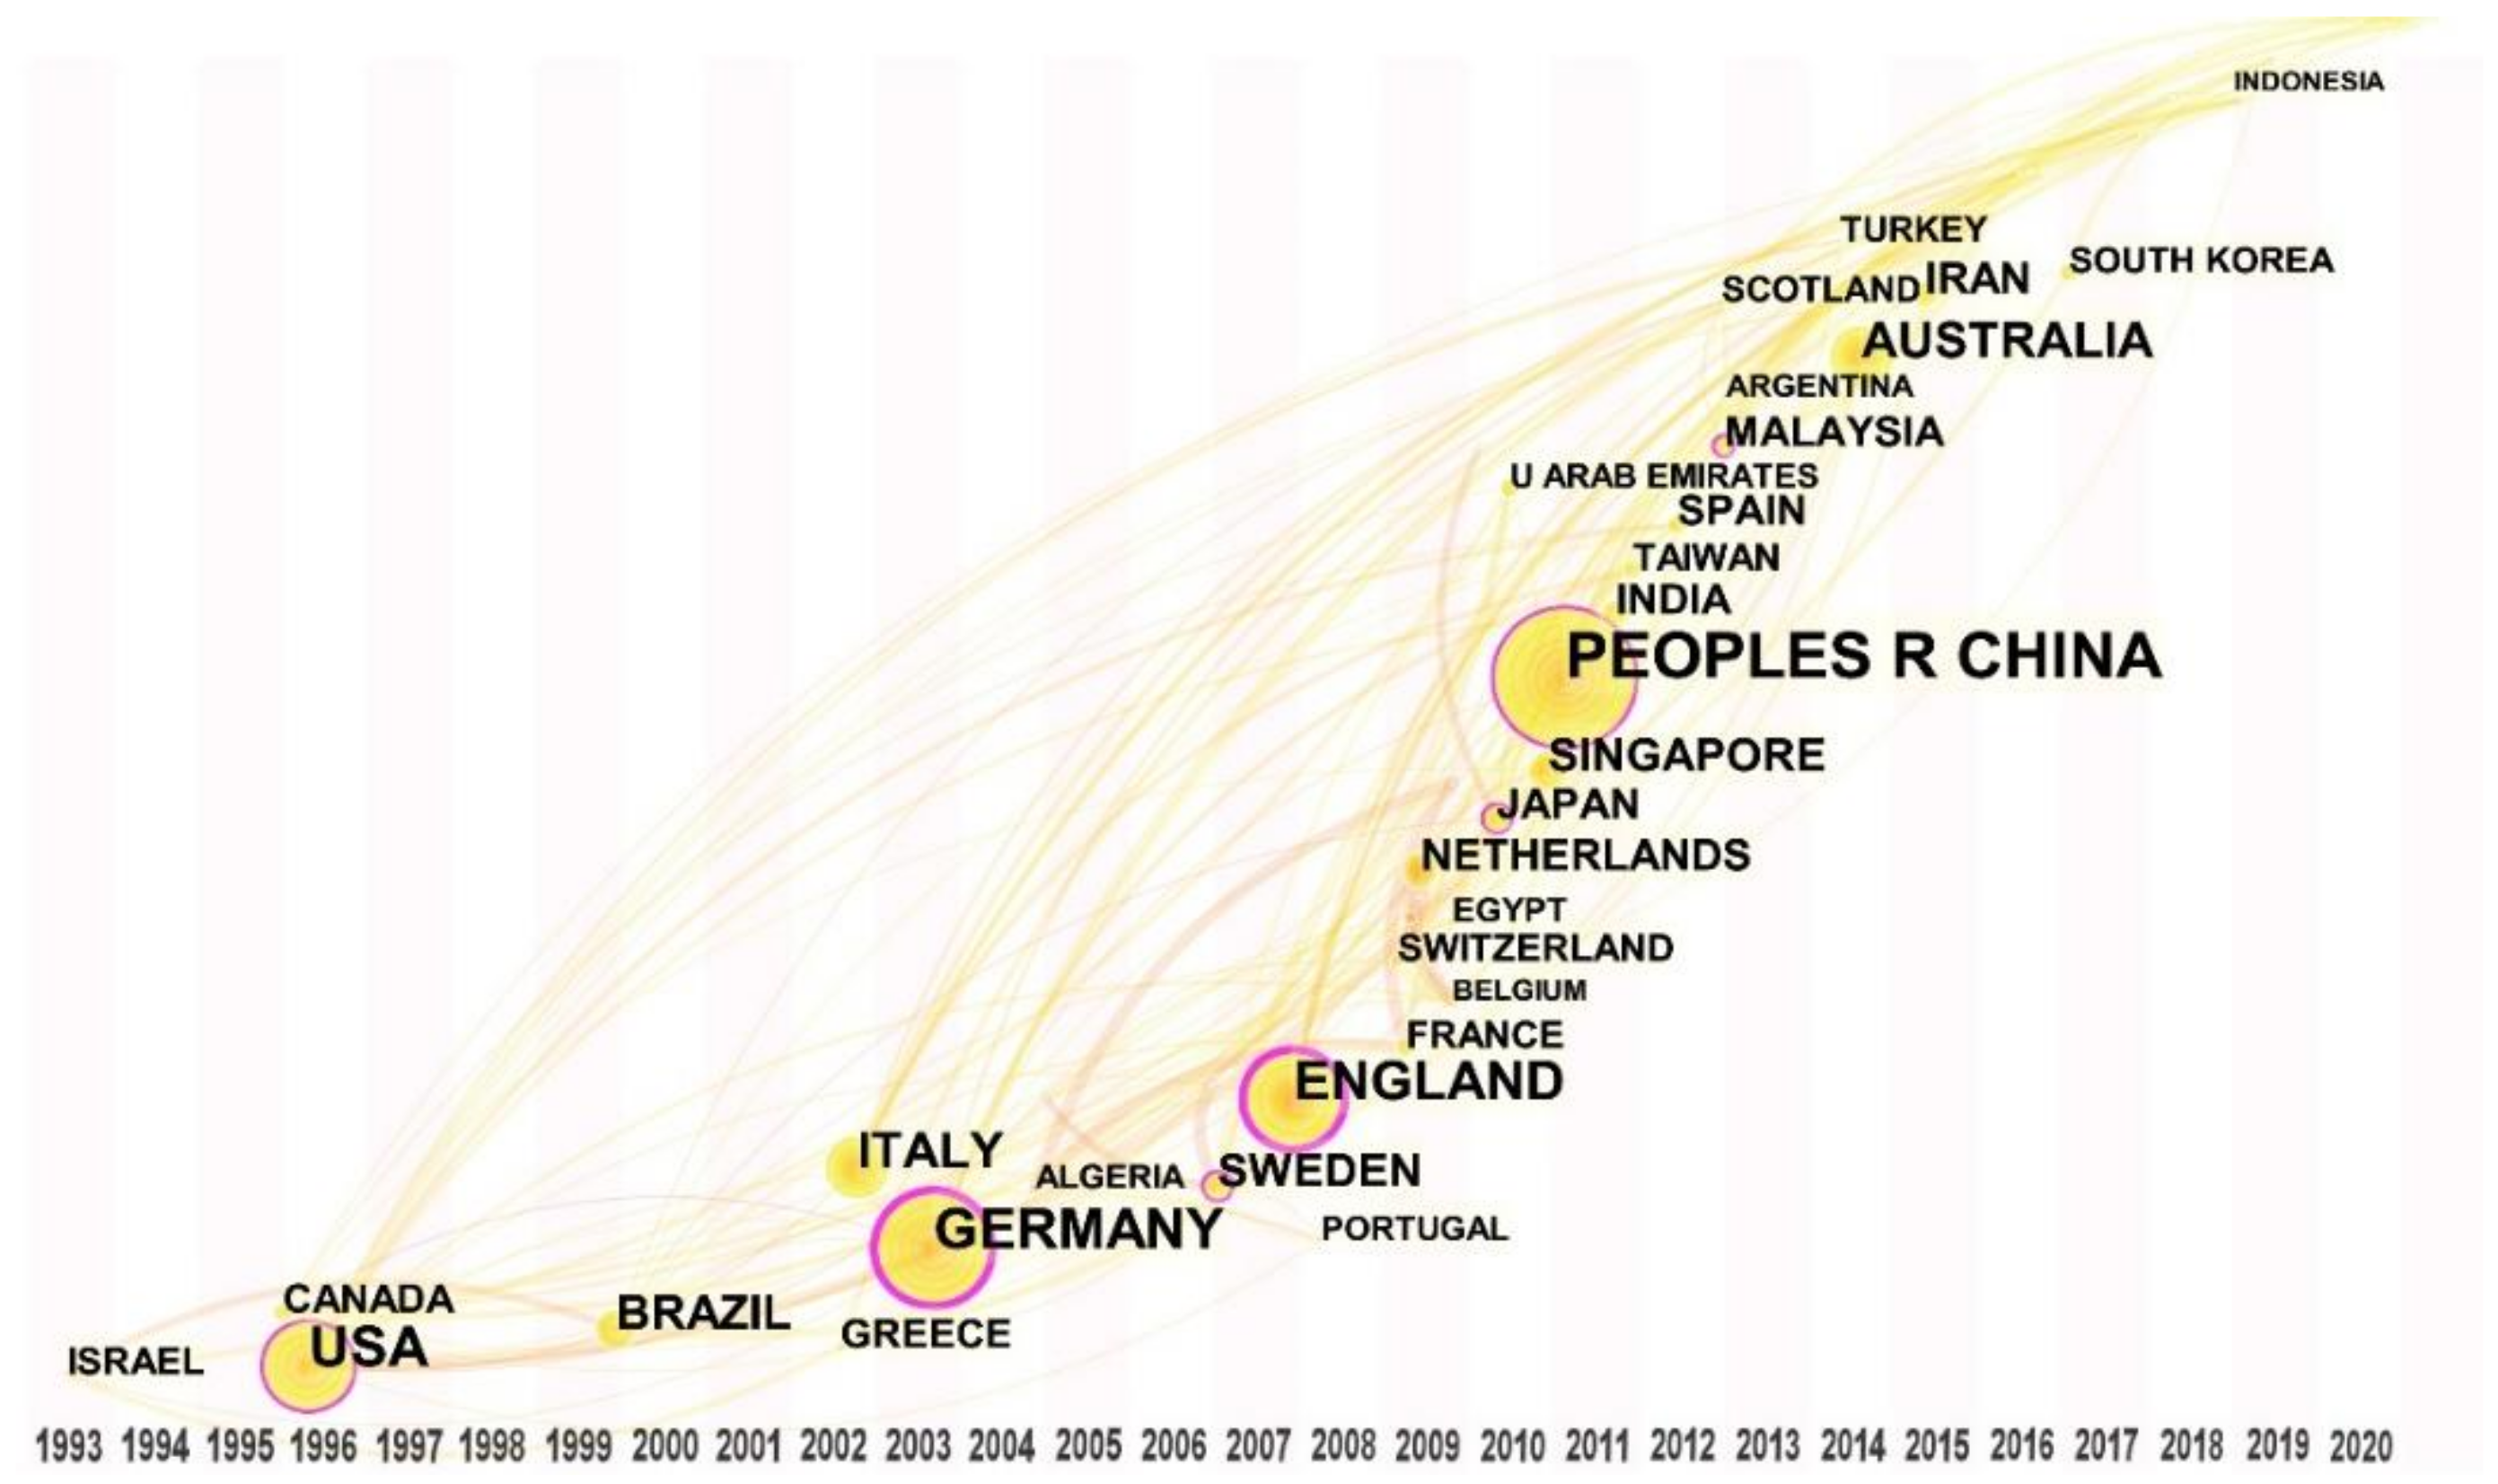
The node type was set to country, the time slice to 1 year, and the pruning method to MST, and sorting was done by the time of first issue to generate a national and regional time-zone map of the field, as shown in Figure 2. A total of 70 nodes and 149 lines were obtained, representing that 70 countries carried out relevant research in this field and 149 cooperative relationships were produced. According to Table 2, Israel was the first to conduct research in the field in 1993, followed by the USA (1995) and Canada (1995). China has the highest number of papers (115 papers), followed by the USA (61 papers) and Germany (59 papers). The countries with the strongest academic influence are Germany (0.27), the USA (0.27), and England (0.21), in that order.
3.1.4. Research Subjects
Setting the node type to category and the time slice to 1 year generated a co-occurrence map of subject categories. A total of 98 nodes and 173 lines were obtained, which means related research was carried out in 98 subject categories and 173 cooperative relationships were generated. According to the time of publication, meteorology and atmospheric sciences first started relevant research in 1993, followed by public administration (1995), urban studies (1995), and regional and urban planning (1995). Table 3 lists the top 10 subject categories in terms of academic influence according to centrality.
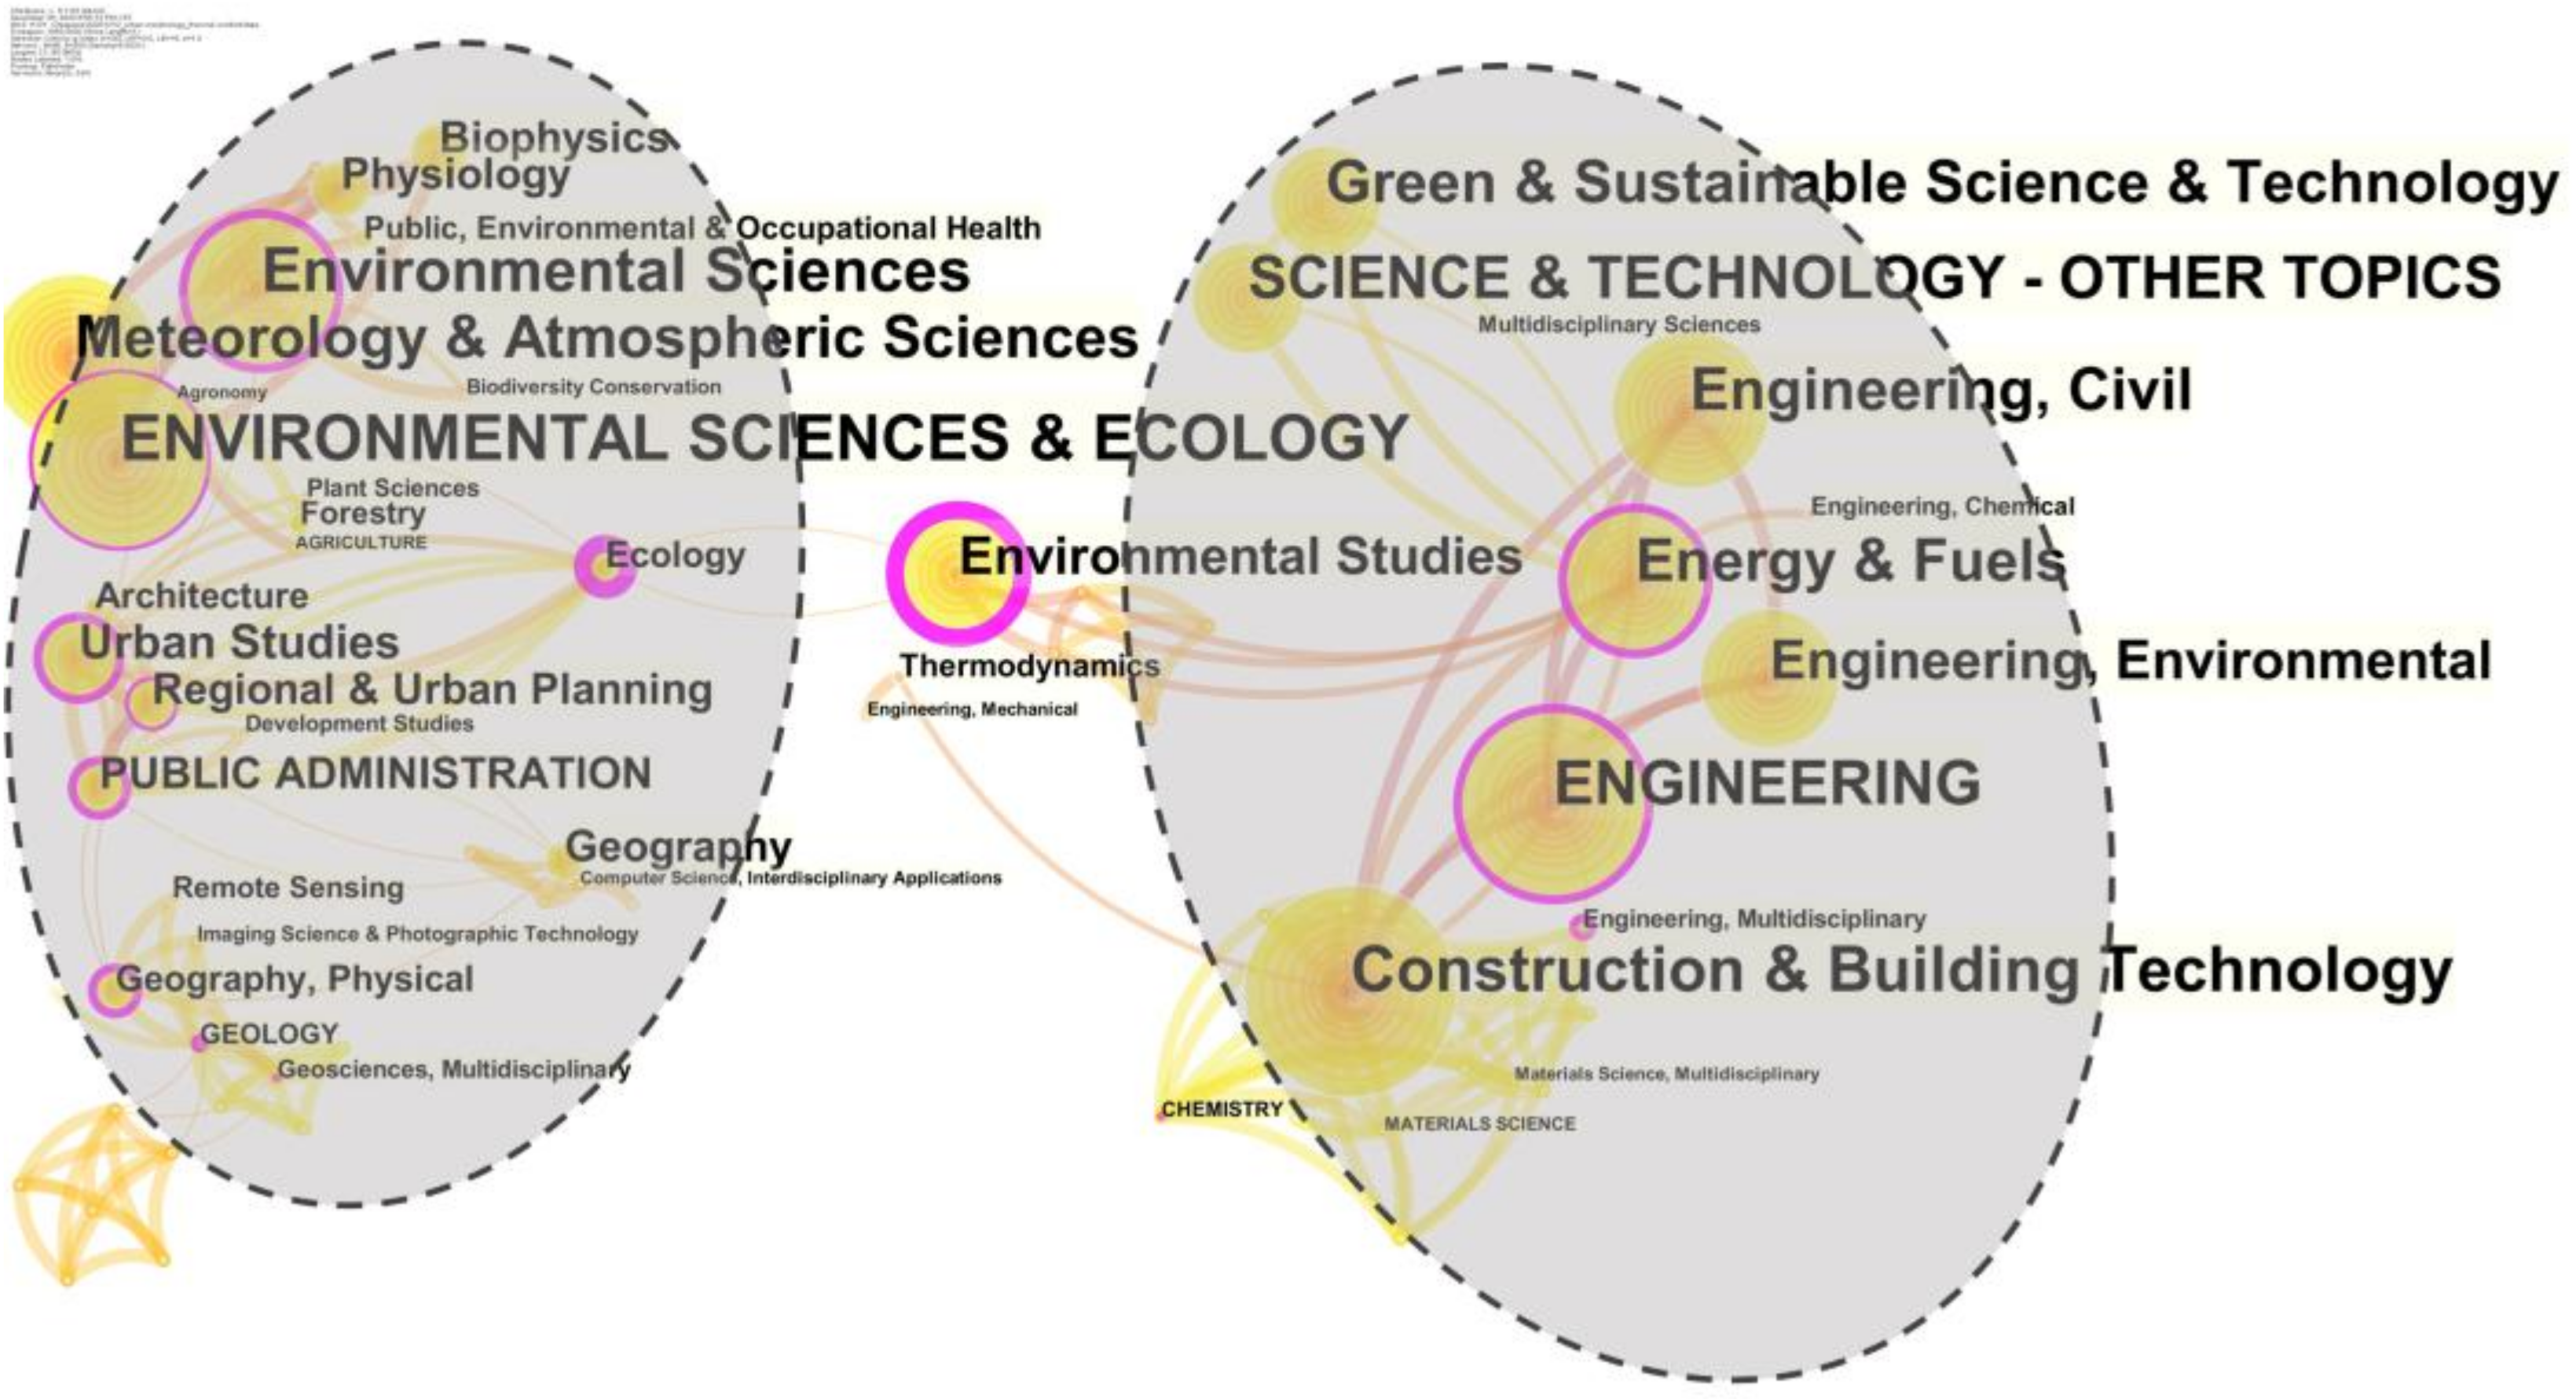
In the analysis options, the size of each node represents the frequency of occurrence, and the outer purple border represents the betweenness centrality, the thicker borders means the higher betweenness centrality and the greater academic influence from the node; lines between nodes represent connections, and the thicker lines mean stronger academic connections. The research field is clearly divided into two major directions, as shown in Figure 3: one is ecology-centered, in which environmental sciences, meteorology and atmospheric sciences, ecology, urban planning, and geography form a strong academic link; the other is centered on civil engineering and technFology, in which engineering, energy and fuels, civil engineering, and construction and building technology form a strong connection. The two directions are connected by environmental studies, which shows that this is the core discipline of this research field. Meteorology and atmospheric sciences and ecology are the strongest citation bursts, showing that they play an important role in the field.
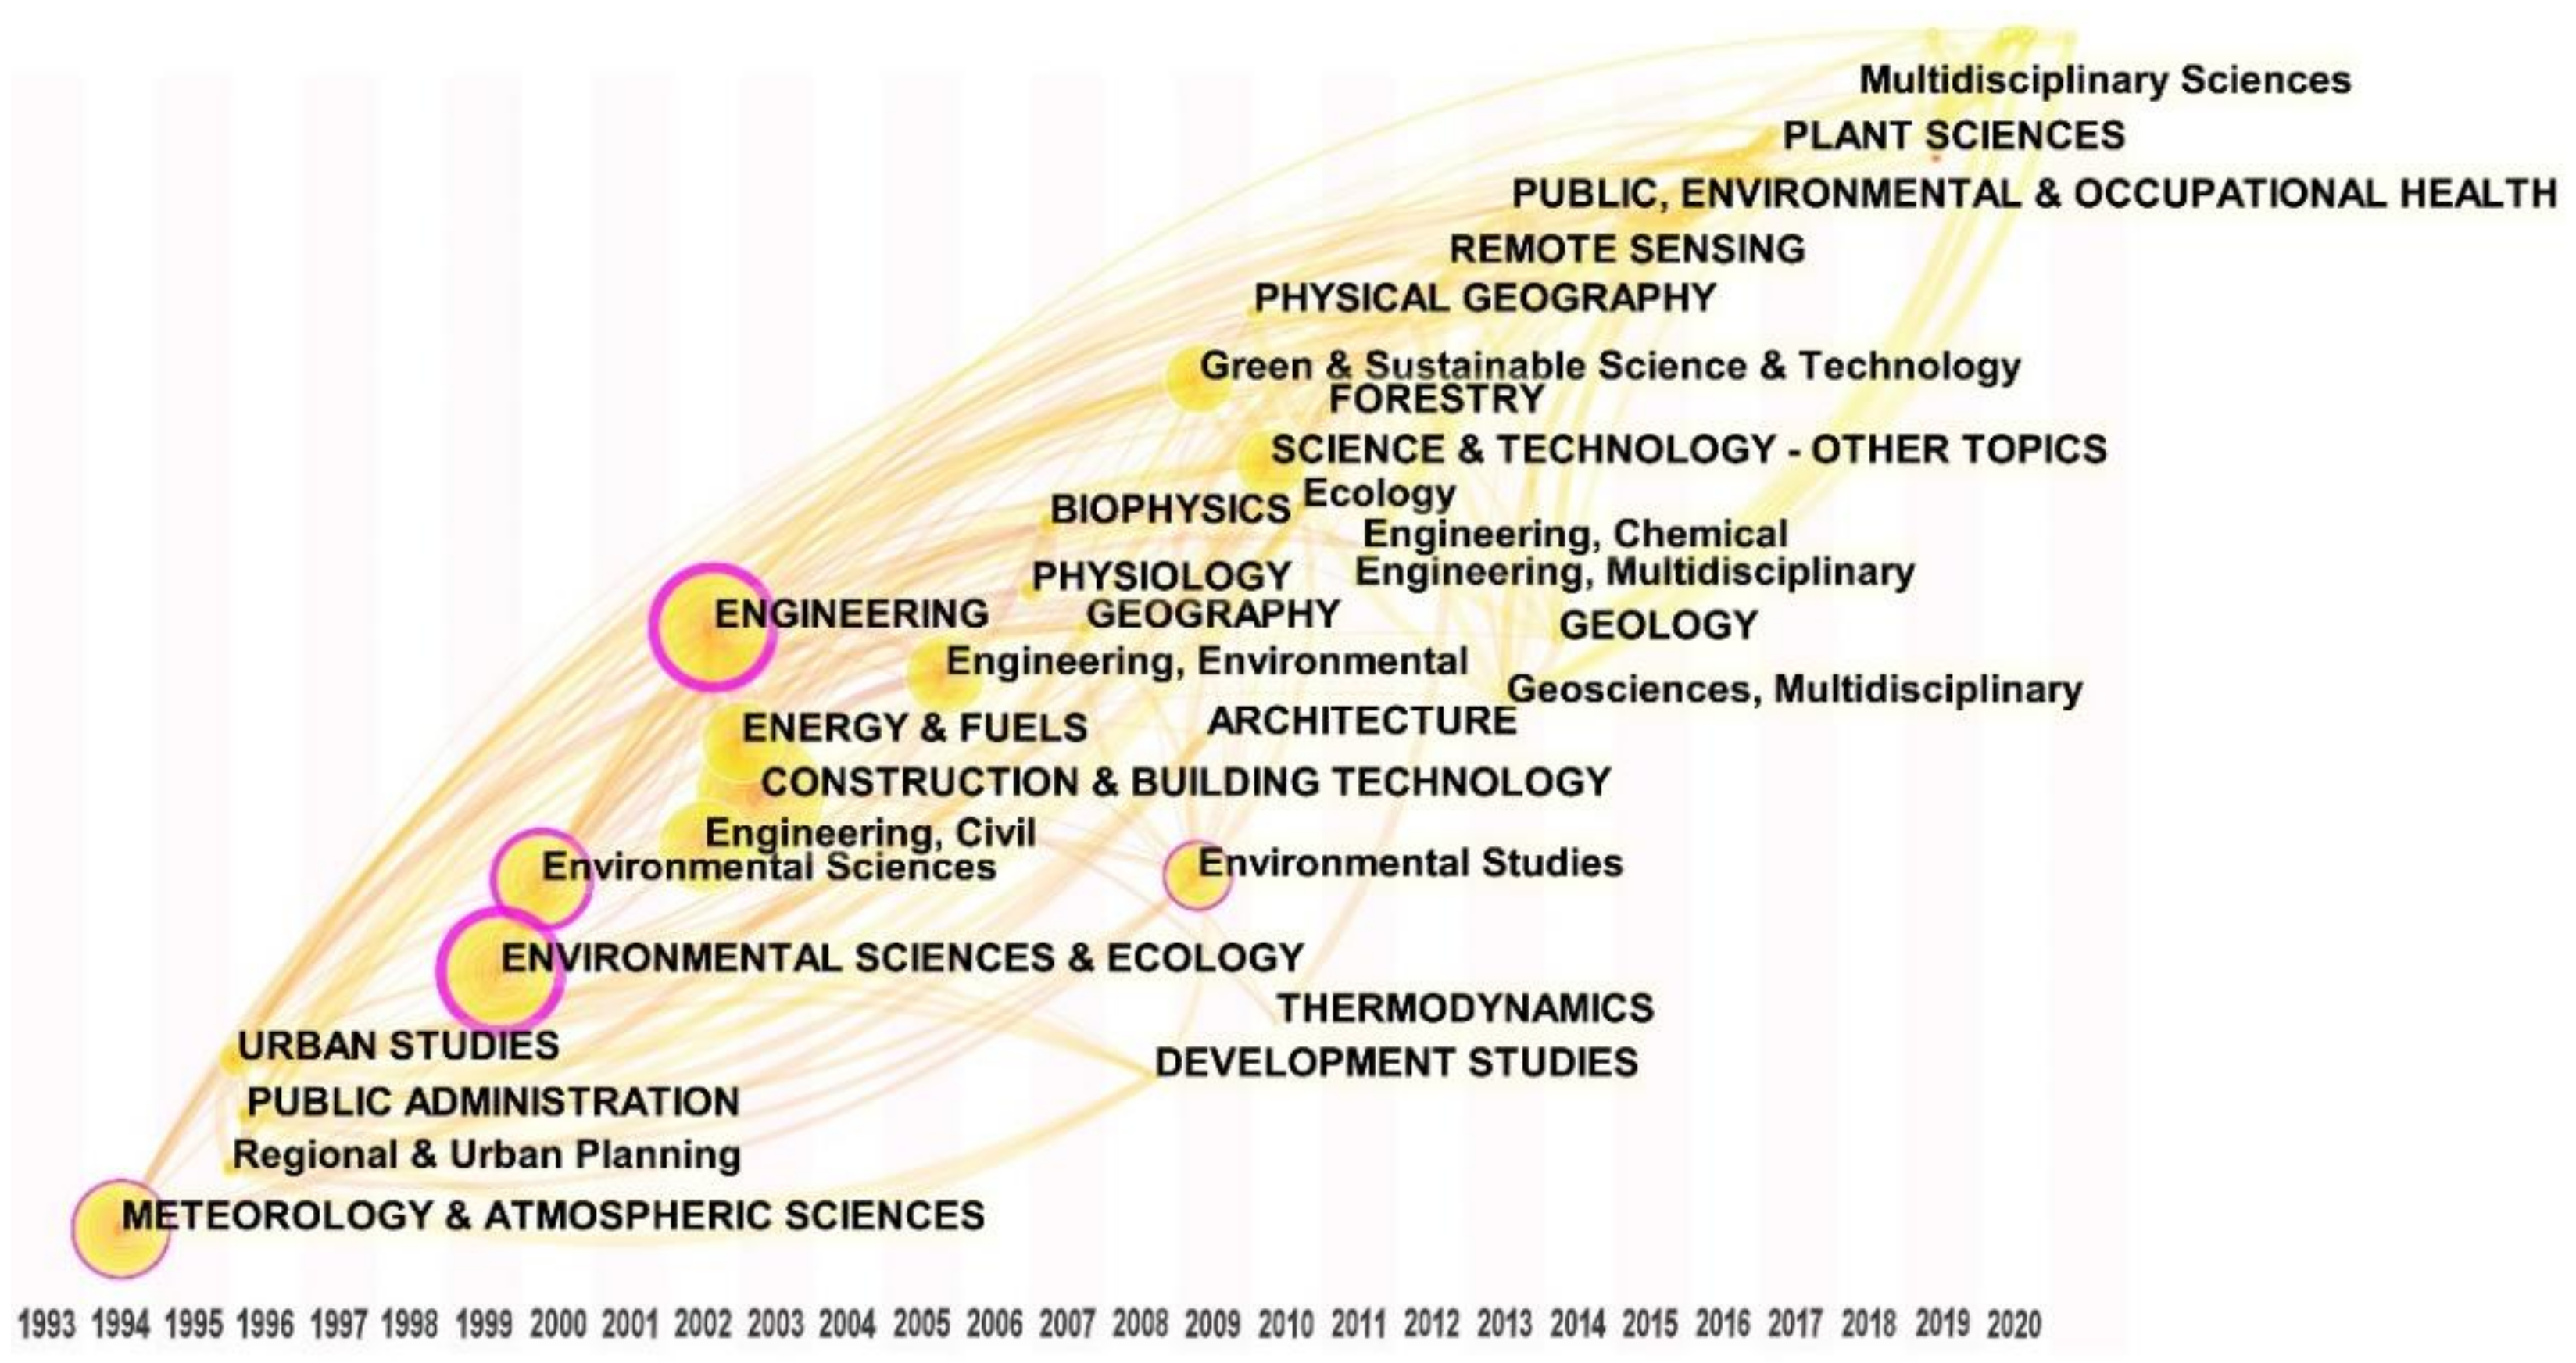
The development of this field has gone through three stages in terms of subject evolution, as shown in Figure 4. Before 1998, meteorology and urban planning took the lead in conducting research. The period from 1999 to 2006 was a development stage led by environmental sciences and engineering and supplemented by civil engineering and energy. Since 2007, there has been a trend of interdisciplinary research in architecture, physiology, ecology, sociology, geography, and computer science. Disciplines that have emerged in the past three years include instruments and instrumentation (2020), astronomy and astrophysics, applied physics (2019), material science (2019), chemistry (2019), and multidisciplinary sciences (2017), representing further developments for future cross-disciplinary studies.
3.2. Academic Groupings and Research Focus
In order to identify the research topics in this field, three levels of analysis were performed: keyword co-occurrence (556 articles), cocitation clustering (1187 articles), and landmark references (15 articles). First, the analysis obtained 446 high-frequency keywords and 8 keyword bursts, which reflects the research objects, contents, and emerging trends at a certain stage in the 556 articles. Second, cluster analysis of the references cocited by 556 articles was performed, the top 10% cocited references each year were extracted, and a total of 1187 references were obtained. Nominal terms were extracted from the titles, keywords, and abstracts of cocited references as cluster naming tags, and 13 effective clusters were obtained, which then identified the research topics. Finally, 15 landmark references were analyzed. Through the above three levels of analysis, we can confirm the academic groupings and research topics in this field.
3.2.1. Keyword Co-Occurrence Analysis
We set the node type to keyword and the pruning method to MST to obtain 446 nodes and 1029 lines, which means that there were 446 keywords and 1029 connections. The value of centrality can reflect the academic influence of a keyword, and the top 20 keywords are shown in Table 4. Burst detection was performed on 446 keywords according to the Kleinberg algorithm [44]. From all keywords, those with the strongest burst in a certain period of time were detected, and eight emergent words were obtained that reflect research hotspots in this field, shown in Table 5. High-frequency keywords and word bursts reflect the research background, contents, and methods, which are specifically embodied in five categories.
- Research scope
The research scope mainly reflects the spatial and temporal distribution and research scale: “climate”, “climate change”, “heat island”, and “microclimate” reflect the coupling relationship between climate scale and urban morphology at different levels [45,46,47]; “hot” and “summer” reflect the climatic context of research in this field, which is mainly focused on the hot summer climate [48,49].
- 2.
- Correlation research
Research related to urban morphological elements showed relationships among “geometry”, “environment”, “street canyon”, and “building”, reflecting the research elements of urban geometry, street canyons, buildings, green spaces, urban shadows, courtyards, etc. [31,47,49,50], with the most studies related to street canyons and green spaces. Research on the influence of street canyons on thermal comfort is mainly reflected by different aspect ratios, directions, and shapes. The effects of green space in thermal comfort include different tree configurations, pedestrian-level greening, green roofs, and the configurations of buildings and trees.
Research related to thermal comfort includes “thermal comfort”, “index”, “temperature”, “human thermal comfort”, “outdoor thermal comfort”, and “MRT”, which reflect various thermal indices [47]; the most commonly used are MRT and PET. “Heat”, “energy”, and “flux” reflect the quantitative study of human thermal balance and energy exchange from the perspective of biometeorology [51]. “Behavior” reflects research on the psychology of human behavior under different microclimate conditions [50].
- 3.
- Research methods
Research methods and tools include “model” and “CFD simulation”, which reflect various models in this research field, including the CFD, thermal balance, and energy exchange models. CFD simulation is the most commonly used research tool, mainly used to study the related evaluation of urban morphology and thermal comfort at various scales [52,53].
- 4.
- Strategy research
Mitigation strategy research includes “impact” and “design”. Related research includes the impact and role of urban morphology-related strategies and technologies in improving thermal comfort [54], among which urban design is the most commonly used mitigation method [55].
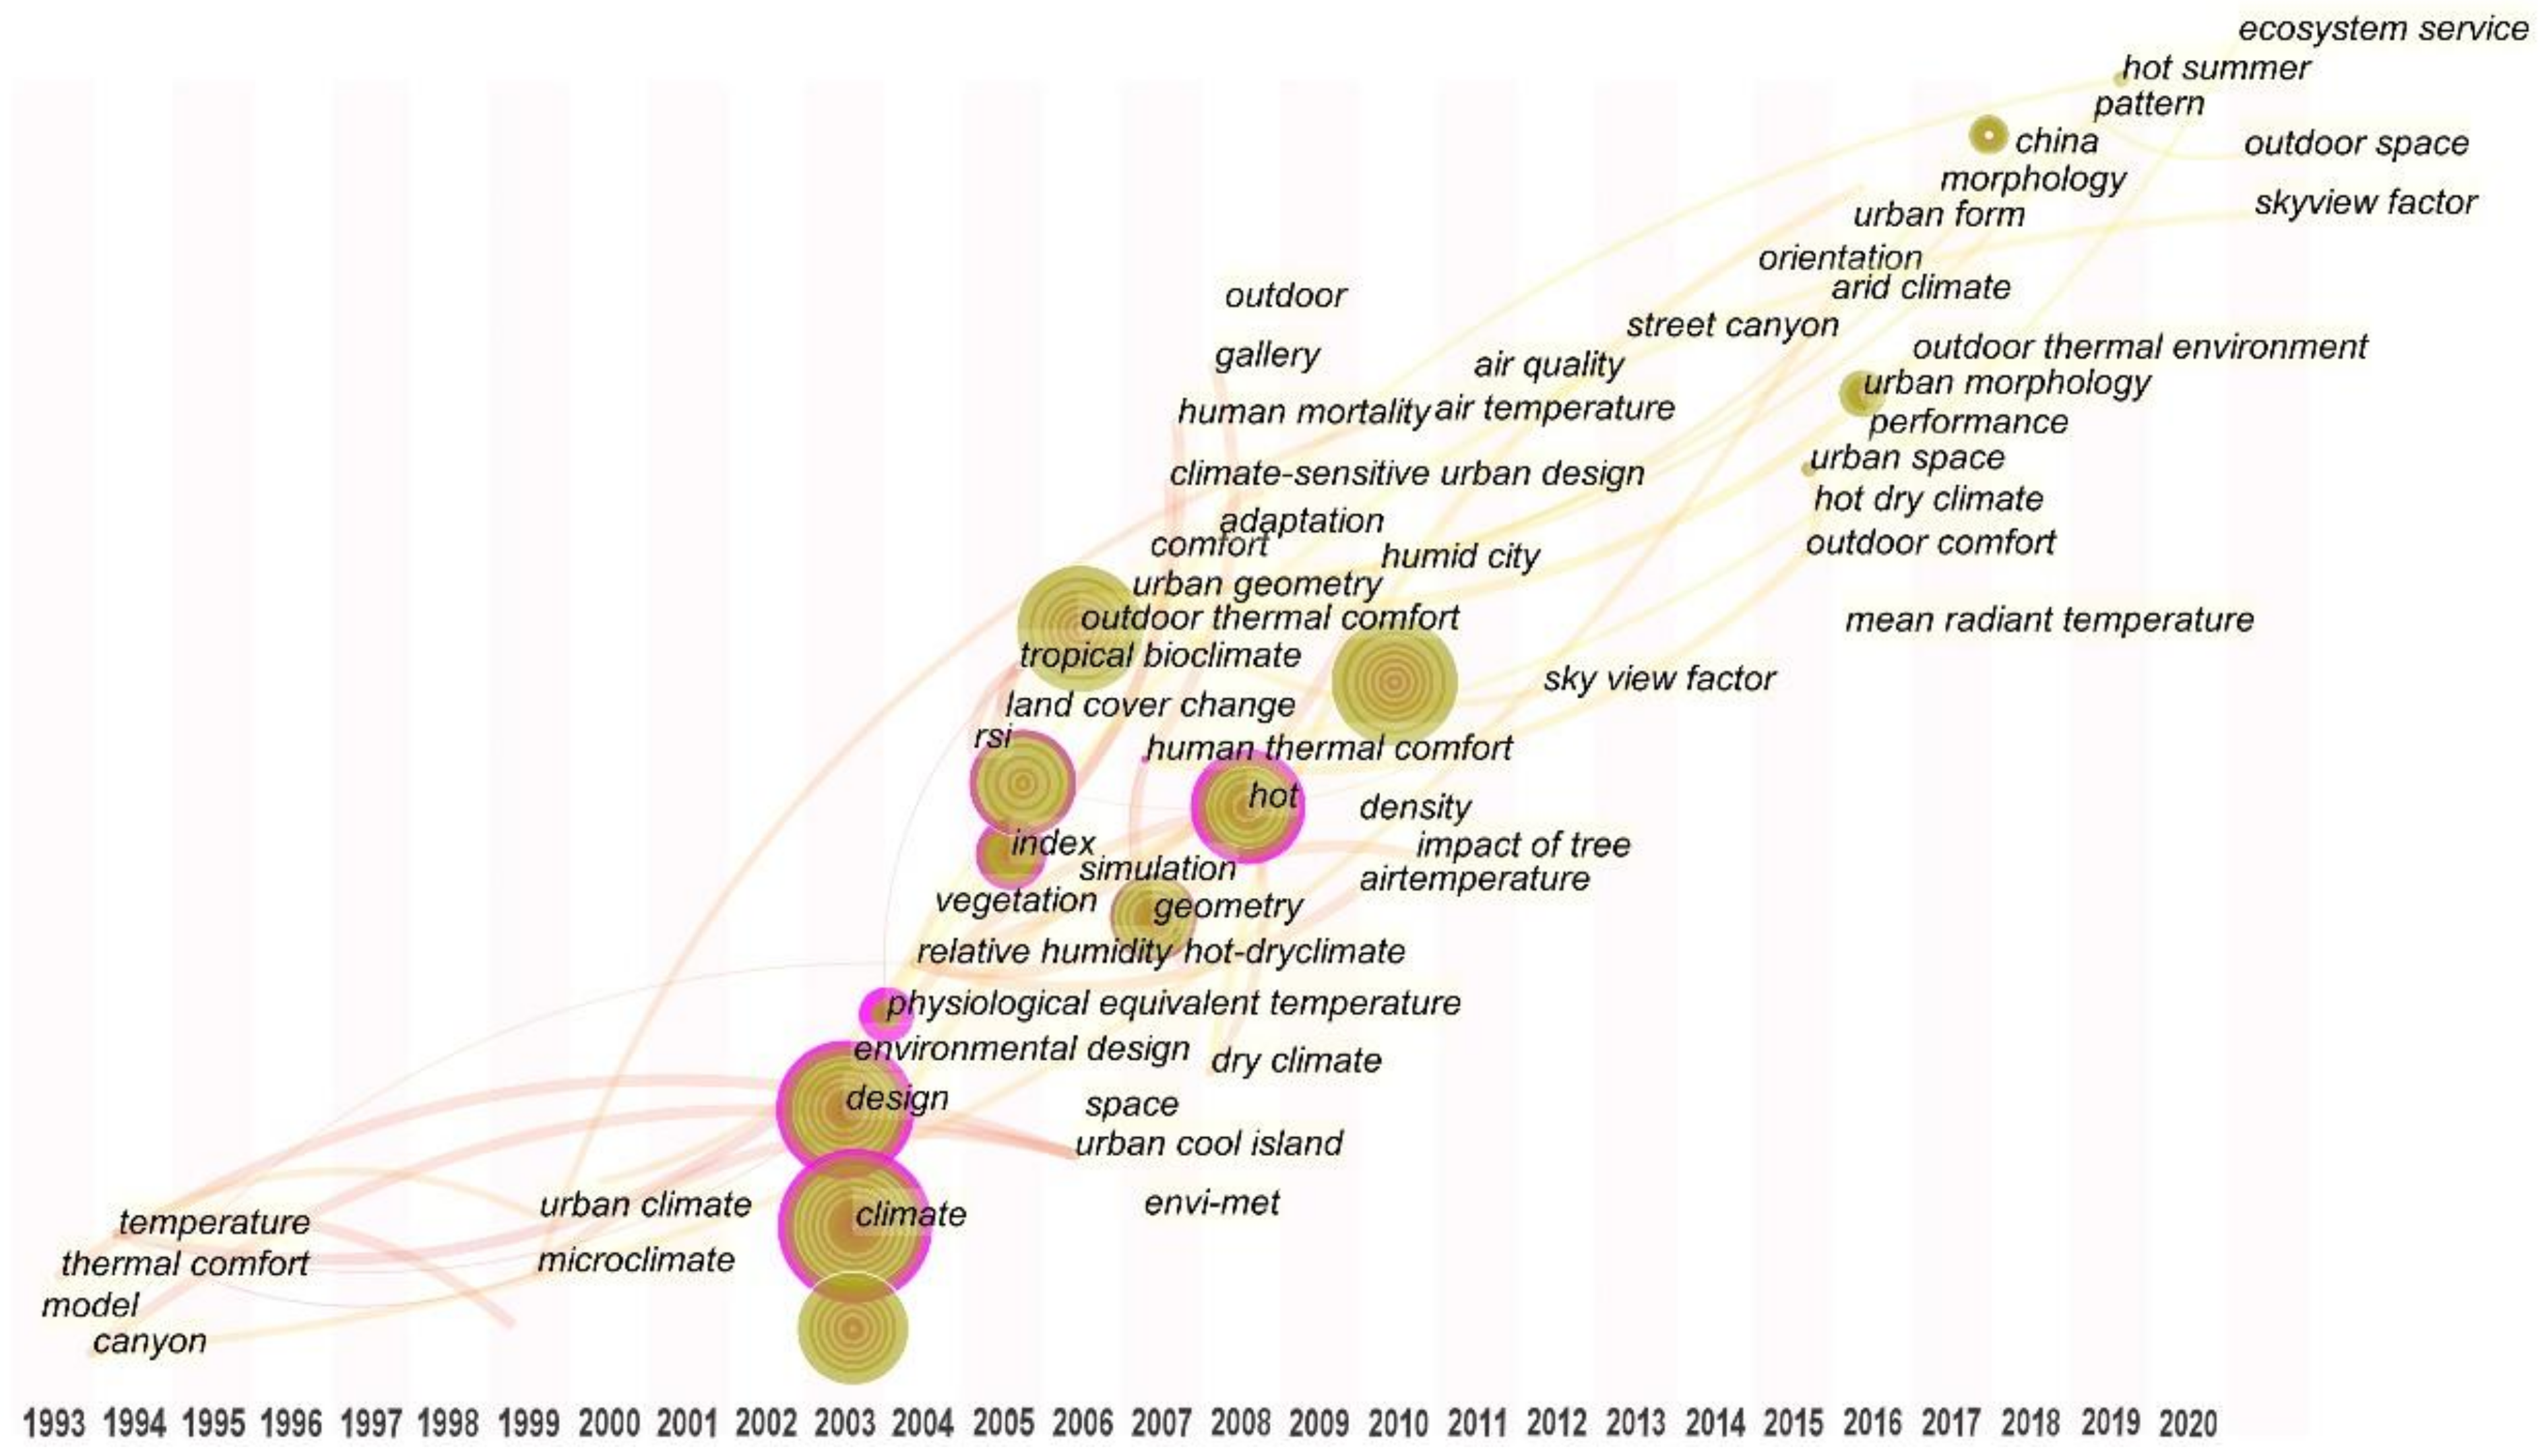
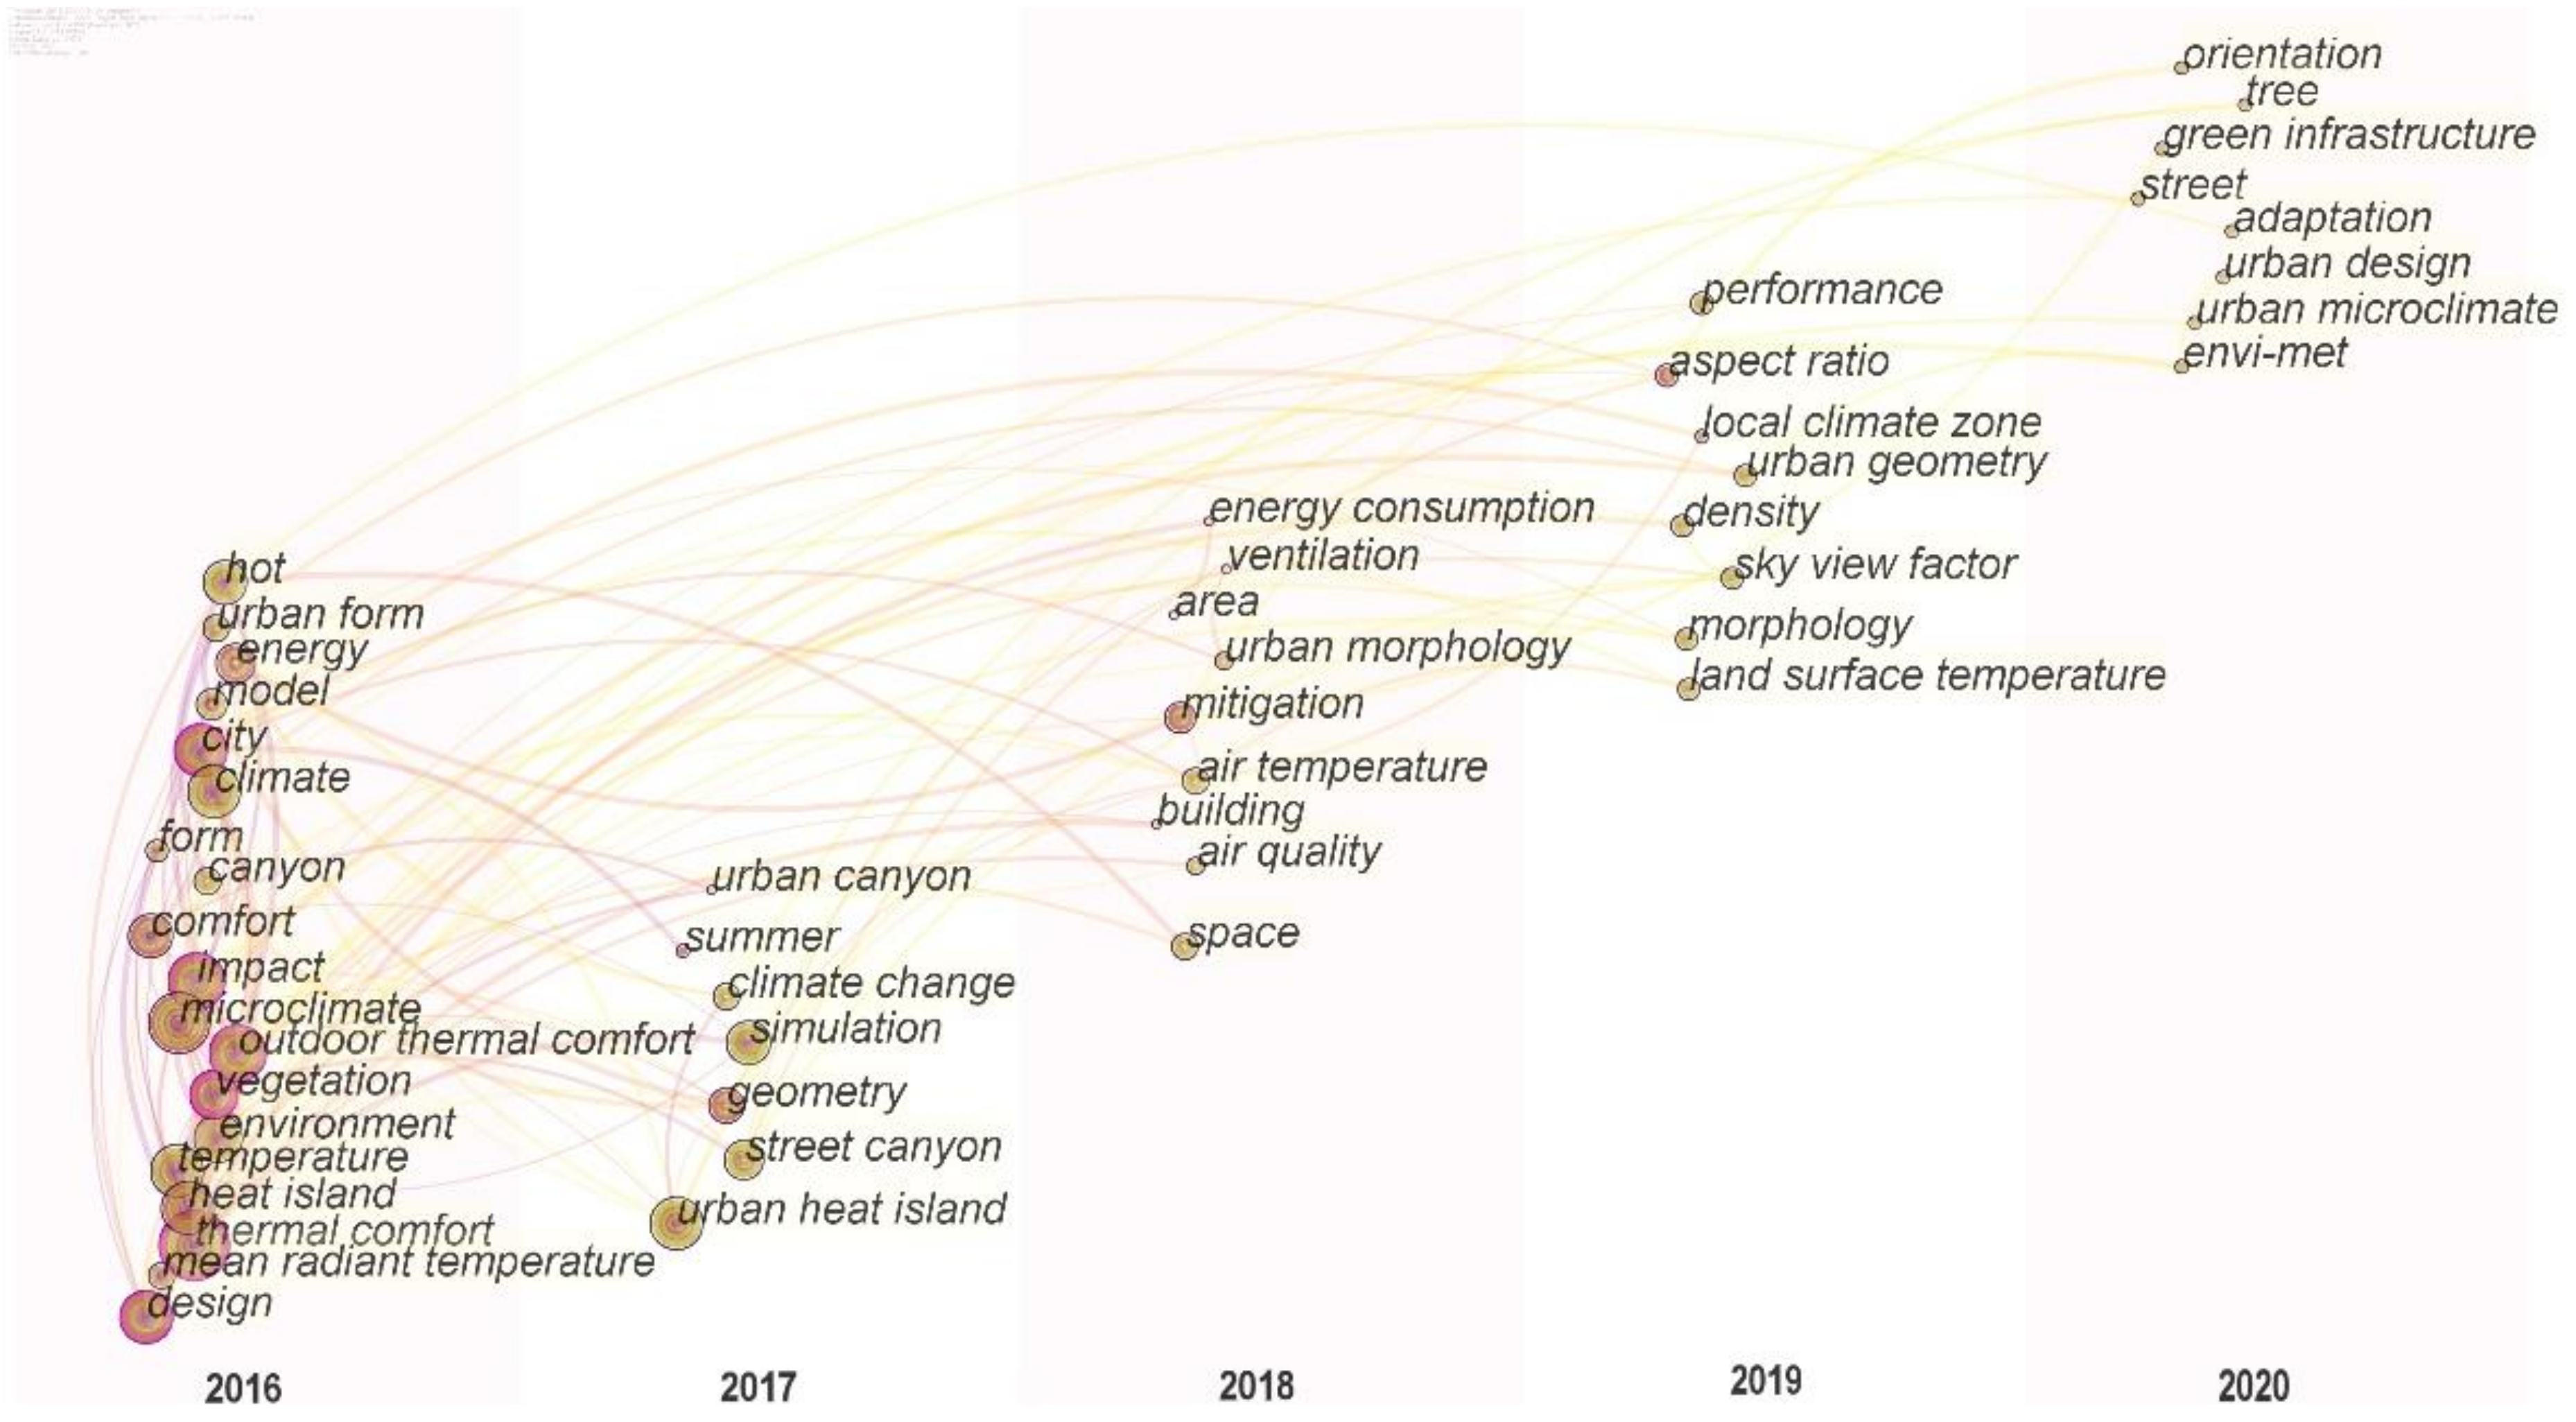
The evolution of the field was analyzed as shown in Figure 5. Combined with the distribution of the time of publication and the key node year of the time-zone view of subjects, research in this field can be roughly divided into three stages. Before 1999 was the initial stage of development, with few high-frequency keywords, with articles mainly discussing thermal comfort indices, energy balance models, and morphological research on the street canyon scale. In the next stage, 2003 to 2014, most of the keywords in this field appeared and entered mainstream development. Research was mainly focused on the urban climate against the background of a high-temperature climate. PET and MRT were the most used thermal comfort indicators, and research was focused on the influence of urban geometry and design on thermal comfort. Among these studies, street canyons, sky view factor (SVF), land cover changes, density, space, trees, and air quality were the elements of most concern in urban geometry, and ENVI-met was the most important simulation tool. According to the keyword co-occurrence time-zone view in the past 5 years shown in Figure 6, the high-frequency keywords changed little after 2015 and were still focused more on hot climate and summer, and a new high-frequency keyword, “ecosystem service”, indicates the beginning of the recent development from improved thermal comfort to a more integrated ecology.
3.2.2. Clustering Analysis of Cocited References
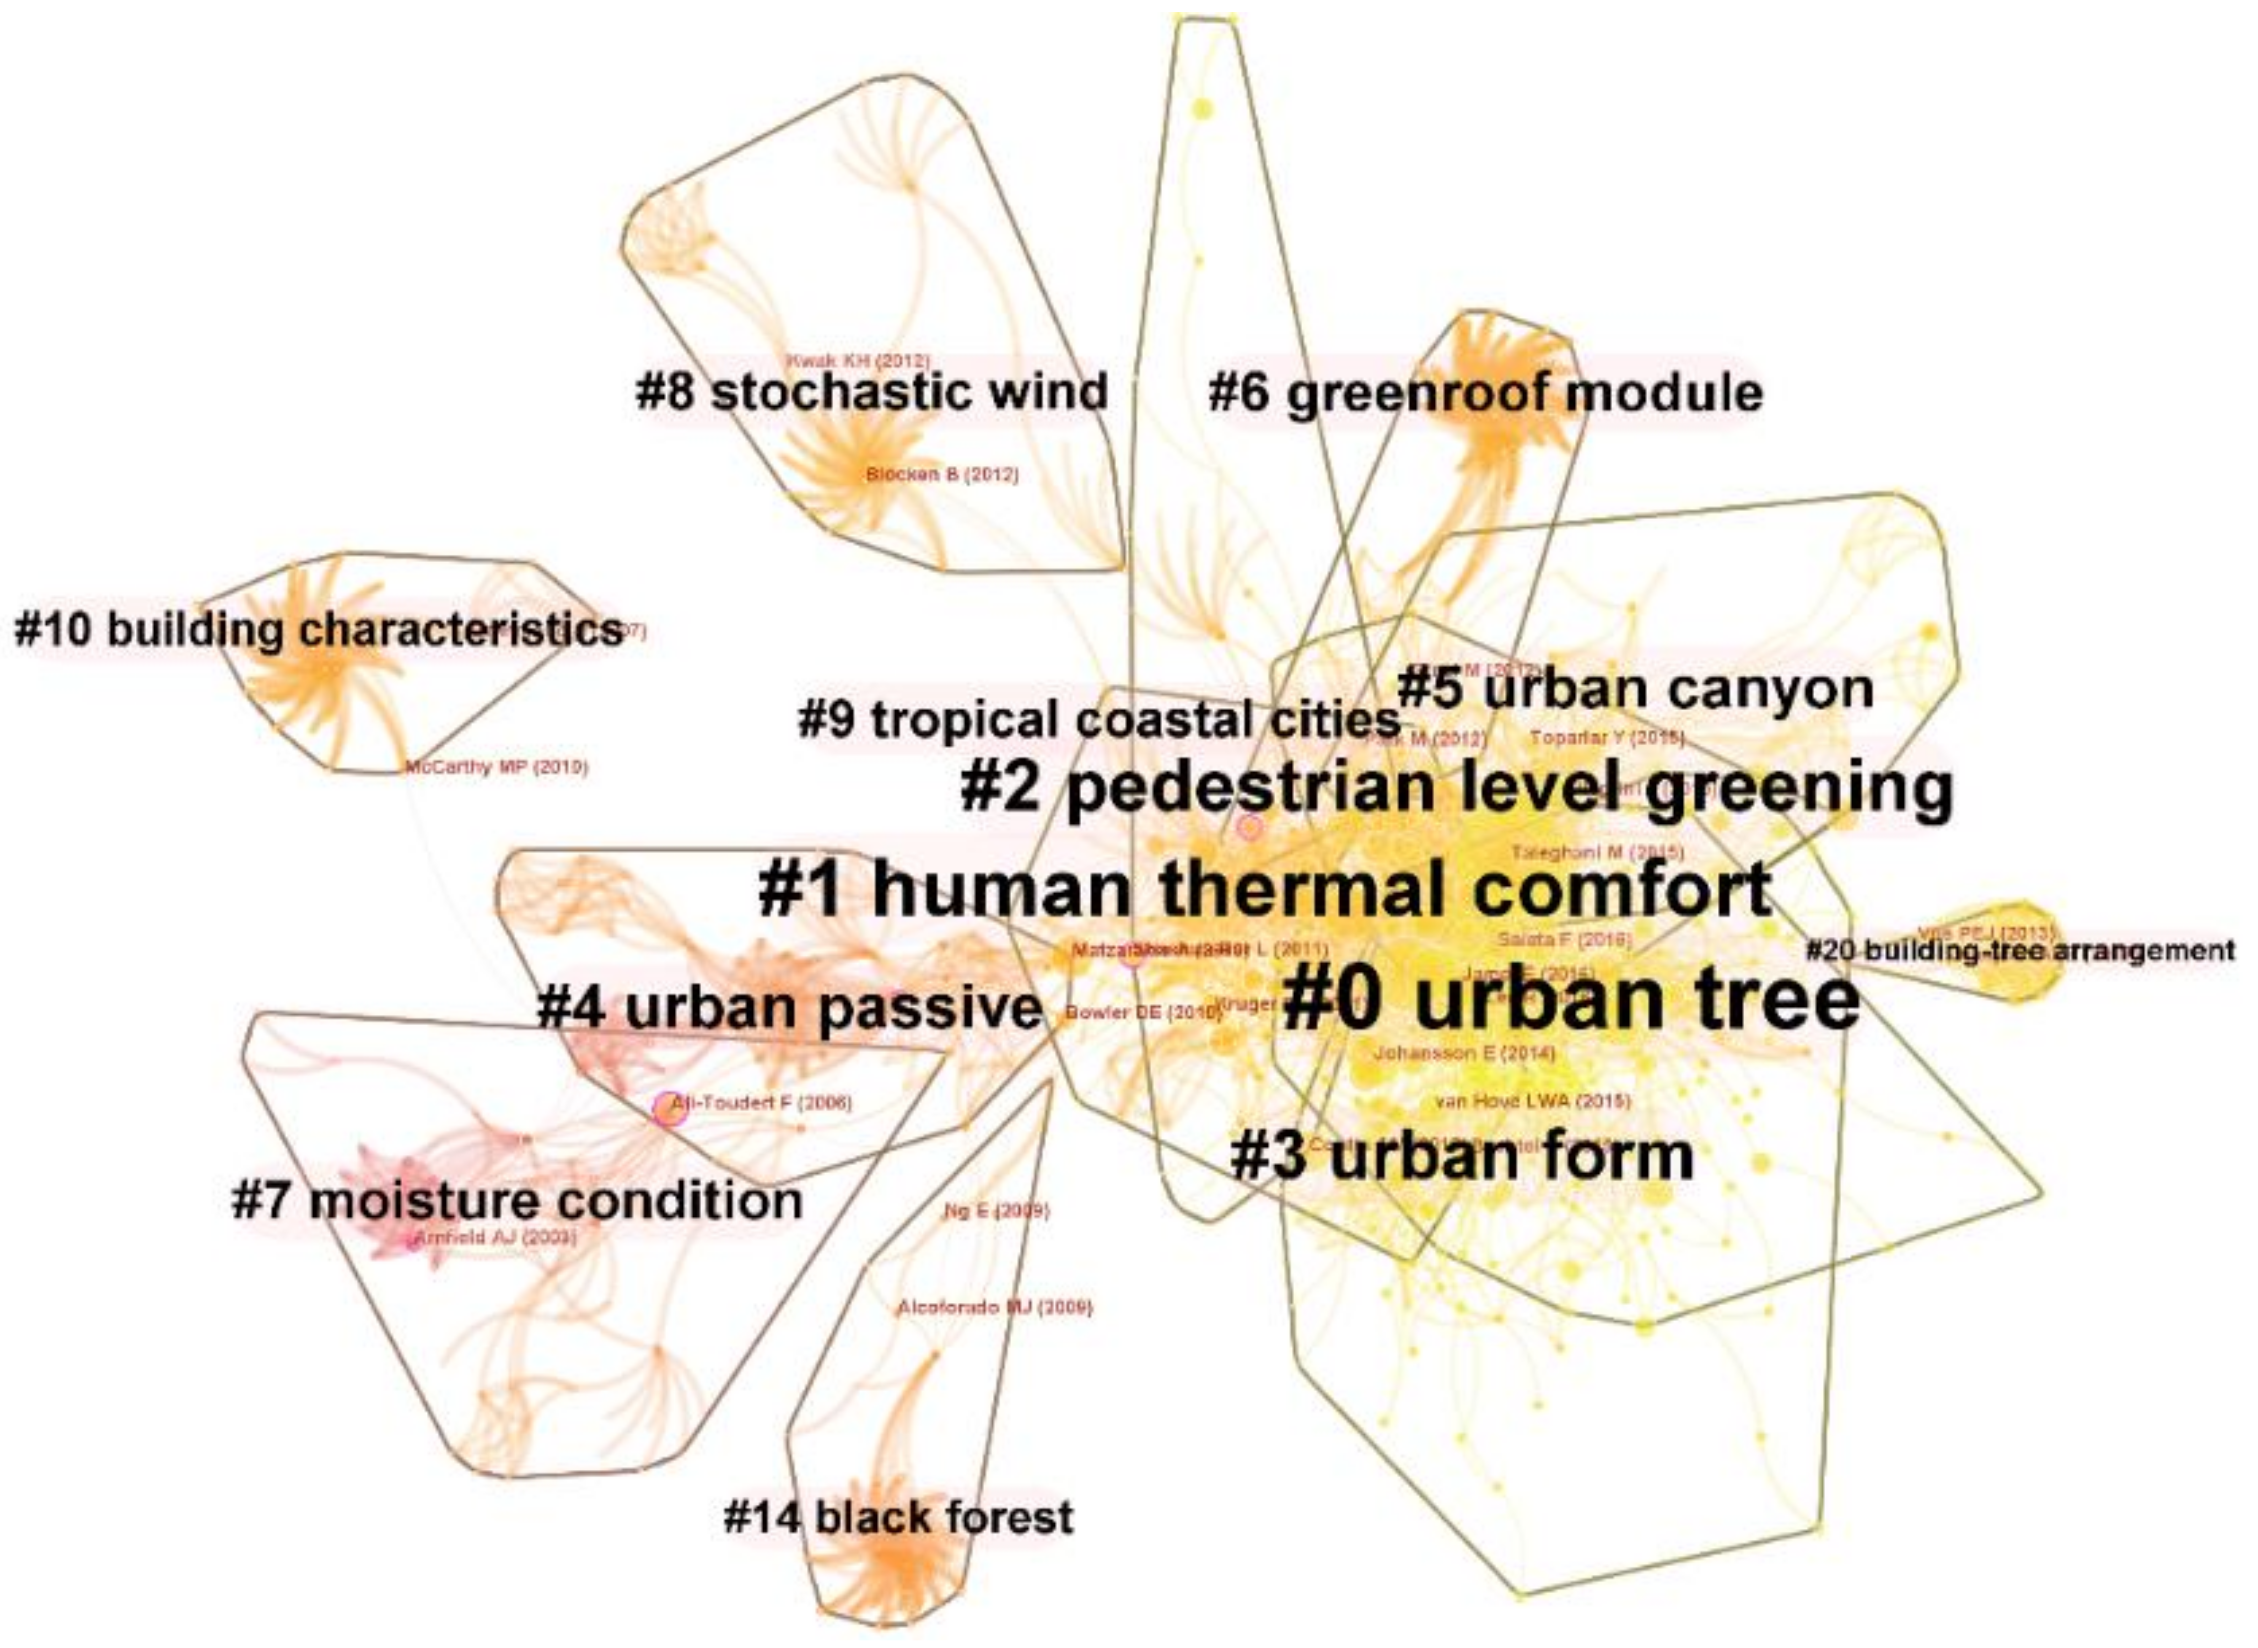
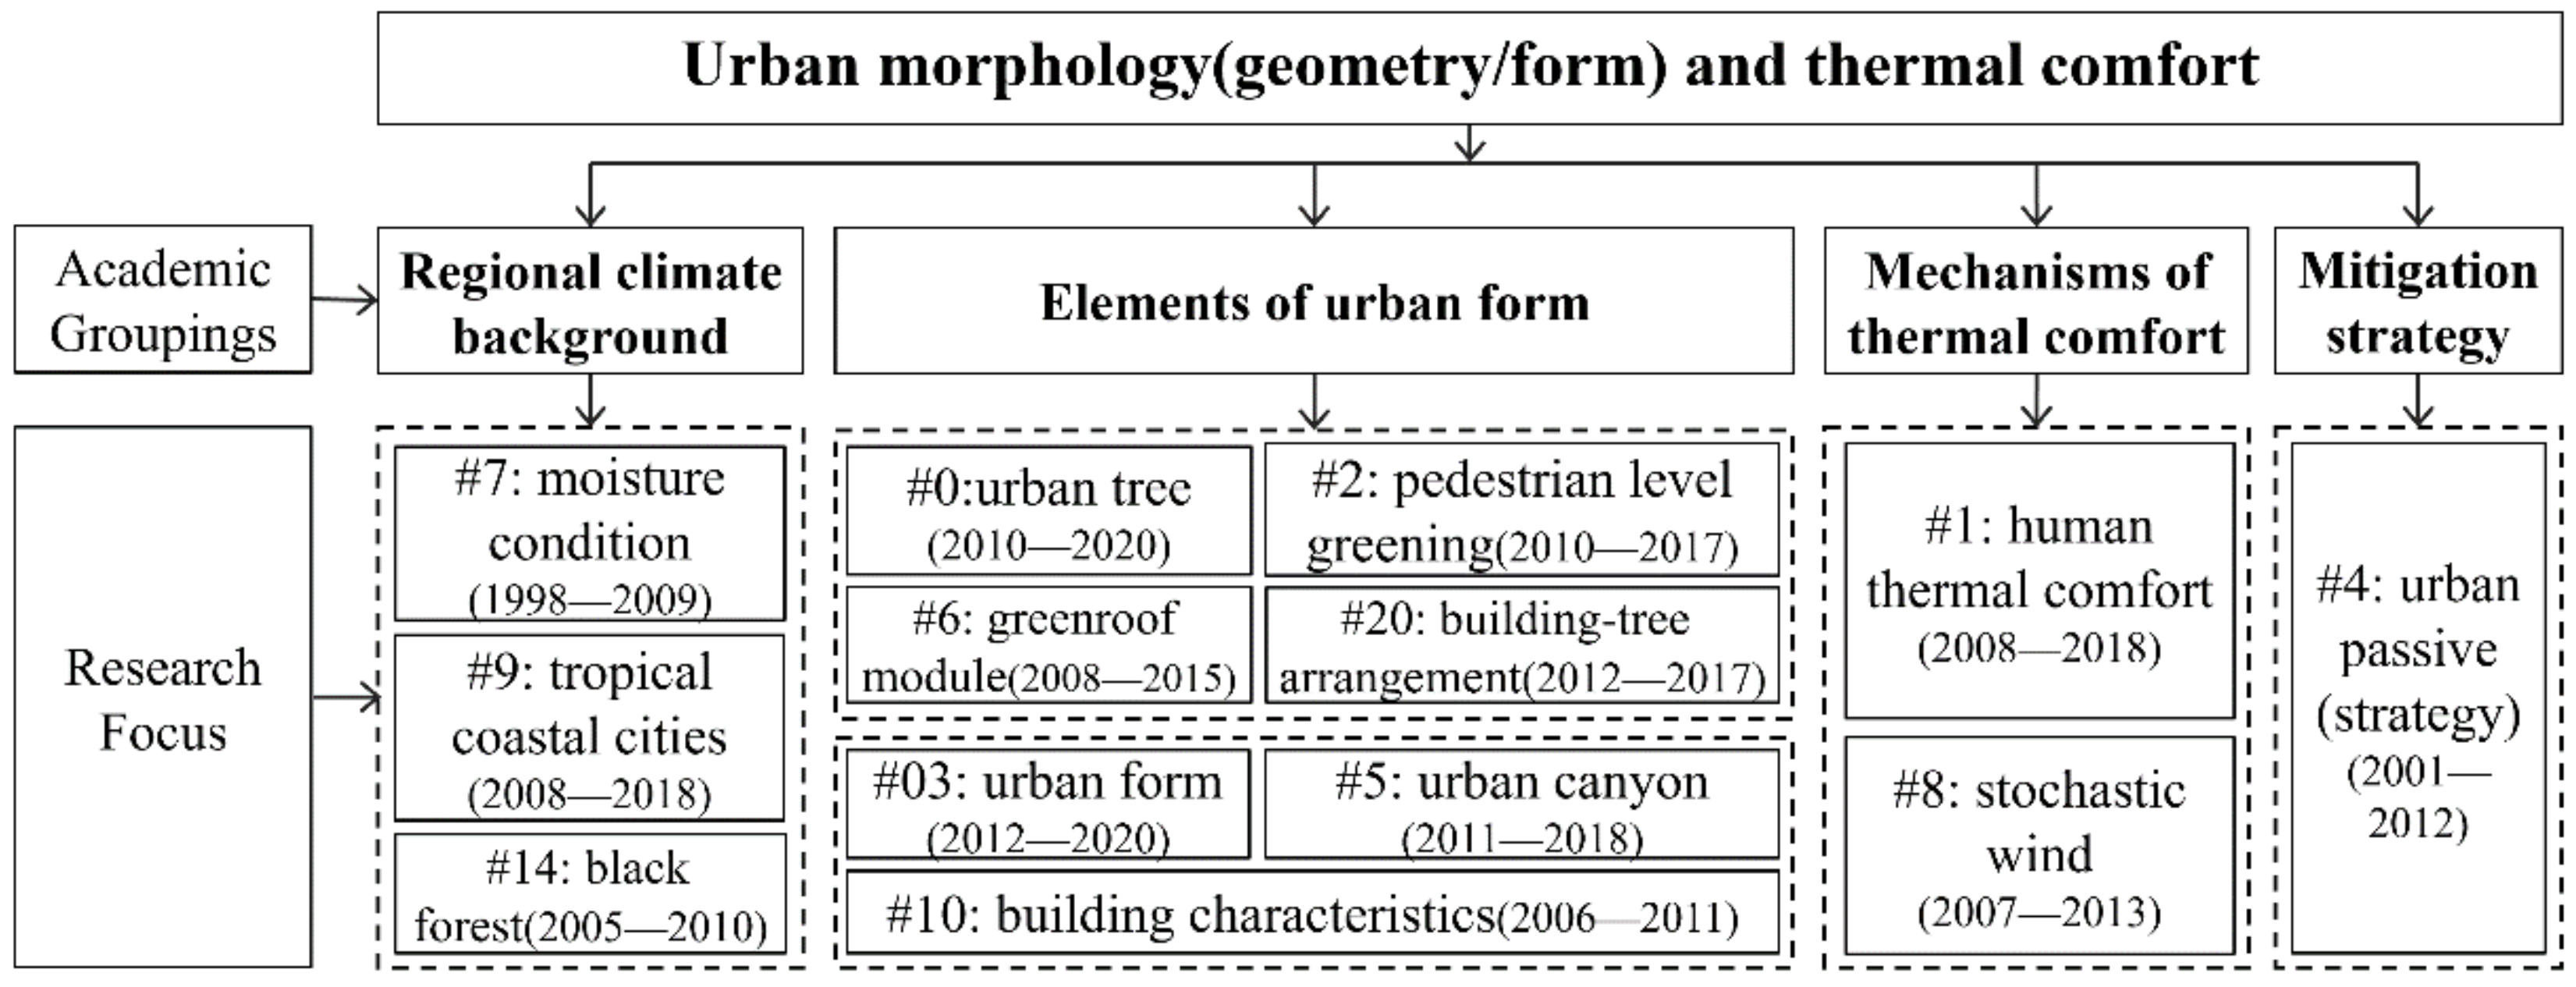
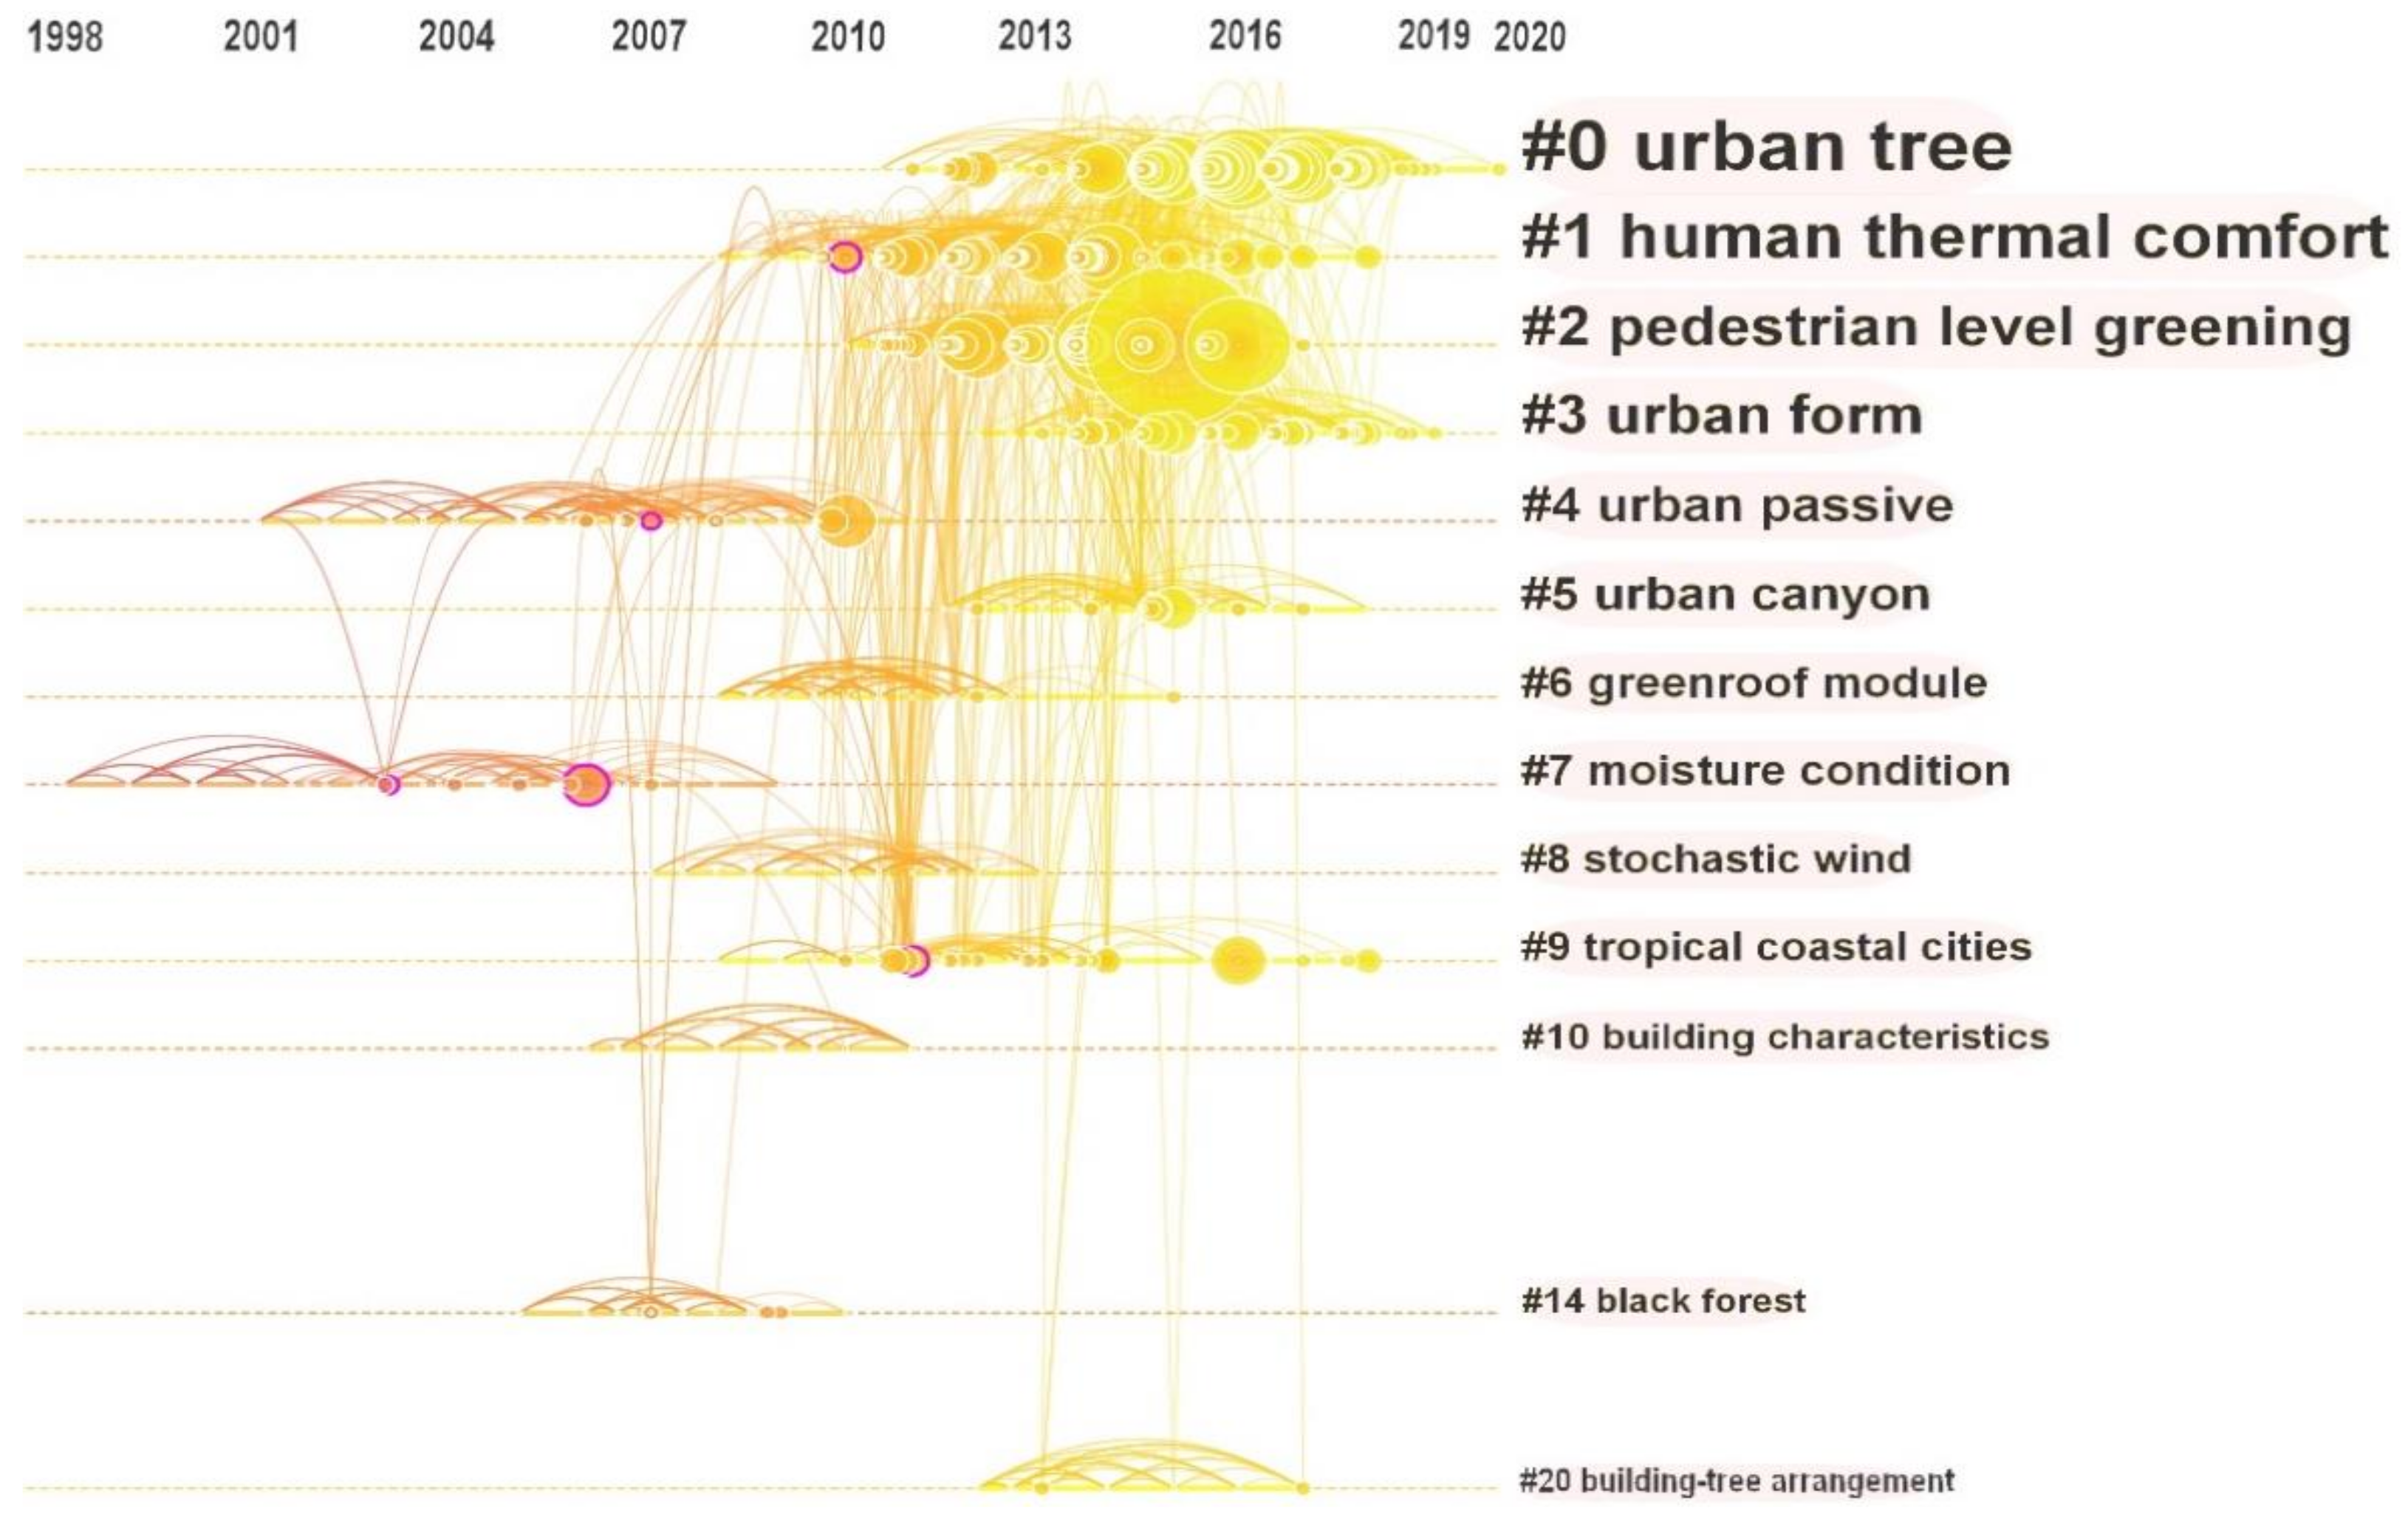
We set the node type to cocited documents and the threshold to 10%, which represents the top 10% of references cited each year, to obtain 1187 nodes and 4861 lines, representing 1187 cited references and 4861 academic connections. The modularity value Q is 0.78, and the weight mean silhouette value S is 0.89. In the cluster analysis, Q > 0.3 means that the cluster structure is reasonable, and S > 0.7 means high cluster credibility. As a result, 20 clusters were obtained, and according to the CiteSpace naming system, the cluster sizes were sorted from #0 to #20, with the largest cluster named #0. After screening, 13 effective clusters were obtained, as shown in Figure 7 and Table 6, representing a wide range of topics covered by the cited references. The 13 research topics were sorted into two levels, and four academic groups were obtained, as shown in Figure 8. Combined with the clustering timeline view in Figure 9, the active years of different topics were analyzed.
- Group 1: Regional climate background
The theme of group 1 is regional climate background and it contains three clusters. Clusters #7, moisture conditions; #9, tropical coastal cities; and #14, black forest, reflect the regional climate background, mainly focused on high-temperature and high-humidity climate zones, including arid and humid hot regions and tropical coastal cities. The active years of study of #7, moisture conditions, were from 1998 to 2009, and the representative article presents small-scale simulations of PET and MRT for the urban street canyons of Colombo and Phoenix [56], suggesting that cities in this climate can mitigate the UHI effect by increasing urban density. The active years of #9, tropical coastal cities, were 2008–2018. The representative article proposes measures and methods for mitigating the UHI effect by using a street geometry element system based on the particularity of the water effect of tropical coastal cities [29]. Cluster #14, black forest, was active in 2005–2010. The representative article simulated the climate of the Black Forest in southern Germany and made suggestions for tourism, but it lacked an analysis of the impact of the forest on the surrounding built-up urban areas [57]. In the last five years, relevant studies have been conducted in areas mainly in the Mediterranean [58] and tropical coastal cities [29]. In addition, there are studies on the influence of the unique street isthmus morphology of historic urban neighborhoods on thermal comfort [59].
- 2.
- Group 2: Elements of urban form
This group contains urban morphological elements and thermal comfort evaluation and contains seven clusters: #0, urban trees; #2, pedestrian-level greening; #3, urban forms; #5, urban canyons; #6, green roof modules; #10, building characteristics; and #20, building–tree arrangements.
Clusters #0, #2, #6, and #20 reflect the related research on urban greening and thermal comfort. Greening is one of the important elements of urban morphology and can directly affect thermal comfort. Many researchers have carried out related studies on aspects including trees, pedestrian-level greening, green roofs, and tree layouts around buildings. The active years of cluster #0, urban trees, were 2010–2020, which represents the impact of different tree species configurations on urban thermal comfort. The representative article studied the impact of different tree types and configuration modes on the microclimate in winter and summer and proposed a configuration strategy to alleviate the UHI effect with a combination of tree planting and urban morphology [60,61,62]. The active years of cluster #2, pedestrian-level greening, were 2010–2017, representing the study of the impact of such greening on urban thermal comfort, including a comparative study of the impact of different types of greening on pedestrian thermal comfort and the configuration strategy of pedestrian-level greening. The representative article used Harbin as an example and analyzed the impact of different street canyon landscape forms on thermal comfort [63]. Cluster #6, green roof modules, was active from 2008 to 2015 and reflects research on green roof technologies [64] and the impact of green roofs on thermal comfort [65]. Studies have shown that green roofs can effectively alleviate the UHI effect, but mitigation on the pedestrian scale is limited. Cluster #20, building–tree arrangements, was active from 2012 to 2017. The representative article studied the coupling effect of different building and tree arrangements on residential outdoor PM2.5 diffusion [66]. There are also related studies that reflect the impact of different layouts of buildings and trees on thermal comfort. Srivanit took a townhouse in the suburbs of Bangkok, Thailand, as an example, combined with street design, and proposed a tree-planting model to alleviate the UHI effect [67]. It can be seen that the morphological elements affecting thermal comfort in the past five years are still urban geometric structure and morphology [14], block morphology, building morphology [68], and greening [69]. At the same time, water bodies are included among urban geometric forms when carrying out research [65,70,71,72], reflecting the further attention to natural large cooling sources in cities.
Clusters #3, #5, and #10 reflect the elements of urban geometric form at different spatial scales. The active years of cluster #3, urban form, were 2012 to 2020. Related research mainly used LCZ to study the impact of urban-scale geometric forms on the urban thermal environment [73,74,75], and there are few relevant strategic studies. Javanroodi simulated 1600 city layouts and proposed the best urban form for potential ventilation [76]. The active years of cluster #5, urban canyon, were 2011 to 2018. Relevant research was done mainly through field measurement and simulation of different types of street canyons to study the impact of street canyon design parameters on thermal comfort, and mitigation strategies were proposed [77,78]. By analyzing the impact of different layouts during the nights on the block scale, Xie found that the courtyard area shows better performance for reducing heating demand and enhancing ventilation, while the street canyon area shows relatively poor environmental conditions [79]. Cluster #10, building characteristics, was active in 2006–2012. Related research was concentrated 10 years ago, and there have been few recent results. In the representative article, Mavrogianni used EnergyPlus to simulate and analyze the design of 3456 typical residential buildings in London to obtain the factors and design strategies of residential building forms that have an impact on thermal comfort [80]. In recent years, research on building energy consumption combined with the effects of urban morphology is attracting more and more attention from scholars. Existing studies have confirmed that the courtyard form area shows better outdoor thermal comfort and annual energy consumption than the other areas [58,81].
- 3.
- Group 3: Thermal comfort
This group covers the study of thermal comfort evaluation and contains two clusters. Cluster #1, human thermal comfort, was active in 2008–2018. The representative article is Rupp’s review of human thermal comfort in the built environment, including thermal comfort models and indices in different scenarios [26]. Cluster #8, stochastic wind, was active from 2007 to 2013, mainly for the study of urban natural ventilation. This is because, in the hot summer, the use of natural ventilation is a direct strategy to improve thermal comfort.
- 4.
- Group 4: Mitigation strategy
This group covers the study of mitigation strategies and contains only one cluster. Cluster #4, urban passive, was active from 2001 to 2012 and reflects research on thermal comfort improvement strategies related to urban form. The representative article is by Fahmy, taking Cairo as an example to study how to design the urban form as a passive thermal comfort system and propose design strategies [82].
3.2.3. Landmark References
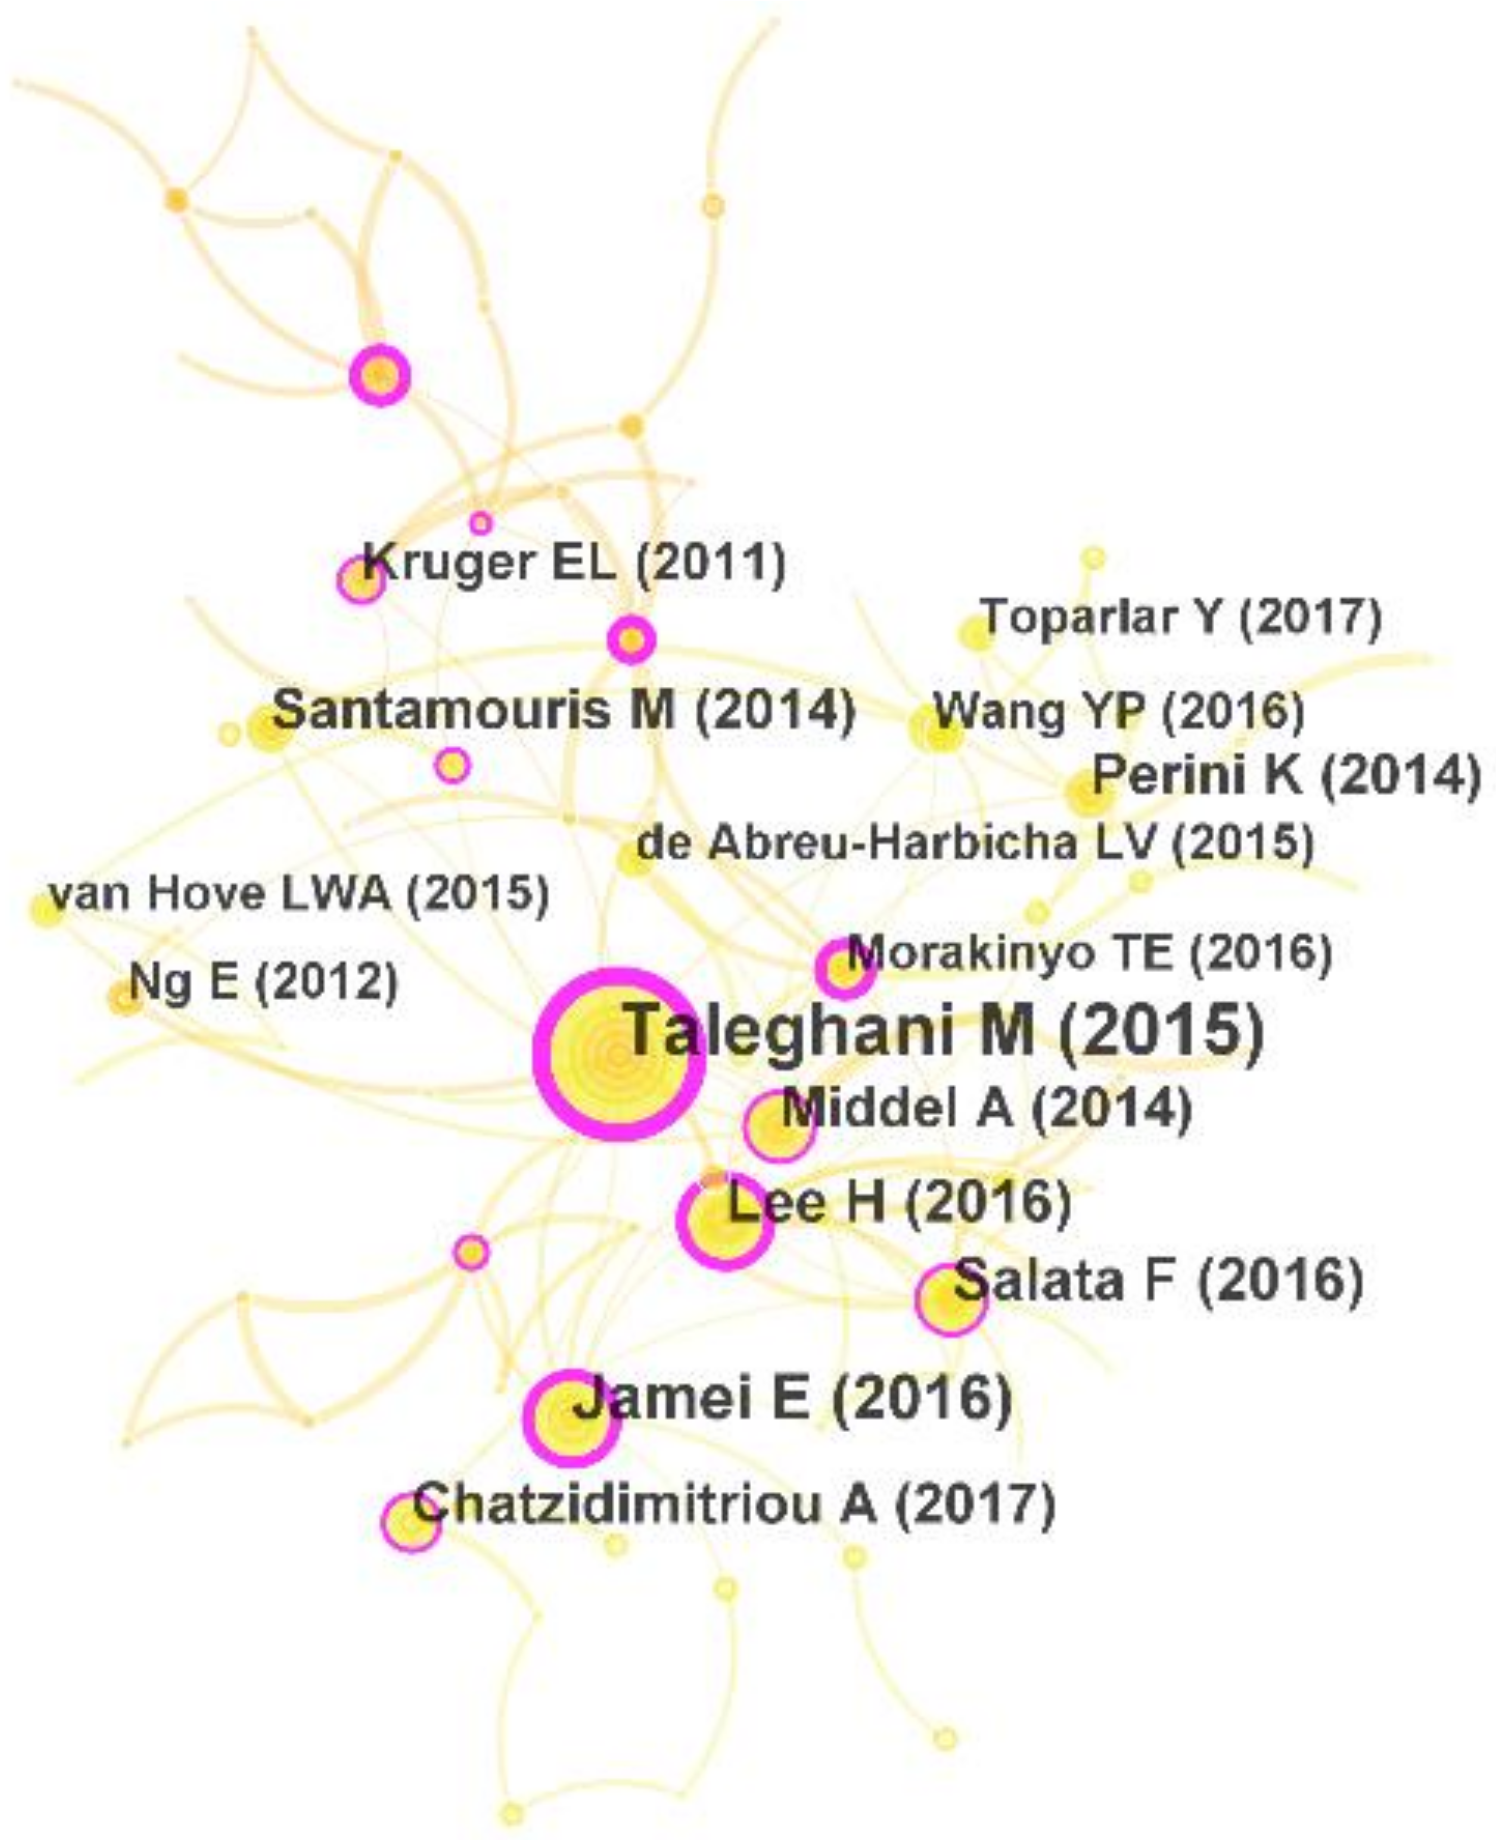
According to the citation frequency, the landmark references were extracted. The top 15 landmark references were extracted to generate a cocited network, as shown in Figure 10 and Table 7. According to the clustering framework of Figure 8, most of the research topics in these 15 documents belong to academic group 2, that is, research on urban morphological elements and thermal comfort evaluation. This reflects that this grouping is the focus in this field. The top 15 references were divided into two parts.
- Correlation research
The environmental effects of urban greening with regard to thermal comfort are the most studied, with seven articles. Among them, articles 2 and 5 combined urban morphology and greening, demonstrated the influence of urban morphology and greening types on thermal comfort during the day and night through simulation, and proposed appropriate design guidelines [19,33]. Articles 4 and 12 simulated and analyzed the effects of different types of ground greening, planting patterns, and tree species on thermal comfort from trees and lawns from the perspective of greening types and put forward planting recommendations in different climates [54,88]. Articles 6, 7, and 14 studied the effects of green roofs and pedestrian-level ground vegetation on thermal comfort by simulating different cases in typical urban areas and proposed that although both can alleviate the UHI effect, roofs and reflective roofs are not very effective at the pedestrian level [12,35,90].
The research on the environmental effects of geometric form with regard to thermal comfort contains five references. Among them, articles 1 and 8 used street orientation, aspect ratio, SVF, and other characterization parameters to analyze the geometric forms of different blocks and street canyons through a combination of field measurement and simulation and proposed urban design suggestions [20,84]. Based on the geometry of street canyons, articles 9 and 13 analyzed the effect of street ventilation on the diffusion of traffic air pollutants [85] and the effects of different tree planting types on the thermal comfort of the street [89].
Along with research on the mechanism of UHI, article 10 took the densely populated industrial agglomeration area of Rotterdam in the Netherlands as an example to analyze the temporal and spatial distribution characteristics of the UHI effect and changes in thermal comfort. The results showed that the UHI effect was strongest in the Rotterdam agglomeration area in late spring and summer and stronger at night. UHI was significantly correlated with the proportion of buildings, impervious and green surfaces, and average building height, and it did not reflect the true outdoor thermal comfort situation in Rotterdam [86]. In article 11, Wang used three urban areas in Toronto, Canada, as an example and used ENVI-met to simulate and analyze the effects of three UHI mitigation strategies: cool roads, cool roofs, and urban vegetation. The results show that the combination of the three technologies can significantly improve the urban thermal environment [87].
- 2.
- Simulation and measurement
Among the 15 articles, except for 3 reviews, only 2 articles did not use the ENVI-met simulation tool, only field measurement, reflecting that the combination of field measurement and simulation is the mainstream research method. In addition, two studies focused on simulation tools alone. Article 3 introduced ENVI-met and compared simulation results with measured results, verifying the accuracy of the software for the simulation of air temperature and average radiation temperature [33]. Article 15 reviewed 183 documents that used CFD simulation methods to conduct urban microclimate research before 2015, and it proposed that further CFD simulation needs to be carried out in different cities [24].
4. Discussion
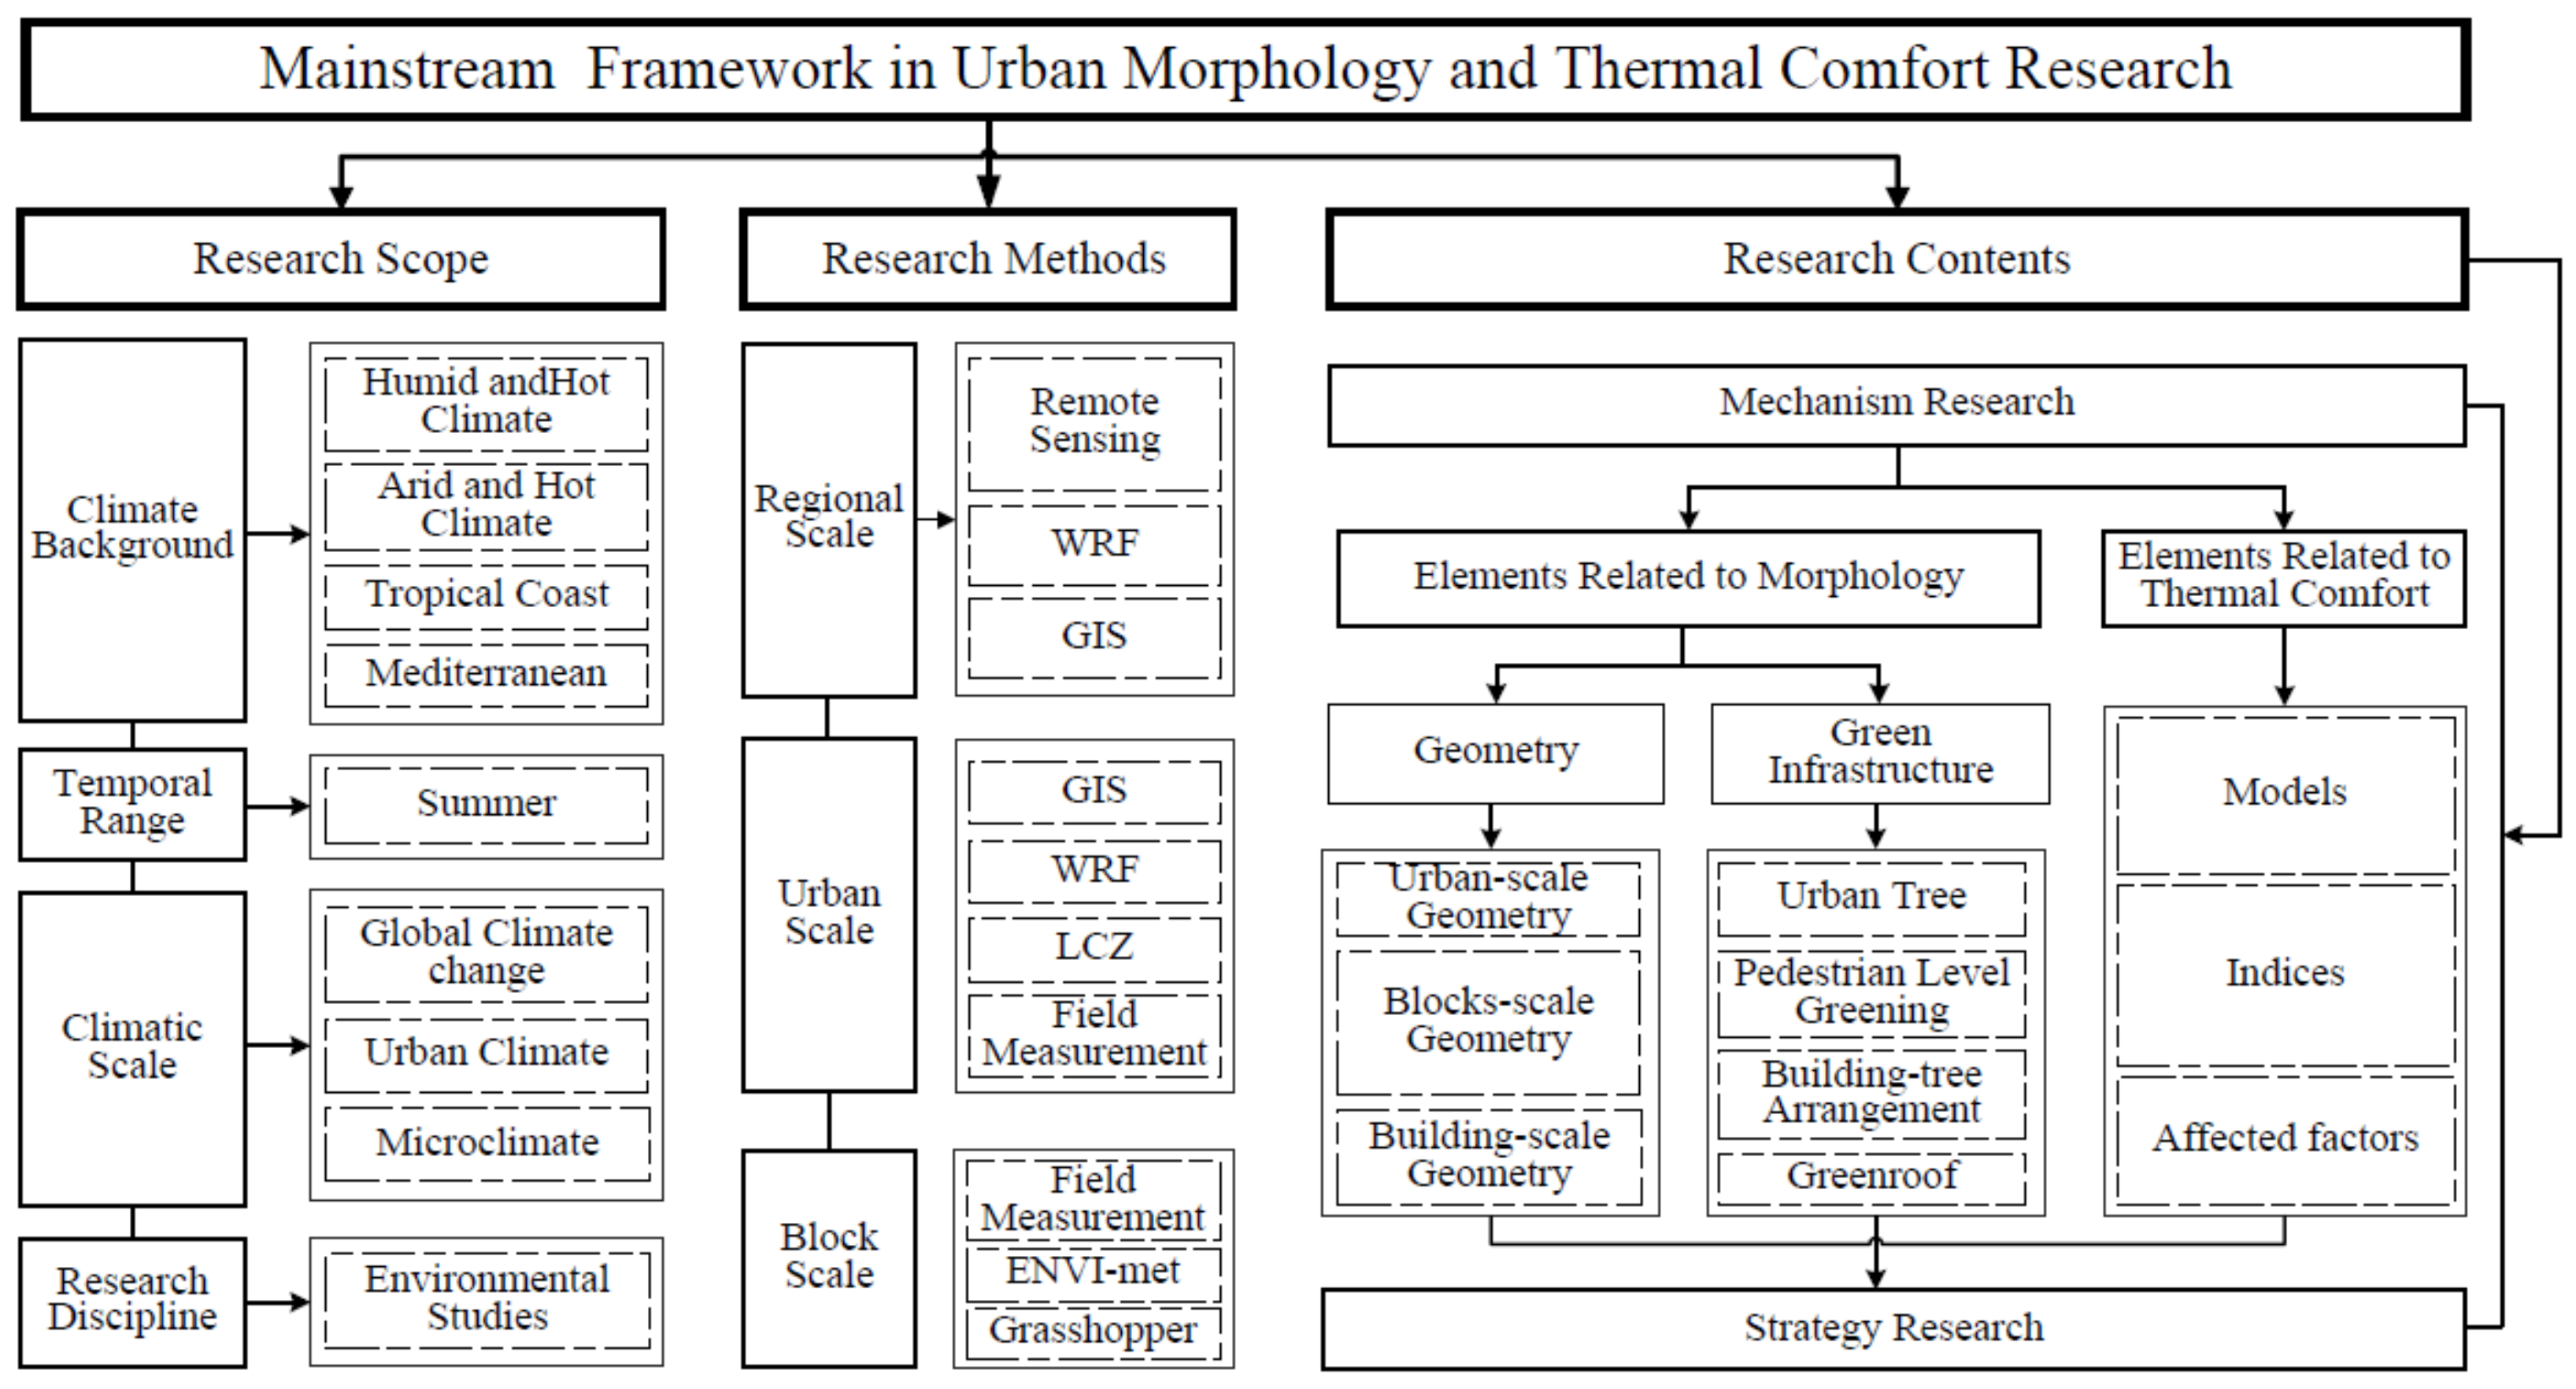
Based on the above review, the overall research evolution and frontiers about urban morphology and thermal comfort are summarized and discussed in detail, and the mainstream research framework is established according to the academic groupings and research themes. As shown in Figure 11, the framework contains three parts: research scope, research methods, and research content. In research scope, the climate background, temporal range, and climate scale are based on the keyword co-occurrence analysis found in Section 3.2.1 and the cluster analysis found in Section 3.2.2; the research discipline is based on the subject co-occurrence analysis found in Section 3.1.4. The research method is based on keyword co-occurrence analysis found in Section 3.2.1, Section 3.2.2 and Section 3.2.3, the cluster analysis found in Section 3.2.2, and the landmark reference analysis found in Section 3.2.3. In the research contents, correlation research was carried out in Section 3.2.1 and Section 3.2.2, and strategy research was carried out in Section 3.2.1 and Section 3.2.2.
4.1. Research Scope
In terms of regional weather characters, the main focus is in humid, dry, and tropical coastal climates as well as the Mediterranean climate. Earlier studies paid more attention to hot and humid and hot and dry regions and were active in 1998–2009. Tropical coastal cities were also discussed between 2008 and 2018, because the geometric morphological factors have a more significant impact on tropical coastal areas [29], including Malaysia, Dubai [91], and Hong Kong [92]. In the last 5 years, many studies were also carried out in Mediterranean climate regions, including Greece [93] and Tunisia [94]. It can be seen that the study areas have been mostly in certain regions and countries with tropical and subtropical climates, especially developed countries and regions. However, the UHI effect is more pronounced in cities at middle and high latitudes [95], and the factors affecting human thermal comfort differ in different climate zones [96], while cities at middle and high latitudes face the same thermal problems in the context of global warming and population growth [97]. Research needs to be carried out in wider mid- to high-latitude climate zones in the future. In addition, for certain special built-up areas, such as urban historic districts, traditional villages, and traditional buildings [98], due to their unique street canyon types and historical conservation requirements, as well as high tourist traffic, further research is needed at the mechanistic and strategic levels to address these special characteristics.
Current research is focused on summer in hot climate areas, particularly on improving thermal comfort. Meanwhile, in winter, the UHI index becomes higher compared to that in summer, diminishing thermal comfort and aggravating problems such as air pollution and energy consumption. In the future, it will be necessary to combine energy, ecology, health, and other aspects to carry out corresponding quantitative analyses in different seasons of the year.
In terms of climate scale, related research climate scales are mainly divided into three levels: global climate, urban climate, and urban microclimate. Research on the urban climate and microclimate scale appeared at an earlier stage and attracted more attention at the end of the 20th century. After the IPCC Fourth Climate Assessment Conference was held in 2007, the academic community started to carry out relevant research from the perspective of climate change at a global scale. In the future, more in-depth research will be needed on more levels, such as the micro, pedestrian, canopy, urban, and regional scales.
In terms of research perspectives, environmental studies is a core discipline that has started to focus more on energy consumption [58], air quality [99], and ecology in recent years. An increasing number of interdisciplinary areas have begun to become involved in this research field, including instrument science, physics, chemistry, and computer science, all of which have contributed to further development in terms of equipment for field measurements, air quality analysis, respiratory health, and numerical simulation, together with research objectives. Future studies will need to further integrate more disciplines in the field and at the same time focus on economics, energy, ecology, and the health of residents in affected areas, looking at elements such as urban air pollution, aspects of anthropogenic heat, and building energy consumption in greater detail in quantitative research.
4.2. Research Methods and Tools
The dominant research methods in this field are mainly real measurements, remote sensing, and simulations, and different combinations of methods are often used at different scales. Field measurements are used at various scales of research, mostly with fixed weather stations and mobile weather monitoring devices, and more advanced weather observation devices are expected to emerge in the future, as wearable pedestrian weather monitoring devices are already available [100], and more advanced climate observation devices will appear in the future. Remote sensing is often applied at the regional and city scales [101,102]. For simulation tools, WRF is applied in large-scale regional and urban studies [103]. ENVI-met is the most commonly used simulation tool for the neighborhood and street canyon scales [24], and RayMan is the most commonly used tool for calculating the thermal comfort index. Recently, the use of Grasshopper as a visualization tool to integrate various plug-ins, such as TRNSYS [104] and Eddy3D [58], has become an increasingly widespread trend. Against the current multidisciplinary background, GIS is often used as an integration platform [105], combining tools such as LCZ and InVEST [106] to analyze the impact of urban morphology on the thermal environment.
4.3. Research Content
The research content is the largest academic grouping, which mainly includes two types of content: correlation research and strategy research. Correlation research includes two parts: the effects of urban form elements with regard to thermal comfort and the related human outdoor thermal comfort. The former mainly includes the influence of multiscale urban geometry and green infrastructure on thermal comfort.
The study of the influence of multiscale urban geometry on thermal comfort includes urban-scale, block-scale, and building-scale morphology. From a temporal perspective, research on the thermal comfort of building-scale morphology was the earliest, followed by block-scale morphology. Recently, research has been carried out from the perspective of larger urban-scale morphology. In general, it seems that the urban morphological elements with regard to thermal comfort in existing studies are more often studied from a 2D perspective in a flat plane, and less attention has been paid to urban morphology and thermal comfort on the 3D scale [107]. The effects of urban morphology on thermal comfort rely on the basic climate character of the city. In different climate zones, the characters and degrees of the influence of urban morphology on thermal comfort are different. The morphological indicators that have proven to have a significant impact in various climatic zones include SVF, aspect ratio, street orientation, building density, building height, greening ratio, and impervious area ratio. However, on a larger urban scale, more accurate morphological characterization parameters need to be integrated into multiple layers by referring to LCZ combined with information on urban building density, open space, green infrastructure systems, and materials [30,73].
Green infrastructure has the most relevant research on the evaluation of thermal comfort because its greening and cooling effect is the most significant [18,97]. According to cluster analysis, the research focus includes urban trees, pedestrian-level greening, building–tree arrangements, and green roofs. In terms of time, research on green roofs was the earliest, followed by pedestrian-level greening, building–tree arrangements, and urban trees. There are relatively few studies on vertical greening. Urban facades are an important part of the urban 3D form. More research on vertical greening can be carried out in the future. Furthermore, although the impact of green infrastructure on urban thermal comfort seems to have been confirmed by many studies, relevant research may continue in different climate zones. At the same time, future research will pay more attention to large-scale green cooling sources such as water bodies and parks.
Among the thermal comfort studies, research about the relationship between urban morphology and outdoor thermal comfort is relatively mature, and less attention has been paid to indoor thermal comfort, which is because urban morphology directly affects outdoor thermal comfort by affecting solar radiation and ventilation but indirectly affects indoor thermal comfort. For example, the correlation between urban SVF and indoor thermal comfort is not significant [108]. Research on the evaluation of outdoor thermal comfort mainly includes thermal comfort models, thermal indices, and thermal comfort elements. Thermal comfort models include research on human thermal balance and energy exchange models. Among the thermal indices, PMV, PET, and UTCI are the most commonly used. In 2017, Freitas summarized 165 outdoor thermal indices for simulating human thermal perception. Among the indicators, UTCI had the highest score and demonstrated advantages in different climatic conditions [109]. Research on thermal comfort factors mainly includes natural ventilation, heat stress, and the psychological impact of microclimate on human behavior. Indoor thermal comfort studies mainly focus on the effects of different morphological elements on indoor thermal comfort, such as SVF [108], building orientation [80], urban green infrastructure [110], and the satisfaction of indoor thermal comfort for the elderly [111]. Strategy research is mainly based on the framework of correlation research, proposing corresponding strategies for multiscale urban geometric morphology and green infrastructure. Among these studies, the most common are those on strategies for green infrastructure and block-scale morphology, including local urban design and greening layout design guidelines. Comprehensive improvement strategy research from the perspective of urban-scale morphology is relatively lagging. In general, there is significantly less strategy research than correlation research. In the future, it will be necessary to analyze the characteristics of different levels of UHI as the basis, combined with LCZ, to improve thermal comfort while focusing on improving energy consumption, ecology, and health. In addition, certain strategies are time-dependent and have limitations, having different effects in different climatic conditions, seasons, and times of the day. For example, summer and winter cannot play a positive role at the same time, and comprehensive analysis of the temporal and spatial effects of the strategy is required.
In terms of limitations, CiteSpace is good at mapping existing research studies but less good at assessing detailed results in different articles. The purpose of this research was to sort out the mainstream research framework, academic groupings, and dynamics in urban morphology and thermal comfort research from a macro perspective. In view of the numerous topics, some content had to be omitted from the overview of a specific topic. In addition, given the advantage of CiteSpace in capturing high-frequency hotspots, it can be seen that there are more discussions on the mainstream research framework and fewer discussions on some non-mainstream topics that appear less frequently.
5. Conclusions
In this paper, based on CiteSpace literature visualization and analysis software, using the Web of Science core database as the data source, we visualized and analyzed 556 papers in the field of research related to urban morphology and thermal comfort from 1993 to 2020, and we found that this field will continue to be a key area receiving extensive attention from the academic community for some time in the future.
In terms of the number of publications, research in this field has grown exponentially since 2007. In terms of countries, China has the highest number of publications, and Germany has the strongest academic impact, followed by the USA and England. According to the co-occurrence map and time-zone map of research subjects, environmental studies is the core discipline in urban morphology and thermal comfort studies, and meteorology, atmospheric sciences, and ecology are emerging disciplines playing important roles. According to the keyword co-occurrence map and research topic timeline map, with increasingly emerging disciplines, the field shifted from the single focus on improving thermal comfort to the simultaneous focus on anthropogenic heat emission, energy consumption, air pollution, ecology, and human health in recent years. The intersection of related disciplines will also produce a deeper integration.
In terms of academic groupings and research topics, in addition to the mainstream tropical and subtropical climate zones, a broader range of climate zones also needs attention. At the same time, more comprehensive study is needed to combine the spatial and temporal changes throughout the year at the micro, pedestrian, block, urban, and regional scales. With the crossover of research methods, many new research tools have been created by measurement and simulation, and future researchers will need to pay attention to the use of such tools. In addition to building-scale and block-scale morphology, urban-scale morphology and urban green infrastructure will be the focus of future research. In general, the research framework in this field is well established, and future research will further deepen the investigation of certain research topics.
With the presence of global climate change and the frequent occurrence of extreme climate events, the future urban climate environment will face greater threats and challenges. The research field of urban morphology and thermal comfort is closely related to the urban environment. In this research, we conducted a systematic review of the field and identified the mainstream research framework and future research trends with the purpose of inspiring related researchers to further improve the field; this review could also serve governments in terms of providing more appropriate ideas when formulating policies related to urban morphology.
Author Contributions
Conceptualization, Y.W. and D.Z.; methodology, Y.C.; formal analysis, Y.C. and Y.W.; investigation, Y.C. and Y.W.; writing—review and editing, Y.C., Y.W., and D.Z.; visualization, Y.C.; supervision, Y.W. and D.Z.; funding acquisition, Y.W. All authors have read and agreed to the published version of the manuscript.
Funding
This research was funded by the National Natural Science Foundation of China, grant number 52078416.
Conflicts of Interest
The authors declare no conflict of interest.
References
- DAES. World Urbanization Prospects 2018: Highlights; United Nations: New York, NY, USA, 2019. [Google Scholar]
- Wu, F.; Geng, Y.; Tian, X.; Zhong, S.; Wu, W.; Yu, S.; Xiao, S. Responding climate change: A bibliometric review on urban environmental governance. J. Clean. Prod. 2018, 204, 344–354. [Google Scholar] [CrossRef]
- Soon, W.W.-H.; Connolly, R.; Connolly, M.; O’Neill, P.; Zheng, J.; Ge, Q.; Hao, Z.; Yan, H. Comparing the current and early 20th century warm periods in China. Earth-Sci. Rev. 2018, 185, 80–101. [Google Scholar] [CrossRef]
- Zeng, Y.; Cao, Y.; Qiao, X.; Seyler, B.C.; Tang, Y. Air pollution reduction in China: Recent success but great challenge for the future. Sci. Total Environ. 2019, 663, 329–337. [Google Scholar] [CrossRef] [PubMed]
- Wu, W.; Wang, M.; Zhang, F. Commuting behavior and congestion satisfaction: Evidence from Beijing, China. Transp. Res. Part D Transp. Environ. 2019, 67, 553–564. [Google Scholar] [CrossRef]
- Li, G.; Zhang, X.; Mirzaei, P.A.; Zhang, J.; Zhao, Z. Urban heat island effect of a typical valley city in China: Responds to the global warming and rapid urbanization. Sustain. Cities Soc. 2018, 38, 736–745. [Google Scholar] [CrossRef]
- Oke, T.R. The energetic basis of the urban heat island. Q. J. R. Meteorol. Soc. 1982, 108, 1–24. [Google Scholar] [CrossRef]
- Xu, Y.; Ren, C.; Ma, P.F.; Ho, J.; Wang, W.W.; Lau, K.K.L.; Lin, H.; Ng, E. Urban morphology detection and computation for urban climate research. Landsc. Urban Plan. 2017, 167, 212–224. [Google Scholar] [CrossRef]
- Yang, Z.W.; Chen, Y.B.; Zheng, Z.H.; Huang, Q.Y.; Wu, Z.F. Application of building geometry indexes to assess the correlation between buildings and air temperature. Build. Environ. 2020, 167, 106477. [Google Scholar] [CrossRef]
- Wang, Y.; Akbari, H. The effects of street tree planting on Urban Heat Island mitigation in Montreal. Sustain. Cities Soc. 2016, 27, 122–128. [Google Scholar] [CrossRef]
- American Society of Heating, Refrigerating and Air Conditioning Engineers. Thermal Environmental Conditions for Human Occupancy; American Society of Heating, Refrigerating and Air-Conditioning Engineers: Atlanta, GA, USA, 2010; Volume 55. [Google Scholar]
- Perini, K.; Magliocco, A. Effects of vegetation, urban density, building height, and atmospheric conditions on local temperatures and thermal comfort. Urban For. Urban Green. 2014, 13, 495–506. [Google Scholar] [CrossRef]
- Fernandes, M.E.; Masiero, E. Relationship between outdoor thermal comfort and Local Climate Zones. Urbe-Rev. Bras. Gest. Urbana 2020, 12, 16. [Google Scholar] [CrossRef]
- Baruti, M.M.; Johansson, E.; Yahia, M.W. Urbanites’ outdoor thermal comfort in the informal urban fabric of warm-humid Dar es Salaam, Tanzania. Sustain. Cities Soc. 2020, 62, 14. [Google Scholar] [CrossRef]
- Hajat, S.; Kosatky, T. Heat-related mortality: A review and exploration of heterogeneity. J. Epidemiol. Community Health 2010, 64, 753–760. [Google Scholar] [CrossRef]
- Vandentorren, S.; Bretin, P.; Zeghnoun, A.; Mandereau-Bruno, L.; Croisier, A.; Cochet, C.; Riberon, J.; Siberan, I.; Declercq, B.; Ledrans, M. August 2003 heat wave in France: Risk factors for death of elderly people living at home. Eur. J. Public Health 2006, 16, 583–591. [Google Scholar] [CrossRef] [Green Version]
- Zuo, J.; Pullen, S.; Palmer, J.; Bennetts, H.; Chileshe, N.; Ma, T. Impacts of heat waves and corresponding measures: A review. J. Clean. Prod. 2015, 92, 1–12. [Google Scholar] [CrossRef]
- Zaki, S.A.; Othman, N.E.; Syahidah, S.W.; Yakub, F.; Muhammad-Sukki, F.; Ardila-Rey, J.A.; Shahidan, M.F.; Saudi, A.S.M. Effects of Urban Morphology on Microclimate Parameters in an Urban University Campus. Sustainability 2020, 12, 2962. [Google Scholar] [CrossRef] [Green Version]
- Middel, A.; Häb, K.; Brazel, A.J.; Martin, C.A.; Guhathakurta, S. Impact of urban form and design on mid-afternoon microclimate in Phoenix Local Climate Zones. Landsc. Urban Plan. 2014, 122, 16–28. [Google Scholar] [CrossRef]
- Taleghani, M.; Kleerekoper, L.; Tenpierik, M.; Van den Dobbelsteen, A. Outdoor thermal comfort within five different urban forms in the Netherlands. Build. Environ. 2015, 83, 65–78. [Google Scholar] [CrossRef]
- Stone, B.; Hess, J.J.; Frumkin, H. Urban form and extreme heat events: Are sprawling cities more vulnerable to climate change than compact cities? Environ. Health Perspect. 2010, 118, 1425–1428. [Google Scholar] [CrossRef] [Green Version]
- Xu, X.D.; Yin, C.H.; Wang, W.; Xu, N.; Hong, T.Z.; Li, Q. Revealing Urban Morphology and Outdoor Comfort through Genetic Algorithm-Driven Urban Block Design in Dry and Hot Regions of China. Sustainability 2019, 11, 3683. [Google Scholar] [CrossRef] [Green Version]
- Baruti, M.M.; Johansson, E.; Astrand, J. Review of studies on outdoor thermal comfort in warm humid climates: Challenges of informal urban fabric. Int. J. Biometeorol. 2019, 63, 1449–1462. [Google Scholar] [CrossRef] [Green Version]
- Toparlar, Y.; Blocken, B.; Toparlar, Y.; Maiheu, B.; Van Heijst, G.J.F. A review on the CFD analysis of urban microclimate. Renew. Sustain. Energy Rev. 2017, 80, 1613. [Google Scholar] [CrossRef]
- Lai, D.Y.; Liu, W.Y.; Gan, T.T.; Liu, K.X.; Chen, Q.Y. A review of mitigating strategies to improve the thermal environment and thermal comfort in urban outdoor spaces. Sci. Total Environ. 2019, 661, 337–353. [Google Scholar] [CrossRef] [PubMed]
- Rupp, R.F.; Vasquez, N.G.; Lamberts, R. A review of human thermal comfort in the built environment. Energy Build. 2015, 105, 178–205. [Google Scholar] [CrossRef]
- Hami, A.; Abdi, B.; Zarehaghi, D.; Bin Maulan, S. Assessing the thermal comfort effects of green spaces: A systematic review of methods, parameters, and plants’ attributes. Sustain. Cities Soc. 2019, 49, 11. [Google Scholar] [CrossRef]
- Guo, L.L.; Li, B.F.; Chen, H. A Review of the Impact of Urban Block Form on Urban Microclimate. New Arch 2018, 5, 28–38. [Google Scholar] [CrossRef]
- Shafaghat, A.; Manteghi, G.; Keyvanfar, A.; Bin Lamit, H.; Saito, K.; Ossen, D.R. Street Geometry Factors Influence Urban Microclimate in Tropical Coastal Cities: A Review. Environ. Clim. Technol. 2016, 17, 61–75. [Google Scholar] [CrossRef] [Green Version]
- AlKhaled, S.; Coseo, P.; Brazel, A.; Cheng, C.W.; Sailor, D. Between aspiration and actuality: A systematic review of morphological heat mitigation strategies in hot urban deserts. Urban Clim. 2020, 31, 100570. [Google Scholar] [CrossRef]
- Sanaieian, H.; Tenpierik, M.; Van den Linden, K.; Seraj, F.M.; Shemrani, S.M.M. Review of the impact of urban block form on thermal performance, solar access and ventilation. Renew. Sustain. Energy Rev. 2014, 38, 551–560. [Google Scholar] [CrossRef]
- Gago, E.J.; Roldan, J.; Pacheco-Torres, R.; Ordonez, J. The city and urban heat islands: A review of strategies to mitigate adverse effects. Renew. Sustain. Energy Rev. 2013, 25, 749–758. [Google Scholar] [CrossRef]
- Jamei, E.; Rajagopalan, P.; Seyedmahmoudian, M.; Jamei, Y. Review on the impact of urban geometry and pedestrian level greening on outdoor thermal comfort. Renew. Sustain. Energy Rev. 2016, 54, 1002–1017. [Google Scholar] [CrossRef]
- Akbari, H.; Cartalis, C.; Kolokotsa, D.; Muscio, A.; Pisello, A.L.; Rossi, F.; Santamouris, M.; Synnef, A.; Wong, N.H.; Zinzi, M. Local Climate Change and Urban Heat Island Mitigation Techniques—The State of the Art. J. Civ. Eng. Manag. 2015, 22, 1–16. [Google Scholar] [CrossRef] [Green Version]
- Santamouris, M. Cooling the cities—A review of reflective and green roof mitigation technologies to fight heat island and improve comfort in urban environments. Sol. Energy 2014, 103, 682–703. [Google Scholar] [CrossRef]
- Chen, C.; Song, M. Visualizing a field of research: A methodology of systematic scientometric reviews. PLoS ONE 2019, 14, e0223994. [Google Scholar] [CrossRef] [Green Version]
- Jiang, Y.; Hou, L.; Shi, T.; Gui, Q. A Review of Urban Planning Research for Climate Change. Sustainability 2017, 9, 2224. [Google Scholar] [CrossRef] [Green Version]
- Xue, J.; You, R.; Liu, W.; Chen, C.; Lai, D. Applications of Local Climate Zone Classification Scheme to Improve Urban Sustainability: A Bibliometric Review. Sustainability 2020, 12, 8083. [Google Scholar] [CrossRef]
- Meng, L.; Wen, K.-H.; Brewin, R.; Wu, Q. Knowledge Atlas on the Relationship between Urban Street Space and Residents’ Health—A Bibliometric Analysis Based on VOSviewer and CiteSpace. Sustainability 2020, 12, 2384. [Google Scholar] [CrossRef] [Green Version]
- Chen, C. Science Mapping: A Systematic Review of the Literature. J. Data Inf. Sci. 2017, 2, 1–40. [Google Scholar] [CrossRef] [Green Version]
- Chen, C. CiteSpace: A Practical Guide for Mapping Scientific Literature; Nova Science Publishers: New York, NY, USA, 2016. [Google Scholar]
- Small, H. Cocitation in scientific literature-New measure of relationship between 2 documents. J. Am. Soc. Inf. Sci. 1973, 24, 265–269. [Google Scholar] [CrossRef]
- Chen, C.; Ibekwe-SanJuan, F.; Hou, J. The structure and dynamics of cocitation clusters: A multiple-perspective cocitation analysis. J. Am. Soc. Inf. Sci. Technol. 2010, 61, 1386–1409. [Google Scholar] [CrossRef] [Green Version]
- Kleinberg, J. Bursty and hierarchical structure in streams. Data Min. Knowl. Discov. 2003, 7, 373–397. [Google Scholar] [CrossRef]
- Norton, B.A.; Coutts, A.M.; Livesley, S.J.; Harris, R.J.; Hunter, A.M.; Williams, N.S.G. Planning for cooler cities: A framework to prioritise green infrastructure to mitigate high temperatures in urban landscapes. Landsc. Urban Plan. 2015, 134, 127–138. [Google Scholar] [CrossRef]
- Johansson, E. Influence of urban geometry on outdoor thermal comfort in a hot dry climate: A study in Fez, Morocco. Build. Environ. 2006, 41, 1326–1338. [Google Scholar] [CrossRef]
- Oliveira, S.; Andrade, H.; Vaz, T. The cooling effect of green spaces as a contribution to the mitigation of urban heat: A case study in Lisbon. Build. Environ. 2011, 46, 2186–2194. [Google Scholar] [CrossRef]
- Jamei, E.; Rajagopalan, P. Urban development and pedestrian thermal comfort in Melbourne. Sol. Energy 2017, 144, 681–698. [Google Scholar] [CrossRef]
- Ali-Toudert, F.; Mayer, H. Effects of asymmetry, galleries, overhanging facades and vegetation on thermal comfort in urban street canyons. Sol. Energy 2007, 81, 742–754. [Google Scholar] [CrossRef]
- Charalampopoulos, I.; Tsiros, I.; Chronopoulou-Sereli, A.; Matzarakis, A. Analysis of thermal bioclimate in various urban configurations in Athens, Greece. Urban Ecosyst. 2013, 16, 217–233. [Google Scholar] [CrossRef]
- Ketterer, C.; Matzarakis, A. Human-biometeorological assessment of heat stress reduction by replanning measures in Stuttgart, Germany. Landsc. Urban Plan. 2014, 122, 78–88. [Google Scholar] [CrossRef]
- Letzel, M.O.; Helmke, C.; Ng, E.; An, X.P.; Lai, A.; Raasch, S. LES case study on pedestrian level ventilation in two neighbourhoods in Hong Kong. Meteorol. Z 2012, 21, 575–589. [Google Scholar] [CrossRef]
- Allegrini, J.; Carmeliet, J. Coupled CFD and building energy simulations for studying the impacts of building height topology and buoyancy on local urban microclimates. Urban Clim. 2017, 21, 278–305. [Google Scholar] [CrossRef]
- Lee, H.; Mayer, H.; Chen, L. Contribution of trees and grasslands to the mitigation of human heat stress in a residential district of Freiburg, Southwest Germany. Landsc. Urban Plan. 2016, 148, 37–50. [Google Scholar] [CrossRef]
- Johansson, E.; Emmanuel, R. The influence of urban design on outdoor thermal comfort in the hot, humid city of Colombo, Sri Lanka. Int. J. Biometeorol. 2006, 51, 119–133. [Google Scholar] [CrossRef] [PubMed]
- Emmanuel, R.; Fernand, H.J.S. Urban heat islands in humid and arid climates: Role of urban form and thermal properties in Colombo, Sri Lanka and Phoenix, USA. Clim. Res. 2007, 34, 241–251. [Google Scholar] [CrossRef] [Green Version]
- Endler, C.; Oehler, K.; Matzarakis, A. Vertical gradient of climate change and climate tourism conditions in the Black Forest. Int. J. Biometeorol. 2010, 54, 45–61. [Google Scholar] [CrossRef]
- Natanian, J.; Kastner, P.; Dogan, T.; Auer, T. From energy performative to livable Mediterranean cities: An annual outdoor thermal comfort and energy balance cross-climatic typological study. Energy Build. 2020, 224, 110283. [Google Scholar] [CrossRef]
- Algeciras, J.A.R.; Consuegra, L.G.; Matzarakis, A. Spatial-temporal study on the effects of urban street configurations on human thermal comfort in the world heritage city of Camaguey-Cuba. Build. Environ. 2016, 101, 85–101. [Google Scholar] [CrossRef]
- Zhang, L.; Zhan, Q.M.; Lan, Y.L. Effects of the tree distribution and species on outdoor environment conditions in a hot summer and cold winter zone: A case study in Wuhan residential quarters. Build. Environ. 2018, 130, 27–39. [Google Scholar] [CrossRef]
- Zhao, D.; Lei, Q.H.; Shi, Y.J.; Wang, M.D.; Chen, S.B.; Shah, K.; Ji, W.L. Role of Species and Planting Configuration on Transpiration and Microclimate for Urban Trees. Forests 2020, 11, 825. [Google Scholar] [CrossRef]
- Morakinyo, T.E.; Ouyang, W.L.; Lau, K.K.L.; Ren, C.; Ng, E. Right tree, right place (urban canyon): Tree species selection approach for optimum urban heat mitigation-development and evaluation. Sci. Total Environ. 2020, 719, 20. [Google Scholar] [CrossRef]
- Li, G.G.; Ren, Z.H.; Zhan, C.H. Sky View Factor-based correlation of landscape morphology and the thermal environment of street canyons: A case study of Harbin, China. Build. Environ. 2020, 169, 106587. [Google Scholar] [CrossRef]
- De Munck, C.S.; Lemonsu, A.; Bouzouidja, R.; Masson, V.; Claverie, R. The GREENROOF module (v7.3) for modelling green roof hydrological and energetic performances within TEB. Geosci. Model Dev. 2013, 6, 1941–1960. [Google Scholar] [CrossRef] [Green Version]
- Jamei, E.; Ossen, D.R.; Seyedmahmoudian, M.; Sandanayake, M.; Stojcevski, A.; Horan, B. Urban design parameters for heat mitigation in tropics. Renew. Sustain. Energy Rev. 2020, 134, 110362. [Google Scholar] [CrossRef]
- Hong, B.; Lin, B.R.; Qin, H.Q. Numerical investigation on the coupled effects of building-tree arrangements on fine particulate matter (PM2.5) dispersion in housing blocks. Sustain. Cities Soc. 2017, 34, 358–370. [Google Scholar] [CrossRef]
- Srivanit, M.; Jareemit, D. Modeling the influences of layouts of residential townhouses and tree-planting patterns on outdoor thermal comfort in Bangkok suburb. J. Build. Eng. 2020, 30, 101262. [Google Scholar] [CrossRef]
- Galal, O.M.; Mahmoud, H.; Sailor, D. Impact of evolving building morphology on microclimate in a hot arid climate. Sustain. Cities Soc. 2020, 54, 102011. [Google Scholar] [CrossRef]
- Thom, J.K.; Coutts, A.M.; Broadbent, A.M.; Tapper, N.J. The influence of increasing tree cover on mean radiant temperature across a mixed development suburb in Adelaide, Australia. Urban For. Urban Green. 2016, 20, 233–242. [Google Scholar] [CrossRef]
- Yang, X.S.; Zhao, L.H. Diurnal Thermal Behavior of Pavements, Vegetation, and Water Pond in a Hot-Humid City. Buildings 2016, 6, 2. [Google Scholar] [CrossRef] [Green Version]
- Mostofa, T.; Manteghi, G. Influential factors of water body to enhance the urban cooling islands (Ucis): A review. Int. Trans. J. Eng. Manag. Appl. Sci. Technol. 2020, 11, 12. [Google Scholar] [CrossRef]
- Cai, Z.; Han, G.F.; Chen, M.C. Do water bodies play an important role in the relationship between urban form and land surface temperature? Sustain. Cities Soc. 2018, 39, 487–498. [Google Scholar] [CrossRef]
- Quan, J.L. Multi-Temporal Effects of Urban Forms and Functions on Urban Heat Islands Based on Local Climate Zone Classification. Int. J. Environ. Res. Public Health 2019, 16, 2140. [Google Scholar] [CrossRef] [Green Version]
- Kwok, Y.T.; Schoetter, R.; Lau, K.K.L.; Hidalgo, J.; Ren, C.; Pigeon, G.; Masson, V. How well does the local climate zone scheme discern the thermal environment of Toulouse (France)? An analysis using numerical simulation data. Int. J. Climatol. 2019, 39, 5292–5315. [Google Scholar] [CrossRef]
- Kotharkar, R.; Bagade, A.; Agrawal, A. Investigating Local Climate Zones for Outdoor Thermal Comfort Assessment in an Indian City. Geogr. Pannonica 2019, 23, 318–328. [Google Scholar] [CrossRef] [Green Version]
- Javanroodi, K.; Mandavinejad, M.; Nik, V.M. Impacts of urban morphology on reducing cooling load and increasing ventilation potential in hot-arid climate. Appl. Energy 2018, 231, 714–746. [Google Scholar] [CrossRef]
- Huang, K.T.; Li, Y.J. Impact of street canyon typology on building’s peak cooling energy demand: A parametric analysis using orthogonal experiment. Energy Build. 2017, 154, 448–464. [Google Scholar] [CrossRef]
- Morini, E.; Castellani, B.; De Ciantis, S.; Anderini, E.; Rossi, F. Planning for cooler urban canyons: Comparative analysis of the influence of facades reflective properties on urban canyon thermal behavior. Sol. Energy 2018, 162, 14–27. [Google Scholar] [CrossRef]
- Xie, X.X.; Sahin, O.; Luo, Z.W.; Yao, R.M. Impact of neighborhood-scale climate characteristics on building heating demand and night ventilation cooling potential. Renew. Energy 2020, 150, 943–956. [Google Scholar] [CrossRef]
- Mavrogianni, A.; Wilkinson, P.; Davies, M.; Biddulph, P.; Oikonomou, E. Building characteristics as determinants of propensity to high indoor summer temperatures in London dwellings. Build. Environ. 2012, 55, 117–130. [Google Scholar] [CrossRef] [Green Version]
- Natanian, J.; Auer, T. Beyond nearly zero energy urban design: A holistic microclimatic energy and environmental quality evaluation workflow. Sustain. Cities Soc. 2020, 56, 11. [Google Scholar] [CrossRef]
- Fahmy, M.; Sharples, S. On the development of an urban passive thermal comfort system in Cairo, Egypt. Build. Environ. 2009, 44, 1907–1916. [Google Scholar] [CrossRef]
- Salata, F.; Golasi, I.; de Lieto Vollaro, R.; de Lieto Vollaro, A. Urban microclimate and outdoor thermal comfort. A proper procedure to fit ENVI-met simulation outputs to experimental data. Sustain. Cities Soc. 2016, 26, 318–343. [Google Scholar] [CrossRef]
- Chatzidimitriou, A.; Yannas, S. Street canyon design and improvement potential for urban open spaces; the influence of canyon aspect ratio and orientation on microclimate and outdoor comfort. Sustain. Cities Soc. 2017, 33, 85–101. [Google Scholar] [CrossRef]
- Kruger, E.L.; Minella, F.O.; Rasia, F. Impact of urban geometry on outdoor thermal comfort and air quality from field measurements in Curitiba, Brazil. Build. Environ. 2011, 46, 621–634. [Google Scholar] [CrossRef]
- Van Hove, L.W.A.; Jacobs, C.M.J.; Heusinkveld, B.G.; Elbers, J.A.; van Driel, B.L.; Holtslag, A.A.M. Temporal and spatial variability of urban heat island and thermal comfort within the Rotterdam agglomeration. Build. Environ. 2015, 83, 91–103. [Google Scholar] [CrossRef] [Green Version]
- Wang, Y.P.; Berardi, U.; Akbari, H. Comparing the effects of urban heat island mitigation strategies for Toronto, Canada. Energy Build. 2016, 114, 2–19. [Google Scholar] [CrossRef]
- De Abreu-Harbich, L.V.; Labaki, L.C.; Matzarakis, A. Effect of tree planting design and tree species on human thermal comfort in the tropics. Landsc. Urban Plan. 2015, 138, 99–109. [Google Scholar] [CrossRef]
- Morakinyo, T.E.; Lam, Y.F. Simulation study on the impact of tree-configuration, planting pattern and wind condition on street-canyon’s micro-climate and thermal comfort. Build. Environ. 2016, 103, 262–275. [Google Scholar] [CrossRef]
- Ng, E.; Chen, L.; Wang, Y.; Yuan, C. A study on the cooling effects of greening in a high-density city: An experience from Hong Kong. Build. Environ. 2012, 47, 256–271. [Google Scholar] [CrossRef]
- Taleb, D.; Abu-Hijleh, B. Urban heat islands: Potential effect of organic and structured urban configurations on temperature variations in Dubai, UAE. Renew. Energy 2013, 50, 747–762. [Google Scholar] [CrossRef]
- Tan, Z.; Lau, K.K.L.; Ng, E. Urban tree design approaches for mitigating daytime urban heat island effects in a high-density urban environment. Energy Build. 2016, 114, 265–274. [Google Scholar] [CrossRef]
- Kantzioura, A.; Kosmopoulos, P.; Dimoudi, A.; Zoras, S. Experimental investigation of microclimatic conditions in relation to the built environment in a central urban area in Thessaloniki (Northern Greece): A case study. Sustain. Cities Soc. 2015, 19, 331–340. [Google Scholar] [CrossRef]
- Younsi, S.A.; Kharrat, F.; Younsi, S.A.; Kharrat, F. Urban Morphology for a Better Sustainable Urban Strategy: City of Tunis as a Case Study. In Recent Advances in Environmental Science from the Euro-Mediterranean and Surrounding Regions; Kallel, A., Ksibi, M., BenDhia, H., Khelifi, N., Eds.; Springer International Publishing: Cham, Switzerland, 2018; Volume 1, pp. 75–76. [Google Scholar]
- Peng, S.; Piao, S.; Ciais, P.; Friedlingstein, P.; Ottle, C.; Breon, F.M.; Nan, H.; Zhou, L.; Myneni, R.B. Surface urban heat island across 419 global big cities. Environ. Sci. Technol. 2012, 46, 696–703. [Google Scholar] [CrossRef]
- Zhu, Z.; Liang, J.; Sun, C.; Han, Y.S. Summer Outdoor Thermal Comfort in Urban Commercial Pedestrian Streets in Severe Cold Regions of China. Sustainability 2020, 12, 1876. [Google Scholar] [CrossRef] [Green Version]
- Manoli, G.; Fatichi, S.; Schlapfer, M.; Yu, K.; Crowther, T.W.; Meili, N.; Burlando, P.; Katul, G.G.; Bou-Zeid, E. Magnitude of urban heat islands largely explained by climate and population. Nature 2019, 573, 55–60. [Google Scholar] [CrossRef]
- Yao, X.B.; Dewancker, B.J.; Guo, Y.; Han, S.; Xu, J. Study on Passive Ventilation and Cooling Strategies for Cold Lanes and Courtyard Houses-A Case Study of Rural Traditional Village in Shaanxi, China. Sustainability 2020, 12, 8687. [Google Scholar] [CrossRef]
- Shafaghat, A.; Keyvanfar, A.; Manteghi, G.; Bin Lamit, H. Environmental-conscious factors affecting street microclimate and individuals’ respiratory health in tropical coastal cities. Sustain. Cities Soc. 2016, 21, 35–50. [Google Scholar] [CrossRef]
- Pigliautile, I.; Pisello, A.L. Environmental data clustering analysis through wearable sensing techniques: New bottom-up process aimed to identify intra-urban granular morphologies from pedestrian transects. Build. Environ. 2020, 171, 106641. [Google Scholar] [CrossRef]
- Yu, K.; Chen, Y.H.; Wang, D.D.; Chen, Z.X.; Gong, A.D.; Li, J. Study of the Seasonal Effect of Building Shadows on Urban Land Surface Temperatures Based on Remote Sensing Data. Remote Sens. 2019, 11, 497. [Google Scholar] [CrossRef] [Green Version]
- Coutts, A.M.; Harris, R.J.; Phan, T.; Livesley, S.J.; Williams, N.S.G.; Tapper, N.J. Thermal infrared remote sensing of urban heat: Hotspots, vegetation, and an assessment of techniques for use in urban planning. Remote Sens. Environ. 2016, 186, 637–651. [Google Scholar] [CrossRef]
- Wong, M.M.F.; Fung, J.C.H.; Ching, J.; Yeung, P.P.S.; Tse, J.W.P.; Ren, C.; Wang, R.; Cai, M. Evaluation of uWRF performance and modeling guidance based on WUDAPT and NUDAPT UCP datasets for Hong Kong. Urban Clim. 2019, 28, 100460. [Google Scholar] [CrossRef] [Green Version]
- Perini, K.; Chokhachian, A.; Dong, S.; Auer, T. Modeling and simulating urban outdoor comfort: Coupling ENVI-Met and TRNSYS by grasshopper. Energy Build. 2017, 152, 373–384. [Google Scholar] [CrossRef]
- Chen, Y.P.; Zheng, B.H.; Hu, Y.Z. Mapping Local Climate Zones Using ArcGIS-Based Method and Exploring Land Surface Temperature Characteristics in Chenzhou, China. Sustainability 2020, 12, 2974. [Google Scholar] [CrossRef] [Green Version]
- Ronchi, S.; Salata, S.; Arcidiacono, A. Which urban design parameters provide climate-proof cities? An application of the Urban Cooling InVEST Model in the city of Milan comparing historical planning morphologies. Sustain. Cities Soc. 2020, 63, 102459. [Google Scholar] [CrossRef]
- Huang, X.; Wang, Y. Investigating the effects of 3D urban morphology on the surface urban heat island effect in urban functional zones by using high-resolution remote sensing data: A case study of Wuhan, Central China. ISPRS-J. Photogramm. Remote Sens. 2019, 152, 119–131. [Google Scholar] [CrossRef]
- Leung, K.S.; Steemers, K. Urban Geometry, Indoor Thermal Comfort and Cooling Load: An Empirical Study on High-Density Tropical Housing; Csaar Press-Center Study Architecture Arab Region: Amman, Jordan, 2010; pp. 63–78. [Google Scholar]
- De Freitas, C.R.; Grigorieva, E.A. A comparison and appraisal of a comprehensive range of human thermal climate indices. Int. J. Biometeorol. 2017, 61, 487–512. [Google Scholar] [CrossRef] [PubMed]
- Wang, Y.F.; Bakker, F.; De Groot, R.; Wortche, H. Effect of ecosystem services provided by urban green infrastructure on indoor environment: A literature review. Build. Environ. 2014, 77, 88–100. [Google Scholar] [CrossRef]
- Mendes, A.; Pereira, C.; Mendes, D.; Aguiar, L.; Neves, P.; Silva, S.; Batterman, S.; Teixeira, J.P. Indoor Air Quality and Thermal Comfort Results of a Pilot Study in Elderly Care Centers in Portugal. J. Toxicol. Environ. Health Part A 2013, 76, 333–344. [Google Scholar] [CrossRef] [Green Version]
Figure 1.
Annual publications from 1993 to 2020.

Figure 2.
Time-zone view of contributing countries.

Figure 3.
Co-occurrence network of research subjects.

Figure 4.
Time-zone view of research subjects.

Figure 5.
Annual variations of co-occurring keywords in this field.

Figure 6.
Co-occurring keywords in the past 5 years.

Figure 7.
Cocitation network and clusters.

Figure 8.
Framework of cocited references on urban morphology and thermal comfort.

Figure 9.
Timeline view of research topics.

Figure 10.
Network of top 15 cocitations.

Figure 11.
Mainstream research framework.


Table 1.
List of cited journals and number of records contributed.
| No. | Freq | Centrality | Cited Journal | Year | Quartile Rank |
|---|---|---|---|---|---|
| 1 | 488 | 0.04 | Building and Environment | 1993 | Q1 |
| 2 | 471 | 0.07 | Energy and Buildings | 1993 | Q1 |
| 3 | 324 | 0.01 | Landscape and Urban Planning | 2006 | Q1 |
| 4 | 322 | 0.01 | Solar Energy | 2007 | Q2 |
| 5 | 315 | 0.01 | International Journal of Biometeorology | 1993 | Q2 |
| 6 | 298 | 0.01 | International Journal of Climatology | 2003 | Q1 |
| 7 | 258 | 0.03 | Theoretical and Applied Climatology | 1993 | Q2 |
| 8 | 232 | 0.06 | Atmospheric Environment | 1993 | Q2 |
| 9 | 227 | 0.01 | Sustainable Cities and Society | 2015 | Q1 |
| 10 | 221 | 0.02 | Urban Climate | 2014 | Q2 |
Table 2.
List of contributing countries and number of records contributed.
| No. | Country | Centrality | Frequency |
|---|---|---|---|
| 1 | Germany | 0.34 | 59 |
| 2 | England | 0.2 | 49 |
| 3 | USA | 0.18 | 61 |
| 4 | Sweden | 0.17 | 28 |
| 5 | China | 0.14 | 115 |
| 6 | Japan | 0.12 | 20 |
| 7 | Malaysia | 0.11 | 19 |
| 8 | Canada | 0.1 | 15 |
| 9 | Italy | 0.09 | 39 |
| 10 | Scotland | 0.09 | 11 |
Table 3.
List of contributing subjects.
| No. | Freq | Centrality | WOS Categories | Year |
|---|---|---|---|---|
| 1 | 160 | 0.44 | Engineering | 2002 |
| 2 | 144 | 0.43 | Environmental Sciences | 1999 |
| 3 | 66 | 0.4 | Environmental Studies | 2008 |
| 4 | 89 | 0.39 | Engineering and Environmental | 2005 |
| 5 | 43 | 0.34 | Urban Studies | 1995 |
| 6 | 115 | 0.26 | Meteorology and Atmospheric Sciences | 1993 |
| 7 | 2 | 0.25 | Water Resources | 2014 |
| 8 | 132 | 0.21 | Energy and Fuels | 2002 |
| 9 | 29 | 0.19 | Regional and Urban Planning | 1995 |
| 10 | 6 | 0.19 | Engineering, Multidisciplinary | 2010 |
Table 4.
List of keyword co-occurrence.
| No. | Freq | Centrality | Year | Keywords |
|---|---|---|---|---|
| 1 | 196 | 0.15 | 1993 | thermal comfort |
| 2 | 74 | 0.11 | 2007 | geometry |
| 3 | 40 | 0.11 | 2005 | index |
| 4 | 110 | 0.09 | 1993 | temperature |
| 5 | 98 | 0.09 | 2003 | environment |
| 6 | 118 | 0.08 | 1999 | heat island |
| 7 | 9 | 0.08 | 2007 | human thermal comfort |
| 8 | 150 | 0.07 | 2006 | outdoor thermal comfort |
| 9 | 147 | 0.07 | 2009 | impact |
| 10 | 114 | 0.07 | 1999 | microclimate |
| 11 | 106 | 0.07 | 2003 | design |
| 12 | 61 | 0.07 | 2006 | energy |
| 13 | 45 | 0.07 | 1993 | canyon |
| 14 | 21 | 0.07 | 2003 | heat |
| 15 | 9 | 0.07 | 2012 | CFD simulation |
| 16 | 79 | 0.06 | 2007 | hot |
| 17 | 66 | 0.06 | 2012 | street canyon |
| 18 | 65 | 0.06 | 2005 | simulation |
| 19 | 54 | 0.06 | 2008 | climate change |
| 20 | 28 | 0.06 | 2009 | building |
Table 5.
Top 8 keywords with the strongest citation bursts.
| No. | Keywords | Strength | Begin | End | 1993–2020 |
|---|---|---|---|---|---|
| 1 | environment | 5.94 | 2003 | 2015 |  |
| 2 | index | 4 | 2005 | 2015 |  |
| 3 | flux | 3.39 | 2007 | 2014 |  |
| 4 | climate | 5.45 | 2009 | 2014 |  |
| 5 | behavior | 5.24 | 2009 | 2015 |  |
| 6 | model | 3.61 | 2011 | 2014 |  |
| MRT | 4.42 | 2015 | 2017 |  | |
| 8 | summer | 3.38 | 2017 | 2018 |  |
Table 6.
List of cited clusters and number of records contributed.
| Cluster ID | Size | Label (LLR) | Mean Year |
|---|---|---|---|
| #0 | 143 | urban tree | 2016 |
| #1 | 109 | human thermal comfort | 2012 |
| #2 | 92 | pedestrian level greening | 2013 |
| #3 | 84 | urban form | 2016 |
| #4 | 65 | urban passive | 2006 |
| #5 | 60 | urban canyon | 2014 |
| #6 | 53 | green roof module | 2010 |
| #7 | 51 | moisture condition | 2003 |
| #8 | 47 | stochastic wind | 2010 |
| #9 | 45 | tropical coastal cities | 2012 |
| #10 | 38 | building characteristics | 2008 |
| #14 | 35 | black forest | 2007 |
| #20 | 15 | building–tree arrangement | 2013 |
Table 7.
Top 15 landmark studies from 1993 to 2020.
| No. | Strength | Year | City, Country | Method | Climate | Theme | Cited References |
|---|---|---|---|---|---|---|---|
| 1 | 72 | 2015 | Netherlands | ENVI-met | Temperate marine climate | Effect of urban forms on outdoor thermal comfort | [20] |
| 2 | 40 | 2016 | / | / | / | Review: effects of urban form, greening on thermal comfort | [33] |
| 3 | 30 | 2016 | Rome, Italy | ENVI-met | Mediterranean climate | Microclimate and thermal comfort simulation | [83] |
| 4 | 29 | 2016 | Freiburg, Germany | ENVI-met | Temperate marine climate | Effect of greening on thermal comfort | [54] |
| 5 | 27 | 2014 | Phoenix, Arizona, USA | ENVI-met | Tropical desert climate | Effect of urban form, greening on thermal comfort | [19] |
| 6 | 25 | 2014 | Milan, Genoa, and Rome, Italy | ENVI-met | Mediterranean climate | Effect of vegetation, urban density, building height on thermal comfort | [12] |
| 7 | 24 | 2014 | / | / | / | Effect of reflective, green roofs on thermal comfort | [35] |
| 8 | 24 | 2017 | Thessaloniki, Greece | ENVI-met | Mediterranean climate | Effect of street canyon design on thermal comfort | [84] |
| 9 | 19 | 2011 | Curitiba, Brazil | ENVI-met | Temperate marine climate | Effect of urban geometry on thermal comfort | [85] |
| 10 | 18 | 2015 | Rotterdam, Netherlands | Field measurement | Temperate marine climate | Urban heat island and thermal | [86] |
| comfort | |||||||
| 11 | 18 | 2016 | Toronto, Canada | ENVI-met | Humid continental climate | UHI mitigation strategies | [87] |
| 12 | 17 | 2015 | Campinas, Brazil | Field measurement | Subtropical climate | Effect of planting design and tree species on human thermal comfort | [88] |
| 13 | 17 | 2016 | Campinas, Brazil | ENVI-met | Subtropical monsoon climate | Effect of vegetation, street canyons on thermal comfort | [89] |
| 14 | 16 | 2012 | Campinas, Brazil | ENVI-met | Subtropical monsoon climate | Cooling effects of greening | [90] |
| 15 | 15 | 2017 | / | / | / | Review: CFD analysis of urban microclimate | [24] |
Publisher’s Note: MDPI stays neutral with regard to jurisdictional claims in published maps and institutional affiliations. |
© 2021 by the authors. Licensee MDPI, Basel, Switzerland. This article is an open access article distributed under the terms and conditions of the Creative Commons Attribution (CC BY) license (https://creativecommons.org/licenses/by/4.0/).
Share and Cite
MDPI and ACS Style
Chen, Y.; Wang, Y.; Zhou, D. Knowledge Map of Urban Morphology and Thermal Comfort: A Bibliometric Analysis Based on CiteSpace. Buildings 2021, 11, 427. https://0-doi-org.brum.beds.ac.uk/10.3390/buildings11100427
AMA Style
Chen Y, Wang Y, Zhou D. Knowledge Map of Urban Morphology and Thermal Comfort: A Bibliometric Analysis Based on CiteSpace. Buildings. 2021; 11(10):427. https://0-doi-org.brum.beds.ac.uk/10.3390/buildings11100427
Chicago/Turabian StyleChen, Yuan, Yupeng Wang, and Dian Zhou. 2021. "Knowledge Map of Urban Morphology and Thermal Comfort: A Bibliometric Analysis Based on CiteSpace" Buildings 11, no. 10: 427. https://0-doi-org.brum.beds.ac.uk/10.3390/buildings11100427
Note that from the first issue of 2016, this journal uses article numbers instead of page numbers. See further details here.