
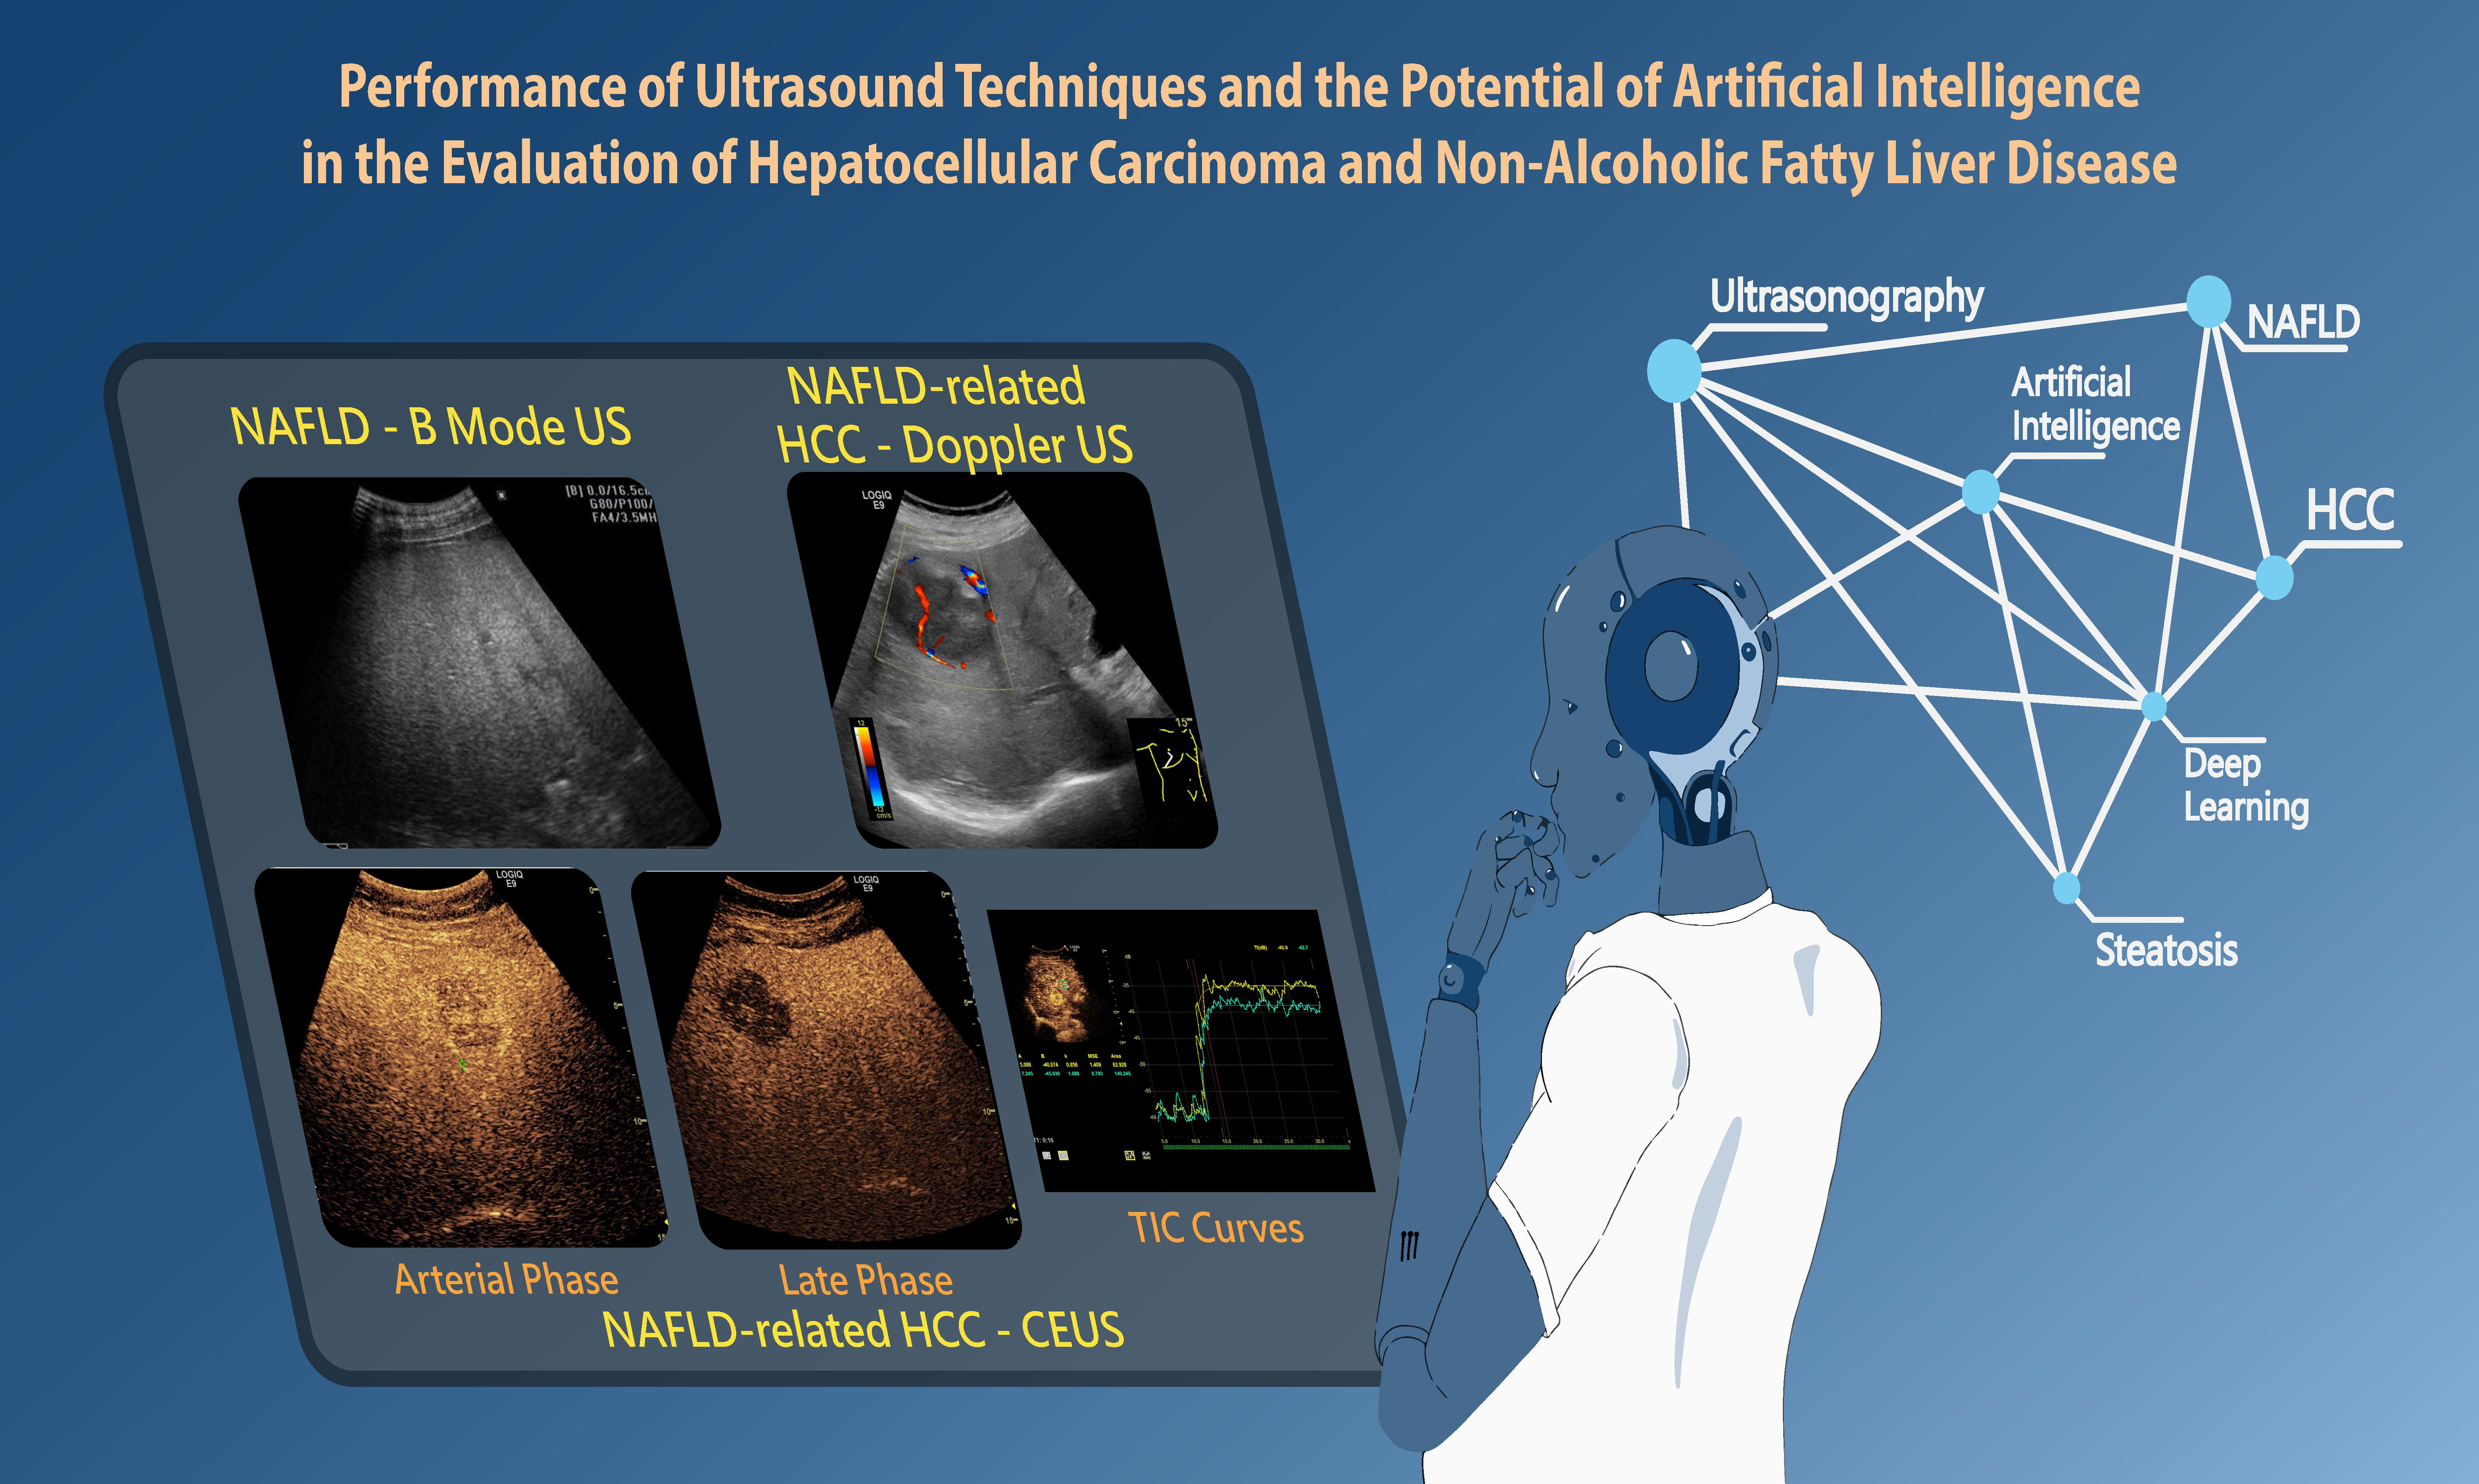
Performance of Ultrasound Techniques and the Potential of Artificial Intelligence in the Evaluation of Hepatocellular Carcinoma and Non-Alcoholic Fatty Liver Disease

 ,
,  ,
, 
 and
and
Abstract
:Simple Summary
Abstract

1. Introduction
2. Conventional Ultrasonography
2.1. Evaluating NAFLD Using Conventional US
2.1.1. Ultrasound Diagnostic Criteria for Hepatic Steatosis
2.1.2. Quantitative Assessment of Hepatic Steatosis
2.1.3. US Performance for Steatosis Detection
2.1.4. Ultrasonographic Steatosis Patterns
2.1.5. Limitations of Ultrasonography in Steatosis Diagnosis
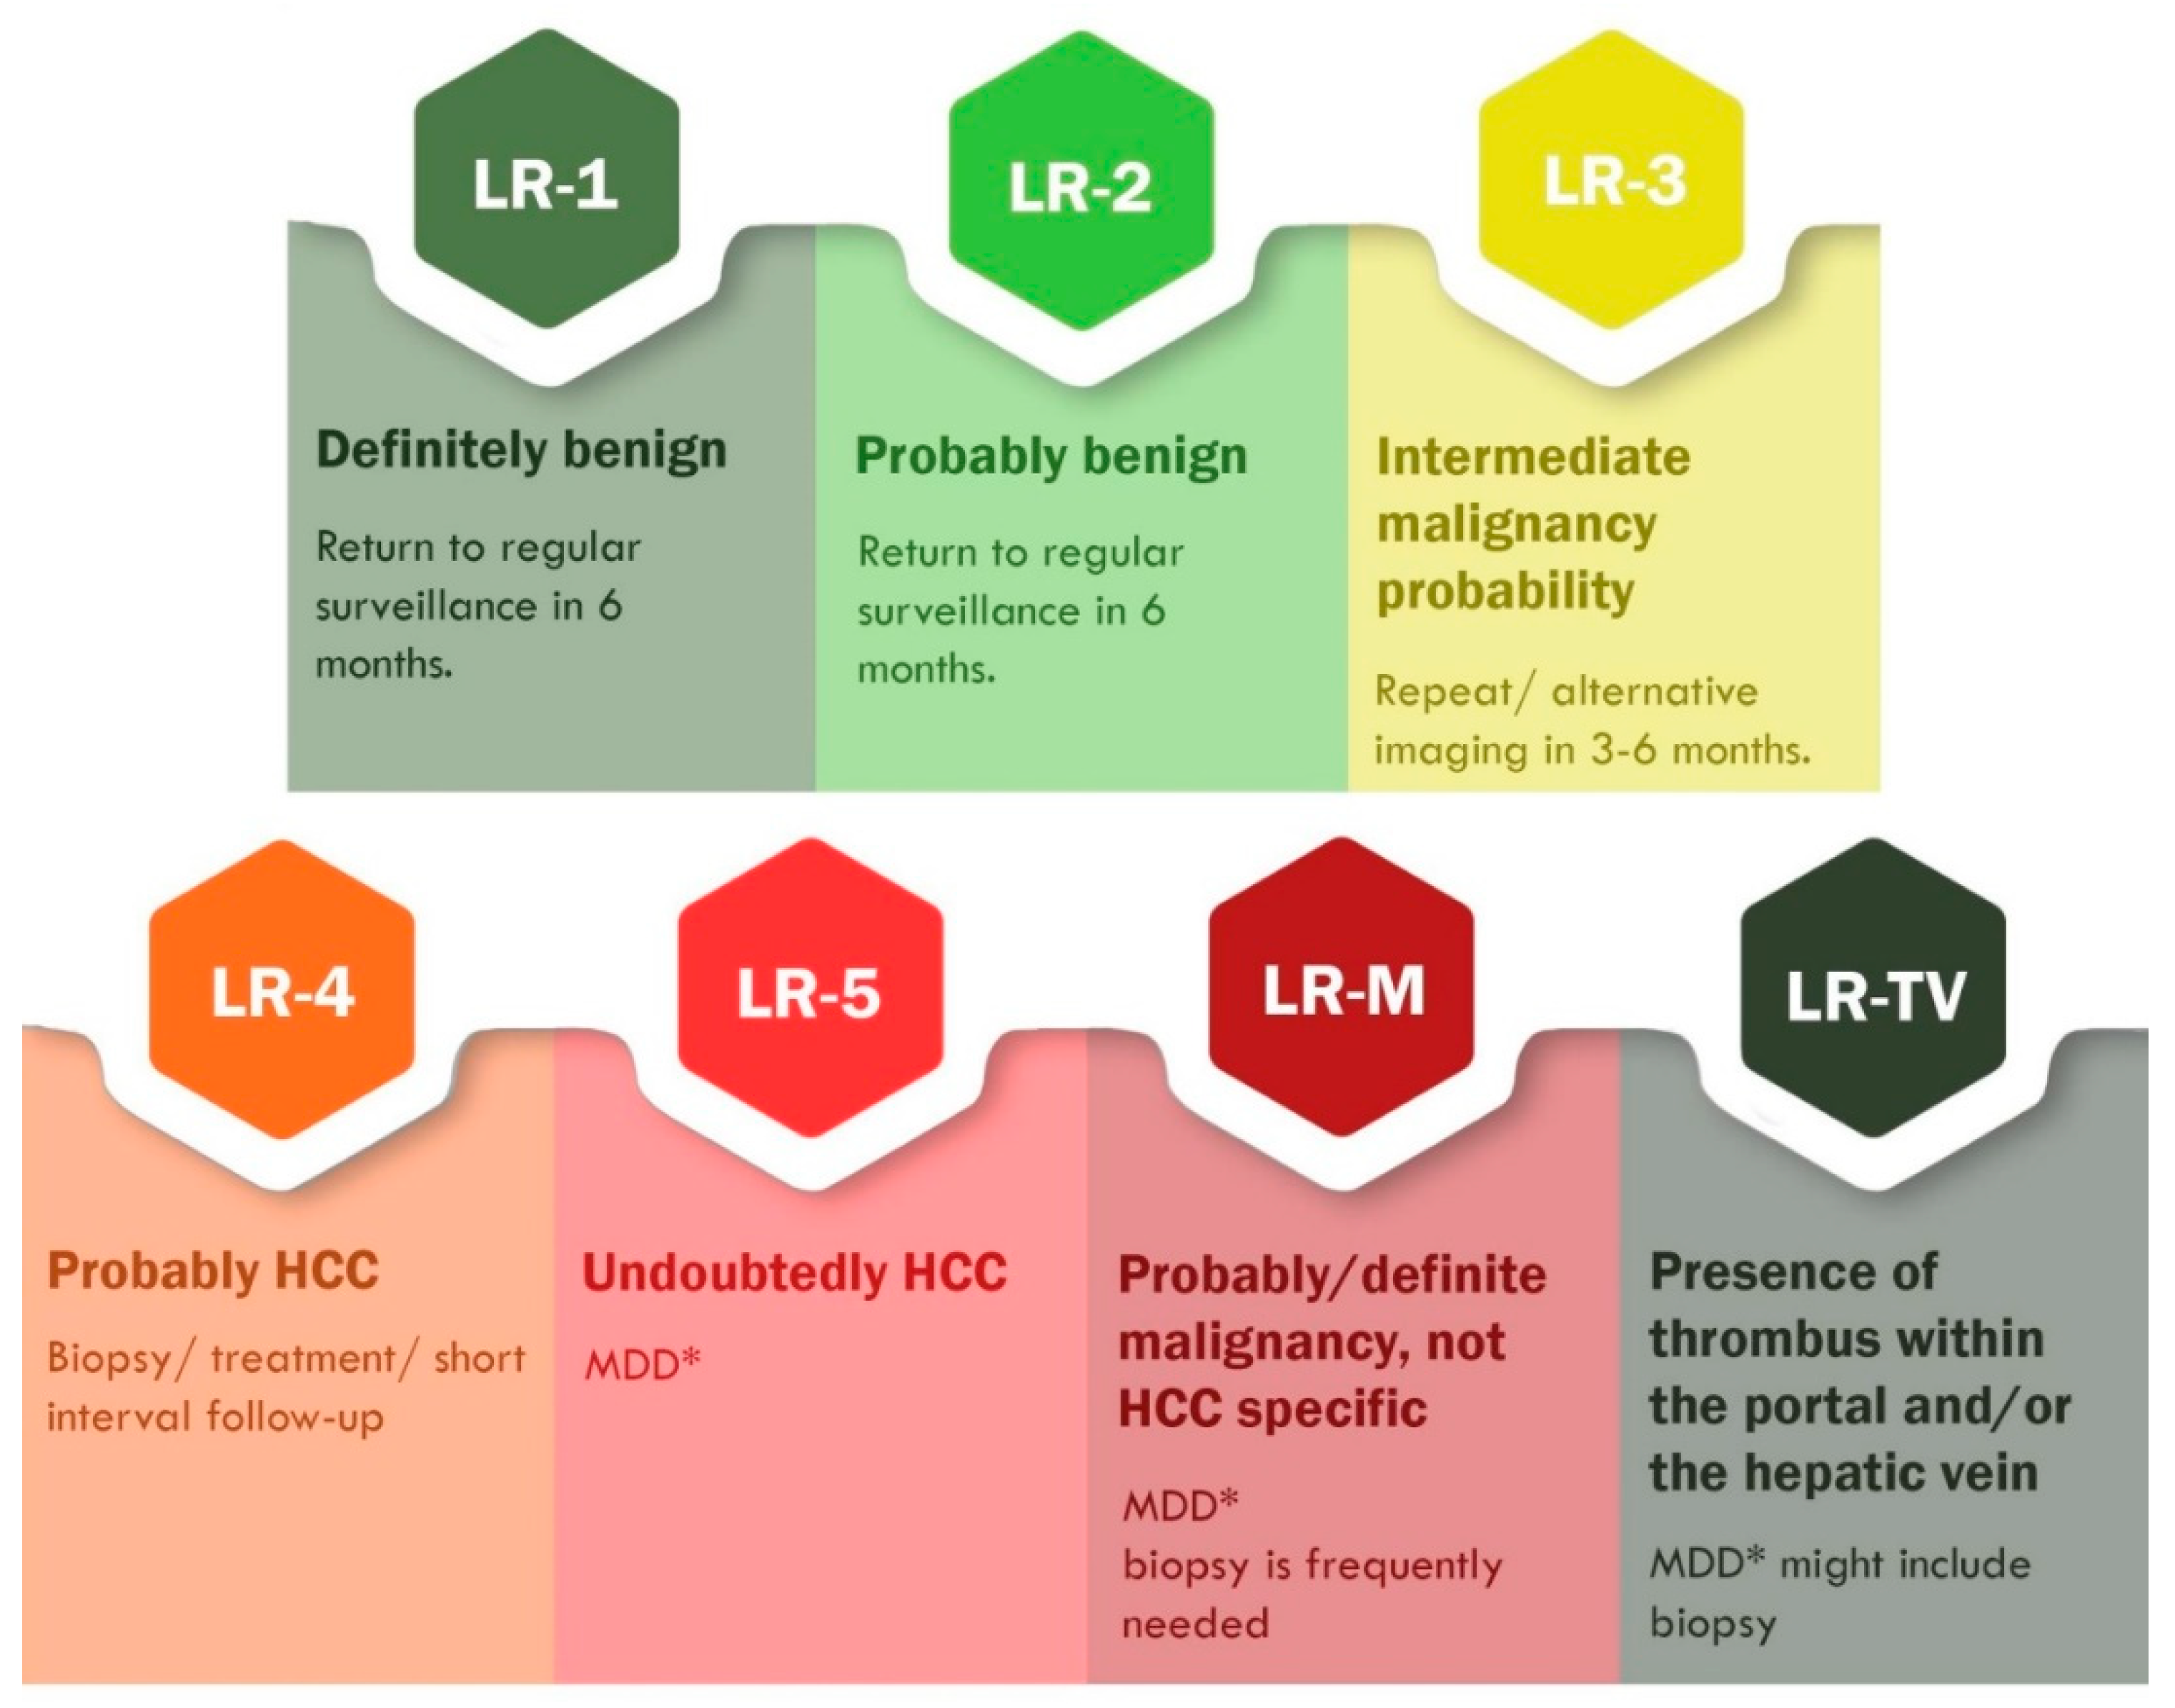
2.2. NAFLD-Related HCC: Could Conventional and Doppler US Differentiate between Focal Liver Lesions (FLLs)?
3. Contrast-Enhanced Ultrasonography (CEUS): An Add-on to the Diagnostic Power of Ultrasonography in NAFLD-Related HCC
3.1. General and Technical Considerations
Indications, Advantages and Limitations of CEUS Compared to Conventional US
3.2. Assessment of Fatty Liver Progression Using CEUS
3.3. The Evaluation of FLLs, Including HCC, in NAFLD Patients Using CEUS
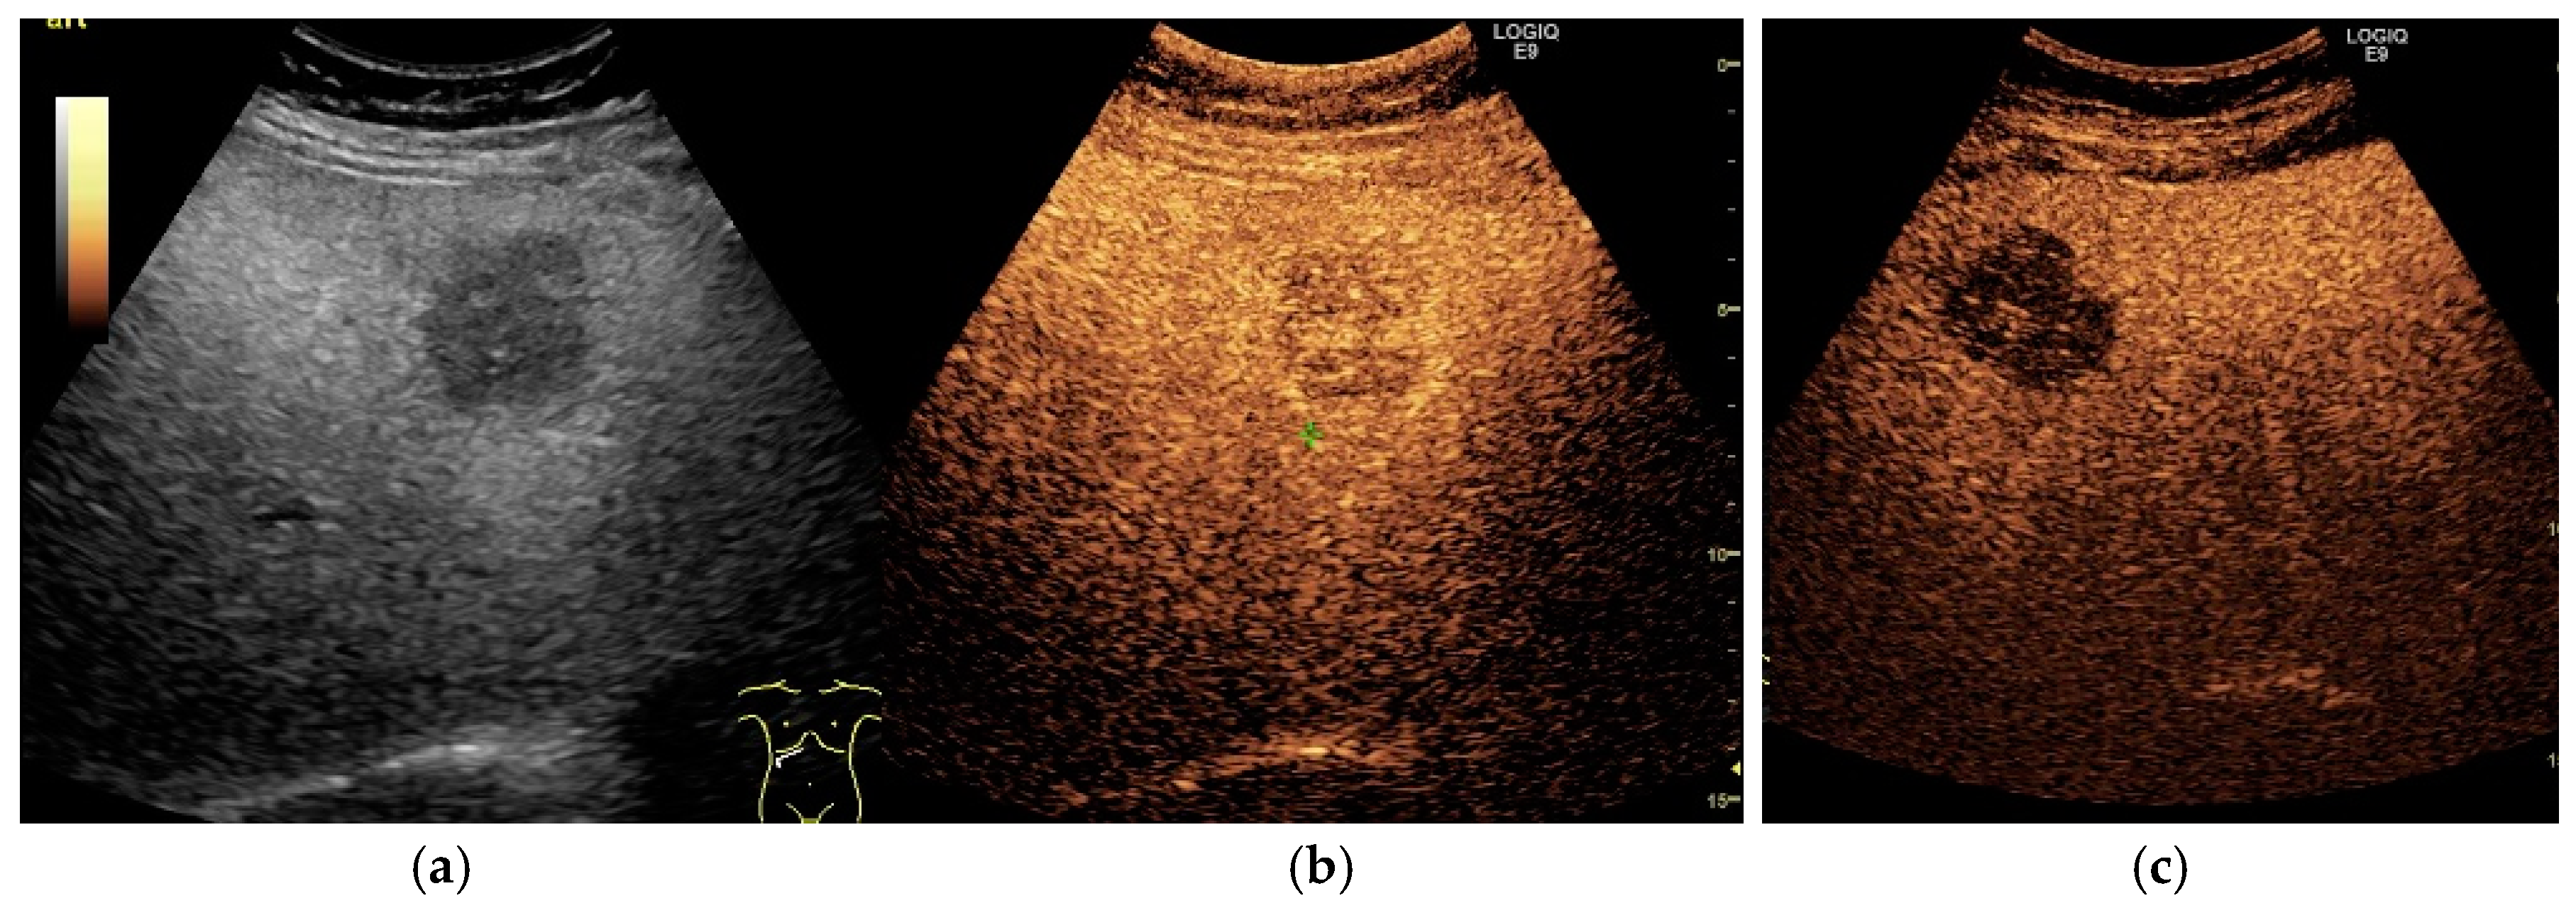
3.3.1. Diagnostic Features of Hepatocellular Carcinoma on CEUS
3.3.2. HCC Particularities in NAFLD Patients
3.3.3. Sonazoid-Enhanced US—A Breakthrough in the CEUS Practice
4. Artificial Intelligence in the Ultrasonographic Evaluation of NAFLD and NAFLD-Related HCC: A Potential Pillar
4.1. The Applications of AI in the Ultrasonographic Evaluation of NAFLD
4.2. The Applications of AI in the Ultrasonographic Evaluation of NAFLD-Related HCC
4.3. Advantages and Pitfalls of Future AI-Based Solutions
5. Concluding Remarks
Author Contributions
Funding
Acknowledgments
Conflicts of Interest
References
- Estes, C.; Razavi, H.; Loomba, R.; Younossi, Z.; Sanyal, A.J. Modeling the epidemic of nonalcoholic fatty liver disease demonstrates an exponential increase in burden of disease. Hepatology 2018, 67, 123–133. [Google Scholar] [CrossRef]
- Younossi, Z.M. Non-alcoholic fatty liver disease—A global public health perspective. J. Hepatol. 2019, 70, 531–544. [Google Scholar] [CrossRef] [PubMed] [Green Version]
- Singh, S.; Muir, A.J.; Dieterich, D.T.; Falck-Ytter, Y.T. American Gastroenterological Association Institute Technical Review on the Role of Elastography in Chronic Liver Diseases. Gastroenterology 2017, 152, 1544–1577. [Google Scholar] [CrossRef] [PubMed] [Green Version]
- Maher, J.J.; Schattenberg, J.M. Nonalcoholic Fatty Liver Disease in 2020. Gastroenterology 2020, 158, 1849–1850. [Google Scholar] [CrossRef] [PubMed]
- Papatheodoridi, M.; Cholongitas, E. Diagnosis of Non-alcoholic Fatty Liver Disease (NAFLD): Current Concepts. Curr. Pharm. Des. 2018, 24, 4574–4586. [Google Scholar] [CrossRef] [PubMed]
- Leoni, S.; Tovoli, F.; Napoli, L.; Serio, I.; Ferri, S.; Bolondi, L. Current guidelines for the management of non-alcoholic fatty liver disease: A systematic review with comparative analysis. World J. Gastroenterol. 2018, 24, 3361–3373. [Google Scholar] [CrossRef]
- Maurice, J.; Manousou, P. Non-alcoholic fatty liver disease. Clin. Med. 2018, 18, 245–250. [Google Scholar] [CrossRef]
- Chalasani, N.; Younossi, Z.; Lavine, J.E.; Charlton, M.; Cusi, K.; Rinella, M.; Harrison, S.A.; Brunt, E.M.; Sanyal, A.J. The diagnosis and management of nonalcoholic fatty liver disease: Practice guidance from the American Association for the Study of Liver Diseases. Hepatology 2018, 67, 328–357. [Google Scholar] [CrossRef]
- Younossi, Z.M.; Koenig, A.B.; Abdelatif, D.; Fazel, Y.; Henry, L.; Wymer, M. Global epidemiology of nonalcoholic fatty liver disease-Meta-analytic assessment of prevalence, incidence, and outcomes. Hepatology 2016, 64, 73–84. [Google Scholar] [CrossRef] [Green Version]
- Caines, A.; Selim, R.; Salgia, R. The Changing Global Epidemiology of Hepatocellular Carcinoma. Clin. Liv. Dis. 2020, 24, 535–547. [Google Scholar] [CrossRef]
- Mittal, S.; El-Serag, H.B.; Sada, Y.H.; Kanwal, F.; Duan, Z.; Temple, S.; May, S.B.; Kramer, J.R.; Richardson, P.A.; Davila, J.A. Hepatocellular Carcinoma in the Absence of Cirrhosis in United States Veterans is Associated with Nonalcoholic Fatty Liver Disease. Clin. Gastroenterol. Hepatol. 2016, 14, 124–131.e1. [Google Scholar] [CrossRef] [PubMed] [Green Version]
- Golabi, P.; Rhea, L.; Henry, L.; Younossi, Z.M. Hepatocellular carcinoma and non-alcoholic fatty liver disease. Hepatol. Int. 2019, 13, 688–694. [Google Scholar] [CrossRef]
- Koeckerling, D.; Tomlinson, J.W.; Cobbold, J.F. Fighting liver fat. Endocr. Connect. 2020, 9, R173–R186. [Google Scholar] [CrossRef]
- Lupsor-Platon, M.; Serban, T.; Silion, A.I.; Tirpe, A.; Florea, M. Hepatocellular Carcinoma and Non-Alcoholic Fatty Liver Disease: A Step Forward for Better Evaluation Using Ultrasound Elastography. Cancers 2020, 12, 2778. [Google Scholar] [CrossRef] [PubMed]
- Pocha, C.; Dieperink, E.; McMaken, K.A.; Knott, A.; Thuras, P.; Ho, S.B. Surveillance for hepatocellular cancer with ultrasonography vs. computed tomography—A randomised study. Aliment. Pharmacol. Ther. 2013, 38, 303–312. [Google Scholar] [CrossRef]
- Singal, A.; Volk, M.L.; Waljee, A.; Salgia, R.; Higgins, P.; Rogers, M.A.; Marrero, J.A. Meta-analysis: Surveillance with ultrasound for early-stage hepatocellular carcinoma in patients with cirrhosis. Aliment. Pharmacol. Ther. 2009, 30, 37–47. [Google Scholar] [CrossRef]
- Samoylova, M.L.; Mehta, N.; Roberts, J.P.; Yao, F.Y. Predictors of Ultrasound Failure to Detect Hepatocellular Carcinoma. Liver Transpl. 2018, 24, 1171–1177. [Google Scholar] [CrossRef] [Green Version]
- Llovet, J.M.; Zucman-Rossi, J.; Pikarsky, E.; Sangro, B.; Schwartz, M.; Sherman, M.; Gores, G. Hepatocellular carcinoma. Nat. Rev. Dis. Primers. 2016, 2, 16018. [Google Scholar] [CrossRef]
- Marrero, J.A.; Kulik, L.M.; Sirlin, C.B.; Zhu, A.X.; Finn, R.S.; Abecassis, M.M.; Roberts, L.R.; Heimbach, J.K. Diagnosis, Staging, and Management of Hepatocellular Carcinoma: 2018 Practice Guidance by the American Association for the Study of Liver Diseases. Hepatology 2018, 68, 723–750. [Google Scholar] [CrossRef] [PubMed] [Green Version]
- Zhang, Y.N.; Fowler, K.J.; Hamilton, G.; Cui, J.Y.; Sy, E.Z.; Balanay, M.; Hooker, J.C.; Szeverenyi, N.; Sirlin, C.B. Liver fat imaging-a clinical overview of ultrasound, CT, and MR imaging. Br. J. Radiol. 2018, 91, 20170959. [Google Scholar] [CrossRef] [PubMed] [Green Version]
- Jennison, E.; Patel, J.; Scorletti, E.; Byrne, C.D. Diagnosis and management of non-alcoholic fatty liver disease. Postgrad. Med. J. 2019, 95, 314–322. [Google Scholar] [CrossRef]
- Hernaez, R.; Lazo, M.; Bonekamp, S.; Kamel, I.; Brancati, F.L.; Guallar, E.; Clark, J.M. Diagnostic accuracy and reliability of ultrasonography for the detection of fatty liver: A meta-analysis. Hepatology 2011, 54, 1082–1090. [Google Scholar] [CrossRef] [Green Version]
- Gaiani, S.; Avogaro, A.; Bombonato, G.C.; Bolognesi, M.; Amor, F.; Vigili de Kreutzenberg, S.; Guarneri, G.; Sacerdoti, D. Nonalcoholic fatty liver disease (NAFLD) in nonobese patients with diabetes: Prevalence and relationships with hemodynamic alterations detected with Doppler sonography. J. Ultrasound. 2009, 12, 1–5. [Google Scholar] [CrossRef] [Green Version]
- Castera, L.; Friedrich-Rust, M.; Loomba, R. Noninvasive Assessment of Liver Disease in Patients With Nonalcoholic Fatty Liver Disease. Gastroenterology 2019, 156, 1264–1281. [Google Scholar] [CrossRef] [Green Version]
- Abd El-Kader, S.M.; El-Den Ashmawy, E.M. Non-alcoholic fatty liver disease: The diagnosis and management. World J. Hepatol. 2015, 7, 846–858. [Google Scholar] [CrossRef] [PubMed]
- Lee, D.H. Imaging evaluation of non-alcoholic fatty liver disease: Focused on quantification. Clin. Mol. Hepatol. 2017, 23, 290–301. [Google Scholar] [CrossRef] [PubMed]
- Kim, S.H.; Lee, J.M.; Kim, J.H.; Kim, K.G.; Han, J.K.; Lee, K.H.; Park, S.H.; Yi, N.J.; Suh, K.S.; An, S.K.; et al. Appropriateness of a donor liver with respect to macrosteatosis: Application of artificial neural networks to US images--initial experience. Radiology 2005, 234, 793–803. [Google Scholar] [CrossRef]
- Wang, C.C.; Hsieh, T.C.; Tseng, T.C.; Wang, P.C.; Hsu, C.S.; Lin, H.H.; Wang, L.Y.; Kao, J.H. Factors affecting the diagnostic accuracy of ultrasonography in assessing the severity of hepatic steatosis. J. Formos. Med. Assoc. 2014, 113, 249–254. [Google Scholar] [CrossRef] [PubMed] [Green Version]
- Dasarathy, S.; Dasarathy, J.; Khiyami, A.; Joseph, R.; Lopez, R.; McCullough, A.J. Validity of real time ultrasound in the diagnosis of hepatic steatosis: A prospective study. J. Hepatol. 2009, 51, 1061–1067. [Google Scholar] [CrossRef]
- Lupsor-Platon, M.; Stefanescu, H.; Muresan, D.; Florea, M.; Szasz, M.E.; Maniu, A.; Badea, R. Noninvasive assessment of liver steatosis using ultrasound methods. Med. Ultrason. 2014, 16, 236–245. [Google Scholar] [CrossRef] [PubMed] [Green Version]
- Pirmoazen, A.M.; Khurana, A.; El Kaffas, A.; Kamaya, A. Quantitative ultrasound approaches for diagnosis and monitoring hepatic steatosis in nonalcoholic fatty liver disease. Theranostics 2020, 10, 4277–4289. [Google Scholar] [CrossRef] [PubMed]
- Xia, M.F.; Yan, H.M.; He, W.Y.; Li, X.M.; Li, C.L.; Yao, X.Z.; Li, R.K.; Zeng, M.S.; Gao, X. Standardized ultrasound hepatic/renal ratio and hepatic attenuation rate to quantify liver fat content: An improvement method. Obesity 2012, 20, 444–452. [Google Scholar] [CrossRef]
- Ballestri, S.; Nascimbeni, F.; Lugari, S.; Lonardo, A.; Francica, G. A critical appraisal of the use of ultrasound in hepatic steatosis. Expert Rev. Gastroenterol. Hepatol. 2019, 13, 667–681. [Google Scholar] [CrossRef] [PubMed]
- Kwon, H.J.; Kim, K.W.; Jung, J.H.; Choi, S.H.; Jeong, W.K.; Kim, B.; Song, G.W.; Lee, S.G. Noninvasive quantitative estimation of hepatic steatosis by ultrasound: A comparison of the hepato-renal index and ultrasound attenuation index. Med. Ultrason. 2016, 18, 431–437. [Google Scholar] [CrossRef] [PubMed] [Green Version]
- Karcaaltincaba, M.; Akhan, O. Imaging of hepatic steatosis and fatty sparing. Eur. J. Radiol. 2007, 61, 33–43. [Google Scholar] [CrossRef] [PubMed]
- Venkatesh, S.K.; Hennedige, T.; Johnson, G.B.; Hough, D.M.; Fletcher, J.G. Imaging patterns and focal lesions in fatty liver: A pictorial review. Abdom. Radiol. 2017, 42, 1374–1392. [Google Scholar] [CrossRef] [PubMed]
- Tobari, M.; Hashimoto, E.; Yatsuji, S.; Torii, N.; Shiratori, K. Imaging of nonalcoholic steatohepatitis: Advantages and pitfalls of ultrasonography and computed tomography. Intern. Med. 2009, 48, 739–746. [Google Scholar] [CrossRef] [PubMed] [Green Version]
- Bril, F.; Ortiz-Lopez, C.; Lomonaco, R.; Orsak, B.; Freckleton, M.; Chintapalli, K.; Hardies, J.; Lai, S.; Solano, F.; Tio, F.; et al. Clinical value of liver ultrasound for the diagnosis of nonalcoholic fatty liver disease in overweight and obese patients. Liver Int. 2015, 35, 2139–2146. [Google Scholar] [CrossRef]
- Charatcharoenwitthaya, P.; Lindor, K.D. Role of radiologic modalities in the management of non-alcoholic steatohepatitis. Clin. Liver Dis. 2007, 11, 37–54. [Google Scholar] [CrossRef]
- Saadeh, S.; Younossi, Z.M.; Remer, E.M.; Gramlich, T.; Ong, J.P.; Hurley, M.; Mullen, K.D.; Cooper, J.N.; Sheridan, M.J. The utility of radiological imaging in nonalcoholic fatty liver disease. Gastroenterology 2002, 123, 745–750. [Google Scholar] [CrossRef]
- Milic, S.; Lulic, D.; Stimac, D. Non-alcoholic fatty liver disease and obesity: Biochemical, metabolic and clinical presentations. World J. Gastroenterol. 2014, 20, 9330–9337. [Google Scholar] [CrossRef]
- de Moura Almeida, A.; Cotrim, H.P.; Barbosa, D.B.; de Athayde, L.G.; Santos, A.S.; Bitencourt, A.G.; de Freitas, L.A.; Rios, A.; Alves, E. Fatty liver disease in severe obese patients: Diagnostic value of abdominal ultrasound. World J. Gastroenterol. 2008, 14, 1415–1418. [Google Scholar] [CrossRef]
- European Association for the Study of the Liver. EASL Clinical Practice Guidelines: Management of hepatocellular carcinoma. J. Hepatol. 2018, 69, 182–236. [Google Scholar] [CrossRef] [Green Version]
- Choi, H.H.; Rodgers, S.K.; Fetzer, D.T.; Wasnik, A.P.; Millet, J.D.; Morgan, T.A.; Dawkins, A.; Gabriel, H.; Kamaya, A. Ultrasound Liver Imaging Reporting and Data System (US LI-RADS): An Overview with Technical and Practical Applications. Acad. Radiol. 2020. [Google Scholar] [CrossRef]
- Morgan, T.A.; Maturen, K.E.; Dahiya, N.; Sun, M.R.M.; Kamaya, A.; American College of Radiology Ultrasound Liver, I.; Reporting Data System Working, G. US LI-RADS: Ultrasound liver imaging reporting and data system for screening and surveillance of hepatocellular carcinoma. Abdom. Radiol. 2018, 43, 41–55. [Google Scholar] [CrossRef] [PubMed]
- Tchelepi, H.; Ralls, P.W.; Radin, R.; Grant, E. Sonography of diffuse liver disease. J. Ultrasound Med. 2002, 21, 1023–1032, quiz 1033–1024. [Google Scholar] [CrossRef] [PubMed]
- Minami, Y.; Kudo, M. Hepatic malignancies: Correlation between sonographic findings and pathological features. World J. Radiol. 2010, 2, 249–256. [Google Scholar] [CrossRef]
- Tchelepi, H.; Ralls, P.W. Ultrasound of focal liver masses. Ultrasound Q. 2004, 20, 155–169. [Google Scholar] [CrossRef]
- Harvey, C.J.; Albrecht, T. Ultrasound of focal liver lesions. Eur. Radiol. 2001, 11, 1578–1593. [Google Scholar] [CrossRef] [PubMed]
- Terminology and Diagnostic Criteria Committee, Japan Society of Ultrasonics in Medicine. Ultrasound diagnostic criteria for hepatic tumors. J. Med. Ultrason. 2014, 41, 113–123. [Google Scholar] [CrossRef]
- Tochio, H.; Kudo, M. Afferent and efferent vessels of premalignant and overt hepatocellular carcinoma: Observation by color Doppler imaging. Intervirology 2004, 47, 144–153. [Google Scholar] [CrossRef] [PubMed]
- Kudo, M.; Tochio, H.; Zhou, P. Differentiation of hepatic tumors by color Doppler imaging: Role of the maximum velocity and the pulsatility index of the intratumoral blood flow signal. Intervirology 2004, 47, 154–161. [Google Scholar] [CrossRef]
- Salvatore, V.; Bolondi, L. Clinical impact of ultrasound-related techniques on the diagnosis of focal liver lesions. Liver Cancer 2012, 1, 238–246. [Google Scholar] [CrossRef] [PubMed]
- Wu, S.; Tu, R.; Liu, G.; Huang, L.; Guan, Y.; Zheng, E. Focal fatty sparing usually does not arise in preexisting nonalcoholic diffuse homogeneous fatty liver. J. Ultrasound Med. 2014, 33, 1447–1452. [Google Scholar] [CrossRef] [PubMed]
- Lupsor, M.; Badea, R. Imaging diagnosis and quantification of hepatic steatosis: Is it an accepted alternative to needle biopsy? Rom. J. Gastroenterol. 2005, 14, 419–425. [Google Scholar]
- Tzartzeva, K.; Obi, J.; Rich, N.E.; Parikh, N.D.; Marrero, J.A.; Yopp, A.; Waljee, A.K.; Singal, A.G. Surveillance Imaging and Alpha Fetoprotein for Early Detection of Hepatocellular Carcinoma in Patients With Cirrhosis: A Meta-analysis. Gastroenterology 2018, 154, 1706–1718.e1. [Google Scholar] [CrossRef] [PubMed] [Green Version]
- Lencioni, R.; Della Pina, C.; Crocetti, L.; Bozzi, E.; Cioni, D. Clinical management of focal liver lesions: The key role of real-time contrast-enhanced US. Eur. Radiol. 2007, 17 (Suppl. 6), F73–F79. [Google Scholar] [CrossRef]
- Claudon, M.; Dietrich, C.F.; Choi, B.I.; Cosgrove, D.O.; Kudo, M.; Nolsoe, C.P.; Piscaglia, F.; Wilson, S.R.; Barr, R.G.; Chammas, M.C.; et al. Guidelines and good clinical practice recommendations for Contrast Enhanced Ultrasound (CEUS) in the liver—Update 2012: A WFUMB-EFSUMB initiative in cooperation with representatives of AFSUMB, AIUM, ASUM, FLAUS and ICUS. Ultrasound Med. Biol. 2013, 39, 187–210. [Google Scholar] [CrossRef] [PubMed]
- Wilson, S.R.; Lyshchik, A.; Piscaglia, F.; Cosgrove, D.; Jang, H.J.; Sirlin, C.; Dietrich, C.F.; Kim, T.K.; Willmann, J.K.; Kono, Y. CEUS LI-RADS: Algorithm, implementation, and key differences from CT/MRI. Abdom. Radiol. 2018, 43, 127–142. [Google Scholar] [CrossRef]
- Dietrich, C.F.; Averkiou, M.; Nielsen, M.B.; Barr, R.G.; Burns, P.N.; Calliada, F.; Cantisani, V.; Choi, B.; Chammas, M.C.; Clevert, D.A.; et al. How to perform Contrast-Enhanced Ultrasound (CEUS). Ultrasound Int. Open 2018, 4, E2–E15. [Google Scholar] [CrossRef] [PubMed] [Green Version]
- Dietrich, C.F.; Nolsoe, C.P.; Barr, R.G.; Berzigotti, A.; Burns, P.N.; Cantisani, V.; Chammas, M.C.; Chaubal, N.; Choi, B.I.; Clevert, D.A.; et al. Guidelines and Good Clinical Practice Recommendations for Contrast Enhanced Ultrasound (CEUS) in the Liver—Update 2020—WFUMB in Cooperation with EFSUMB, AFSUMB, AIUM, and FLAUS. Ultraschall Med. 2020. [Google Scholar] [CrossRef]
- Cosgrove, D.; Harvey, C. Clinical uses of microbubbles in diagnosis and treatment. Med. Biol. Eng. Comput. 2009, 47, 813–826. [Google Scholar] [CrossRef] [PubMed]
- Kudo, M.; Ueshima, K.; Osaki, Y.; Hirooka, M.; Imai, Y.; Aso, K.; Numata, K.; Kitano, M.; Kumada, T.; Izumi, N.; et al. B-Mode Ultrasonography versus Contrast-Enhanced Ultrasonography for Surveillance of Hepatocellular Carcinoma: A Prospective Multicenter Randomized Controlled Trial. Liver Cancer 2019, 8, 271–280. [Google Scholar] [CrossRef]
- Ertle, J.; Dechene, A.; Sowa, J.P.; Penndorf, V.; Herzer, K.; Kaiser, G.; Schlaak, J.F.; Gerken, G.; Syn, W.K.; Canbay, A. Non-alcoholic fatty liver disease progresses to hepatocellular carcinoma in the absence of apparent cirrhosis. Int. J. Cancer 2011, 128, 2436–2443. [Google Scholar] [CrossRef]
- Carvalho, C.F.; Chammas, M.C.; Souza de Oliveira, C.P.; Cogliati, B.; Carrilho, F.J.; Cerri, G.G. Elastography and Contrast-enhanced Ultrasonography in the Early Detection of Hepatocellular Carcinoma in an Experimental Model of Nonalcoholic Steatohepatitis. J. Clin. Exp. Hepatol. 2013, 3, 96–101. [Google Scholar] [CrossRef] [PubMed] [Green Version]
- Vijayaraghavan, G.R.; David, S.; Bermudez-Allende, M.; Sarwat, H. Imaging-guided Parenchymal Liver Biopsy: How We Do It. J. Clin. Imaging Sci. 2011, 1, 30. [Google Scholar] [CrossRef]
- Tanaka, H. Current role of ultrasound in the diagnosis of hepatocellular carcinoma. J. Med. Ultrason. 2020, 47, 239–255. [Google Scholar] [CrossRef] [Green Version]
- Friedrich-Rust, M.; Klopffleisch, T.; Nierhoff, J.; Herrmann, E.; Vermehren, J.; Schneider, M.D.; Zeuzem, S.; Bojunga, J. Contrast-Enhanced Ultrasound for the differentiation of benign and malignant focal liver lesions: A meta-analysis. Liver Int. 2013, 33, 739–755. [Google Scholar] [CrossRef]
- Romanini, L.; Passamonti, M.; Aiani, L.; Cabassa, P.; Raieli, G.; Montermini, I.; Martegani, A.; Grazioli, L.; Calliada, F. Economic assessment of contrast-enhanced ultrasonography for evaluation of focal liver lesions: A multicentre Italian experience. Eur. Radiol. 2007, 17 (Suppl. 6), F99–F106. [Google Scholar] [CrossRef]
- Smajerova, M.; Petrasova, H.; Little, J.; Ovesna, P.; Andrasina, T.; Valek, V.; Nemcova, E.; Miklosova, B. Contrast-enhanced ultrasonography in the evaluation of incidental focal liver lesions: A cost-effectiveness analysis. World J. Gastroenterol. 2016, 22, 8605–8614. [Google Scholar] [CrossRef]
- Kim, T.H.; Yoon, J.H.; Lee, J.M. Emerging Role of Hepatobiliary Magnetic Resonance Contrast Media and Contrast-Enhanced Ultrasound for Noninvasive Diagnosis of Hepatocellular Carcinoma: Emphasis on Recent Updates in Major Guidelines. Korean J. Radiol. 2019, 20, 863–879. [Google Scholar] [CrossRef]
- Konno, K.; Ishida, H.; Sato, M.; Komatsuda, T.; Ishida, J.; Naganuma, H.; Hamashima, Y.; Watanabe, S. Liver tumors in fatty liver: Difficulty in ultrasonographic interpretation. Abdom. Imaging 2001, 26, 487–491. [Google Scholar] [CrossRef]
- Farrell, G.C.; Teoh, N.C.; McCuskey, R.S. Hepatic microcirculation in fatty liver disease. Anat. Rec. 2008, 291, 684–692. [Google Scholar] [CrossRef]
- Cocciolillo, S.; Parruti, G.; Marzio, L. CEUS and Fibroscan in non-alcoholic fatty liver disease and non-alcoholic steatohepatitis. World J. Hepatol. 2014, 6, 496–503. [Google Scholar] [CrossRef] [PubMed] [Green Version]
- Pandit, H.; Tinney, J.P.; Li, Y.; Cui, G.; Li, S.; Keller, B.B.; Martin, R.C.G., 2nd. Utilizing Contrast-Enhanced Ultrasound Imaging for Evaluating Fatty Liver Disease Progression in Pre-clinical Mouse Models. Ultrasound Med. Biol. 2019, 45, 549–557. [Google Scholar] [CrossRef]
- Tsujimoto, T.; Kawaratani, H.; Kitazawa, T.; Hirai, T.; Ohishi, H.; Kitade, M.; Yoshiji, H.; Uemura, M.; Fukui, H. Decreased phagocytic activity of Kupffer cells in a rat nonalcoholic steatohepatitis model. World J. Gastroenterol. 2008, 14, 6036–6043. [Google Scholar] [CrossRef]
- Blomley, M.J.; Lim, A.K.; Harvey, C.J.; Patel, N.; Eckersley, R.J.; Basilico, R.; Heckemann, R.; Urbank, A.; Cosgrove, D.O.; Taylor-Robinson, S.D. Liver microbubble transit time compared with histology and Child-Pugh score in diffuse liver disease: A cross sectional study. Gut 2003, 52, 1188–1193. [Google Scholar] [CrossRef] [PubMed] [Green Version]
- Nasr, P.; Hilliges, A.; Thorelius, L.; Kechagias, S.; Ekstedt, M. Contrast-enhanced ultrasonography could be a non-invasive method for differentiating none or mild from severe fibrosis in patients with biopsy proven non-alcoholic fatty liver disease. Scand. J. Gastroenterol. 2016, 51, 1126–1132. [Google Scholar] [CrossRef] [PubMed]
- Li, N.; Ding, H.; Fan, P.; Lin, X.; Xu, C.; Wang, W.; Xu, Z.; Wang, J. Intrahepatic transit time predicts liver fibrosis in patients with chronic hepatitis B: Quantitative assessment with contrast-enhanced ultrasonography. Ultrasound Med. Biol. 2010, 36, 1066–1075. [Google Scholar] [CrossRef] [PubMed]
- Lim, A.K.; Taylor-Robinson, S.D.; Patel, N.; Eckersley, R.J.; Goldin, R.D.; Hamilton, G.; Foster, G.R.; Thomas, H.C.; Cosgrove, D.O.; Blomley, M.J. Hepatic vein transit times using a microbubble agent can predict disease severity non-invasively in patients with hepatitis C. Gut 2005, 54, 128–133. [Google Scholar] [CrossRef] [PubMed] [Green Version]
- Topal, N.B.; Orcan, S.; Sigirli, D.; Orcan, G.; Eritmen, U. Effects of fat accumulation in the liver on hemodynamic variables assessed by Doppler ultrasonography. J. Clin. Ultrasound 2015, 43, 26–33. [Google Scholar] [CrossRef] [PubMed]
- Balasubramanian, P.; Boopathy, V.; Govindasamy, E.; Venkatesh, B.P. Assessment of Portal Venous and Hepatic Artery Haemodynamic Variation in Non-Alcoholic Fatty Liver Disease (NAFLD) Patients. J. Clin. Diagn. Res. 2016, 10, TC07–TC10. [Google Scholar] [CrossRef]
- Korean Liver Cancer Study Group; National Cancer Center, Korea. 2014 Korean Liver Cancer Study Group-National Cancer Center Korea practice guideline for the management of hepatocellular carcinoma. Korean J. Radiol. 2015, 16, 465–522. [Google Scholar] [CrossRef]
- Bruix, J.; Sherman, M.; Llovet, J.M.; Beaugrand, M.; Lencioni, R.; Burroughs, A.K.; Christensen, E.; Pagliaro, L.; Colombo, M.; Rodes, J.; et al. Clinical management of hepatocellular carcinoma. Conclusions of the Barcelona-2000 EASL conference. European Association for the Study of the Liver. J. Hepatol. 2001, 35, 421–430. [Google Scholar] [CrossRef]
- Seitz, K.; Strobel, D.; Bernatik, T.; Blank, W.; Friedrich-Rust, M.; Herbay, A.; Dietrich, C.F.; Strunk, H.; Kratzer, W.; Schuler, A. Contrast-Enhanced Ultrasound (CEUS) for the characterization of focal liver lesions—Prospective comparison in clinical practice: CEUS vs. CT (DEGUM multicenter trial). Parts of this manuscript were presented at the Ultrasound Dreilandertreffen 2008, Davos. Ultraschall Med. 2009, 30, 383–389. [Google Scholar] [CrossRef] [PubMed]
- Strobel, D.; Bernatik, T.; Blank, W.; Schuler, A.; Greis, C.; Dietrich, C.F.; Seitz, K. Diagnostic accuracy of CEUS in the differential diagnosis of small (</= 20 mm) and subcentimetric (</= 10 mm) focal liver lesions in comparison with histology. Results of the DEGUM multicenter trial. Ultraschall Med. 2011, 32, 593–597. [Google Scholar] [CrossRef]
- Strobel, D.; Seitz, K.; Blank, W.; Schuler, A.; Dietrich, C.; von Herbay, A.; Friedrich-Rust, M.; Kunze, G.; Becker, D.; Will, U.; et al. Contrast-enhanced ultrasound for the characterization of focal liver lesions--diagnostic accuracy in clinical practice (DEGUM multicenter trial). Ultraschall Med. 2008, 29, 499–505. [Google Scholar] [CrossRef]
- Sporea, I.; Badea, R.; Popescu, A.; Sparchez, Z.; Sirli, R.L.; Danila, M.; Sandulescu, L.; Bota, S.; Calescu, D.P.; Nedelcu, D.; et al. Contrast-enhanced ultrasound (CEUS) for the evaluation of focal liver lesions—A prospective multicenter study of its usefulness in clinical practice. Ultraschall Med. 2014, 35, 259–266. [Google Scholar] [CrossRef]
- Trillaud, H.; Bruel, J.M.; Valette, P.J.; Vilgrain, V.; Schmutz, G.; Oyen, R.; Jakubowski, W.; Danes, J.; Valek, V.; Greis, C. Characterization of focal liver lesions with SonoVue-enhanced sonography: International multicenter-study in comparison to CT and MRI. World J. Gastroenterol. 2009, 15, 3748–3756. [Google Scholar] [CrossRef] [PubMed]
- Jiang, H.Y.; Chen, J.; Xia, C.C.; Cao, L.K.; Duan, T.; Song, B. Noninvasive imaging of hepatocellular carcinoma: From diagnosis to prognosis. World J. Gastroenterol. 2018, 24, 2348–2362. [Google Scholar] [CrossRef] [PubMed]
- Tanaka, H.; Iijima, H.; Nouso, K.; Aoki, N.; Iwai, T.; Takashima, T.; Sakai, Y.; Aizawa, N.; Iwata, K.; Ikeda, N.; et al. Cost-effectiveness analysis on the surveillance for hepatocellular carcinoma in liver cirrhosis patients using contrast-enhanced ultrasonography. Hepatol. Res. 2012, 42, 376–384. [Google Scholar] [CrossRef] [PubMed]
- Auer, T.A.; Fischer, T.; Garcia, S.R.M.; Penzkofer, T.; Jung, E.M.; Hamm, B.; Lerchbaumer, M.H. Value of contrast-enhanced ultrasound (CEUS) in Focal Liver Lesions (FLL) with inconclusive findings on cross-sectional imaging. Clin. Hemorheol. Microcirc. 2020, 74, 327–339. [Google Scholar] [CrossRef]
- Sawatzki, M.; Meyenberger, C.; Brand, S.; Semela, D. Contrast-enhanced ultrasound (CEUS) has excellent diagnostic accuracy in differentiating focal liver lesions: Results from a Swiss tertiary gastroenterological centre. Swiss. Med. Wkly. 2019, 149, w20087. [Google Scholar] [CrossRef]
- Zhang, J.; Yu, Y.; Li, Y.; Wei, L. Diagnostic value of contrast-enhanced ultrasound in hepatocellular carcinoma: A meta-analysis with evidence from 1998 to 2016. Oncotarget 2017, 8, 75418–75426. [Google Scholar] [CrossRef] [Green Version]
- Yue, W.W.; Wang, S.; Xu, H.X.; Sun, L.P.; Guo, L.H.; Bo, X.W.; Li, X.L.; Zhao, C.K.; Wang, D.; Liu, B.J. Parametric imaging with contrast-enhanced ultrasound for differentiating hepatocellular carcinoma from metastatic liver cancer. Clin. Hemorheol. Microcirc. 2016, 64, 177–188. [Google Scholar] [CrossRef] [PubMed]
- Deng, H.; Shi, H.; Lei, J.; Hu, Y.; Li, G.; Wang, C. A meta-analysis of contrast-enhanced ultrasound for small hepatocellular carcinoma diagnosis. J. Cancer Res. Ther. 2016, 12, C274–C276. [Google Scholar] [CrossRef] [PubMed]
- Xie, L.; Guang, Y.; Ding, H.; Cai, A.; Huang, Y. Diagnostic value of contrast-enhanced ultrasound, computed tomography and magnetic resonance imaging for focal liver lesions: A meta-analysis. Ultrasound Med. Biol. 2011, 37, 854–861. [Google Scholar] [CrossRef] [PubMed]
- Yang, D.; Li, R.; Zhang, X.H.; Tang, C.L.; Ma, K.S.; Guo, D.Y.; Yan, X.C. Perfusion Characteristics of Hepatocellular Carcinoma at Contrast-enhanced Ultrasound: Influence of the Cellular differentiation, the Tumor Size and the Underlying Hepatic Condition. Sci. Rep. 2018, 8, 4713. [Google Scholar] [CrossRef] [Green Version]
- Iavarone, M.; Sangiovanni, A.; Forzenigo, L.V.; Massironi, S.; Fraquelli, M.; Aghemo, A.; Ronchi, G.; Biondetti, P.; Roncalli, M.; Colombo, M. Diagnosis of hepatocellular carcinoma in cirrhosis by dynamic contrast imaging: The importance of tumor cell differentiation. Hepatology 2010, 52, 1723–1730. [Google Scholar] [CrossRef] [Green Version]
- Boozari, B.; Soudah, B.; Rifai, K.; Schneidewind, S.; Vogel, A.; Hecker, H.; Hahn, A.; Schlue, J.; Dietrich, C.F.; Bahr, M.J.; et al. Grading of hypervascular hepatocellular carcinoma using late phase of contrast enhanced sonography—A prospective study. Dig. Liver Dis. 2011, 43, 484–490. [Google Scholar] [CrossRef]
- Nicolau, C.; Catala, V.; Vilana, R.; Gilabert, R.; Bianchi, L.; Sole, M.; Pages, M.; Bru, C. Evaluation of hepatocellular carcinoma using SonoVue, a second generation ultrasound contrast agent: Correlation with cellular differentiation. Eur. Radiol. 2004, 14, 1092–1099. [Google Scholar] [CrossRef]
- von Herbay, A.; Vogt, C.; Westendorff, J.; Haussinger, D.; Gregor, M. Correlation between SonoVue enhancement in CEUS, HCC differentiation and HCC diameter: Analysis of 130 patients with hepatocellular carcinoma (HCC). Ultraschall Med. 2009, 30, 544–550. [Google Scholar] [CrossRef] [PubMed]
- Matsui, O.; Kobayashi, S.; Sanada, J.; Kouda, W.; Ryu, Y.; Kozaka, K.; Kitao, A.; Nakamura, K.; Gabata, T. Hepatocelluar nodules in liver cirrhosis: Hemodynamic evaluation (angiography-assisted CT) with special reference to multi-step hepatocarcinogenesis. Abdom. Imaging 2011, 36, 264–272. [Google Scholar] [CrossRef] [PubMed] [Green Version]
- Jang, H.J.; Kim, T.K.; Burns, P.N.; Wilson, S.R. Enhancement patterns of hepatocellular carcinoma at contrast-enhanced US: Comparison with histologic differentiation. Radiology 2007, 244, 898–906. [Google Scholar] [CrossRef] [PubMed]
- Piscaglia, F.; Wilson, S.R.; Lyshchik, A.; Cosgrove, D.; Dietrich, C.F.; Jang, H.J.; Kim, T.K.; Salvatore, V.; Willmann, J.K.; Sirlin, C.B.; et al. American College of Radiology Contrast Enhanced Ultrasound Liver Imaging Reporting and Data System (CEUS LI-RADS) for the diagnosis of Hepatocellular Carcinoma: A pictorial essay. Ultraschall Med. 2017, 38, 320–324. [Google Scholar] [CrossRef] [Green Version]
- Kim, T.K.; Noh, S.Y.; Wilson, S.R.; Kono, Y.; Piscaglia, F.; Jang, H.J.; Lyshchik, A.; Dietrich, C.F.; Willmann, J.K.; Vezeridis, A.; et al. Contrast-enhanced ultrasound (CEUS) liver imaging reporting and data system (LI-RADS) 2017—A review of important differences compared to the CT/MRI system. Clin. Mol. Hepatol. 2017, 23, 280–289. [Google Scholar] [CrossRef] [Green Version]
- Lyshchik, A.; Kono, Y.; Dietrich, C.F.; Jang, H.J.; Kim, T.K.; Piscaglia, F.; Vezeridis, A.; Willmann, J.K.; Wilson, S.R. Contrast-enhanced ultrasound of the liver: Technical and lexicon recommendations from the ACR CEUS LI-RADS working group. Abdom. Radiol. 2018, 43, 861–879. [Google Scholar] [CrossRef]
- Ferraioli, G.; Meloni, M.F. Contrast-enhanced ultrasonography of the liver using SonoVue. Ultrasonography 2018, 37, 25–35. [Google Scholar] [CrossRef] [Green Version]
- Schellhaas, B.; Wildner, D.; Pfeifer, L.; Goertz, R.S.; Hagel, A.; Neurath, M.F.; Strobel, D. LI-RADS-CEUS—Proposal for a Contrast-Enhanced Ultrasound Algorithm for the Diagnosis of Hepatocellular Carcinoma in High-Risk Populations. Ultraschall Med. 2016, 37, 627–634. [Google Scholar] [CrossRef]
- Kono, Y.; Lyshchik, A.; Cosgrove, D.; Dietrich, C.F.; Jang, H.J.; Kim, T.K.; Piscaglia, F.; Willmann, J.K.; Wilson, S.R.; Santillan, C.; et al. Contrast Enhanced Ultrasound (CEUS) Liver Imaging Reporting and Data System (LI-RADS(R)): The official version by the American College of Radiology (ACR). Ultraschall Med. 2017, 38, 85–86. [Google Scholar] [CrossRef] [Green Version]
- Bartolotta, T.V.; Terranova, M.C.; Gagliardo, C.; Taibbi, A. CEUS LI-RADS: A pictorial review. Insights Imaging 2020, 11, 9. [Google Scholar] [CrossRef]
- Terzi, E.; Bonis, L.; Leoni, S.; Benevento, F.; Granito, A.; Tovoli, F.; Pini, P.; Bolondi, L.; Piscaglia, F. CEUS LI-RADS are effective in predicting the risk hepatocellular carcinoma of liver nodules. Dig. Liver Dis. 2017, 49, e22. [Google Scholar] [CrossRef]
- Harris, P.S.; Hansen, R.M.; Gray, M.E.; Massoud, O.I.; McGuire, B.M.; Shoreibah, M.G. Hepatocellular carcinoma surveillance: An evidence-based approach. World J. Gastroenterol. 2019, 25, 1550–1559. [Google Scholar] [CrossRef] [PubMed]
- Janica, J.; Ustymowicz, A.; Lukasiewicz, A.; Panasiuk, A.; Niemcunowicz-Janica, A.; Turecka-Kulesza, E.; Lebkowska, U. Comparison of contrast-enhanced ultrasonography with grey-scale ultrasonography and contrast-enhanced computed tomography in diagnosing focal fatty liver infiltrations and focal fatty sparing. Adv. Med. Sci. 2013, 58, 408–418. [Google Scholar] [CrossRef] [PubMed] [Green Version]
- Numata, K.; Morimoto, M.; Ogura, T.; Sugimori, K.; Takebayashi, S.; Okada, M.; Tanaka, K. Ablation therapy guided by contrast-enhanced sonography with Sonazoid for hepatocellular carcinoma lesions not detected by conventional sonography. J. Ultrasound Med. 2008, 27, 395–406. [Google Scholar] [CrossRef] [Green Version]
- Numata, K.; Luo, W.; Morimoto, M.; Kondo, M.; Kunishi, Y.; Sasaki, T.; Nozaki, A.; Tanaka, K. Contrast enhanced ultrasound of hepatocellular carcinoma. World J. Radiol. 2010, 2, 68–82. [Google Scholar] [CrossRef]
- Iurca, I.; Tirpe, A.; Zimta, A.A.; Moldovan, C.; Gulei, D.; Slaby, O.; Condorelli, G.; Berindan-Neagoe, I. Macrophages Interaction and MicroRNA Interplay in the Modulation of Cancer Development and Metastasis. Front. Immunol. 2020, 11, 870. [Google Scholar] [CrossRef]
- Arita, J.; Hasegawa, K.; Takahashi, M.; Hata, S.; Shindoh, J.; Sugawara, Y.; Kokudo, N. Correlation between contrast-enhanced intraoperative ultrasound using Sonazoid and histologic grade of resected hepatocellular carcinoma. AJR Am. J. Roentgenol. 2011, 196, 1314–1321. [Google Scholar] [CrossRef]
- Wu, M.; Li, L.; Wang, J.; Zhang, Y.; Guo, Q.; Li, X.; Zhang, X. Contrast-enhanced US for characterization of focal liver lesions: A comprehensive meta-analysis. Eur. Radiol. 2018, 28, 2077–2088. [Google Scholar] [CrossRef] [PubMed]
- Borges, V.F.; Diniz, A.L.; Cotrim, H.P.; Rocha, H.L.; Andrade, N.B. Sonographic hepatorenal ratio: A noninvasive method to diagnose nonalcoholic steatosis. J. Clin. Ultrasound 2013, 41, 18–25. [Google Scholar] [CrossRef]
- Webb, M.; Yeshua, H.; Zelber-Sagi, S.; Santo, E.; Brazowski, E.; Halpern, Z.; Oren, R. Diagnostic value of a computerized hepatorenal index for sonographic quantification of liver steatosis. AJR Am. J. Roentgenol. 2009, 192, 909–914. [Google Scholar] [CrossRef] [PubMed] [Green Version]
- Lupsor, M.; Badea, R.; Nedevschi, S.; Mitrea, D.; Florea, M. Ultrasonography Contribution to Hepatic Steatosis Quantification. Possibilities of Improving this Method through Computerized Analysis of Ultrasonic Image. In Proceedings of the 2006 IEEE International Conference on Automation, Quality and Testing, Robotics, Cluj-Napora, Romania, 25–28 May 2006; pp. 478–483. [Google Scholar]
- Wu, G.G.; Zhou, L.Q.; Xu, J.W.; Wang, J.Y.; Wei, Q.; Deng, Y.B.; Cui, X.W.; Dietrich, C.F. Artificial intelligence in breast ultrasound. World J. Radiol. 2019, 11, 19–26. [Google Scholar] [CrossRef]
- Litjens, G.; Kooi, T.; Bejnordi, B.E.; Setio, A.A.A.; Ciompi, F.; Ghafoorian, M.; van der Laak, J.; van Ginneken, B.; Sanchez, C.I. A survey on deep learning in medical image analysis. Med. Image Anal. 2017, 42, 60–88. [Google Scholar] [CrossRef] [Green Version]
- Muse, E.D.; Topol, E.J. Guiding ultrasound image capture with artificial intelligence. Lancet 2020, 396, 749. [Google Scholar] [CrossRef]
- Drukker, L.; Noble, J.A.; Papageorghiou, A.T. Introduction to artificial intelligence in ultrasound imaging in obstetrics and gynecology. Ultrasound Obstet. Gynecol 2020, 56, 498–505. [Google Scholar] [CrossRef] [PubMed]
- Lambin, P.; Rios-Velazquez, E.; Leijenaar, R.; Carvalho, S.; van Stiphout, R.G.; Granton, P.; Zegers, C.M.; Gillies, R.; Boellard, R.; Dekker, A.; et al. Radiomics: Extracting more information from medical images using advanced feature analysis. Eur. J. Cancer 2012, 48, 441–446. [Google Scholar] [CrossRef] [PubMed] [Green Version]
- Rizzo, S.; Botta, F.; Raimondi, S.; Origgi, D.; Fanciullo, C.; Morganti, A.G.; Bellomi, M. Radiomics: The facts and the challenges of image analysis. Eur. Radiol. Exp. 2018, 2, 36. [Google Scholar] [CrossRef]
- Theek, B.; Opacic, T.; Magnuska, Z.; Lammers, T.; Kiessling, F. Radiomic analysis of contrast-enhanced ultrasound data. Sci. Rep. 2018, 8, 11359. [Google Scholar] [CrossRef] [Green Version]
- Parekh, V.S.; Jacobs, M.A. Deep learning and radiomics in precision medicine. Expert. Rev. Precis. Med. Drug Dev. 2019, 4, 59–72. [Google Scholar] [CrossRef] [PubMed] [Green Version]
- Brattain, L.J.; Telfer, B.A.; Dhyani, M.; Grajo, J.R.; Samir, A.E. Machine learning for medical ultrasound: Status, methods, and future opportunities. Abdom Radiol. 2018, 43, 786–799. [Google Scholar] [CrossRef]
- Soffer, S.; Ben-Cohen, A.; Shimon, O.; Amitai, M.M.; Greenspan, H.; Klang, E. Convolutional Neural Networks for Radiologic Images: A Radiologist’s Guide. Radiology 2019, 290, 590–606. [Google Scholar] [CrossRef]
- Han, A.; Byra, M.; Heba, E.; Andre, M.P.; Erdman, J.W., Jr.; Loomba, R.; Sirlin, C.B.; O’Brien, W.D., Jr. Noninvasive Diagnosis of Nonalcoholic Fatty Liver Disease and Quantification of Liver Fat with Radiofrequency Ultrasound Data Using One-dimensional Convolutional Neural Networks. Radiology 2020, 295, 342–350. [Google Scholar] [CrossRef]
- Biswas, M.; Kuppili, V.; Edla, D.R.; Suri, H.S.; Saba, L.; Marinhoe, R.T.; Sanches, J.M.; Suri, J.S. Symtosis: A liver ultrasound tissue characterization and risk stratification in optimized deep learning paradigm. Comput. Methods Programs Biomed. 2018, 155, 165–177. [Google Scholar] [CrossRef]
- Byra, M.; Styczynski, G.; Szmigielski, C.; Kalinowski, P.; Michalowski, L.; Paluszkiewicz, R.; Ziarkiewicz-Wroblewska, B.; Zieniewicz, K.; Sobieraj, P.; Nowicki, A. Transfer learning with deep convolutional neural network for liver steatosis assessment in ultrasound images. Int. J. Comput. Assist. Radiol. Surg. 2018, 13, 1895–1903. [Google Scholar] [CrossRef] [Green Version]
- Cao, W.; An, X.; Cong, L.; Lyu, C.; Zhou, Q.; Guo, R. Application of Deep Learning in Quantitative Analysis of 2-Dimensional Ultrasound Imaging of Nonalcoholic Fatty Liver Disease. J. Ultrasound Med. 2020, 39, 51–59. [Google Scholar] [CrossRef] [PubMed]
- Bharti, P.; Mittal, D.; Ananthasivan, R. Preliminary Study of Chronic Liver Classification on Ultrasound Images Using an Ensemble Model. Ultrason. Imaging 2018, 40, 357–379. [Google Scholar] [CrossRef] [PubMed]
- Hassan, T.M.; Elmogy, M.; Sallam, E.-S. Diagnosis of Focal Liver Diseases Based on Deep Learning Technique for Ultrasound Images. Arab. J. Sci. Eng. 2017, 42, 3127–3140. [Google Scholar] [CrossRef]
- Sato, M.; Morimoto, K.; Kajihara, S.; Tateishi, R.; Shiina, S.; Koike, K.; Yatomi, Y. Machine-learning Approach for the Development of a Novel Predictive Model for the Diagnosis of Hepatocellular Carcinoma. Sci. Rep. 2019, 9, 7704. [Google Scholar] [CrossRef] [Green Version]
- Schmauch, B.; Herent, P.; Jehanno, P.; Dehaene, O.; Saillard, C.; Aube, C.; Luciani, A.; Lassau, N.; Jegou, S. Diagnosis of focal liver lesions from ultrasound using deep learning. Diagn. Interv. Imaging 2019, 100, 227–233. [Google Scholar] [CrossRef]
- Durot, I.; Akhbardeh, A.; Sagreiya, H.; Loening, A.M.; Rubin, D.L. A New Multimodel Machine Learning Framework to Improve Hepatic Fibrosis Grading Using Ultrasound Elastography Systems from Different Vendors. Ultrasound Med. Biol. 2020, 46, 26–33. [Google Scholar] [CrossRef] [Green Version]
- Bruno, M.A.; Walker, E.A.; Abujudeh, H.H. Understanding and Confronting Our Mistakes: The Epidemiology of Error in Radiology and Strategies for Error Reduction. Radiographics 2015, 35, 1668–1676. [Google Scholar] [CrossRef] [PubMed]
- Blumenthal-Barby, J.S.; Krieger, H. Cognitive biases and heuristics in medical decision making: A critical review using a systematic search strategy. Med. Decis. Mak. 2015, 35, 539–557. [Google Scholar] [CrossRef] [PubMed]


| Grade | Ultrasonographic Features |
|---|---|
| I: mild steatosis | Liver echogenicity slightly increased and normal visualization of portal vein wall and the diaphragmatic outline. |
| II: moderate steatosis | Liver echogenicity moderately increased with slightly impaired visualization of portal vein wall and diaphragmatic outline. |
| III: severe steatosis | Liver echogenicity markedly increased with poor or no visualization of portal vein wall, diaphragmatic outline, and posterior portion of the right hepatic lobe. |
| Conventional B-Mode and Doppler Ultrasound | Contrast Enhanced Ultrasound (CEUS) | |
|---|---|---|
| Indications | HCC surveillance for high risk patients [19,43] Guides biopsy or treatment [66] | Evaluates nodules ≥ 10 mm observed at US surveillance [59] Guides biopsy or treatment for observations that are undetectable or inconspicuous on US [59,61] Selects the most relevant lesion/lesion component for biopsy [59,61] Evaluates lesions with inconclusive histology [59] Better characterization of arterial phase enhancement in inconclusive CT/MRI [59] Differentiates between benign and malignant portal vein thrombosis [59,61] First line contrast imaging modality in patients with renal insufficiency [61] |
| Advantages | Broadly available [20] Free from ionizing radiation [21] Cost-effective Non-invasive Typical HCC features of Doppler findings are available [50] The wide variety of Doppler methods (color/spectral/power Doppler) for better assessment of FLLs [47,67] | UCAs are safe in adult and pediatric individuals [61] The possibility of re-administration of UCAs for better assessment of suspicious observations [61] Avoids unnecessary further imaging for benign lesions [59] Absence of ionizing radiation [68] Real-time and quantitative assessment [61] Cost-effective [69,70] Excludes pseudovascular lesions detected on CT or MRI such as arterioportal shunts [71] |
| Limitations | Low sensitivity in patients with morbid obesity [41] Steatosis leads to acoustic beam attenuation [36,72] Unable to differentiate between simple steatosis and progressive NASH [38,39] Unable to differentiate between steatosis and fibrosis [37] Inadequate to assess with certainty the degree of fatty infiltration [30] Focal fatty deposition or sparing areas can lead to confusion with other FLLs [35] Low sensitivity for early-stage HCC [56] Overlap of FLL appearance on the US image [57] | Unsuitable for HCC staging [60] Subdiaphragmatic or deep lesions are difficult to reach and characterize properly [59] Limited penetration in obese patients [59] Severe hepatic steatosis alters signal transmission through the parenchyma [59] |
| Technique | Features |
|---|---|
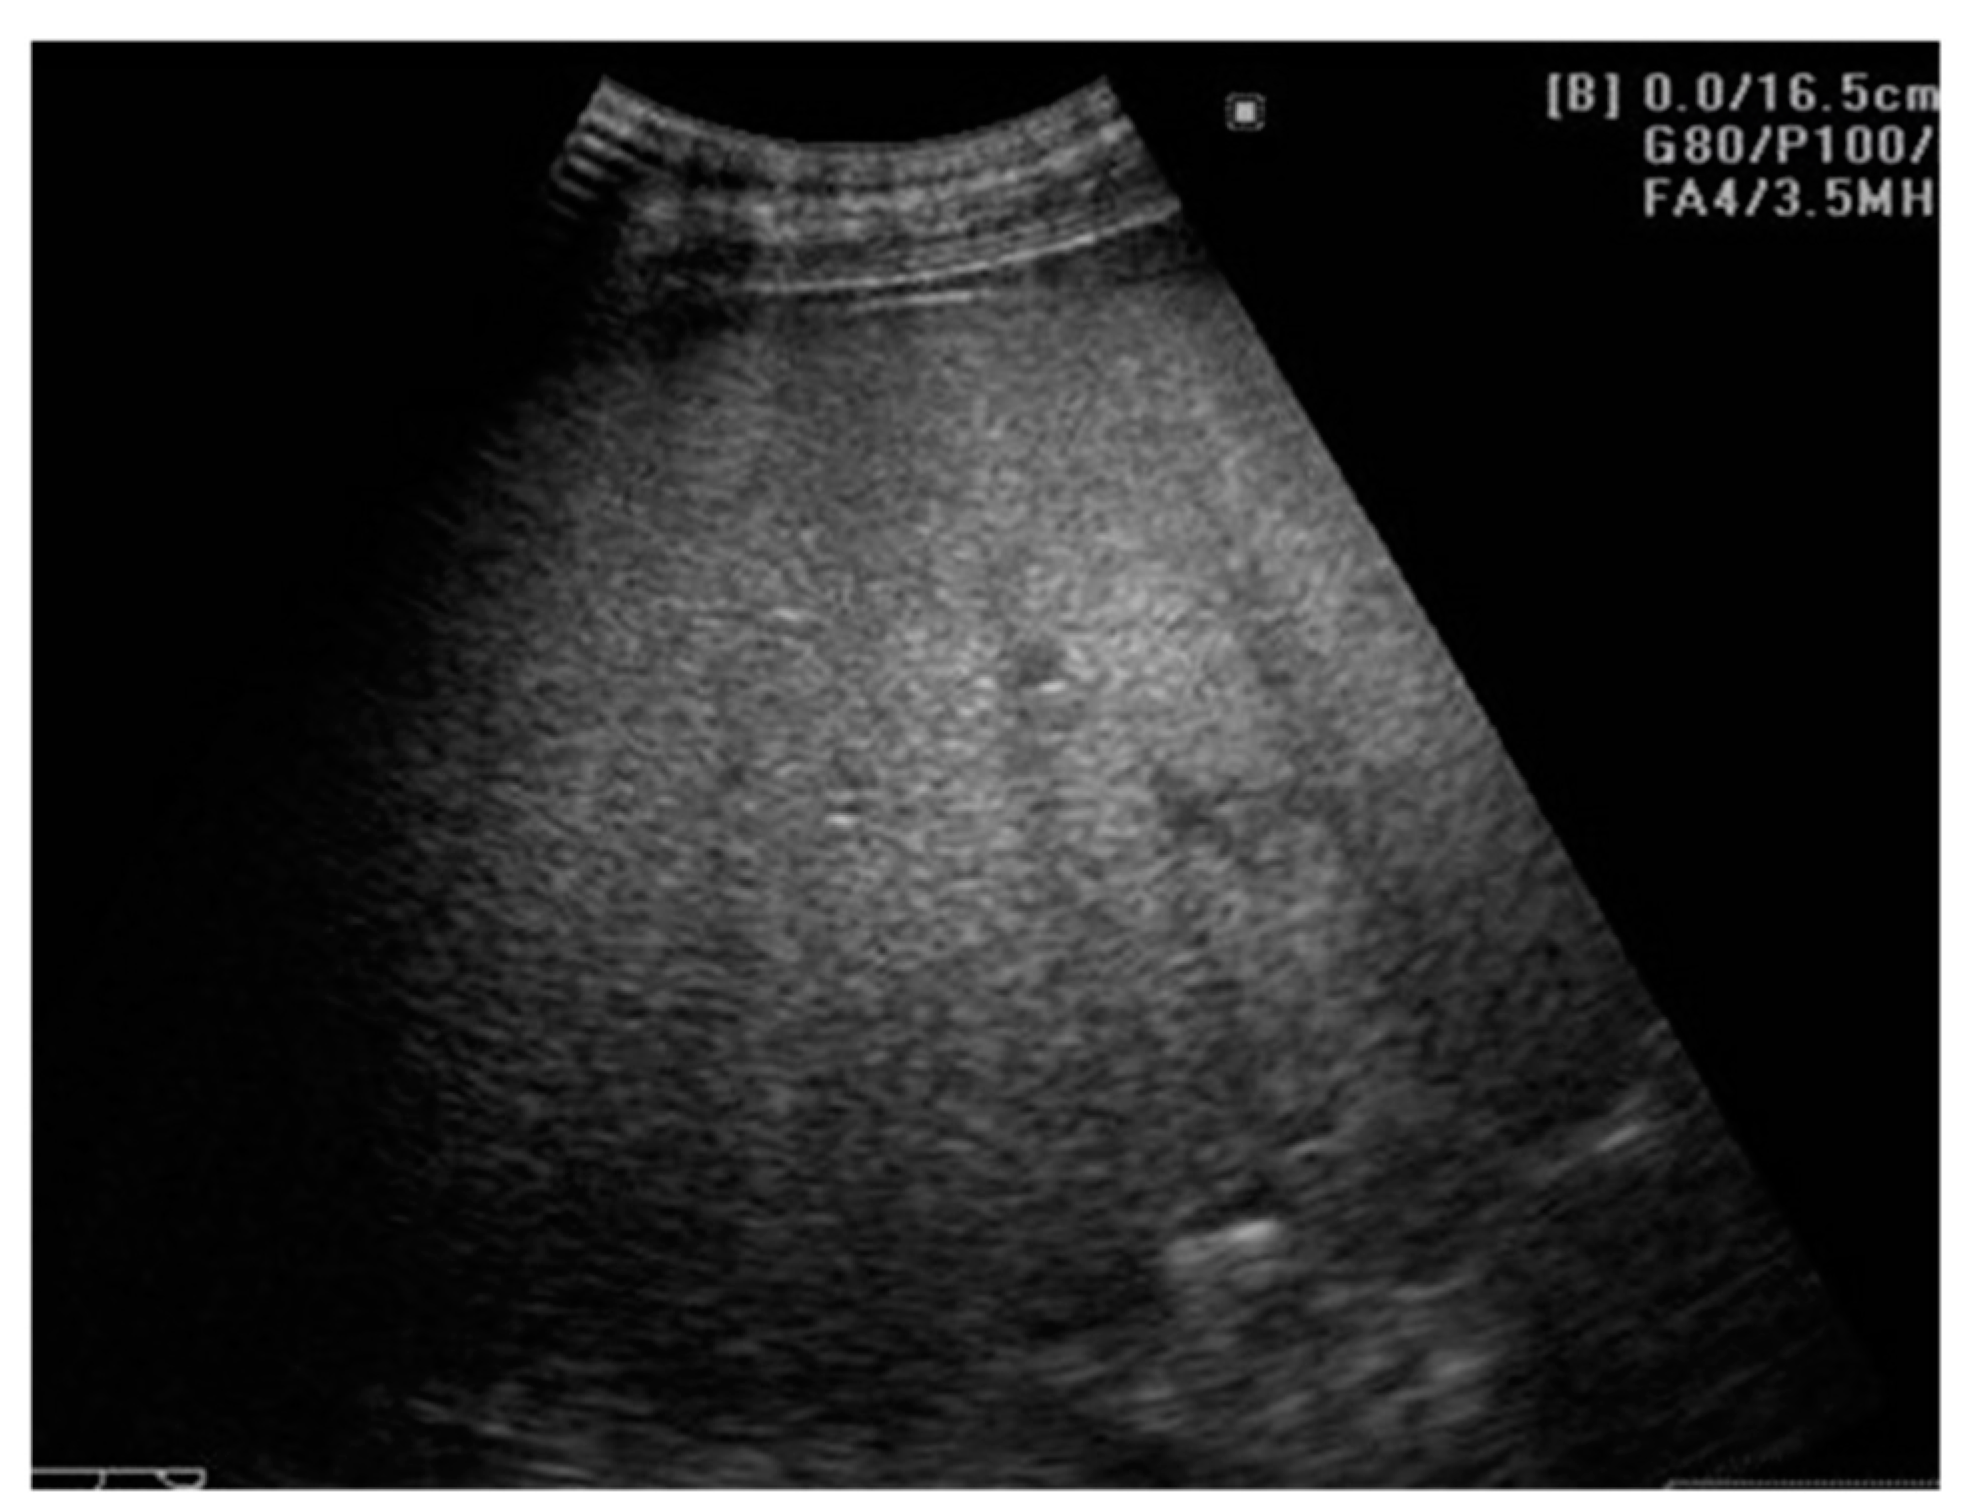
| B-mode US | Hepatomegaly Bright, hyperechoic liver compared to the right kidney Posterior beam attenuation Difficult visualization of echogenic structure, such as the portal vein wall, the gallbladder, the diaphragm etc. |
| Doppler US | Abnormal waveforms of the hepatic veins (normal triphasic pattern disappears) [81] Velocity of the portal flow (flow peak maximum velocity and mean flow velocity) and the portal vein pulsatility index (VPI) are significantly lower in patients with fatty liver when compared to the controls; it also corelates with the severity of the fatty liver [82] |
| US elastography | Fibrosis assessment by means of hepatic stiffness measurement Steatosis evaluation by the instrumentality of the Controlled Attenuation Parameter (CAP) [14] |
| CEUS | Earlier arrival time of contrast agents in hepatic veins using the hepatic vein transit time (HVTT) Reduced contrast effect in the Kupffer cell phase |
| Study | UCA Used | AUROC | Malignant Lesions | Benign Lesions | ||||||||
|---|---|---|---|---|---|---|---|---|---|---|---|---|
| HCC | Metastases | Hemangioma | FNH | Hepatocellular Adenoma | ||||||||
| Se (%) | Sp (%) | Se (%) | Sp (%) | Se (%) | Sp (%) | Se (%) | Sp (%) | Se (%) | Sp (%) | |||
| Auer et al. [92] | SonoVue | 0.951 | 100 | 100 | 90 | 100 | 99 | 100 | 100 | 100 | 66.6 | 100 |
| (n = 7) | (n = 31) | (n = 74) | (n = 19) | (n = 3) | ||||||||
| Sawatzki et al. [93] 1 | SonoVue | N/S | Se = 96–97.2 # | Sp = 84.2–90.6 # | ||||||||
| (n = 37) | (n = 75) | |||||||||||
| Zhang et al. [94] * | SonoVue Sonazoid Levovist | 0.94 | 85 | 91 | N/S | N/S | ||||||
| (N/S) | ||||||||||||
| Yue et al. [95] 2 | SonoVue | 0.70 | Se = 72; Sp = 84.6 | |||||||||
| (n = 30) | (n = 30) | |||||||||||
| Deng et al. [96] * | Sonazoid Levovist | 0.93 | 86 | 87 | N/S | |||||||
| (n = 30–104) | ||||||||||||
| Sporea et al. [88] | SonoVue | N/S | 81.2 | 94.2 | 93.1 | 94.1 | 90.2 | 97.6 | 94.7 | 98.4 | N/S | |
| (n = 209) | (n = 109) | (n = 102) | (n = 19) | (n = 7) | ||||||||
| Friedrich-Rust et al. [68] * | SonoVue Sonazoid Levovist | N/S | 88 | N/S | 91 | N/S | 86 | N/S | 88 | N/S | N/S | |
| (n = 2238) | (n = 1775) | (n = 1191) | (n = 602) | (n = 84) | ||||||||
| Xie et al. [97] * | SonoVue Levovist | 0.9555 | N/S | N/S | ||||||||
| Strobel et al. [86] | SonoVue | N/S | Se = 93.5 # | Sp = 66.7 # | ||||||||
| (n = 154) | (n = 87) | |||||||||||
| Seitz et al. [85] ** | SonoVue | N/S | 86.1 | 96.6 | 93.6 | 82.4 | 62.5 | 97.3 | 57.1 | 99.3 | N/S | |
| (n = 7/40 **) | (n = 7/56 **) | (n = 48/9 **) | (n = 31/14 **) | |||||||||
| Study | AI Technical Considerations | Accuracy of the AI Method |
|---|---|---|
| Bharti et al. [137] | Deep learning | Detection of
|
| Hassan et al. [138] | Deep learning | Detection of HCCs, liver cysts and hemangiomas
|
| Sato et al. [139] | Machine learning | Prediction of HCC (n = 539 patients with HCC, n = 1043 patients without HCC)
|
| Schmauch et al. [140] | Deep learning | Detection and characterization of FLL (benign vs. malignant) Training (n = 367 patients):
|
Publisher’s Note: MDPI stays neutral with regard to jurisdictional claims in published maps and institutional affiliations. |
© 2021 by the authors. Licensee MDPI, Basel, Switzerland. This article is an open access article distributed under the terms and conditions of the Creative Commons Attribution (CC BY) license (http://creativecommons.org/licenses/by/4.0/).
Share and Cite
Lupsor-Platon, M.; Serban, T.; Silion, A.I.; Tirpe, G.R.; Tirpe, A.; Florea, M. Performance of Ultrasound Techniques and the Potential of Artificial Intelligence in the Evaluation of Hepatocellular Carcinoma and Non-Alcoholic Fatty Liver Disease. Cancers 2021, 13, 790. https://0-doi-org.brum.beds.ac.uk/10.3390/cancers13040790
Lupsor-Platon M, Serban T, Silion AI, Tirpe GR, Tirpe A, Florea M. Performance of Ultrasound Techniques and the Potential of Artificial Intelligence in the Evaluation of Hepatocellular Carcinoma and Non-Alcoholic Fatty Liver Disease. Cancers. 2021; 13(4):790. https://0-doi-org.brum.beds.ac.uk/10.3390/cancers13040790
Chicago/Turabian StyleLupsor-Platon, Monica, Teodora Serban, Alexandra Iulia Silion, George Razvan Tirpe, Alexandru Tirpe, and Mira Florea. 2021. "Performance of Ultrasound Techniques and the Potential of Artificial Intelligence in the Evaluation of Hepatocellular Carcinoma and Non-Alcoholic Fatty Liver Disease" Cancers 13, no. 4: 790. https://0-doi-org.brum.beds.ac.uk/10.3390/cancers13040790