Article

NiO, Fe2O3, and MoO3 Supported over SiO2 Nanocatalysts for Asphaltene Adsorption and Catalytic Decomposition: Optimization through a Simplex–Centroid Mixture Design of Experiments

by
Daniela Arias-Madrid
1,
Oscar E. Medina
1,
Jaime Gallego
2,
Sócrates Acevedo
3,
Alexander A. Correa-Espinal
4,
Farid B. Cortés
1,* and
Camilo A. Franco
1,*
1
Grupo de Investigación en Fenómenos de Superficie—Michael Polanyi, Facultad de Minas, Universidad Nacional de Colombia, Sede Medellín, Medellín 050034, Colombia
2
Química de Recursos Energéticos y Medio Ambiente, Instituto de Química, Universidad de Antioquia UdeA, Calle 70 No. 52-21, Medellín 050010, Colombia
3
Facultad de Ciencias, Escuela de Química, Universidad Central de Venezuela, Caracas 1040, Venezuela
4
Departamento Ingeniería de la Organización, Facultad de Minas, Universidad Nacional de Colombia, Sede Medellín, Medellín 050034, Colombia
*
Authors to whom correspondence should be addressed.
Submission received: 20 April 2020 / Revised: 7 May 2020 / Accepted: 13 May 2020 / Published: 19 May 2020
(This article belongs to the Special Issue Fluid Catalytic Cracking)

Abstract

:
The main objective of this study was to evaluate the effect of functionalized silica nanoparticles with Fe2O3, NiO, and MoO3 metal oxides on the decomposition of asphaltenes, through an experimental simplex–centroid mixture design for surface area, asphaltene adsorption, and activation energy. The experimental nanoparticle surface area was measured by adsorption of N2. Adsorption isotherms, and the subsequent oxidation process of asphaltenes, were performed through batch adsorption experiments and thermogravimetric analysis, respectively. Among the monometallic systems, the presence of iron increased the affinity between the nanoparticle and the asphaltenes, and a higher metal oxide load increased the adsorptive capacity of the system. For the pairings evaluated, there was better synergy between iron and nickel, with the participation of the former being slightly superior. In the mixture design that included three transition elements, the participation of molybdenum was not significant, and the adsorption of asphaltenes was dominated by the active sites formed by the other two transition element oxides. The mixture design created to minimize the activation energy showed that the interaction of the three transition elements is important and can be evidenced in the interaction coefficients.

1. Introduction

The oil industry has a significant challenge in the extraction and production of heavy (HO) and extra heavy crude oil (EHO), due to the presence of heavy components [1]. Asphaltenes are the heaviest organic solids present in the HO microstructure, constituting peripheral aliphatic chains bonded to a polyaromatic core, with heteroatoms such as nitrogen, sulfur, and oxygen, and containing metals such as nickel, iron, and vanadium in the form of metal porphyrins [2,3], which form a chemical structure with island or archipelago architecture [4,5]. The different structures facilitate the nucleation and growth of asphaltenes, and the subsequent formation of colloidal nanoaggregates, increasing crude oil viscosity [5]. The presence of asphaltenes in crude oils causes many problems in transportation, production, and oil-recovery operations, increasing the economic costs and environmental impacts [3,6]. Therefore, reducing the asphaltene content helps to improve the quality of HO and EHO and contributes to environmental stewardship [7]. Nanotechnology has taken a significant role as an alternative for the management of asphaltenes and heavy crude oil recovery [8,9]. Nanoparticles can be used as adsorbents and catalysts in the process of removal and transformation of asphaltenes and oil recovery [10]. Their properties, including high surface-area-to-volume ratio [11], high-affinity adsorption [12,13], and exceptional catalytic activity [14,15], make nanoparticles excellent candidates for asphaltene adsorption/decomposition. Nanoparticles based on transition elements or functionalized with metal oxides have shown good affinity for the asphaltenes, improving their adsorption with regards to the adsorbed quantity and the adsorption energy [16,17]. In addition, it has been reported that supports functionalized with element oxides can improve the adsorption and catalytic capacity of the material [17]. In this regard, some authors have investigated the effect of metal oxides on surface support for the improvement of thermal-enhanced oil recovery processes (TEOR) [18,19,20,21,22]. For example, NiO nanoparticles decrease the oxidation temperature of n-C7 asphaltenes from 450 to 325 °C [23], but silica nanoparticles as support for low loadings of nickel oxides improve the catalytic efficiency, decomposing the asphaltenes at 300 °C [24]. Other studies have shown the presence of a high concentration of metal oxides (50 mg·L−1 to 30 g·L−1), such as those of iron adsorbed between 3.5 and 4.0 mg·m−2 asphaltenes, onto their surface [25,26]. In addition, impregnation of Fe2O3 on SiO2, kaolinite, and montmorillonite surfaces enhanced adsorption against unmodified sorbent bases [25,26]. Likewise, cobalt and molybdenum oxides on the surface of alumina adsorbed more porphyrins that individual constituents [27]. Other authors, including Kazemzadeh et al. [28], have evaluated the behavior of metal oxides such as SiO2, NiO, and Fe3O4 nanoparticles in asphaltene adsorption. They concluded that an increase in the n-heptane content of the solution containing nanoparticles led to an increase in adsorption [28].
Designs with one, two, and three transition elements can analyze the effect of each oxide on the structure of the support and appraise the behavior of the mixture oxides on the adsorbed amount with mixture analyses called simplex–centroid mixture design (SCMD). The SCMD has been used to study the relationship between the proportions of different variables and the responses. It allows for estimation of the interaction of each element in the mixture by providing a parameter that symbolizes this interaction, optimizing the component elements according to the targets [29]. The mixture design used involves the points located at the vertices and in the center, and each point is a combination of the proportion of the components included in the mixture. In the mixture design with four components, the center points are included in the spatial center of the polygon, in the form of a tetrahedron, and it fits a special cubic model with a relatively low number of experiments. The response variable of each mixture is determined by the proportion, not the amount of each component [30]. Different industries have used the SCMD for predicting the response variables for the components in the determination of the optimum mixture proportion of the carbon to nitrogen ratio (C/N ratio) in the decomposition of organic wastes, and in optimizing and developing ceramic adsorbent for arsenic removal from aqueous solution [29,31]. It has also been applied to the pharmaceutical and medical industry in the design of medicines and the study of acids [32,33]. In our previous studies, SCMD has been used to optimize the concentration of palladium and/or nickel oxide on the silica surface, to enhance the catalytic activity in the adsorption of Colombian asphaltenes. From that research, we concluded that the optimum proportion of nickel did not exceed 2% [24]. Moreover, the functionalization with metal oxides suggests that asphaltenes adsorption/decomposition is a selective process and depends on the metal used [34,35]. Recently, Medina et al. [14] employed the statistical design to improve the efficiency of gasification processes assisted by NiO-PdO/CeO2 nanoparticles, and it was found that, with a mass fraction of 0.89 and 1.1 of PdO and NiO, respectively, the asphaltene conversion was maximized at 100% in less than 80 min [14].
This study continues the investigation of supported transition element oxides (TEOs) and their effect on asphaltene adsorption and catalytic processes [24,36,37]. Silica nanoparticles were functionalized with iron, molybdenum, and nickel element oxides as mono-, bi-, and tri-elemental compounds, and we determined the effect of nanoparticle surface area, the amount of asphaltene adsorbed, and its subsequent oxidation in the presence of each nanoparticle. This work allows for optimization of the amount of each metal and support to obtain the maximum asphaltene adsorption and the lowest effective activation energy for its oxidation in bimetallic and trimetallic SCMD experiments.

2. Results and Discussion

2.1. Surface Characterization

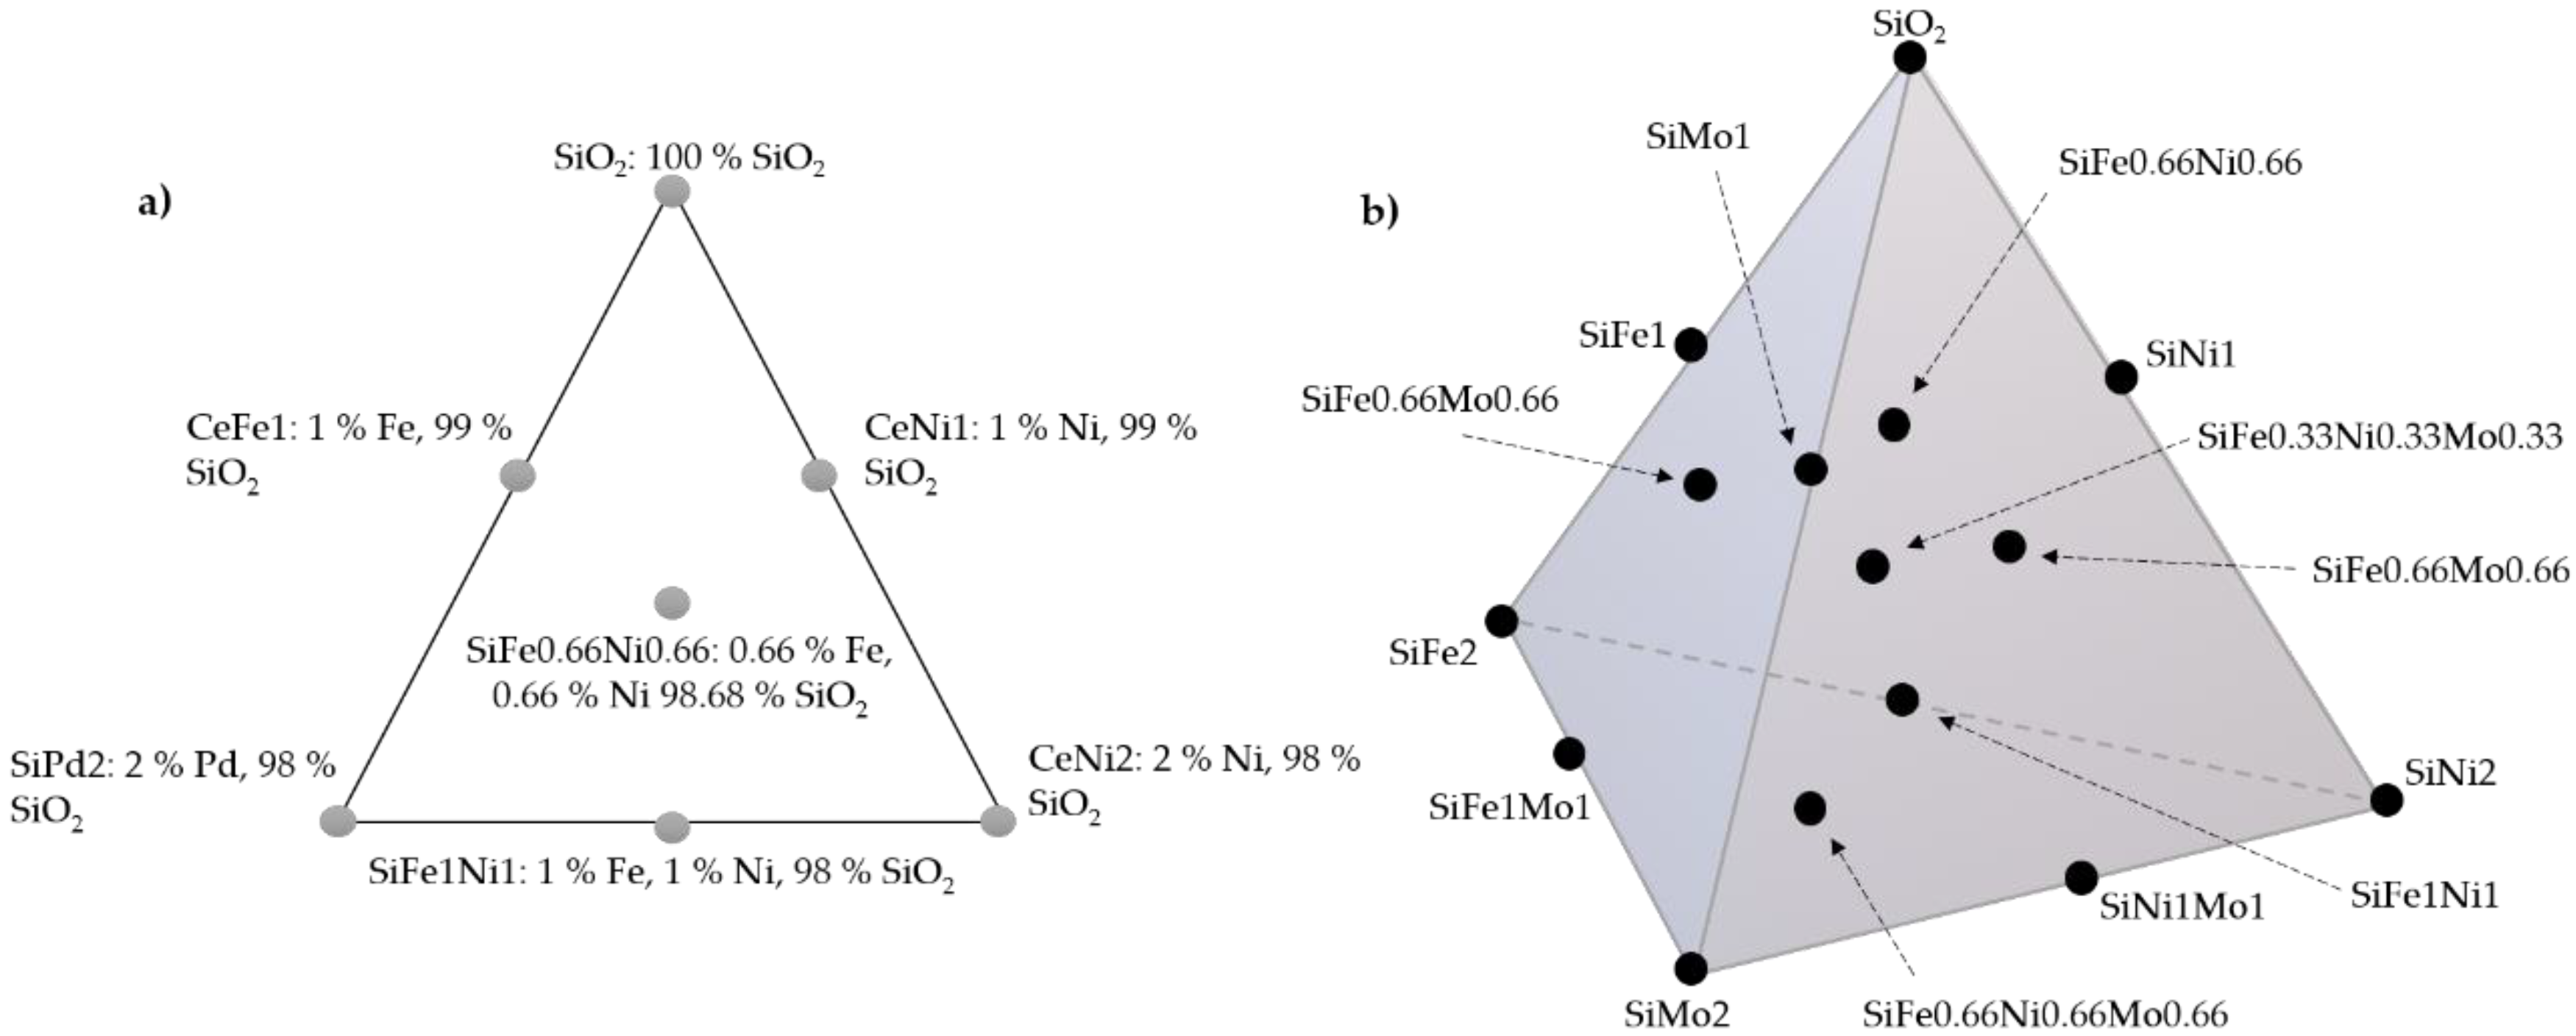
Figure 1 shows a typical scheme of the SCMD for the Si-Fe-Ni and Si-Fe-Ni-Mo systems. The Si-Ni-Mo and Si-Fe-Mo systems are in the same proportions as the presented design with two transition elements. The scheme of these designs is shown in Supplementary Figure S1.
The specific surface areas (SBET) for the as-prepared nanoparticles are presented in Table 1. Each type of nanoparticle exhibits a different chemical nature, depending on the dosage and kind of metal oxide impregnated. For the hybrid materials, when the content of nickel, iron, and molybdenum oxides increases, surface area decreases. As silica (S) is a microporous material, the deposition of the TEOs blocks the pore spaces, reducing its original surface area, while hygroscopic salt (SHS) materials preserve the fumed silica size (7 nm). These results are in agreement with those reported by Medina et al. [36], Alamolhoda et al. [38], and Cortés et al. [39].
Mixture designs for the tri- and bi-elemental series were developed by using the surface area values of the points shown in Table 1 to predict the surface area of any material composed of different TEO dosages on a silica support. Table 2 shows the parameters obtained for the Si-Fe-Ni design, with the surface area as the response variable. The nanoparticle composed of 0.5% by weight of each metal was used to validate the theoretical results. SiFe0.5Ni0.5 had an experimental value of 338.17 m2·g−1, while the SCMD value was 323.3 m2·g−1. This represents a 2.05% error when compared to the value of the experimental surface area. 
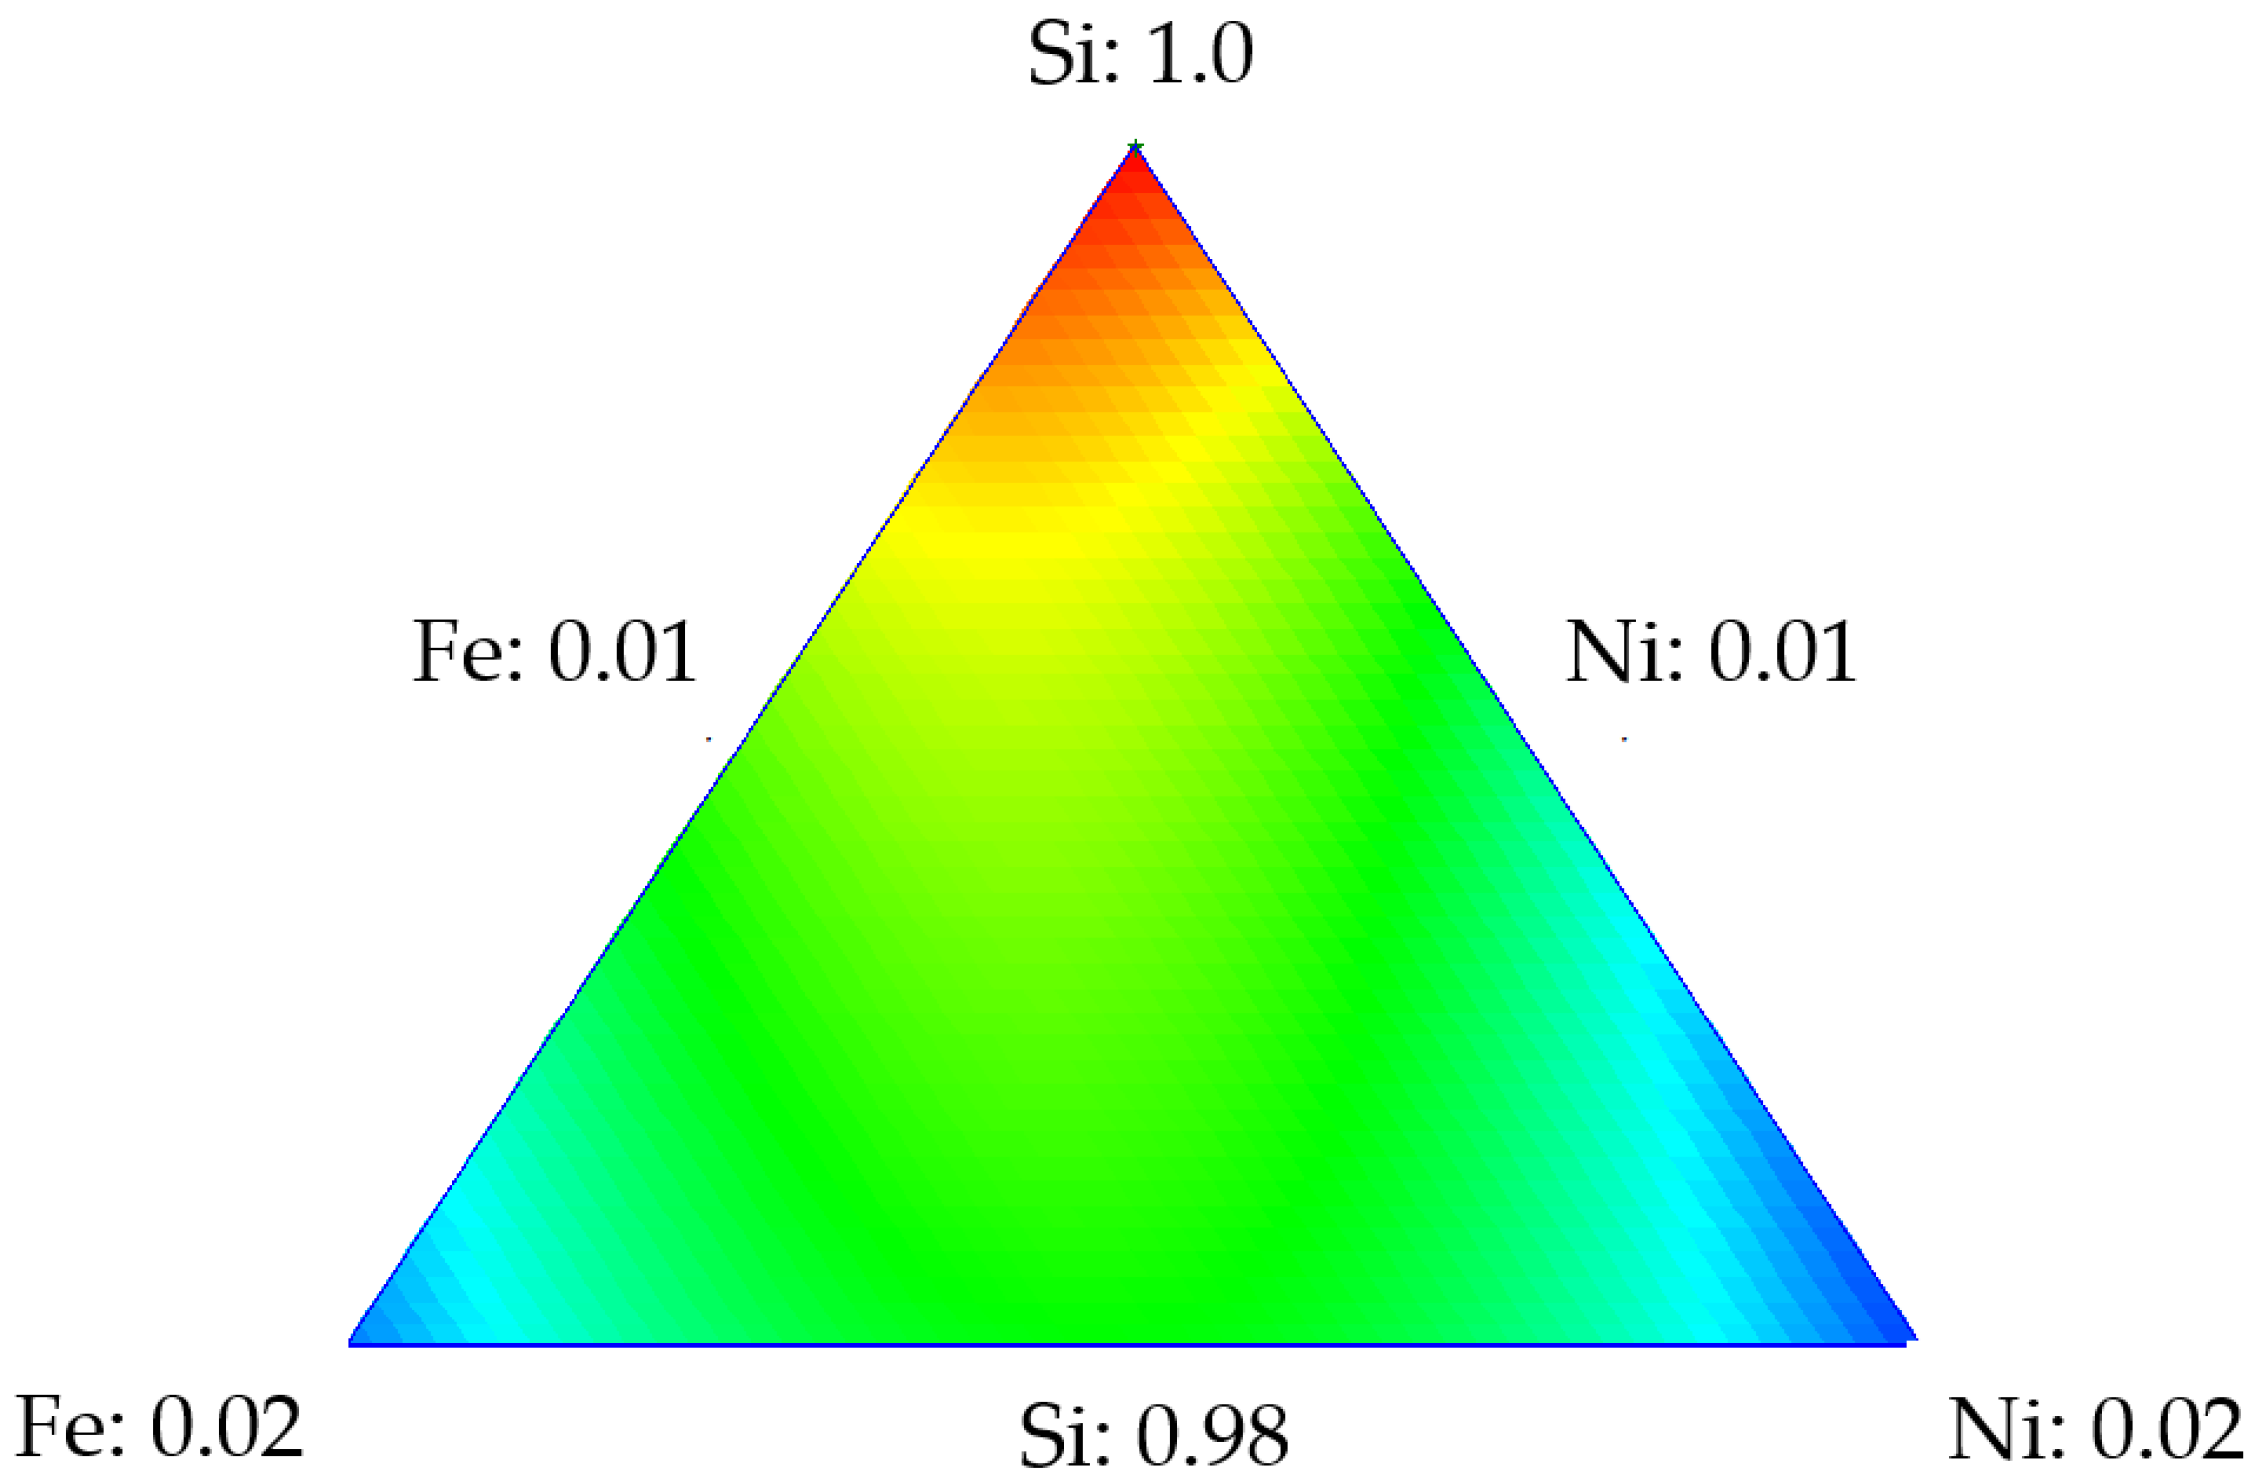
Figure 2 shows the response surface for the Si-Fe-Ni design, from which it is observed that as the dosage of each element (Fe or Ni) increased, the surface area decreased, obtaining the minimum value at those points representing the maximum amount of metal (blue zone). Therefore, the maximum value of the surface area is at the point where the silica represents 100% of the nanoparticle composition.
Likewise, the surface area values of SiFe0.5Mo0.5 and SiNi0.5Mo0.5 were predicted. For the Si-Fe-Mo design, the error was 2.07%, and the theoretical and experimental values for the surface were 320.8 and 335.6 m2·g−1, respectively. The Si-Ni-Mo design shows an error of 4.04%, the theoretical value for SiNi0.5Mo0.5 was 302.2 m2·g−1, and the experimental value was 274.9 m2·g−1. Supplementary Tables S1 and S2 present the parameters for the surface area design for the series Si-Fe-Mo and Si-Ni-Mo, respectively, in which these values represent the interaction between the silica support and metal oxides. Supplementary Figure S2a,b shows the response surface for surface area in each of the designs. Here, the same behavior described in Figure 2 was observed, in which the surface area decreased with increasing contribution of each transition element in the composition of the nanoparticle. Among the three elements analyzed and their respective contributions to the reduction of surface area, it was determined that the presence of nickel and iron affected, to a greater extent than molybdenum, the surface area of the nanoparticle. The surface area in the design with three transition elements was also predicted. Here, the calculation point is where the contribution of each TEO was 0.5%. The experimental value for this point was 355.9 m2·g−1, and the theoretical value was 379.9 m2·g−1, which demonstrates an error of 2.82%. Supplementary Table S3 shows the parameters for this design, in which the response variable is the surface area.
These results suggest that SCMD can predict the surface area values of any point of each mixture, reducing operational costs and measurement time.

2.2. Asphaltene Adsorption Isotherms with Mixture Design

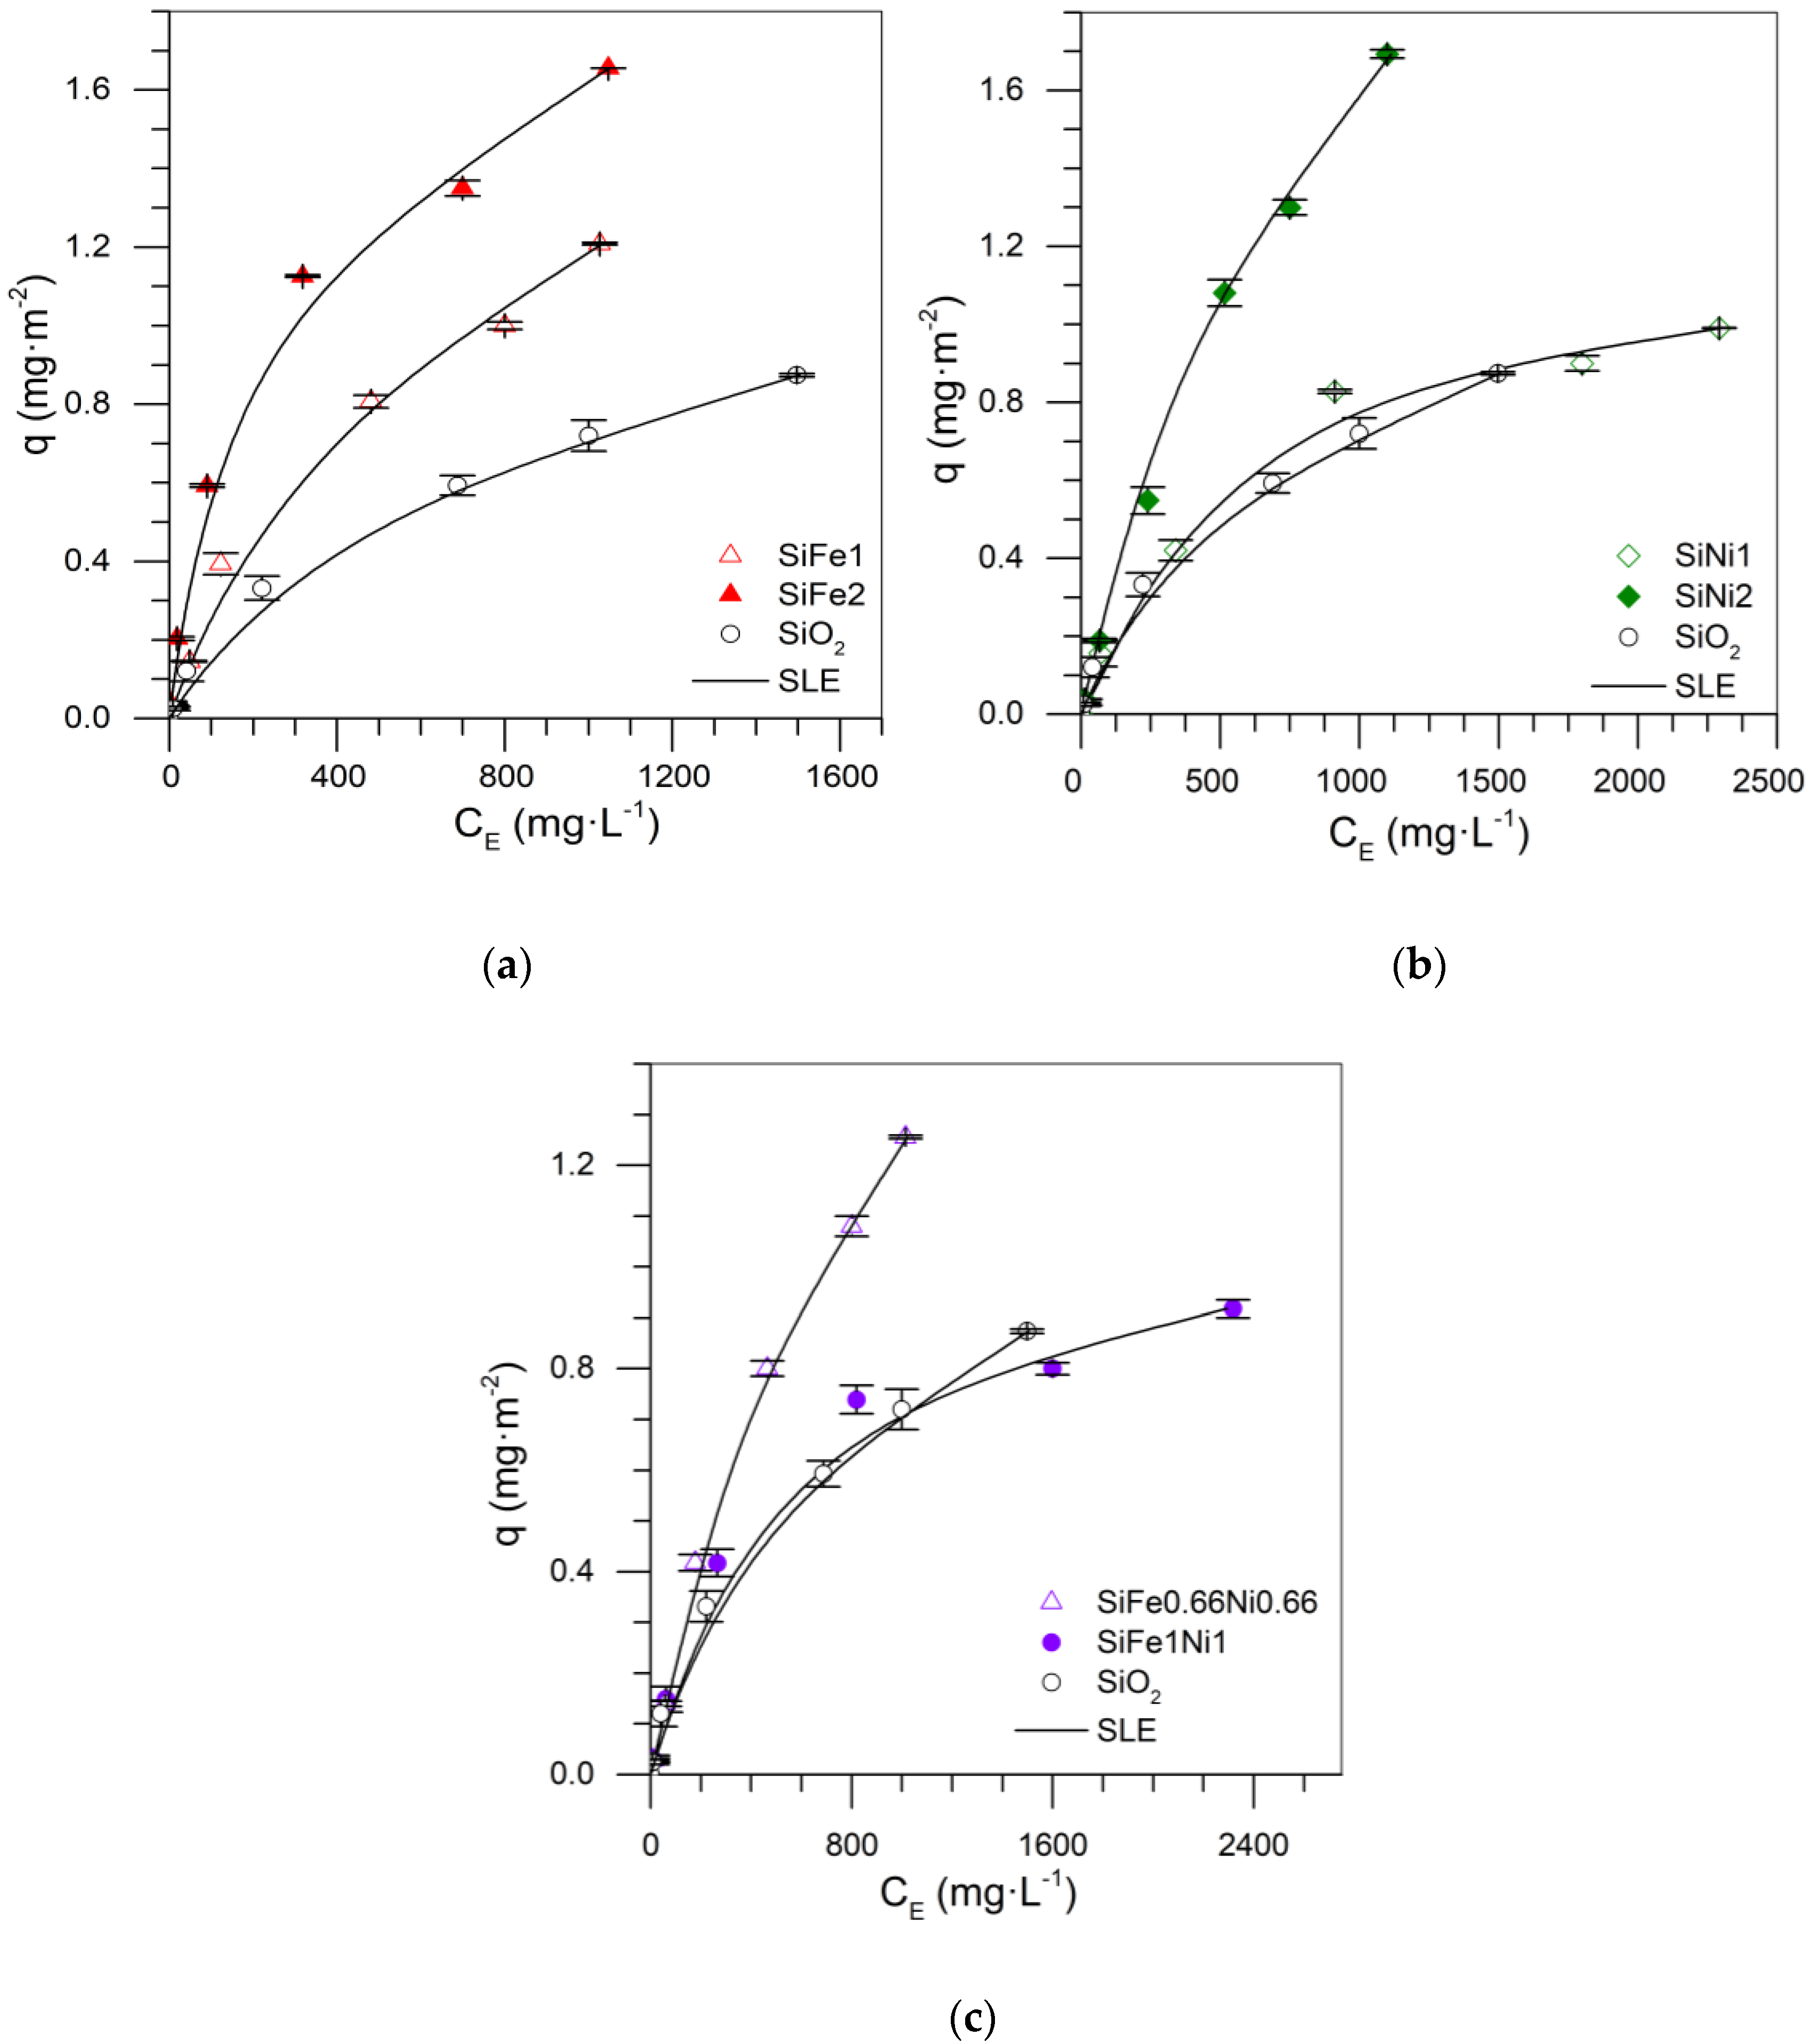
Figure 3 shows the asphaltene adsorption isotherms at 25 °C for the Si-Fe-Ni mixture design. In general, SiO2 showed less adsorption of the samples with the addition of TEOs. The transition elements increased the active sites, which generated an increase of asphaltene uptake and adsorption affinity [40]. When the content of asphaltenes increased in the solution, the adsorbed amount increased according to the adsorption isotherm.
Figure 3a,b shows that, for mono-elemental nanoparticles, the increase in the dosage of the TE on the support increased the asphaltene uptake, with the highest adsorption capacity demonstrated using the SiFe2 and SiNi2 nanoparticles. In addition, the adsorption isotherm for the SiFe1Ni1 nanoparticle showed lower adsorption than those isotherms with one transition element. This can arise due to the poor dispersion of the metals on the surface of the support, occurring as a result of sintering phenomena. If the dispersion of metals is not adequate, the size of the crystals is also affected, and therefore, a poor adsorptive capacity of the material is obtained [36]. In contrast, the dosage of 1% Ni showed only a slight increase in the amount of asphaltenes adsorbed to the support. This behavior suggests that, at this dosage, the nickel crystals did not achieve good dispersion on the SiO2 surface, and therefore, there was not adequate active site distribution, hindering the adsorption of asphaltenes. In the SiFe1 system, for this dosage, there was a considerable increase in adsorptive capacity compared to the SiNi1 system. In other words, iron crystals achieved a better anchorage, forming a heterogeneous structure with high selectivity for heavy hydrocarbons. According to Tamman’s temperature, Ni diffusion over the support surface requires more energy than Fe [41,42].
Analyzing isotherms of SiFe2 and SiNi2, those mixtures with the highest adsorption, it is concluded that these nanoparticles demonstrated similar maximum adsorption with slight affinity differences. The iron has a higher affinity for adsorption of asphaltenes, based on the selectivity in the heteroatom adsorption of asphaltenes as nitrogen, while the nickel has lower selectivity. It has been reported that the main nitrogen forms present in the asphaltene molecular structure include pyridine, pyrrolic, amine, and quaternary-N [43,44]. Pyridines are the primary sites for intermolecular interaction due to their aromatic structure [45]. In this regard, the increase in the atomic ratio of pyridine improves the attraction with the functional groups of the metal oxides [
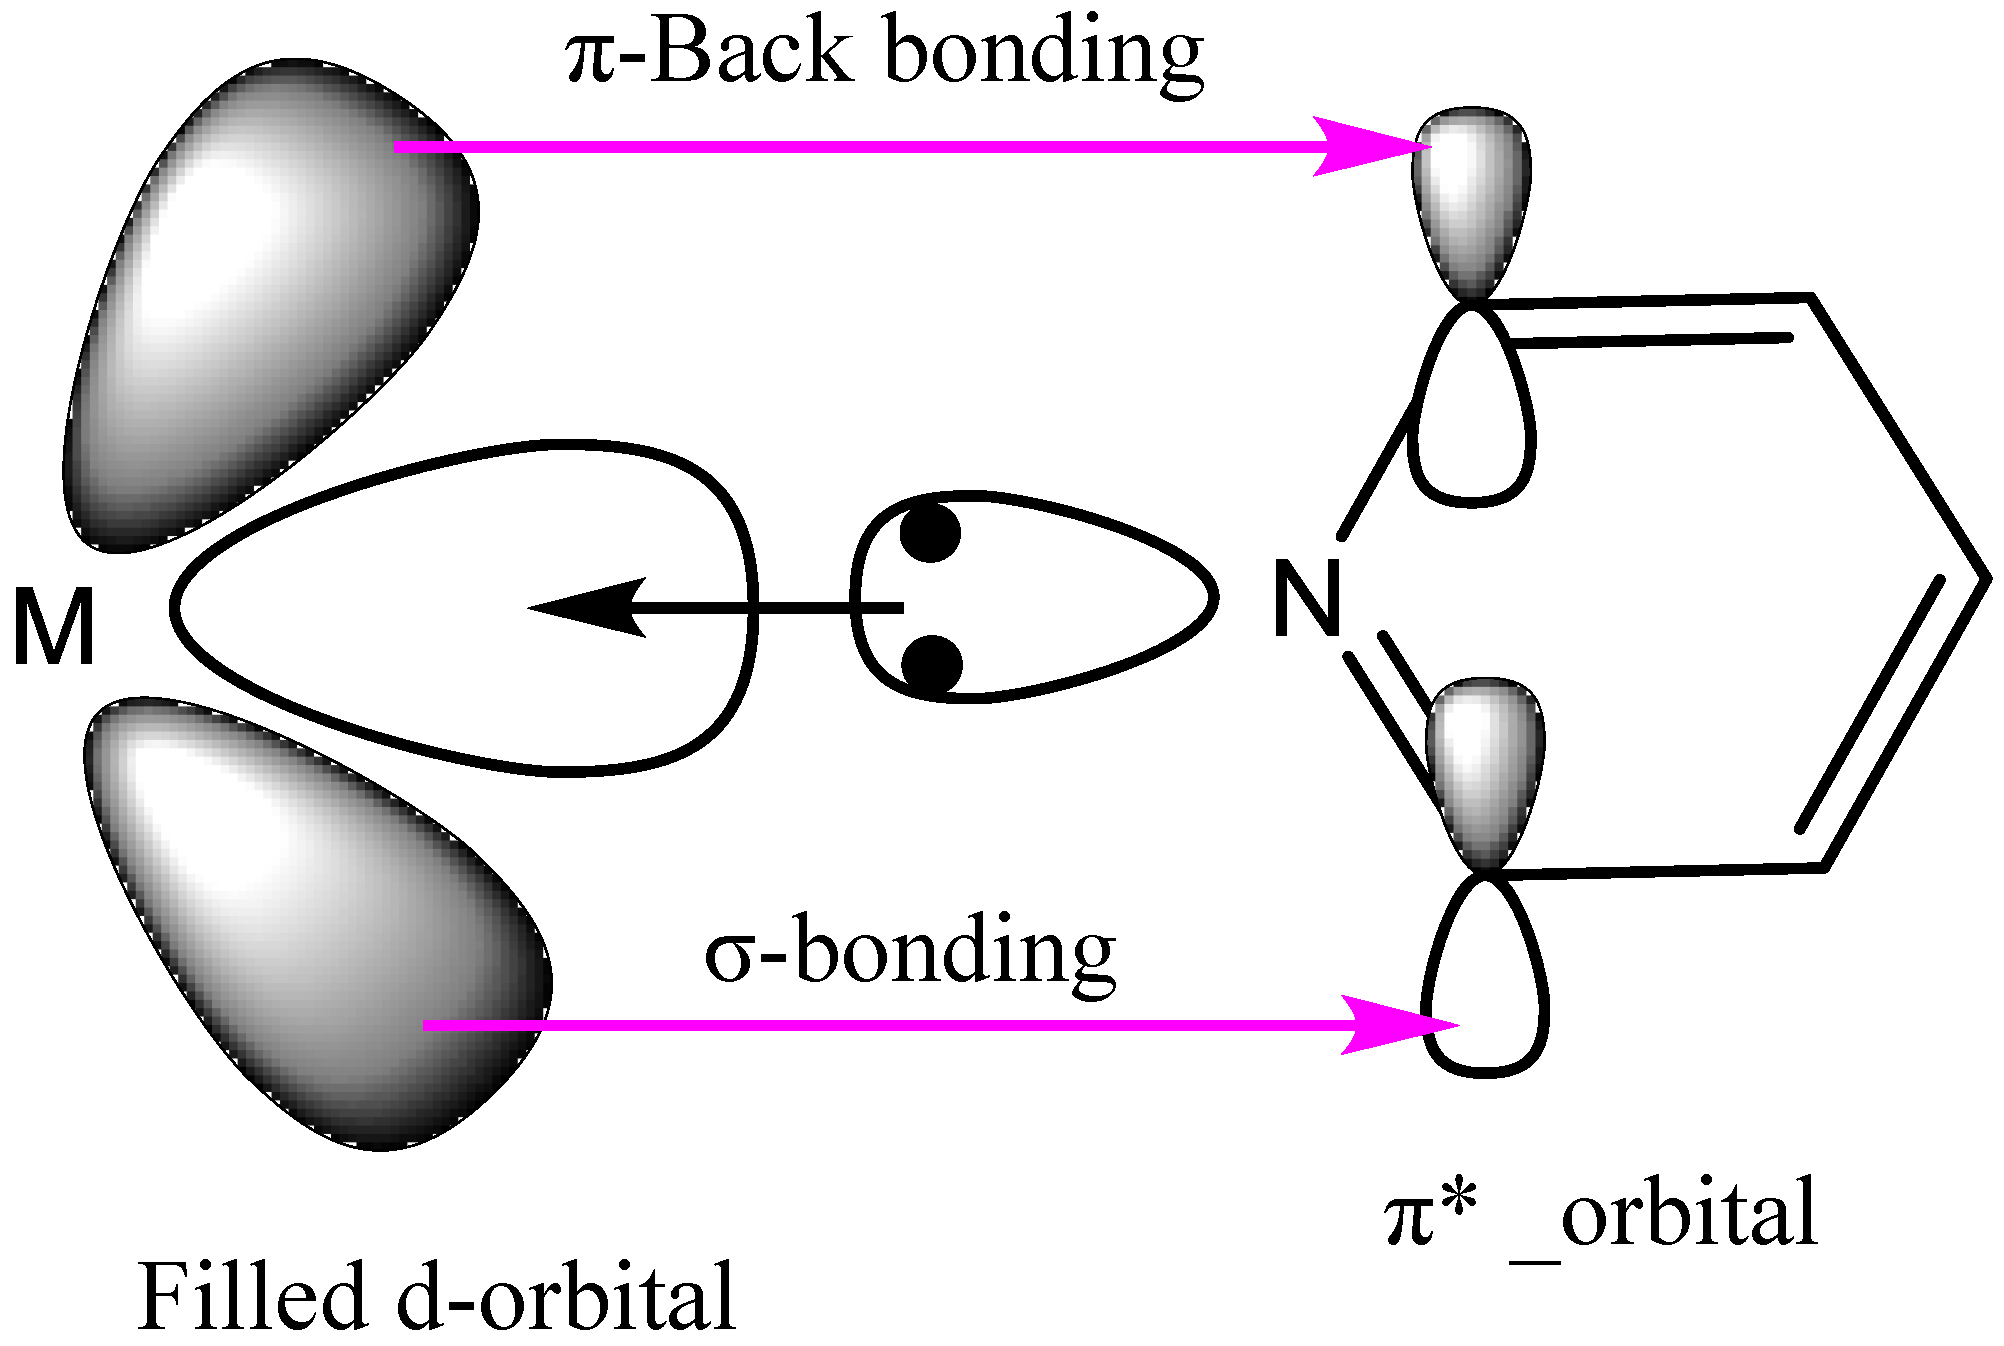
46]. This interaction could be the consequence of both σ and π bonding between metal and a pyridine functional group, as shown in Figure 4:
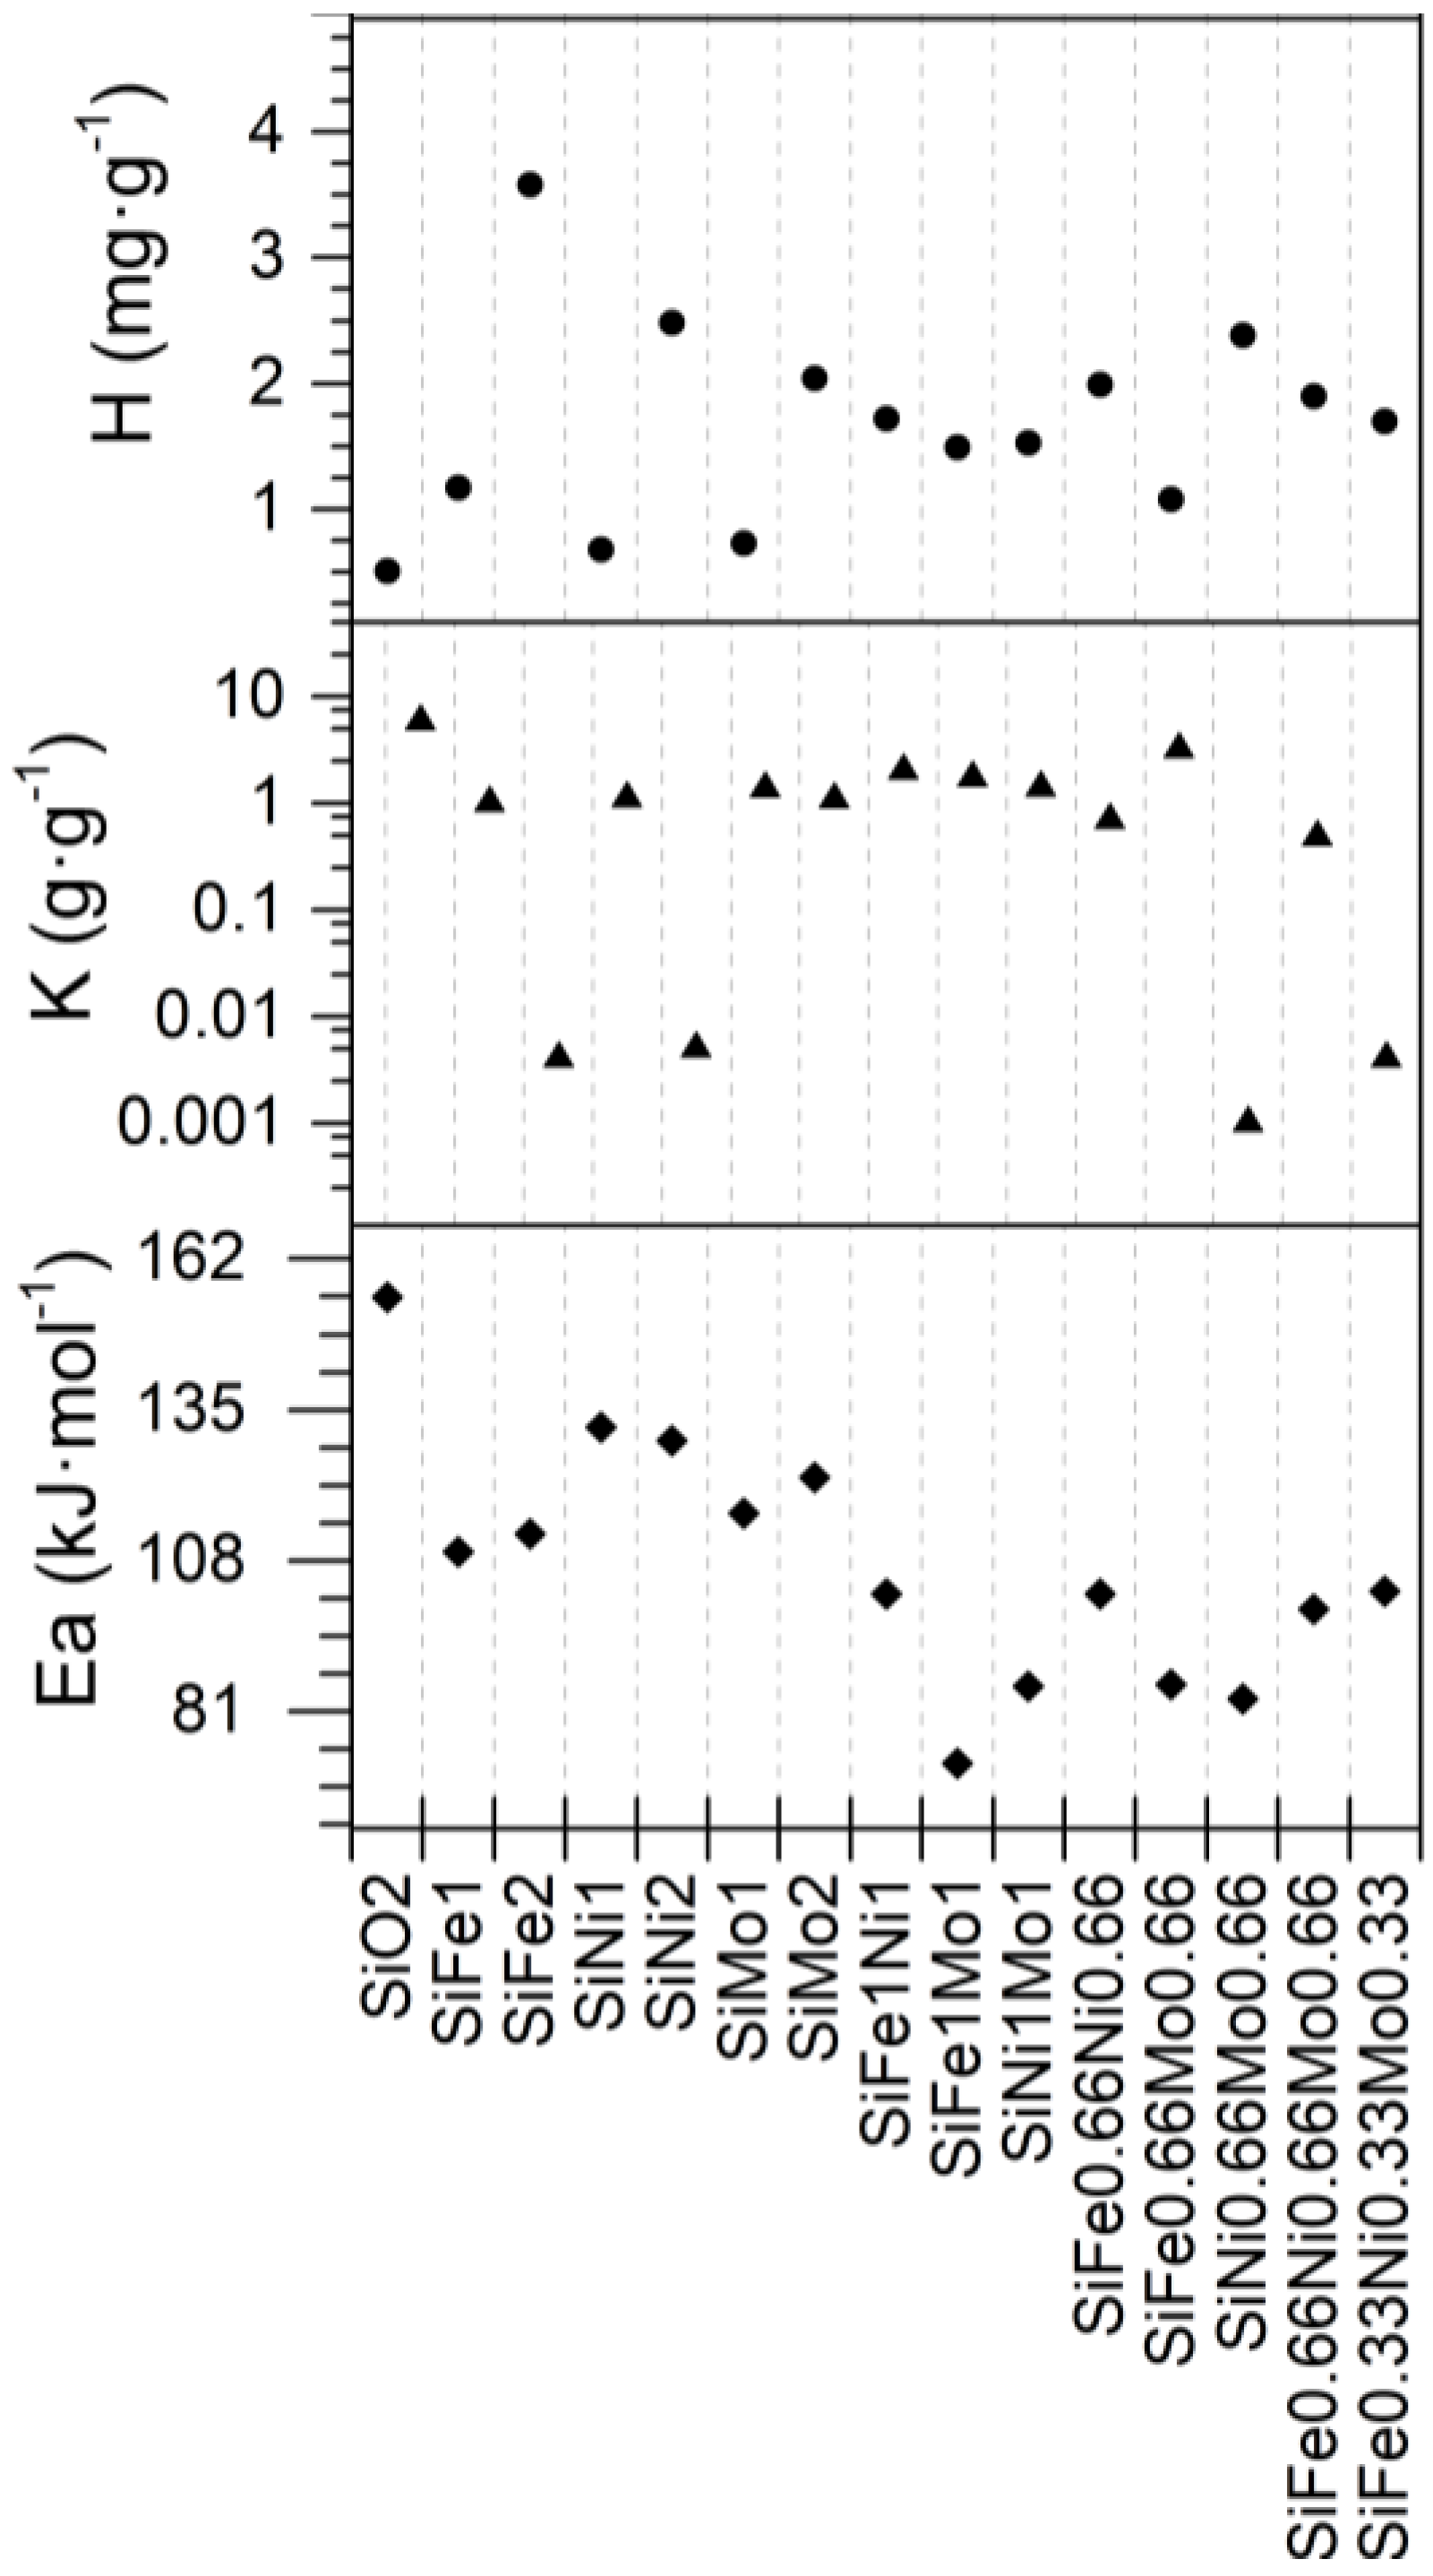
Supplementary Table S4 and Figure 5 show the SLE model parameters obtained for adsorption isotherms of support and SHS nanoparticles. The nanoparticles with iron oxide had higher adsorption affinity than the isotherms with nickel and molybdenum oxide, based on Henry’s law constant ( H ) values, in which low values imply high affinity. Molybdenum oxides have a greater affinity than iron oxides. Regarding the association degree of the asphaltenes on the nanoparticle surface ( K ), the addition of the TEO on the support reduced the magnitude of its value more than SiO2 nanoparticles. A similar trend for H was found. The self-association degree reduced as the affinity increased, and therefore, the addition of Mo—more so than Ni and Fe—improves this property.
The adsorption isotherms for any dosage of the TEOs on the SiO2 surface were predicted, using the experimental results of the different systems evaluated in the Si-Fe-Ni series. Table 3 and Table 4 show the ANOVA table and the parameters found through the development of the SCMD, respectively. The ANOVA table is fundamental in the experimental design. It shows the fit of the mixture model, and the adjustment for the special cubic model, which had a p-value higher than 0.05, an R2 higher than 99%, and the R2(adj) adjusted to the parameters above 90%, demonstrating reliability in the adjustment parameters. 
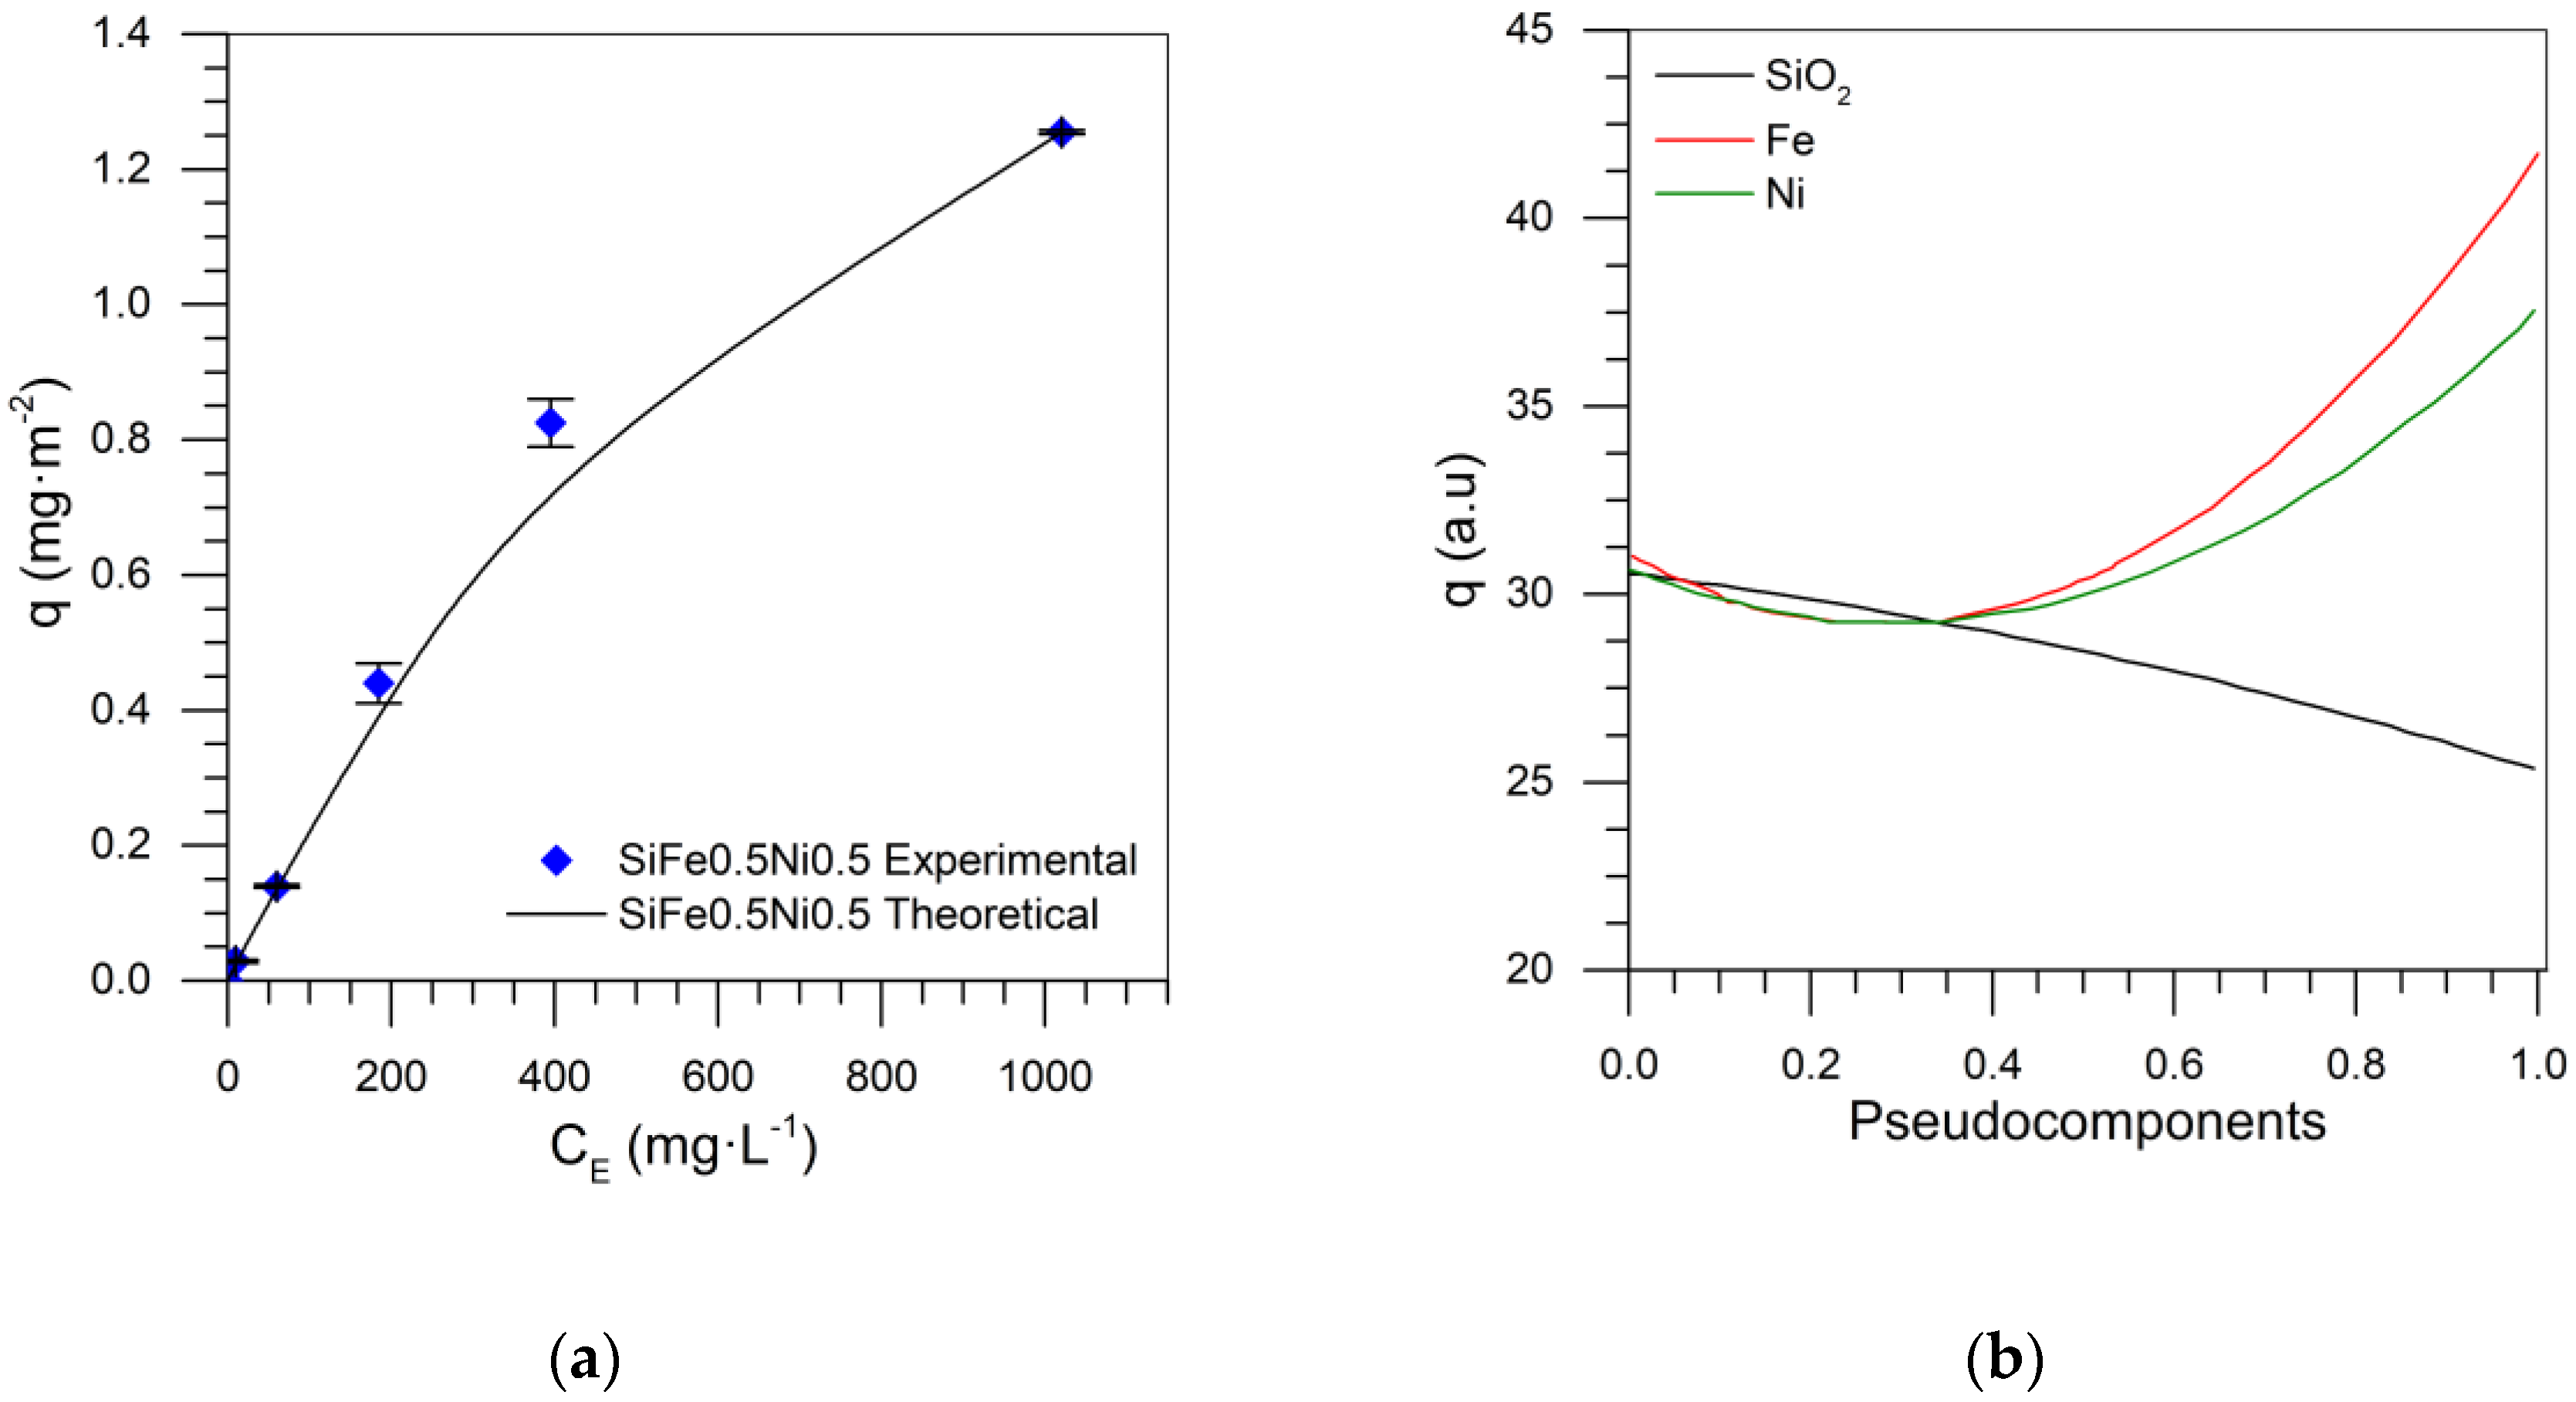
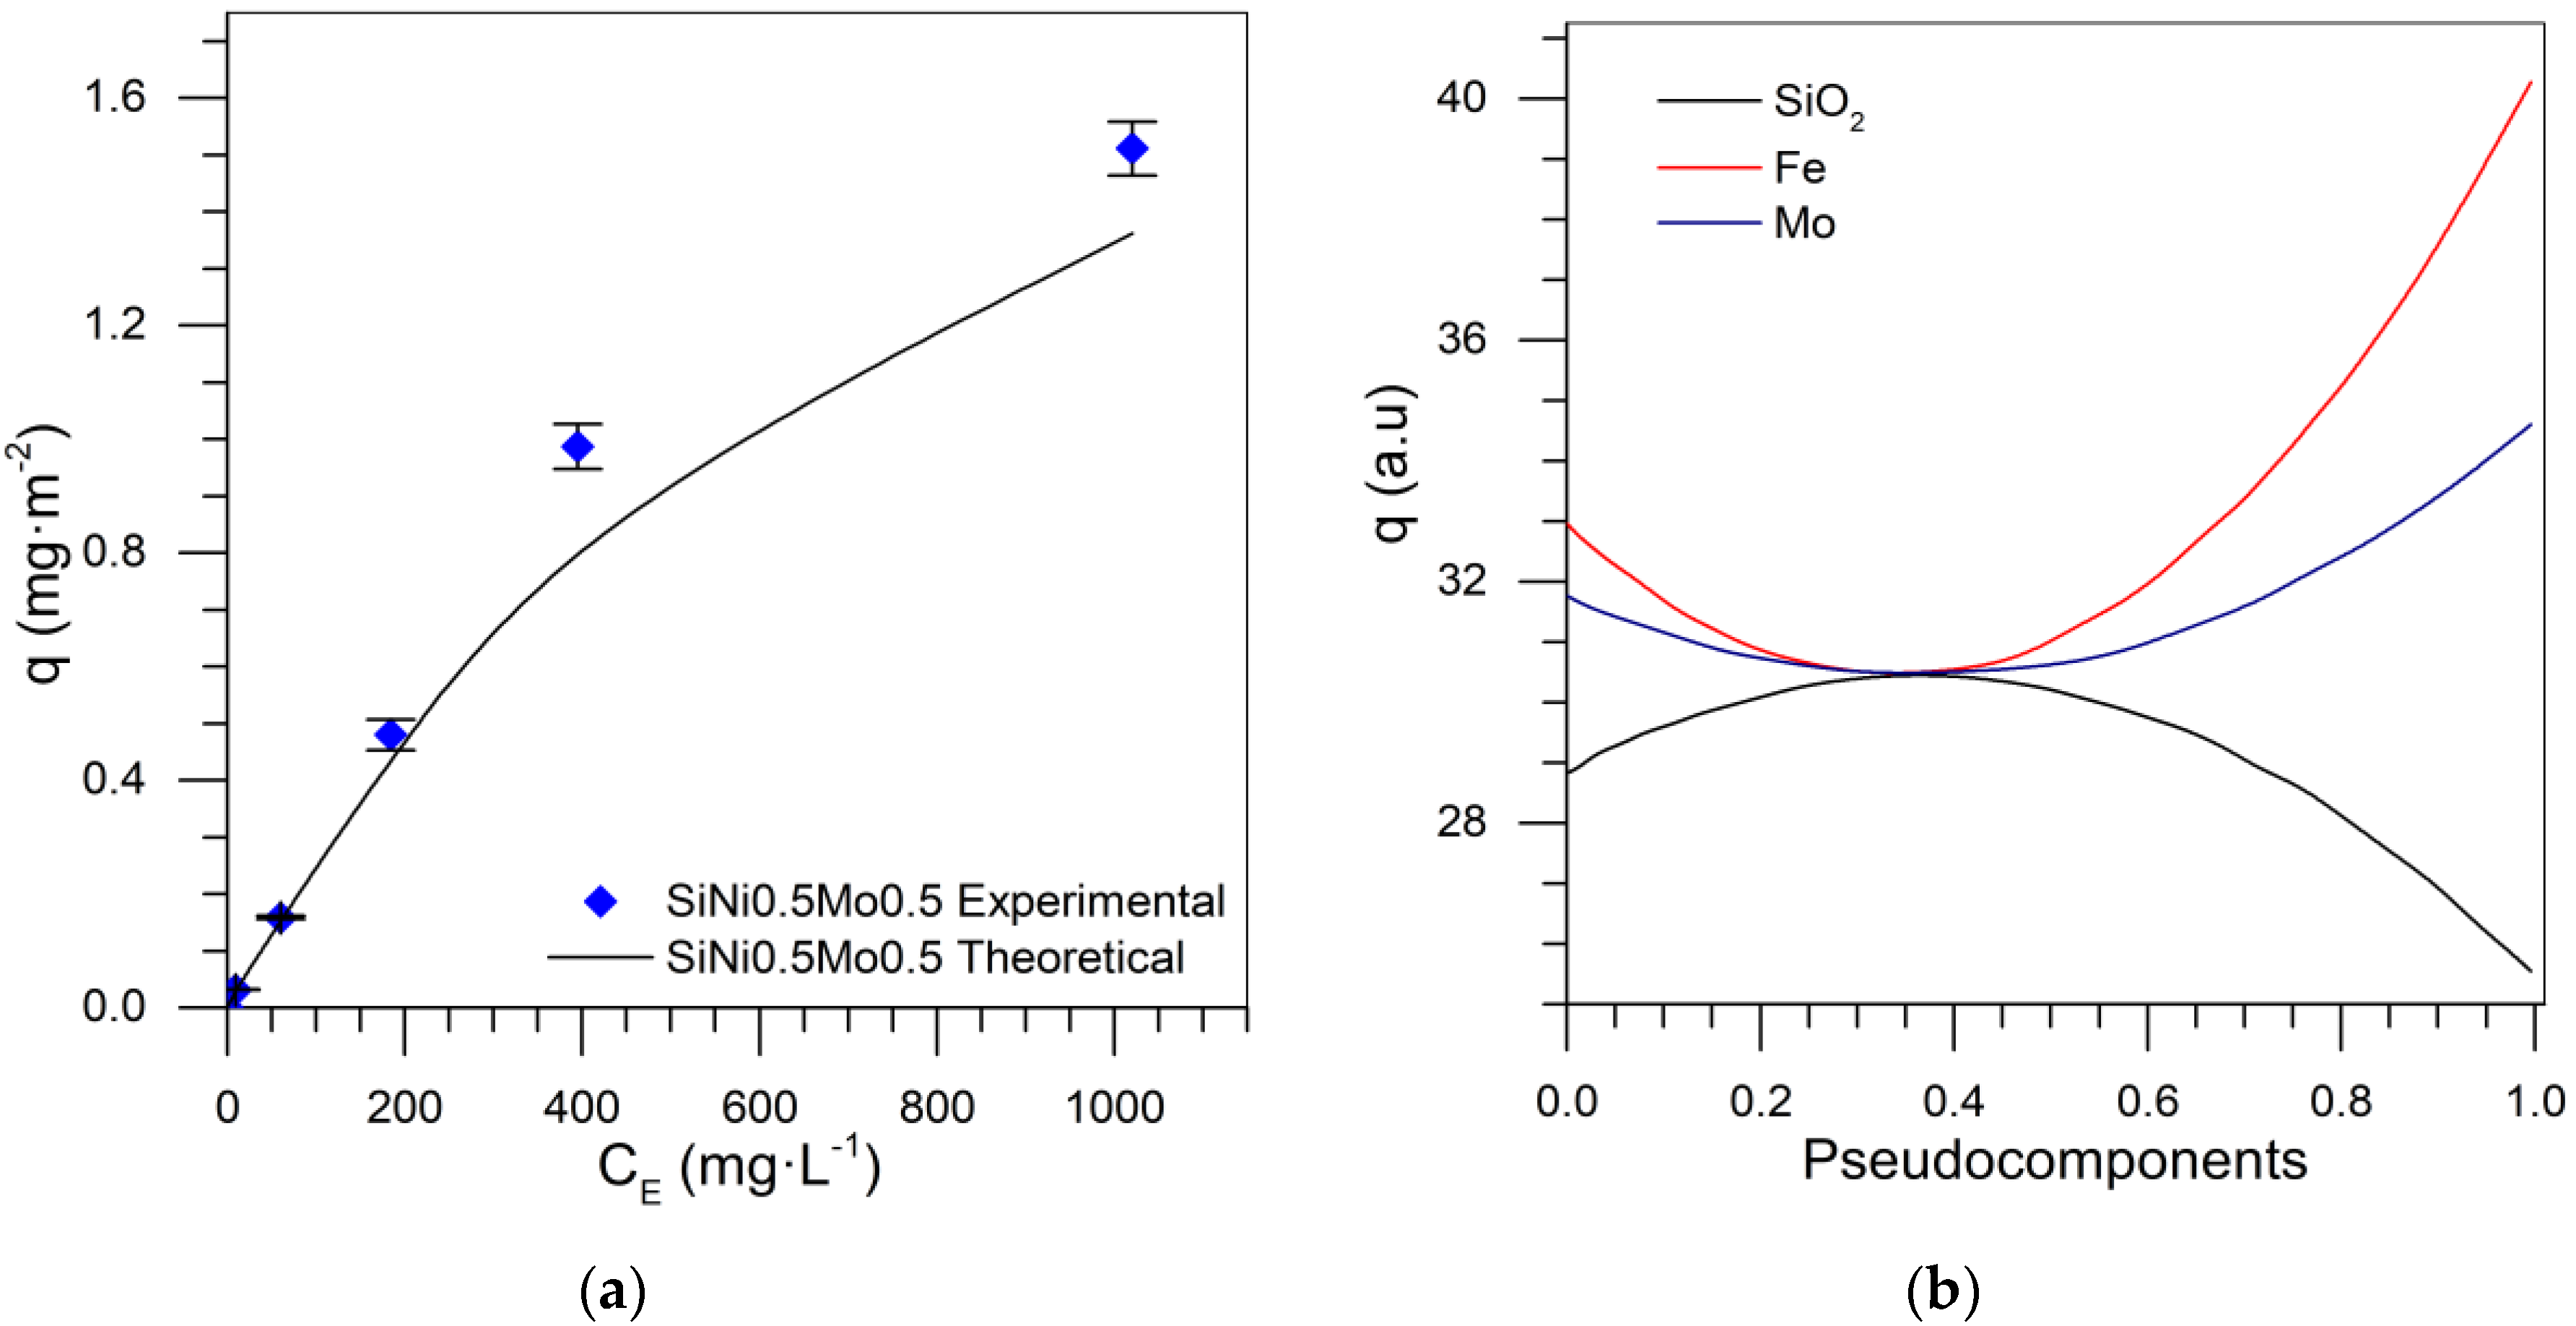
Figure 6a shows the adsorption isotherm for SiFe0.5Ni0.5 nanoparticles. For this mixture design, the RSM was 5.38%, calculated from the theoretical values given by the adjustment model and the experimental data of the adsorption isotherm for the SiFe0.5Ni0.5 nanoparticles.
Figure 6b shows the trace plot for the S-Fe-Ni series, in which it is observed that, when the contribution of silica increased, the adsorption decreased, and when the amount of metals increased, the adsorption increased. The contribution of iron was the most important, followed by nickel oxides. In contrast, 
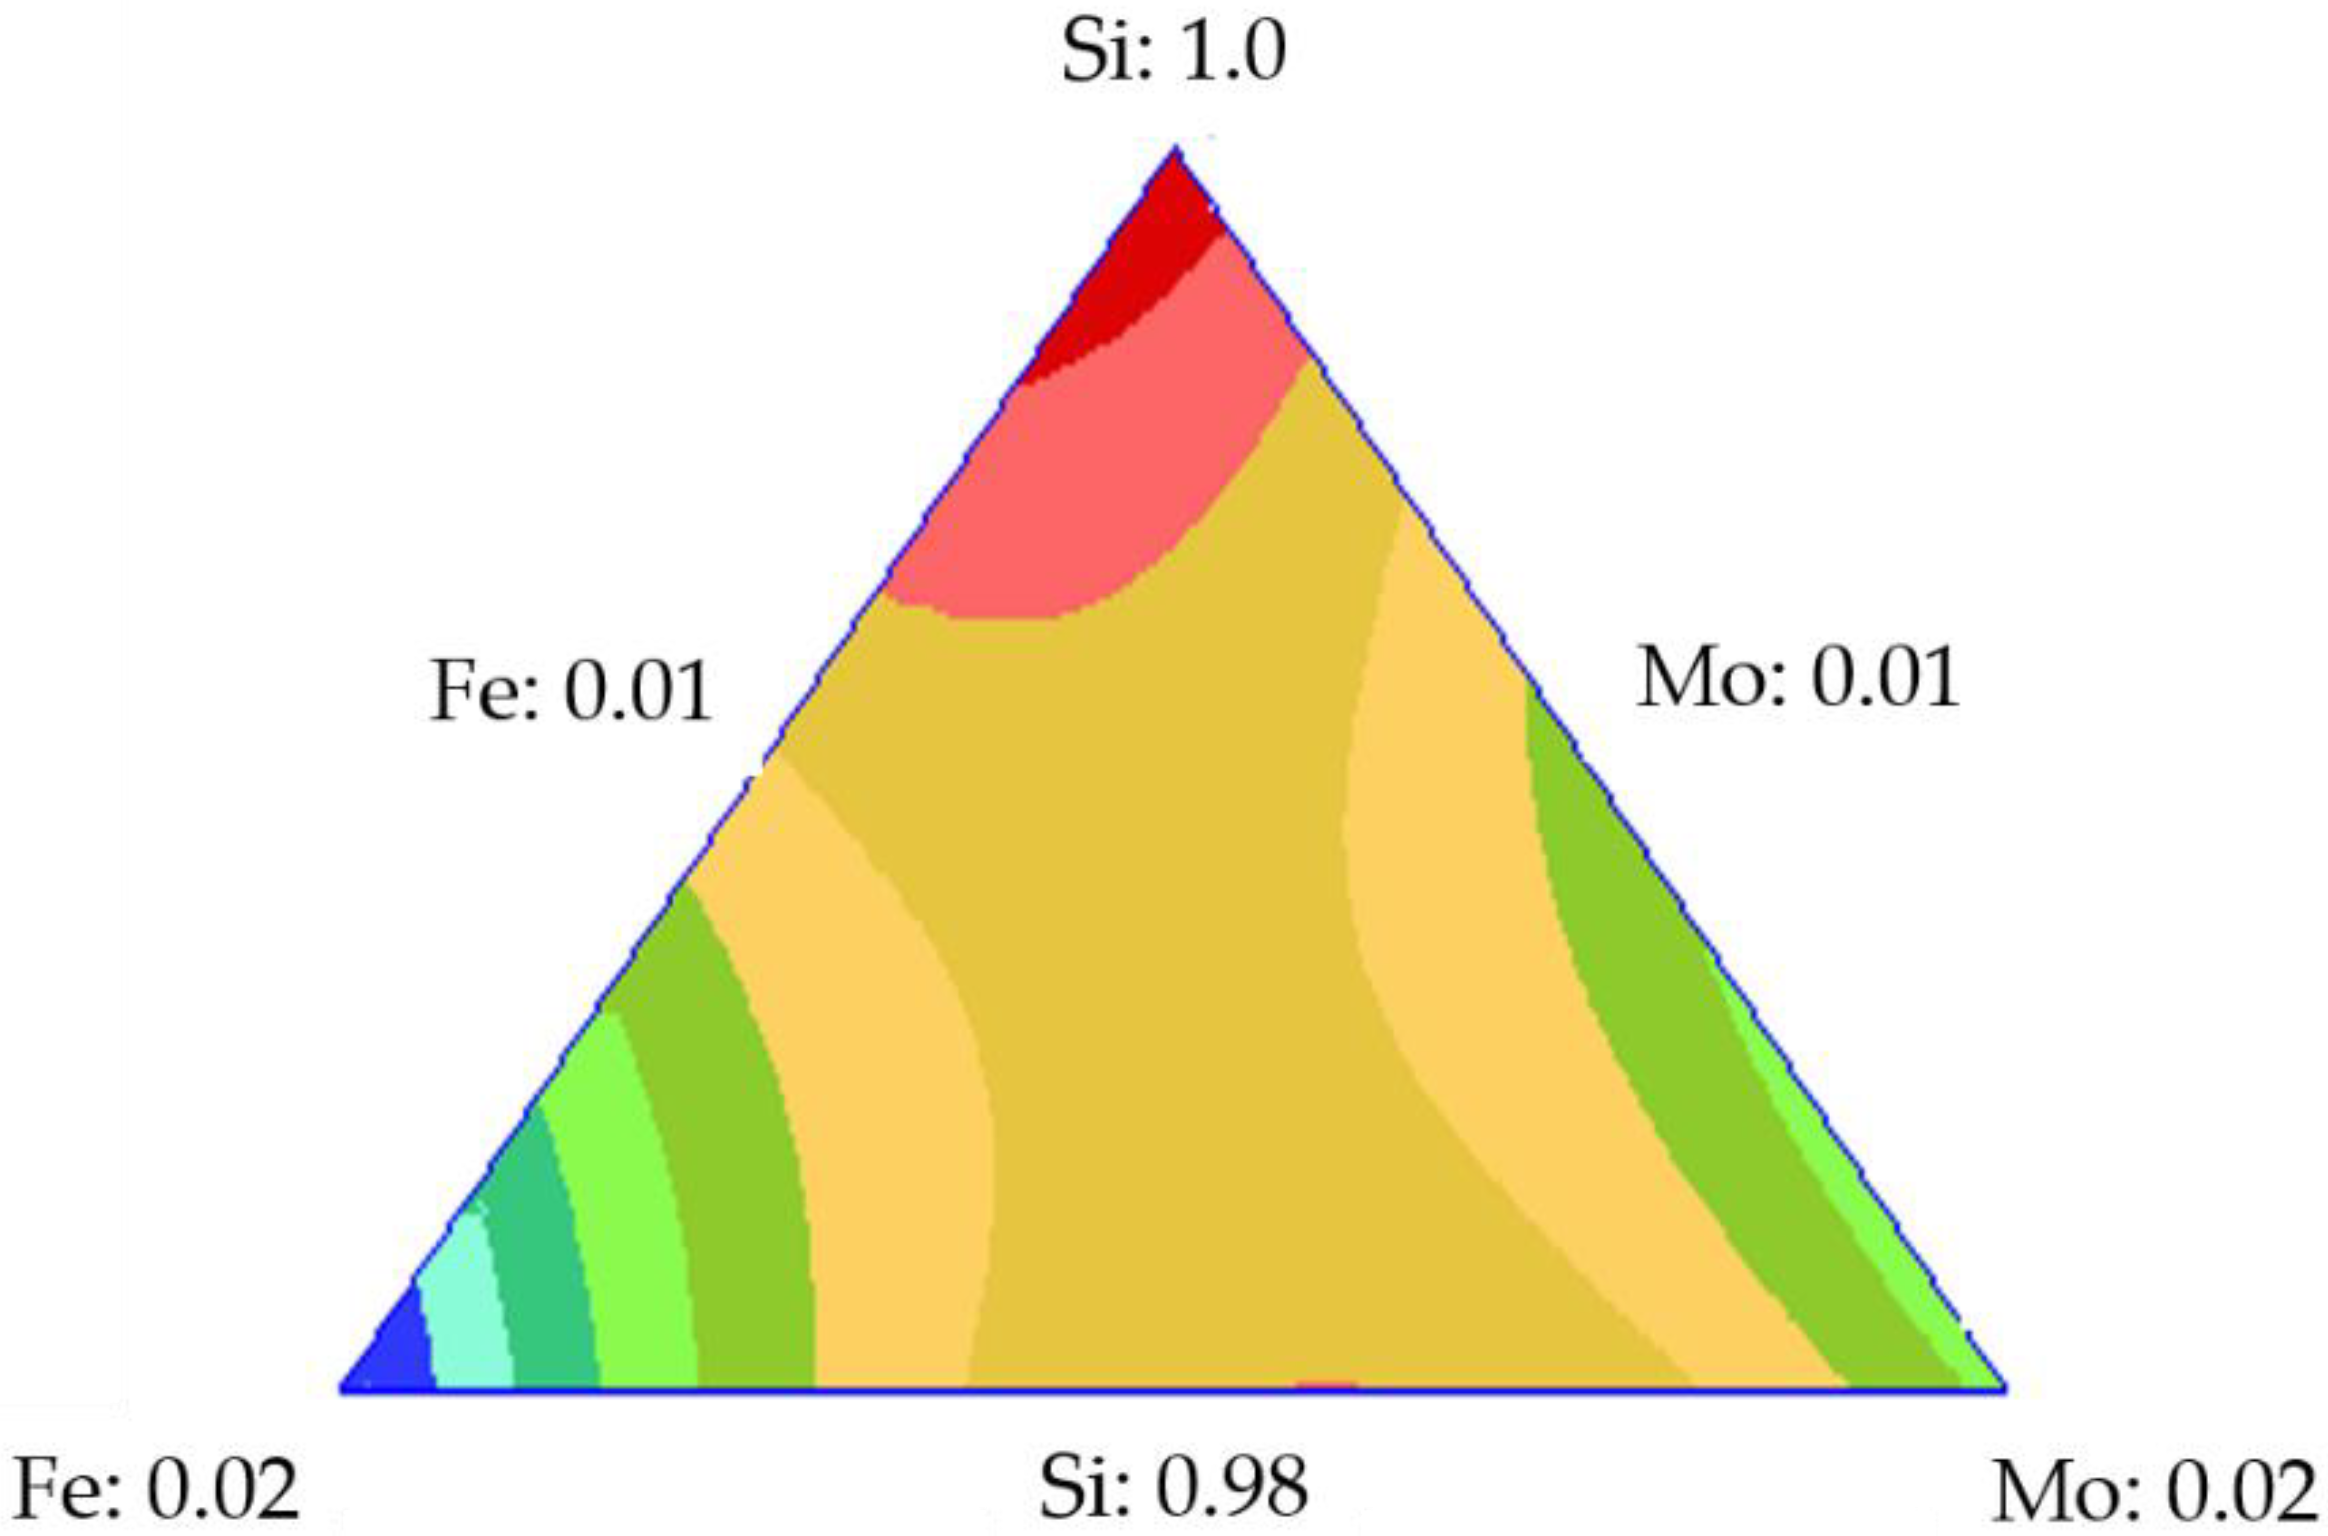
Figure 7 shows the adsorption response surface for the initial concentration of 100 mg·L−1. Again, it is evident that the increase in adsorption occurred in the direction of increasing TE concentration.
Experimental adsorption isotherms were constructed for each SCMD series, Fe-Mo, Ni-Mo, and three transition elements. 
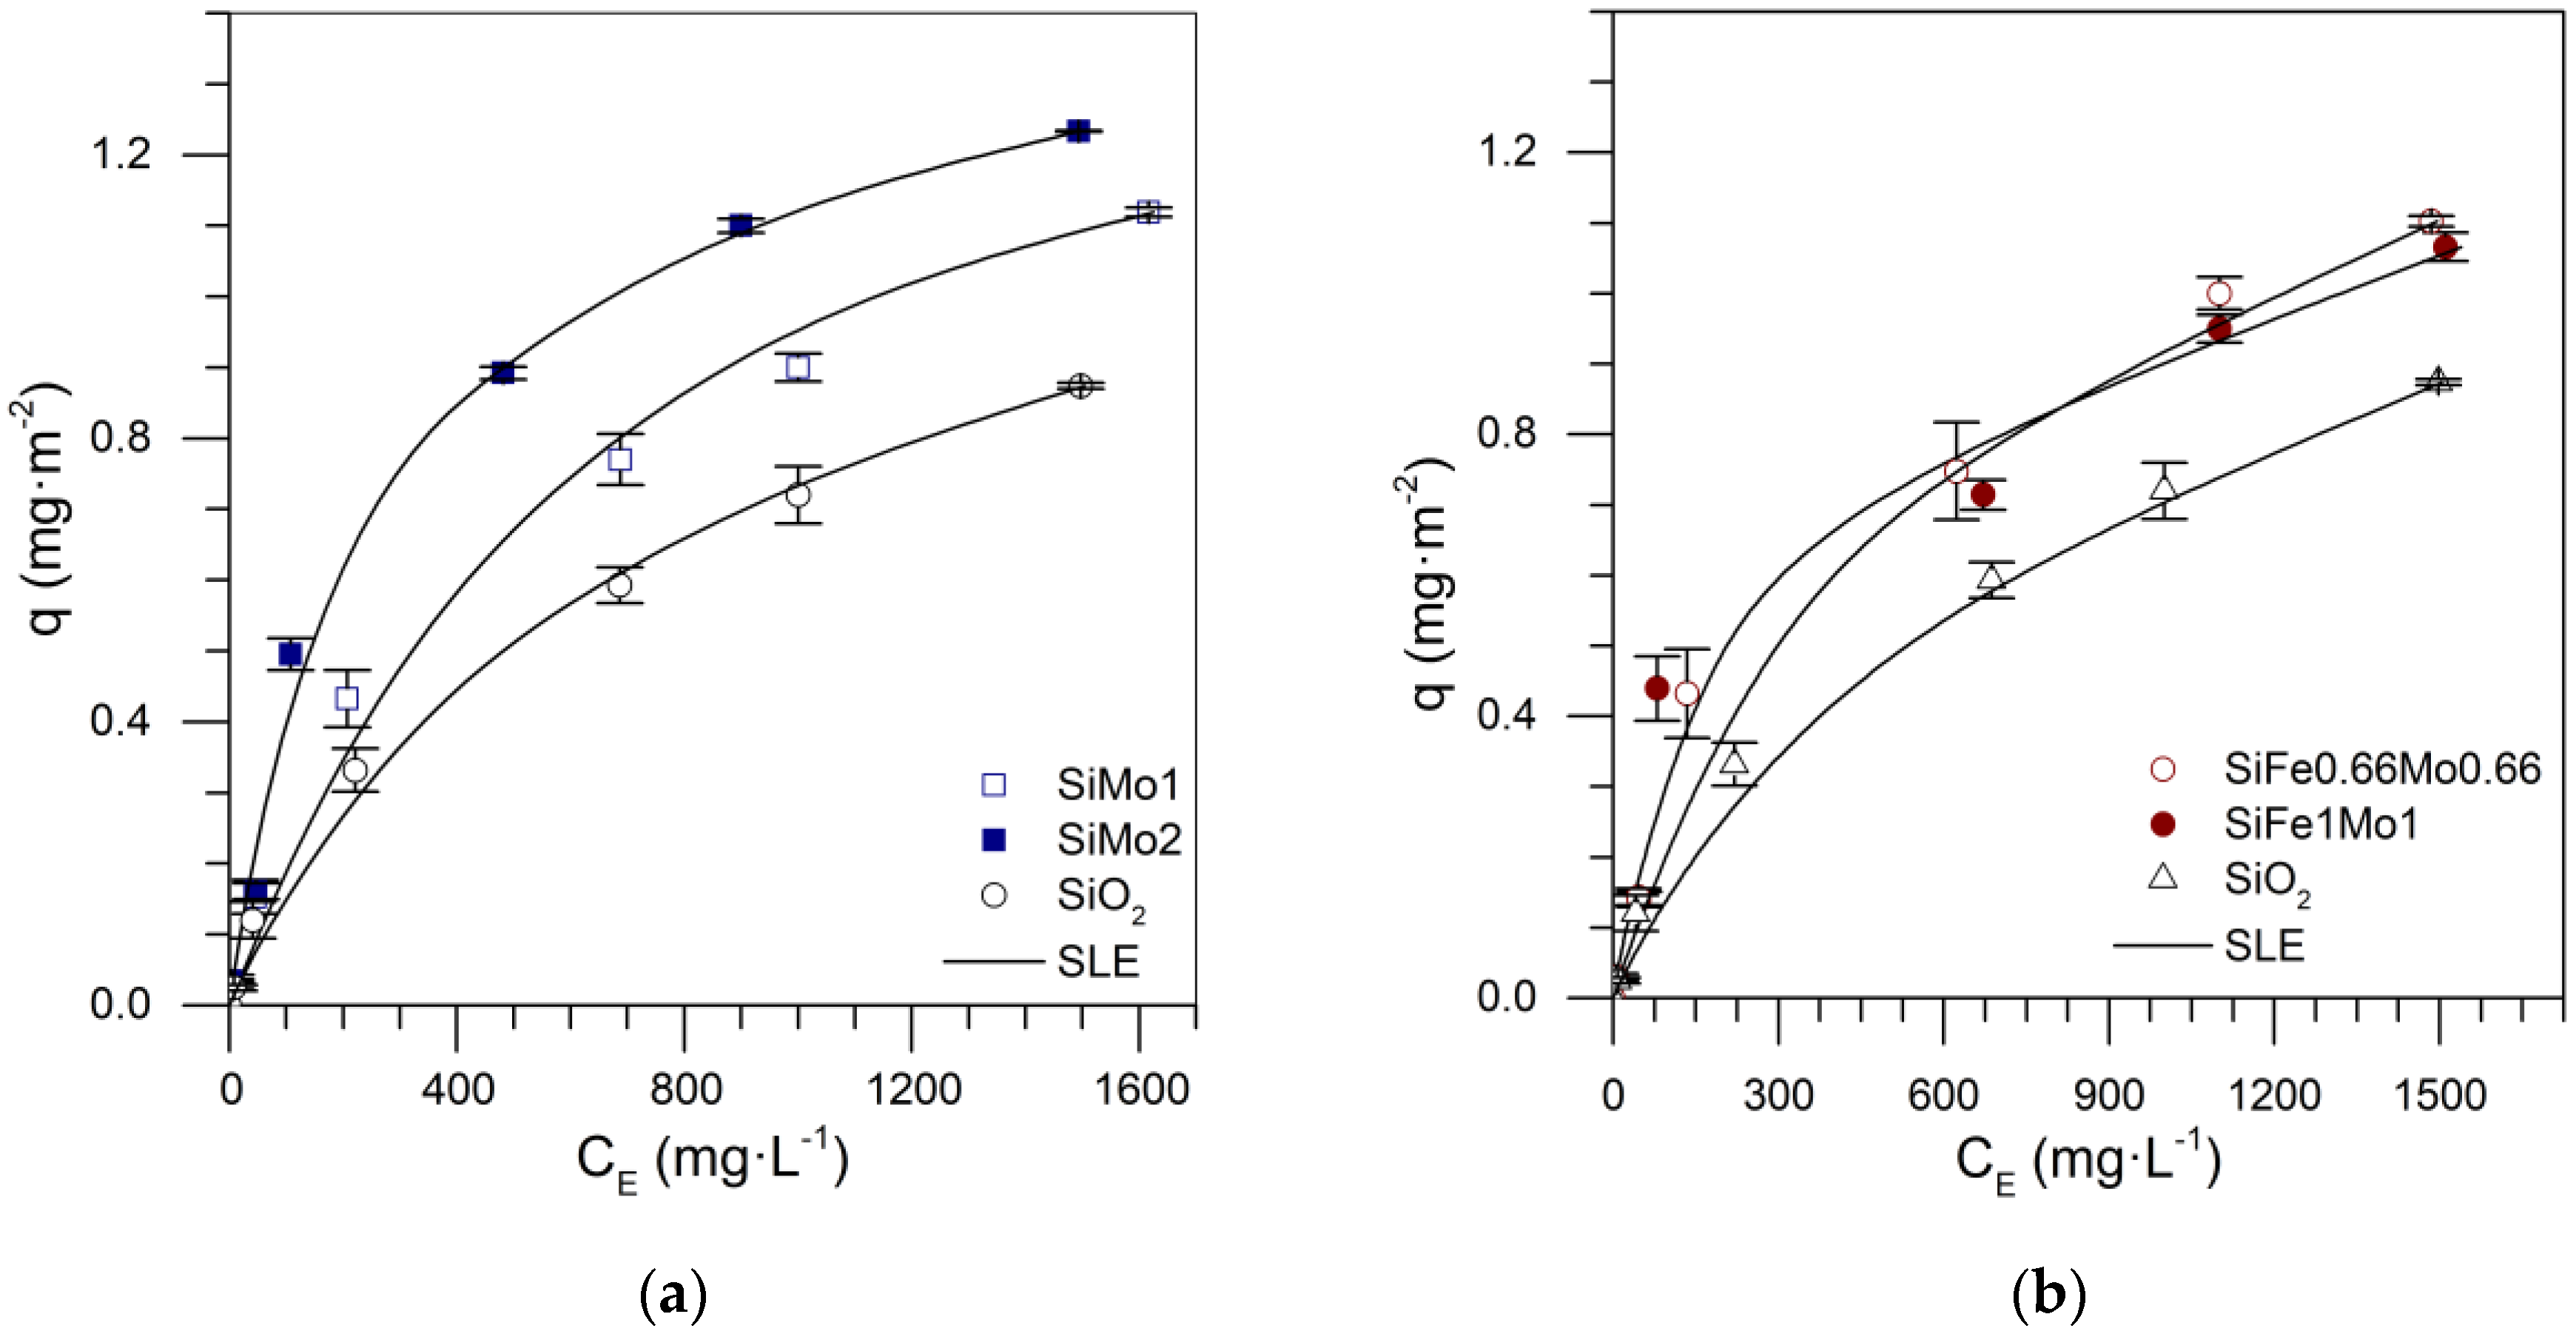
Figure 8 shows the isotherms of the series Si-Fe-Mo, in which the SiFe2 nanoparticles (Figure 7) showed the greatest adsorbed amount, and the adsorption behavior of the nanoparticles with two transition elements are similar. Bi-elemental nanoparticles showed lower adsorption than SiFe2 nanoparticles. Thus, it can be inferred that Mo inhibits Fe mobility on the support, resulting in a sintering characteristic of material complexed with transition metals [48].
The high adsorption capacity of SiFe2 could be because asphaltene is rich in nitrogen species, and iron demonstrates high selectivity for pyridine and pyrrolic compounds. In addition, the molybdenum oxides increased the amount adsorbed onto the silica nanoparticles due to selectivity for sulfur compounds.
Supplementary Figure S1a shows the mixture design and the fraction of each component for the Si-Fe-Mo series. The coefficients of the equation to approximate the adsorbed amount and predict the isotherm for different values of each component are shown in Table 5. Figure 9a shows the experimental and theoretical adsorption isotherm for silica nanoparticles functionalized with 0.5% by weight of each transition element (Fe and Mo). In this case, the RSM was 1.36%, demonstrating the reliability of the SCMD implementation.
Figure 9b shows the trace plot for the concentration of 100 mg·L−1 in which the behavior of each component is described. As the contribution of silica increased, the adsorbed amount decreased. When the supply of TEO increased, the adsorbed amount increased, which is higher for iron than molybdenum in this design. This analysis is contrasted with the one presented in Figure 10. The response surfaces for the initial concentrations of 100 mg·L−1 show that the amount adsorbed was higher at the tips of the triangle, where there is a more significant contribution of the transition elements; comparing these elements, we see the iron provides greater adsorption than molybdenum.
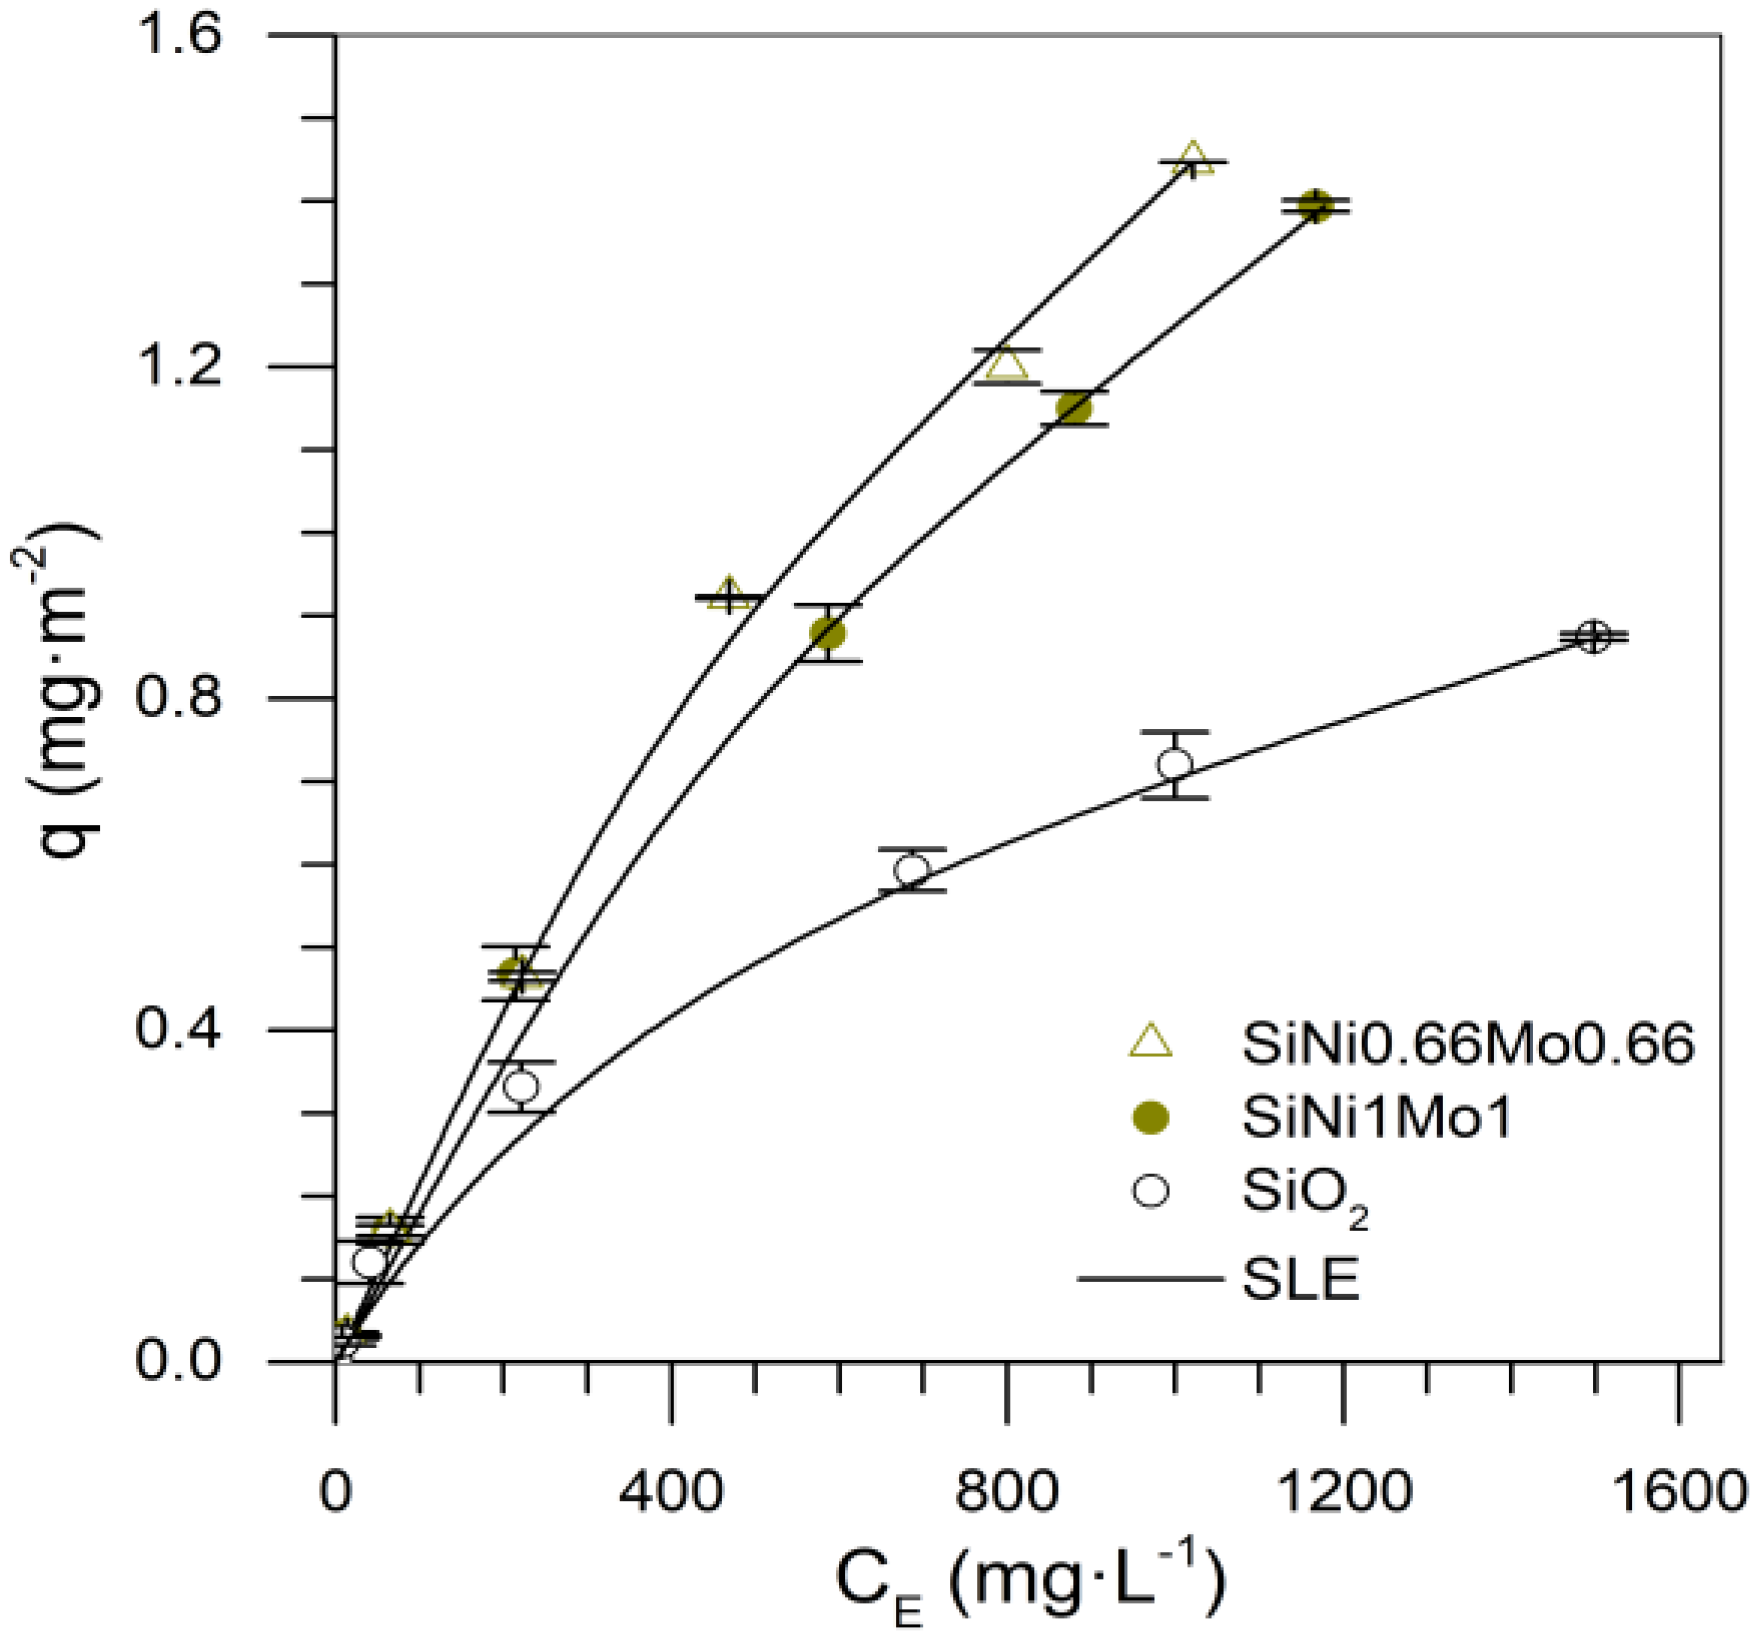
Figure 11 shows the remaining isotherms for the Si-Ni-Mo series. According to Figure 8a, the adsorption achieved with the Ni-Mo coupling was higher than SiMo2. This suggests that the combination of metals had a positive effect on the adsorption capacity of nanoparticles because, with the addition of Ni onto Mo-mono-elemental nanoparticles, the latter enhanced its selectivity for sulfur-based compounds and participation to a greater extent in the adsorption of heavy oil fractions. This implies that the Ni-Mo system has a synergistic effect that improves affinity and adsorptive capacity compared to the mono-elemental system.
Adsorption isotherm predictions for the Si-Ni-Mo system are presented in Table 6. 
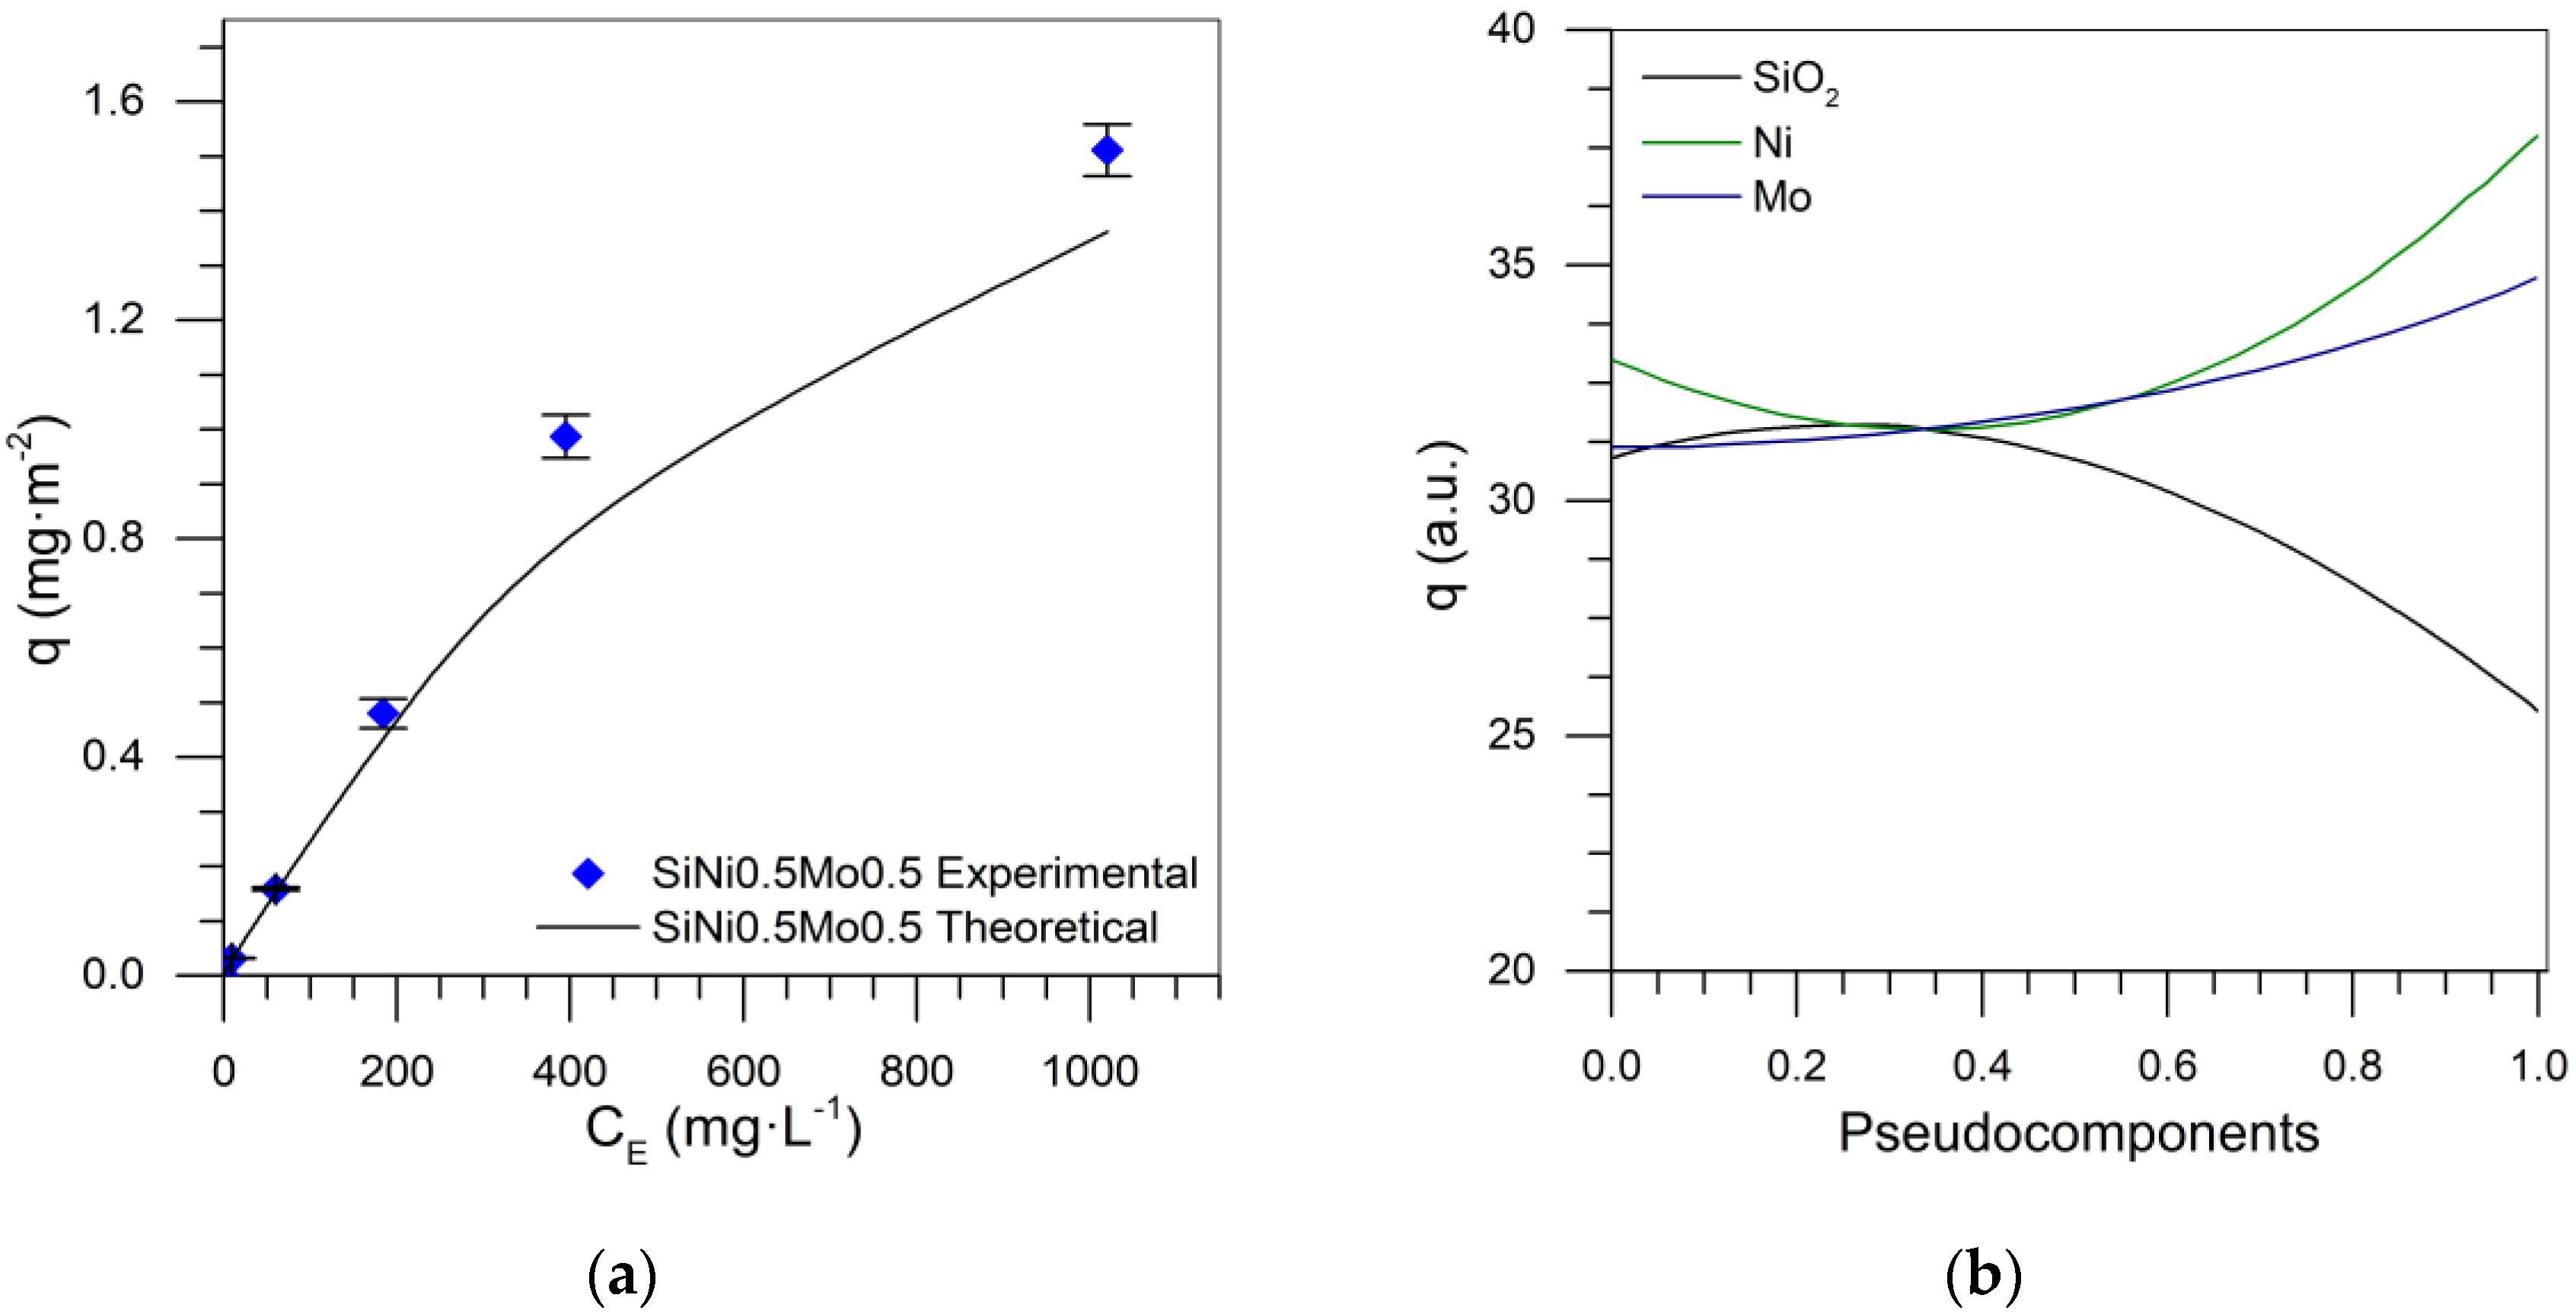
Figure 12a shows the adsorption isotherm of SiNi0.5Mo0.5 nanoparticles, which, when compared with the theoretical data, demonstrates an error of 9.58% based on the special cubic model.
Figure 12b and Figure 13 show the behavior of each component in the adsorption of asphaltenes. Figure 12b shows that increasing the contribution of each component tended to increase the adsorption, and silica shows the same behavior as that in previous mixture designs. The presence of Ni and Mo increased the asphaltene adsorption as the TEOs significantly contributed to increasing active sites in the nanoparticle. Among these, nickel has the greatest effect on increasing adsorption capacity. Figure 13 shows the relationship between the response surface to the adsorbed amount, corroborating the important contribution of nickel in the improvement of asphaltene uptake, and the need to maximize this variable.
For the tri-elemental mixture design, there were 15 experimental data points, presented in Figure 1b. This mixture design was developed by using all the results shown previously and then was used in the special cubic model for four components: silica, iron, molybdenum, and nickel. Table 7 shows the values of the coefficients of the model. 
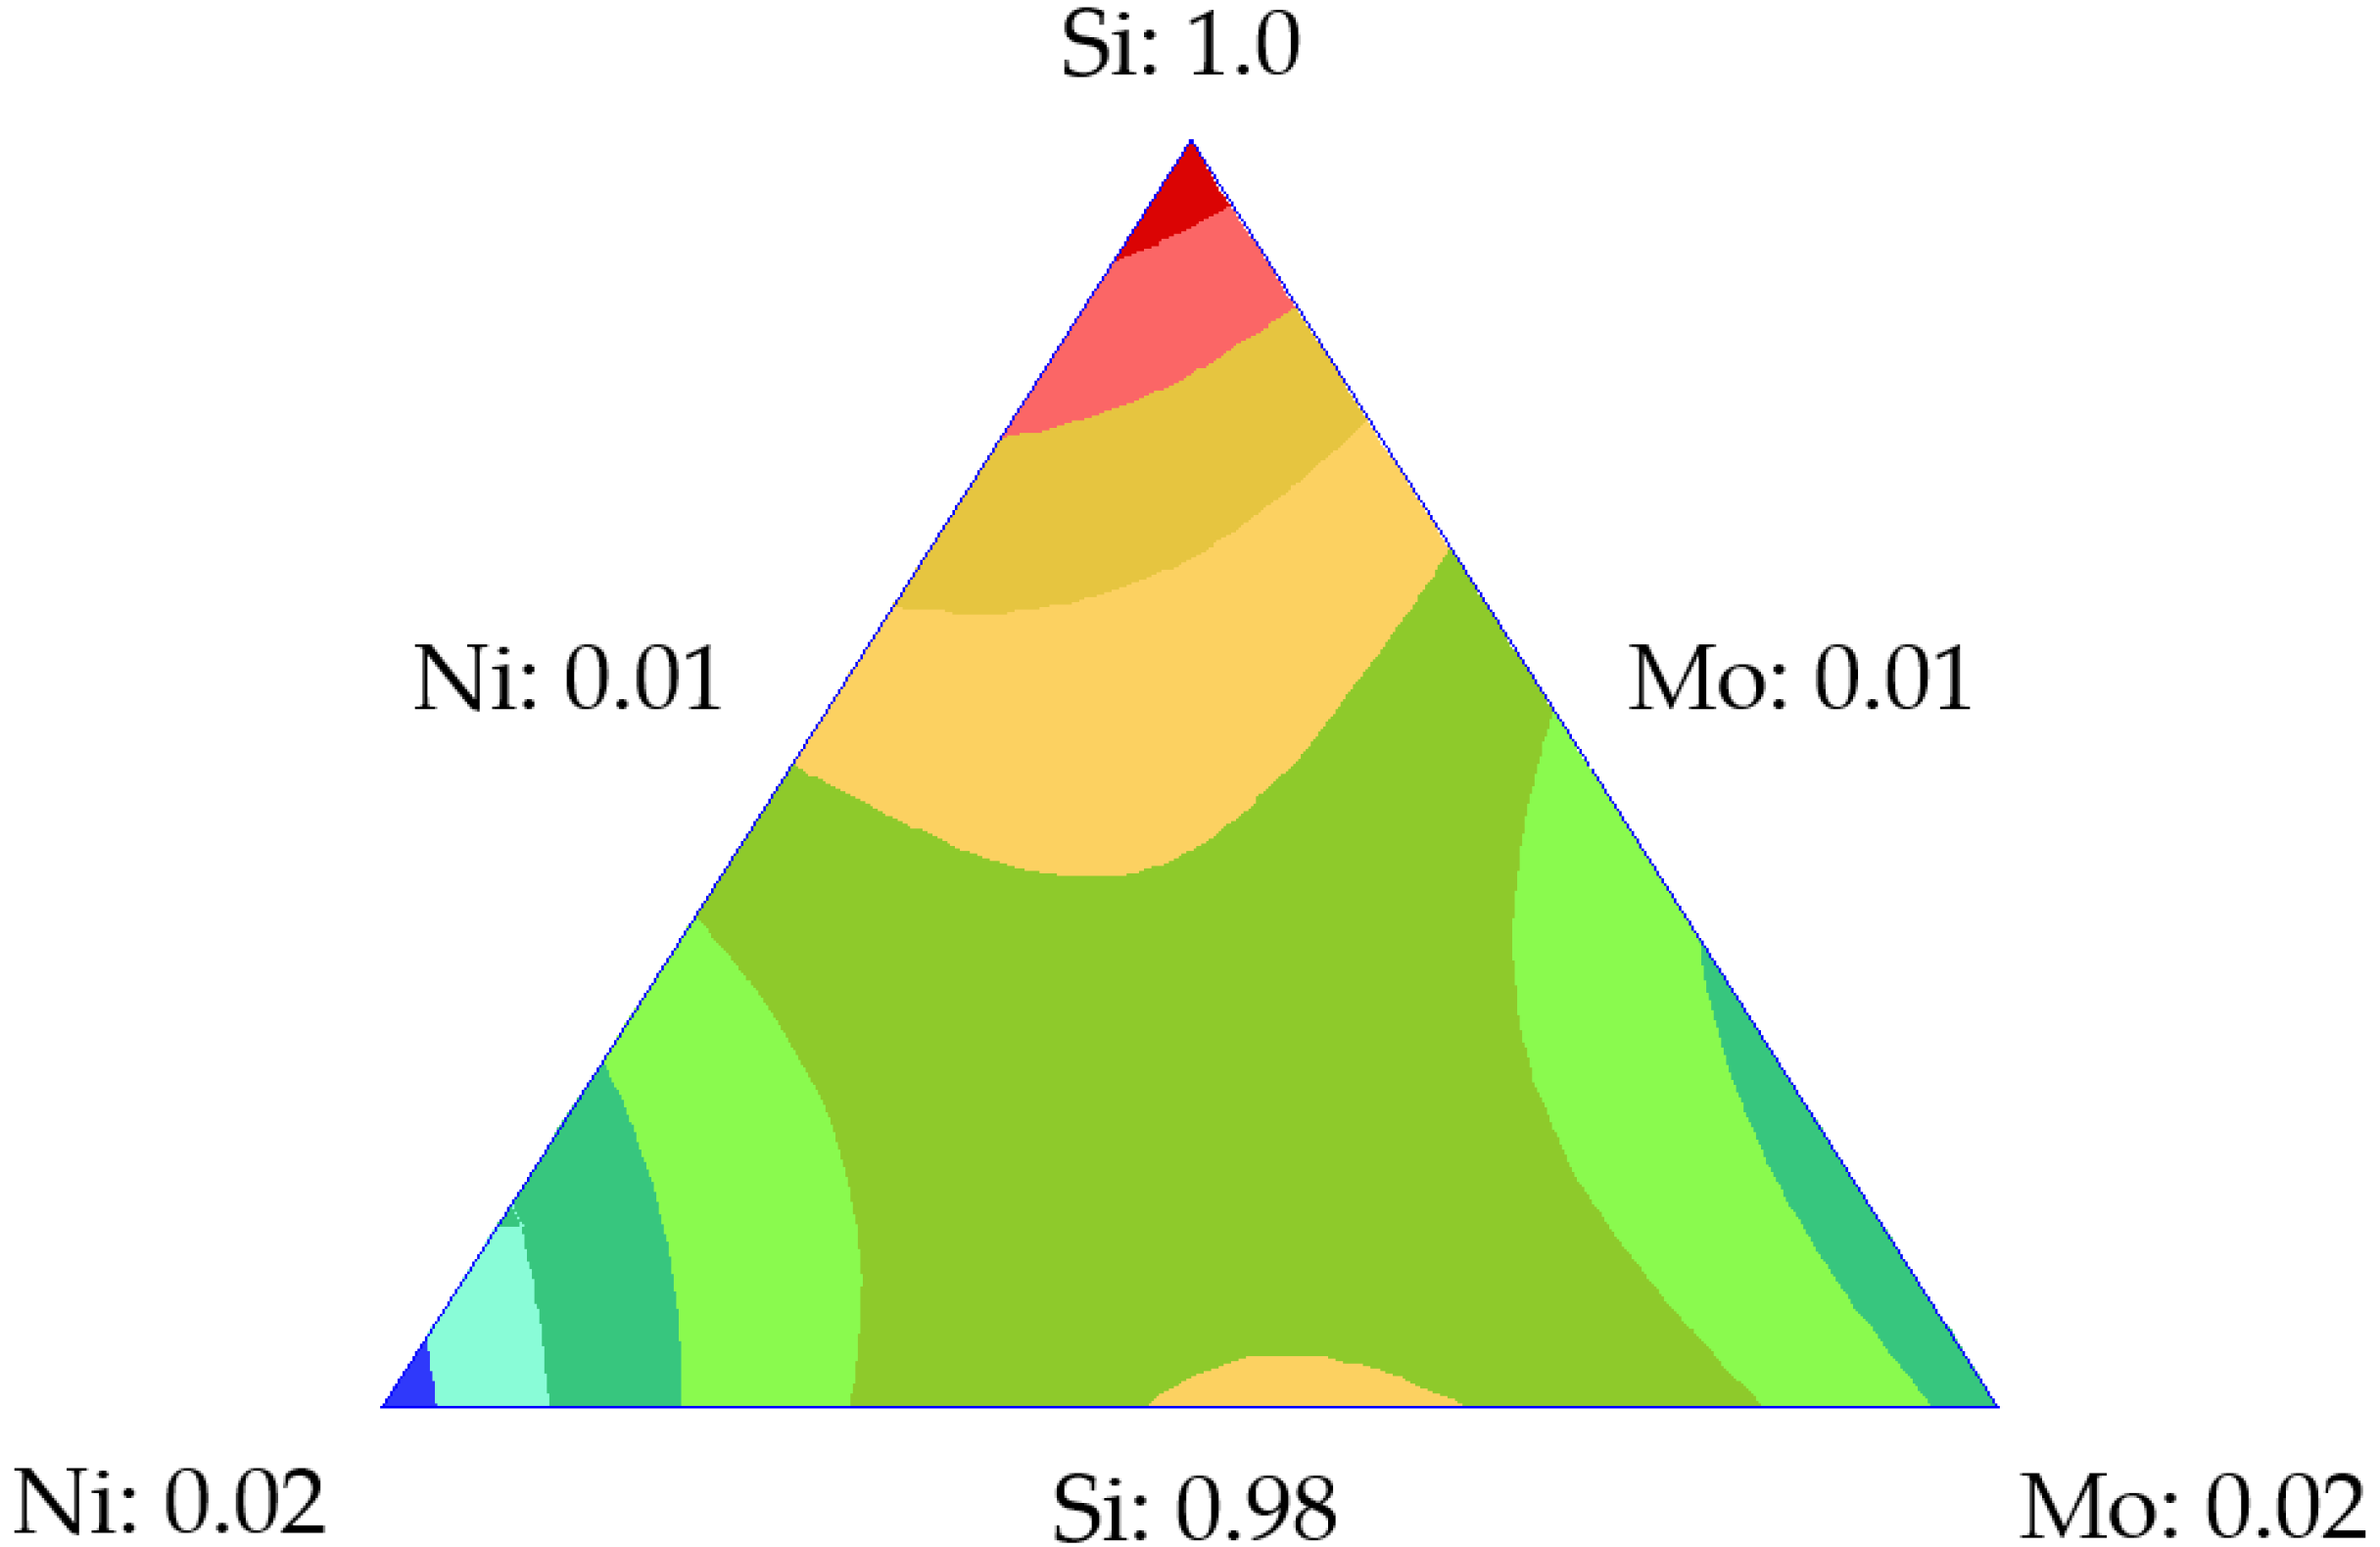
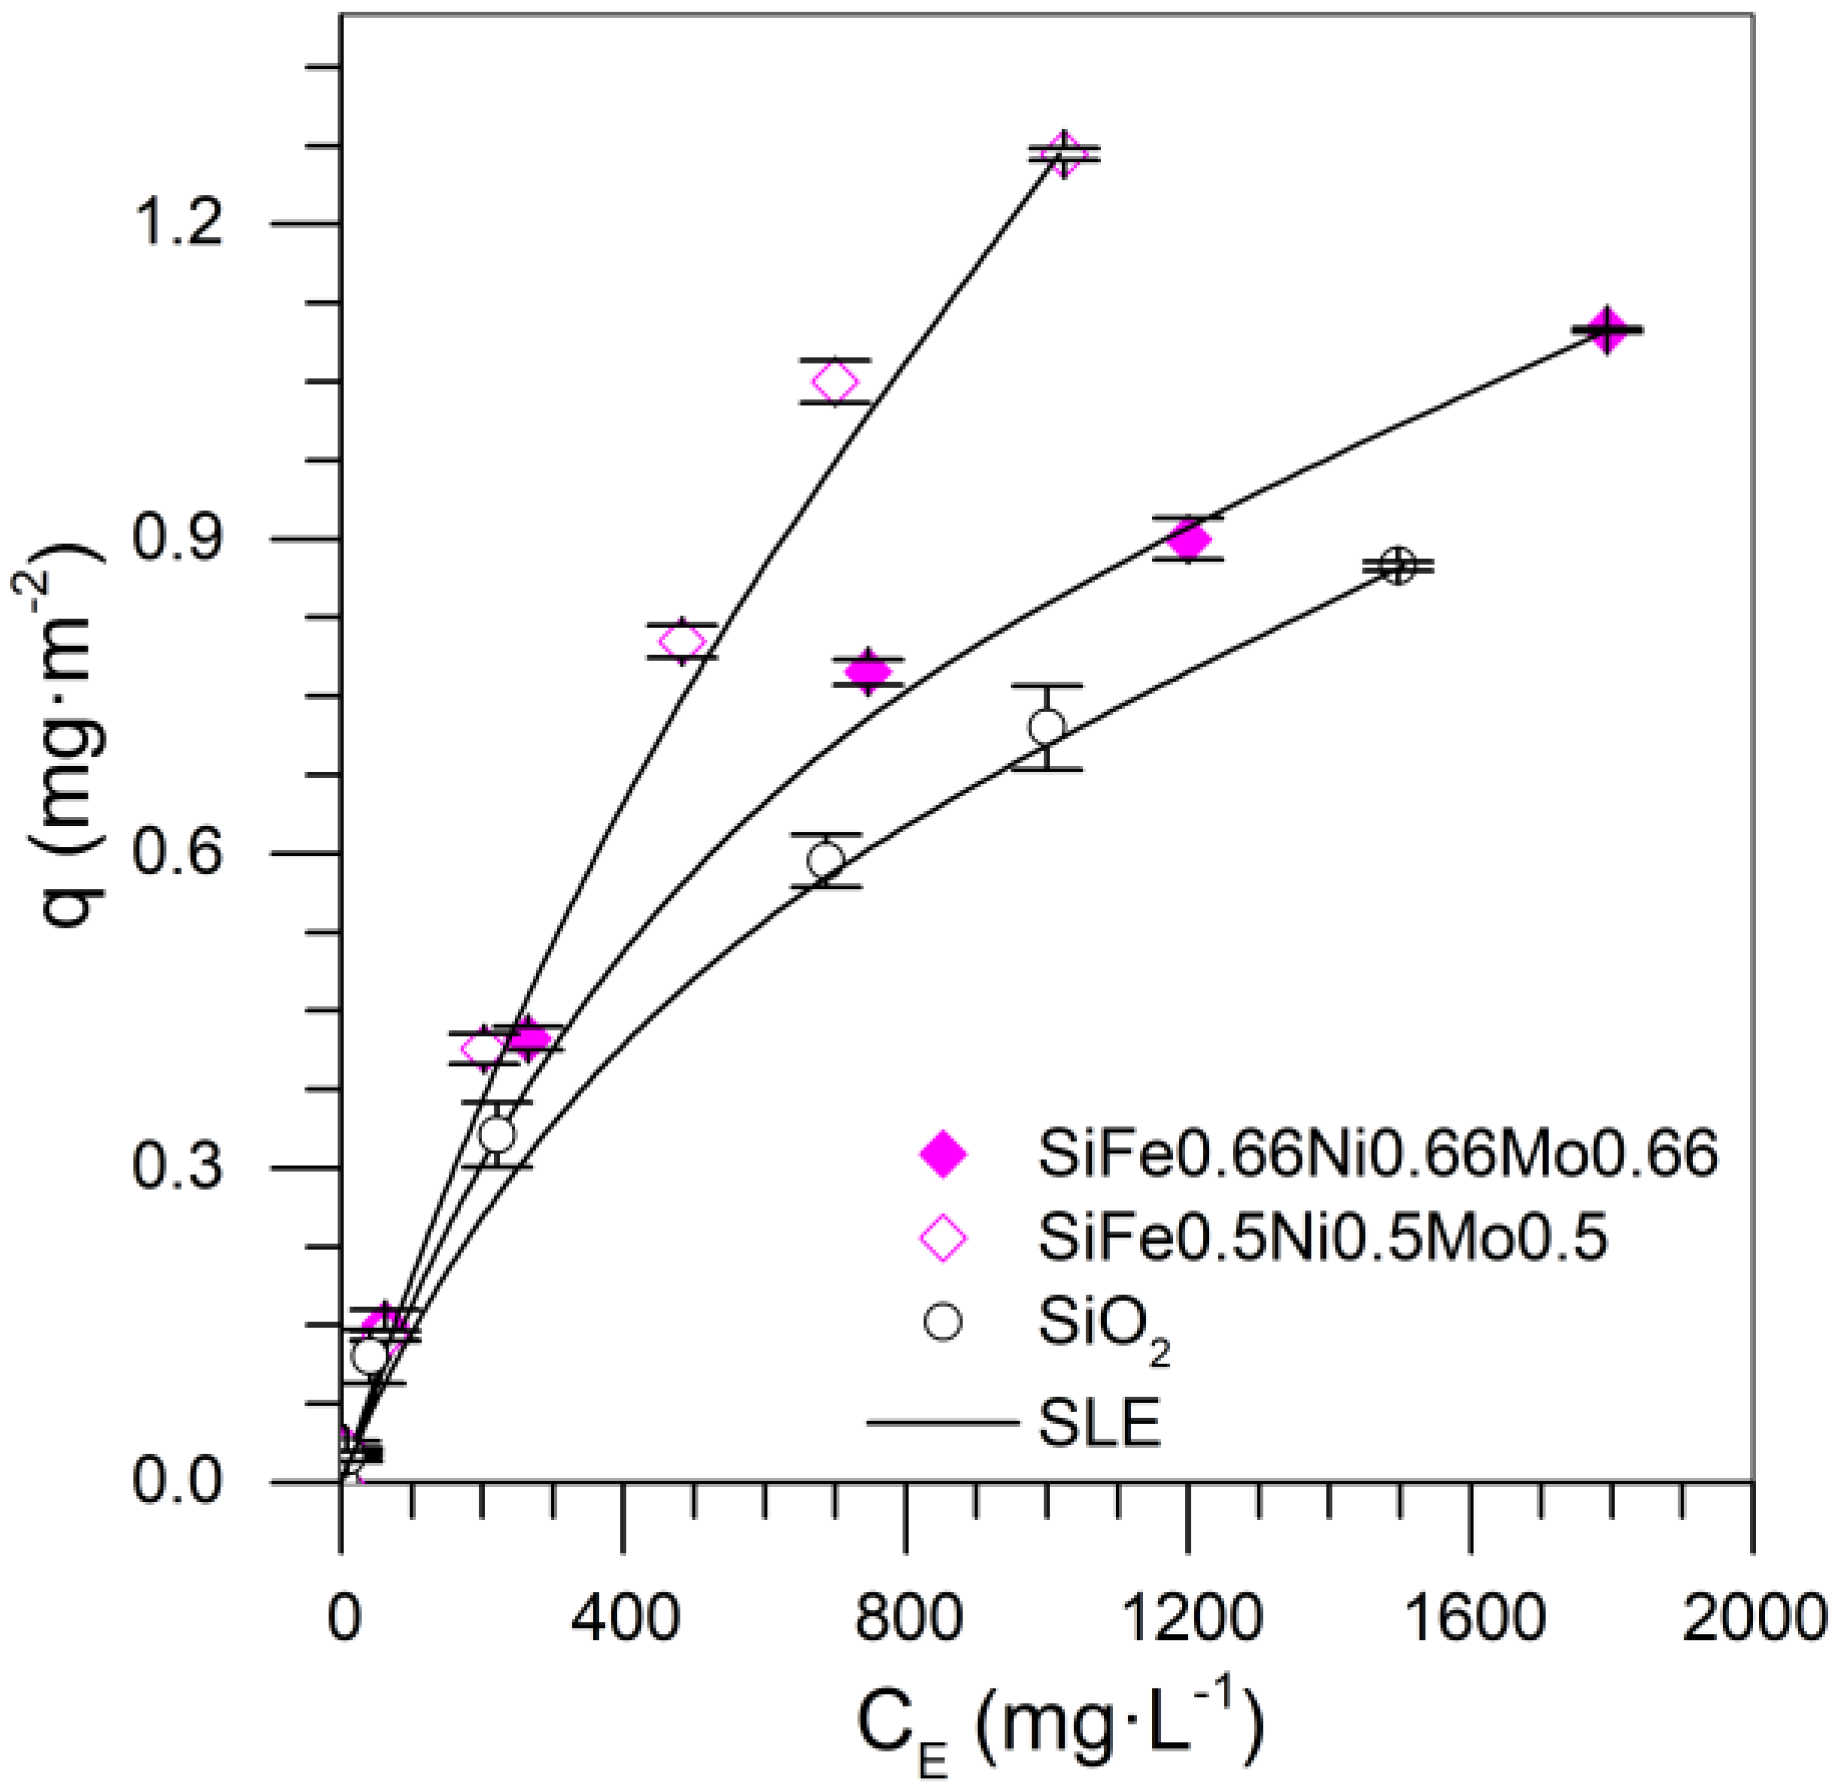
Figure 14 shows the isotherms for the nanoparticles functionalized with three transition elements. The experimental results show that the highest adsorption was obtained for the system with a 0.5% mass fraction of each metal.
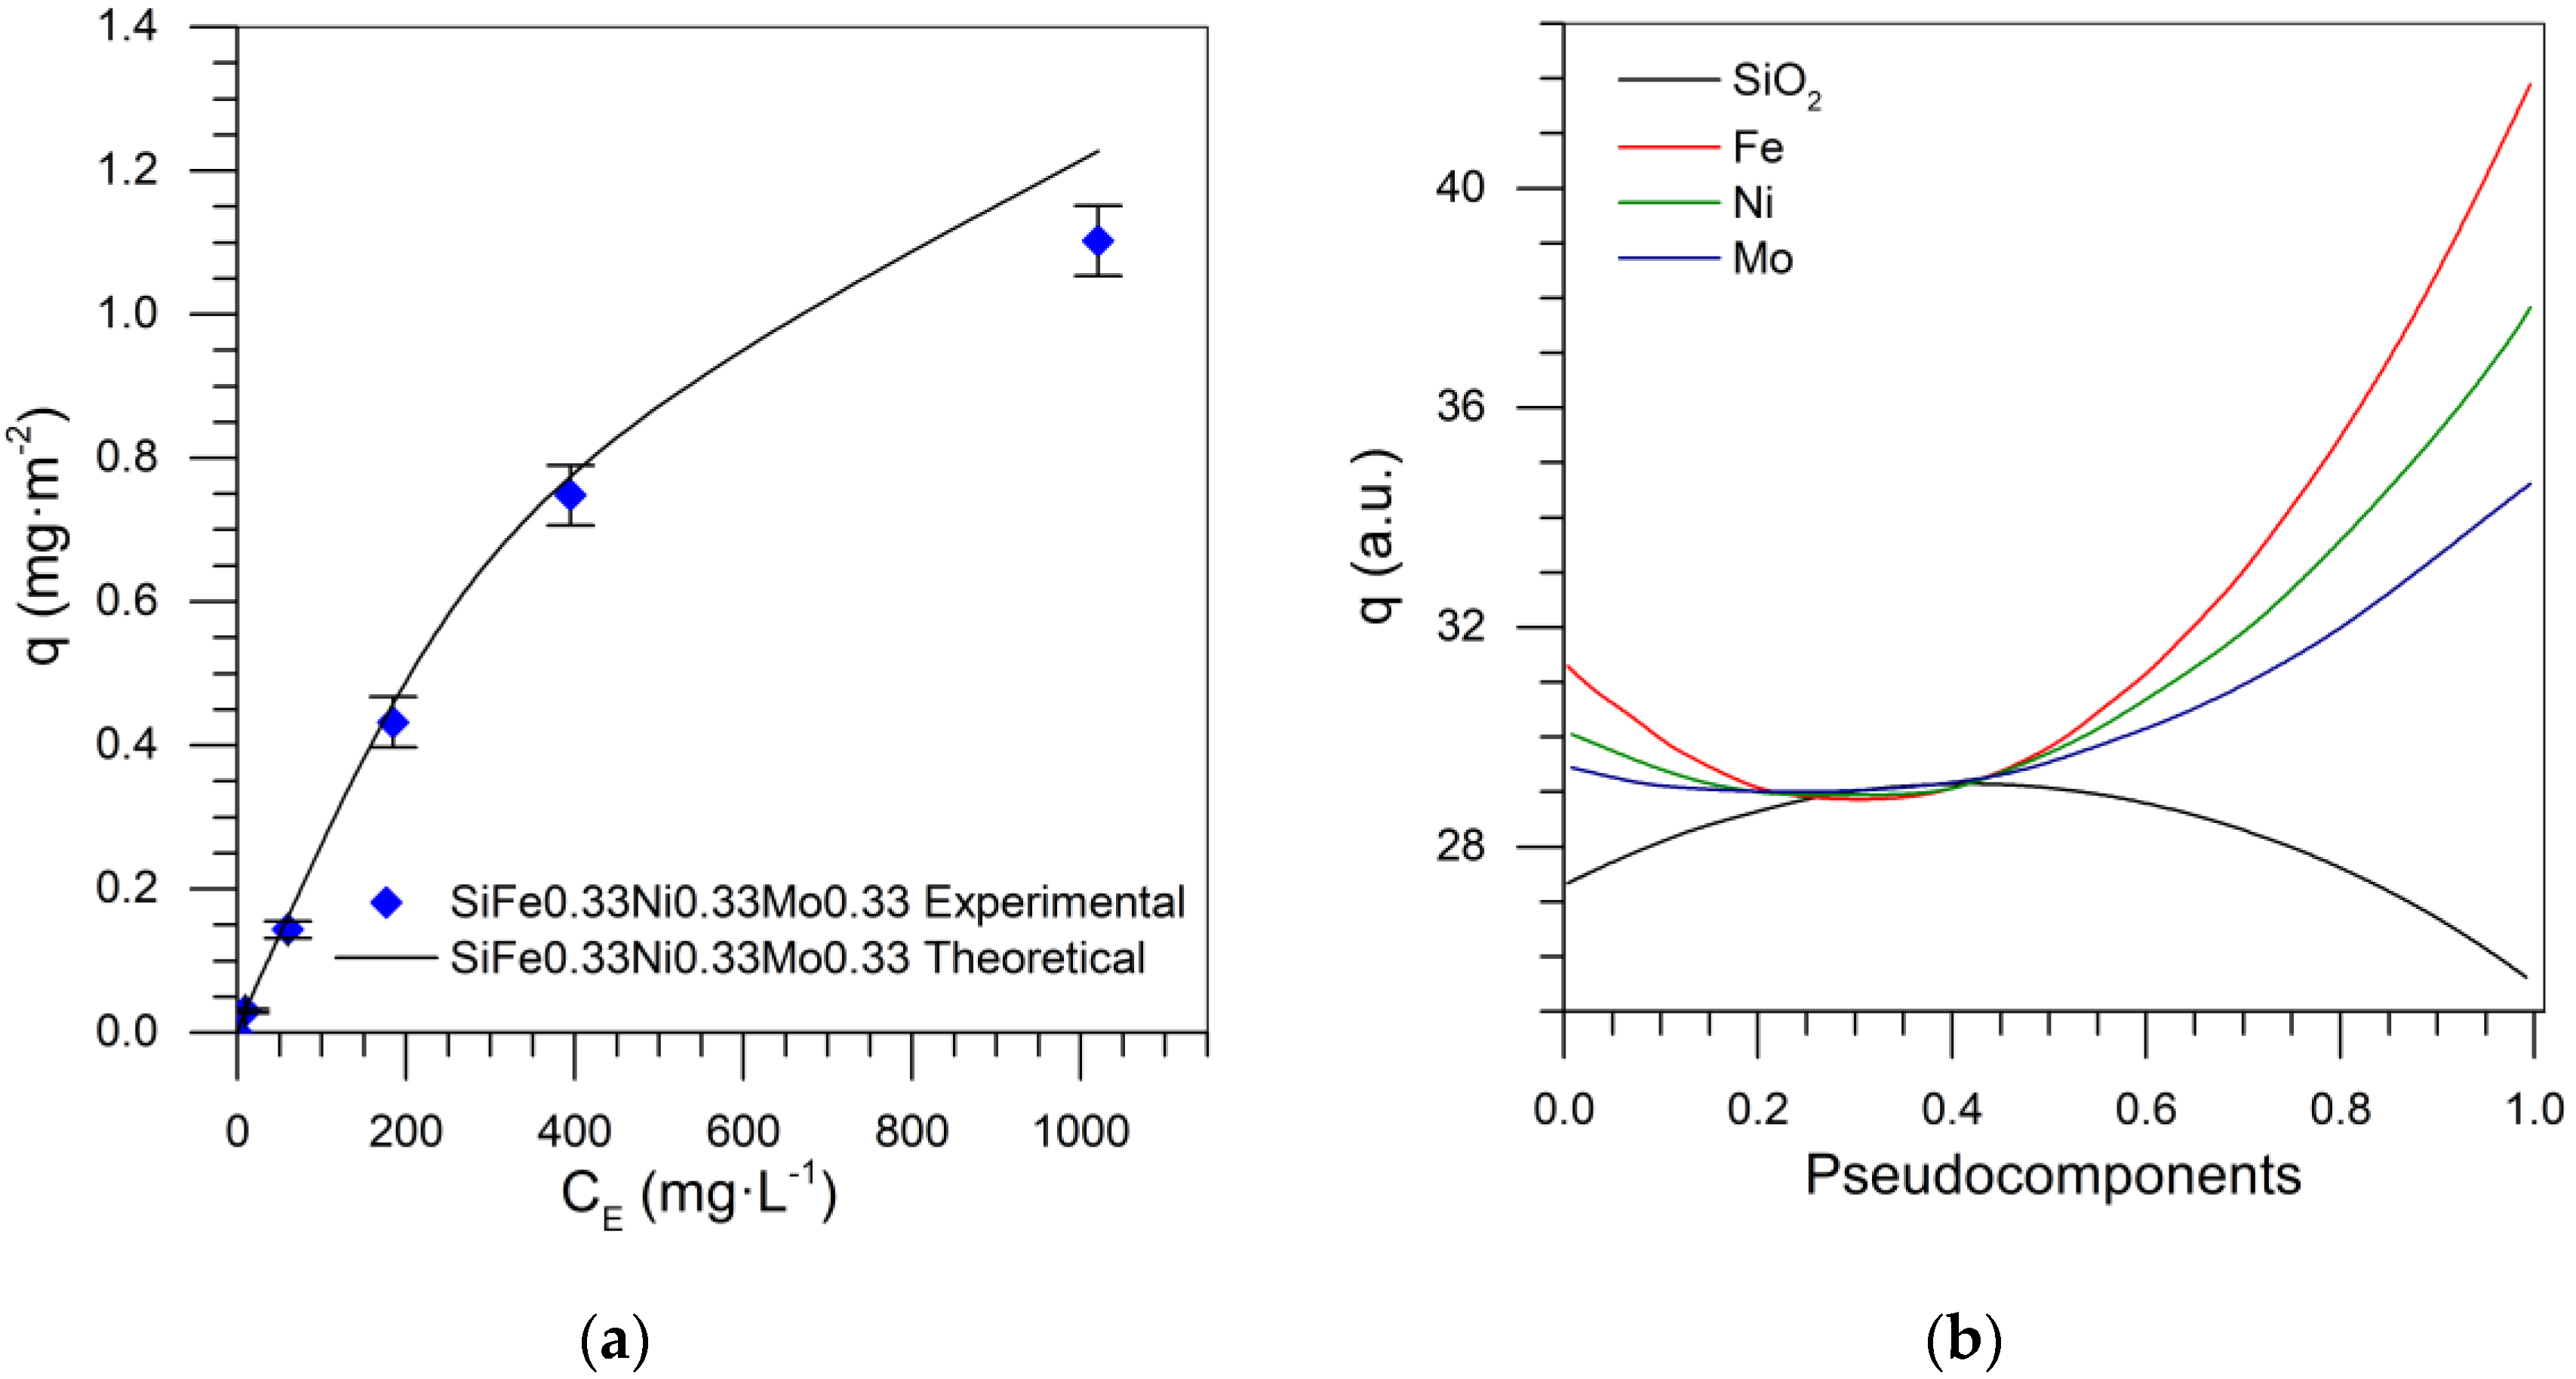
Figure 15a shows the predicted adsorption isotherm for nanoparticles composed of 0.33% mass fraction of each TEO. An RSM of 9.23% was obtained, based on the special cubic model. Once this mixture design is fully developed, the adsorption isotherms can be predicted for any system within the evaluated region. Figure 15b shows the trace plot for the tri-elemental mixture design, with the adsorbed amount as the response variable. This graph shows that the adsorbed amount increased as TEO content increased, and the contribution for maximizing this variable occurred in the order Mo < Ni < Fe.

2.3. Catalytic Oxidation of Asphaltenes

2.3.1. Virgin Asphaltenes and Asphaltenes in the Presence of SiO2

Catalytic thermal oxidation of asphaltenes was performed to determine the effect of the selected nanoparticles using thermogravimetric analysis in an air atmosphere. The amount of adsorbed asphaltene was fixed (0.2 mg·m−2) for the oxidation texts. Each sample had a minimal mass to preclude any mass-transfer limitations [49,50]. Figure 16 shows the rate of mass loss (DTG) as a function of temperature for the virgin asphaltenes and fumed silica nanoparticles containing asphaltenes. The results show that asphaltene mass loss began at temperatures above 400 °C. The maximum mass loss of asphaltenes occurs at the peak of the DTG at approximately 500 °C; however, the complete oxidation of these molecules continued as the temperature increased to almost 600 °C. However, when asphaltenes were adsorbed over SiO2 nanoparticles, oxidation reactions appeared to occur at temperatures near 390 °C, which is 50 °C less than the virgin asphaltenes. This leads to conclude that the silica nanoparticles act as a catalyst for the oxidation process. However, at the end of this test, there were some remaining hydrocarbons associated with coke formation. Deconvolution of the curves suggests asphaltene oxidation occurs in two main temperature regions. The first is below 500 °C, where the alkyl side chains are broken, and polycyclic aromatics hydrocarbons are opened. At higher temperatures, addition reactions of free radicals occur, as silica nanoparticles do not stabilize the cracked compounds, and hence a remaining heavy oil fraction is decomposed until 600 °C.

2.3.2. Asphaltene Oxidation with the Presence of One Transition Element

For practical purposes, and as suggested by the literature, the temperature was divided into three regions: between 180 and 260 °C, corresponding to a low-temperature region (LTR); between 261 and 430 °C, called the mid-temperature region (MTR); and temperatures over 431 °C are within the high-temperature region (HTR). Figure 17a,b shows the rate of mass loss as a function of temperature (DTG) and the conversion of virgin asphaltenes in the presence of mono-elemental nanoparticles with 0.2 mg·m−2 adsorbed asphaltene, respectively. In the presence of the nanoparticles, the asphaltene rate of mass loss curve shifted to the left, confirming that oxidation was occurring at lower temperatures due to the catalytic activity of the materials. Within the LTR, there was no significant asphaltene decomposition in the presence of the nanoparticles, because the curve intensities in this region are low. The maximum peak of the curves was reduced from 500 to 330 °C in all cases, implying that, during MTR, there was a significant mass loss due to asphaltene oxidation [24]. Within this region, the larger aliphatic chains are decomposed, and dissociation of S-C and N-C bonds occurs [51,52]. Finally, in the HTR region, the heaviest components were oxidized at approximately 500 °C.
The functionalized nanoparticles exhibited a substantial mass loss of asphaltenes within the MTR. Nanoparticles with molybdenum oxides present the highest decomposition peak intensity, reflecting the catalytic activity of this TE for oxidizing the heavy oil fractions. The nanoparticles increase the catalytic effect in the order Ni < Fe < Mo. Figure 17b shows the catalytic effect of the nanoparticles, reflected in the degree of conversion at temperatures ≤ 450 °C. However, as mono-elemental nanoparticles are not capable of stabilizing the free radicals produced during the LTR and MTR, addition reactions promote the formation of higher molecular weight compounds that require higher energy for their decomposition. Hence, the conversion degree was lower than for virgin asphaltenes at temperatures above 450 °C. Nanoparticles achieved total decomposition at approximately 620 °C. These results indicate a need to improve mono-elemental catalysts.

2.3.3. Asphaltene Oxidation with the Presence of Two Transition Elements

Bi-elemental functionalized silica nanoparticles using Fe, Ni, and Mo were analyzed to identify the synergistic effect between the different elements during asphaltene oxidation. Figure 18a,b presents a plot of the rate of mass loss and percent conversion, respectively, as a function of temperature in the presence of functionalized nanoparticles with two transition elements. The LTR for nanoparticles with two TEOs on its surface showed a slightly greater rate of mass loss than mono-elemental nanoparticles. The components with lower molecular weight began to decompose during LTR, and the decomposed amount varied between different nanoparticles due to the transfer of electrons from TEOs according to their SiO2 surface charges. The decomposition of asphaltenes over the different nanoparticles continued in MTR, in which a significant mass loss was observed. The SiNi1Mo1 presents the highest intensity peak at approximately 360 °C and shows the second peak of decomposition at 470 °C during HTR, while the other functionalized nanoparticles end the decomposition at temperatures greater than 490 °C. This allows us to conclude that nanoparticles functionalized with Ni and Mo have a synergistic effect in the decomposition of heavy oil fractions [53,54]. As shown in Figure 18b, for a conversion of 30%, the nanoparticles decomposed the asphaltenes between 350 and 360 °C, while the asphaltenes in the absence of nanoparticles achieved this conversion at 430 °C. Thereby, nanoparticles with two TEOs are an optimum nanomaterial to oxidize particles with a high molecular weight, such as the asphaltenes.

2.3.4. Asphaltene Oxidation in the Presence of Three Transition Elements

Fumed silica was functionalized with three TEOs: iron, nickel, and molybdenum. Figure 19a shows the rate for mass loss of the asphaltenes adsorbed over tri-elemental nanoparticles. During LTR, MTR, and HTR, a behavior similar to bi-elemental nanoparticles was found. The nanoparticles functionalized with three transition elements show similar asphaltene oxidizing characteristics. The catalytic effect of Si-Ni-Fe-Mo nanoparticles is observed in the conversion curve in Figure 19b, where 20% conversion was achieved at 340 °C, while the virgin asphaltenes achieved this conversion at 430 °C. This evidence demonstrates that the nanoparticles with three TEO on their surface are appropriate to asphaltene decomposition.

2.3.5. Activation Energy for the Oxidation of Asphaltenes in the Presence and Absence of Nanoparticles

The activation energies ( E a ) were calculated by using the Ozawa–Flynn–Wall (OFW) method with thermal analysis data [55]. The activation energies required to oxidize the virgin asphaltenes, as well as those in the presence of the SiO2 and nanoparticles functionalized with TEO, are presented in Figure 20.
For virgin asphaltenes, the activation energy ( E a ) decreased as the conversion increased; meanwhile, the opposite behavior was observed for functionalized nanoparticles and support, in which the ( E a ) values increased when the conversion degree increment. The difference in ( E a ) values between virgin asphaltenes, SiO2, and functionalized nanoparticles lies in the reaction mechanisms for each asphaltene oxidation system. The catalysis process is affected to the extent that the adsorptive phenomenon occurs stepwise, in which smaller asphaltenes are quickly adsorbed. Asphaltene aggregates are then formatted on the solid–liquid interface on the surface of the nanoparticles. Hence, oxidation reactions begin with the asphaltenes in the inner layer before oxidizing the molecules in the outer layers [56]. In contrast, virgin asphaltene oxidation occurs in one homogeneous step. From Figure 20, it is observed that the presence of SiO2 and functionalized nanoparticles decreased the energy activation values to between 0% and 50% of conversion, much lower than virgin asphaltenes. This allows us to conclude that SiO2 and functionalized nanoparticles favor the catalytic process. In Figure 20a, for values lower than 40%, the activation energy decreased, confirming the synergetic effect of the nanoparticles with two and three TEO, in the following order: SiO2 > SNi2 > SNi1 > SFe1 > SFe2 > SFe1Ni1 > SFe0.66Ni0.66. In this system, the nanoparticles functionalized effectively have a positive influence on activation energies. For the Si-Fe-Mo and Si-Ni-Mo series, presented in Figure 20b,c, respectively, similar behavior was exhibited, and SiFe1Mo1, SiFe0.66Mo0.66, SiNi1Mo1, and SiNi0.66Mo0.66 demonstrated superior performance. The same behavior is presented for nanoparticles with three transition elements, as shown in Figure 20d, in which the activation energy was lower in all conversion ranges compared to SiO2, and lower than virgin asphaltenes for values lower than 60%.
The activation energy can be separated into two general zones according to the DTG of virgin asphaltene decomposition in both zones. The first is from 0% to approximately 50% of conversion, and the second is until 100%, due to the differences obtained for activation energy values. The energy required to convert between 0% and 50% of the asphaltenes was lower in the presence of the nanoparticles than in their absence. However, in the second step, higher activation energy values were observed, indicating that the asphaltene molecules decompose heterogeneously, generating more stable compounds when the reaction goes forward. For example, for SiO2 adsorbed asphaltenes, the activation energy is highest, indicating that this material (SiO2) promotes the carbonization of the asphaltenes, generating highly stable compounds even in oxidizing atmospheres. It is well-known that these transition elements promote the break of C–C and C– heteroatom bonds, favoring cracking, hydrogenation, and isomerization, among other reactions. The principal problem of the catalysts based on these kinds of TEO is the coking of the surface blocking the active sites. As can be seen on the TGA profiles, these coke materials can be eliminated from the surface of the material at approximately 750 °C. In addition, as observed in Figure 20, the bi-elemental nanomaterials using Mo, Fe, and Ni present the lowest activation energy in the entire range of the conversion, from 0% to 100%. These results demonstrate that these hybrid nanomaterials (MoNi or MoFe) have a high resistance to coking or inhibit these kinds of deposits during the oxidation of asphaltenes.

2.3.6. Minimization in Activation Energy of Asphaltenes from SCMD

The activation energy at 20% of conversion, as a representative value for a continuous process, was used to develop a mixture design to determine the combination of pseudo components in which the system is optimized, i.e., the system in which the minimum activation energy is achieved. STAGRAPHICS Centurion XVI software was used for the statistical analysis. The designs for the series conformed with silica nanoparticles combined with two and three transition element oxides. Table 8 shows the coefficients of mixture design, with activation energy as the response variable for the Si-Fe-Ni series.
Figure 21a shows that the presence of iron on the surface minimized the activation energy, while in the presence of nickel and fumed silica, the activation energy increased. Therefore, the TEO iron demonstrated considerable catalytic effect on asphaltenes. The optimum values to minimize the activation energy in this series were Si = 0.98, Fe = 0.013, and Ni = 0.07, and the RMS% was 7.78% in the prediction of activation energy for SiFe0.66Ni0.66 at a conversion of 20%. Supplementary Table S5 shows the coefficients of activation energy mixture design for the Si-Ni-Mo series, and Supplementary Figure S4a shows the trace plot for the activation energy. From this figure, we can conclude that the optimum value in the pseudo component that minimizes the activation energy was 0.54 and 0.4 for molybdenum and nickel, respectively. The optimum point in which the activation energy was minimized was Si = 0.98, Ni = 0.008, and Mo = 0.012, and the RMS% to predict the activation energy value of SiNi0.66Mo0.66 was 16.28%.
Supplementary Table S6 and Supplementary Figure S4b show the coefficients of activation energy mixture design and trace plot for the activation energy for Si-Fe-Mo, respectively. A behavior similar to that of the Si-Ni-Mo series is presented, where the optimum pseudo-components value was 0.55 and 0.42 for Fe and Mo, respectively. The RSM% error to predict the activation energy for 20% of conversion for SiFe0.66Mo0.66 was 4.91%. The mixture design with three TEO and silica for the activation energy is presented in Supplementary Table S7 and Figure 21b. The trace plot shows that the minimum activation energy was achieved when Si = 0.98, Fe = 0.01, Ni = 1.24·10−11, and Mo = 0.0094. From the table, it can be inferred that the three-TEO mixture had a positive effect on response value (activation energy), while some interactions between two metals did not achieve the minimum activation energy.

3. Materials and Methods

3.1. Materials

n-Heptane (99%, Sigma-Aldrich, St. Louis, MO, USA) was used for asphaltenes extraction from crude oil. Distilled water, with a conductivity of 0.5 µS, was used to support the transition elements in the preparation of the nanoparticles. Fumed silica nanoparticles (SiO2) with a diameter of 7 nm (Sigma-Aldrich, St. Louis, MO, USA) were used as adsorbents and as support for the nanoparticles with one, two, and three transition elements (NiFeMo/SiO2). Salt precursors Fe(NO3)3 (Merck GaG, Darmstadt, Germany), Ni(NO3)2 (Merck GaG, Darmstadt, Germany), and (NH4)6Mo7O24 (Merck GaG, Darmstadt, Germany) were used for the functionalization of the fumed silica support to obtain nanoparticles with one, two, and three transition element(s) functionalized on the surface with Ni, Fe, and/or Mo with a mass fraction between 0% and 2%. The preparation of these nanoparticles was carried out by the incipient wetness technique reported in previous publications [16,35]. Nanoparticles are referenced in this paper according to the initial letter of the support and the loading of the corresponding functionalization salt. As an example, fumed silica functionalized with a 1% mass fraction of each salt precursor is labeled as SiNi1Fe1Mo1. The nanoparticles were characterized by using adsorption/desorption isotherms of N2 at −196 °C, using an Autosorb-1 from Quantachrome Instruments (Boynton Beach, FL, USA). Each sample was first degassed at 140 °C, under N2, with a high vacuum. The surface areas were calculated by using the Brunauer–Emmett–Teller method [57,58]. n-C7 asphaltenes were extracted for the crude oil, which was produced from a local reservoir located in the south of Colombia. The crude oil had 5.9 × 10⁵ cP of viscosity and an American Petroleum Institute (API) gravity of 7.2°, both at standard conditions of temperature and pressure of 16 °C and 14.5 psi, respectively. n-C7 asphaltenes were isolated from the crude oil, following a standard procedure detailed in previous publications [16,50]. Heavy oil model solutions were prepared by dilution of a stock solution containing 5000 mg·L−1 of n-C7 asphaltenes in toluene. Initial concentrations ( C 0 ) of n-C7 asphaltenes were established as 100, 500, 1500, 3000, and 5000 mg·L−1.

3.2. Methods

3.2.1. Adsorption Experiments

The colorimetric method was used for determining the amount of n-C7 asphaltenes adsorbed on the selected nanoparticles, using a UV-vis spectrophotometer Genesys 10S (Thermo Scientific, Waltham, MA, USA), following the protocol described previously [37]. Briefly, different solutions of asphaltenes/toluene between 100 and 2000 mg·L−1 were made. Nanoparticle concentration was fixed in 100 mg per 10 mL of the model solution. Then, nanoparticles were added to the model solutions and stirred at 300 rpm for 24 h, to ensure adsorption equilibrium.
The amount of n-C7 asphaltenes adsorbed ( q ) (mg·m−2) was obtained from the mass balance expressed in Equation (1):
q = ( C 0 C E ) M A
where C E (mg·L−1) denotes the n-C7 asphaltenes concentration after adsorption, M (L·g−1) is the ratio of the solution volume to the dry mass of the nanoparticles, and A (m2·g−1) is the measured surface area per unit mass of the nanoparticles. Each run was repeated at least twice to confirm the reproducibility of the experiment. The uncertainty in the absorbance measurements (±0.001 a.u.) introduced a deviation of 0.05 mg·L−1 in the calculation of the residual concentration.

3.2.2. Thermogravimetric Analysis of Asphaltenes

A TGA/DSC analyzer (Q500, TA Instruments, Inc, New Castle, DE, USA) was used for thermogravimetric analysis by heating the nanoparticles containing adsorbed asphaltenes and n-C7 asphaltenes. The uncertainty of the equipment measurements is 0.1%, and the sensitivity is 0.1 µg. The test was performed under a constant airflow rate (100 cm3·min−1), from 25 to 800 °C, at three different heating rates (5, 10, and 20 °C·min−1), and the sample weight was 5 mg. The nanoparticles with asphaltenes selected for TGA experiments have the same amount of asphaltenes per surface area (0.2 mg·m−2). Each experimental run was repeated, at least twice, to confirm the reproducibility of the experiments.

4. Modeling

4.1. Solid–Liquid Equilibrium Model

The SLE Model permits knowledge of valuable information about adsorbate–adsorbate and adsorbate–adsorbent interactions [59]. The model describes the degree to which molecules self-associate around the active sites of the adsorbent surface and the affinity for being adsorbed based on a thermodynamic framework [59]. The adsorption isotherms were thereby described by the SLE model. Equations (2)–(4) describe the model.
C E = ψ H 1 + K ψ exp ( ψ q m A )
  ψ = 1 + 1 + 4 K ξ 2 K
ξ =   q m q ( q m q )
where H (mg·g−1) is Henry´s law constant related to the adsorption affinity, and K (g·g−1) is the reaction constant related to the degree of association of the adsorbate onto the nanoparticle surface. C E (mg·g−1) is the equilibrium concentration of the adsorbate in the solution, A (m2·mg−1) is the measured specific surface area (SBET), q m (mg·m−2) is the maximum adsorption capacity, and q is the amount of asphaltene adsorbed. The correlation coefficient determined the accuracy of the model ( R 2 ) and the root mean square ( R M S ) [60].

4.2. Ozawa–Flynn–Wall (OFW) Model

The isoconversional method to estimate the effective activation energy was used to confirm the catalytic activity of the nanoparticles in n-C7 asphaltene oxidation. The method was developed by Ozawa–Flynn–Wall (OFW) [55,61]. The model considers that the reaction rate at a constant conversion is only a function of temperature [62]. Therefore, in the kinetic and catalytic study of oxidizing virgin asphaltenes and nanoparticles containing asphaltenes, the following equation was employed (Equation (5)):
d α d t = K α exp ( E α R T ) f ( α )
where t is the reaction time (s), α is the reaction conversion, E α is the effective activation energy (kJ·mol−1), T is the reaction temperature (K), R is the ideal gas constant (J mol−1·K−1), K α is the pre-exponential factor (1/s), and f ( α ) is a function that describes asphaltene conversion.
The reaction conversion is equal to ( m 0 m T ) / ( m 0 m f ) , in which m 0 , m t , and m f are the initial mass, the current mass at a given temperature, and the final mass, respectively. Replacing d t = d T / β , where β is the heating rate, in Equation (5), and integrating yields, leads to the following [61]:
g ( α ) = 0 α d α f ( α ) = 0 T K α exp ( E α / R T ) β d T
With the evaluation of activation energy in Equation (4), it can be seen that E α depends on the approximation used to estimate the integral on the right-hand side of the equation. For the OFW, the model Doyle approximation was employed [62,63]:
log ( β ) = log ( K α E α R g ( α ) ) 2.315 0.4567 E α R T
At constant degrees of conversion and different heating rates, a linear relationship is observed when plotting log ( β ) against 1 / T . From the slope of the best-fit linear function, the activation energy was obtained.

4.3. Simplex–Centroid Mixture Design

In a q-component simplex centroid design, the number of distinct points is 2 q 1 . Four different simplex–centroid mixture designs (SCMD) were implemented with the STATGRAPHICS Centurion XVI (StatPoint Technologies, Inc., TX, USA) software. Three of the SCMD were restricted to three components, and one was established as a four-component design. This method allows the determination and/or prediction of some response variable in a wide range of concentrations of each component with just a few experiments [64]. The design of experiments with mixtures also enables the optimum concentration of the selected components of the mixture to maximize or minimize the value of the response variable. In this work, the components of the proposed SCMD were the Si as support and the respective loading of Ni, Fe, and Mo oxides. The amount of each functionalization transition element was established from 0% to 2% in mass fraction, leading to the following constraints (Equations (8)–(11)):
0.98 S i 1.00
0 F e 0.02
0 M o 0.02
0 N i 0.02
However, the construction of the experimental designs with mixtures is based on the sum of the fractions of the individual components of the mixture, which must be equal to 1, as shown in Equation (12):
i = 1 n x i = x 1 + x 2 + x 3 + + x q = 1 , x i 0
where q is the number of components in the mixture, and x is the proportion of each i component. Mixture designs contemplating the incorporation of two of the three selected transition elements would have q = 3 and acquire a value of 4 when the three transition elements are considered.
As the upper limit of the transition elements loading does not meet the restriction postulated in Equation (10), the fraction of each compound had to be normalized as a pseudo-component fraction ( x i ), shown in Equation (13), based on the restrictions of Equations (8)–(11).
x i = x i L i 1 L
where L is the lower limit of each i component [64]. The response variable is modeled through polynomial equations that associate the amount of each component. These are calibrated according to the experimental designs shown in Figure 1. Linear, quadratic, and special cubic models are the most commonly used expressions.
The parameter β i represents the expected response to the pure component i and β i j is the coefficient of the nonadditive blending of components i and j . β i j k and the other similar parameters are defined as follows (Equation (14)):
γ = i = 1 q β i x i + i < j q β i j x i x j + i < j < k q β i j k x i x j x k
where γ is the value of the response variable.
In the design with three transition elements, fifteen points were evaluated with different concentrations of the three transition elements and the support. Equation (14) helps to determine the fraction x i for each component, taking into account that i varies from 1 to 4. The model was validated with the root mean square (RMS). The adjustment variable in STATGRAPHICS was the adsorbed amount expressed in mg·m−2 for the different concentrations evaluated. Fifteen different experimental points were used. Chemical proportions are presented in Table 9 with their nomenclature.

5. Conclusions

The setting for the prediction of surface area as a response variable for nanoparticles functionalized with designs including two and three transition elements was achieved with less than 6% error, providing reliable surface area values of each nanoparticle, using specific parameters, thereby reducing operational costs. Being able to predict the values of the surface area with a potential error of only 6% will contribute enormously to the development of more nanoparticles.
The estimated values adjusted with RSM% less than 10% for predicting fractions SiFe0.5Mo0.5, SiFe0.5Ni0.5, SiNi0.5Mo0.5, and SiFe0.33Ni0.33Mo0.33 are valuable because the results provide the opportunity to optimize the process of evaluation of the adsorptive capacity of asphaltene materials and optimize the operational time. Furthermore, it is possible to identify which chemical elements are essential in the amount adsorbed, that is, which of the TEOs contribute to maximizing the response variable. Generally, in the different designs, it was observed that the contributions of iron and nickel are the most important and that, the greater their presence, the greater the amount adsorbed. However, the synergy between the chemical elements, when they were in an equal percentage on the surface of the support, does not contribute to an increase in the amount adsorbed. Therefore, for the capture of asphaltenes, it is recommended to use iron and nickel nanoparticles that are functionalized onto the surface of the support individually.
The optimum (minimum) activation energy was achieved by using three transition elements, in which the contribution of nickel was minimal. This makes it possible to identify which nanoparticles require more energy for the asphaltene conversion once they are adsorbed onto their surface.
From this systematic study, it was possible to realize that some physical–chemical properties of the hybrid nanomaterials can be predicted by using a simplex–centroid mixture design SCMD as surface area, adsorption capability, and activation energy during the absorption and oxidation of asphaltenes.

Supplementary Materials

The following data are available online at https://0-www-mdpi-com.brum.beds.ac.uk/2073-4344/10/5/569/s1. Figure S1: Simplex–centroid mixture design with (a) fumed silica (SiO2), iron oxide (Fe), and molybdenum oxide (Mo); and (b) fumed silica (SiO2), nickel oxide (Ni), and molybdenum oxide (Mo). Table S1: Parameters of the surface area design for Si-Fe-Mo. Table S2: Parameters of the surface area design for Si-Ni-Mo. Figure S2: Response surface to surface area of design with (a) Si-Fe-Mo and (b) Si-Ni-Mo. Table S3: Parameters of the surface area design for Si-Fe-Ni-Mo. Table S4: Estimated SLE model parameters for SiO2 and functionalized nanoparticles with elements transition. Figure S3: H values from SLE model for silica and functionalized nanoparticles. Table S5: Coefficients to activation energy mixture design for Si-Ni-Mo. Figure S4: Trace plot for activation energy for the series (a) Si-Ni-Mo and (b) Si-Fe-Mo. Table S6: Coefficients to activation energy mixture design for Si-Fe-Mo. Table S7: Coefficients to activation energy mixture design for Si-Fe-Ni-Mo.

Author Contributions

Conceptualization, D.A.-M. and C.A.F.; methodology, D.A.-M., F.B.C. and C.A.F.; formal analysis, A.A.C.-E., D.A.-M., O.E.M., and J.G.; investigation, D.A.-M., O.E.M., S.A. and J.G.; data curation, D.A.-M. and O.E.M.; writing—original draft preparation, D.A.-M.; writing—review and editing, all authors. All authors have read and agreed to the published version of the manuscript.

Funding

The authors would like to acknowledge Fondo Nacional de Financiamiento para la Ciencia, la Tecnología y la Innovación “FRANCISCO JOSÉ DE CALDAS”, Agencia Nacional de Hidrocarburos (ANH), COLCIENCIAS and Universidad Nacional de Colombia, for their support, provided in Agreement 272 of 2017.

Acknowledgments

The authors also acknowledge Grupo de Investigación en Fenómenos de Superficie–Michael Polanyi.

Conflicts of Interest

The authors declare no conflict of interest.

References

  1. Minssieux, L. Paper SPE 37250 Presented at the SPE International Symposium on Oil Field Chemistry Held in Houston; Society of Petroleum Engineers: Houston, TX, USA, 1997; pp. 401–419. [Google Scholar]
  2. Amin, J.S.; Nikooee, E.; Ghatee, M.; Ayatollahi, S.; Alamdari, A.; Sedghamiz, T. Investigating the effect of different asphaltene structures on surface topography and wettability alteration. Appl. Surf. Sci. 2011, 257, 8341–8349. [Google Scholar] [CrossRef]
  3. Groenzin, H.; Mullins, O.C. Asphaltene molecular size and structure. J. Phys. Chem. A 1999, 103, 11237–11245. [Google Scholar] [CrossRef]
  4. Mullins, O.C.; Sheu, E.Y. (Eds.) Plenum Press: Optical interrogation of aromatic moieties in crude oil sand asphaltenes. In Structures and Dynamics of Asphaltenes; Springer: Boston, MA, USA, 1998. [Google Scholar]
  5. Medina, O.E.; Gallego, J.; Rodriíguez, E.; Franco, C.A.; Corteés, F.B. Effect of pressure on the oxidation kinetics of Asphaltenes. Energy Fuels 2019, 33, 10734–10744. [Google Scholar] [CrossRef]
  6. Lawal, K.A.; Vesovic, V.; Boek, E.S. Modeling permeability impairment in porous media due to asphaltene deposition under dynamic conditions. Energy Fuels 2011, 25, 5647–5659. [Google Scholar] [CrossRef]
  7. Montoya, T.; Coral, D.; Franco, C.A.; Nassar, N.N.; Cortés, F.B. A Novel Solid–Liquid Equilibrium Model for Describing the Adsorption of Associating Asphaltene Molecules onto Solid Surfaces Based on the “Chemical Theory”. Energy Fuels 2014, 28, 4963–4975. [Google Scholar] [CrossRef]
  8. Snow, R.H. In-Situ Thermal Upgrading of Bitumen and Shale Oil by RF Electrical Heating. In Proceedings of the SPE Heavy Oil Conference and Exhibition, Kuwait City, Kuwait, 12–14 December 2011. [Google Scholar]
  9. Cavallaro, A.; Galliano, G.; Moore, R.; Mehta, S.; Ursenbach, M.; Zalewski, E.; Pereira, P. In situ upgrading of Llancanelo heavy oil using in situ combustion and a downhole catalyst bed. J. Can. Pet. Technol. 2008, 47, 23. [Google Scholar]
  10. Weissman, J.; Kessler, R.; Sawicki, R.; Belgrave, J.; Laureshen, C.; Mehta, S.; Moore, R.; Ursenbach, M. Down-hole catalytic upgrading of heavy crude oil. Energy Fuels 1996, 10, 883–889. [Google Scholar] [CrossRef]
  11. Medina, O.E.; Olmos, C.; Lopera, S.H.; Cortés, F.B.; Franco, C.A. Nanotechnology Applied to Thermal Enhanced Oil Recovery Processes: A Review. Energies 2019, 12, 4671. [Google Scholar] [CrossRef] [Green Version]
  12. Medina, O.E.; Caro-Vélez, C.; Gallego, J.; Cortés, F.B.; Lopera, S.H.; Franco, C.A. Upgrading of Extra-Heavy Crude Oils by Dispersed Injection of NiO–PdO/CeO2±δ Nanocatalyst-Based Nanofluids in the Steam. Nanomaterials 2019, 9, 1755. [Google Scholar] [CrossRef] [Green Version]
  13. Amin, F. A Study on the Adsorption and Catalytic Oxidation of Asphaltene onto Nanoparticles. J. Pet. Sci. Technol. 2017, 7, 21–29. [Google Scholar]
  14. Medina, O.E.; Gallego, J.; Restrepo, L.G.; Cortés, F.B.; Franco, C.A. Influence of the Ce4+/Ce3+ Redox-couple on the cyclic regeneration for adsorptive and catalytic performance of NiO-PdO/CeO2±δ nanoparticles for n-C7 asphaltene steam gasification. Nanomaterials 2019, 9, 734. [Google Scholar] [CrossRef] [Green Version]
  15. Marei, N.N.; Nassar, N.N.; Hmoudah, M.; El-Qanni, A.; Vitale, G.; Hassan, A. Nanosize effects of NiO nanosorbcats on adsorption and catalytic thermo-oxidative decomposition of vacuum residue asphaltenes. Can. J. Chem. Eng. 2017, 95, 1864–1874. [Google Scholar] [CrossRef]
  16. Nassar, N.N. Asphaltene adsorption onto alumina nanoparticles: Kinetics and thermodynamic studies. Energy Fuels 2010, 24, 4116–4122. [Google Scholar] [CrossRef]
  17. Hashemi, R.; Nassar, N.N.; Pereira-Almao, P. Transport behavior of multimetallic ultradispersed nanoparticles in an oil-sands-packed bed column at a high temperature and pressure. Energy Fuels 2012, 26, 1645–1655. [Google Scholar] [CrossRef]
  18. Marei, N.N.; Nassar, N.N.; Vitale, G.; Hassan, A.; Zurita, M.J.P. Effects of the size of NiO nanoparticles on the catalytic oxidation of Quinolin-65 as an asphaltene model compound. Fuel 2017, 207, 423–437. [Google Scholar] [CrossRef]
  19. Amrollahi Biyouki, A.; Hosseinpour, N.; Nassar, N.N. Pyrolysis and Oxidation of Asphaltene-Born Coke-like Residue Formed onto in Situ Prepared NiO Nanoparticles toward Advanced in Situ Combustion Enhanced Oil Recovery Processes. Energy Fuels 2018, 32, 5033–5044. [Google Scholar] [CrossRef]
  20. Kosari, M.; Golmohammadi, M.; Ahmadi, S.J.; Towfighi, J.; Chenari, A.H. On the catalysis capability of transition metal oxide nanoparticles in upgrading of heavy petroleum residue by supercritical water. J. Supercrit. Fluids 2017, 126, 14–24. [Google Scholar] [CrossRef]
  21. Zhang, X.; Liu, Q.; Fan, Z. Enhanced in situ combustion of heavy crude oil by nickel oxide nanoparticles. Int. J. Energy Res. 2019, 43, 3399–3412. [Google Scholar] [CrossRef]
  22. Mohammadi, M.; Sedighi, M.; Hemati, M. Removal of petroleum asphaltenes by improved activity of NiO nanoparticles supported on green AlPO-5 zeolite: Process optimization and adsorption isotherm. Petroleum 2019, in press. [Google Scholar] [CrossRef]
  23. Nassar, N.N.; Hassan, A.; Pereira-Almao, P. Comparative oxidation of adsorbed asphaltenes onto transition metal oxide nanoparticles. Colloids Surf. A Physicochem. Eng. Asp. 2011, 384, 145–149. [Google Scholar] [CrossRef]
  24. Franco, C.A.; Montoya, T.; Nassar, N.N.; Pereira-Almao, P.; Corteés, F.B. Adsorption and subsequent oxidation of colombian asphaltenes onto nickel and/or palladium oxide supported on fumed silica nanoparticles. Energy Fuels 2013, 27, 7336–7347. [Google Scholar] [CrossRef]
  25. Carbognani, L.; Orea, M.; Fonseca, M. Complex nature of separated solid phases from crude oils. Energy Fuels 1999, 13, 351–358. [Google Scholar] [CrossRef]
  26. Carbognani, L. Effects of iron compounds on the retention of oil polar hydrocarbons over solid sorbents. Pet. Sci. Technol. 2000, 18, 335–360. [Google Scholar] [CrossRef]
  27. Morales, A.; Galiasso, R. Adsorption mechanism of Boscan porphyrins on MoO3’Co3O4and CoMoAl2O3. Fuel 1982, 61, 13–17. [Google Scholar] [CrossRef]
  28. Kazemzadeh, Y.; Eshraghi, S.E.; Kazemi, K.; Sourani, S.; Mehrabi, M.; Ahmadi, Y. Behavior of asphaltene adsorption onto the metal oxide nanoparticle surface and its effect on heavy oil recovery. Ind. Eng. Chem. Res. 2015, 54, 233–239. [Google Scholar] [CrossRef]
  29. Chen, R.; Zhang, Z.; Feng, C.; Hu, K.; Li, M.; Li, Y.; Shimizu, K.; Chen, N.; Sugiura, N. Application of simplex-centroid mixture design in developing and optimizing ceramic adsorbent for As (V) removal from water solution. Microporous Mesoporous Mater. 2010, 131, 115–121. [Google Scholar] [CrossRef]
  30. Cornell, J.A. Experiments with Mixtures: Designs, Models, and the Analysis of Mixture Data; John Wiley & Sons: Hoboken, NJ, USA, 2011; Volume 403. [Google Scholar]
  31. Abdullah, N.; Chin, N.L. Simplex-centroid mixture formulation for optimised composting of kitchen waste. Bioresour. Technol. 2010, 101, 8205–8210. [Google Scholar] [CrossRef] [Green Version]
  32. Yoshiara, L.Y.; Madeira, T.B.; Delaroza, F.; da Silva, J.B.; Ida, E.I. Optimization of soy isoflavone extraction with different solvents using the simplex-centroid mixture design. Int. J. Food Sci. Nutr. 2012, 63, 978–986. [Google Scholar] [CrossRef]
  33. Li, Y.; Zhang, Y.; Wang, M.; Jiang, L.; Sui, X. Simplex-centroid mixture design applied to the aqueous enzymatic extraction of fatty acid-balanced oil from mixed seeds. J. Am. Oil Chem. Soc. 2013, 90, 349–357. [Google Scholar] [CrossRef]
  34. Giraldo, J.; Nassar, N.N.; Benjumea, P.; Pereira-Almao, P.; Corteés, F.B. Modeling and Prediction of Asphaltene Adsorption Isotherms Using Polanyi’s Modified Theory. Energy Fuels 2013, 27, 2908–2914. [Google Scholar] [CrossRef]
  35. Franco, C.A.; Nassar, N.N.; Ruiz, M.A.; Pereira-Almao, P.; Corteés, F.B. Nanoparticles for inhibition of asphaltenes damage: Adsorption study and displacement test on porous media. Energy Fuels 2013, 27, 2899–2907. [Google Scholar] [CrossRef]
  36. Medina, O.E.; Gallego, J.; Arias-Madrid, D.; Cortés, F.B.; Franco, C.A. Optimization of the load of transition metal oxides (Fe2O3, Co3O4, NiO and/or PdO) onto CeO2 nanoparticles in catalytic steam decomposition of n-C7 asphaltenes at low temperatures. Nanomaterials 2019, 9, 401. [Google Scholar] [CrossRef] [PubMed] [Green Version]
  37. Medina Erao, O.E.; Gallego, J.; Olmos, C.M.; Chen, X.; Cortés, F.B.; Franco, C.A. Effect of Multifunctional Nanocatalysts on n-C7 Asphaltene Adsorption and Subsequent Oxidation under High Pressure Conditions. Energy Fuels 2020, in press. [Google Scholar] [CrossRef]
  38. Alamolhoda, S.; Vitale, G.; Hassan, A.; Nassar, N.N.; Pereira Almao, P. Development and characterization of novel combinations of Ce-Ni-MFI solids for water gas shift reaction. Can. J. Chem. Eng. 2019, 97, 140–151. [Google Scholar] [CrossRef] [Green Version]
  39. Cortés, F.B.; Chejne, F.; Carrasco-Marín, F.; Pérez-Cadenas, A.F.; Moreno-Castilla, C. Water sorption on silica-and zeolite-supported hygroscopic salts for cooling system applications. Energy Convers. Manag. 2012, 53, 219–223. [Google Scholar] [CrossRef]
  40. Xing, C.; Hilts, R.; Shaw, J. Sorption of Athabasca vacuum residue constituents on synthetic mineral and process equipment surfaces from mixtures with pentane. Energy Fuels 2010, 24, 2500–2513. [Google Scholar] [CrossRef]
  41. Cao, A.; Lu, R.; Veser, G. Stabilizing metal nanoparticles for heterogeneous catalysis. Phys. Chem. Chem. Phys. 2010, 12, 13499–13510. [Google Scholar] [CrossRef]
  42. Allen, K.M.; Auyeung, N.; Rahmatian, N.; Klausner, J.F.; Coker, E.N. Cobalt ferrite in YSZ for use as reactive material in solar thermochemical water and carbon dioxide splitting, part II: Kinetic modeling. JOM 2013, 65, 1682–1693. [Google Scholar] [CrossRef]
  43. Sun, Z.-H.; Li, D.; Ma, H.-X.; Tian, P.-P.; Li, X.-K.; Li, W.-H.; Zhu, Y.-H. Characterization of asphaltene isolated from low-temperature coal tar. Fuel Process. Technol. 2015, 138, 413–418. [Google Scholar] [CrossRef]
  44. Calemma, V.; Iwanski, P.; Nali, M.; Scotti, R.; Montanari, L. Structural characterization of asphaltenes of different origins. Energy Fuels 1995, 9, 225–230. [Google Scholar] [CrossRef]
  45. Ascanius, B.E.; Garcia, D.M.; Andersen, S.I. Analysis of asphaltenes subfractionated by N-methyl-2-pyrrolidone. Energy Fuels 2004, 18, 1827–1831. [Google Scholar] [CrossRef]
  46. Adams, J.J. Asphaltene adsorption, a literature review. Energy Fuels 2014, 28, 2831–2856. [Google Scholar] [CrossRef]
  47. Pal, S. Pyridine: A Useful Ligand in Transition Metal Complexes; IntechOpen: London, UK, 2018. [Google Scholar]
  48. Nassar, N.N.; Franco, C.A.; Montoya, T.; Cortés, F.B.; Hassan, A. Effect of oxide support on Ni–Pd bimetallic nanocatalysts for steam gasification of n-C7 asphaltenes. Fuel 2015, 156, 110–120. [Google Scholar] [CrossRef]
  49. Nassar, N.N.; Hassan, A.; Pereira-Almao, P. Effect of the particle size on asphaltene adsorption and catalytic oxidation onto alumina particles. Energy Fuels 2011, 25, 3961–3965. [Google Scholar] [CrossRef]
  50. Nassar, N.N.; Hassan, A.; Pereira-Almao, P. Application of nanotechnology for heavy oil upgrading: Catalytic steam gasification/cracking of asphaltenes. Energy Fuels 2011, 25, 1566–1570. [Google Scholar] [CrossRef]
  51. Nassar, N.N.; Hassan, A.; Pereira-Almao, P. Clarifying the catalytic role of NiO nanoparticles in the oxidation of asphaltenes. Appl. Catal. A Gen. 2013, 462, 116–120. [Google Scholar] [CrossRef]
  52. Tarboush, B.J.A.; Husein, M.M. Inferring the role of NiO nanoparticles from the thermal behavior of virgin and adsorbed hydrocarbons. Fuel 2015, 147, 53–61. [Google Scholar] [CrossRef]
  53. Tarboush, B.J.A.; Husein, M.M. Adsorption of asphaltenes from heavy oil onto in situ prepared NiO nanoparticles. J. Colloid Interface Sci. 2012, 378, 64–69. [Google Scholar] [CrossRef]
  54. Tarboush, B.J.A.; Husein, M.M. Oxidation of asphaltenes adsorbed onto NiO nanoparticles. Appl. Catal. A Gen. 2012, 445, 166–171. [Google Scholar] [CrossRef]
  55. Flynn, J.H.; Wall, L.A. A quick, direct method for the determination of activation energy from thermogravimetric data. J. Polym. Sci. Part B Polym. Lett. 1966, 4, 323–328. [Google Scholar] [CrossRef]
  56. Husein, M.M.; Alkhaldi, S.J. In situ preparation of alumina nanoparticles in heavy oil and their thermal cracking performance. Energy Fuels 2014, 28, 6563–6569. [Google Scholar] [CrossRef]
  57. Sing, K.S.; Williams, R.T. Physisorption hysteresis loops and the characterization of nanoporous materials. Adsorpt. Sci. Technol. 2004, 22, 773–782. [Google Scholar] [CrossRef]
  58. Brunauer, S.E.; Emmett, P.H.; Teller, E.J. Adsorption of gases in multimolecular layers. Am. Chem. 1938, 60, 309–319. [Google Scholar] [CrossRef]
  59. Montgomery, D.C.; Runger, G.C. Applied Statistics and Probability for Engineers; John Wiley & Sons: Hoboken, NJ, USA, 2010. [Google Scholar]
  60. Ozawa, T. A new method of analyzing thermogravimetric data. Bull. Chem. Soc. Jpn. 1965, 38, 1881–1886. [Google Scholar] [CrossRef] [Green Version]
  61. Doyle, C. Kinetic analysis of thermogravimetric data. J. Appl. Polym. Sci. 1961, 5, 285–292. [Google Scholar] [CrossRef]
  62. Doyle, C.D. Series approximations to the equation of thermogravimetric data. Nature 1965, 207, 290–291. [Google Scholar] [CrossRef]
  63. Mandal, N.; Pal, M. Optimum mixture design using deficiency criterion. Commun. Stat. Theory Methods 2008, 37, 1565–1575. [Google Scholar] [CrossRef]
  64. Statgraphics Centurion, X. Statpoint technologies. INC Version 2009, 16, 17. [Google Scholar]
Figure 1. Simplex–centroid mixture design with (a) fumed silica (SiO2), iron oxide (Fe2O3), and nickel oxide (NiO); and (b) fumed silica (SiO2), iron oxide (Fe2O3), nickel oxide (NiO), and molybdenum oxide (MoO3).
Catalysts 10 00569 g001
Figure 2. Response surface for the surface area of the design using Si-Fe-Ni.
Catalysts 10 00569 g002
Figure 3. Asphaltene adsorption isotherms for nanoparticles (a) SiO2, SiFe1, SiFe2, (b) SiO2, SiNi1, SiNi2, and (c) Si, SiFe1Ni1, SiFe0.66Ni0.66 at 25 °C. The symbols are experimental data, and the solid lines are from the SLE model.
Catalysts 10 00569 g003
Figure 4. Illustration of general σ-bonding and π-back bonding between a transition metal and a pyridine moiety of asphaltenes. This strongly suggests that, on the nanoparticle support, asphaltenes are adsorbed sideways and normal or at an angle to the surface. Taken from Pal et al. [47].
Catalysts 10 00569 g004
Figure 5. Estimated SLE model parameters and effective activation energy values for SiO2 and functionalized nanoparticles.
Catalysts 10 00569 g005
Figure 6. (a) Asphaltene sorption isotherm at 25 °C for SiFe0.5Ni0.5, experimental and theoretical data, and (b) trace plot at 100 mg·L-1 for Si-Fe-Ni mixture design.
Catalysts 10 00569 g006
Figure 7. Response surface of the amount of adsorbed asphaltene for the Si-Fe-Ni mixture design at a concentration of 100 mg·L−1.
Catalysts 10 00569 g007
Figure 8. Asphaltene adsorption isotherms for nanoparticles (a) SiO2, SiMo1, SiMo2, (b) SiO2, SiFe1Mo1, and SiFe0.66Mo0.66 at 25 °C. The symbols are experimental data, and the solid lines are SLE model data.
Catalysts 10 00569 g008
Figure 9. (a) Asphaltene sorption isotherms at 25 °C with SiFe0.5Mo0.5 with experimental and theoretical data and (b) trace plot at 100 mg·L−1 for Si-Fe-Mo mixture design.
Catalysts 10 00569 g009
Figure 10. Response surface of adsorption for the mixture design of Si-Fe-Mo at 100 mg·L−1.
Catalysts 10 00569 g010
Figure 11. Asphaltene adsorption isotherms for nanoparticles SiO2, SiNi1Mo1, and SiNi0.66Mo0.66 at 25 °C. The symbols are experimental data, and the solid lines are from the SLE model.
Catalysts 10 00569 g011
Figure 12. (a) Asphaltene sorption isotherms of SiNi0.5Mo0.5 at 25 °C, using experimental and theoretical data and (b) trace plot at 100 mg·L−1 of asphaltenes for the Si-Ni-Mo mixture.
Catalysts 10 00569 g012
Figure 13. Response surface of adsorption for the Si-Ni-Mo mixture at 100 mg·L−1 and 25 ℃.
Catalysts 10 00569 g013
Figure 14. Asphaltene adsorption isotherms for nanoparticles SiO2, SiFe0.5Ni0.5Mo0.5, and SiFe0.66Ni0.66Mo0.66 at 25 °C. The symbols are experimental data, and the solid lines are from the SLE model.
Catalysts 10 00569 g014
Figure 15. (a) Asphaltene sorption isotherms at 25 °C with SiFe0.0.33Ni0.33Mo0.33, experimental and SLE adjusted data, and (b) trace plot at 100 mg·L−1 for Si-Fe-Ni-Mo mixture design.
Catalysts 10 00569 g015
Figure 16. Rate of mass loss as a function of temperature (DTG) and in an air atmosphere of virgin asphaltenes and asphaltenes adsorbed over silica nanoparticles. The heating rate was 10 °C·min−1.
Catalysts 10 00569 g016
Figure 17. (a) The rate of mass loss as a function of temperature (DTG) and (b) conversion of virgin asphaltenes in the presence of one transition element. Adsorbed asphaltenes were present at 0.2 mg·m−2; heating rate is 10 °C·min−1.
Catalysts 10 00569 g017
Figure 18. (a) Plot of the rate of mass loss as a function of temperature (DTG) and (b) conversion of virgin asphaltenes and those in the presence of two transition elements. Asphaltenes adsorbed were present at 0.2 mg·m−2 and heating rate of 10 °C·min−1.
Catalysts 10 00569 g018
Figure 19. (a) Plot of the rate of mass loss as a function of temperature (DTG) and (b) conversion for virgin asphaltenes in the presence of three transition elements. Asphaltenes adsorbed amount of 0.2 mg·m−2 and heating rate of 10 °C·min−1.
Catalysts 10 00569 g019
Figure 20. Activation energies obtained by the OFW method, evaluated for the oxidation of virgin asphaltenes and asphaltenes in the presence of SiO2 and nanoparticles functionalized with transition elements. (a) The series Si-Fe-Ni, (b) Si-Fe-Mo, (c) Si-Ni-Mo, and (d) Si-Fe-Ni-Mo.
Catalysts 10 00569 g020
Figure 21. Trace plot for the activation energy for the series (a) Si-Fe-Ni and (b) Si-Fe-Ni-Mo at 20% of conversion.
Catalysts 10 00569 g021
Table 1. Surface area of SiO2 and nanoparticles functionalized with different combinations of the transition elements.
MaterialSBET ± 0.01 m2·g−1
SiO2380.0
SiFe1312.4
SiFe2237.6
SiNi1278.3
SiNi2228.2
SiMo1295.4
SiMo2279.9
SiFe0.5Ni0.5338.1
SiNi0.5Mo0.5355.6
SiFe0.5Mo0.5274.9
SiFe1Ni1297.8
SiNi1Mo1283.2
SiFe1Mo1322.0
SiFe0.66Ni0.66314.8
SiNi0.66Mo0.66272.7
SiFe0.66Mo0.66312.8
SiFe0.66Ni0.66Mo0.66291.0
SiFe0.5Ni0.5Mo0.5314.0
Table 2. Parameters of the surface area design for the Si-Fe-Ni series.
β 1 β 2 β 3 β 12 β 13 β 23 β 123
380.00237.61228.2614.52−102.96259.7373.38
Table 3. ANOVA table of 100 mg·L−1 for Si-Fe-Ni mixture design.
SourceSum of SquaresDegrees of FreedomMean SquareF Ratiop-Value
Cubic special model0.299618130.023047512.460.2156
Total error0.00184910.0018493--
Total (corr)0.30146714---
R-square = 99.3866%
R-square (adj) = 91.4117%
Standard error = 0.043004
Average absolute error = 0.0074653
Table 4. Coefficients of the Special Cubic Model for Si-Fe-Ni mixture design.
Asphaltene Initial Concentration (mg·L−1) β 1 β 2 β 3 β 12 β 13 β 23 β 123
1000.020.040.04−0.010.00−0.04−0.02
5000.120.200.19−0.070.00−0.19−0.07
15000.330.590.55−0.29−0.09−0.610.95
30000.611.131.08−0.24−0.06−1.461.56
50000.891.661.69−0.270.47−1.37−0.83
Table 5. Coefficients of the Special Cubic Model for mixture design with Si-Fe-Mo.
Asphaltene Initial Concentration (mg·L−1) β 1 β 2 β 3 β 12 β 13 β 23 β 123
100 0.030.040.03−0.010.01−0.03−0.01
500 0.120.190.16−0.010.04−0.14−0.06
1500 0.340.520.490.090.06−0.27−0.15
3000 0.611.060.890.110.08−1.05−0.21
5000 0.891.591.230.070.22−1.38−0.36
Table 6. Coefficients of the Special Cubic Model for mixture design using Si-Ni-Mo nanomaterial for asphaltene adsorption.
Asphaltene Initial Concentration (mg·L−1) β 1 β 2 β 3 β 12 β 13 β 23 β 123
100 0.030.040.03−0.010.01−0.020.004
500 0.120.190.160.010.04−0.090.16
1500 0.340.520.49−0.090.06−0.281.05
3000 0.611.060.89−0.060.08−0.563.31
5000 0.891.591.230.470.22−0.494.06
Table 7. Coefficients of the Special Cubic Model for the Si-Fe-Ni-Mo mixture.
Asphaltene Initial Concentration (mg·L−1) β 1 β 2 β 3 β 4 β 12 β 13 β 14
100 0.030.040.040.03−0.02−0.010.00
500 0.120.200.190.16−0.070.000.05
1500 0.340.520.550.50−0.13−0.080.07
3000 0.611.131.080.49−0.21−0.030.91
5000 0.891.591.691.23−0.010.59−3.66
Asphaltene Initial Concentration (mg·L−1) β 23 β 24 β 34 β 123 β 124 β 134 β 234
100 0.340.520.550.50−0.13−0.080.07
500 0.611.131.080.49−0.21−0.030.91
1500 0.891.591.691.23−0.010.59−3.66
3000 0.891.591.691.23−0.010.59−3.66
5000 −1.11−1.26−0.37−4.408.7912.66−5.05
Table 8. Coefficients of activation energy mixture design for Si-Fe-Ni.
Effective Activation Energy β 1 β 2 β 3 β 12 β 13 β 23 β 123
20%124.54112.82129.41−46.529.38−74.06124.54
Table 9. Chemical proportions and nomenclature of the points in the SCMD.
Chemical ProportionsNomenclature
x 1 x 2 x 3 x 4
(SiO2)(Fe)(Ni)(Mo)
1.00000.00000.00000.0000SiO2
0.99000.01000.00000.0000SiFe1
0.98000.02000.00000.0000SiFe2
0.99000.00000.01000.0000SiNi1
0.98000.00000.02000.0000SiNi2
0.99000.00000.00000.0100SiMo1
0.98000.00000.00000.0200SiMo2
0.98000.01000.01000.0000SiFe1Ni1
0.98000.00000.01000.0100SiNi1Mo1
0.98000.01000.00000.0100SiFe1Mo1
0.98680.00660.00660.0000SiFe0.66Ni0.66
0.98680.00000.00660.0066SiNi0.66Mo0.66
0.98680.00660.00000.0066SiFe0.66Mo0.66
0.98020.00660.00660.0066SiFe0.66Ni0.66Mo0.66
0.99010.00500.00500.0050SiFe0.5Ni0.5Mo0.5

