Article

A Promising Catalyst for the Dehydrogenation of Perhydro-Dibenzyltoluene: Pt/Al2O3 Prepared by Supercritical CO2 Deposition

1
HySA Infrastructure Centre of Competence, Faculty of Engineering, North-West University, Private Bag X6001, Potchefstroom Campus, Potchefstroom 2520, South Africa
2
Department of Chemical and Biological Engineering, Koç University, Sarıyer, 34450 Istanbul, Turkey
3
Department of Materials Science and Engineering, Institute of Material Science, University of Connecticut, Storrs, CT 06269-3136, USA
4
Department of Chemical Engineering, Izmir Institute of Technology, Urla, 35430 Izmir, Turkey
5
Iongenics Electrochemical Technologies, Teknopark Izmir, Urla, 35430 Izmir, Turkey
6
Koç University Tüpraş Energy Center (KUTEM), Koç University, Sarıyer, 34450 Istanbul, Turkey
*
Authors to whom correspondence should be addressed.
Submission received: 4 April 2022 / Revised: 22 April 2022 / Accepted: 26 April 2022 / Published: 28 April 2022
(This article belongs to the Topic Catalysis for Sustainable Chemistry and Energy)

Abstract

:
Pt/Al2O3 catalysts prepared via supercritical deposition (SCD), with supercritical CO2, wet impregnation (WI) methods and a selected benchmark catalyst, were evaluated for the dehydrogenation of perhydro-dibenzyltoluene (H18-DBT) at 300 °C in a batch reactor. After ten dehydrogenation runs, the average performance of the catalyst prepared using SCD was the highest compared to the benchmark and WI-prepared catalysts. The pre-treatment of the catalysts with the product (dibenzyltoluene) indicated that the deactivation observed is mainly due to the adsorbed H0-DBT blocking the active sites for the reactant (H18-DBT). Furthermore, the SCD method afforded a catalyst with a higher dispersion of smaller sized Pt particles, thus improving catalytic performance towards the dehydrogenation of H18-DBT. The particle diameters of the SCD- and WI-prepared catalysts varied in the ranges of 0.6–2.2 nm and 0.8–3.4 nm and had average particle sizes of 1.1 nm and 1.7 nm, respectively. Energy dispersive X-ray spectroscopy analysis of the catalysts after ten dehydrogenation runs revealed the presence of carbon. In this study, improved catalyst performance led to the production of more liquid-based by-products and carbon material compared to catalysts with low catalytic performance.

1. Introduction

The establishment of a cost-competitive and efficient infrastructure for hydrogen storage and distribution is required to promote a hydrogen economy. This is important, as governments and industries are working towards implementing decarbonization strategies, such as utilizing hydrogen as a vector for clean energy. Hydrogen storage and distribution in the form of liquid organic hydrogen carriers (LOHCs) has become a ‘hot topic’ recently. This is because LOHCs can store large volumes of hydrogen for long periods and without self-discharge at ambient temperature and pressure. Traditional hydrogen storage technologies require high-pressure steel tanks, expensive composite cylinders, energy-intensive gaseous compression and liquefaction processes [1,2,3,4,5,6]. Unlike in traditional technologies, hydrogen is not readily available when utilizing LOHCs—energy is required for the release of hydrogen from the hydrogen-rich molecules.
To date, the most preferred LOHC molecule is dibenzyltoluene (H0-DBT) due to its high hydrogen storage capacity (6.2 wt %, 57 kg-H2/m3 LOHC), availability on a multi-ton scale, low melting point (−30 °C), high boiling point (380 °C) and its many other favorable properties [7,8,9,10]. Hydrogen is stored via the catalytic hydrogenation of H0-DBT to produce perhydro-dibenzyltoluene (H18-DBT), and hydrogen is released by the catalytic dehydrogenation of H18-DBT to produce H0-DBT. Other LOHC molecules, such as perhydro-N-ethylcarbazole, octahydroindole and octahydro-7-ethylindole, appear to be competitive in terms of low dehydrogenation temperature (<200 °C) compared to H0-DBT (>300 °C) [11,12,13]; however, their cost and availability are disadvantageous.
The main challenges associated with H18-DBT are high viscosity at low temperature, which could cause pumping issues, a high dehydrogenation temperature and catalyst deactivation during the dehydrogenation reaction. The viscosity issue is addressed by mixing perhydrobenzyltoluene (H12-BT) and H18-DBT at a ratio of 80:20 [14]. The high dehydrogenation temperature of H18-DBT is also problematic as a substantial fraction of the hydrogen produced could be used to supply heat to the reactor [15]. Moreover, catalyst deactivation has been reported to occur when Pt/Al2O3 is used for the dehydrogenation of H18-DBT [16,17].
Of importance/note is that the mechanism of catalyst deactivation is not yet fully understood—this could be due to blockage of the active sites by the reactants, products, or by-products. Reducing the acidity of the Al2O3 support material by modification with Mg has led to slightly improved catalyst stability, but with a decline in productivity from 0.09 to 0.07 gH2/gPt/min [18]. In that study, the dehydrogenation of H18-DBT at 300 °C was carried out using a fixed-bed reactor packed with 0.5 wt % Pt/Mg-Al2O3. The modification of the catalyst with optimized quantities of dopants, such as sulphur, resulted in the improved catalytic performance of Pt/Al2O3 and a reduction in the formation of by-products [19,20,21,22].
The development of efficient catalysts for the H18-DBT dehydrogenation reaction is crucial for the commercialization of LOHC technology. In 2020, the SHERLOHCK consortium (an EU subsidized consortium) embarked upon such catalyst development research—they set the following targets: the desired catalyst efficiency in terms of productivity should be higher than 3 gH2/gPt/min while maintaining stability; high conversion (>90%) and selectivity (>99.8%) [23]. The catalyst could be improved by a wide variety of strategies, such as the addition of doping metals, the modification of the chemical and textural properties of the support material, increasing the active surface area by obtaining highly dispersed and uniform particles and utilizing the synergistic effect of bimetals. The control of nanoparticle dispersion, size and distribution in the support material is considered a major challenge in conventional synthetic methods.
The application of supercritical deposition (SCD), especially the use of supercritical CO2 (scCO2), for the preparation of catalysts offers advantages over conventional catalyst preparation methods. ScCO2 is inexpensive, inert, non-flammable and non-toxic; furthermore, it has a moderate critical temperature and pressure (Tc = 304.15 K, Pc = 7.38 MPa) [24]. ScCO2 exhibits gas-like diffusivity; hence, its mass transfer rates are higher than a liquid-based solvent [24]. The zero-surface tension and gas-like viscosity of scCO2 lead to good penetration into porous catalyst support materials [25]. Consequently, scCO2 has been successfully used for the deposition of different metal species on porous supports for use as catalysts for a wide variety of reactions [26,27].
In this work, we evaluate the catalytic performance of Pt/Al2O3 catalysts prepared via SCD using scCO2 (SCD/scCO2) and by wet impregnation (WI), against a selected benchmark catalyst, for the dehydrogenation of H18-DBT. To study the effect of the synthesis method on the physicochemical properties of the thus prepared catalysts, the catalysts were characterized using the temperature-programmed desorption of ammonia (NH3-TPD), CO pulse chemisorption, scanning electron microscopy–energy dispersive X-ray spectroscopy (SEM–EDX) and high-angle annular darkfield scanning transmission electron microscopy (HAADF–STEM). To the best of our knowledge, our study describes, for the first time, a catalyst prepared via SCD/scCO2 (Pt/Al2O3) used for the dehydrogenation of H18-DBT.

2. Results and Discussion

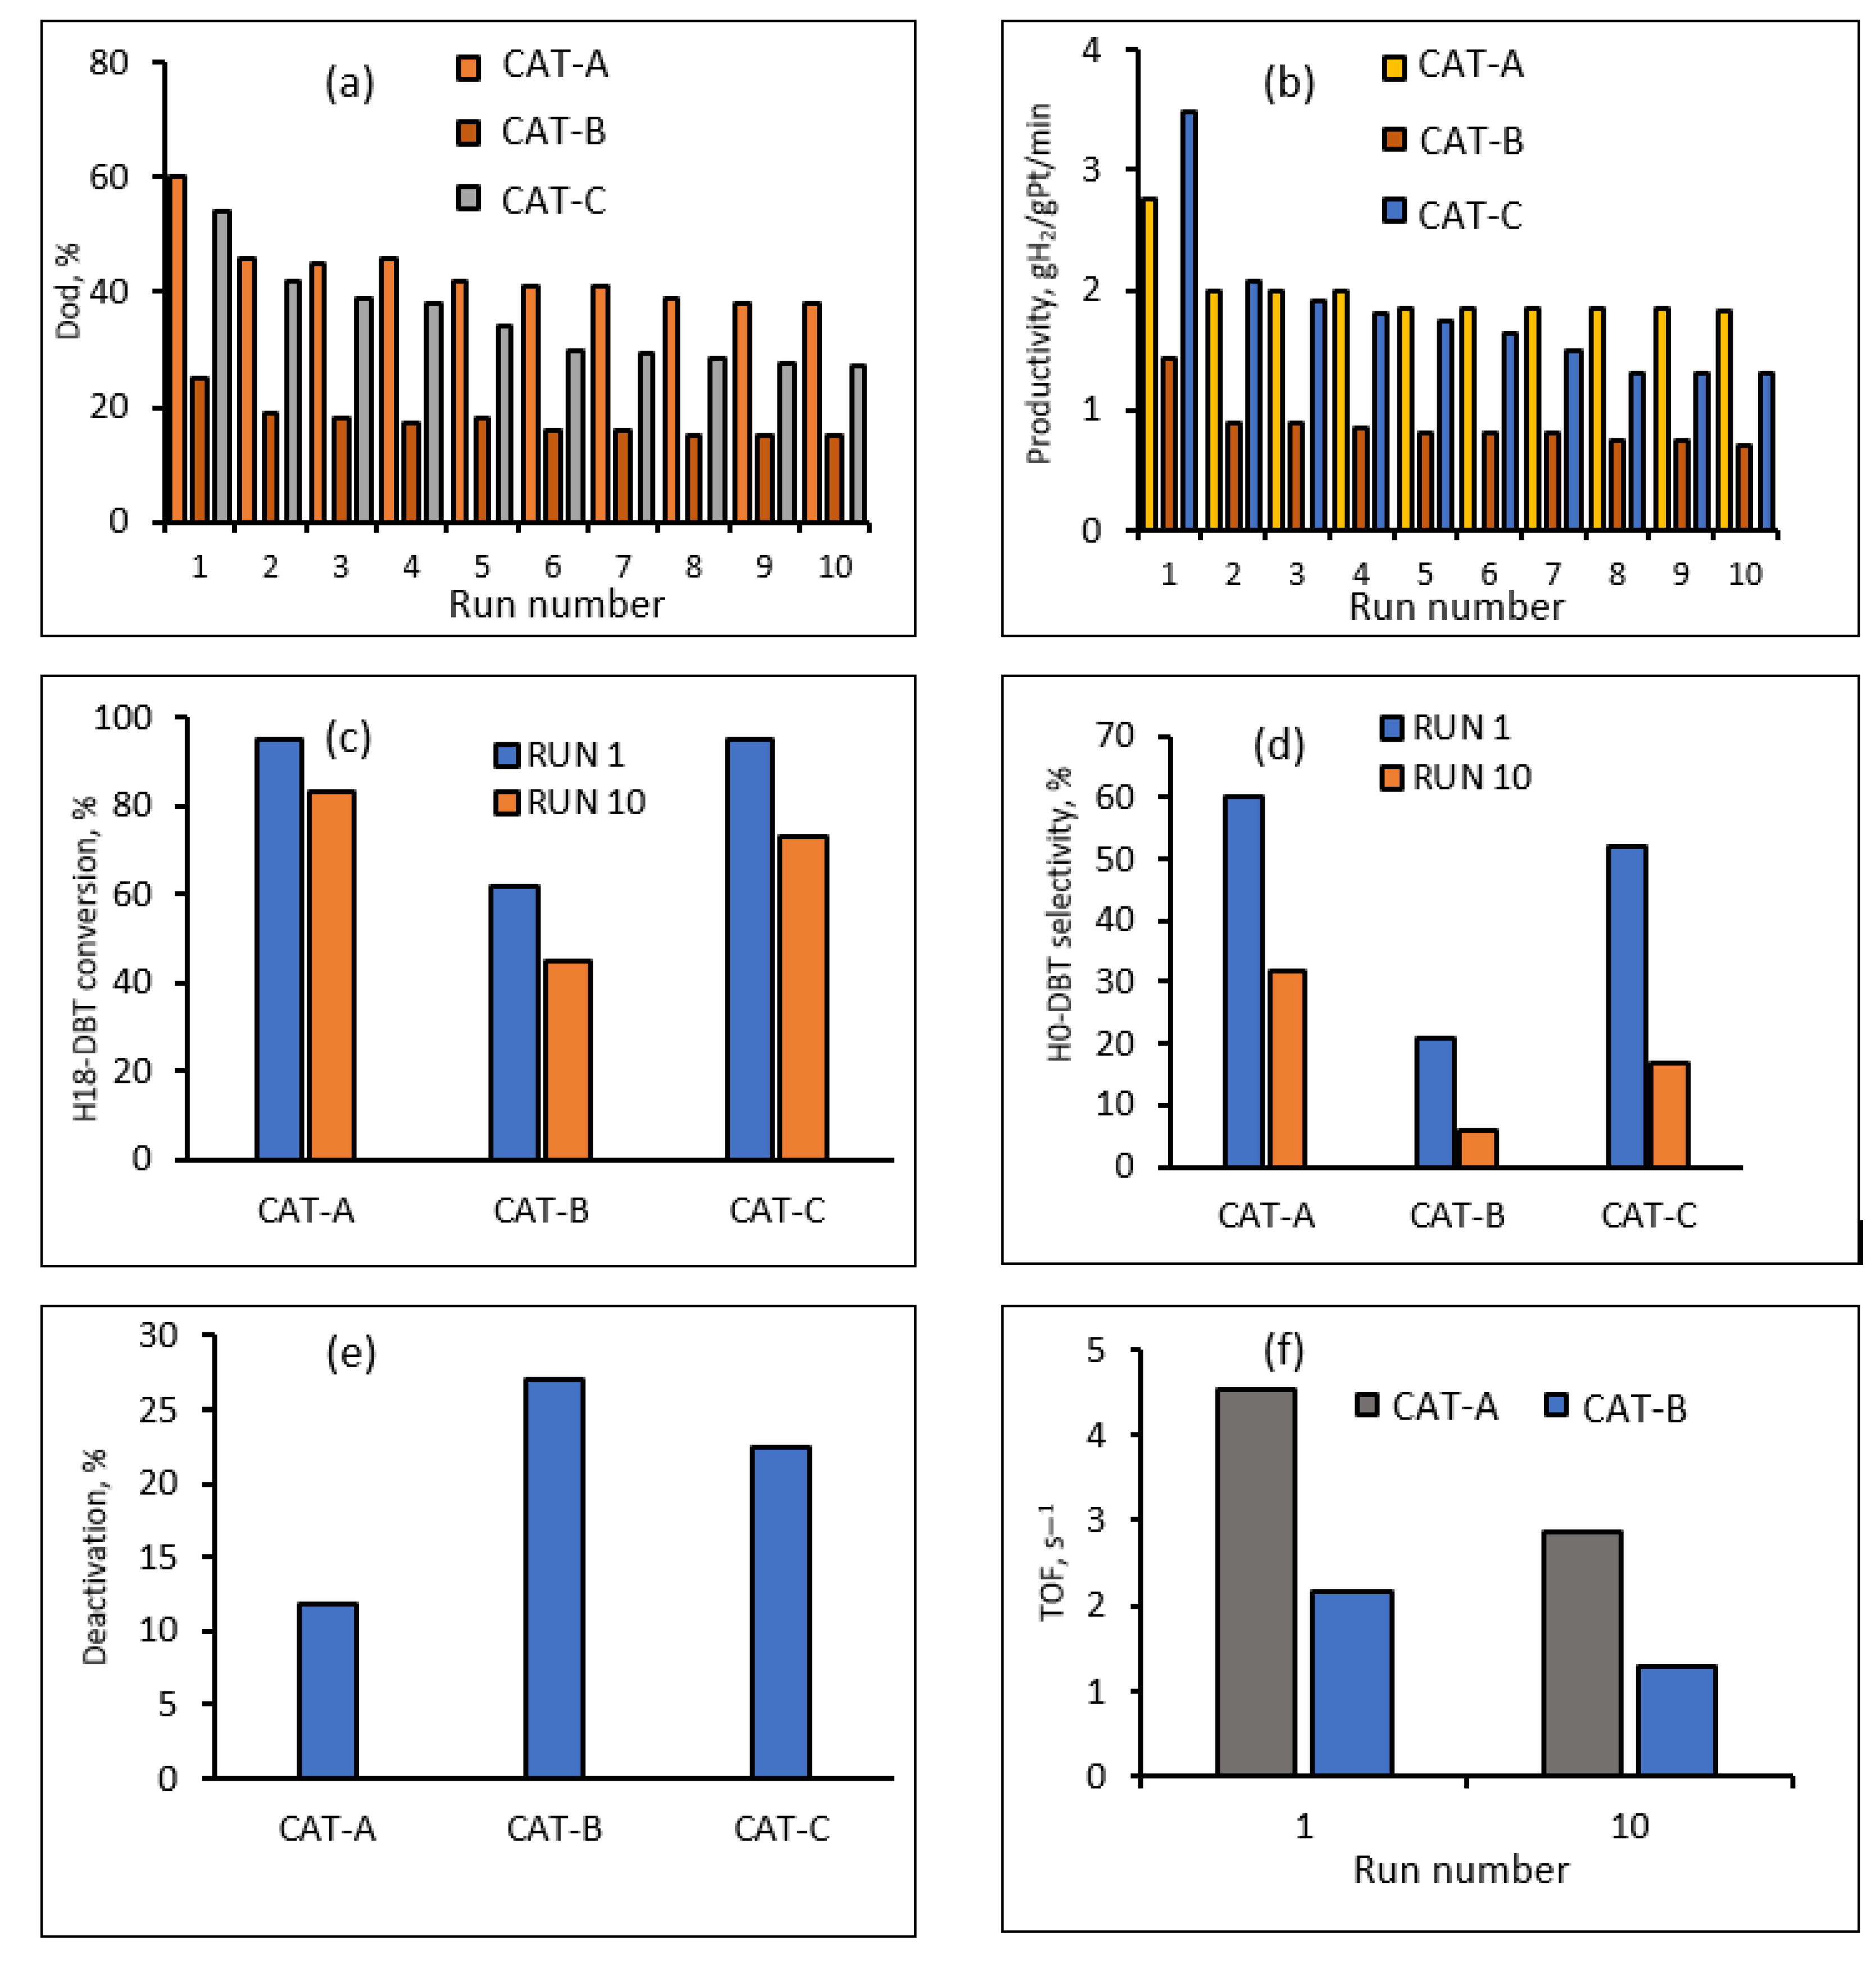
2.1. Catalytic Dehydrogenation

For all experiments, the dehydrogenation temperature and the ratio of Pt to H18-DBT were kept constant at 300 °C and 0.05 mol % based on 20 mL H18-DBT and 1.36 g Pt/Al2O3. Figure 1 shows a comparison of catalysts prepared using WI (CAT-B) and SCD/scCO2 (CAT-A); data for the benchmark catalyst (CAT-C) are included. Catalyst comparison, based on the dod over 10 runs, revealed initial catalyst stability: see Figure 1a. Successive runs were carried out by decanting the reaction mixture after a pre-determined reaction time (100 min) and replacing with fresh H0-DBT whilst re-using the catalyst. Therefore, the number of dehydrogenation runs performed was equivalent to 17 h of catalyst contact time with LOHC. We established that this effort is important—numerous publications addressing catalyst evaluation in the dehydrogenation of H18-DBT report on only the first run (fresh catalyst) [10,14,19,22,28,29,30].
The dod was calculated using Equation (1).
d o d = V H 2 , r e l e a s e d V H 2 , m a x × 100  
where V H 2 , r e l e a s e d is the volume of hydrogen produced during dehydrogenation and V H 2 , m a x is the volume of hydrogen in the H18-DBT placed in the reactor.
CAT-A showed the highest average dod of 45%, calculated by dividing the sum of the dod values by the total number of runs: see Figure 1a. This is 10% higher than the dod value of CAT-C (benchmark) and 28% higher than the dod value of CAT-B. However, for all catalysts, there was a similar declining trend in the dod, more severely between runs 1 and 2: see Figure 1a. For example, a decline in dod from run 1 to 2 was 14% for CAT-A, 12% for CAT-C and 6% for CAT-B; from runs 2 to 10, it was 15% for CAT-C, 8% for CAT-A and 4% for CAT-B. It was expected that from runs 2 to 10, the decline in dod should be less than that from run 1 to 2, but this was not the case for CAT-C; the decline in dod was still high for runs 2–10. This suggests that the dod for the CAT-C catalyst could decline further if the reaction time is extended. The CAT-B catalyst exhibited low dod, and it was more stable compared to the other two catalysts. However, the CAT-A catalyst could also be advantageous due to its high dod values. The average dod values for all the catalysts here were below 50%, which means that more than half of the storage capacity of H18-DBT is not fully utilized.
The catalyst activity was calculated based on the productivity (P) calculated by Equation (2).
P = g H 2 g P t   m i n
where P is the mass of released hydrogen per mass of Pt per minute. For a batch reactor, the maximum hydrogen flow was converted to the number of grams of hydrogen produced per minute. In a single dehydrogenation run, a fast decline in the hydrogen flow rate will result in a low dod. As shown in Figure 1b, the CAT-C catalyst had the highest productivity (3.48 gH2/gPt/min) in run 1, but this did not result in the highest dod in run 1. Furthermore, the CAT-C catalyst showed a steep decline in productivity from run 1 to 2 and thereafter a further decline from runs 2 to 10. Both CAT-A and CAT-B catalysts showed stable productivity after run 2, although the CAT-B catalyst had the lowest productivity. Data from run 2 indicated that the productivities of CAT-A and CAT-C were close to the SHERLOHCK target of 3 gH2/gPt/min [23]: see Figure 1b. In the work of Jorschick et al., productivity declined by 40% from run 1 to 2, while from runs 2 to 13, the productivity further declined by 65% [31,32]. The reason for this deactivation was the blockage of the active sites by by-products [31,32].
The H18-DBT conversion (X) and H0-DBT selectivity (S) were calculated using Equations (3) and (4), respectively.
X H 18 - D B T   ( % ) = m o l H 18 - D B T   i n m o l H 18 - D B T   o u t m o l H 18 - D B T   i n × 100
S H 0 - D B T   ( % ) = m o l H 0 - D B T m o l H 0 - D B T +   m o l H 6 - D B T +   m o l H 12 - D B T + m o l H 18 - D B T + m o l b y - p r o d u c t s × 100  
The dehydrogenation of H18-DBT is a stepwise reaction: H18-DBT–3H2→H12-DBT–3H2→H6-DBT–3H2→H0-DBT. In run 1, the CAT-A and CAT-C catalysts exhibited high H18-DBT conversion (>90%), whereas CAT-B exhibited low conversion (62%): see Figure 1c. However, this was not maintained up to run 10. The CAT-A catalyst exhibited a 13% decline in H18-DBT conversion, while CAT-B and CAT-C showed 27% and 23% declines, respectively. Run 10 provided results that offer a more meaningful comparison. The selectivity towards H0-DBT was high for CAT-A (32%), followed by CAT-C (17%) and CAT-B (6%): see Figure 1d. The deactivation parameter ( Δ X ) in Equation (5) was used to calculate the extent of deactivation of the catalysts.
Δ X   ( % ) = X i   X f X i × 100
where Xi and Xf are the initial (run 1) and final (run 10) conversions of H18-DBT. As evident in Figure 1e, the CAT-B catalyst was the most deactivated ( Δ X = 27%), followed by CAT-C ( Δ X = 22%) and then CAT-A ( Δ X = 12%). Therefore, in the dehydrogenation of H18-DBT, based on the results of runs 1–10, the CAT-A was the least deactivated catalyst here.
Turnover frequency (TOF) is defined as the number of molecules reacted at each available catalytic active site per unit of time. TOF for the dehydrogenation of H18-DBT was calculated using Equation (6) and based on run 1 (initial 100 min) and run 10 (after 17 h catalyst contact time).
TOF = H 2   r e l e a s e d   ( mol ) x P t × D P t × t
where x P t is the Pt loading (mol), t is the reaction time (s) and D P t is the platinum dispersion determined using CO pulse chemisorption. Figure 1f shows the relationship between TOF and the catalyst contact time or number of dehydrogenation runs. As shown in Figure 1f, in run 1, TOF was found to be high for CAT-A (4.5 s) and decreased to approximately 3 s in run 10. The TOF values for CAT-B declined from 2 s in run 1 to 1.3 s in run 10. Therefore, the decline in TOF values is relative to the deactivation observed. This suggests the blockage of some of the available active sites. The comparison of catalytic performance is summarized in Table 1.

2.2. Characterization

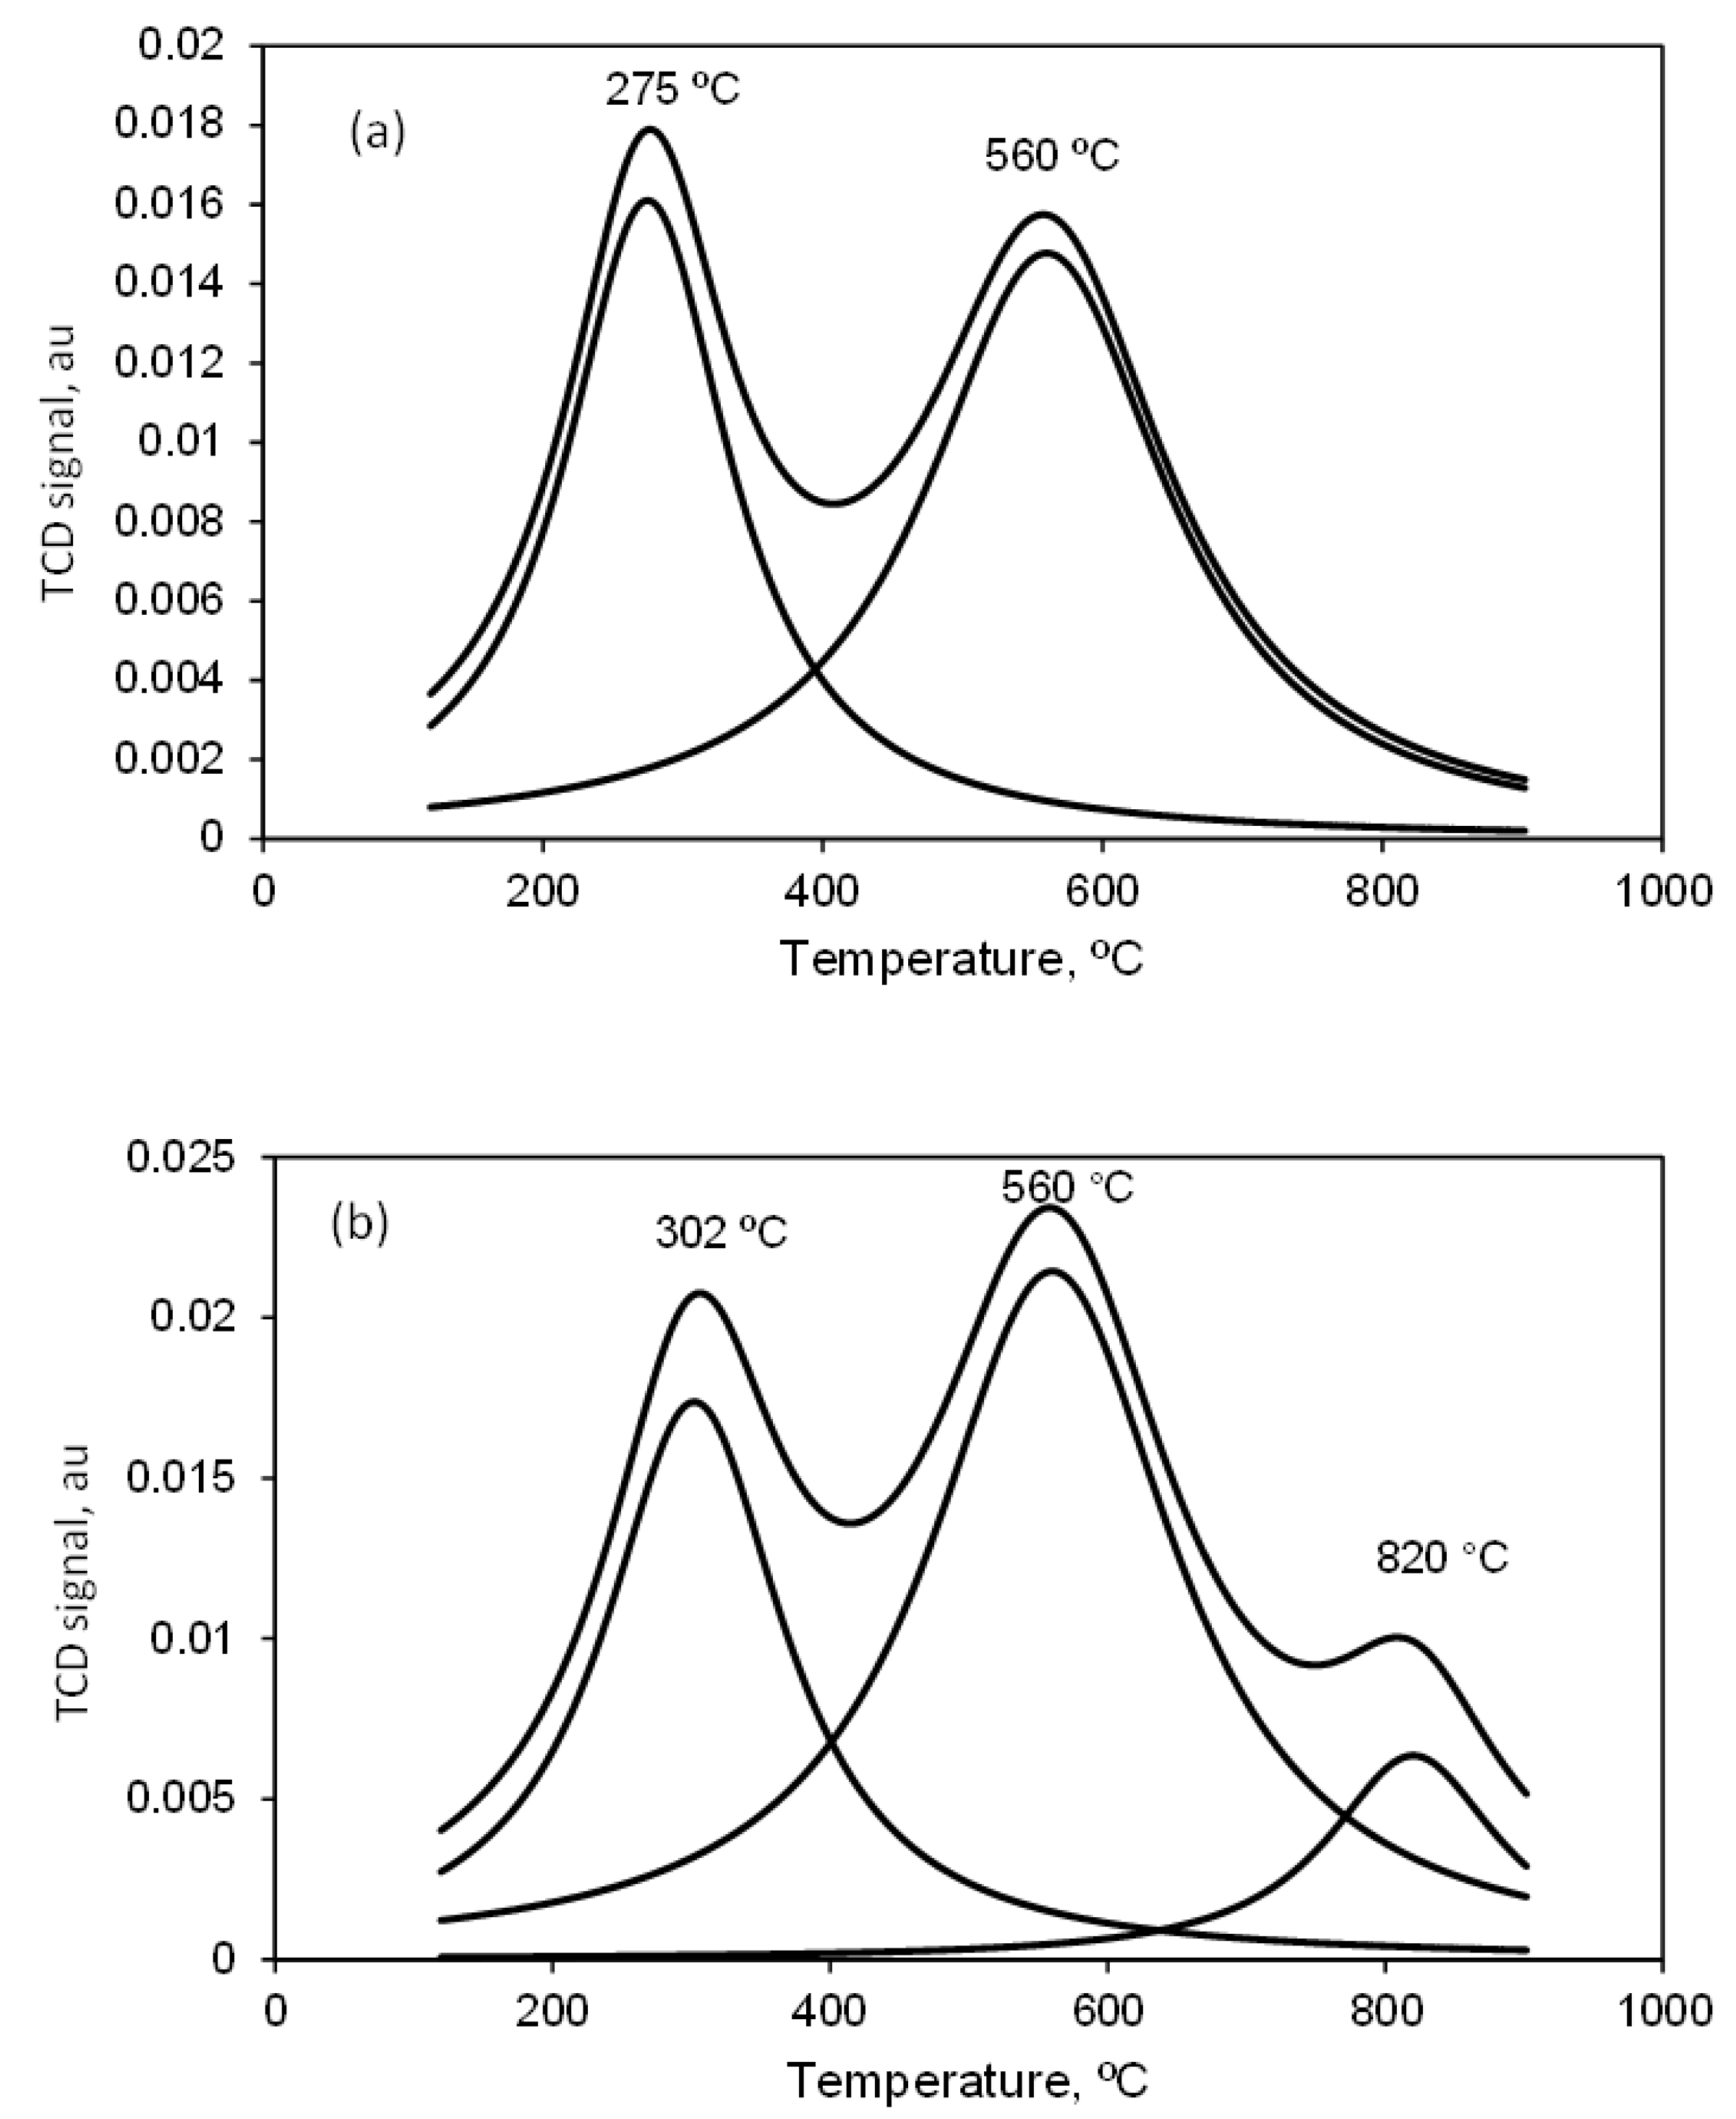
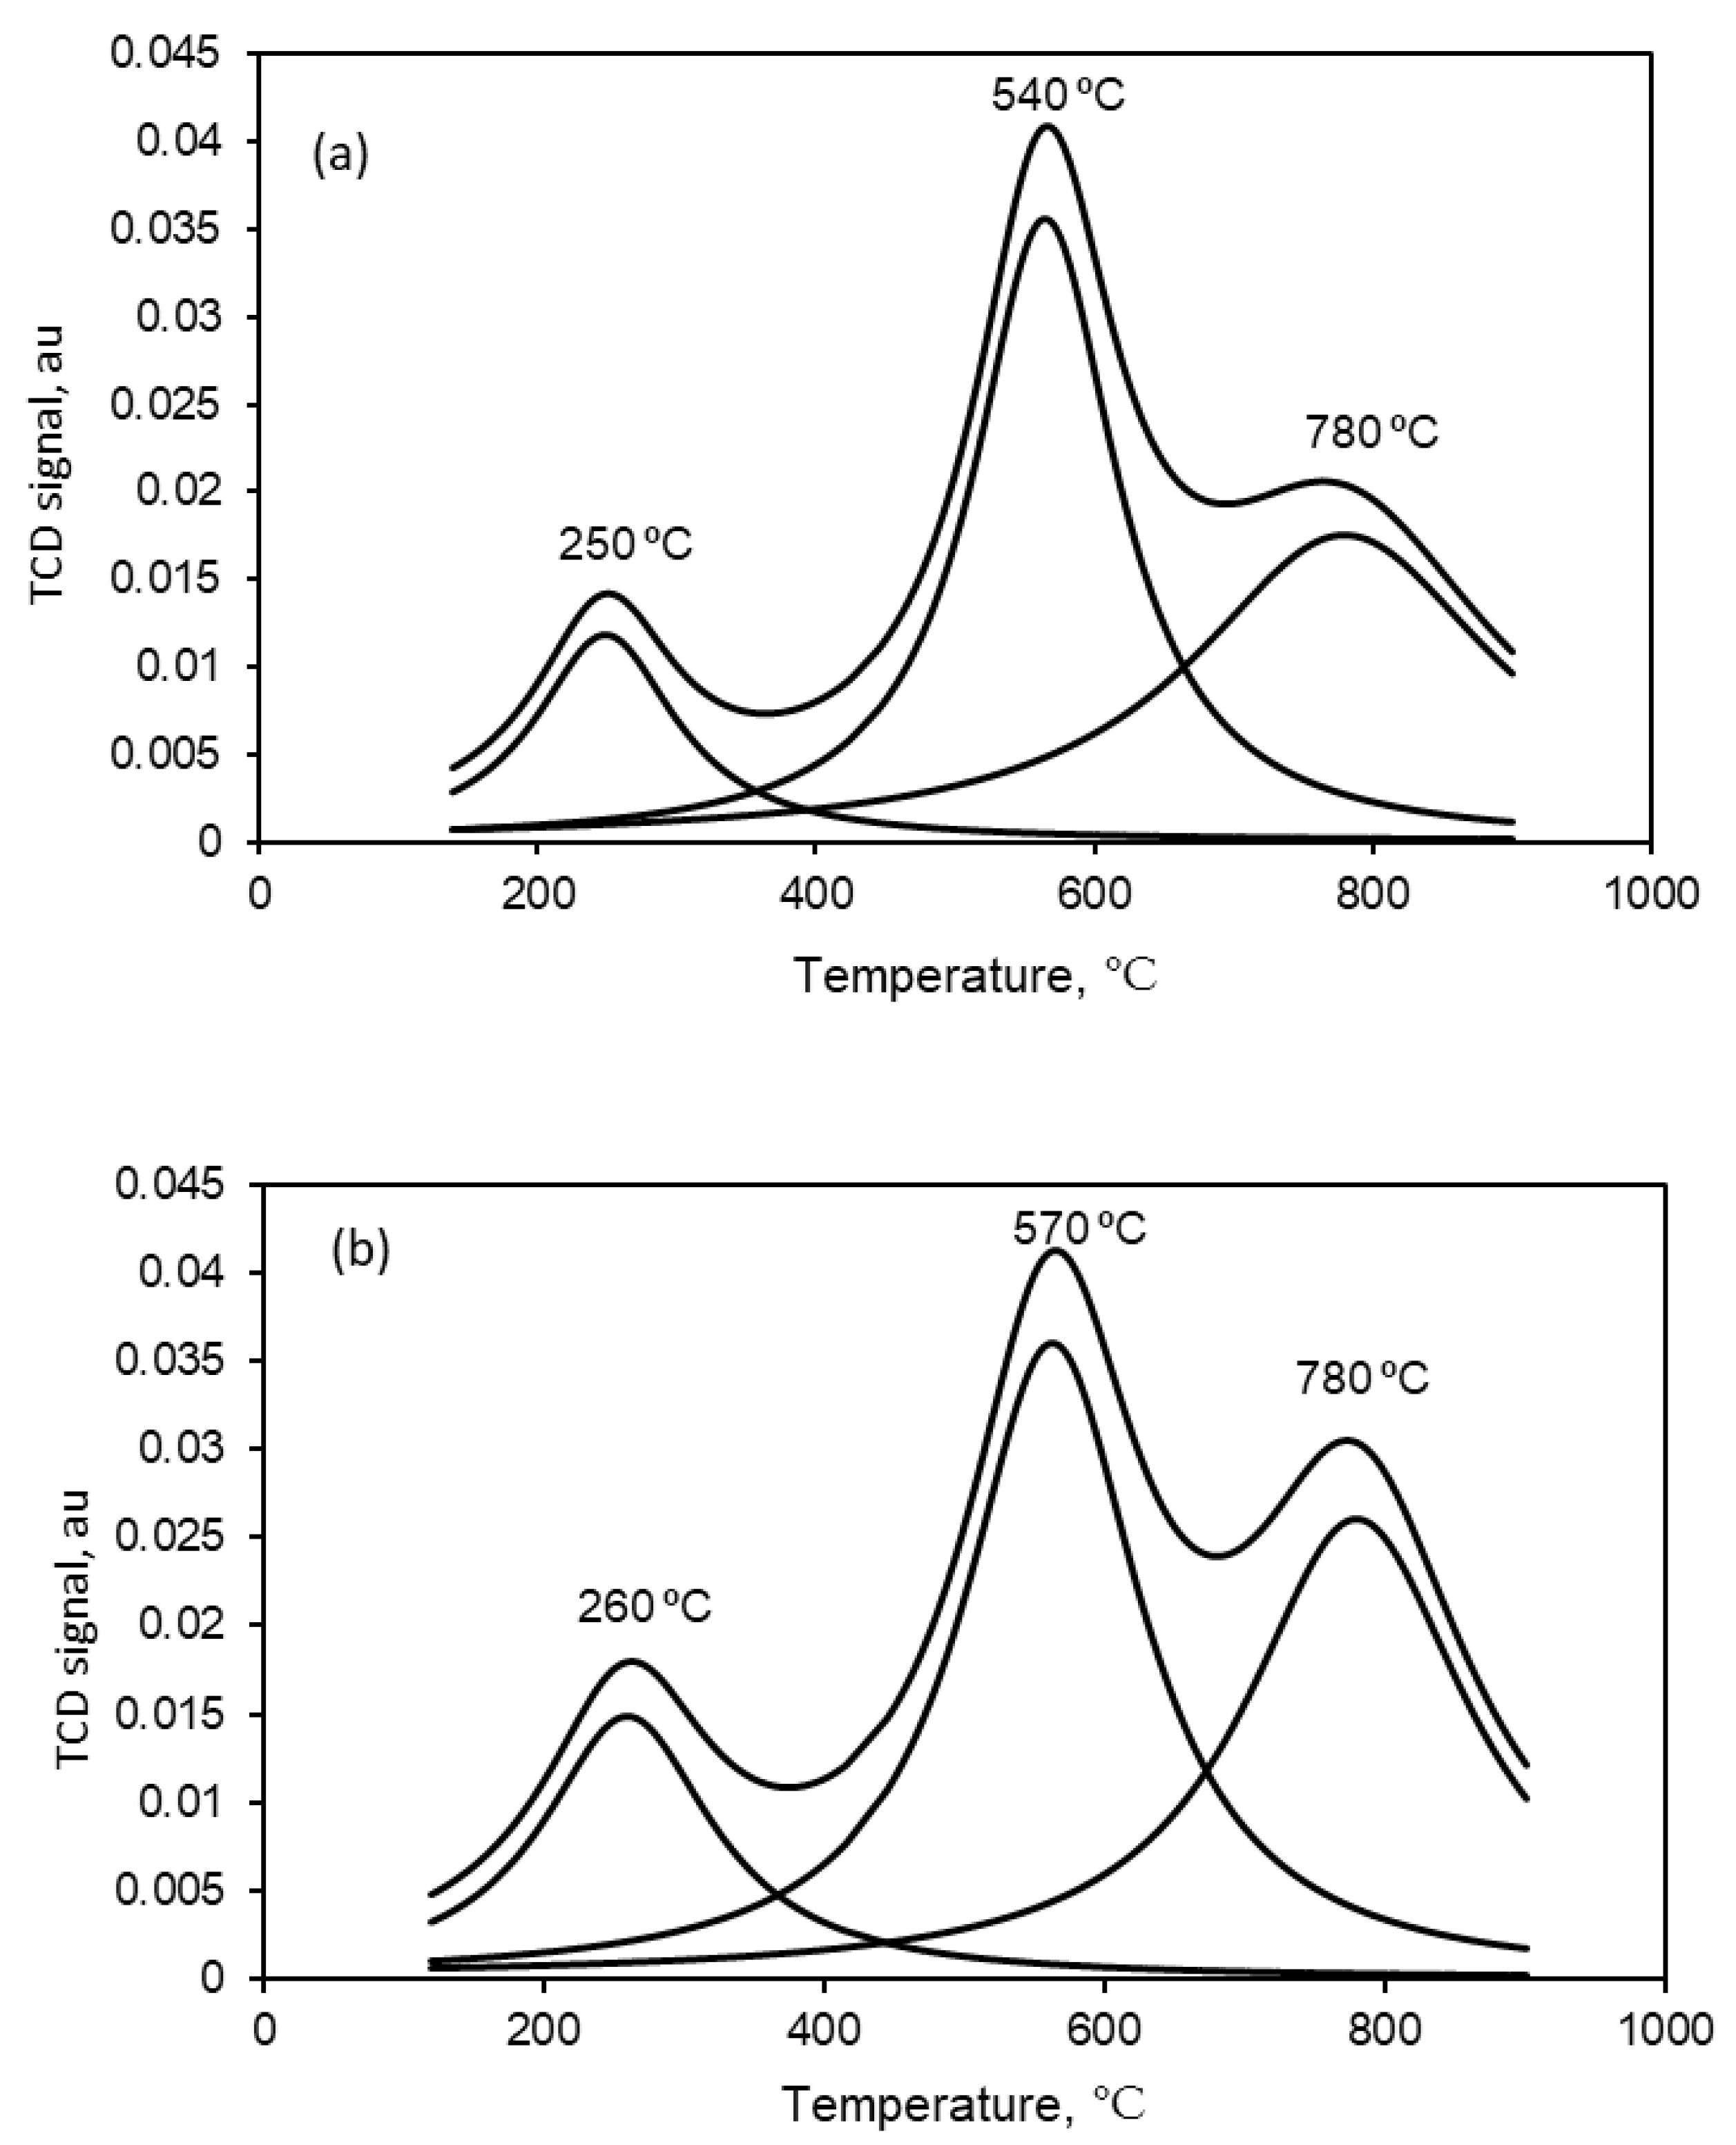
2.2.1. Temperature-Programmed Desorption of Ammonia (NH3-TPD)

The acidity of the catalysts before and after the dehydrogenation reaction was measured using NH3-TPD. The acidic strength of the catalysts was obtained via the deconvolution of the NH3-TPD curves using a log-normal fitting method, found in the Autochem II software. However, NH3-TPD experiments do not distinguish between Lewis and Brønsted acid sites—they only provide the total acidity of the catalyst.
Two peaks appeared at low and high temperatures for fresh CAT-A, and three peaks for fresh CAT-B: see Figure 2. For CAT-A, the low temperature peak at <300 °C is due to weak acid sites, and the high temperature peak above 500 °C can be attributed to the strong acid sites [33,34,35]: see Figure 2a. The peak appearing at 820 °C for CAT-B could be due to strong acid sites, and the peak below 300 °C and above 500 °C could be due to the weak acid and medium acid sites, respectively: see Figure 2b. For all fresh catalysts, the peak fraction B (strong acid site) was higher than the peak fraction A (weak acid site): see Table 2. Furthermore, as indicated in Table 2, the peak fraction values of CAT-B catalyst were higher than for the CAT-A catalyst. Interestingly, both spent catalysts showed a decrease in the fraction of weak acid sites compared to fresh catalysts; see Figure 2b and Figure 3b. The spent CAT-A showed an additional peak at temperatures > 700 °C; however, this did not result in significant changes in the total acidity (see Table 2). The three peaks observed for the CAT-B profile suggest the presence of weak, medium and strong acid site distribution; see Figure 3. Moreover, the fraction of strong acid sites of CAT-B increased from 14 to 40% after the reaction; see Table 2. This suggests that the dehydrogenation reaction affects the acid site distribution of the catalyst. The effect of catalyst acidity on the dehydrogenation of H18-DBT requires further investigation.

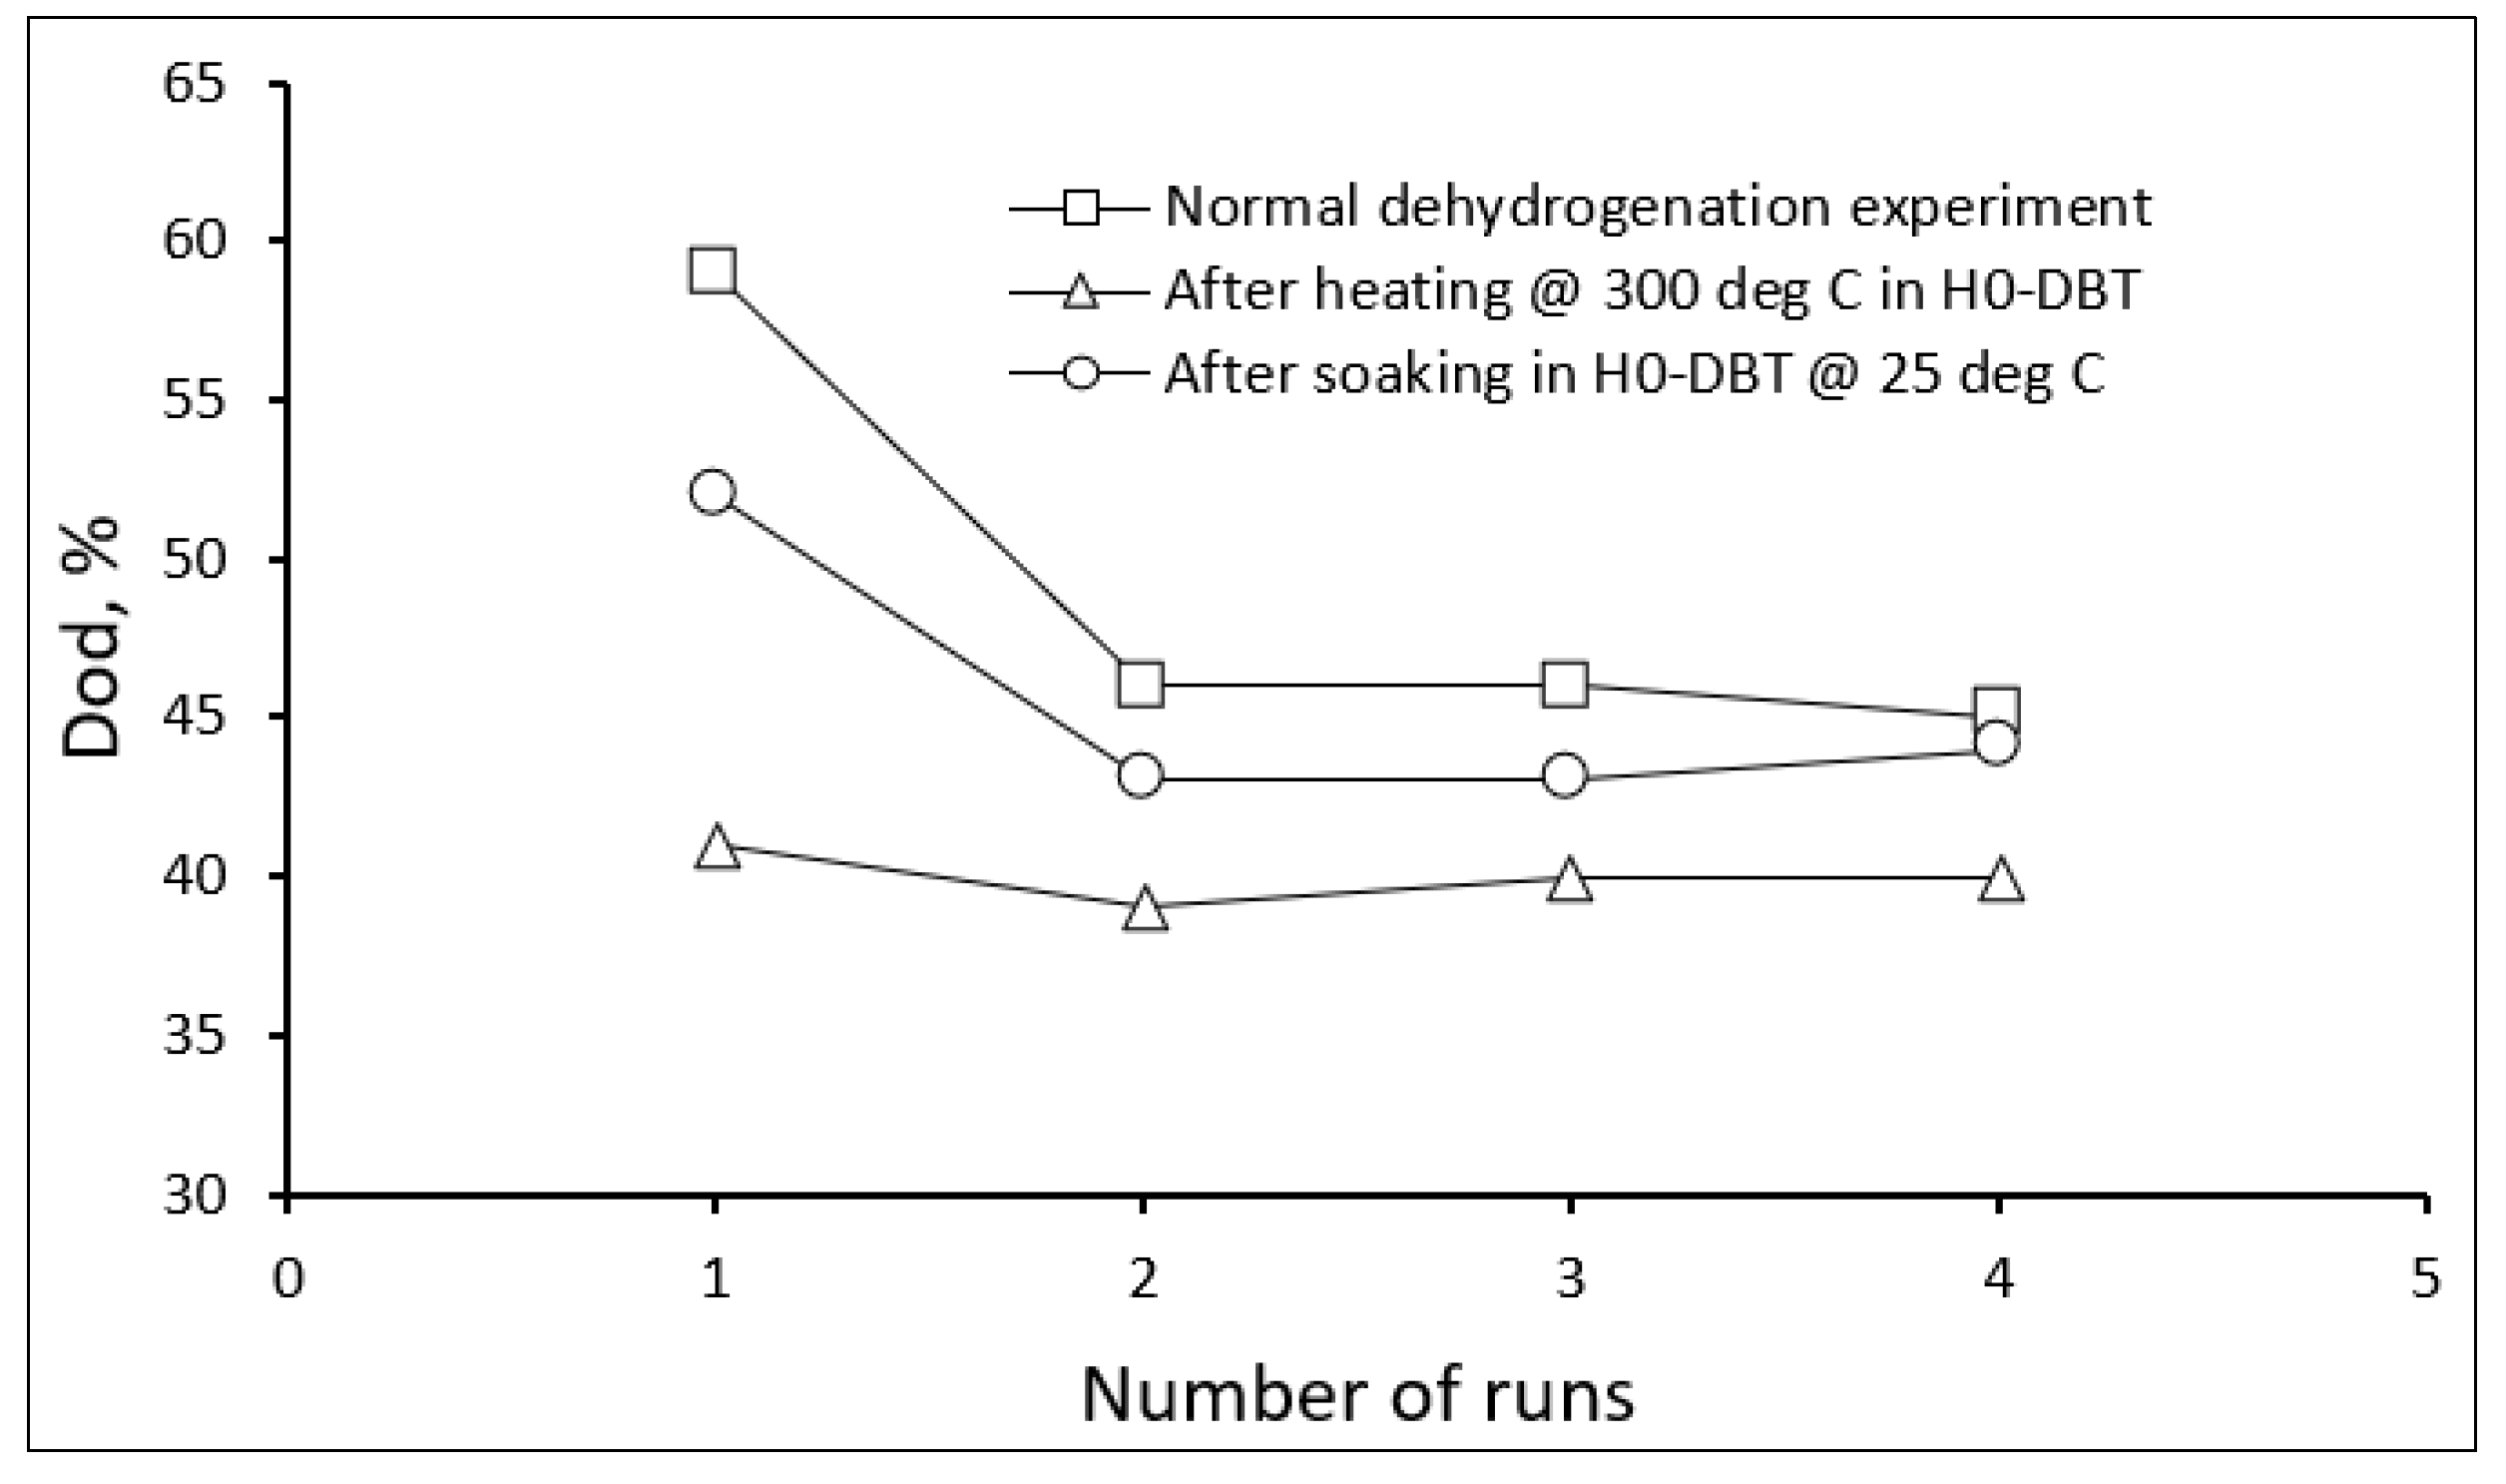
2.2.2. Catalyst Deactivation

It has been reported that the acidity of the catalyst support hinders the desorption of olefin products and enhances their residence time on the catalyst surface [36]. The higher the dod, the more aromatic compounds are produced, and these compounds are susceptible to reaction on the acidic sites of the catalyst. Deactivation is, therefore, observed because there is the possibility of competitive adsorption between reactants and products. To test this hypothesis, a sample of fresh catalyst (CAT-A) was left overnight in pure H0-DBT at rt, and another sample of fresh catalyst was left for 100 min in pure H0-DBT at 300 °C. The latter was performed in an effort to mimic the run that we used for the actual dehydrogenation experiments. These samples of catalysts were separated from H0-DBT and then tested in the dehydrogenation of H18-DBT. The catalyst sample without pre-treatment in H0-DBT exhibited a high dod in the first run followed by a decrease in the second run, which suggests catalyst deactivation: see Figure 4.
We then investigated whether this deactivation could result from the H0-DBT blocking some of the active sites and inhibiting the adsorption of the H18-DBT within the catalyst. Interestingly, both catalysts pre-treated in H0-DBT already exhibited low dod in run 1. Furthermore, in run 1, the dod of the catalyst treated in H0-DBT at rt was 19% lower than in the case of the untreated catalyst, while the dod of the catalyst pre-treated at 300 °C was 42% lower than the untreated catalyst: see Figure 4. This suggests that during normal dehydrogenation, the H0-DBT product dis not completely desorb in run 1, thus hindering the adsorption of the H18-DBT reactant in run 2—hence, a loss in the catalyst activity was evident.

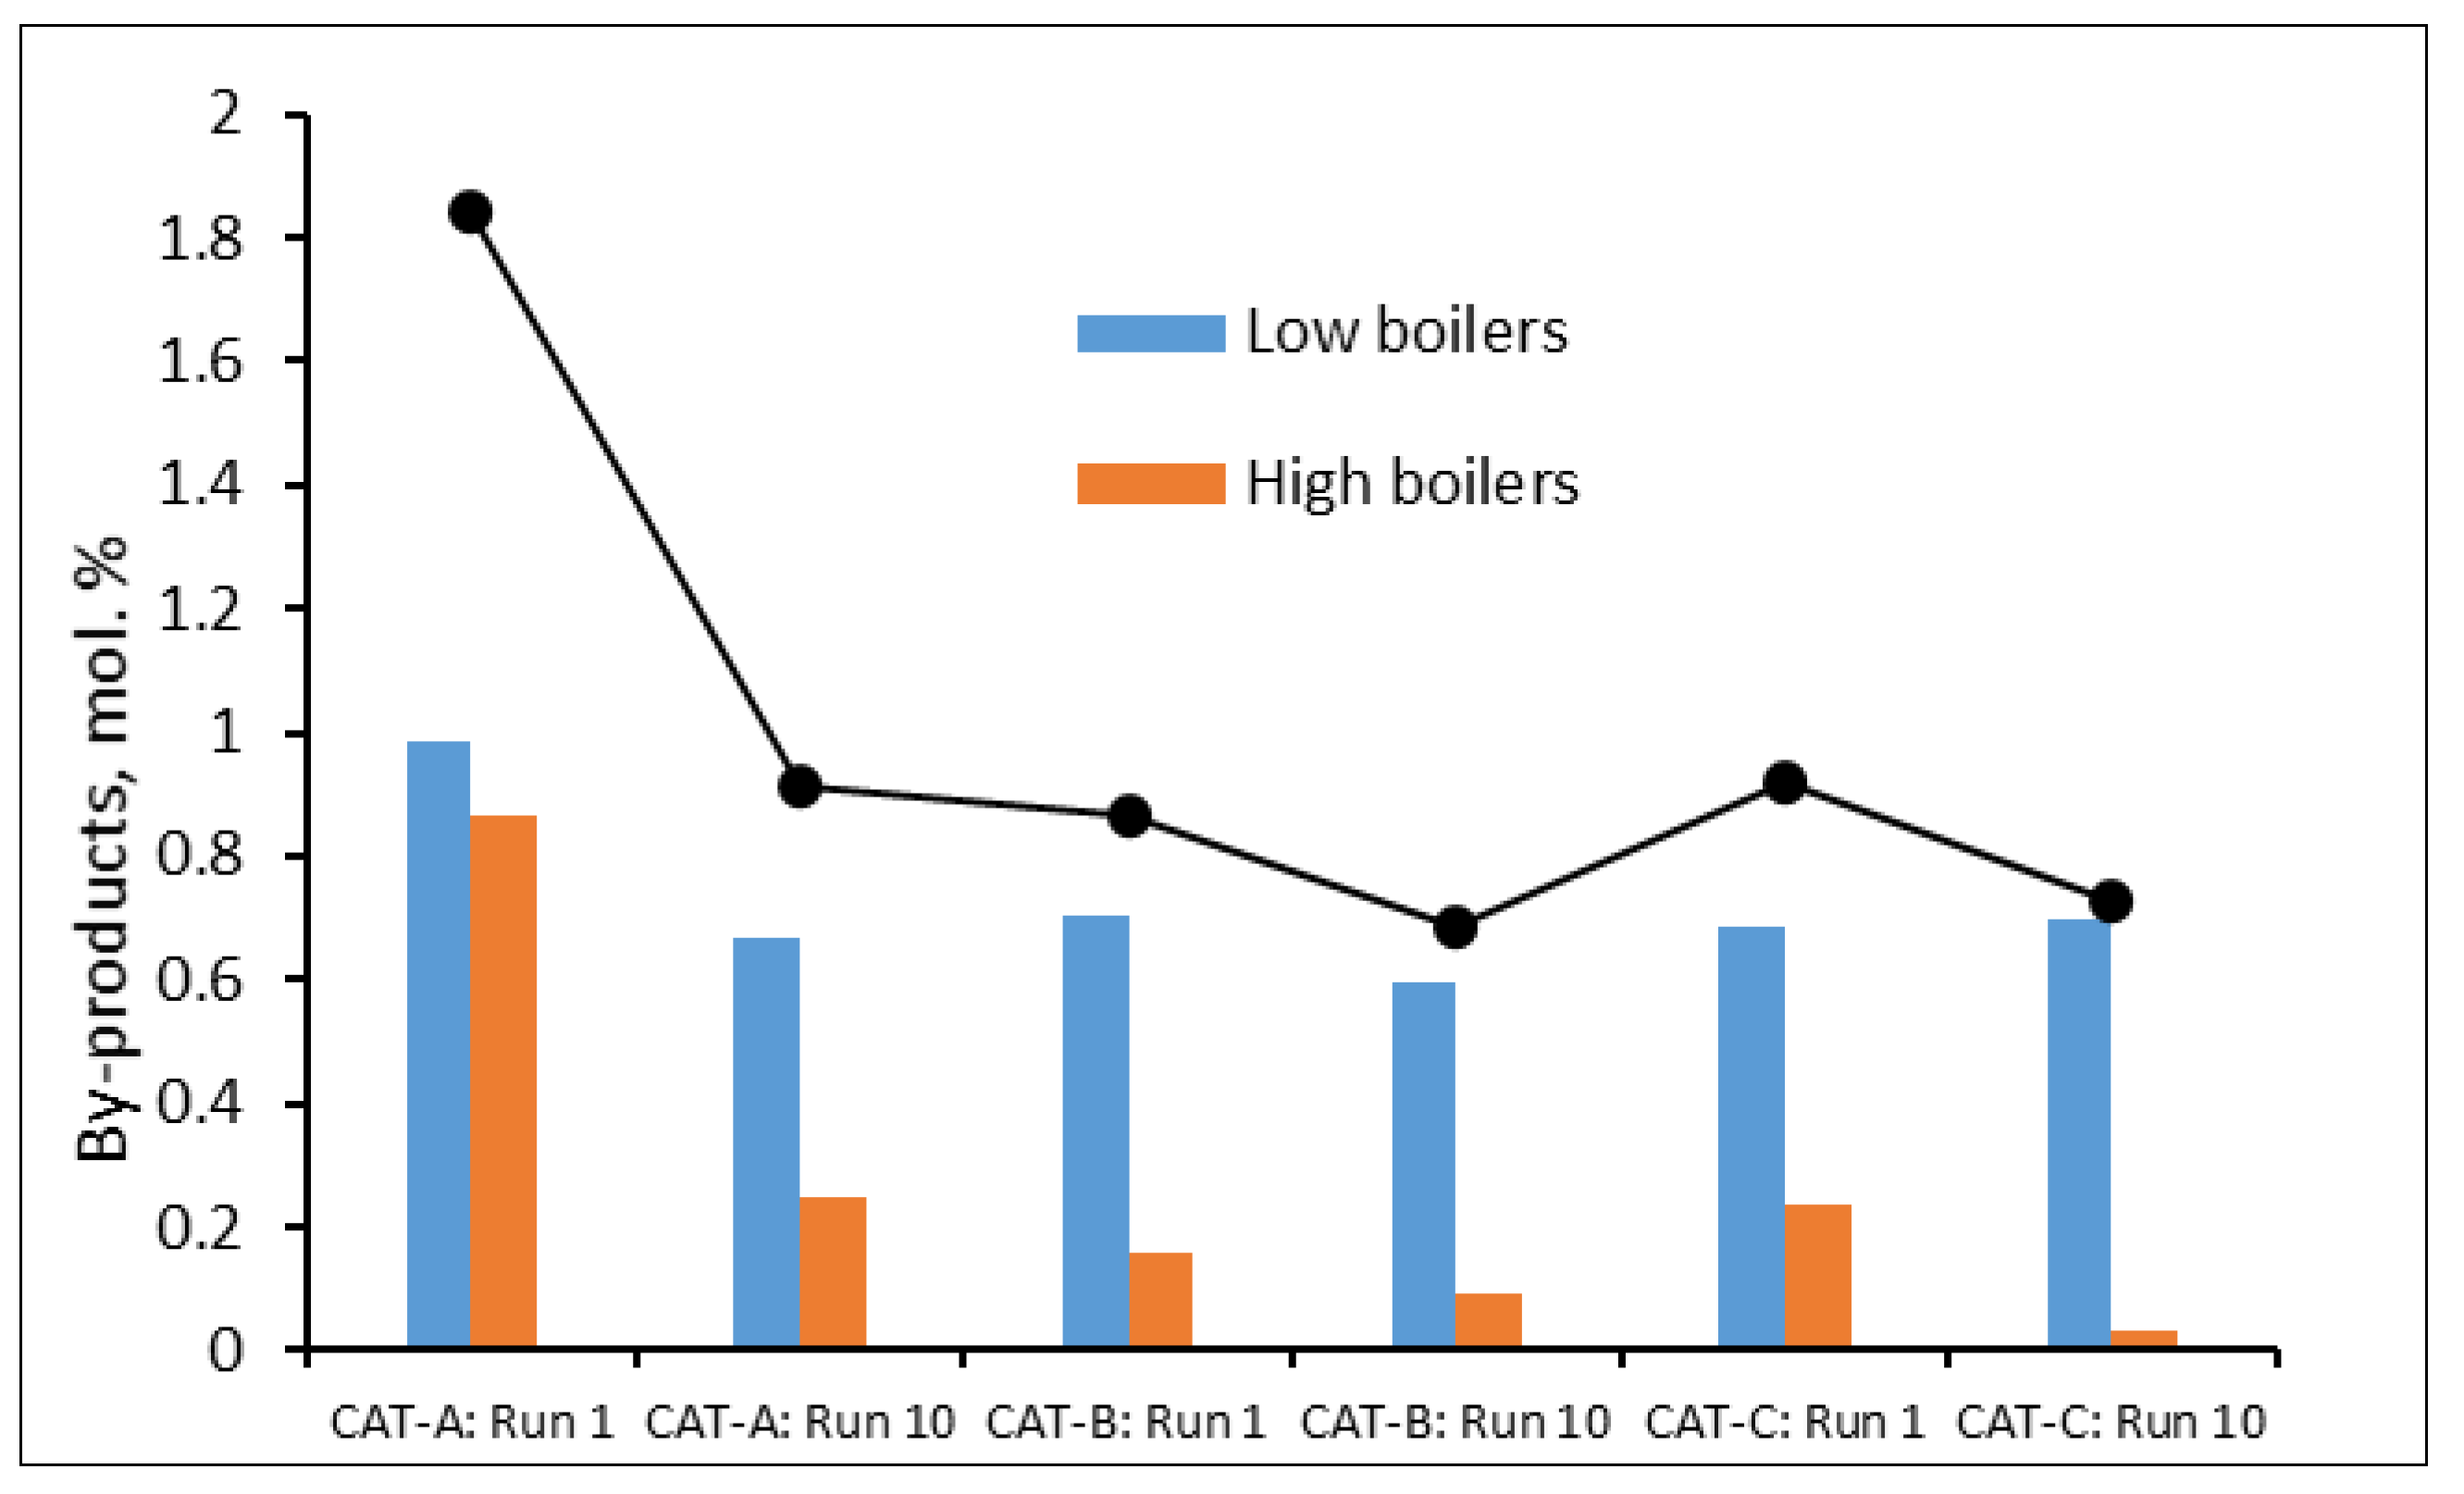
2.2.3. Analysis of Reaction Mixtures

Samples of reaction mixtures obtained after the dehydrogenation of H18-DBT revealed the presence of low-boiling (LB) point and high-boiling (HB) point by-products: see Figure 5. These by-products are known to be due to the cracking and cyclization of H0-DBT during the dehydrogenation reaction [17]. It has been reported earlier that the higher the dod the more aromatic products are formed [17]. Aromatic by-products are also known to be susceptible to adsorb and react on the acid sites of the catalysts; hence, cracking occurs. The LB point by-products are toluene, benzyltoluene and xylene, and the HB point by-products are derivative of benzylmethylfluorene [17].
We compared the catalysts based on the number of by-products produced during the dehydrogenation of H18-DBT. In run 1, CAT-A showed the highest number of total by-products (1.8 mol %: 53% LB and 47% HB); in run 10, the total by-products decreased by 50%. In run 1, CAT-B gave 0.86 mol % as the total number of by-products; in run 10, this decreased by 21%. The number of LB point by-products was higher than that of HB by-products. In run 1, the by-products obtained using CAT-C totalled 0.92 mol %; in run 10, the by-products decreased by 21%. The LB by-products constituted a greater number of by-products, compared to the HB by-products. For all three catalysts, run 1 showed high numbers of by-products because more aromatic compounds were formed—then, as the catalyst became less active from run 2, fewer by-products were formed.

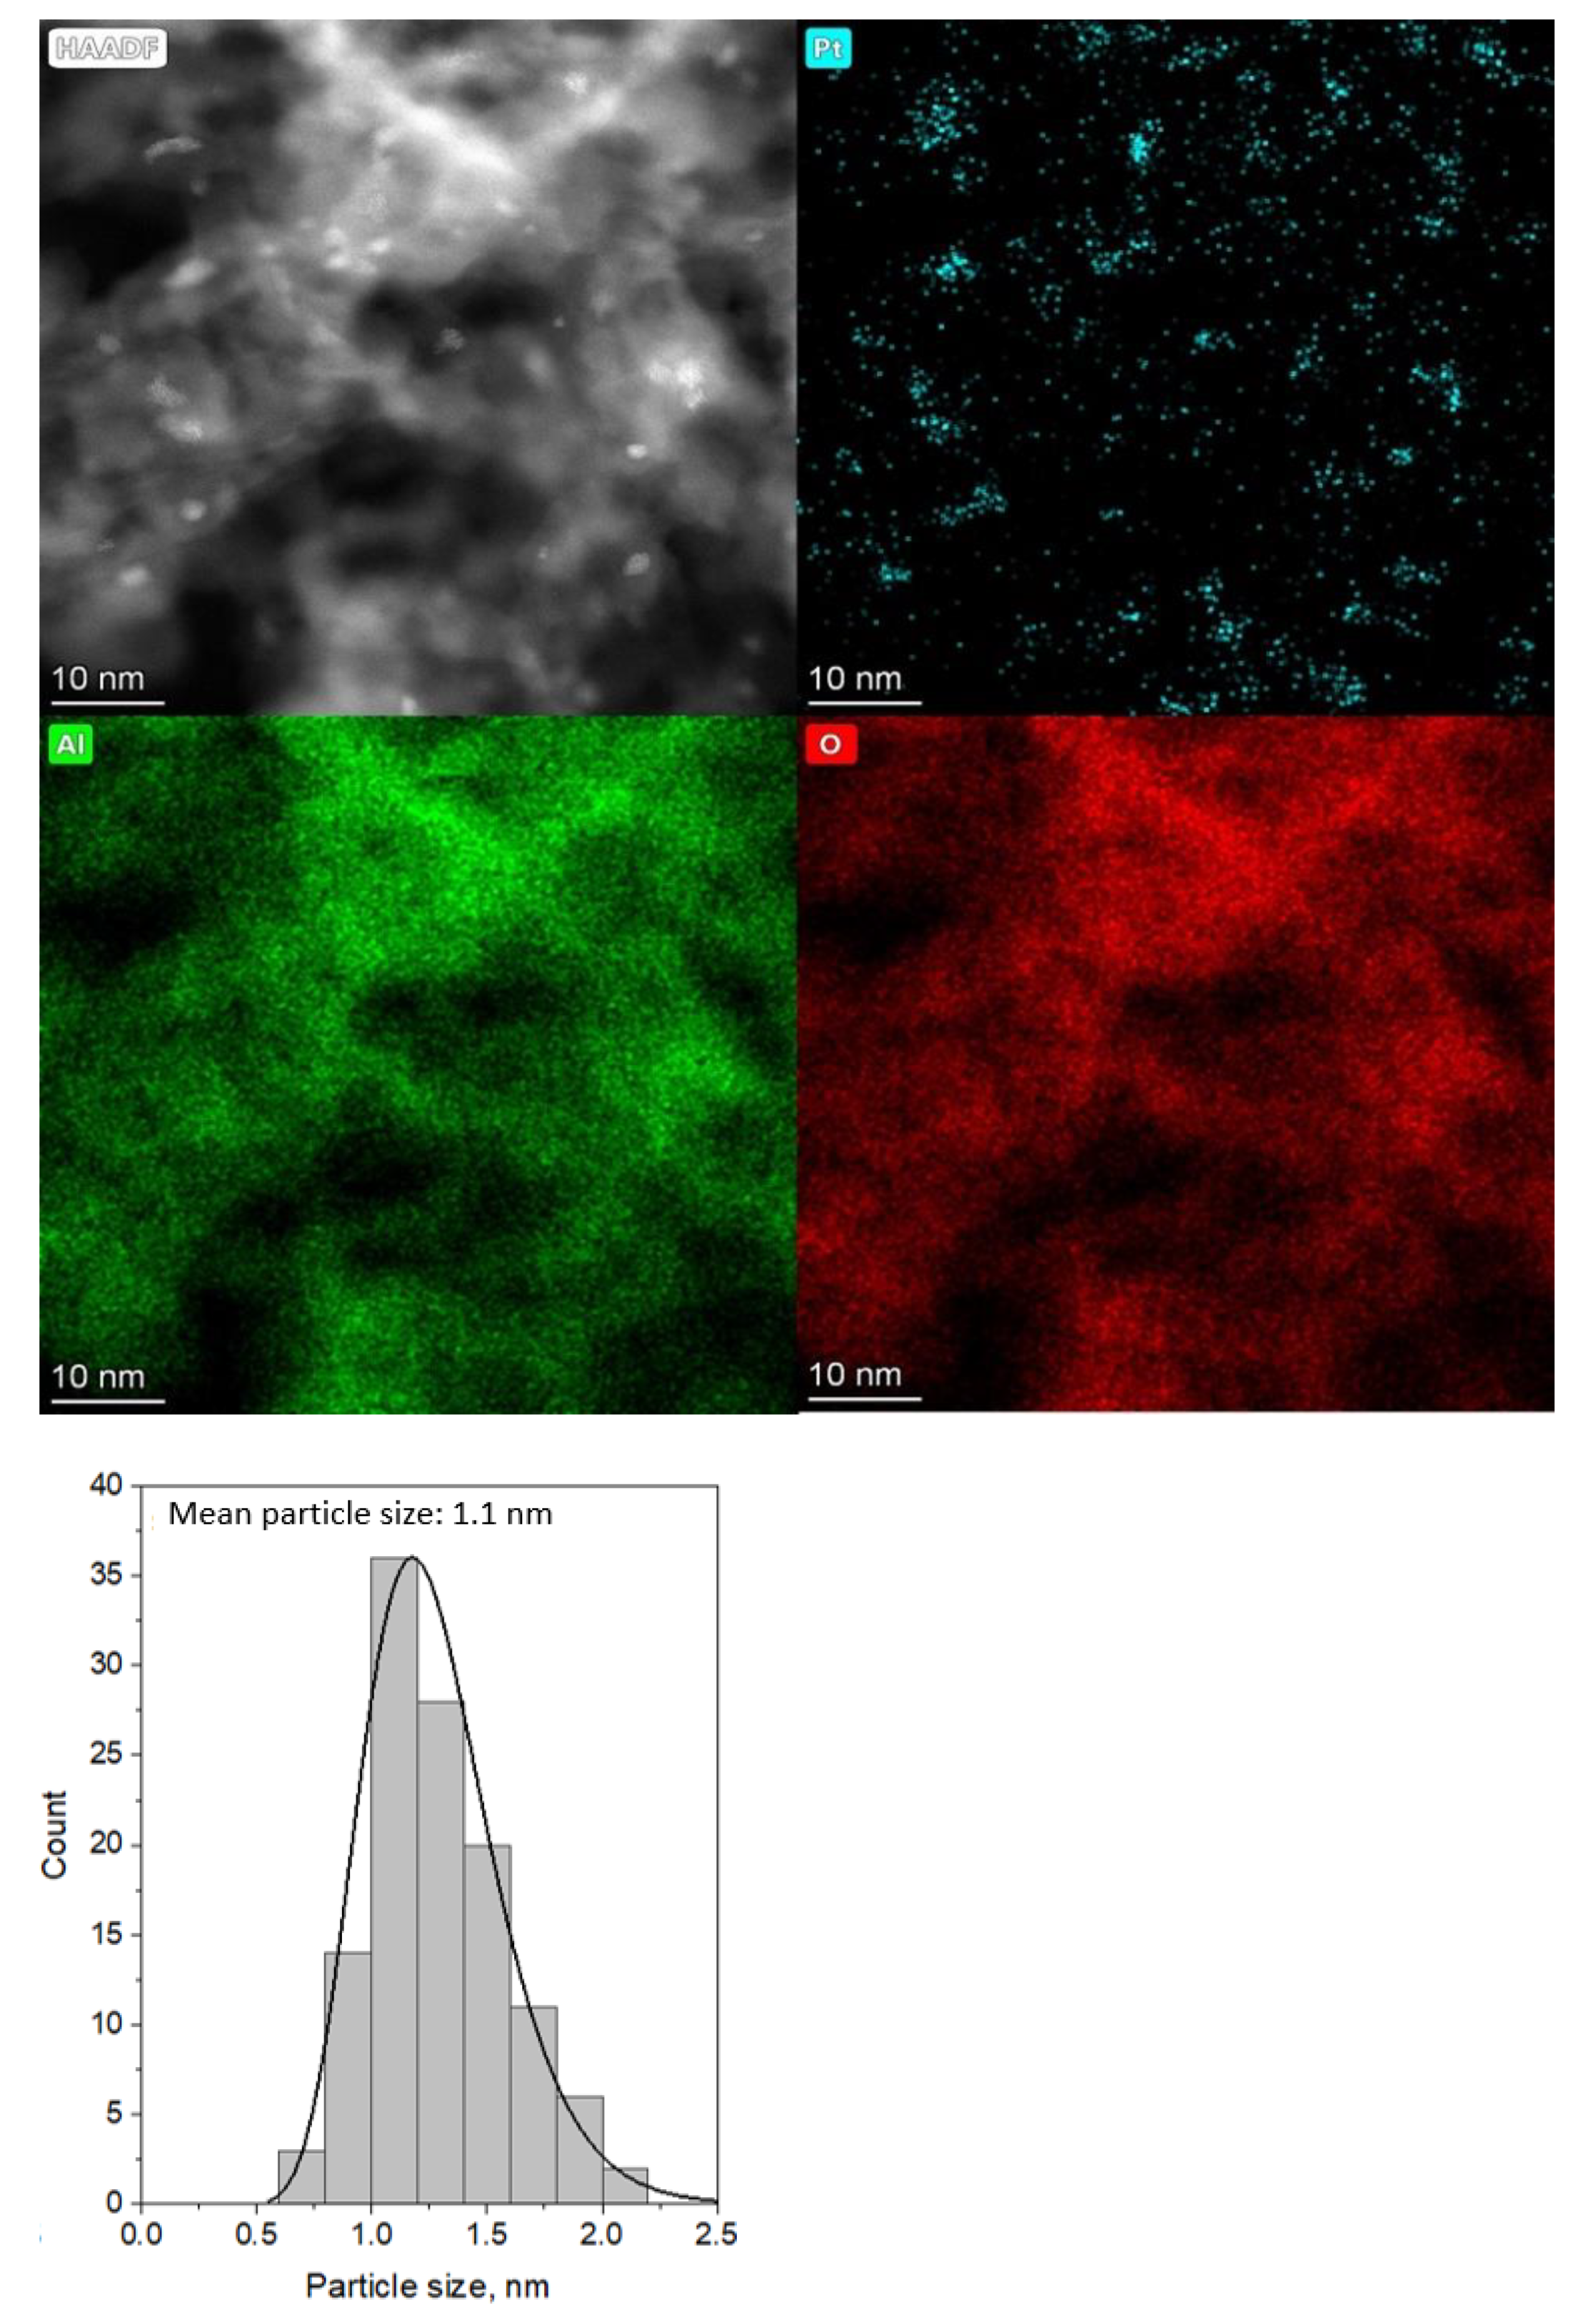
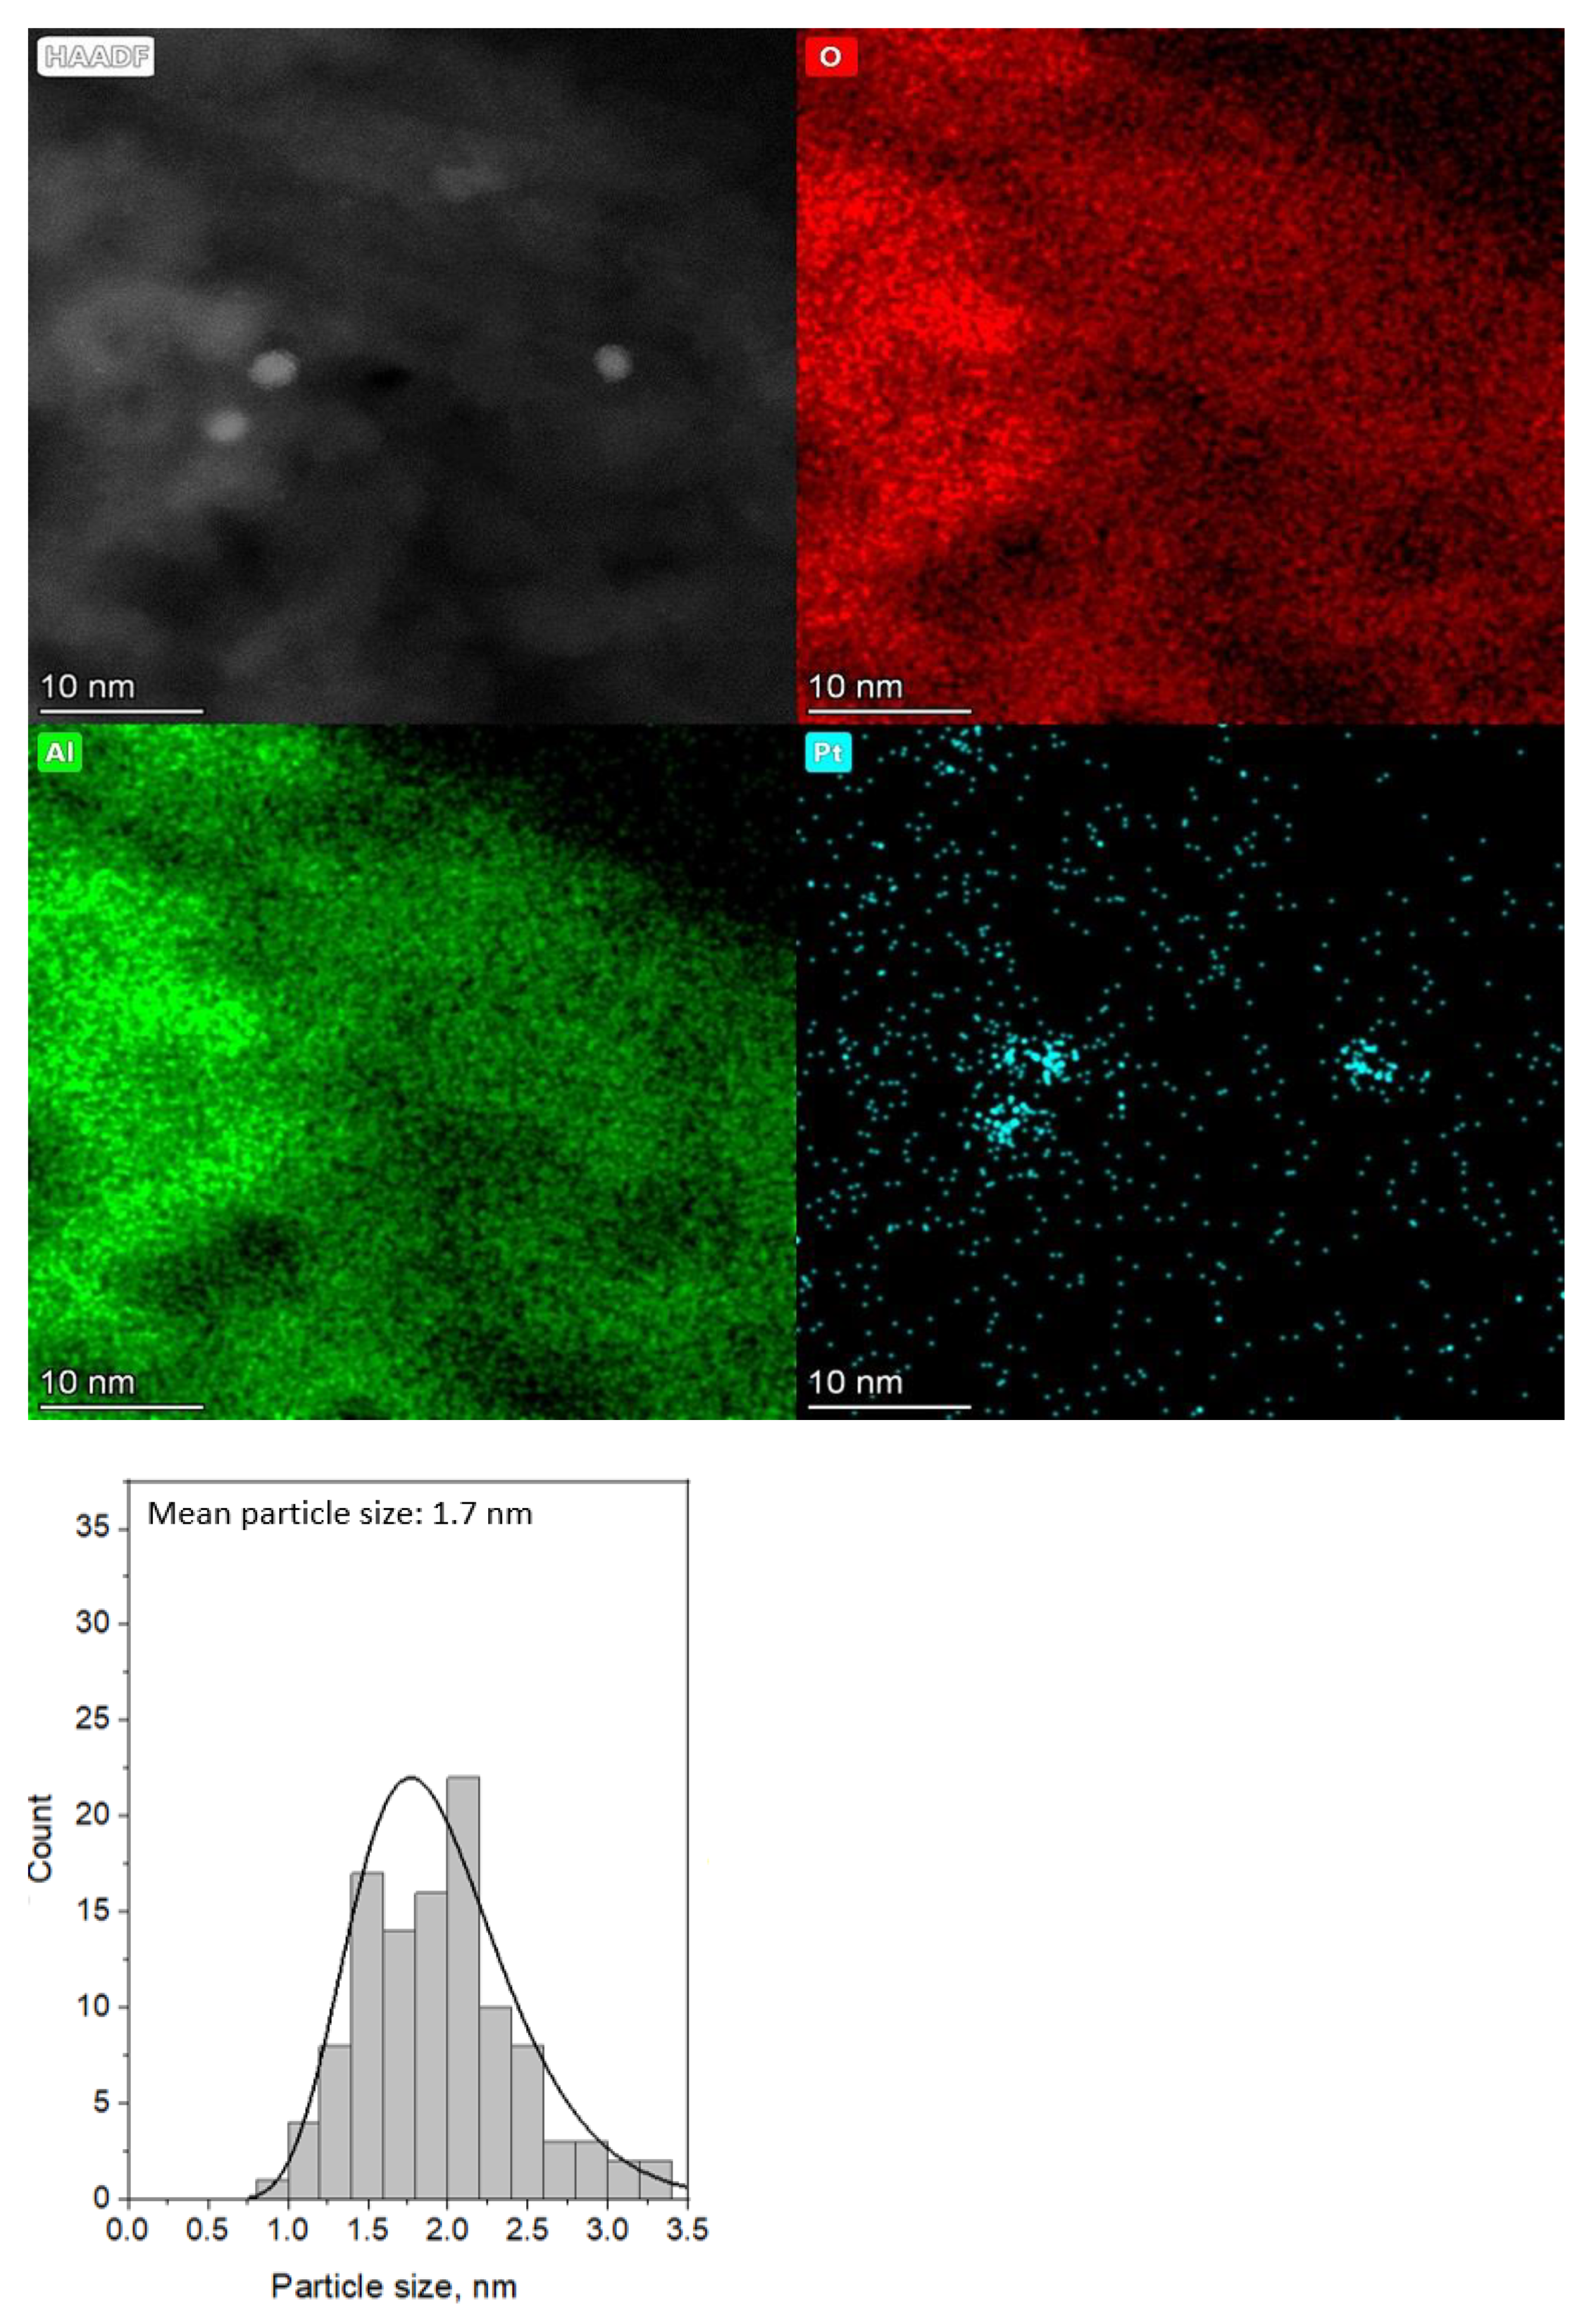
2.2.4. HAADF–STEM Imaging and STEM–EDX Mapping

The morphologies of the prepared samples were characterized by HAADF–STEM imaging and STEM–EDX mapping. Examples of data are shown in Figure 6 and Figure 7, together with the corresponding particle size distribution histograms. The CAT-A catalyst showed numerous Pt clusters, compared to the CAT-B catalyst. The mean particle sizes of CAT-A and CAT-B catalysts are 1.1 nm and 1.7 nm, respectively. The average particle sizes obtained using SCD/scCO2 are slightly smaller than those obtained using the WI method. This is probably due to the thermal reduction in the metal precursor, rather than chemical reduction with hydrogen gas [37]. The smaller the Pt particle size, the higher the dispersion and the high surface area for the reaction [16]. Hence, CAT-A with a mean particle size of 1.1 nm and dispersion of 45% showed higher catalytic activity compared to CAT-B, with a mean particle size of 1.7 nm diameter and dispersion of 32%.

3. Materials and Methods

3.1. Catalyst Preparation

The materials and methods applied in the preparation of Pt/Al2O3 catalysts using the SCD method (catalyst ID: CAT-A) and the conventional WI method (catalyst ID: CAT-B) are explained in detail below. A Pt/Al2O3 catalyst supplied by OEM (catalyst ID: CAT-C) was used as a benchmark.

3.1.1. Chemicals

Dimethyl(1,5-cyclooctadiene)platinum(II) (Pt(cod)Me2) (MW 333.33 g/mol, metal content 59 mol %, purity 97%, melting point 105 °C) was purchased from STREM Chemicals Inc (MA, USA). CO2 and N2 gases were purchased from Air Liquide (Istanbul, Turkey). Hexachloroplatinic acid (38% Pt basis, melting point 60 °C, MW 409.81 g/mol anhydrous basis) was purchased from Sigma-Aldrich (Schnelldorf, Germany). H0-DBT (MW 272 g/mol, concentration 100% w/w, boiling point 390 °C, melting point −39 °C) was purchased from Sasol (Marl, Germany), under the trade name Marlotherm-SH (currently sold by Eastman Chemicals, Marl, Germany). H0-DBT was hydrogenated in-house to obtain H18-DBT with a degree of hydrogenation (doh) of 99%. The catalyst support material (γ-alumina trilobes) of ~2 mm in diameter was obtained from Clariant (Johannesburg, South Africa). As determined in an earlier study, using the N2 physisorption technique [16], the γ-Al2O3 trilobes employed here have a specific surface area, pore volume and pore diameter of 190 m2/g, 0.6 cm3/g and 11 nm, respectively. WI and SCD/scCO2 catalyst preparation methods were carried out utilising the same γ-Al2O3 support material.

3.1.2. Wet Impregnation Method (WI)

Catalyst preparation using the WI method is described in our previous work [18]. A solution of chloroplatinic acid (0.025 M) was added to alumina extrudates to produce a 0.5 wt % Pt loading. A Büchi Rotavapor® R300 (Flawil, Switzerland) was used to remove water, under vacuum, from the extrudates (heating bath temperature 50 °C, evaporating flask under 46 mbar vacuum pressure, rotation speed 40 rpm). The impregnated pellets were dried in an Espec SU-22 oven (Espec North America Inc., MI, USA) at 120 °C for 4 h. Thereafter, extrudates were calcined at 350 °C (temperature ramp rate 5 °C/min) in a stream of air (150 mL/min) for 5 h, in a furnace (Carbolite, Sheffield, UK). The calcined catalysts were reduced in a stream of 10% H2/Ar (50 mL/min) over a period of 4 h at 350 °C, to afford a yield of 50 g Pt/Al2O3 catalyst. The same alumina support was used as for the SCD method.

3.1.3. Supercritical CO2 Deposition Method (SCD/scCO2)

For catalyst preparation using the SCD method, a custom-made high-pressure stainless steel (SS) vessel (57 mL) was used. It had two sapphire windows (diameters 2.5 cm), a rupture disc assembly, a vent line, a thermowell and a pressure transducer. The experimental set-up is shown in Figure S1 (Supporting information).
Prior to the SCD process, Al2O3 was dried in an oven at 120 °C for 2 h (to remove moisture). Pt/Al2O3 was prepared by filling the vessel with ~3 g Al2O3 and a certain quantity of Pt(cod)Me2 to yield 0.5 wt % metal loading after conversion of the precursor to its metal form. A stirrer bar was placed in the vessel to ensure homogeneous mixing during the deposition. An Al2O3 support was placed on a grade 316 SS screen, which was placed along the centre line of the vessel, to avoid contact between the support material and the stirrer bar. The vessel was then sealed with polyether ether ketone O-rings inside and outside of the sapphire windows and placed on a magnetic stirrer. Since the presence of air may interfere with the SCD process, air was displaced by low-pressure CO2 before deposition commenced. The vessel was then heated to 35 °C by means of a circulating heater. Throughout the SCD process, the temperature of the vessel was controlled by this circulating heater, in which water was used as the heating medium. The temperature of the vessel was monitored by means of a thermowell that reached the centre of the vessel. Once the temperature had reached the deposition temperature, CO2 was pumped into the vessel (using a syringe pump) until the pressure inside the vessel reached 15.5 MPa, thus ensuring the dissolution of the precursor in the scCO2 and adsorption of the precursor onto the porous support. The vessel was held under these conditions for 22 h, whereafter it was depressurised at a rate of 0.7 MPa/min under isothermal conditions at 35 °C. A Pt(cod)Me2/Al2O3 composite was thus obtained.
The conversion of Pt(cod)Me2 was conducted thermally in a tubular furnace. The composite was placed in a porcelain combustion boat for easy handling. The combustion boat was positioned at the centre of a quartz process tube, which was then placed inside a tubular furnace. Pt(cod)Me2 was converted to form Pt nanoparticles under the following conditions: flowing N2 (100 mL/min; NTP), 400 °C, atmospheric pressure, 4 h. On completion of the conversion process, the system was cooled to room temperature (rt) under flowing N2. The Pt/Al2O3 catalyst yield of 3 g was subsequently obtained.

3.1.4. Determination of Catalyst Performance

The determination of the catalyst performance for the dehydrogenation of H18-DBT was carried out using a 250 mL three-necked round bottom flask as a batch reactor. A digital temperature controller (PL524 Pro; Wiggens, Beijing, China) was used to measure, control and monitor the temperature of the dehydrogenation reaction. The hydrogen flow rate was measured using a mass flow meter (EL-Flow F11B-500-AGD-22V; Bronkhorst High-Tech B.V., Ruurlo, The Netherlands), which was also integrated with the LabView system for data logging. A schematic representation of the dehydrogenation set-up is shown in Figure S2 (Supporting information). The liquid samples were analysed to determine the degree of dehydrogenation (dod) using calibrated refractive index equipment (Abbemat 300; Anton Paar, Johannesburg, South Africa). Furthermore, single quadrupole gas chromatography–mass spectrometry (GC-SQ-MS) was also used for the analysis of the liquid samples to determine the H18-DBT conversion, H0-DBT selectivity and formation of by-products. The GC-SQ-MS method is described in more detail in our previous work [38]; it was based on the analytical method described by Aslam et al. [39].

3.2. Characterization

The catalysts prepared using the WI and SCD methods were characterised as described below. The benchmark catalyst (supplied by OEM) was not characterised, to avoid the disclosure of confidential information.
Chemisorption experiments were performed using a chemisorption analyser (AutoChem II 2920; Micromeritics, GA, USA) equipped with a thermal conductivity detector (TCD). The fresh and used catalyst samples were weighed to a mass of ~0.3 g and loaded into a quartz U-tube fitted with quartz wool at the bottom. For the carbon monoxide (CO) pulse chemisorption experiments, the catalyst was first reduced to allow the reaction to take place on the Pt nanoparticles. CO chemisorption was carried out at 35 °C under a He stream (flow rate 50 mL/min), using a pulsed chemisorption technique (0.5 mL pulses of CO injected).
NH3-TPD experiments were performed to determine the acidity of the catalysts. Samples were pre-treated at 500 °C for 1 h under a He stream (flow rate 30 mL/min). This was followed by the saturation of samples with a 10% NH3/He at 120 °C. The desorption of NH3 was determined using a TCD, at temperatures ranging from 100 to 900 °C (temperature ramp rate 10 °C/min).
HAADF–STEM images were recorded using a Titan Themis probe-corrected STEM, instrument operated at an accelerating voltage of 300 kV. At least 100 particles were measured, using image J to obtain the particle size distribution histograms. From the histograms, a lognormal distribution curve was fitted and used to determine the mean particle size. STEM X-ray maps were also obtained using the Titan Themis STEM instrument. The latter is equipped with a Super-X silicon drift detector system that allows for the rapid acquisition of energy-dispersive X-ray spectroscopy (EDX) data. Impurities in the catalysts were determined by SEM–EDX, using a FEI Quanta 250 field emission gun scanning electron microscope (ThermoFisher Scientific, Waltham, MA, USA), operating at an accelerating voltage of 15 kV. However, SEM imaging was not performed because the coating material was carbon, which would have interfered with the analysis.

4. Conclusions

A Pt/Al2O3 catalyst, for the dehydrogenation of H18-DBT, prepared using the SCD method with scCO2 (SCD/scCO2) exhibited improved catalytic performance and less deactivation compared to the benchmark catalyst and the one prepared using the WI method. For all three catalysts studied, the significant deactivation between runs 1 and 2 can be attributed to the low desorption of the product (H0-DBT) and, therefore, the blockage of the reaction sites. The SCD/scCO2-prepared catalyst produced the highest number of by-products and carbon impurities on the catalyst surface. The higher the dod, the more aromatic products are formed, which are susceptible to reacting on the acidic sites of the catalyst; hence, cracking occurs. In conclusion, it is recommended that the further modification of the catalyst is required to optimize the acidity of the support material, and also to promote the desorption of the H0-DBT product and the diffusion of H0-DBT from the catalyst pores.

Supplementary Materials

The following supporting information can be downloaded at: https://0-www-mdpi-com.brum.beds.ac.uk/article/10.3390/catal12050489/s1, Figure S1. Schematic representation of the experimental set-up used for supercritical deposition; Figure S2. Schematic representation of the dehydrogenation set-up

Author Contributions

Conceptualization, P.M., C.E. and D.B.; methodology, P.M., H.G., S.R., S.E.B. and E.U.; formal analysis, P.M.; resources, C.E. and D.B.; data curation, P.M., R.G., M.A. and S.R.; writing—original draft preparation, P.M.; writing—review and editing, D.B., C.E. and S.E.B.; supervision, M.A., C.E. and D.B.; project administration, D.B.; funding acquisition, D.B. All authors have read and agreed to the published version of the manuscript.

Funding

Financial support from the DSI HySA Infrastructure Centre of Competence through a KP5 grant, and the NRF grant 119004 are gratefully acknowledged.

Data Availability Statement

The data supporting the findings of this study are incorporated in the article.

Acknowledgments

North-West University, Potchefstroom campus, is gratefully acknowledged.

Conflicts of Interest

The authors declare no conflict of interest.

References

  1. Züttel, A. Hydrogen Storage Methods. Naturwissenschaften 2004, 91, 157–172. [Google Scholar] [CrossRef] [PubMed]
  2. Barthélémy, H. Hydrogen Storage—Industrial Prospectives. Int. J. Hydrogen Energy 2012, 37, 17364–17372. [Google Scholar] [CrossRef]
  3. Zhang, M.; Lv, H.; Kang, H.; Zhou, W.; Zhang, C. A Literature Review of Failure Prediction and Analysis Methods for Composite High-Pressure Hydrogen Storage Tanks. Int. J. Hydrogen Energy 2019, 44, 25777–25799. [Google Scholar] [CrossRef]
  4. Berstad, D.O.; Stang, J.H.; Nekså, P. Comparison Criteria for Large-Scale Hydrogen Liquefaction Processes. Int. J. Hydrogen Energy 2009, 34, 1560–1568. [Google Scholar] [CrossRef]
  5. Laouir, A. Performance Analysis of Open-Loop Cycles for LH2 Regasification. Int. J. Hydrogen Energy 2019, 44, 22425–22436. [Google Scholar] [CrossRef]
  6. Lee, S.; Kim, T.; Han, G.; Kang, S.; Yoo, Y.S.; Jeon, S.Y.; Bae, J. Comparative energetic studies on liquid organic hydrogen carrier: A net energy analysis. Renew. Sustain. Energy Rev. 2021, 150, 111447. [Google Scholar] [CrossRef]
  7. Modisha, P.M.; Ouma, C.N.M.; Garidzirai, R.; Wasserscheid, P.; Bessarabov, D. The Prospect of Hydrogen Storage Using Liquid Organic Hydrogen Carriers. Energy Fuels 2019, 33, 2778–2796. [Google Scholar] [CrossRef]
  8. Sisakova, K.; Podrojkova, N.; Orinakova, R.; Oriňak, A. Novel Catalysts for Dibenzyltoluene as a Potential Liquid Organic Hydrogen Carrier Use—A Mini-review. Energy Fuels 2021, 35, 7608–7623. [Google Scholar] [CrossRef]
  9. Rao, P.C.; Yoon, M. Potential liquid-organic hydrogen carrier (LOHC) systems: A review on recent progress. Energies 2020, 13, 6040. [Google Scholar] [CrossRef]
  10. Brückner, N.; Obesser, K.; Bösmann, A.; Teichmann, D.; Arlt, W.; Dungs, J.; Wasserscheid, P. Evaluation of Industrially Applied Heat-Transfer Fluids as Liquid Organic Hydrogen Carrier Systems. ChemSusChem 2014, 7, 229–235. [Google Scholar] [CrossRef]
  11. Dong, Y.; Yang, M.; Mei, P.; Li, C.; Li, L. Dehydrogenation Kinetics Study of Perhydro-N-Ethylcarbazole over a Supported Pd Catalyst for Hydrogen Storage Application. Int. J. Hydrogen Energy 2016, 41, 8498–8505. [Google Scholar] [CrossRef]
  12. Steinhauer, J.; Bachmann, P.; Freiberger, E.M.; Bauer, U.; Steinrück, H.P.; Papp, C. Model Catalytic Studies of Liquid Organic Hydrogen Carriers: Indole/Indoline/Octahydroindole on Ni(111). J. Phys. Chem. C 2020, 124, 22559–22567. [Google Scholar] [CrossRef]
  13. Chen, Z.; Yang, M.; Zhu, T.; Zhang, Z.; Chen, X.; Liu, Z.; Dong, Y.; Cheng, G.; Cheng, H. 7-Ethylindole: A New Efficient Liquid Organic Hydrogen Carrier with Fast Kinetics. Int. J. Hydrogen Energy 2018, 43, 12688–12696. [Google Scholar] [CrossRef]
  14. Jorschick, H.; Geißelbrecht, M.; Eßl, M.; Preuster, P.; Bösmann, A.; Wasserscheid, P. Benzyltoluene/Dibenzyltoluene-Based Mixtures as Suitable Liquid Organic Hydrogen Carrier Systems for Low Temperature Applications. Int. J. Hydrogen Energy 2020, 45, 14897–14906. [Google Scholar] [CrossRef]
  15. Teichmann, D.; Stark, K.; Müller, K.; Zöttl, G.; Wasserscheid, P.; Arlt, W. Energy Storage in Residential and Commercial Buildings via Liquid Organic Hydrogen Carriers (LOHC). Energy Environ. Sci. 2012, 5, 9044–9054. [Google Scholar] [CrossRef] [Green Version]
  16. Modisha, P.; Gqogqa, P.; Garidzirai, R.; Ouma, C.N.M.; Bessarabov, D. Evaluation of Catalyst Activity for Release of Hydrogen from Liquid Organic Hydrogen Carriers. Int. J. Hydrogen Energy 2019, 44, 21926–21935. [Google Scholar] [CrossRef]
  17. Modisha, P.; Bessarabov, D. Stress Tolerance Assessment of Dibenzyltoluene-Based Liquid Organic Hydrogen Carriers. Sustain. Energy Fuels 2020, 4, 4662–4670. [Google Scholar] [CrossRef]
  18. Garidzirai, R.; Modisha, P.; Shuro, I.; Visagie, J.; van Helden, P.; Bessarabov, D. The Effect of Mg and Zn Dopants on Pt/Al2 O3 for the Dehydrogenation of Perhydrodibenzyltoluene. Catalysts 2021, 11, 490. [Google Scholar] [CrossRef]
  19. Jo, Y.; Oh, J.; Kim, D.; Park, J.H.; Baik, J.H.; Suh, Y.W. Recent progress in dehydrogenation catalysts for heterocyclic and homocyclic liquid organic hydrogen carriers. Korean J. Chem. Eng. 2022, 39, 20–37. [Google Scholar] [CrossRef]
  20. Auer, F.; Blaumeiser, D.; Bauer, T.; Bösmann, A.; Szesni, N.; Libuda, J.; Wasserscheid, P. Boosting the Activity of Hydrogen Release from Liquid Organic Hydrogen Carrier Systems by Sulfur-Additives to Pt on Alumina Catalysts. Catal. Sci. Technol. 2019, 9, 3537–3547. [Google Scholar] [CrossRef]
  21. Ouma, C.N.M.; Obodo, K.O.; Modisha, P.M.; Rhyman, L.; Ramasami, P.; Bessarabov, D. Effect of Chalcogen (S, Se and Te) Surface Additives on the Dehydrogenation of a Liquid Organic Hydrogen Carrier System, Octahydroindole–Indole, on a Pt (1 1 1) Surface. Appl. Surf. Sci. 2021, 566, 150636. [Google Scholar] [CrossRef]
  22. Auer, F.; Hupfer, A.; Bösmann, A.; Szesni, N.; Wasserscheidpeter, P. Influence of the Nanoparticle Size on Hydrogen Release and Side Product Formation in Liquid Organic Hydrogen Carrier Systems with Supported Platinum Catalysts. Catal. Sci. Technol. 2020, 10, 6669–6678. [Google Scholar] [CrossRef]
  23. Catalyst Development for Improved Economic Viability of LOHC Technology l Programme l H2020 l CORDIS l European Commission (Europa.Eu). Available online: https://cordis.europa.eu/programme/id/H2020_FCH-02-1-2020 (accessed on 25 February 2022).
  24. Türk, M.; Erkey, C. Synthesis of Supported Nanoparticles in Supercritical Fluids by Supercritical Fluid Reactive Deposition: Current State, Further Perspectives and Needs. J. Supercrit. Fluids 2018, 134, 176–183. [Google Scholar] [CrossRef]
  25. Seshimo, M.; Hirai, T.; Rahman, M.M.; Ozawa, M.; Sone, M.; Sakurai, M.; Higo, Y.; Kameyama, H. Functionally Graded Pd/γ-Alumina Composite Membrane Fabricated by Electroless Plating with Emulsion of Supercritical CO2. J. Membr. Sci. 2009, 342, 321–326. [Google Scholar] [CrossRef]
  26. Zhang, Y.; Kang, D.; Saquing, C.; Aindow, M.; Erkey, C. Supported Platinum Nanoparticles by Supercritical Deposition. Ind. Eng. Chem. Res. 2005, 44, 4161–4164. [Google Scholar] [CrossRef]
  27. Sootodeh, F.; de Vries, T.J.; Woerlee, G.F. 6 CO2 as a Solvent. In Carbon Dioxide Utilisation; North, M., Styring, P., Eds.; de Gruyter: Berlin, Germany, 2019; pp. 79–104. [Google Scholar]
  28. Ali, A.; Udaya Kumar, G.; Lee, H.J. Parametric Study of the Hydrogenation of Dibenzyltoluene and Its Dehydrogenation Performance as a Liquid Organic Hydrogen Carrier. J. Mech. Sci. Technol. 2020, 34, 3069–3077. [Google Scholar] [CrossRef]
  29. Lee, S.; Han, G.; Kim, T.; Yoo, Y.S.; Jeon, S.Y.; Bae, J. Connected Evaluation of Polymer Electrolyte Membrane Fuel Cell with Dehydrogenation Reactor of Liquid Organic Hydrogen Carrier. Int. J. Hydrogen Energy 2020, 45, 13398–13405. [Google Scholar] [CrossRef]
  30. Lee, S.; Lee, J.; Kim, T.; Han, G.; Lee, J.; Lee, K.; Bae, J. Pt/CeO2 Catalyst Synthesized by Combustion Method for Dehydrogenation of Perhydro-Dibenzyltoluene as Liquid Organic Hydrogen Carrier: Effect of Pore Size and Metal Dispersion. Int. J. Hydrogen Energy 2021, 46, 5520–5529. [Google Scholar] [CrossRef]
  31. Jorschick, H.; Dürr, S.; Preuster, P.; Bösmann, A.; Wasserscheid, P. Operational Stability of a LOHC-Based Hot Pressure Swing Reactor for Hydrogen Storage. Energy Technol. 2019, 7, 146–152. [Google Scholar] [CrossRef] [Green Version]
  32. Jorschick, H.; Preuster, P.; Dürr, S.; Seidel, A.; Müller, K.; Bösmann, A.; Wasserscheid, P. Hydrogen Storage Using a Hot Pressure Swing Reactor. Energy Environ. Sci. 2017, 10, 1652–1659. [Google Scholar] [CrossRef] [Green Version]
  33. Gutiérrez-Alejandre, A.; González-Cruz, M.; Trombetta, M.; Busca, G.; Ramírez, J. Characterization of Alumina-Titania Mixed Oxide Supports: Part II: Al2O3-Based Supports. Microporous Mesoporous Mater. 1998, 23, 265–275. [Google Scholar] [CrossRef]
  34. Shi, Y.; Li, X.; Rong, X.; Gu, B.; Wei, H.; Sun, C. Influence of Support on the Catalytic Properties of Pt-Sn-K/θ-Al2O3 for Propane Dehydrogenation. RSC Adv. 2017, 7, 19841–19848. [Google Scholar] [CrossRef] [Green Version]
  35. Stanislaus, A.; Absi-Halabi, M.; Al-Doloma, K. Effect of Phosphorus on the Acidity of γ-Alumina and on the Thermal Stability of γ-Alumina Supported Nickel-Molybdenum Hydrotreating Catalysts. Appl. Catal. 1988, 39, 239–253. [Google Scholar] [CrossRef]
  36. Lai, Y.; He, S.; Li, X.; Sun, C.; Seshan, K. Dehydrogenation of N-Dodecane over PtSn/MgAlO Catalysts: Investigating the Catalyst Performance While Monitoring the Products. Appl. Catal. A Gen. 2014, 469, 74–80. [Google Scholar] [CrossRef]
  37. Saquing, C.D.; Kang, D.; Aindow, M.; Erkey, C. Investigation of the Supercritical Deposition of Platinum Nanoparticles into Carbon Aerogels. Microporous Mesoporous Mater. 2005, 80, 11–23. [Google Scholar] [CrossRef]
  38. Modisha, P.M.; Jordaan, J.H.L.; Bösmann, A.; Wasserscheid, P.; Bessarabov, D. Analysis of Reaction Mixtures of Perhydro-Dibenzyltoluene Using Two-Dimensional Gas Chromatography and Single Quadrupole Gas Chromatography. Int. J. Hydrogen Energy 2018, 43, 5620–5636. [Google Scholar] [CrossRef]
  39. Aslam, R.; Minceva, M.; Müller, K.; Arlt, W. Development of a Liquid Chromatographic Method for the Separation of a Liquid Organic Hydrogen Carrier Mixture. Sep. Purif. Technol. 2016, 163, 140–144. [Google Scholar] [CrossRef]
Figure 1. Catalytic performance evaluation of CAT-A, CAT-B and CAT-C: (a) Comparison of the initial stability of the catalysts based on the dod over 10 dehydrogenation runs; (b) initial activity and stability of the catalysts based on productivity vs. number of runs; (c) conversion of H18-DBT based on runs 1 and 10; (d) selectivity of catalysts towards H0-DBT based on runs 1 and 10; (e) deactivation over 10 dehydrogenation runs; (f) turnover frequency of catalysts for dehydrogenation of H18-DBT. Reaction conditions: batch reactor, reaction time 100 min for each run, reaction temperature 300 °C, catalyst Pt/Al2O3, mol. ratio: nPt/nH18-DBT (99.7doh) = 0.05 mol %.
Catalysts 12 00489 g001
Figure 2. Ammonia TPD profiles of CAT-A before (a) and after (b) the dehydrogenation reaction.
Catalysts 12 00489 g002
Figure 3. Ammonia TPD profiles of CAT-B before (a) and after (b) the dehydrogenation reaction.
Catalysts 12 00489 g003
Figure 4. Results of investigation into the effect of the product (H0-DBT) on the catalyst deactivation. Reaction conditions: batch reactor, reaction time 100 min for each run, reaction temperature 300 °C, CAT-A (Pt/Al2O3), nPt/nH18-DBT (99.7 doh) 0.05 mol %.
Catalysts 12 00489 g004
Figure 5. Quantity of by-products produced using CAT-A, CAT-B and CAT-C for dehydrogenation of H18-DBT. Reaction conditions: batch reactor, reaction time 100 min for each run, reaction temperature 300 °C, catalyst Pt/Al2O3, nPt/nH18-DBT (99.7 doh) 0.05 mol %.
Catalysts 12 00489 g005
Figure 6. HAADF–STEM imaging, elemental EDS mapping images and particle size distribution from CAT-A catalyst prepared using SCD/scCO2.
Catalysts 12 00489 g006
Figure 7. HAADF–STEM imaging, elemental EDS mapping images and particle size distribution from CAT-B catalyst prepared using WI.
Catalysts 12 00489 g007
Table 1. Catalyst performance for the dehydrogenation of H18-DBT: summary. Reaction conditions: batch reactor, reaction time 100 min for each run, reaction temperature 300 °C, catalyst Pt/Al2O3, nPt/nH18-DBT (99.7doh) 0.05 mol %.
CatalystProductivity
gH2/gPt/min
Degree of Dehydrogenation (%)H18-DBT Conversion
(%)
H0-DBT
Selectivity
(%)
TOF (s−1)
Run 1Run 10Run 1Run 10Run 1Run 10Run 1Run 10Run 1Run 10
CAT-A2.771.826038896738254.52.9
CAT-B1.420.712515313155.621.3
CAT-C3.501.30542788384213--
Table 2. Physico-chemical properties of catalysts before and after dehydrogenation of H18-DBT, including the quantity of carbon impurities.
Catalyst IDDispersion (%)Carbon Content
(%) *
NH3–TPD
Peak
Fraction
A (%)
Peak Fraction
B (%)
Peak Fraction
C (%)
Acidity
mmol NH3/g
CAT-A +45-4258-0.79
CAT-B +32-3356140.98
CAT-A $37321442440.74
CAT-B $22231743400.85
Publisher’s Note: MDPI stays neutral with regard to jurisdictional claims in published maps and institutional affiliations.

