Article

Catalytic Activation of Hydrogen Peroxide Using Highly Porous Hydrothermally Modified Manganese Catalysts for Removal of Azithromycin Antibiotic from Aqueous Solution

1
Department of Applied Chemistry, Bu-Ali Sina University, Hamedan 65174, Iran
2
School of Engineering, University of Guelph, Guelph, ON N1G2W1, Canada
*
Authors to whom correspondence should be addressed.
Submission received: 18 November 2022 / Revised: 20 December 2022 / Accepted: 28 December 2022 / Published: 30 December 2022

Abstract

:
Hydrogen peroxide catalytic activation holds great promise in the treatment of persistent pollutants. In this study, the novel Mn-Acacair/Al, Mn-Acacarg/Al and Mn-BTCarg/Al catalysts, supported on Al2O3, were applied for rapid hydrogen peroxide activation and azithromycin antibiotic removal. The catalysts were prepared by the calcination-hydrothermal method under air or argon atmosphere. The characterization confirmed that the modification of manganese with acetylacetonate and benzene-1,3,5-tricarboxylic acid (H3BTC) O-donor ligands highly improves the catalyst porosity, amorphousity, and abundance of coordinately unsaturated sites, which facilitate the generation of reactive oxygen species. The hydrogen peroxide activation and azithromycin removal reached 98.4% and 99.3% after 40 min using the Mn-BTCarg/Al catalyst with incredible stability and reusability. Only a 5.2% decrease in activity and less than 2% manganese releasing in solutions were detected after five regeneration cycles under the optimum operating conditions. The removal intermediates were identified by LC-MS/MS analysis, and the pathways were proposed. The hydroxylation and decarboxylation reactions play a key role in the degradation reaction.

Graphical Abstract

1. Introduction

The frequent detection of antibiotics in water sources has increased global concerns. The spreading of antibiotics in the environment causes aquatic toxicity, chronic effects on marine organisms, and disrupts the population of bacteria. Unsustainability and genetic toxicity, which raise cancer and mutation among creatures, are the other mal-effects of antibiotic wastes on the ecosystem [1]. The main antibiotics sources enter to the environment are the pharmaceutical and hospital wastewaters. The antibiotics concentrations of these wastewaters are more than the acceptable standard level (1 mg/L) and it is necessary to be treated before entering the municipal sewage system [2]. Among the various types of antibiotics, azithromycin (Azi), C38H72N2O12, is known as a broad-spectrum antimicrobial agent for the treatment of infectious diseases in humans [2]. Due to its extensive use and partial absorption in the patient body, about 70% of Azi enters the environment as nonmetabolized or conjugated Azi through urine and feces [2,3]. This, in turn, has raised the Azi concentration to the highest level compared to the other antibiotics in the influent of wastewater treatment plants. Noteworthy, low achievements in the Azi removal have been reported using conventional biological treatments [4]. In this regard, a biological study for some wastewater treatment plants in China has revealed the lowest removal efficiency for Azi (6.3%) among the 16 common antibiotics [4].
In recent years, well-known advanced oxidation processes (AOPs) such as Fenton, photolysis, photocatalysis, ozonation and catalysis have been utilized in the degradation and removal of antibiotics [2,5,6]. Among them, catalytic activation of oxidants has received tremendous attention due to its high efficiency, stability and low operating costs [5]. The dominant mechanism is generating reactive oxygen species (ROS) for oxidizing organic compounds. In this regard, hydrogen peroxide as a green, non-selective and the most powerful oxidant widely used in the catalytic treatments. H2O2 also has none problems of gaseous release or chemical residues that are associated with the other oxidants [7,8]. Hydrogen peroxide can be injected (ex situ) or generated (in situ) in the treatment system. Appling the ex situ H2O2 may increase the operation costs, but the better controlling of oxidation conditions (contact time, oxidant concentration) and homogeneous distribution of the oxidant tremendously improve the efficiency of system [7,8].
Active redox species of transition metals (such as iron oxide, cobalt oxides, and manganese oxides) are conventionally used in the role of the activation catalysts. Manganese is an available, economical, low-toxic multivalent metal with the ability to undergo quick and reversible redox reactions and self-recovering. This metal has impressive activity in the H2O2 catalytic process [9]. These advantages encouraged the authors to use manganese for Azi removal via the H2O2 activation process. For this aim, the structural and electronic modifications of manganese catalysts are essential to generate more active sites with less activation energy and higher capacity of H2O2 adsorption and ROS generation.
Recent investigations suggest that manganese metal-organic frameworks (MOFs) give high surface area, tunable pore structure, and more active redox sites compared to individual manganese oxides [10,11]. Moreover, low-crystalline MOFs with distinct crystallographic structures and long-range disorders raise the abundance of surface coordinately unsaturated active sites (oxygen vacancies) [7]. According to the Wu et al. report, decreasing the hydrothermal synthesis duration of MOFs gives more amorphousity [12]. On the other hand, Reinsch and Stock have reported that thermal activated MOFs contain more coordinately unsaturated sites and structural defects, which facilitate electron and reagent transformation [13]. Therefore, using low-crystalline Mn-MOFs as the active metal precursors to synthesize the catalysts with thermal treatment will produce high surface area catalysts with more coordinately unsaturated sites (active redox sites). However, it should be noted that the MOFs still suffer from the low chemical and thermal stability that causes metal leaching in the reaction media [14]. Based on these points, different strategies have been developed for: i) increasing the metal-ligand bond strength and ii) adsorption/exchange of guest species by constructing MOF catalysts on suitable supports [15].
O-donor organic ligands have been used to generate strong coordinated bonds and enhance the thermal stability of CeO2 and MnOx-CeO2 [16,17]. Therefore, one attractive choice is using acetylacetonate (Acac) and benzene-1,3,5-tricarboxylic acid (H3BTC) with tow acetyl and three carboxylate groups as chelating O-donor ligands that is expected bring about desired stability for Mn-MOF catalysts. In view of catalyst support, the use of graphene as a MOF support for Peroxymonosulfate activation provided high surface area and redox activity [15]. However, the composite has shown poor dispersion due to the weak interaction between MOFs and graphene. Thus, dispersing the Mn-MOF precursors on the chemically active surface of mesoporous alumina via hydrothermal embedding would improve the favorable interactions.
In this study, Acac and H3BTC were selected as O-donor ligands in the synthesis of manganese catalysts. For the first time, the amorphous Mn(Acac)x and Mn(BTC)x were supported on the mesoporous alumina and activated in the air or argon atmosphere. The number of involved ligands corresponding to each Mn atom (x) can be 1, 2 and 3, depending on the synthesis duration and temperature. The prepared catalysts are represented briefly as Mn-Xy/Al2O3 (X = Acac or BTC, and y = air or argon as the calcination atmosphere). The simple impregnating of Mn-MOF precursor followed by thermal decomposition under the air or argon atmospheres to investigate the structural, electrochemical and surface barrier effects of Acac or H3BTC ligands in hydrogen peroxide activation and Azi removal. According to the points mentioned above, the catalysts are expected to exhibit high activity and stability. The best performance catalyst is sought for operations. Further, the optimum operating conditions of pH, catalyst dosage, H2O2 and initial azithromycin concentrations were found. Finally, liquid chromatography-mass spectrometry analysis identified the generated organic intermediates of azithromycin degradation.

2. Materials and Method

2.1. Materials

For the catalyst synthesis, Mn(NO3)2.4H2O, acetylacetonate (Acac), benzene-1,3,5-tricarboxylic acid (H3BTC) and ethanol were purchased from Sigma-Aldrich and used as received. H2O2 solution (30 wt%), sodium chloride (NaCl), sodium hydroxide (NaOH), copper (II) sulfate, dimethyl phenanthroline (DMP), azithromycin dihydrate (C38H72N2O12.2H2O), sodium thiosulfate (Na2SO3), isopropanol, and p-benzoquinone (BQ) were supplied from Merck. The mesoporous alumina, for catalyst support, was supplied by Naftza Company.

2.2. Synthesis of the Catalysts

The mesoporous alumina was first dried at 120 °C in a vacuum oven for 12 h to remove the humidity and impurities. The bare Mn/Al catalyst were prepared via impregnating Mn(NO3)2.4H2O aqueous solution over the alumina support and calcination at 300 °C in the air atmosphere. Solutions of Mn(Acac)x or Mn(BTC)x were synthesized by a sacrificial template method [12,17,18]. Accordingly, Mn(Acac)x was prepared with Mn(NO3)2.4H2O and Acac aqueous solutions (initial molar ratio of 1:3) while stirring at 50 °C in a water bath for 2 h. Additionally, Mn(BTC)x was synthesized by mixing the alcoholic solution of H3BTC and aqueous solution of Mn(NO3)2.4H2O (initial molar ratio of 1:1). After stirring at room temperature for 30 min, the solution was transferred into a Teflon-lined stainless steel autoclave, and the temperature was maintained at 120 °C for 5 h. The prepared solutions were impregnated over alumina support, by continuous stirring and heating at 60 °C. Catalysts were dried at 90 °C in a vacuum oven overnight to remove the solvent and then calcinated at 300 °C for 3 h under air or argon atmospheres in a tube furnace. Calcination in the air atmosphere was performed to remove organic ligands and investigate the metal dispersion and catalyst activity. Calcination in the argon atmosphere was done to remove only the solvent, decreasing the abundance of active metal sites entirely bounded by solvent, generating more coordinately unsaturated sites, and investigating the effect of ligands’ surface barrier and electronic effects on catalytic activity. The catalysts were denoted as Mn/Al, Mn-Acacair/Al, Mn-Acacarg/Al and Mn-BTCarg/Al. The weight percent of manganese in all the prepared catalysts was almost 10%.

2.3. Characterization of the Catalysts

Different update methods were employed to characterize the samples. The textural properties of support and the synthesized catalysts were determined by the BET surface area and BJH pore size distributions measurements via a Micromeritics ASAP-2010 system. The field emission scanning electron microscopy (FESEM, Tescan, MIRA3, Brno, Czech Republic) equipped with energy dispersive X-ray spectroscopy (EDX at 20 kV) and high-resolution transmission electron microscopy (HRTEM, Tecnai G2 F20, Hillsboro, OR, USA) were used to observe the morphology of samples. The X-ray diffraction patterns (XRD) of the samples was recorded by an analytical X-ray diffractometer with Cu/Kα monochromatized (Philips XPertMPD, Almelo, Netherlands). Thermo Scientific K-Alpha instrument equipped with a high resolution Al/Kα X-ray monochromator was applied to record the X-ray photoelectron spectroscopy (XPS) of catalysts. Additionally, the temperature programmed desorption (TPD) pattern of the catalysts were obtained, using a linearly temperature raising under atmospheric pressure of hydrogen and argon flow to measure the metal dispersion and number of active sites per catalysts mass according to the following equations [19]. Finally, the zero point charge pH (pHZPC) of the catalysts was measured by adding 0.1 g sample to the solution of the sodium chloride (NaCl) and sodium hydroxide (NaOH) with initial pH value of 2 to 12.

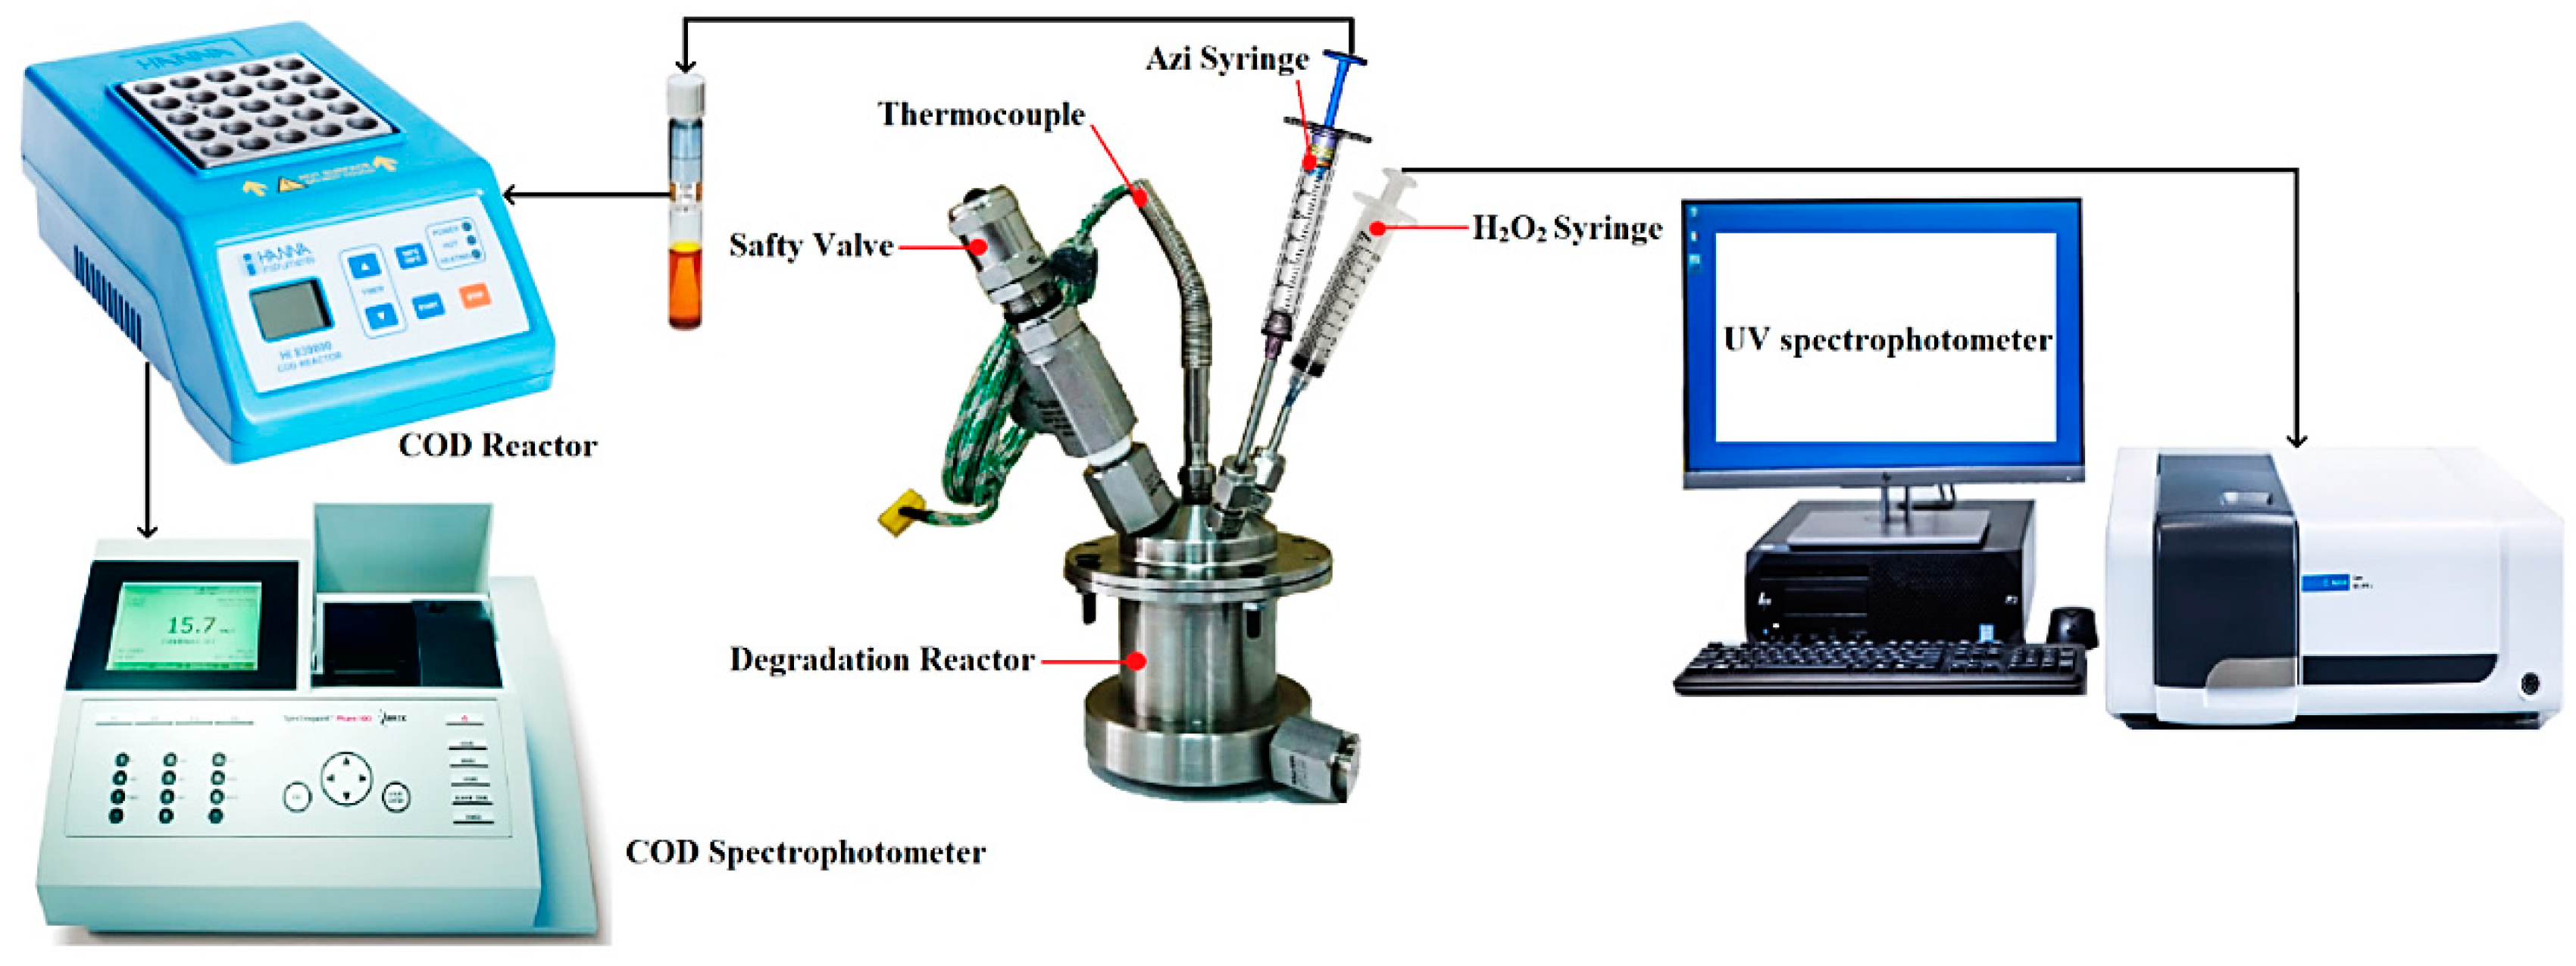
2.4. Experimental Set-Up

The schematic of the used setup is depicted in Figure 1, comprised of three parts: a) the injection section made of two syringes for injecting and sampling the solution of diluted hydrogen peroxide (10 g/L) and the Azi solution (initially, 0.02 to 0.2 g/L), separately. b) the stainless-steel reaction chamber, to eliminate the effect of light on the reaction progress, with a diameter and height of 50 and 70 mm, respectively. A vessel with a volume of 100 cm3 was accommodated in the center of the reactor. c) the analyzing section monitors the reaction progress by sampling the solution every 5 min and determining the H2O2 concentration by the DMP (dimethyl phenanthroline) spectrophotometric method. Hence, for the Azi removal, the reaction progress was followed by quenching the withdrawn samples and introducing them to a COD meter (Rocker, CR25 and CR200) connected to a spectrophotometer.

2.5. Experimental Procedure

In this study, the Azi removal was performed via H2O2 activation. Therefore, measuring the efficiency of catalysts for H2O2 activation and identifying the generated ROS are essential to evaluate the performance of Azi removal. In this regard, preliminary experiments were conducted to find the extent of H2O2 activation under the employed conditions. Accordingly, a certain mass of the synthesized catalyst was first loaded in the reaction chamber, and then H2O2 solution was injected through the 50 mL syringe. The H2O2 concentration of the withdrawn samples was determined with the spectrophotometric dimethyl phenanthroline (DMP) method [20]. Accordingly, the solutions were prepared with dimethyl phenanthroline and copper (II) sulfate added to a specific volume of the withdrawn sample. The absorbance of the diluted samples was measured by a Shimadzu UV-1280 spectrophotometer at 454 nm.
For Azi removal, the required concentration of Azi was gradually added to 100 mL of deionized water. Then, a specified amount of the catalyst was loaded in the reactor chamber, followed by simultaneous injection of H2O2 and Azi solutions through the 50 mL syringes. The reaction solution was sampled every 5 min and quenched with Na2SO3 solution immediately to deactivate the remained H2O2. The added dosage of Na2SO3 was equal to the initial H2O2 molar concentration. Afterward, quenched samples were injected to the COD meter reactor and the spectrophotometer to measure the COD value of samples. The Azi removal efficiency was obtained from:
Azi   mineralization   ( % )   = [ COD ] 0 [ COD ] t [ COD ] 0 × 100
The active species were identified via quenching tests, performed on samples with isopropanol and p-benzoquinone (BQ) as ROS scavengers which exhibit high reactivity with HO and ¯O2, respectively [6,21]. In progress, the operational parameters of pH, catalyst dosage, H2O2 concentration and Azi initial concentration were optimized and the kinetic of reactions was also clarified. Afterward, the stability test of the best efficient catalyst was carried out in five cycles under the optimal operating conditions. The liquid and solid phases were separated after each cycle. The catalysts were used for the next cycle and the liquid phase was monitored via inductively coupled plasma (ICP) analysis by means of a Varian VISTA-MPX instrument to determine the released manganese ions in reaction medium. All tests were repeated three times at room temperature (25 ± 4 °C).
The reaction samples were analyzed via liquid chromatography coupled to high-resolution mass spectrometry, LC-MS/MS, (Agilent 1200–6410 Mass Spectrometer USA) to identify intermediates and the Azi degradation mechanism) under optimized conditions. The HPLC had a 100 × 2.1 mm with 1.8 µm opening size column. Mobile phase consisted of methanol with 0.5% formic acid and deionized water with 0.5% formic acid. The mass spectrometer model worked in positive ionization mode with a drying gas flow of 15 L/min. The gas temperature was maintained at 350 °C, and the capillary voltage was 4000 V. The LC-MS/MS data were collected within (50–1000) m/z.

3. Results and Discussion

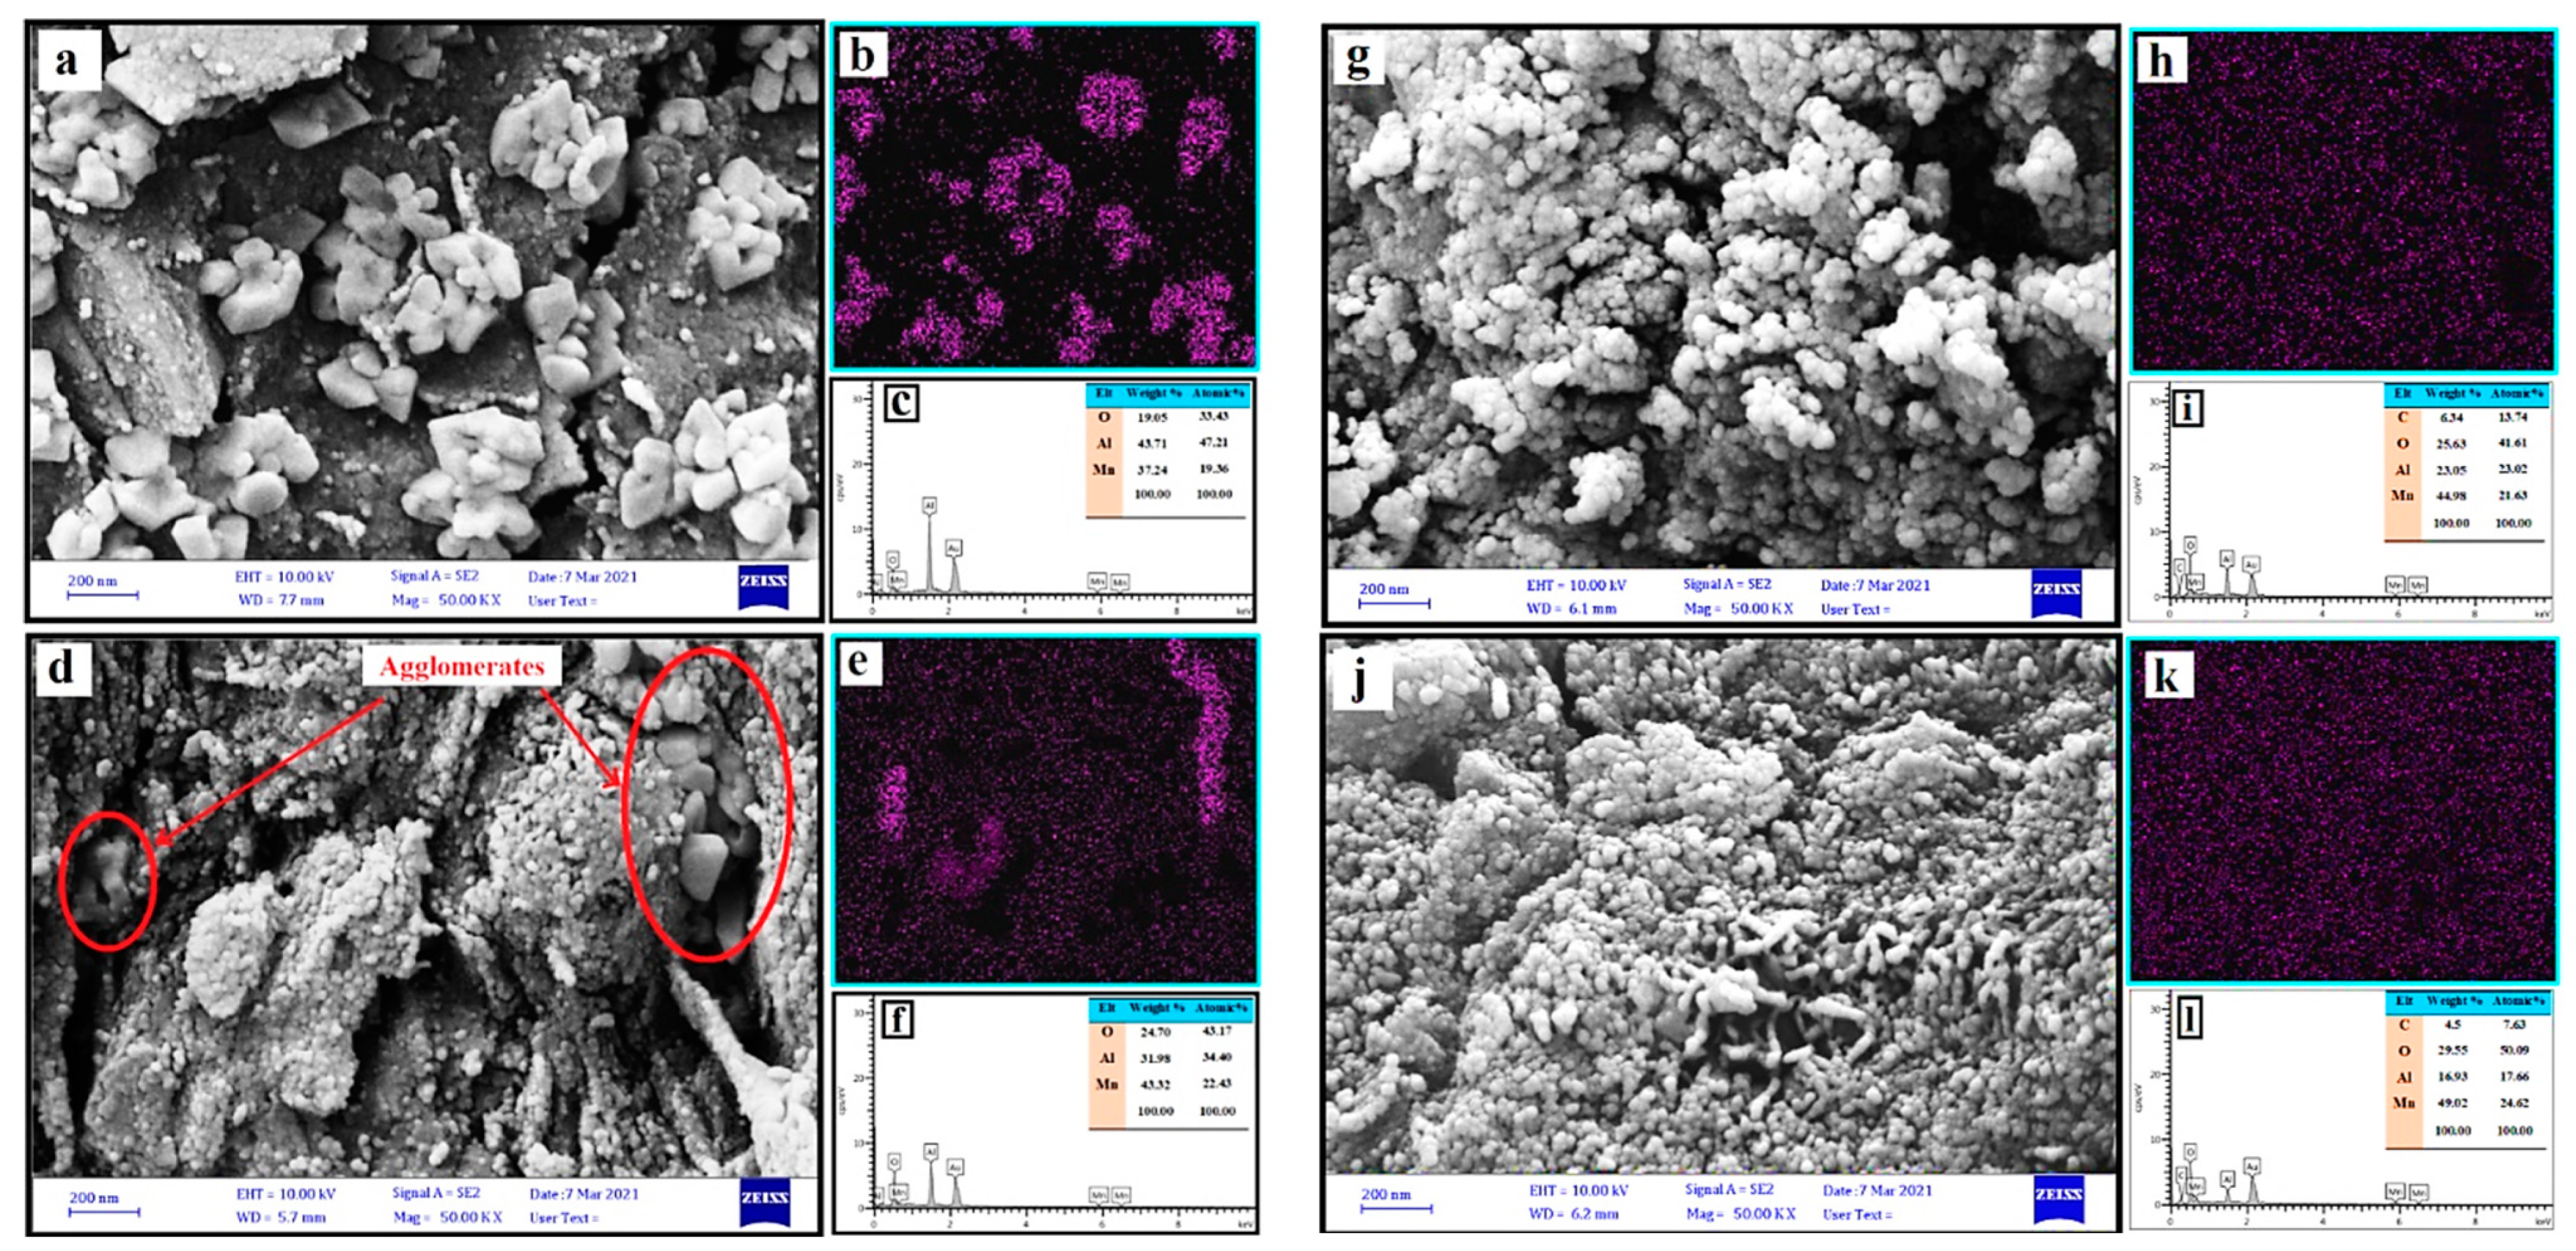
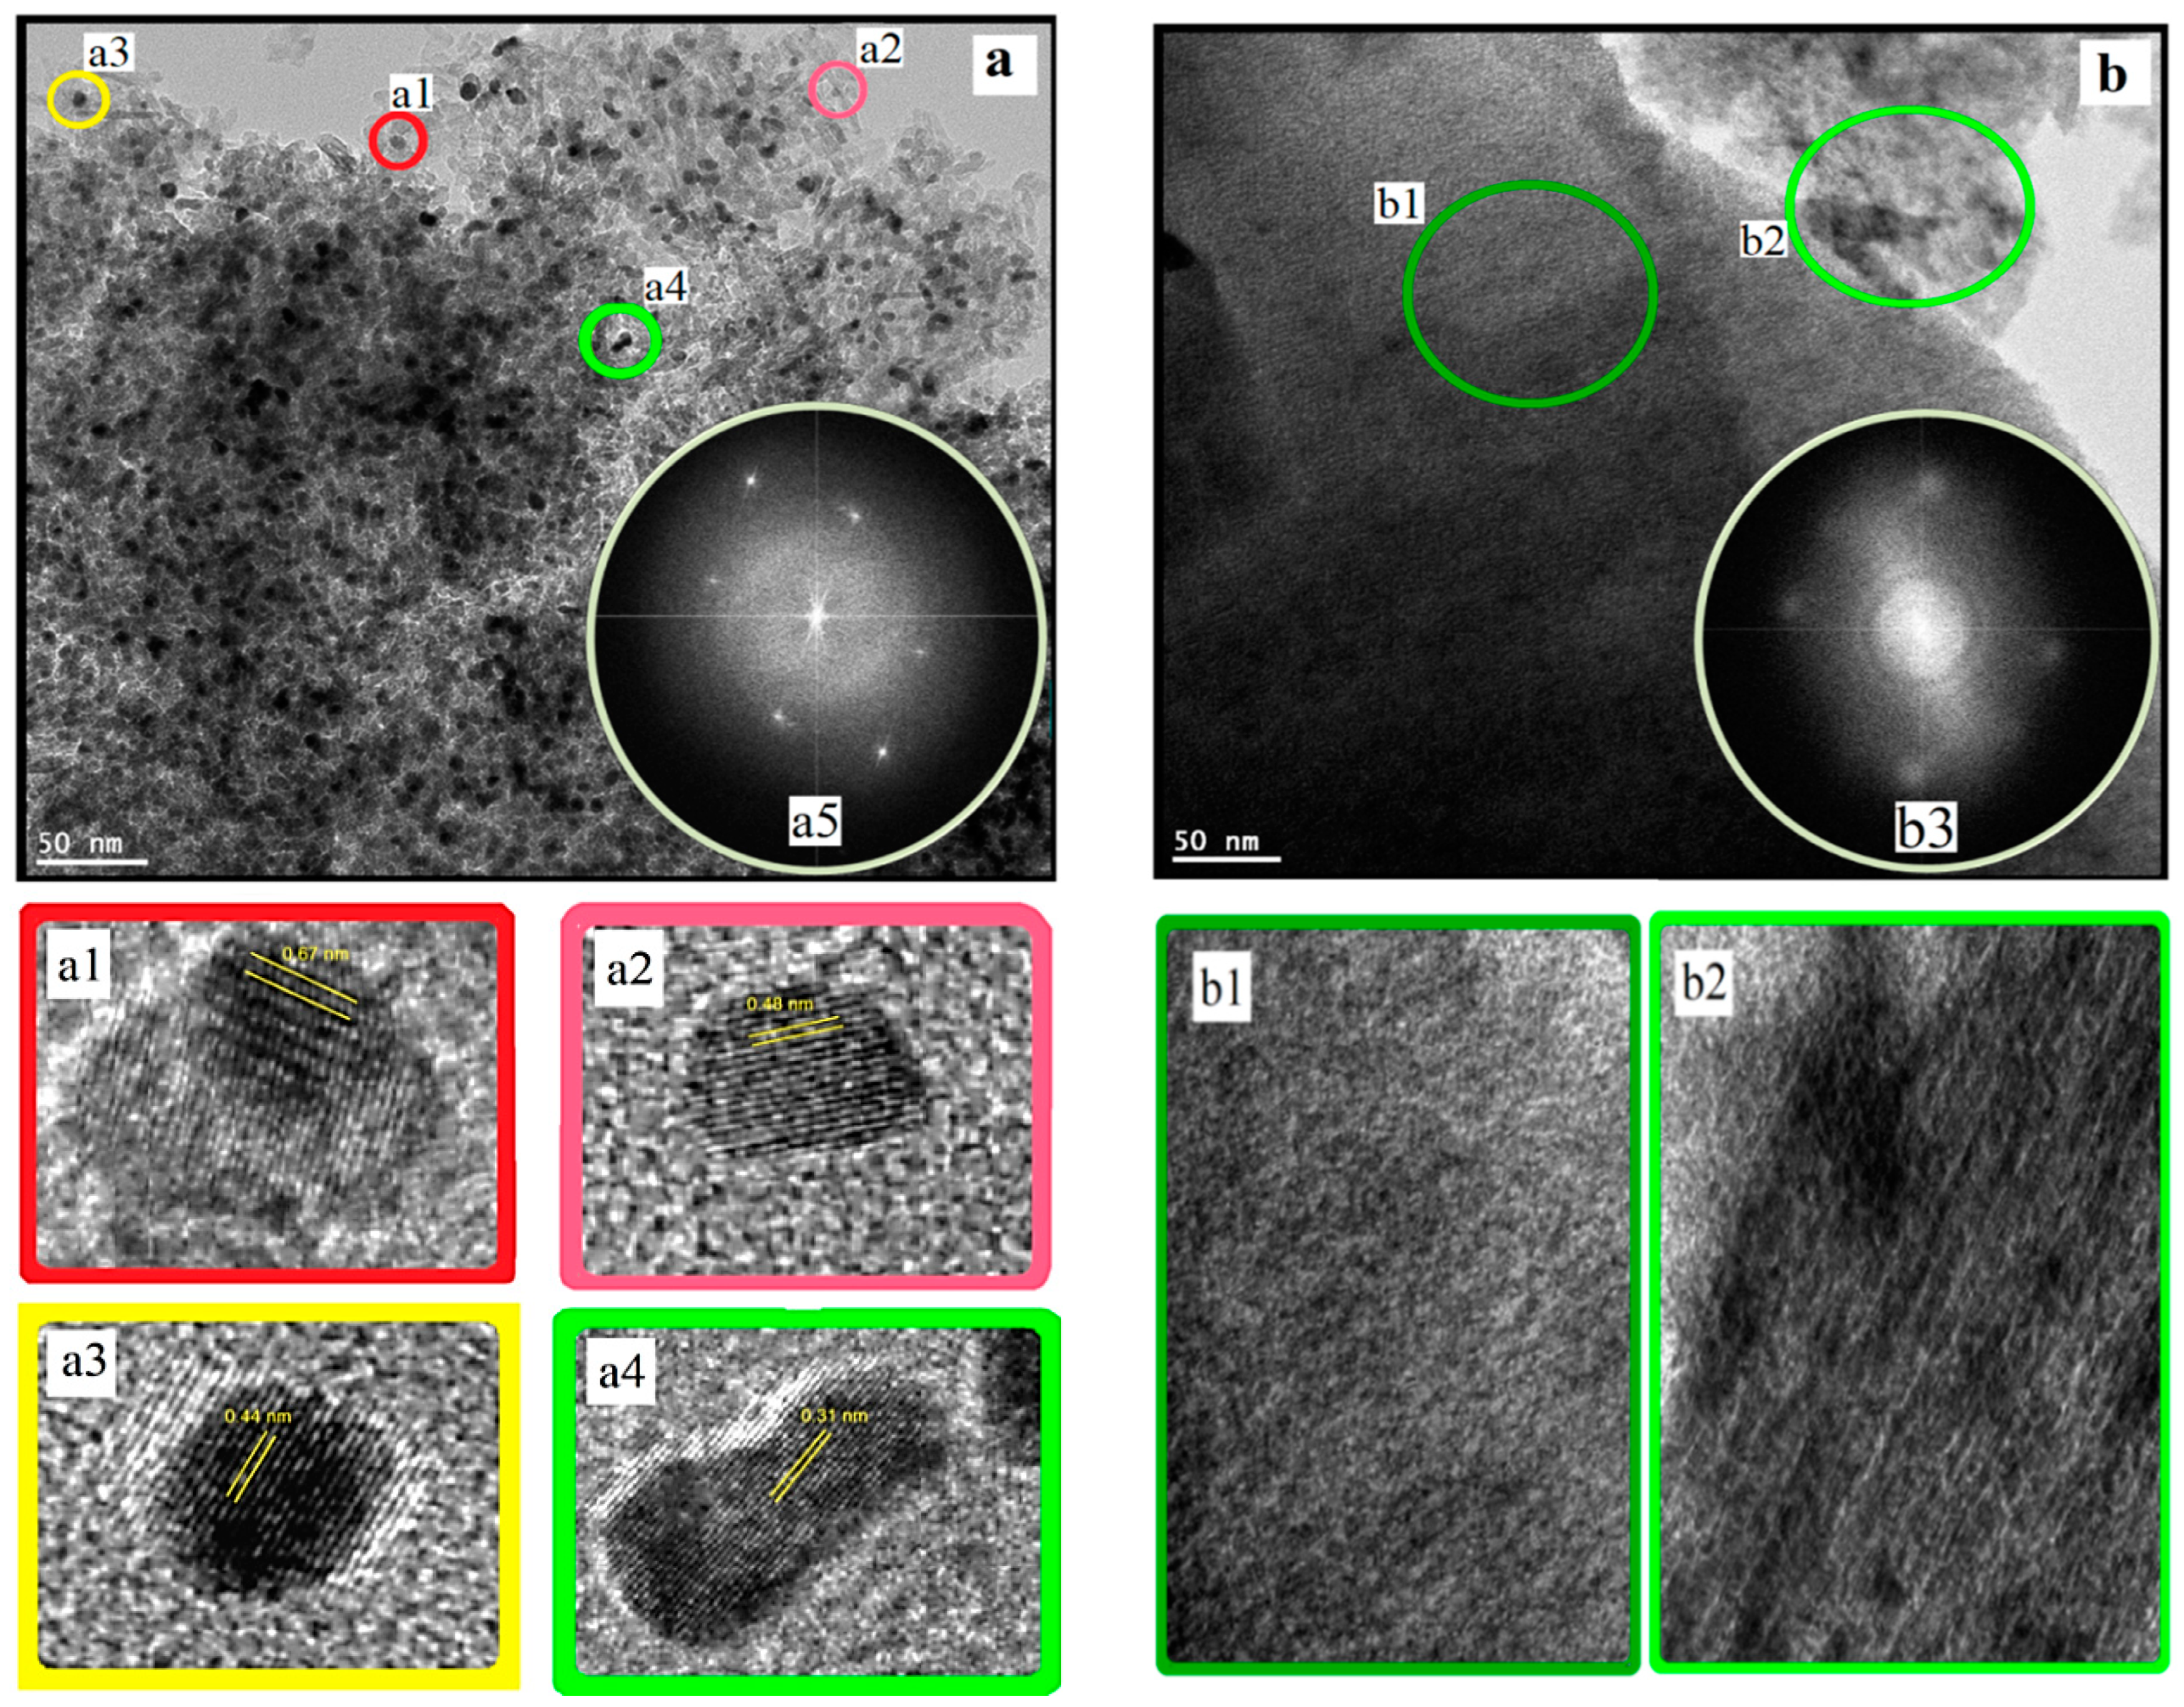
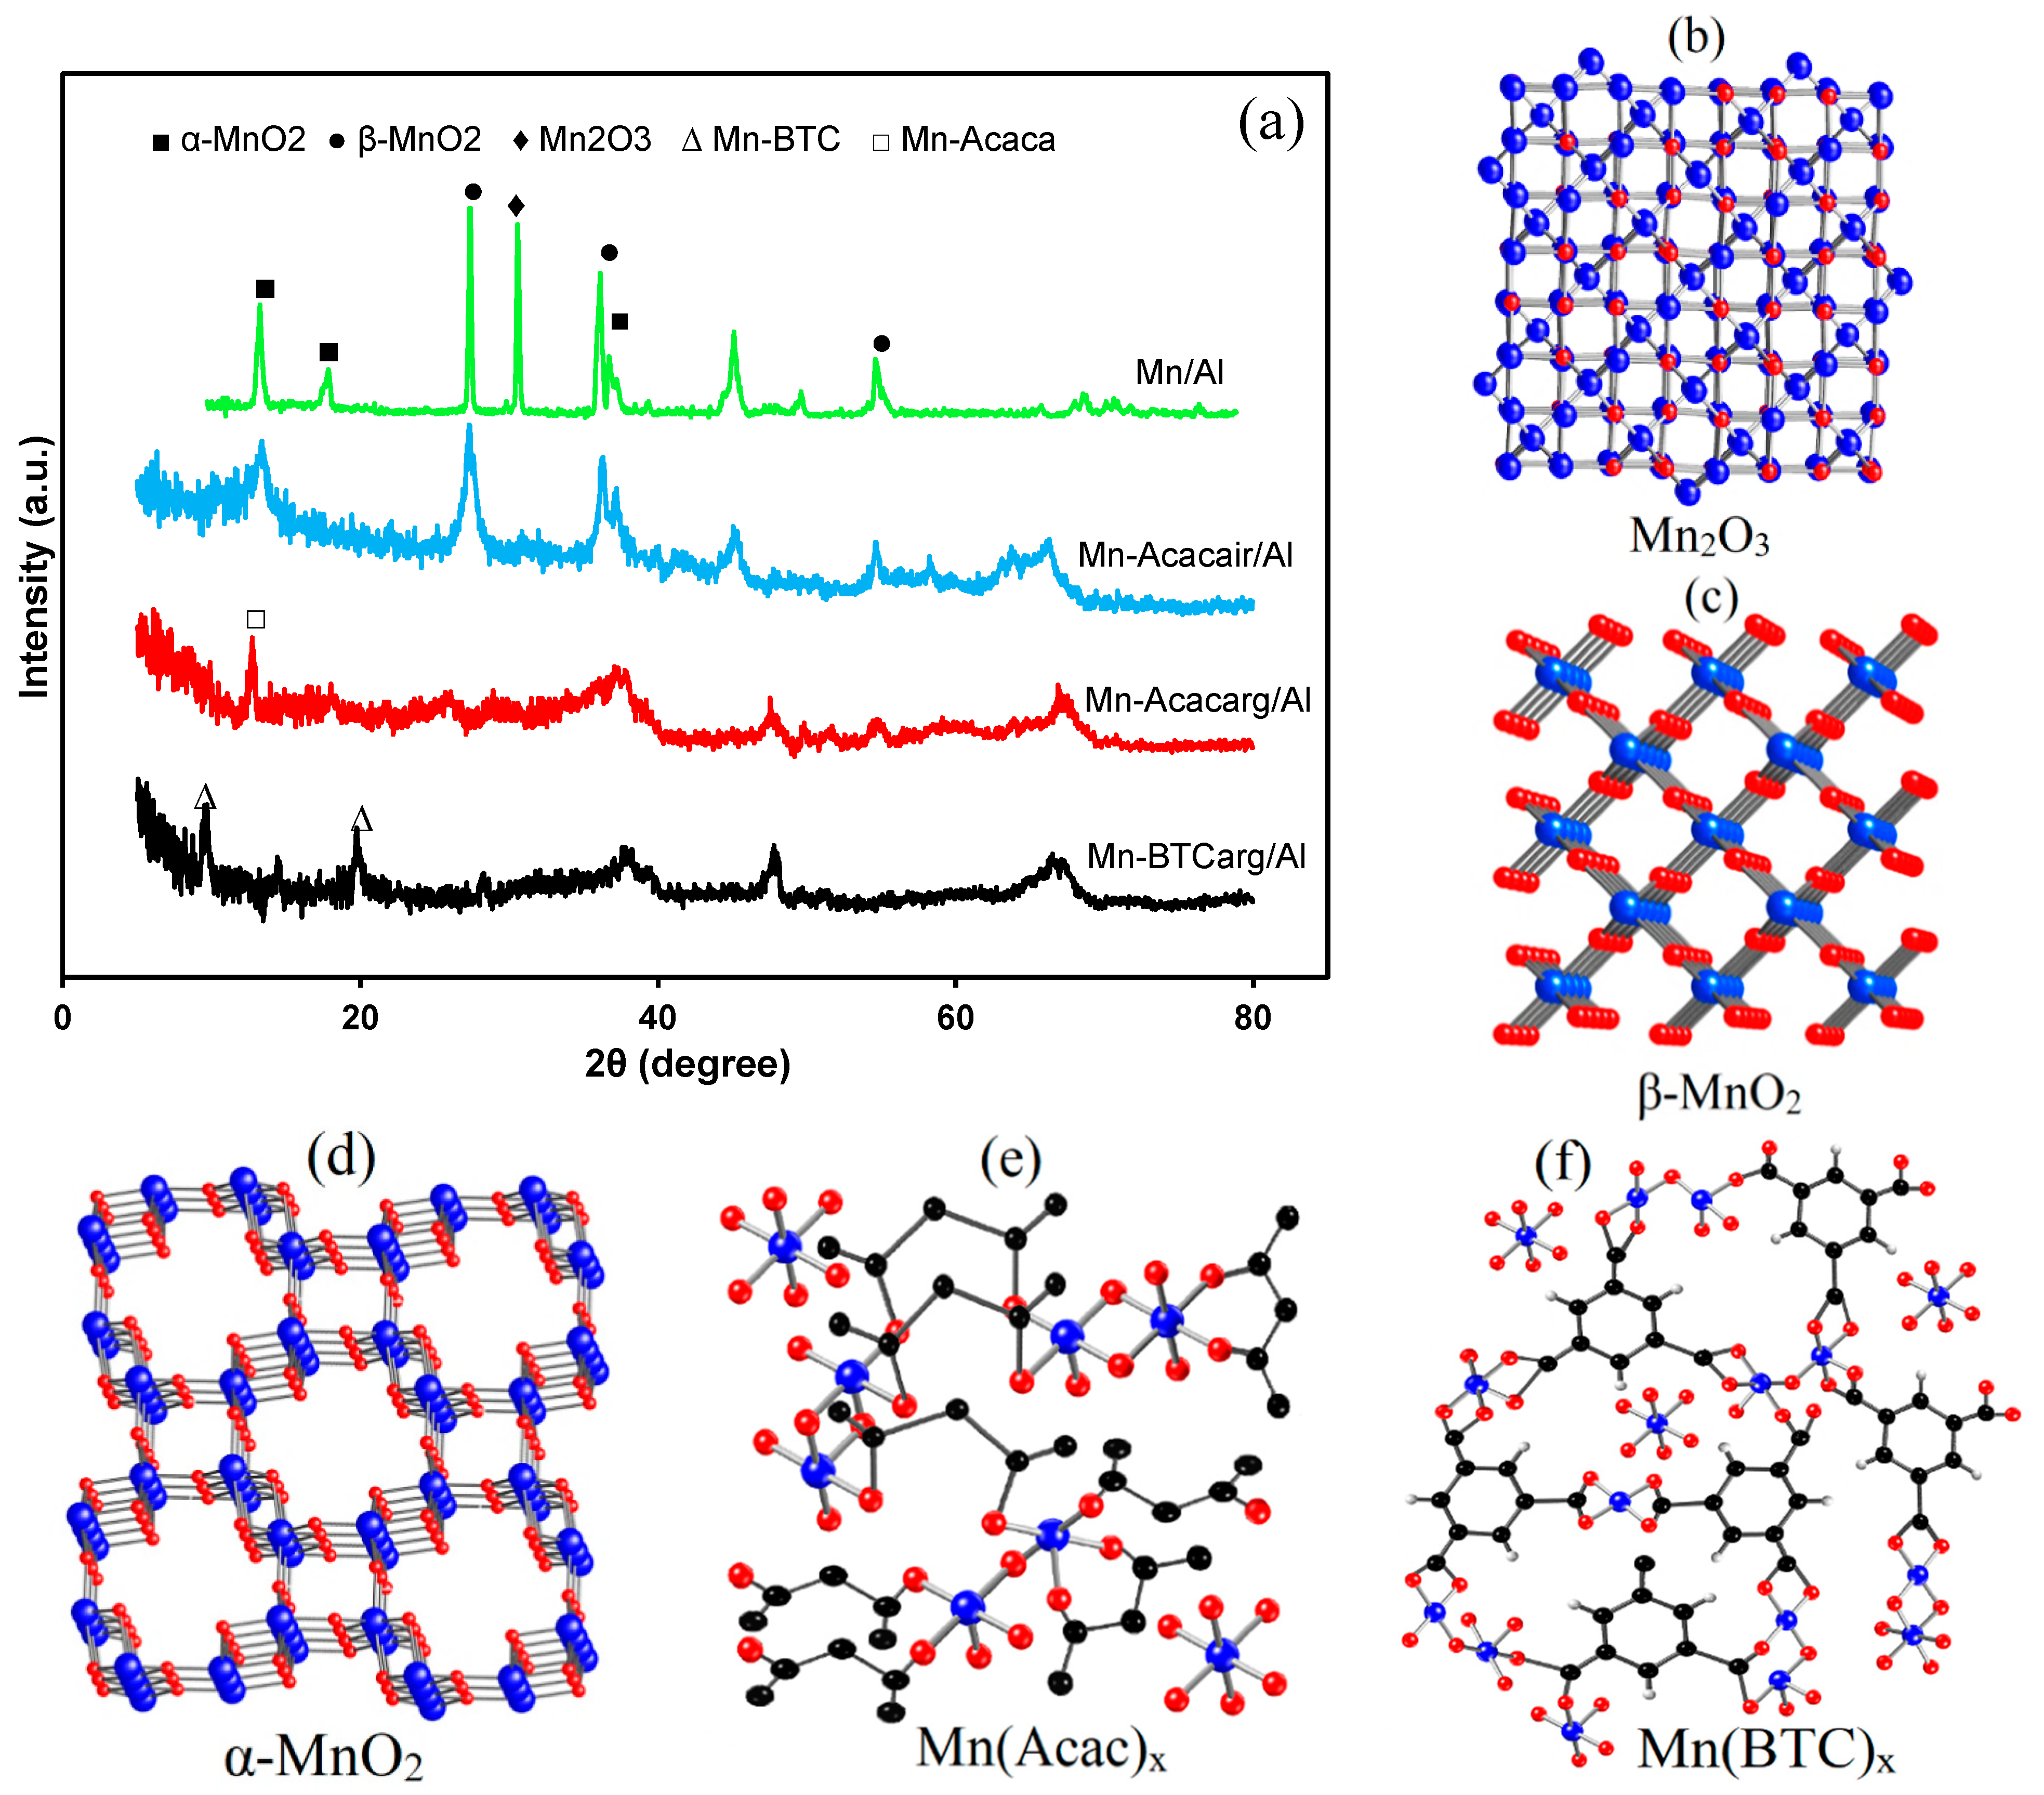
3.1. Characterization of the Catalysts

Results of BET measurement and surface analysis of the mesoporous alumina support and catalysts are listed in Table 1. According to the results, by adding manganese in Mn/Al catalyst, the surface area and pore volume of the support decreased from 259 m2.g−1 to 163 m2.g−1 and 0.52 m3.g−1 to 0.27 m3.g−1, respectively. The pores of alumina with capillary effect play the key role in providing space for the penetration of Mn(NO3)2.4H2O precursor during impregnation that may block some pores of alumina support by manganese oxide. In contrast, introducing the Mn(Acac)x or Mn(BTC)x precursors increased the surface area, pore volume, and average pore diameter. In Mn-Acacarg/Al sample, applying Mn(Acac)x precursor can decrease the manganese sintering, metal cluster size, and the number of blocked pores. While for Mn-Acacarg/Al and Mn-BTCarg/Al catalysts, the formation of porous Mn-MOF layers on the alumina support can establish a prominent increase in the surface area and pore volume [18,22]. As is apparent, Mn-Acacarg/Al catalyst has the highest surface area and pore volume among the prepared catalysts.
The FESEM image of the Mn/Al catalyst (Figure 2a) reveals the agglomerated manganese in cubic shapes with sharp edges. Incorporating Mn-MOF precursor to the catalysts altered the manganese particles from agglomerated cubic shape to rather spherical shapes, but, in the FESEM image of Mn-Acacair/Al (Figure 2d) some agglomerated manganese was still appeared. To supply details about the manganese distribution on the catalyst surface, elemental mappings show that the manganese was uniformly distributed on the surface of Mn-Acacarg/Al and Mn-BTCarg/Al catalysts (Figure 2h,k). According to the EDX analysis, the major components of the Mn/Al and Mn-Acacair/Al (Figure 2c,f) were aluminum (47.2 and 36.4 wt%), manganese (19.4 and 22.4%) and oxygen (33.4 and 41.2%) while, the main constituents of Mn-Acacarg/Al and Mn-BTCarg/Al (Figure 2i,l) were aluminum (23 and 19.1%), manganese (21.5 and 24.6%), oxygen (41.8 and 48.7%) and carbon (13.7 and 7.6%). Thus, a comparison of FESEM images and EDX analysis confirms that Mn-BTCarg/Al has a better metal dispersion, smaller average particle size, and a maximum abundance of surface manganese.
Figure 3a,b display the TEM images of Mn/Al and Mn-BTCarg/Al samples. Dark spots indicate the manganese oxide particles formed on the alumina support surface. The Mn-BTCarg/Al shows a smooth and uniform dispersed layer of manganese on the support surface; the Mn/Al catalyst resulted from the sintering of the small-sized crystalline MnOx particles. Additionally, the HRTEM images were captured to detect the interplanar d-spacing of the MnOx crystalline structure. The HRTEM image of Mn/Al (Figure 3a1–a3) clearly represents lattice fringes, attributed to d-spacing interplanar of 0.67, 0.48, and 0.44 nm, assigned to the (001) and (200) planes of α-MnO2 and the (100) plane of β-MnO2. Additionally, the detected 0.31 nm interplanar spacing in Figure 3a4 corresponds to the (122) planes of the tetragonal-structure α-Mn2O3 [23]. The HRTEM images (Figure 3b1,2) and the fast Fourier transform (FFT) pattern (Figure 3b3) of the Mn-BTCarg/Al exhibit a disordered atomic arrangement which reveals a completely amorphous coating layer of Mn-BTCarg/Al. This is while; the FTT pattern of Mn/Al catalyst (Figure 3a5) displays the pseudo octahedral nanoplatelets that confirms the existence of crystallin MnO2-x (MnO2, Mn2O3) with different crystal planes [24].
Figure 4a represents the XRD patterns of the prepared catalysts. The Mn/Al sample shows a completely crystalline structure with peak characteristics of Mn2O3, α-MnO2 and β-MnO2 phases which are nicely presented by Figure 4b, c and d, respectively [25,26]. The XRD patterns of the Mn-Acacair/Al catalyst has a semi-crystalline structure with peaks attributed to α-MnO2 and β-MnO2 phases [27]. Therefore, in Mn-Acacair/Al the oxide state of manganese shifted from Mn2O3 to MnO2. The Mn-Acacarg/Al and Mn-BTCarg/Al samples have low intensity peaks at 2θ of 13.6°, attributed to the Mn(Acac)x structure (Figure 4e), and 10.2° and 19.7° related to the Mn(BTC)x structures that interacted with alumina (Figure 4f) [28,29]. The interaction of Mn(BTC)x with alumina could insert divalent Al in the structure of Mn-MOF and generate reversible electronic transition between Mn3+ ⇆ Mn4+, Al2+ ⇆ Al3+ and Al2+ ⇆ Mn4+. according to the results, adding O-donor ligands to the manganese catalyst and calcination in argon atmosphere decline the degree of crystallinity and generate an amorphous coating on the surface of Mn-Acacarg/Al and Mn-BTCarg/Al catalysts.
The X-ray photoelectron spectroscopy (XPS) analysis was performed to assess the oxidation state of manganese based on the Mn 3s (Figure 5a), Mn 2p (Figure 5b) and O 1s (Figure 5c) spectra. The average oxidation state (AOS) of manganese was estimated based on the Mn 3s doublet peak and the relation of AOS = 8.956–1.126 ΔES, in which ΔES is the binding energy difference between the doublet Mn 3s peaks [30,31]. The ΔES value of Mn/Al catalyst is 5.1 eV in the range attributed to Mn2O3 with high abundance of trivalent cation (Mn3+). This is while, Mn-Acacair/Al, Mn-Acacarg/Al and Mn-BTCarg/Al doublet peak difference indicates the transformation of trivalent Mn3+ into tetravalent Mn4+ cation. The XPS spectrum of Mn 2p3/2 for Mn/Al catalyst (Figure 5b) shows peaks at binding energies of 642.8 eV (Mn4+ of MnO2), 641.8 eV (Mn3 of Mn2O3) and 636.7 eV (Mn3+ of MnO). The Mn-Acacair/Al, Mn-Acacarg/Al and Mn-BTCarg/Al catalysts show only two peaks relating to Mn3+ and Mn4+ states. According to the molar ratio of the deconvoluted Mn 2p3/2 peak, listed in Table 2, the AOS value of Mn 2p3/2 is in good agreement with that of the Mn 3s. Accordingly, the sequence of the Mn4+ abundance on the surface of catalysts is in the order of Mn-BTCarg/Al > Mn-Acacarg/Al > Mn-Acacair/Al > Mn/Al.
Figure 5c reveals the O 1s spectra to characterize the surface oxygen species. The O 1s spectra of Mn/Al can be deconvoluted to two obvious peaks; the surface lattice oxygen (Mn-O-Mn) (Oα) and surface hydroxyl bonded to manganese (Mn-O-H) (Oβ), while the Mn-Acacair/Al, Mn-Acacarg/Al and Mn-BTCarg/Al spectra show new prominent peaks at the binding energy of 533.04 eV, attributed to the oxygen in carboxyl groups (O=C/O−C), respectively [30,31]. The abundance of remained carboxyl groups of the Mn-Acacair/Al is almost negligible compared to the Mn-Acacarg/Al and Mn-BTCarg/Al catalysts. XPS analysis also shows that surface Oβ/Oα molar ratio gradually increases as 0.29 < 0.58 < 0.89 < 1.19. An increase in the Oβ/Oα ratio demonstrates that the modified catalysts by O-donor ligands lead to a higher abundance of surface-adsorbed oxygen and oxygen vacancies, especially in Mn-BTCarg/Al catalyst [10,12]. The reason can be attributed to the presence of electro donating carboxylate group in this catalyst that increases the charge density near the active sites and assists in generating oxygen vacancies [11].
Table 3 presents the hydrogen TPD analysis results of the catalysts. The listed data include the manganese dispersion, the average size of crystallite and the number of active sites. According to the results, synthesis of the Mn-MOF supported catalysts in argon, and air atmospheres significantly increases the hydrogen consumption compared to bare Mn catalyst. This phenomenon results in a higher manganese dispersion and the number of active sites, consequently decreasing the particles’ average size. As an advantage, in the same loading of manganese, the higher metal dispersions accessible more number of active sites for H2O2 adsorption and ROS generation that improves the Azi removal. The reducibility of Mn-Acacair/Al, Mn-Acacarg/Al and Mn-BTCarg/Al is remarkably improved by a factor of 1.44, 1.12 and 1.56. The high surface abundance of Mn4+ cation, oxygen vacancy and electrophilic surface-adsorbed oxygen improves the reduction of catalysts.

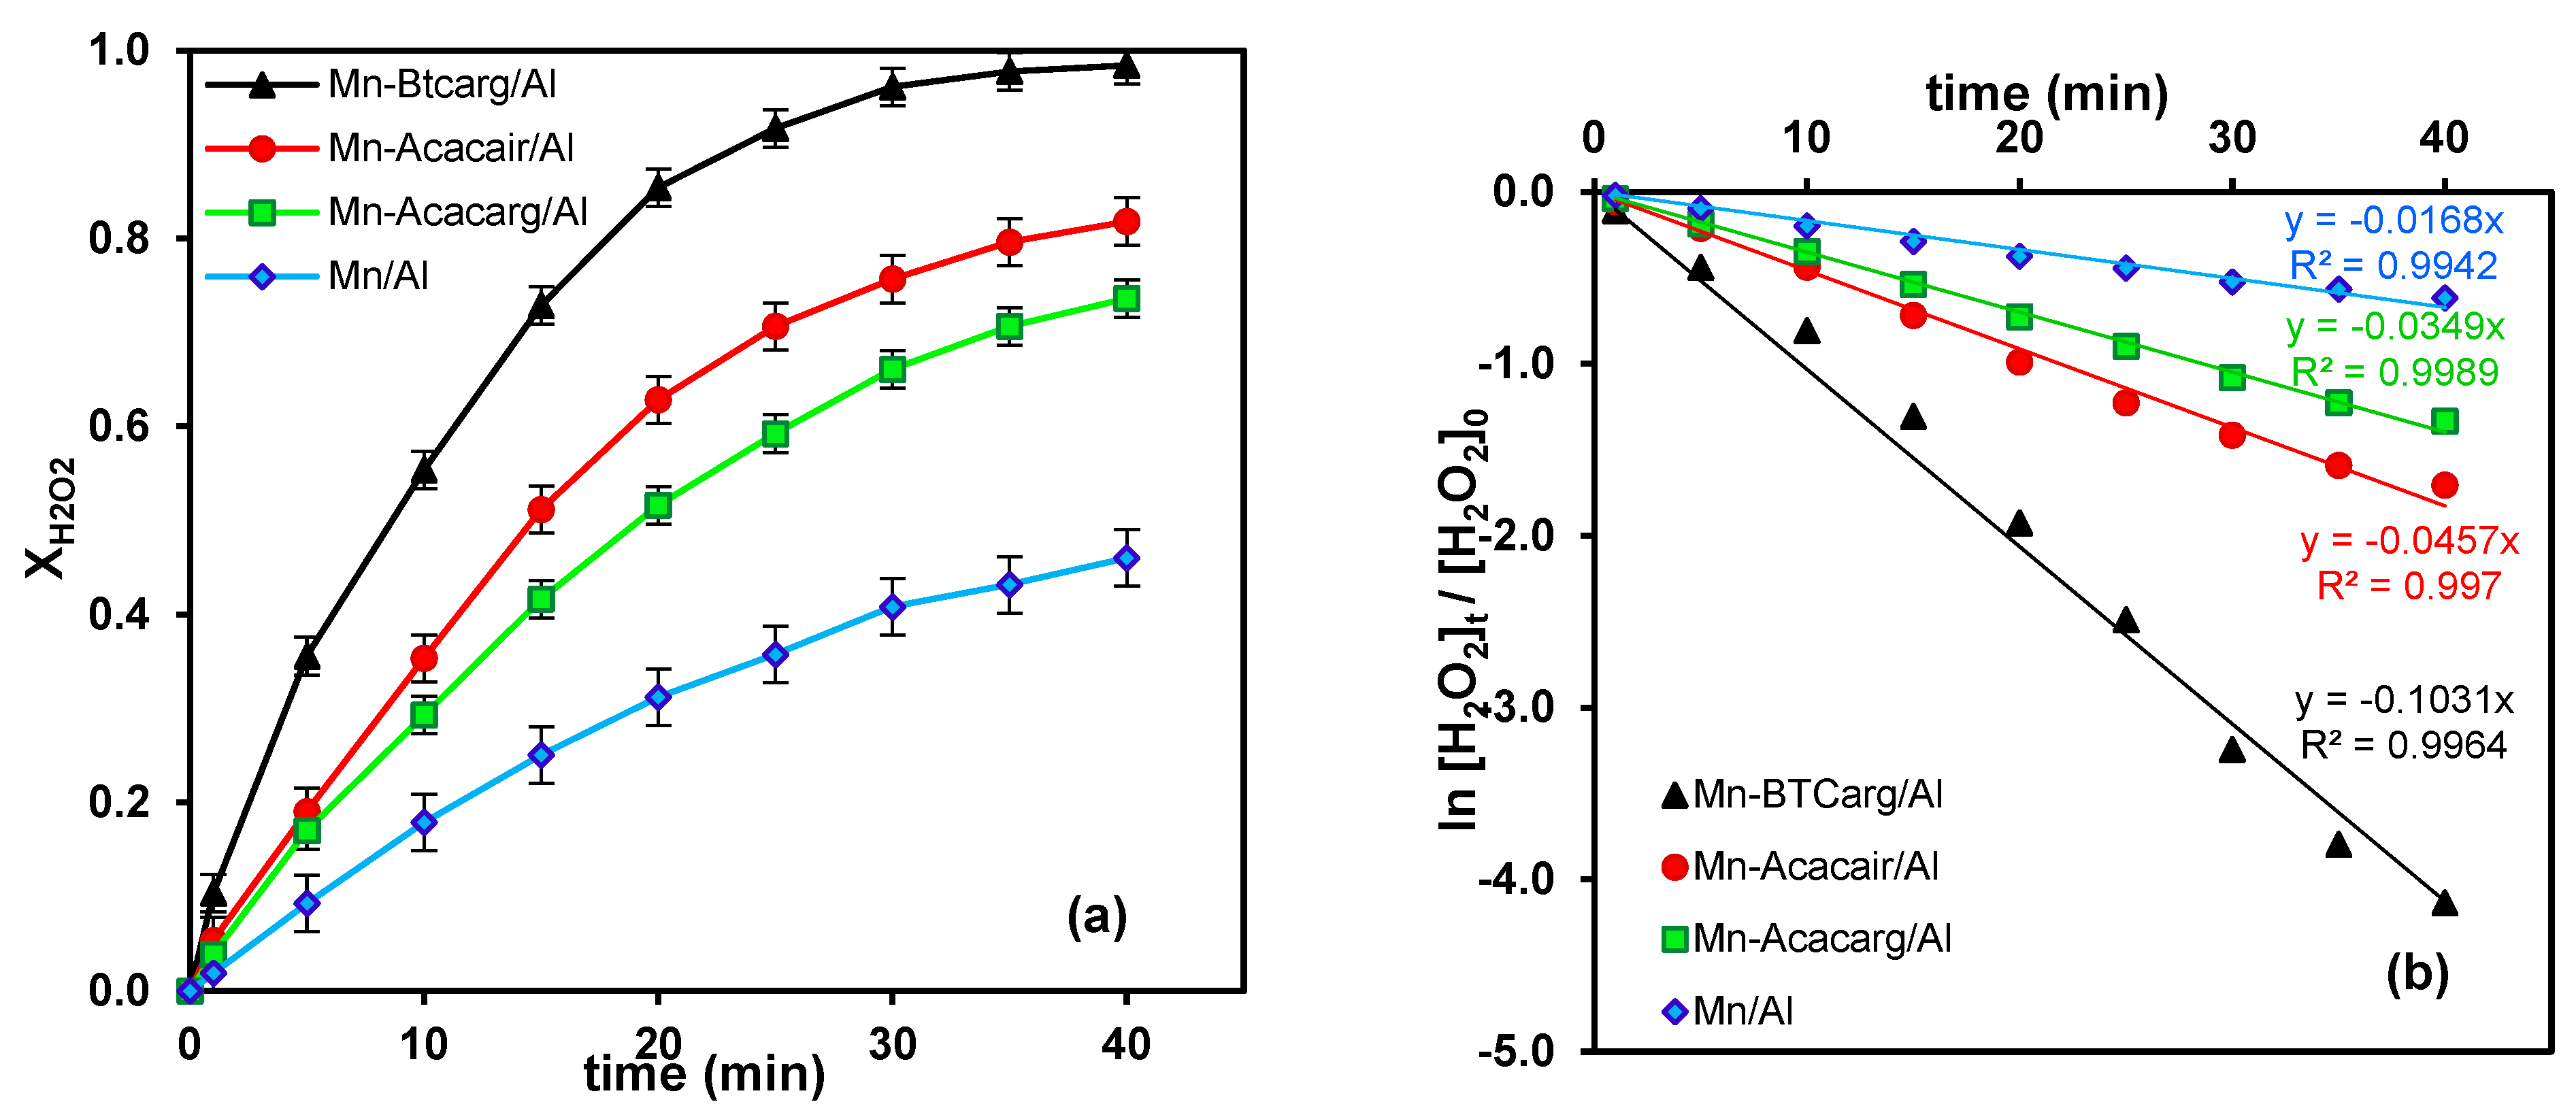
3.2. Performance of Catalysts for Hydrogen Peroxide Activation

Hydrogen peroxide activation can be evaluated in a redox dissociation reaction on the surface of catalysts with ROS generation. The procedure mentioned in Section 2.4 and Section 2.5 was undertaken. The results are reported here in terms of H2O2 conversion ( X H 2 O 2 ) and reaction rate constant ( k H 2 O 2 ), and turn over number (TON).
Figure 6a illustrates the conversion of 10 g/L H2O2 concentration ( X H 2 O 2 ) versus time. The activity of Mn-Acacair/Al, Mn-Acacarg/Al and Mn-BTCarg/Al was highly promoted by the factors of 1.78, 1.60 and 2.14 compared to the Mn/Al catalyst. The highest catalytic activity and almost complete conversion was achieved by Mn-BTCarg/Al during only 40 min. The corresponding rate constants of different catalysts were obtained from the slope of ln ( [ H 2 O 2 ] t / [ H 2 O 2 ] 0 ) versus reaction time. As evidenced in Figure 6b, the reactions follow the pseudo-first-order kinetic. The H2O2 conversion and k H 2 O 2 parameter follow the sequence Mn-BTCarg/Al > Acacair/Al > Mn-Acacarg/Al > Mn/Al, but the TON increased in the order of Mn-BTCarg/Al > Mn-Acacarg/Al > Acacair/Al. In the same loading of manganese, the H2O2 conversion and rate constant were affected by the abundance of the accessible surface active sites, the reducibility of MnOx and oxygen vacancies and the manganese’s ability to transform between Mn3+/Mn4+ valence states. This is while, the TON parameter reveals the activity of every single crystallite and it is independent of the number of surface active sites. Indeed, in TON calculation, the surface barrier effect of organic ligands, detected as carbon in mapping-EDX analysis, is eliminated and only the effect of the surrounding electronic environment of the Mn in the states of MnOx, Mn(Acac)x and Mn(BTC)x is considered.
The structural and performance analysis of Mn/Al and Mn-Acacair/Al show that using the Mn(Acac)x precursor improves metal dispersion and catalytic activity. Comparing the Mn-Acacarg/Al and Mn-Acacair/Al catalysts indicates that higher H2O2 conversions and k H 2 O 2 values belong to the Mn-Acacair/Al. Despite the equal spreading properties of Mn(Acac)x precursor on both catalysts surface, calcination in argon atmosphere preserves the carbonyl chains structure in Mn-Acacarg/Al catalyst that generates surface barrier and reduces the number of accessible active sites as was revealed in the H2-chemisorbtion and EDX analyses [32]. Meanwhile, according to Table 3, the Mn-Acacarg/Al sample gives a higher TON value. An interpretation for this case is the higher ratio of the desirable oxygen vacancies to the lattice oxygen (reflected by XPS analysis) for this catalyst compared to Mn-Acacair/Al. However, Mn-BTCarg/Al catalyst, despite a huge carboxylate ligand, overcomes the surface barrier and gives the best catalytic performance in the H2O2 activation. An interpretation for these observations can be related to the different surface spreading of Mn(BTC)x compared to Mn(Acac)x, enhancing the manganese dispersion. Additionally, the favorable electronic properties of the metal sites surrounded by electro donating BTC ligand increase the charge density near the active sites and assist the generation of desirable surface oxygen vacancies (confirmed by XPS analysis) that accelerate the favorable Mn3+/Mn4+ redox transition.

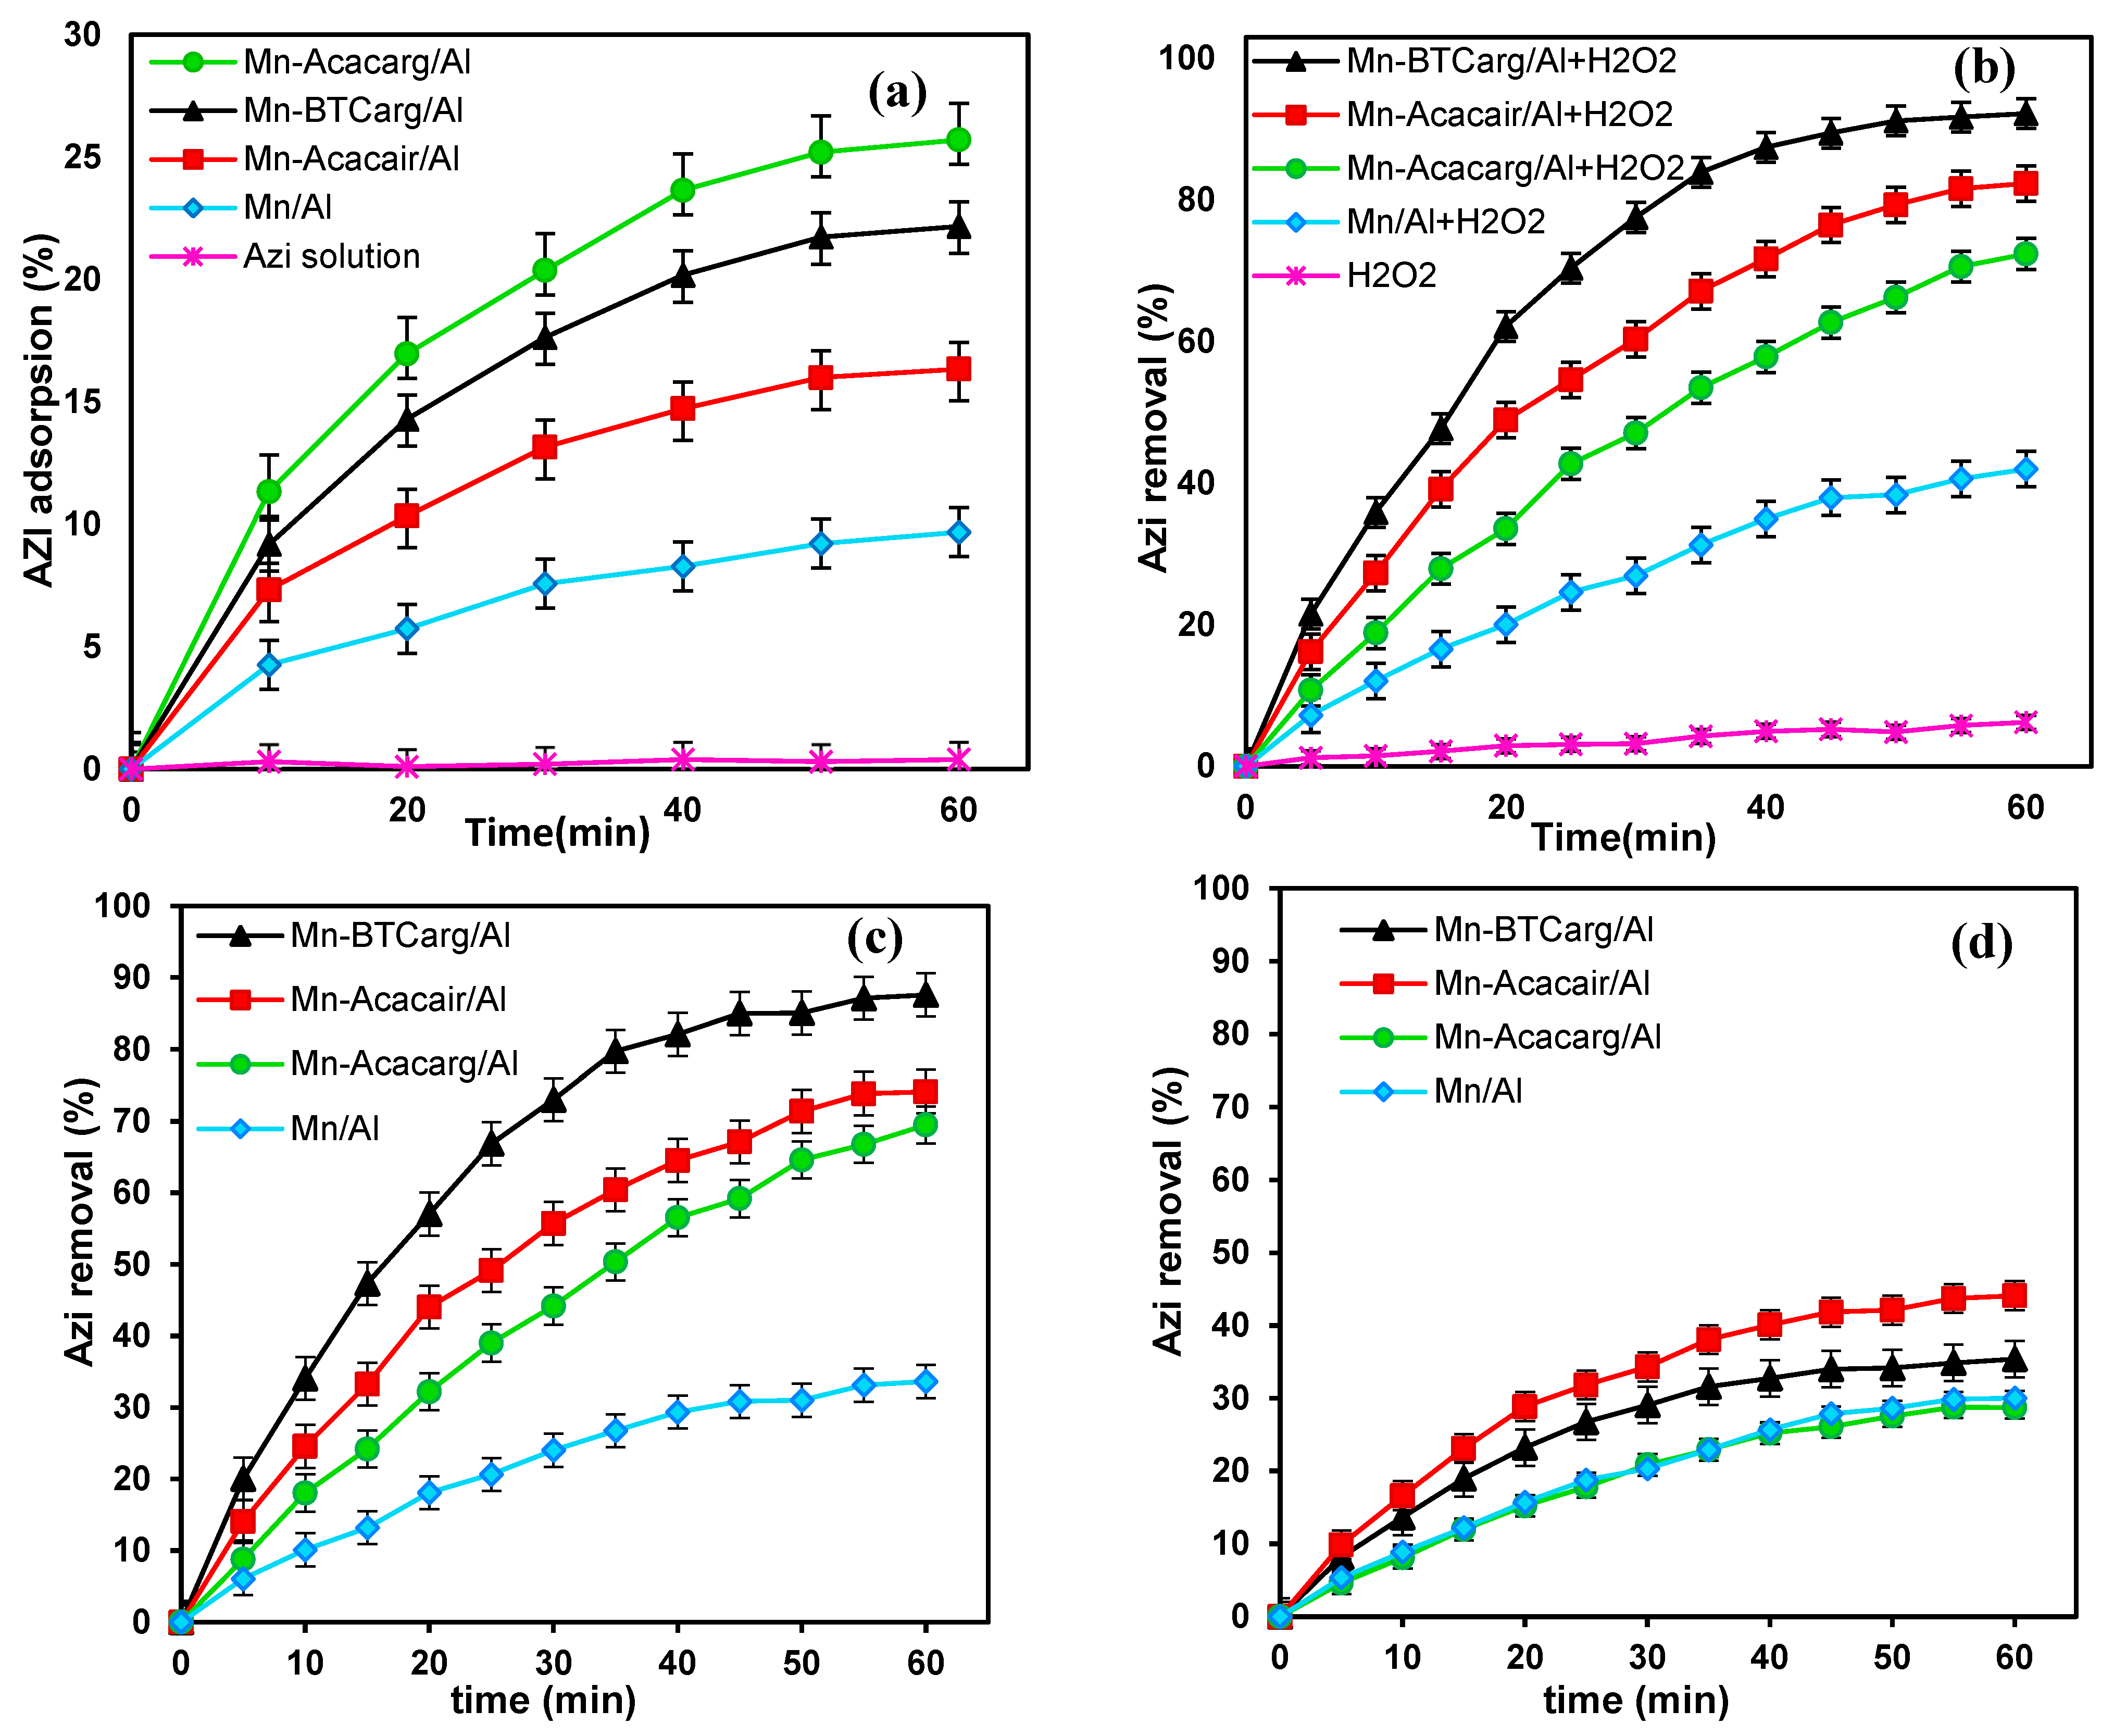
3.3. Performance of Catalysts for Azi Removal

The Azi removal in the presence of prepared catalysts was evaluated based on the COD criterion. Accordingly, the adsorption behavior of catalysts should be first considered in the absence of H2O2. As is shown in Figure 7a, the blank solution of bare azithromycin illustrates a high stability over time. Then, the Azi removal in the other 4 catalytic systems entirely related to the catalytic absorption of azithromycin. The adsorption of Azi is significant for Mn-Acacarg/Al and Mn-BTCarg/Al with 22.13 and 19.95% removal efficiencies after 40 min. According to the given SEM images (Figure 2) and BET results (Table 1), adding O-donor ligands changes the surface morphology and textural properties of the catalysts by forming porous layers. As is evident, the Azi adsorption follows the sequence of Mn-Acacarg/Al > Mn-BTCarg/Al > Mn-Acacair/Al > Mn/Al, in line with increasing the level of porosity and surface area of catalysts. The removal efficiency of Azi was evaluated by immediate quenching samples with Na2SO3 solution to eliminate the H2O2 effect on the COD criterion. Removal efficiency depends on the number of surface-active sites, the metal sites ability to absorb and dissociate of H2O2 and the type of produced ROS in the system. Results presented in Figure 7b indicate that the effect of the spontaneous decomposition of H2O2 in the absence of catalyst is negligible and dominant Azi removal occurs through the H2O2 catalytic activation process in the studding system. The catalytic removal efficiency follows the sequence of Mn-BTCarg/Al > Mn-Acacair/Al > Mn-Acacarg/Al > Mn/Al. Therefore, the outstanding removal was achieved by Mn-BTCarg/Al catalyst.
The other main factor in progressing the removal reaction is the kind and quantity of dominant generated ROS in the system. To supply further information, the identification of ROS was investigated by adding isopropanol and p-benzoquinone (BQ) as scavengers of HO and O2, respectively. As illustrated in Figure 7c, adding BQ to the reaction solution show a lower inhibitory effect for Mn-BTCarg/Al, Mn-Acacarg/Al and Mn-Acacair/Al catalysts compared to the Mn/Al sample. This indicates that O2 plays a weak role in Azi oxidation and also, the abundance of generated O2 in the presence of these catalysts is limited. Meanwhile, the addition of isopropanol significantly suppresses Azi removal, implying that HO was the dominant ROS, responsible for Azi removal (Figure 7d). Therefore, the H2O2 activation mechanism could be proposed as follows: At the beginning of the process, H2O2 molecules reach the oxygen vacancies sites (localized Mn3+) that would facilitate the H2O2 activation to produce HO radicals via O=O adsorption and dissociation (Equation (1)) [33]. Therefore, the high abundance of oxygen vacancies sites (localized Mn3+) on the surface of modified catalysts leads to the activation reaction toward HO generation [34]. Some other H2O2 molecules would reach the Mn4+sites and generate HO2 (Equation (2)) and a cycle of surface Mn3+-Mn4+-Mn3+ would be completed. In the next step, the generated HO radical could react with excess H2O2 to create HO2. The generated HO2 further was decomposed to produce O2 via HO2 → H+ + O2 [35]. The generation of HO2 lead reaction toward producing H2O and O2, the undesirable products in activation reaction.
Mn3+ + H2O2 → HO + HO + Mn4+
Mn4+ + H2O2 → HO2 + H+ + Mn3+
HO + H2O2 → H2O + H2O
HO + HO2 → H2O + O2
As Figure 7b shows, due to the high concentration of Azi at the beginning of the reaction, high removal efficiency is relevant and then tends to mild values. Using the highly active Mn-BTCarg/Al catalyst, no significant Azi removal appeared after forty minutes. Thus, the Mn-BTCarg/Al catalyst and 40 min were selected as the best catalyst and the optimum treatment time for Azi removal.

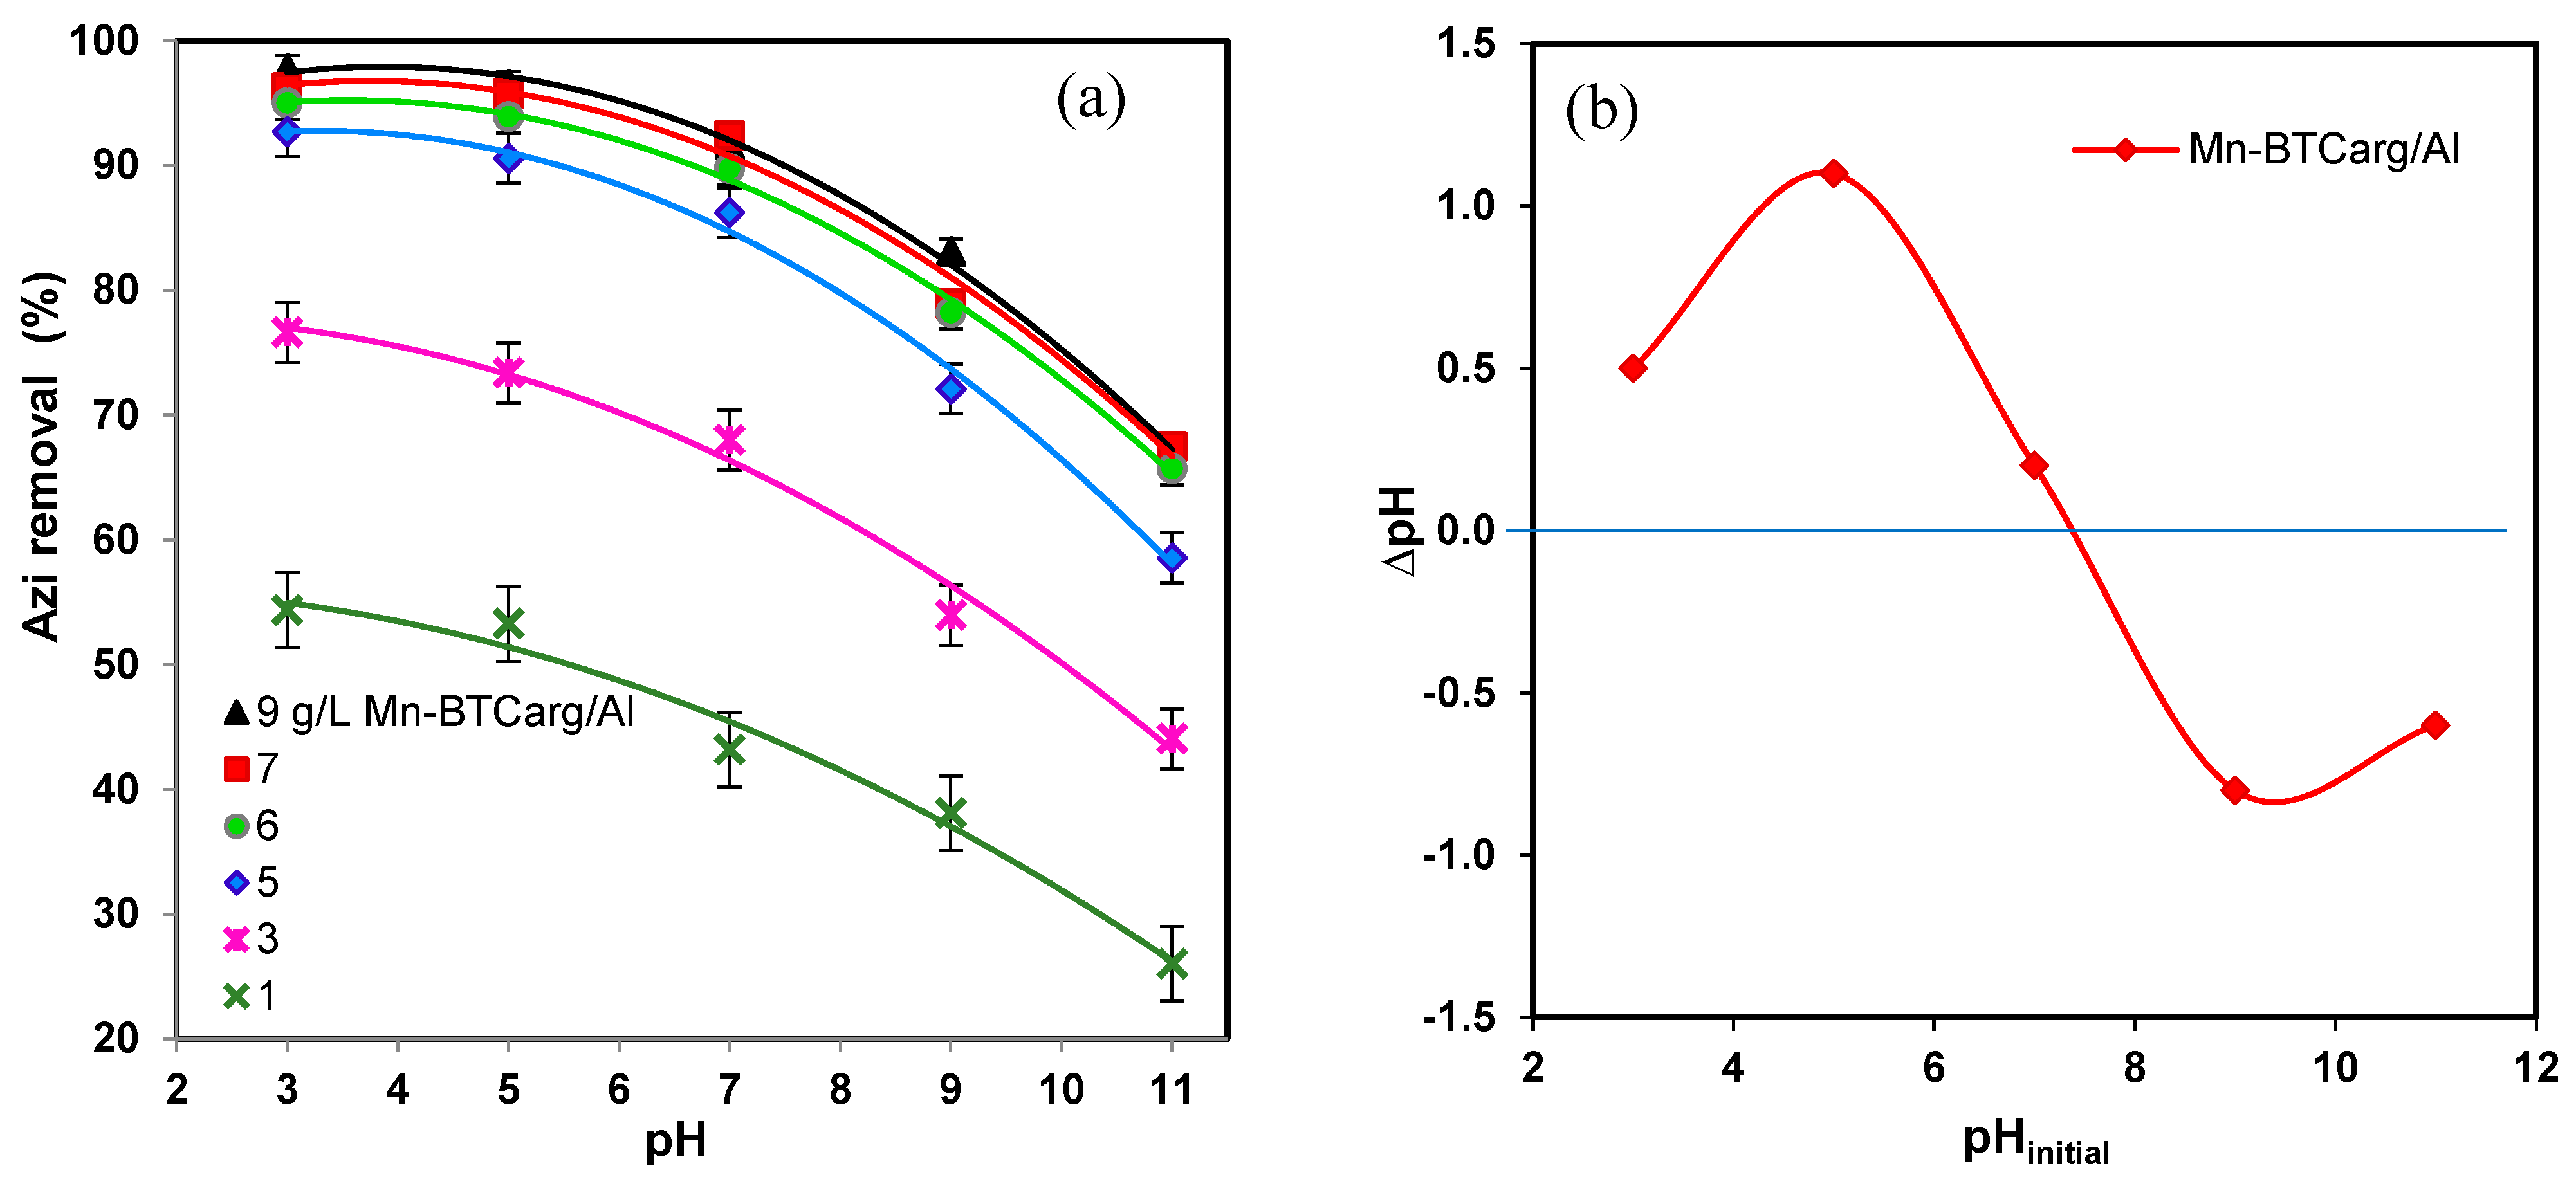
3.4. Effects of the Solution pH and the Catalyst Dosage

Figure 8a shows that removal efficiency reaches to the maximum values of 54.37, 76.63, 92.72, 95.31 and 97.9% with the catalyst dosages of, respectively, 1, 3, 5, 6, 7 and 9 g/L, under pH 3. The efficiency significantly diminishes as pH tends to neutral and alkaline conditions. As is depicted in Figure 8b, the measured pHzpc of Mn-BTCarg/Al is 7.48. Thus, its surface has a positive charge at pHs < 7.48, while H2O2 and the functional groups of Azi have negative charge in acidic pHs; and therefore, H2O2 and Azi could be easily adsorbed on the catalyst surface. The disassociation constant of Azi molecule (pKa1 = 8.96) can be the other influencing parameter for the strong Azi removal under acidic conditions [4]. Despite a high activity at pH 3, to prevent the system corrosion and ease of operations, pH 5 was selected as the optimum reaction pH (see Figure 8a).
The Azi removal is enhanced with catalyst dosage and reaches to 95.8% for 9 g/L dosage at pH 5 (Figure 8a). Surely, high catalyst doses give more surface-active sites to generating ROS and enhancing the Azi removal efficiency; however, no significant enhancement corresponds with catalyst doses of more than 6 g/L. The quantity of loaded catalysts affects the process economy; thus, selecting an optimum dosage of Mn-BTCarg/Al is essential, here 6 g/L.

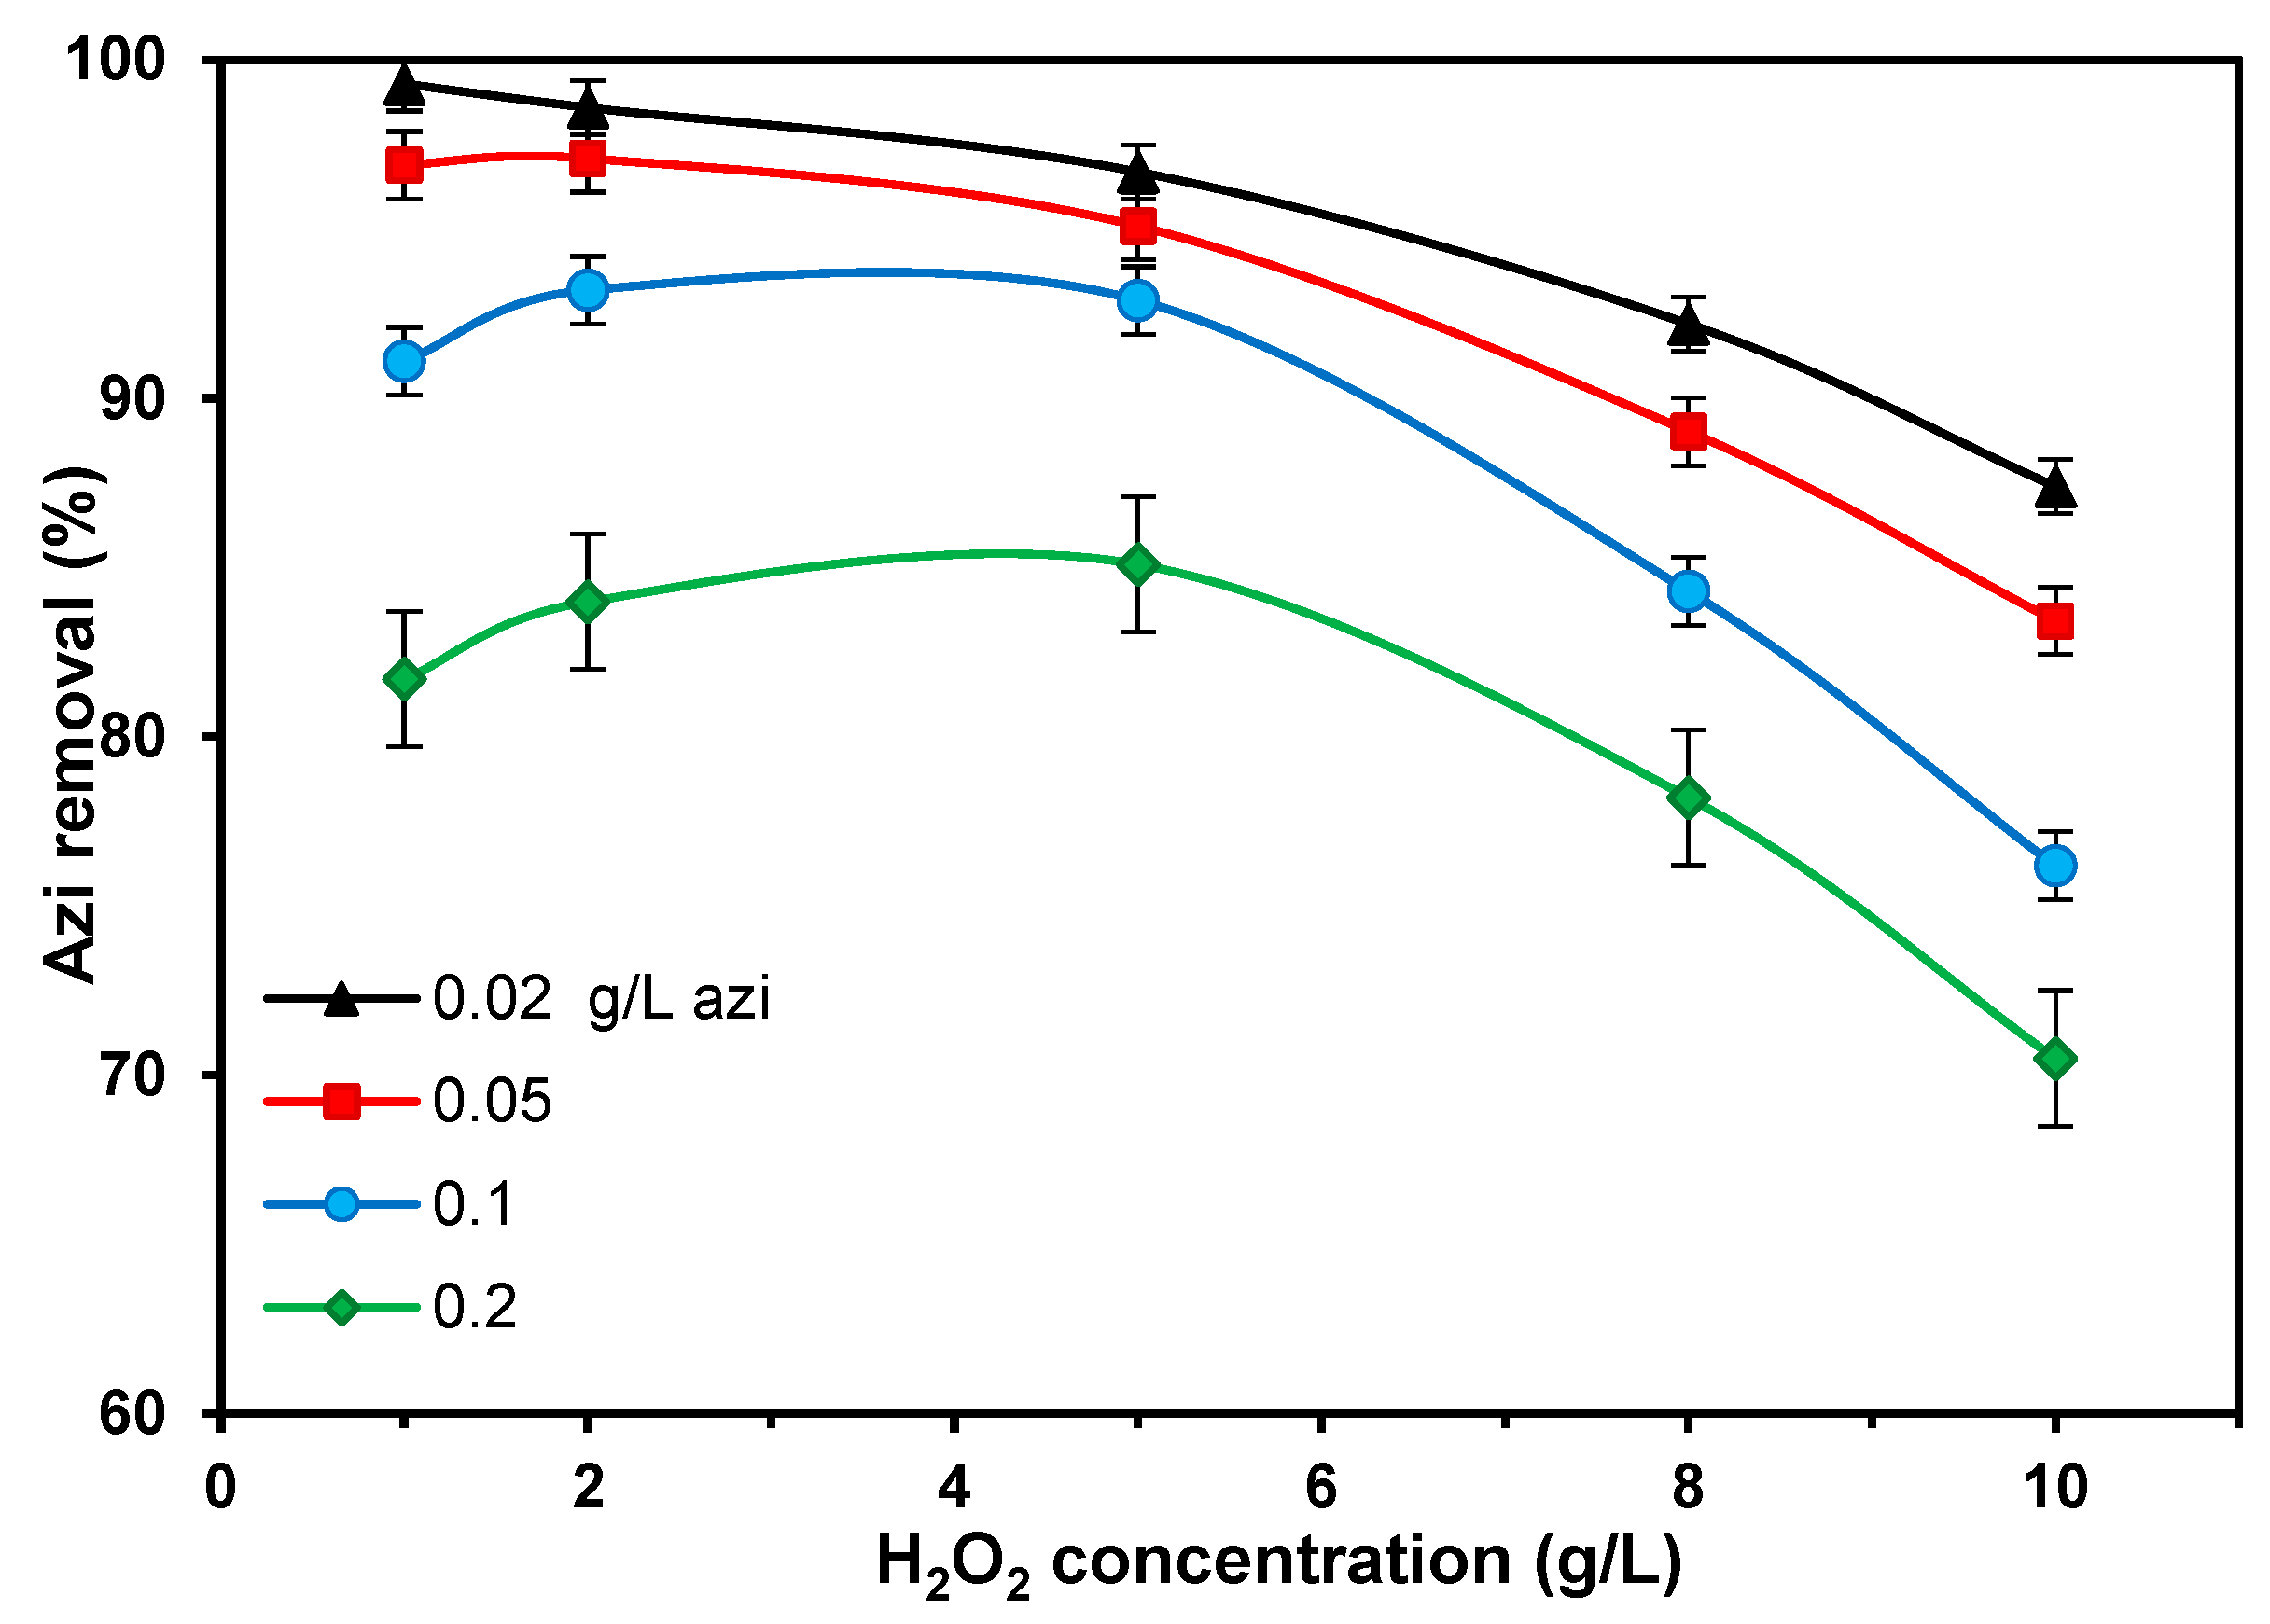
3.5. Effects of Azi and H2O2 Initial Concentrations

Figure 9 shows that increasing the Azi concentration decreases the removal efficiency for all the used concentrations. Under the specified H2O2 concentration of 1 g/L, the Azi removal diminishes from 99.3 to 81.7% by increasing the Azi concentration from 0.02 to 0.2 g/L. This can be regarded as the competition of Azi and H2O2 to adsorb on the catalyst surface and the higher rate of hydroxyl radical consumption, totally introducing an optimum H2O2 concentration of around 2 g/L.
Under high levels of Azi, by introducing high amounts of H2O2, the removal efficiency tends to increase and after reaching a maximum, begins to decrease. This can be attributed to the abundance of hydroxyl radicals in the solution, which can be scavenged by excess H2O2, forming low active HO2 species (H2O2 + HO → HO2+ H2O) [36]. Accordingly, the highest efficiency of the pollutant removal was obtained for the 0.02 g/L of Azi and 1 g/L of H2O2.

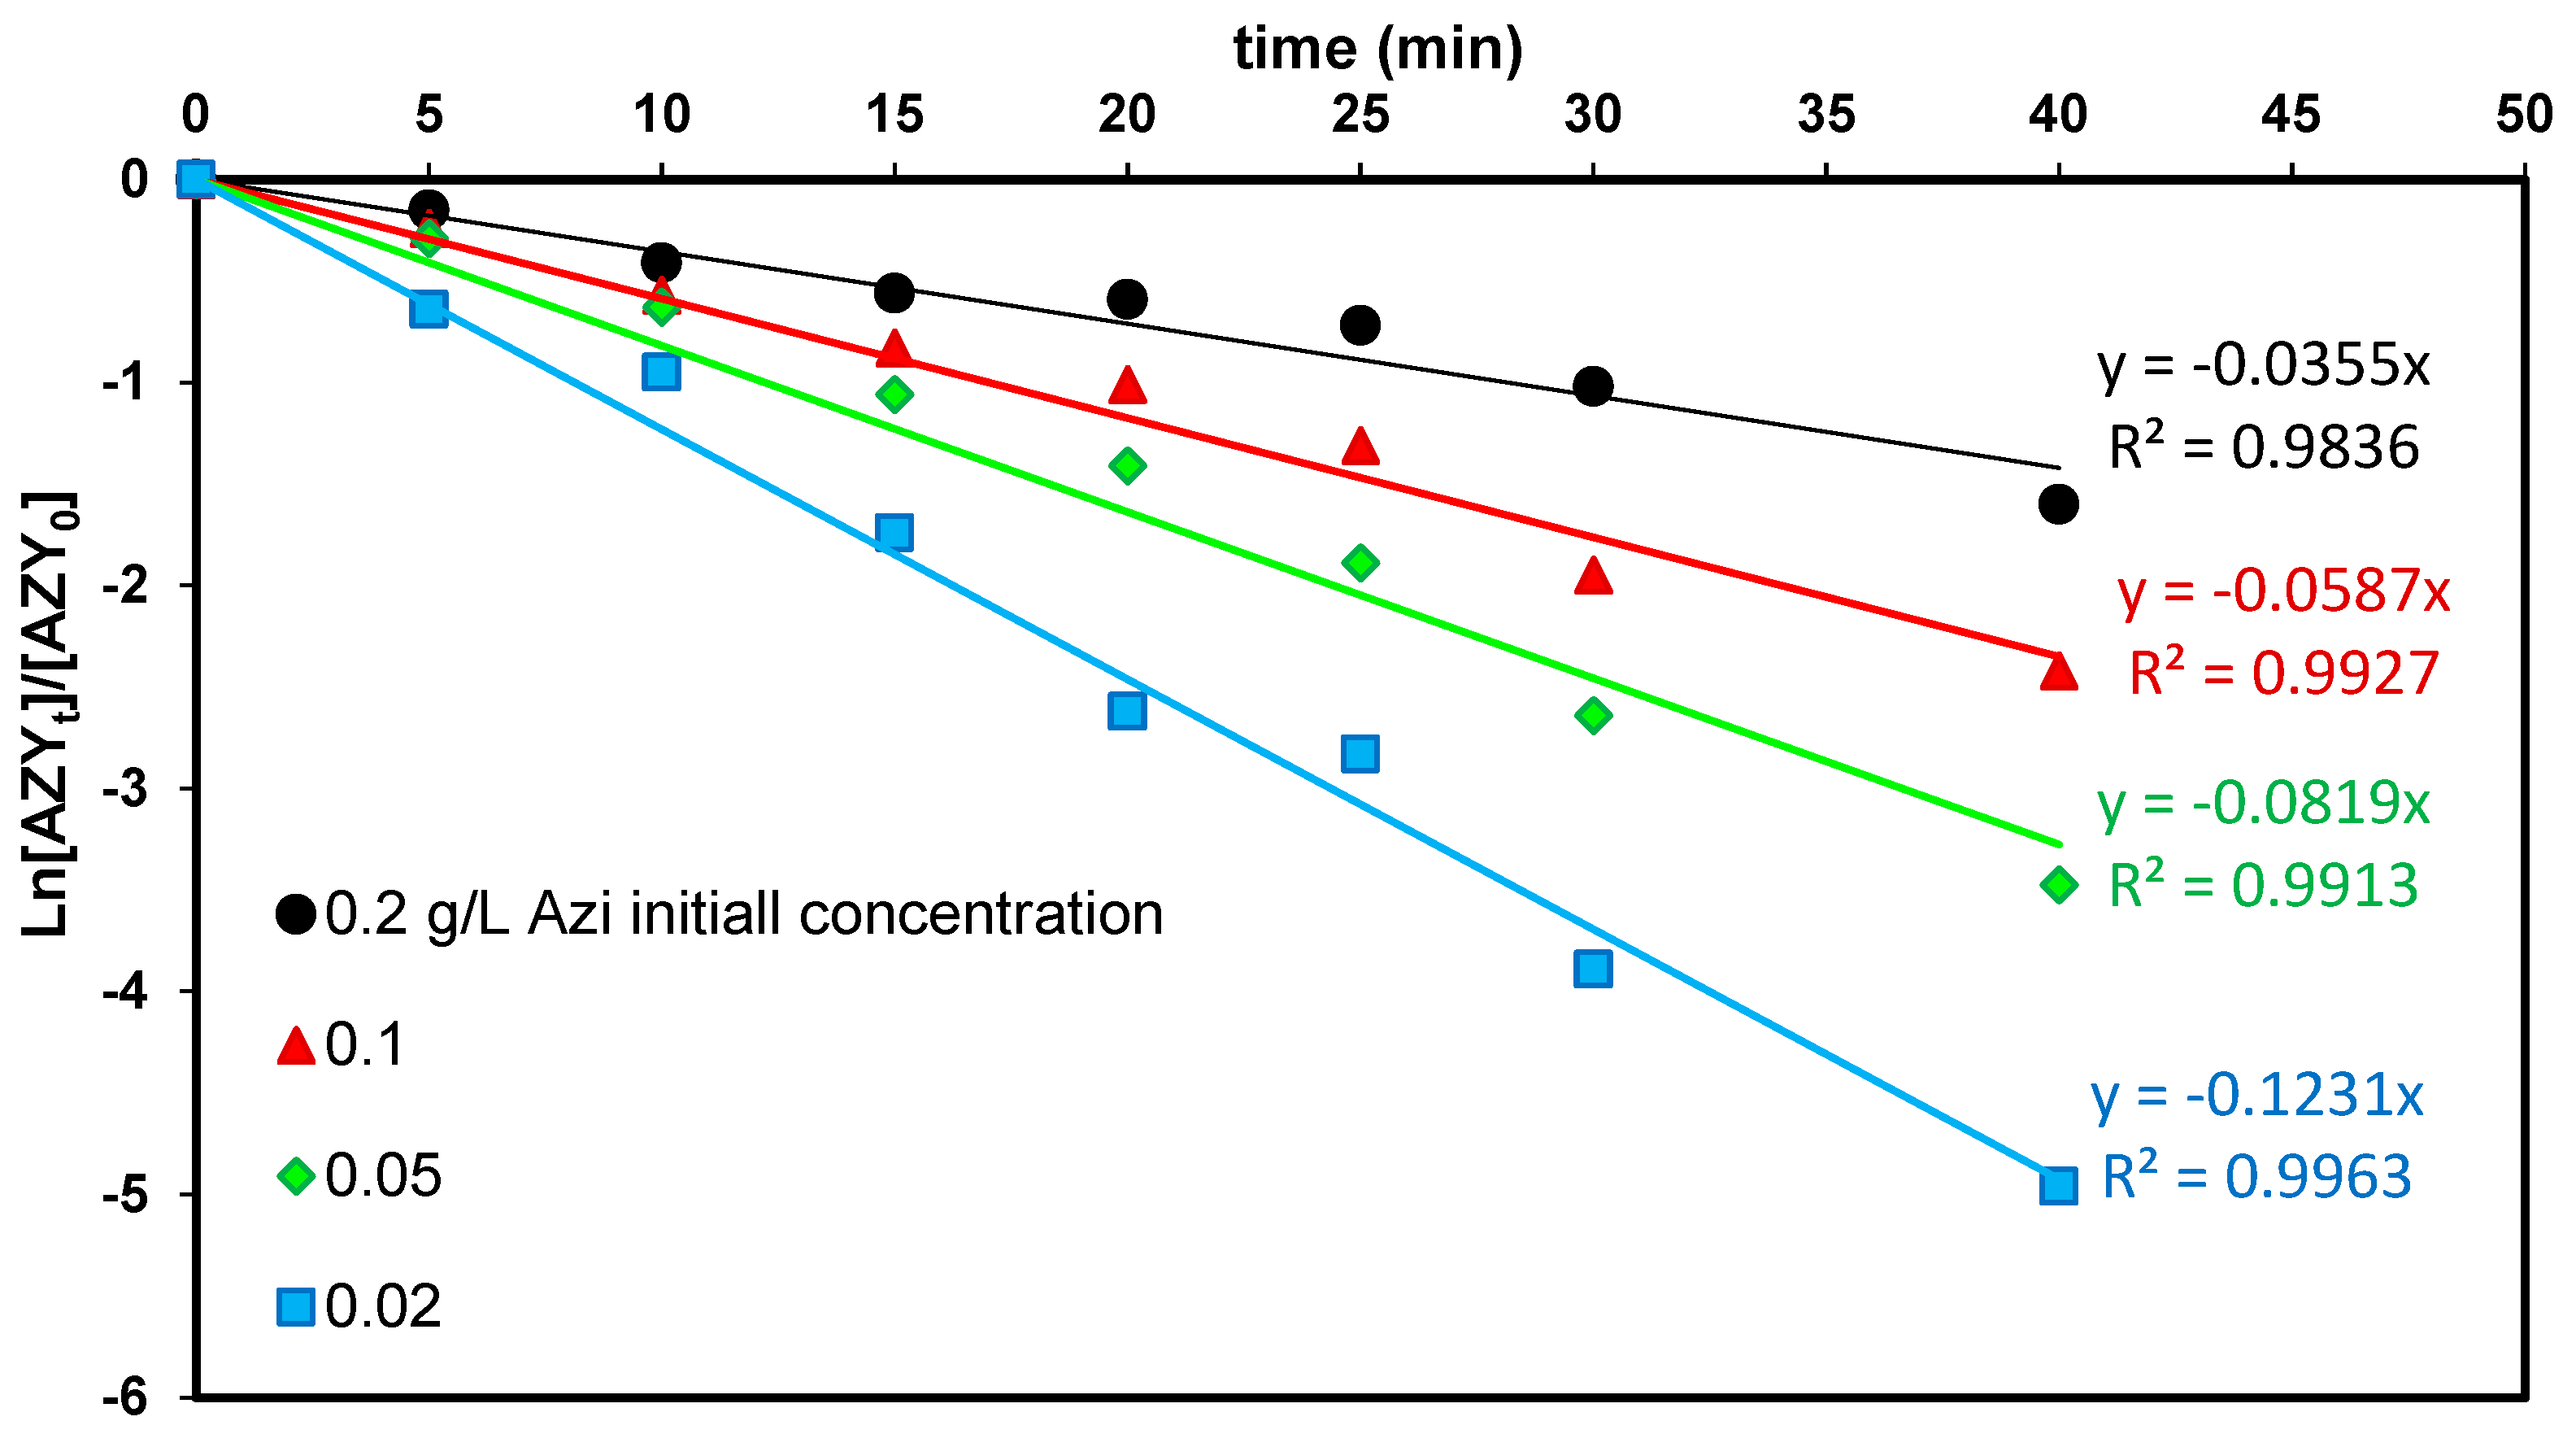
3.6. Kinetic of Azi Removal

To study the Azi removal kinetic based on the COD criterion, experiments were surveyed for 0.02–0.2 g/L of Azi under optimum conditions (pH 5, Mn-BTCarg/Al dosage of 6 g/L and H2O2 concentration of 1 g/L). The results match well with the pseudo-first order kinetic and the corresponding rate constant parameters, kAzi, were obtained from the slope of ln ( [ Azi ] t / [ Azi ] 0 ) versus time (Figure 10). As the concentration of Azi in the reaction media increases, the constant rate decreases significantly. Noteworthy, compared to the previously reported systems, the performance of the employed H2O2-Azi-MnBTCarg/Al system shows a prominent performance in Azi removal [2,5,6].
In order to evaluate the performance of the studied H2O2-Azi-MnBTCarg/Al system, the Azi removal efficiency and obtained kAzi values were compared with the previously reported works on Azi removal. As represented in Table 4, the employed process with the prominent catalyst performance is quite distinguished with respect to the reaction time and the achieved removal efficiency.

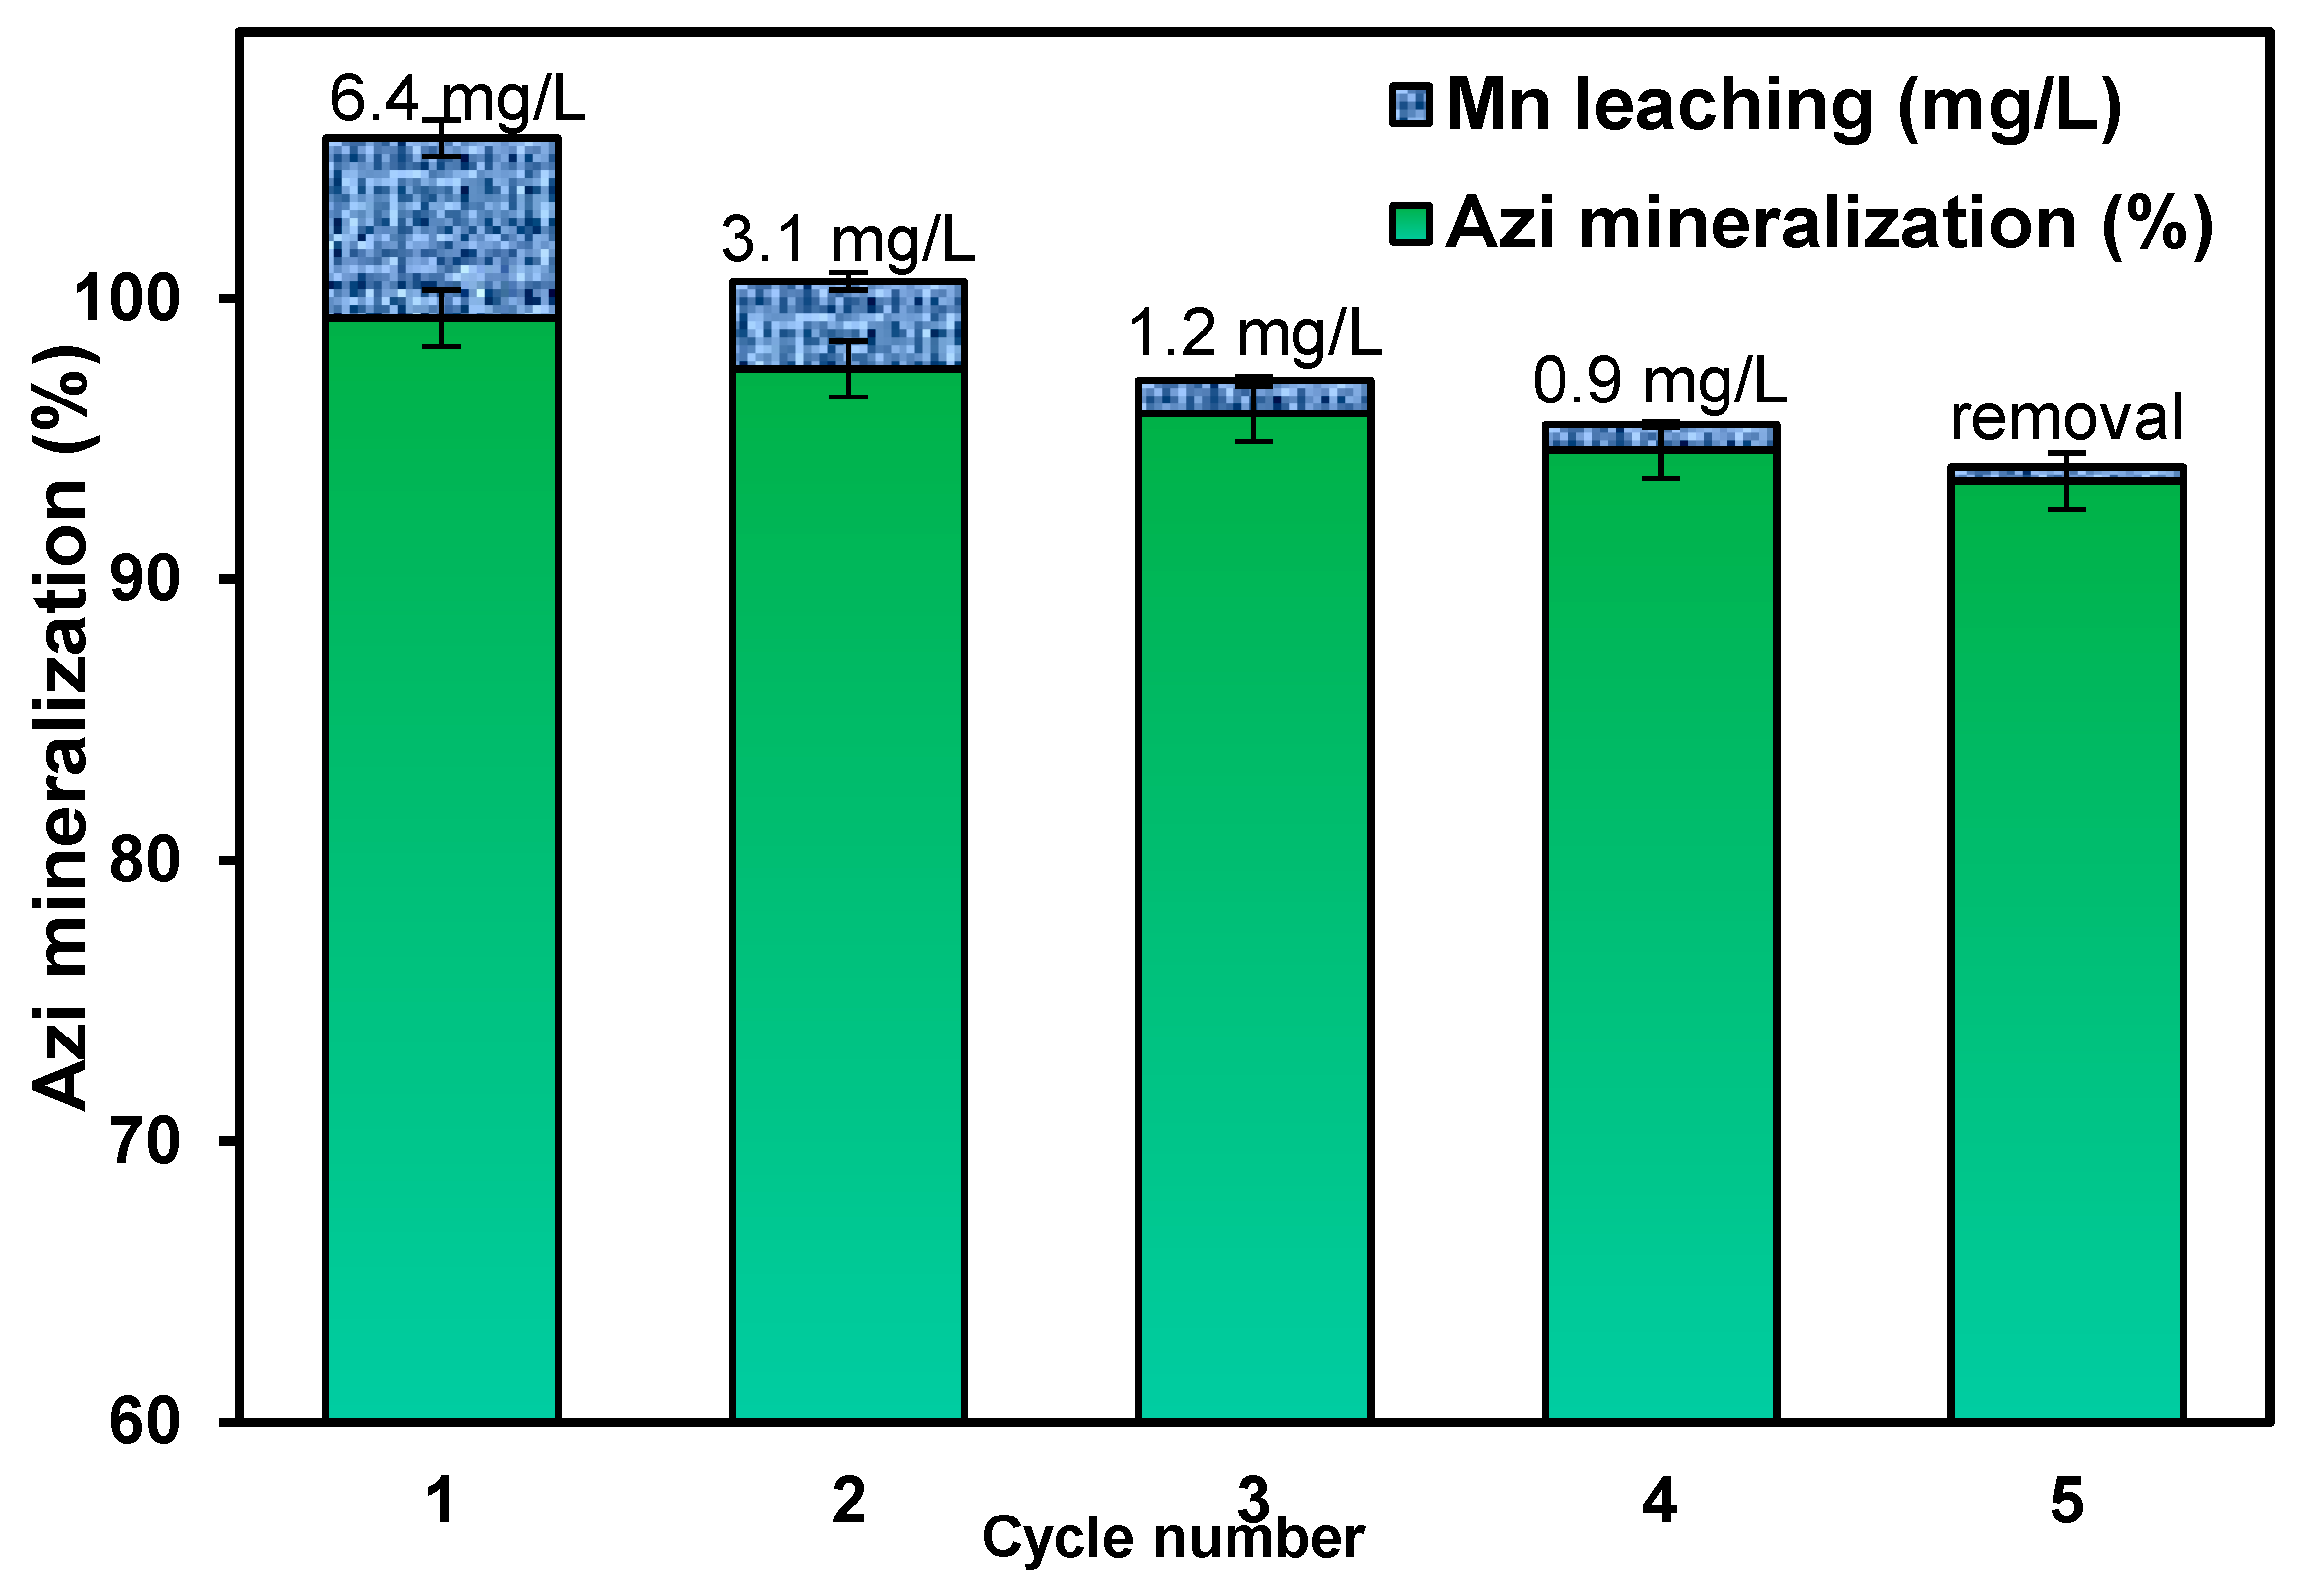
3.7. Catalyst Stability and Reusability

The stability of MnBTCarg/Al catalyst in five usage cycles is shown in Figure 11. During the first cycle, the Azi removal decreased from 99.3 to 97.5%, whereas the ICP-Mass analysis showed 6.4 mg/L of manganese ion leaching in the solution. The structural stability of Mn-BTCarg/Al could regard as the assembling of high-valente manganese ions with hard aromatic tricarboxylates base that formed strong coordinated bonds. Additionally, the flexible nature and remarkable coordination ability of aromatic tricarboxylates allow them to bend and rotate freely with the metal centers [15]. On the other hand, embedding Mn(BTC)x on the mesopores of alumina support could inhabit the metal leaching in the reaction medium [16]. The performance stability of Mn-BTCarg/Al relates to the participation of both aromatic tricarboxylates and active metal in redox reaction. Additionally, based on the XRD pattern (Figure 4), insertion of Al ions in Mn(BTC)x structure could generate Al2+/Al3+ redox pairs that enhance the Mn4+/Mn3+ transfer, raise the catalyst replenishment and postpone Mn-BTCarg/Al deactivation [16]. As is evidence, the catalyst activity decreased smoothly until the end of fifth cycle, while the metal leaching declined after the first cycle, distinctly. This loss of catalytic activities in the further cycles could be attributed to the partial blockage of the active sites by the degradation of intermediates.

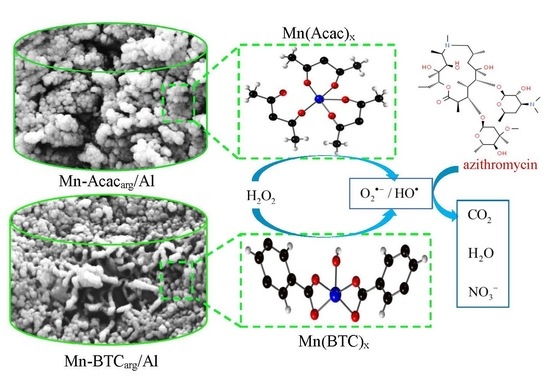
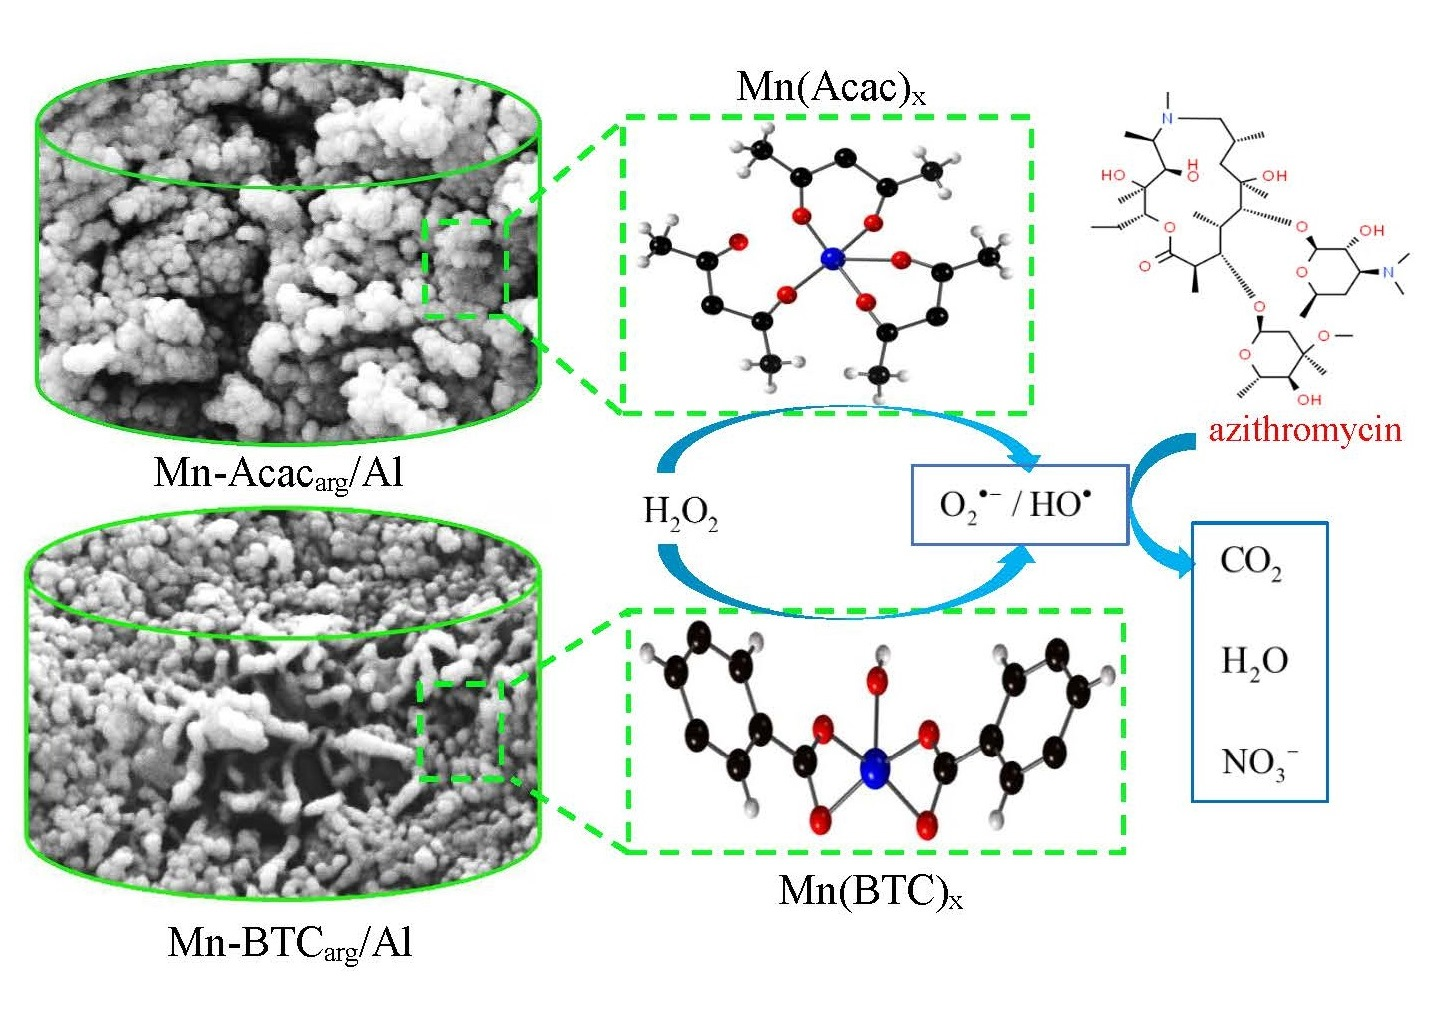
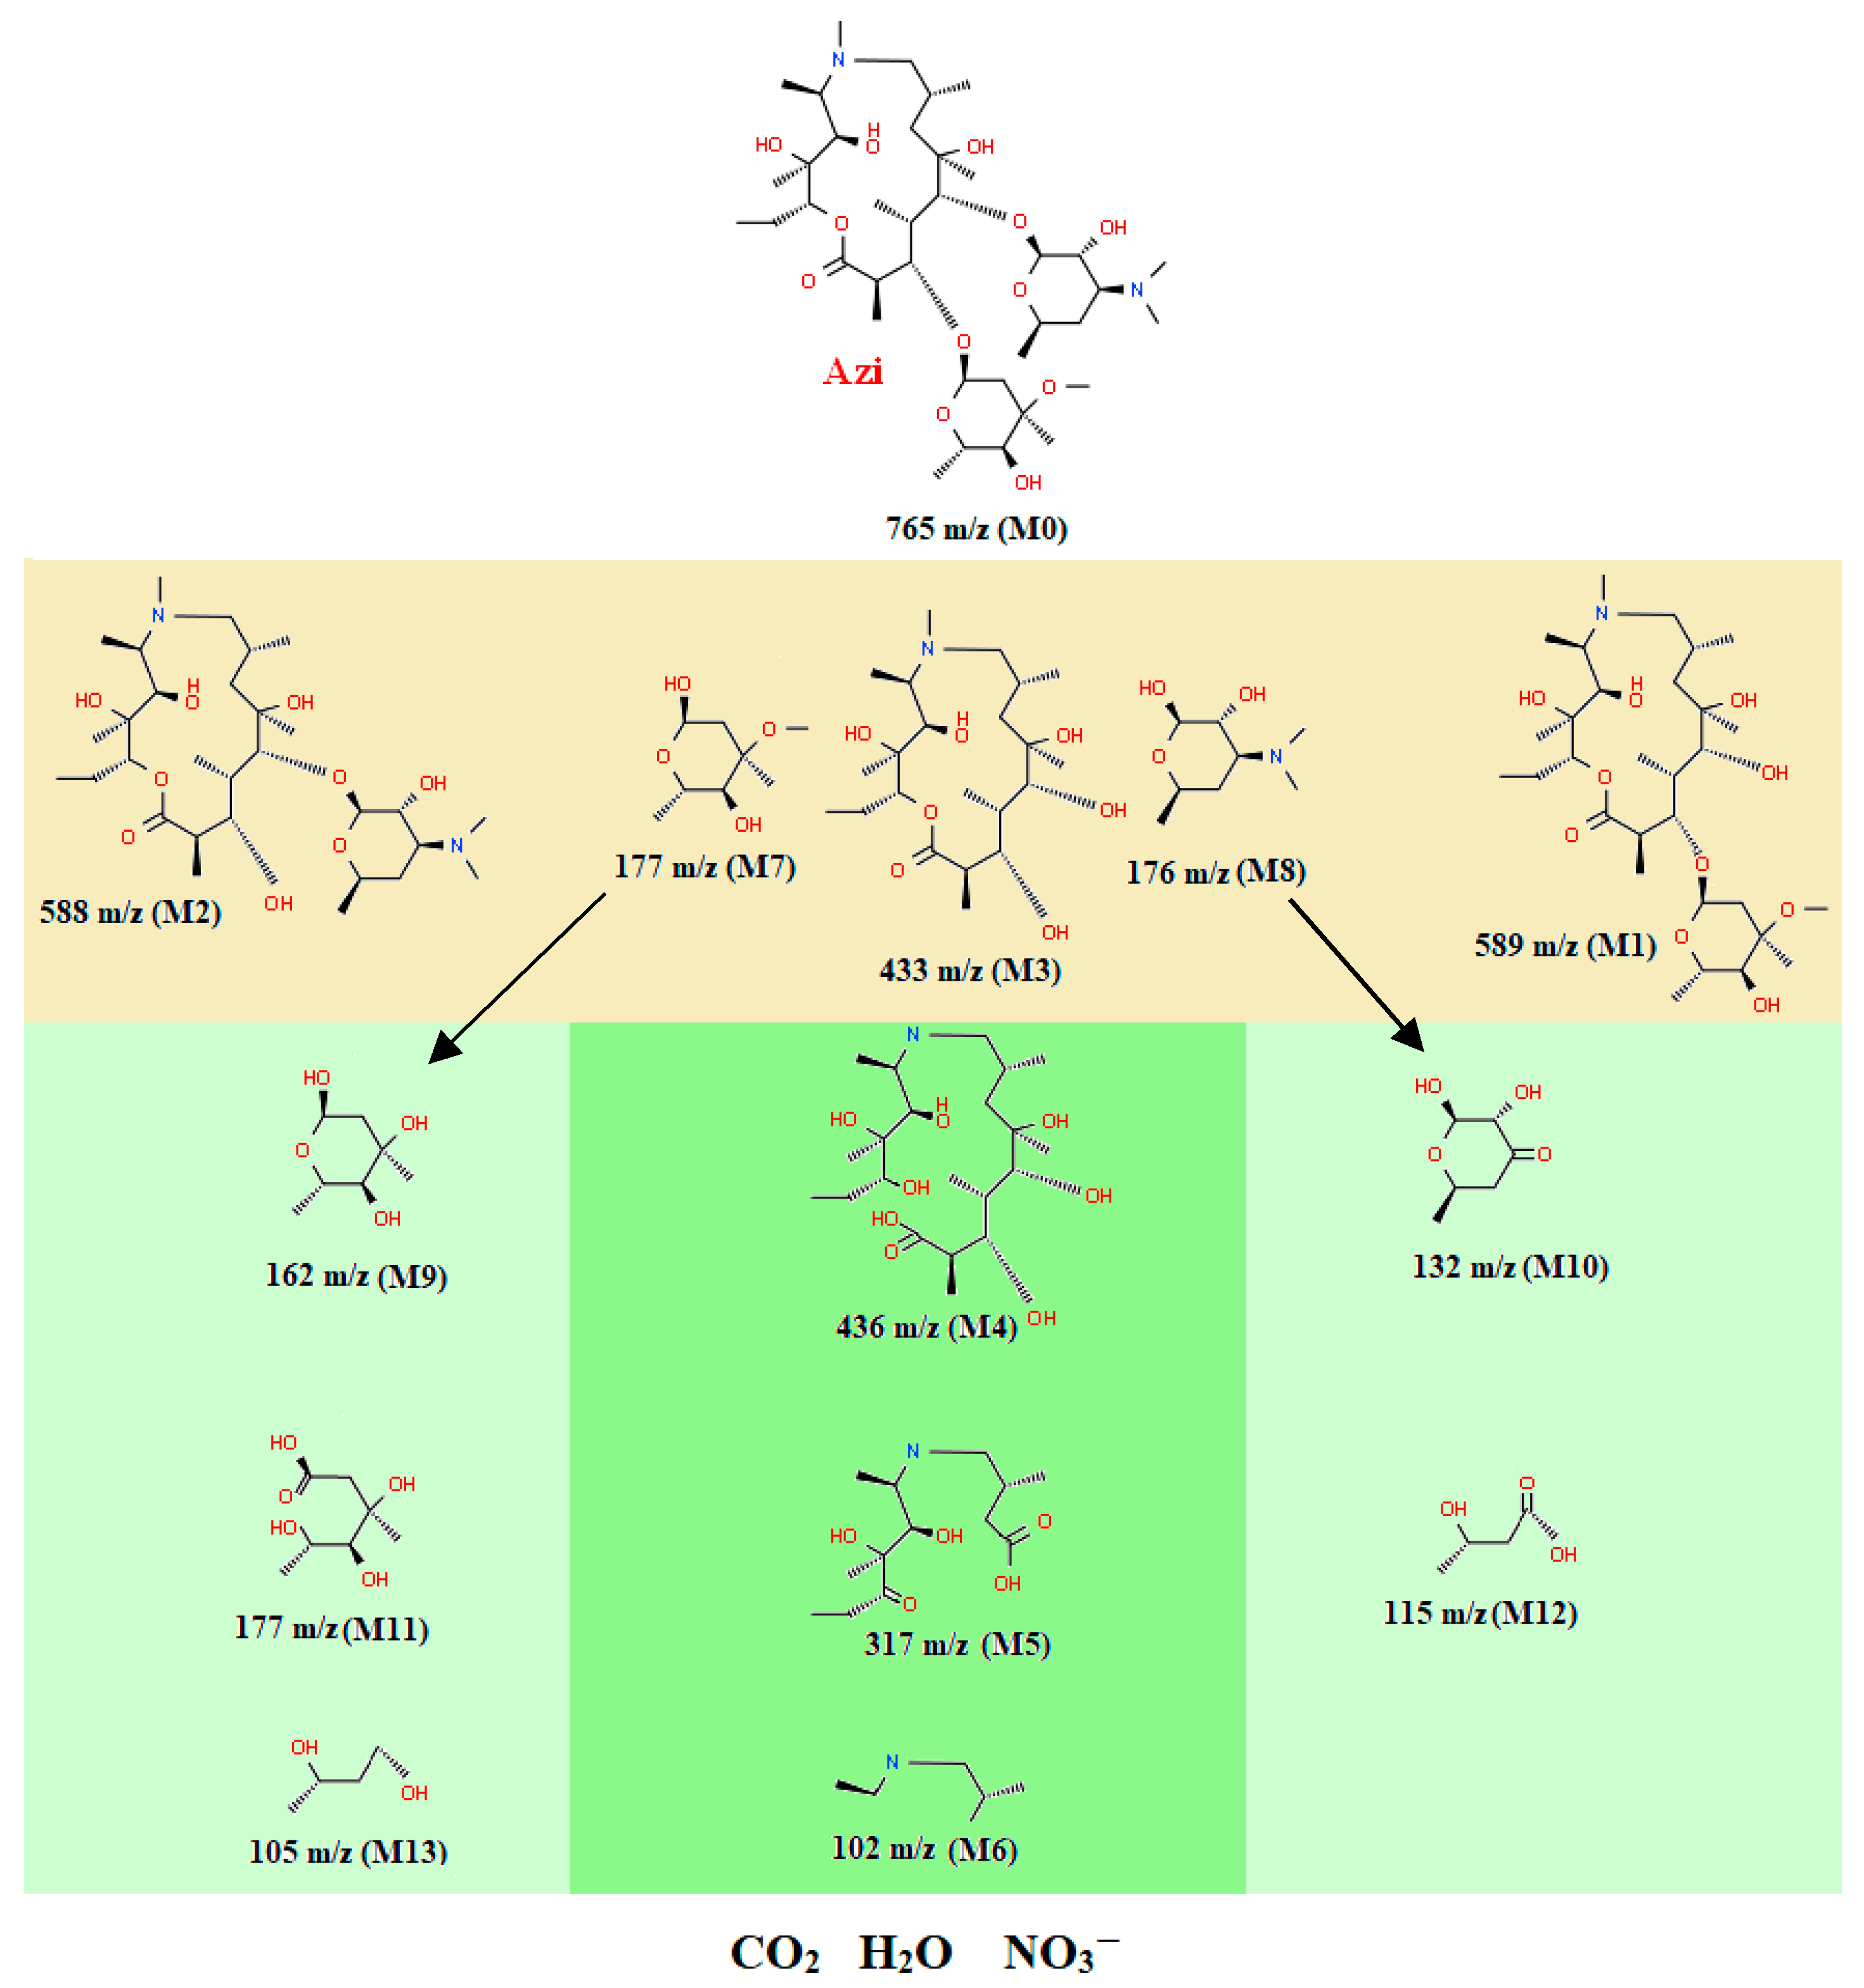
3.8. Azi Removal Mechanism

The Azi removal mechanism was studied under optimal conditions. For this purpose, the reaction solution was sampled and immediately injected to the LC-Mass/Mass instrument to determine the individual ionic fragments. Based on the results and identified intermediates, the predicted mechanism for Azi removal is shown in Figure 12. As shown in Figure 7c and d, the HO radical is responsible for Azi degradation in the H2O2-Azi-Mn-BTCarg/Al system. Therefore, the hydroxylation of the C−O and C−N bonds in the Azi aromatic ring could lead to cleavage of the sugar moiety and ring opening in the first step [36].
The removal pathway could start with desosamine or cladinose cleavage reactions, which consequently, leads to form the M1 and M2 intermediates. If the desosamine and cladinose sugar cleavage occurs simultaneously, three molecules with characteristic peaks at 433 (M3), 177 (M7) and 176 (M8) m/z would be formed [40]. Then, the degradation reaction can proceed in three parallel pathways. The lactone macromolecule degradation is started by the N-demethylation [21]. Then, the hydroxylation leads to cleavage the lactone ring and generates the 436 m/z intermediate (M4). In the next step, through the β-oxidation reaction and losing carboxylic acid, the 317 m/z molecule is produced (M5). In the continuity, the oxidation of diols creates carboxylic acid moiety on the structure that was converted to the smaller component (M6) by releasing of CO2 molecules through decarboxylation reaction.
In removal, the separated desosamine sugar (M8) released NR2 moiety via the N-demethylation and oxidative deamination reactions, giving the 132 m/z intermediates with a new ketone functional group. Meanwhile, the O-demethylation reaction first occurs to create the 162 m/z molecules for the released cladinose sugar. In the next step, both intermediates are influenced by the hydrolysis reaction of enol-ether to aldehyde, leading to the opening of the desosamine and cladinose rings [21]. Then, the hydroxyl radical attacks the ketone moiety and the removal reaction progress by diols oxidation and decarboxylation reaction to produce the new 3-hydroxybutanoic acid (115 m/z) and 3-hydroxybutanal molecule (105 m/z) intermediates [41]. The molecules of final degradation steps with 394, 162, and 115 m/z loss their carboxylic acid groups. The removal can be terminated by releasing CO2, H2O and NO3 and smaller molecules upon decarboxylation reaction [6].

4. Conclusions and Future Works

Amorphous and uniform coating layers of manganese phases were formed with Acac, and H3BTC ligands and products were used in a state-of-the-art removal process. In the pristine Mn/Al catalyst, different Mn2+, Mn3+ and Mn4+ states were identified, while incorporating O-donor ligands shifted the abundance of metal species toward favorable oxidation states. Precisely, oxygen vacancies could be generated during the synthesis and calcination more obvious with the Mn-BTCarg/Al catalyst. Results revealed that hydrogen peroxide activation by the catalysts strongly depended on the coordinately unsaturated sites and the kind of ligand that could remarkably enhance the redox ability of Mn species and overcome the ligands surface barrier. In azithromycin removal, the catalysts revealed profound results. It was revealed that hydroxyl radical was the dominant ROS in the studied system for which the integrated reaction kinetic was determined. Among the synthesized products, the powerful Mn-BTCarg/Al catalyst could give nearly perfect azithromycin removal under the optimal conditions in short times. This catalyst exhibited incredible stability with negligible activity decrease and manganese ion release during five Azi removal cycles. Based on the LC-MS/MS results, the removal pathway could start with desosamine or cladinose cleavage and ring opening reactions via hydroxylation of the C−O and C−N bonds. In progress, the macromolecule converted to the smaller component through the N-demethylation, O-demethylation, hydrolysis which leading to the ring opening and releasing of CO2 molecules. The removal can be terminated by releasing CO2, H2O and NO3 and smaller component.
Future works can focus on (i) studying economic aspects, (ii) determining the band gap energy of the products for utilizing the products as a photocatalyst, (iii) examining the stability of MOF catalysts to avoid the metal leaching under strong acidic and basic conditions, and iv) investigating the effect of other O-donor ligands on the MOF catalyst stability and redox activity.

Author Contributions

All authors conceived and designed the experiments. F.H. performed the experiments and provided data analysis. All authors discussed the results and co-wrote the manuscript. All authors have read and agreed to the published version of the manuscript.

Funding

This research received no external funding.

Data Availability Statement

Not applicable.

Conflicts of Interest

The authors report no conflict of interest. The authors alone are responsible for the content and writing of this article.

References

  1. Wu, Y.; Zhao, X.; Huang, S.; Li, Y.; Zhang, X.; Zeng, G.; Niu, L.; Ling, Y.; Zhang, Y. Facile construction of 2D g-C3N4 supported nanoflower-like NaBiO3 with direct Z-scheme heterojunctions and insight into its photocatalytic degradation of tetracycline. J. Hazard. Mater. 2021, 414, 125547. [Google Scholar] [CrossRef] [PubMed]
  2. Ricky, R.; Shanthakumar, S. Phycoremediation integrated approach for the removal of pharmaceuticals and personal care products from wastewater–A review. J. Environ. Manag. 2022, 302, 113998. [Google Scholar] [CrossRef]
  3. Mowery, H.; Loganathan, B. Persistent organic compounds in wastewater: Azithromycin and urobilin concentrations in wastewater treatment plant samples from Murray, Kentucky, USA. Organohalogen Compd. 2007, 69, 483. [Google Scholar]
  4. Martínez-Polanco, M.P.; Martínez-Polanco, M.P.; Valderrama-Rincón, J.A.; Martínez-Rojas, A.J.; Luna-Wandurraga, H.J.; Díaz-Báez, M.C.; Bustos-López, M.C.; Valderrama-Rincon, J.D. Degradation of high concentrations of azithromycin when present in a high organic content wastewater by using a continuously fed laboratory-scale UASB bioreactor. Chemosphere 2022, 287, 132191. [Google Scholar] [CrossRef] [PubMed]
  5. Qin, H.; Yang, Y.; Shi, W.; She, Y.; Wu, S. Heterogeneous Fenton degradation of azithromycin antibiotic in water catalyzed by amino/thiol-functionalized MnFe2O4 magnetic nanocatalysts. Environ. Chem. Engin. J. 2021, 9, 106184. [Google Scholar] [CrossRef]
  6. Voigt, M.; Jaeger, M. On the photodegradation of azithromycin, erythromycin and tylosin and their transformation products–A kinetic study. Sustain. Chem. Pharm. 2017, 5, 131–140. [Google Scholar] [CrossRef]
  7. Pan, K.; Yang, C.; Hu, J.; Yang, W.; Liu, B.; Yang, J.; Liang, S.; Xiao, K.; Hou, H. Oxygen vacancy mediated surface charge redistribution of Cu-substituted LaFeO3 for degradation of bisphenol A by efficient decomposition of H2O2. J. Hazard. Mater. 2020, 389, 122072. [Google Scholar] [CrossRef]
  8. Kholdeeva, O.; Maksimchuk, N. Metal-organic frameworks in oxidation catalysis with hydrogen peroxide. Catalysts 2021, 11, 283. [Google Scholar] [CrossRef]
  9. Schubert, J.S.; Popovic, J.; Haselmann, G.M.; Nandan, S.P.; Wang, J.; Giesriegl, A.; Cherevan, A.S.; Eder, D. Immobilization of Co, Mn, Ni and Fe oxide co-catalysts on TiO2 for photocatalytic water splitting reactions. J. Mater. Chem. A 2019, 7, 18568–18579. [Google Scholar] [CrossRef] [Green Version]
  10. Aunan, E.; Affolter, C.W.; Olsbye, U.; Lillerud, K.P. Modulation of the Thermochemical Stability and Adsorptive Properties of MOF-808 by the Selection of Non-structural Ligands. Chem. Mater. 2021, 33, 1471–1476. [Google Scholar] [CrossRef]
  11. Cheng, M.; Lai, C.; Liu, Y.; Zeng, G.; Huang, D.; Zhang, C.; Qin, L.; Hu, L.; Zhou, C.; Xiong, W. Metal-organic frameworks for highly efficient heterogeneous Fenton-like catalysis. Coord. Chem. Rev. 2018, 368, 80–92. [Google Scholar] [CrossRef]
  12. Wu, Q.; Siddique, M.S.; Guo, Y.; Wu, M.; Yang, Y.; Yang, H. Low-crystalline bimetallic metal-organic frameworks as an excellent platform for photo-Fenton degradation of organic contaminants: Intensified synergism between hetero-metal nodes. Appl. Catal. B Environ. 2021, 286, 119950. [Google Scholar] [CrossRef]
  13. Reinsch, H.; Stock, N. Formation and characterisation of Mn-MIL-100. CrystEngComm 2013, 15, 544–550. [Google Scholar] [CrossRef] [Green Version]
  14. Ding, M.; Cai, X.; Jiang, H.-L. Improving MOF stability: Approaches and applications. Chem. Sci. 2019, 10, 10209–10230. [Google Scholar] [CrossRef] [PubMed] [Green Version]
  15. Wang, K.; Hui, K.N.; San Hui, K.; Peng, S.; Xu, Y. Recent progress in metal–organic framework/graphene-derived materials for energy storage and conversion: Design, preparation, and application. Chem. Sci. 2021, 12, 5737–5766. [Google Scholar] [CrossRef]
  16. Jiang, Y.; Gao, J.; Zhang, Q.; Liu, Z.; Fu, M.; Wu, J.; Hu, Y.; Ye, D. Enhanced oxygen vacancies to improve ethyl acetate oxidation over MnOx-CeO2 catalyst derived from MOF template. Chem. Engin. J. 2019, 371, 78–87. [Google Scholar] [CrossRef]
  17. Zhang, X.; Hou, F.; Li, H.; Yang, Y.; Wang, Y.; Liu, N.; Yang, Y. A strawsheave-like metal organic framework Ce-BTC derivative containing high specific surface area for improving the catalytic activity of CO oxidation reaction. Micropor. Mesopor. Mat. 2018, 259, 211–219. [Google Scholar] [CrossRef]
  18. Shalaby, M.; Abdallah, H. Preparation of manganese (III) acetylacetonate nanoparticles via an environmentally benign route. Front. Chem. Sci. Eng. 2013, 7, 329–337. [Google Scholar] [CrossRef]
  19. Hasanpour, F.; Saien, J. Incorporating Pb2+ templates into the crystalline structure of MnO2 catalyst supported on monolith: Applications in H2O2 decomposition. ACS Omega 2019, 4, 16638–16650. [Google Scholar] [CrossRef] [Green Version]
  20. Lee, E.; Lee, H.; Kim, Y.; Sohn, K.; Lee, K. Hydrogen peroxide interference in chemical oxygen demand during ozone based advanced oxidation of anaerobically digested livestock wastewater. Int. J. Environ. Sci. Technol. 2011, 8, 381–388. [Google Scholar] [CrossRef] [Green Version]
  21. Naraginti, S.; Yu, Y.-Y.; Fang, Z.; Yong, Y.-C. Visible light degradation of macrolide antibiotic azithromycin by novel ZrO2/Ag@TiO2 nanorod composite: Transformation pathways and toxicity evaluation. Process Safety Environ. Prot. 2019, 125, 39–49. [Google Scholar] [CrossRef]
  22. Sel, K.; Demirci, S.; Ozturk, O.F.; Aktas, N.; Sahiner, N. NH3 gas sensing applications of metal organic frameworks. Microelectron. Eng. 2015, 136, 71–76. [Google Scholar] [CrossRef]
  23. Niu, T.; Li, J.; Qi, Y.; Huang, X.; Ren, Y. Preparation and electrochemical properties of α-MnO2/rGO-PPy composite as cathode material for zinc-ion battery. J. Mater. Sci. 2021, 56, 16582–16590. [Google Scholar] [CrossRef]
  24. Li, W.; Xu, J.; Pan, Y.; An, L.; Xu, K.; Wang, G.; Yu, Z.; Yu, L.; Hu, J. A facile synthesis of α-MnO2 used as a supercapacitor electrode material: The influence of the Mn-based precursor solutions on the electrochemical performance. Appl. Surf. Sci. 2015, 357, 1747–1752. [Google Scholar] [CrossRef]
  25. Huang, X.; Lv, D.; Yue, H.; Attia, A.; Yang, Y. Controllable synthesis of α-and β-MnO2: Cationic effect on hydrothermal crystallization. Nanotechnology 2008, 19, 225606. [Google Scholar] [CrossRef] [Green Version]
  26. Saputra, E.; Muhammad, S.; Sun, H.; Ang, H.-M.; Tadé, M.O.; Wang, S. Manganese oxides at different oxidation states for heterogeneous activation of peroxymonosulfate for phenol degradation in aqueous solutions. Appl. Catal. B Environ. 2013, 142, 729–735. [Google Scholar] [CrossRef] [Green Version]
  27. Liu, Q.; Ji, S.; Yang, J.; Wang, H.; Pollet, B.G.; Wang, R. Enhanced cycleability of amorphous MnO2 by covering on α-MnO2 needles in an electrochemical capacitor. Materials 2017, 10, 988. [Google Scholar] [CrossRef]
  28. Gou, L.; Mou, K.-L.; Fan, X.-Y.; Zhao, M.-J.; Wang, Y.; Xue, D.; Li, D.-L. Mn2O3/Al2O3 cathode material derived from a metal–organic framework with enhanced cycling performance for aqueous zinc-ion batteries. Dalton Trans. 2020, 49, 711–718. [Google Scholar] [CrossRef]
  29. Mahdavi, M.; Farrokhpour, H.; Tahriri, M. A Comparison of Catalytic Effect of Nano-Mn3O4 derived from MnC2O4.2H2O and Mn(acac)3 on Thermal Decomposition of Ammonium Perchlorate. Z. Anorg. Allgem. Chem. 2018, 644, 241–252. [Google Scholar] [CrossRef]
  30. Garakani, M.A.; Abouali, S.; Cui, J.; Kim, J.-K. In Situ TEM study of lithiation into a PPy coated α-MnO2/graphene foam freestanding electrode. Mater. Chem. Front. 2018, 2, 1481–1488. [Google Scholar] [CrossRef]
  31. Lee, J.W.; Hall, A.S.; Kim, J.-D.; Mallouk, T.E. A facile and template-free hydrothermal synthesis of Mn3O4 nanorods on graphene sheets for supercapacitor electrodes with long cycle stability. Chem. Mater. 2012, 24, 1158–1164. [Google Scholar] [CrossRef]
  32. Rosen, A.S.; Mian, M.R.; Islamoglu, T.; Chen, H.; Farha, O.K.; Notestein, J.M.; Snurr, R.Q. Tuning the redox activity of metal–organic frameworks for enhanced, selective O2 binding: Design rules and ambient temperature O2 chemisorption in a cobalt–triazolate framework. J. Am. Chem. Soc. 2020, 142, 4317–4328. [Google Scholar] [CrossRef] [PubMed]
  33. Qu, W.; Wen, H.; Qu, X.; Guo, Y.; Hu, L.; Liu, W.; Tian, S.; He, C.; Shu, D. Enhanced Fenton-like catalysis for pollutants removal via MOF-derived CoxFe3−xO4 membrane: Oxygen vacancy-mediated mechanism. Chemosphere 2022, 303, 135301. [Google Scholar] [CrossRef] [PubMed]
  34. Menon, A.V.; Choudhury, B.; Madras, G.; Bose, S. ‘Trigger-free’self-healable electromagnetic shielding material assisted by co-doped graphene nanostructures. Chem. Eng. J. 2020, 382, 122816. [Google Scholar] [CrossRef]
  35. Guimarães, A.T.B.; Estrela, F.N.; de Lima Rodrigues, A.S.; Chagas, T.Q.; Pereira, P.S.; Silva, F.G.; Malafaia, G. Nanopolystyrene particles at environmentally relevant concentrations causes behavioral and biochemical changes in juvenile grass carp (Ctenopharyngodon idella). J. Hazard. Mater. 2021, 403, 123864. [Google Scholar] [CrossRef]
  36. Jalali, S.; Ardjmand, M.; Ramavandi, B.; Nosratinia, F. Removal of amoxicillin from wastewater in the presence of H2O2 using modified zeolite Y-MgO catalyst: An optimization study. Chemosphere 2021, 274, 129844. [Google Scholar] [CrossRef]
  37. Jaramillo-Baquero, M.; Zúñiga-Benítez, H.; Peñuela, G.A. Use of photo-fenton for macrolide antibiotic azithromycin removal. Acta Period. Technol. 2020, 51, 29–37. [Google Scholar]
  38. Shokri, R.; Yengejeh, R.J.; Babaei, A.A.; Derikvand, E.; Almasi, A. UV activation of hydrogen peroxide for removal of azithromycin antibiotic from aqueous solution: Determination of optimum conditions by response surface methodology. Toxin Rev. 2019, 39, 284–291. [Google Scholar] [CrossRef]
  39. Sayadi, M.H.; Sobhani, S.; Shekari, H. Photocatalytic degradation of azithromycin using GO@ Fe3O4/ZnO/SnO2 nanocomposites. J. Clean. Prod. 2019, 232, 127–136. [Google Scholar] [CrossRef]
  40. Tong, L.; Eichhorn, P.; Pérez, S.; Wang, Y.; Barceló, D. Photodegradation of azithromycin in various aqueous systems under simulated and natural solar radiation: Kinetics and identification of photoproducts. Chemosphere 2011, 83, 340–348. [Google Scholar] [CrossRef]
  41. Čizmić, M.; Ljubas, D.; Rožman, M.; Ašperger, D.; Ćurković, L.; Babić, S. Photocatalytic degradation of azithromycin by nanostructured TiO2 film: Kinetics, degradation products, and toxicity. Materials 2019, 12, 873. [Google Scholar] [CrossRef]
Figure 1. Scheme of the used setup for hydrogen peroxide catalytic activation and Azi removal.
Catalysts 13 00077 g001
Figure 2. SEM images, manganese mapping FESEM analyses and EDX patterns of the Mn/Al (ac), Mn-Acacair/Al (df), Mn-Acacarg/Al (gi) and the Mn-BTCarg/Al (jl) samples.
Catalysts 13 00077 g002
Figure 3. The TEM images of the Mn/Al (a) and Mn-BTCarg/Al (b), HRTEM images of the Mn/Al (a1a4) and Mn-BTCarg/Al (b1,b2) and FTT analysis of the Mn/Al (a5) and Mn-BTCarg/Al (b3) samples.
Catalysts 13 00077 g003
Figure 4. The XRD patterns of the Mn/Al, Mn-Acacair/Al, Mn-Acacarg/Al and Mn-BTCarg/Al catalysts (a) and relevant manganese phase structures (bf).
Catalysts 13 00077 g004
Figure 5. The XPS spectra of Mn/Al, Mn-Acacair/Al, Mn-Acacarg/Al and the Mn-BTCarg/Al catalysts; Mn 3s(a), Mn 2p3/2 (b), and O 1s (c).
Catalysts 13 00077 g005
Figure 6. Conversion of hydrogen peroxide versus time for different used catalysts (a) and the kinetic plots (b); catalyst dosage of 5 g/L and initial H2O2 concentration of 10 g/L.
Catalysts 13 00077 g006
Figure 7. (a) The Azi adsorption: pH = 7, catalyst dose of 5 g/L, and Azi initial concentration of 0.1 g/L in the absence of H2O2; (b) Azi removal, (c) Effect of isopropanol on Azi removal and (d) Effect of P-benzoquinone (BQ) on Azi removal: pH = 7, catalyst dose of 5 g/L, and Azi concentration of 0.1 g/L, H2O2 concentration of 5 g/L.
Catalysts 13 00077 g007
Figure 8. Effects of pH and Mn-BTCarg/Al dosage on the Azi removal (a), Azi initial concentration of 0.1 g/L, the H2O2 concentration of 5 g/L and 40 min treatment; The pHzpc of Mn-BTCarg/Al (b), Mn-BTCarg/Al dosage of 0.1 g/L.
Catalysts 13 00077 g008
Figure 9. Effects of Azi and H2O2 initial concentrations on the Azi removal; pH = 5, Mn-BTCarg/Al catalyst dosage of 6 g/L and after 40 min treatment.
Catalysts 13 00077 g009
Figure 10. Kinetic plot of the Azi removal; pH = 5, Mn-BTCarg/Al catalyst dosage of 6 g/L and H2O2 concentration of 1 g/L.
Catalysts 13 00077 g010
Figure 11. The stability of the catalyst in consecutive regenerating cycles; pH = 5, Mn-BTCarg/Al catalyst dosage of 6 g/L, Azi concentration of 0.02 g/L and H2O2 concentration of 1 g/L.
Catalysts 13 00077 g011
Figure 12. The removal pathway of Azi in the Mn-BTCarg/Al-H2O2 process.
Catalysts 13 00077 g012
Table 1. BET surface analyses of the support and catalysts.
Catalyst/SupportSurface Area (BET)
(m2.g−1)
Pore Volume
(cm3.g−1)
Average Pore Diameter
(nm)
Alumina support2590.524.72
Mn/Al1630.274.31
Mn-Acacair/Al2160.345.29
Mn-Acacarg/Al2510.486.13
Mn-BTCarg/Al2460.435.74
Table 2. The summary of XPS analysis results for the prepared catalysts.
CatalystΔES (eV)Mn4+/Mn3+Oxygen Distribution (%)
OαOβOβ/Oα
Mn/Al3.211.1578.5222.480.29
Mn-Acacair/Al3.711.5158.2333.410.57
Mn-Acacarg/Al3.772.1542.6137.940.89
Mn-BTCarg/Al3.843.2640.9248.651.19
Table 3. The dispersion and number of manganese particles determined by H2-chemisorption of different prepared catalysts and the TON value of catalysts after 30 min.
CatalystH2 Desorption
(µmol. gcat −1)
D (%)Active Sites No., NAc,
(×1020.gcat −1)
(TON)
( N H 2 O 2 min 1 N Ac 1 )
Mn/Al82122.463.521.53
Mn-Acacair/Al118332.405.121.95
Mn-Acacarg/Al91625.063.972.17
Mn-BTCarg/Al127534.915.612.32
Table 4. Comparison of the Azi removal results of other works with this study.
ProcessCatalystAzi Initial Conc. (mg/L)Reaction Time (min)Azi Removal (%) k A z i (min−1) Ref.
Heterogeneous FentonMnFe2O4124092.60.01[5]
Photo-FentonFeSO4130830.06[37]
UV/H2O2-260760.02[38]
Photocatalysis UVCGO@Fe3O4/ZnO/SnO230120900.02[39]
Visible photocatalysis2D g-C3N4-NaBiO3253057.30.03[1]
H2O2 catalytic activationMn-BTCarg/Al204099.30.12This study
Disclaimer/Publisher’s Note: The statements, opinions and data contained in all publications are solely those of the individual author(s) and contributor(s) and not of MDPI and/or the editor(s). MDPI and/or the editor(s) disclaim responsibility for any injury to people or property resulting from any ideas, methods, instructions or products referred to in the content.

