
The Chemically-Modified Tetracycline COL-3 and Its Parent Compound Doxycycline Prevent Microglial Inflammatory Responses by Reducing Glucose-Mediated Oxidative Stress

 ,
, 
Abstract
:1. Introduction
2. Materials and Methods
2.1. Drugs and Cell Culture Reagents
2.2. Microglial Cell Cultures
Ethics Statement
2.3. Polyethyleneimine Coating
2.4. Isolation of Microglial Cells and Production of Microglial Subcultures
2.5. Purification and Aggregation of Recombinant αS
2.6. Transmission Electron Microscopy (TEM)
2.7. Stimulation Protocols with Inflammogens and Drug Treatments
2.8. Immunofluorescence Detection of Microglial Cell Markers
2.9. TNF-α Assay
2.10. Measurement of Intracellular NADPH
2.11. Quantification of Intracellular ROS Levels
2.12. Assessment of [3H]-2-DG Uptake
2.13. Statistical Analysis
3. Results
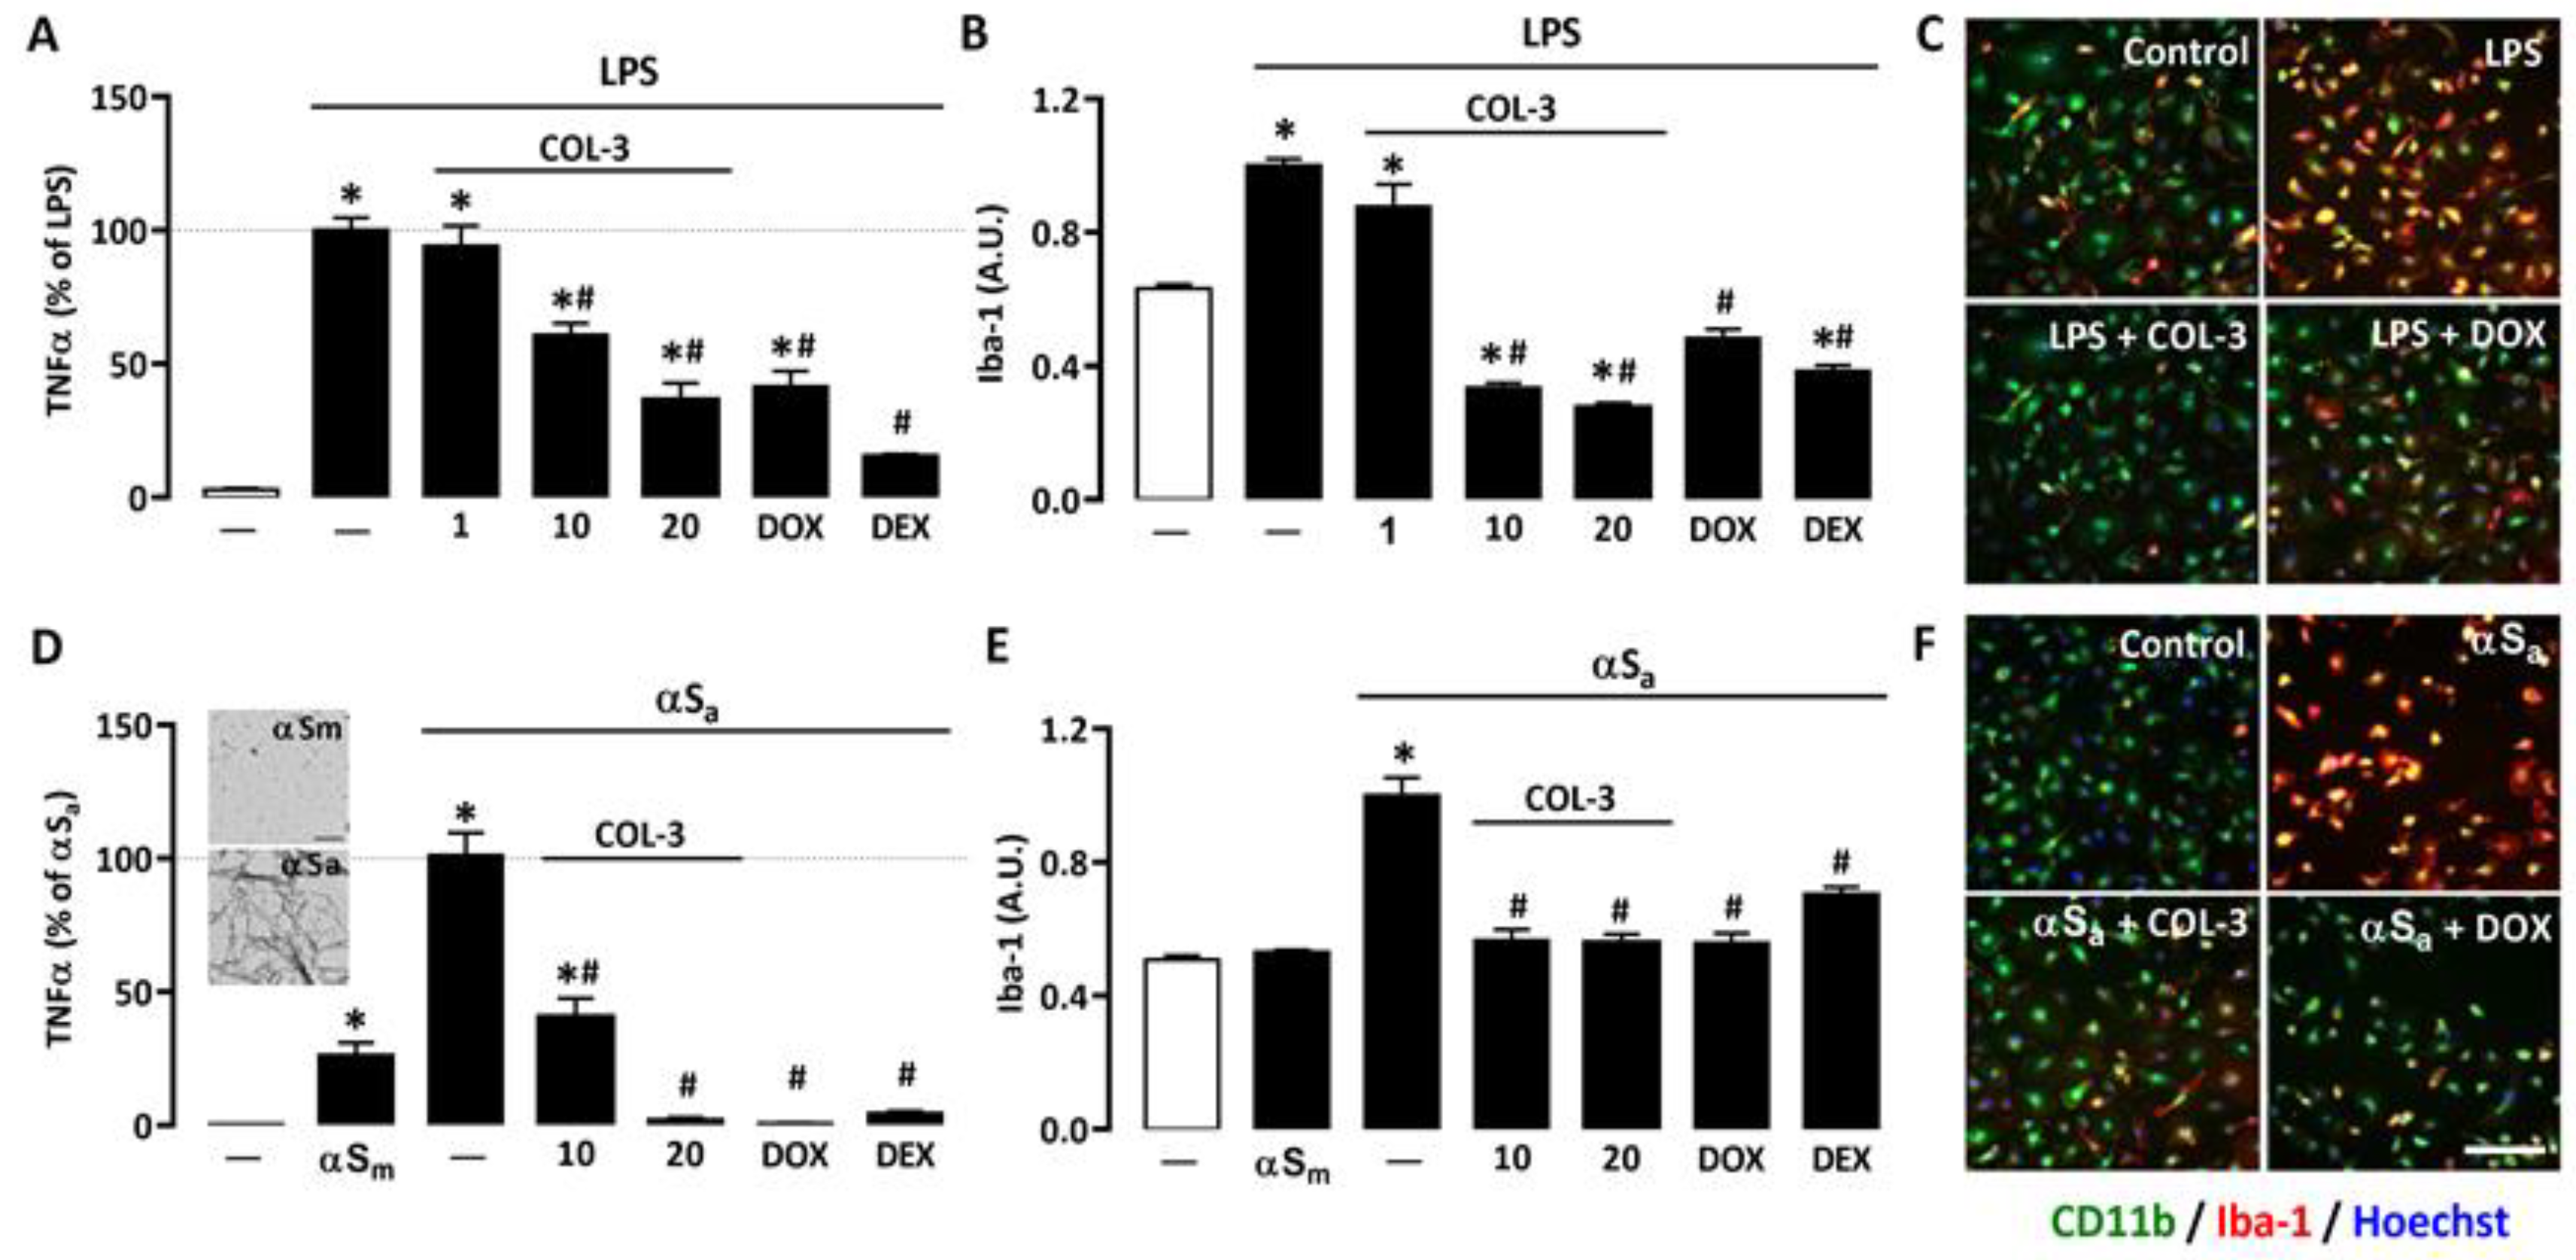
3.1. COL-3 Reduces the Inflammatory Response of Microglial Cells Exposed to LPS or αSa
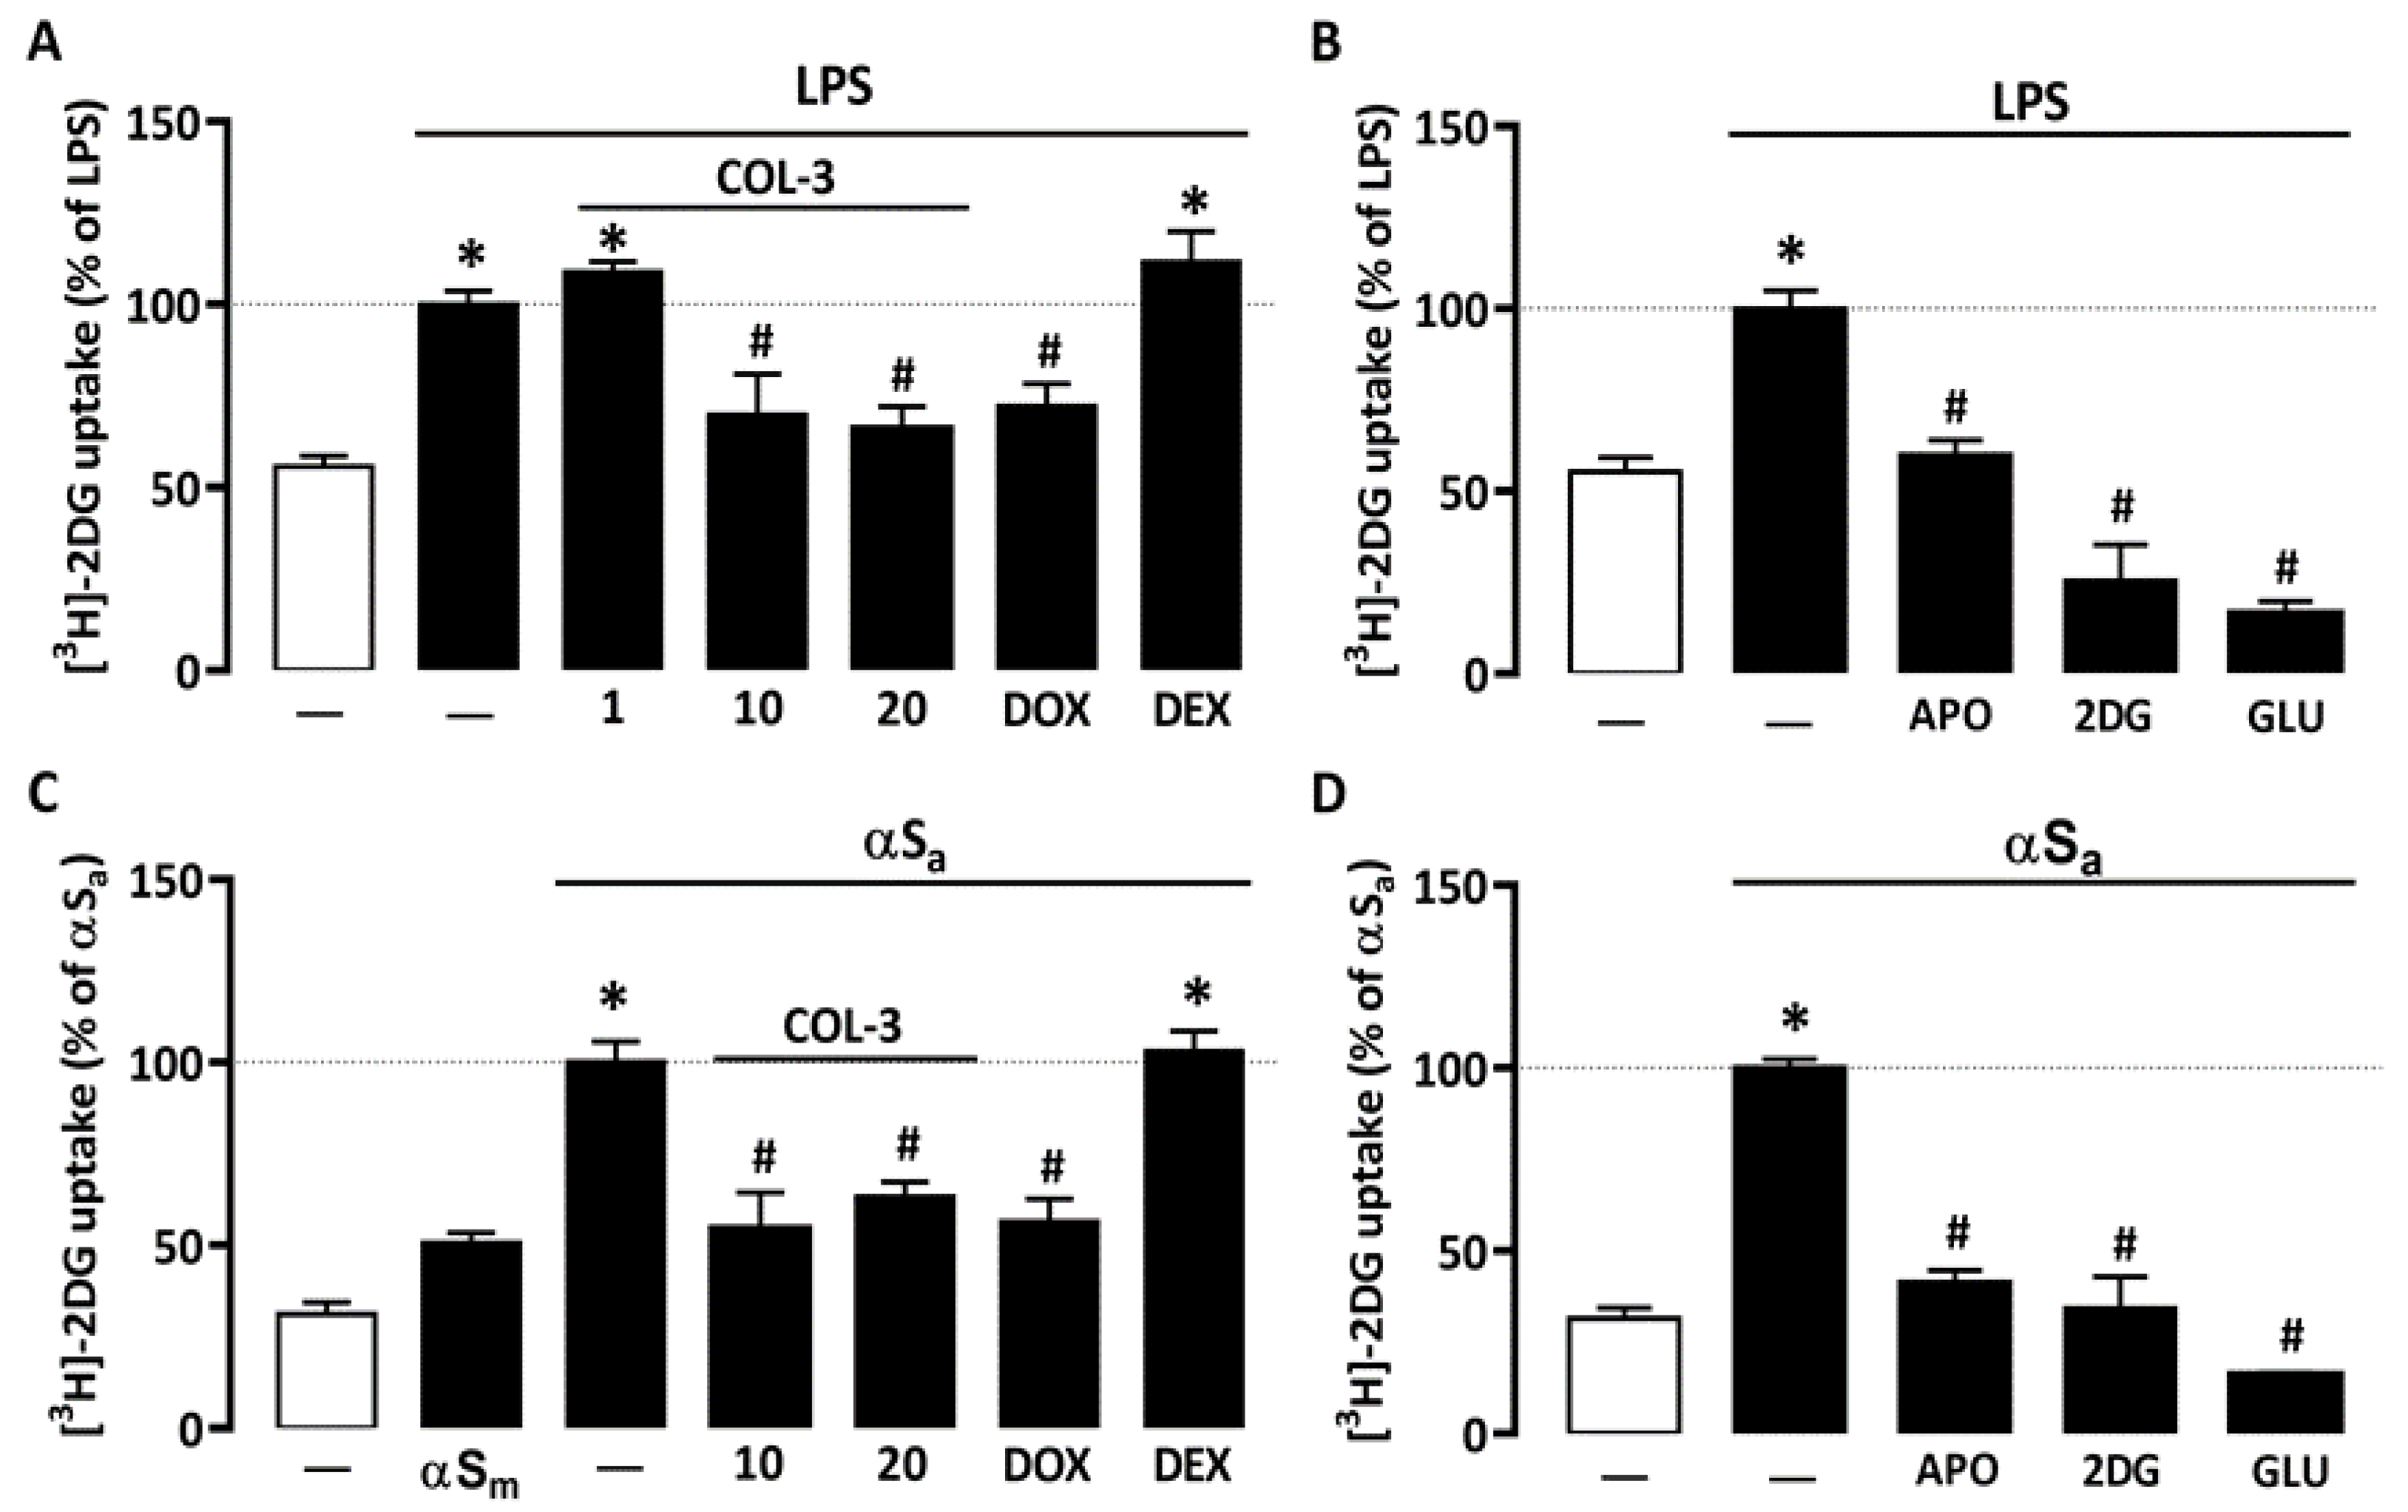
3.2. COL-3 Reduces Glucose Accumulation in Microglial Cells Exposed to LPS or αSa
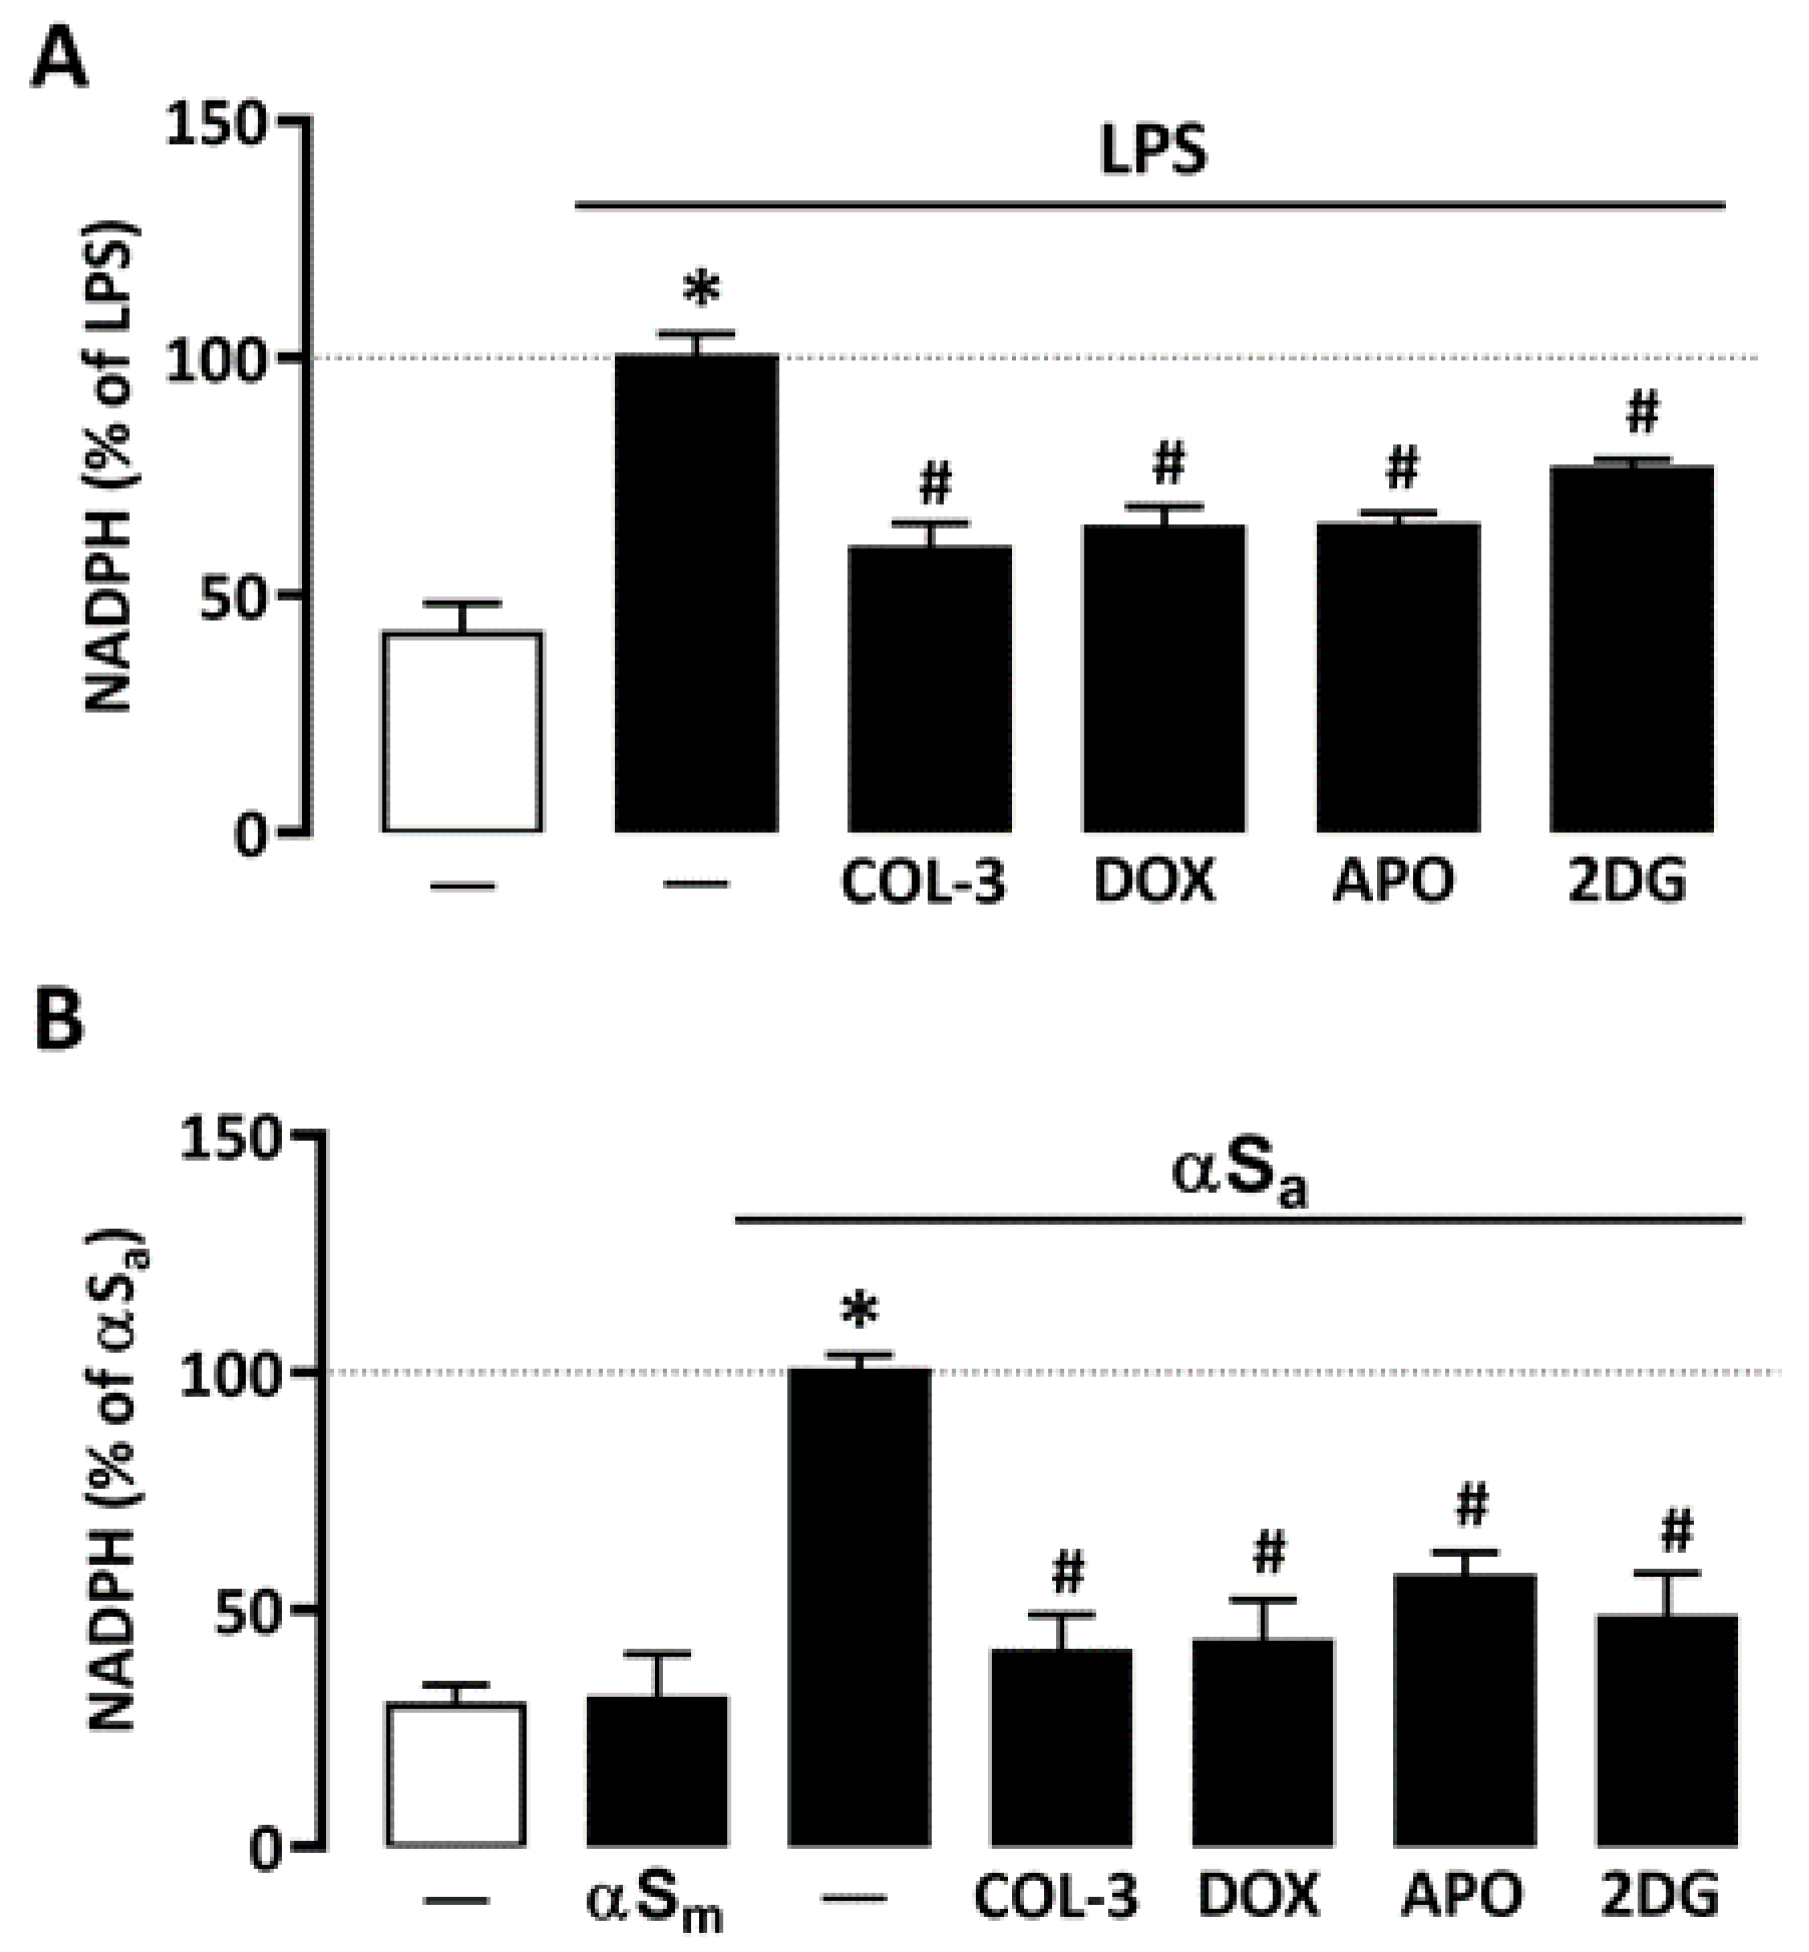
3.3. COL-3 Prevents the Rise of NADPH in Microglial Cells Exposed to LPS or αSa
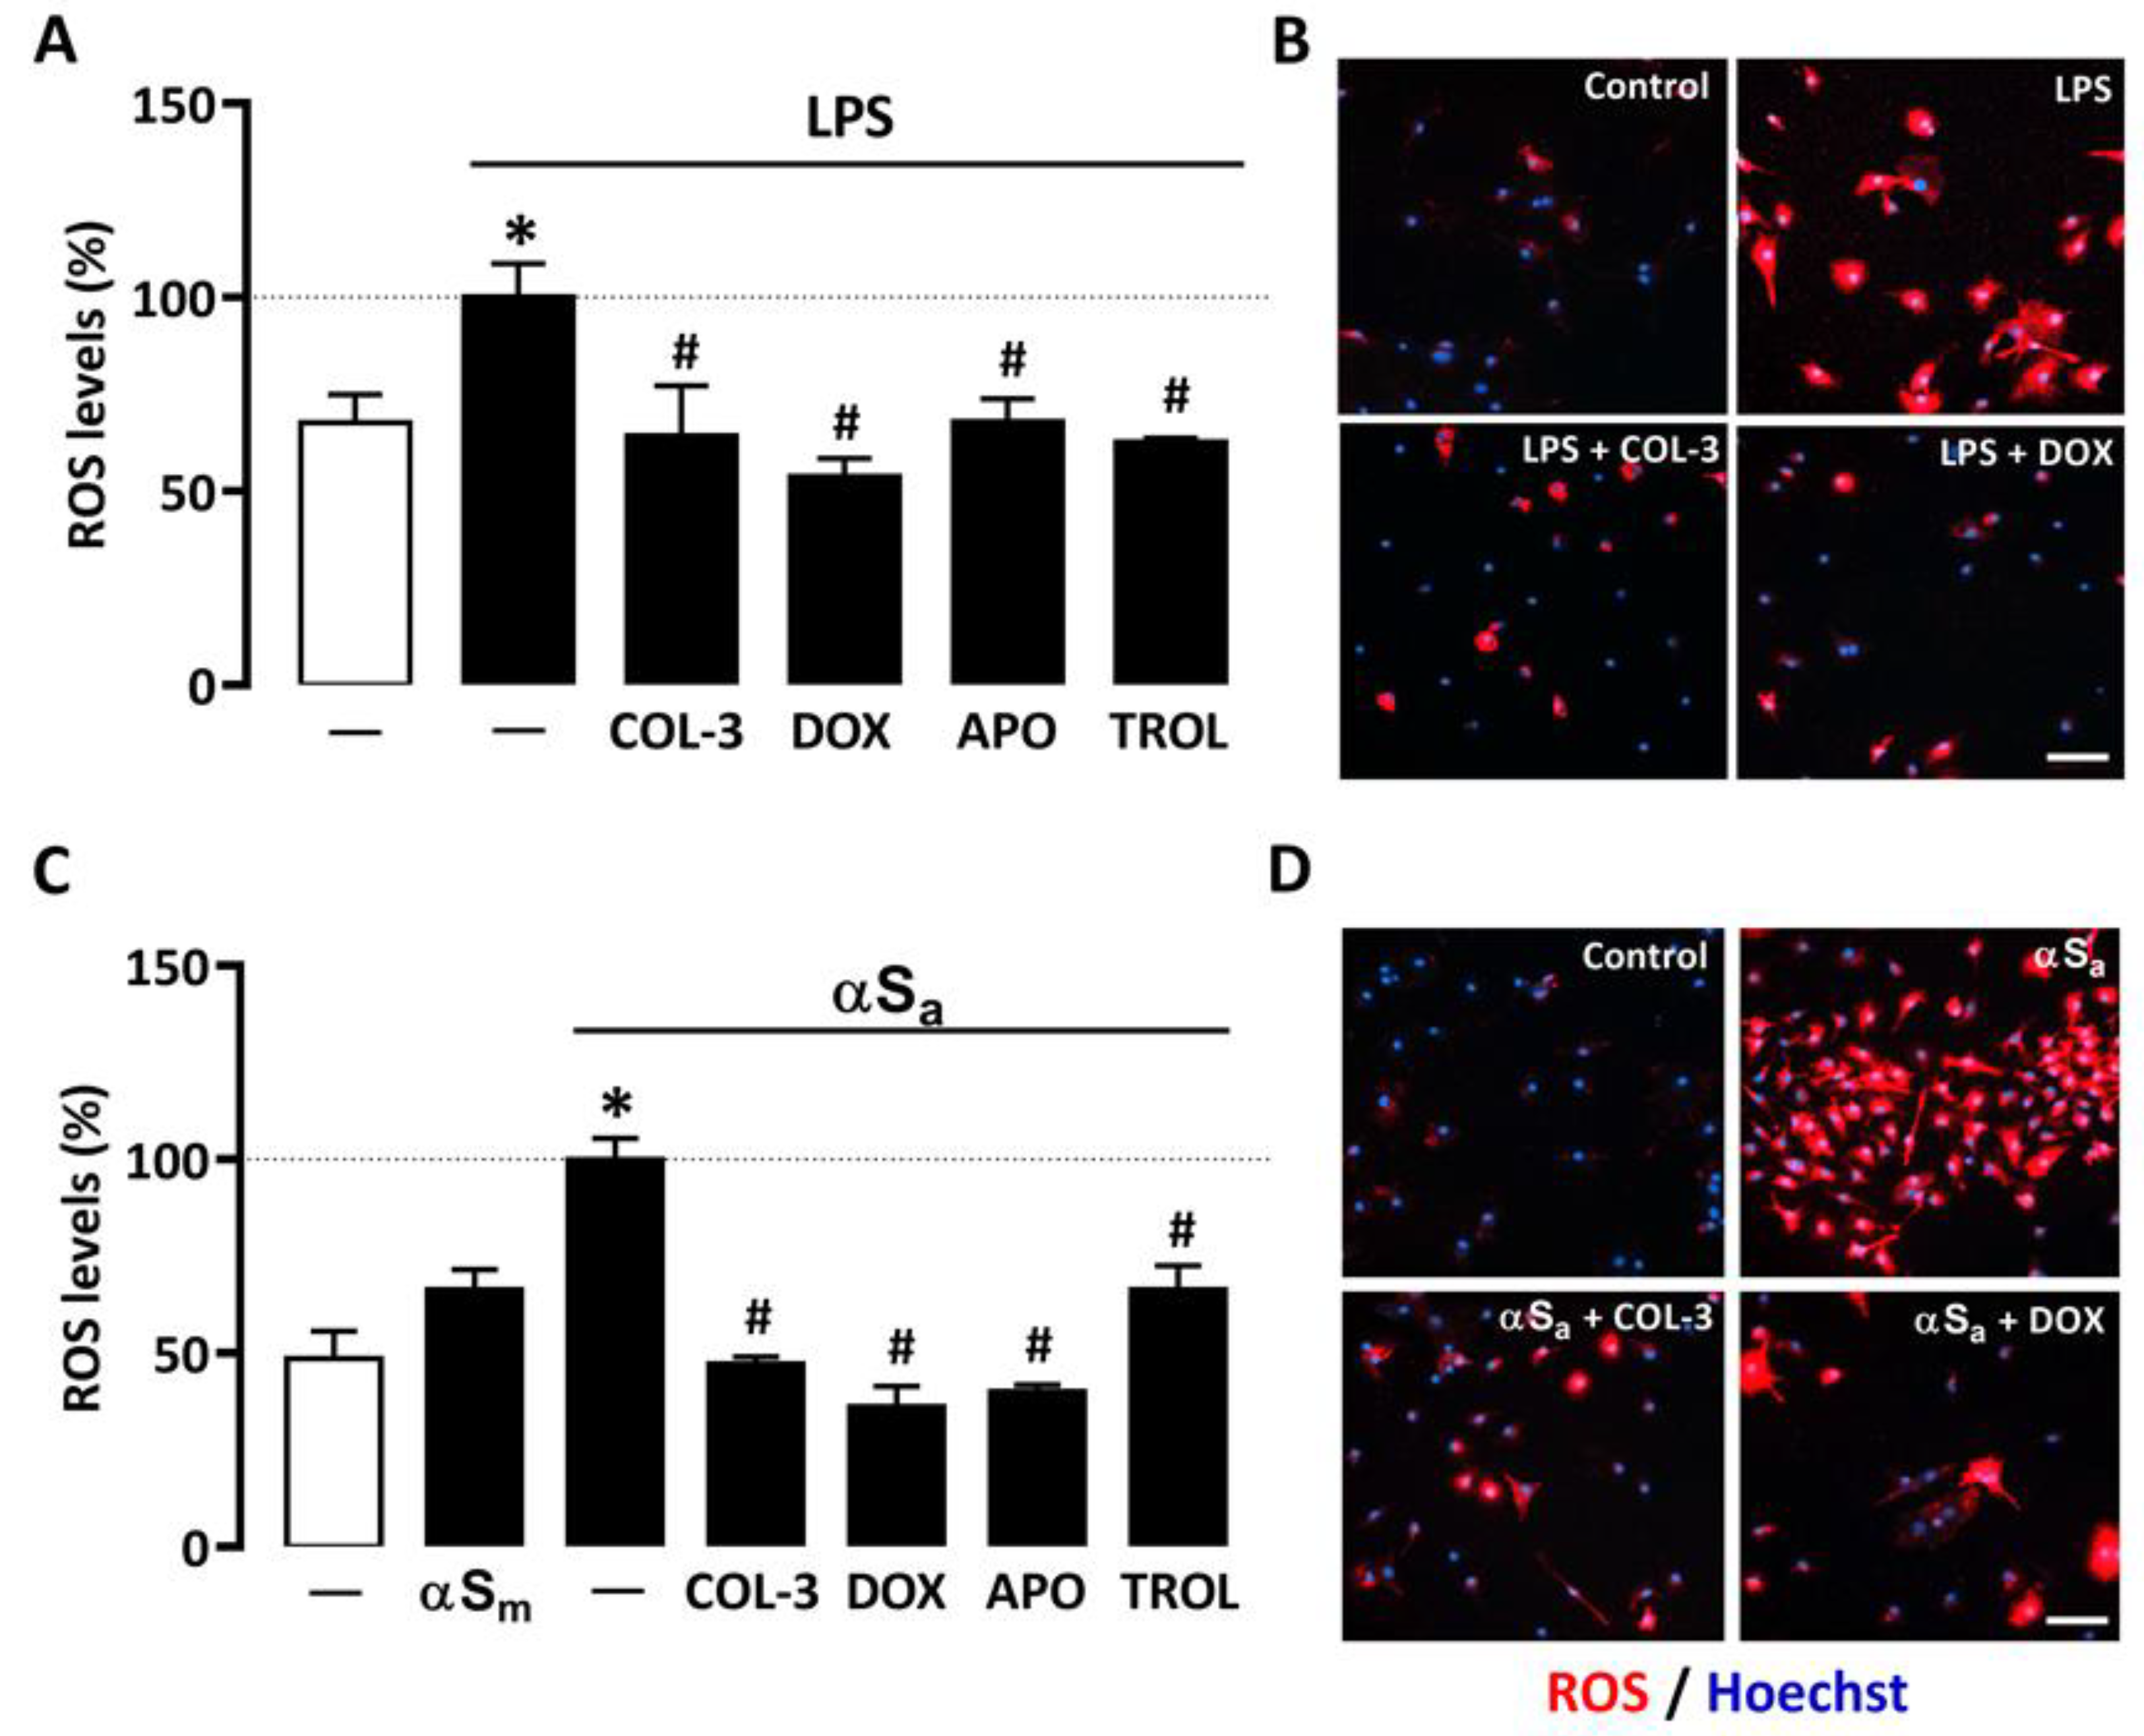
3.4. COL-3 Prevents Microglial Oxidative Stress Elicited by Inflammatory Signals
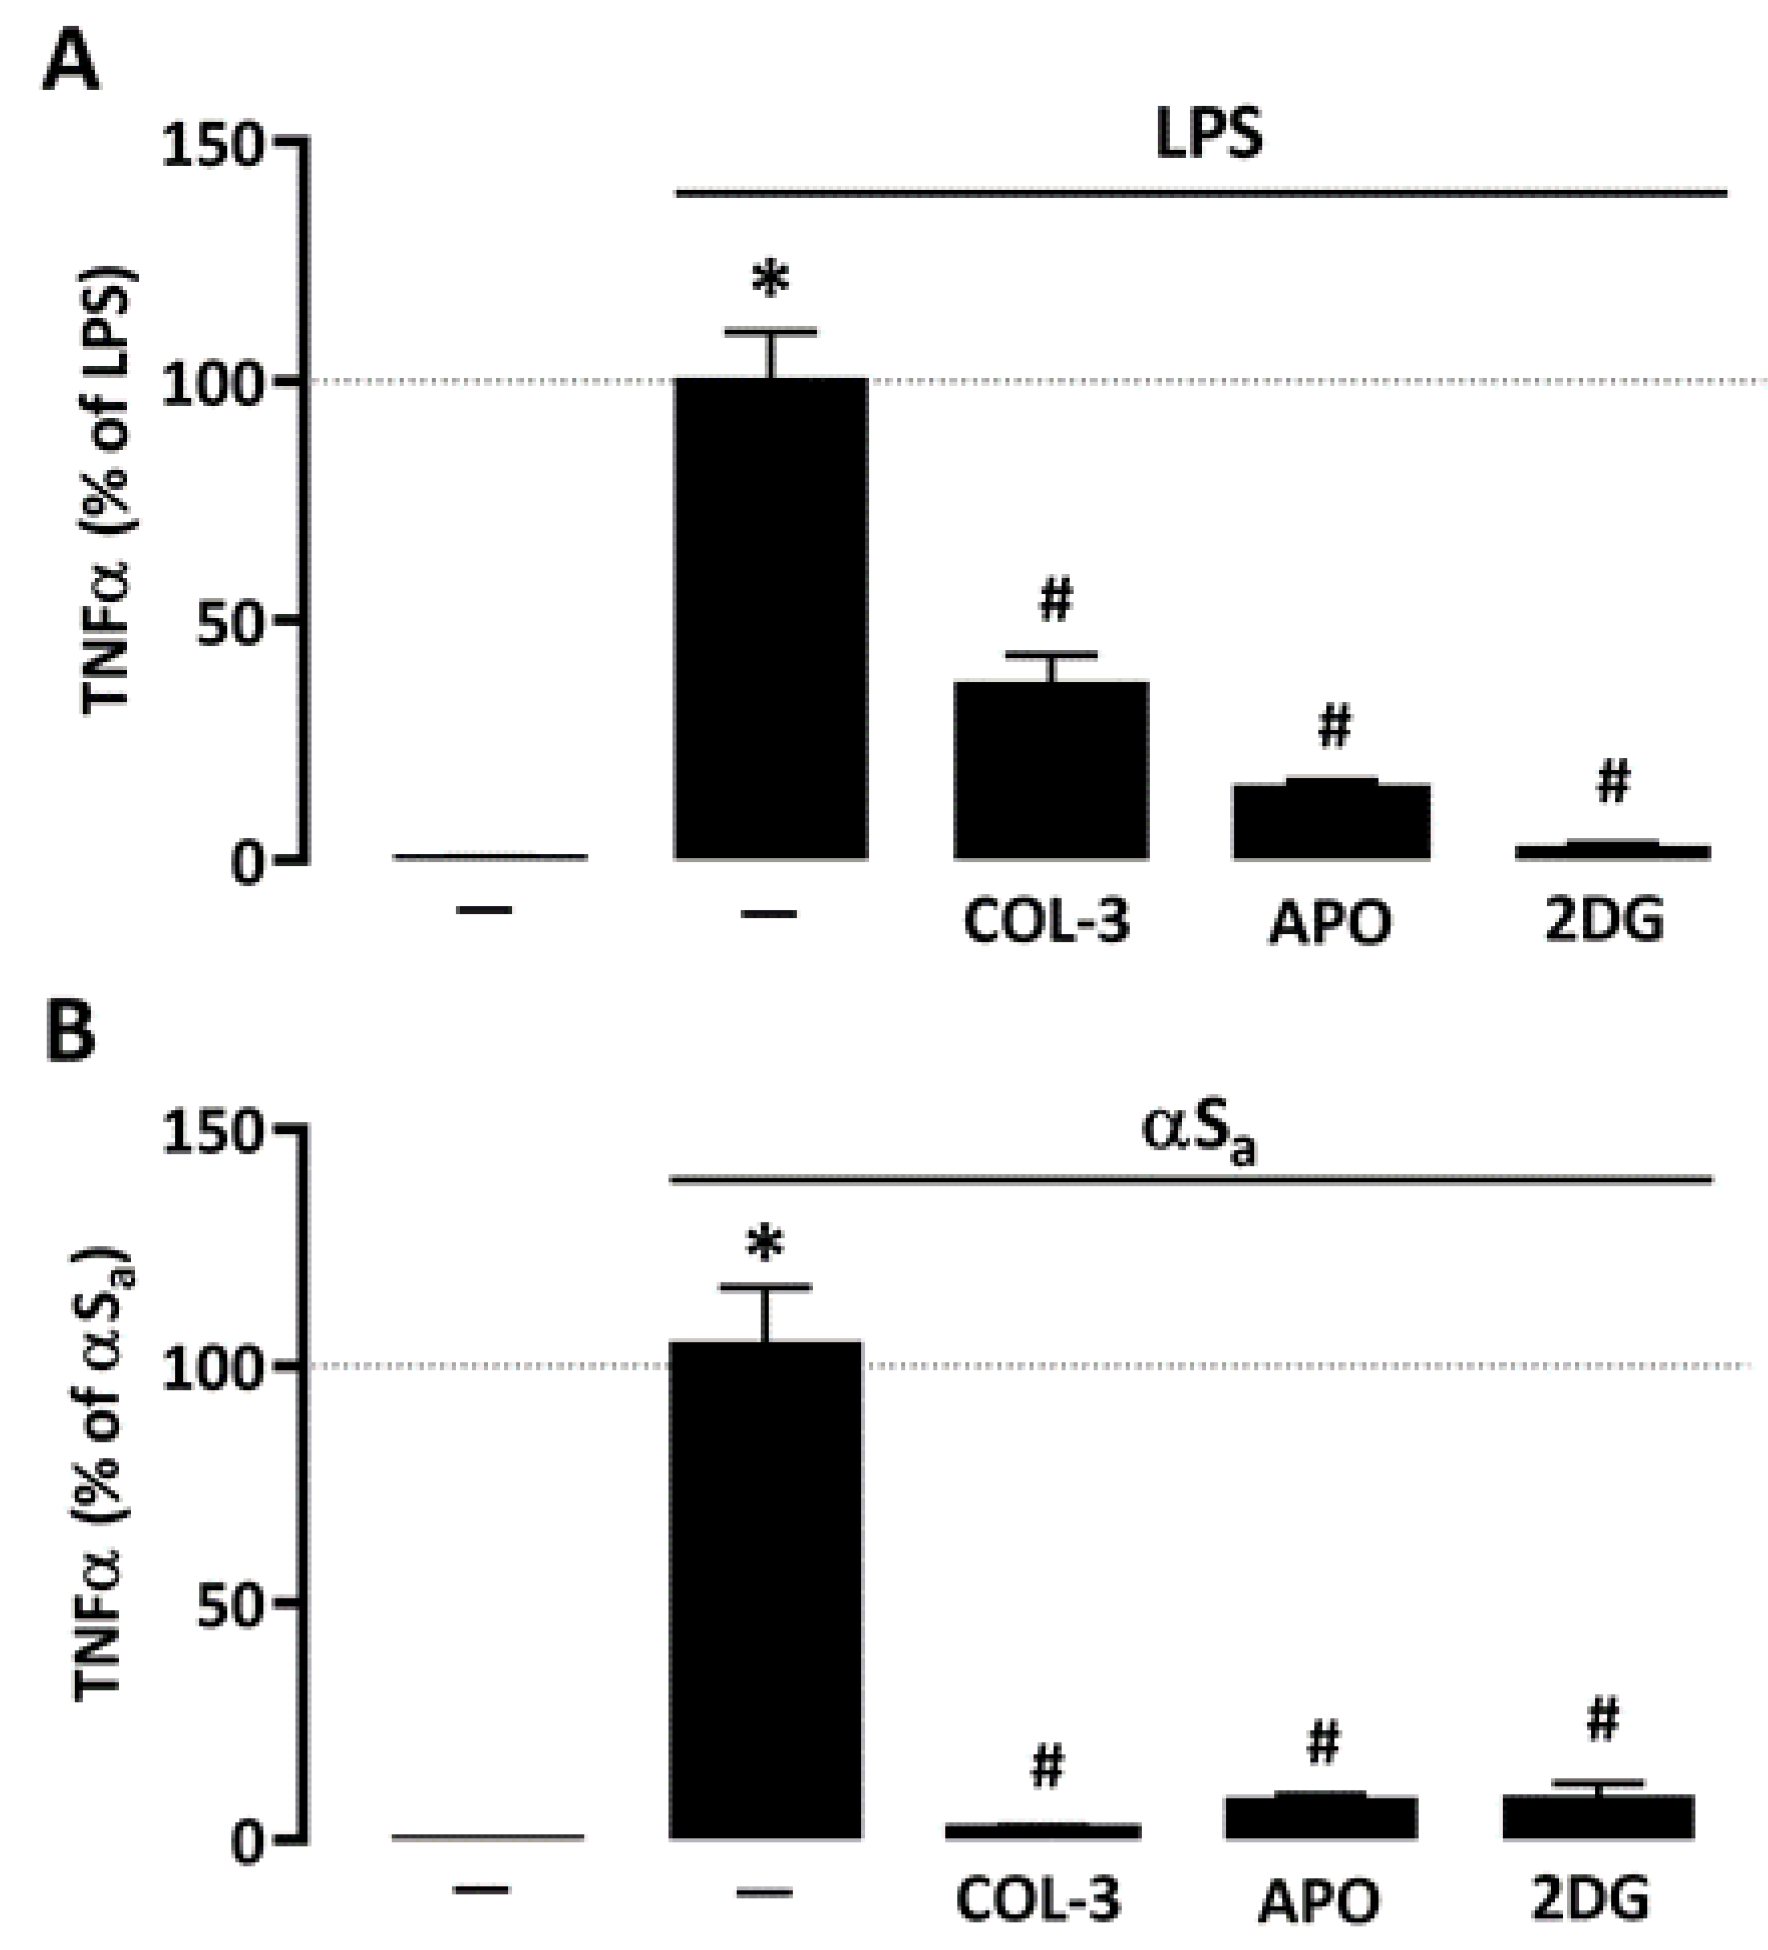
3.5. The Suppressive Effect of COL-3 on TNF-α Release Is Reproduced by Interfering with Glucose Metabolism or NADPH Oxidase Activation
4. Discussion
4.1. COL-3 Performs as a Potent Anti-Inflammatory Drug in LPS- and αSa-Treated Microglial Cells
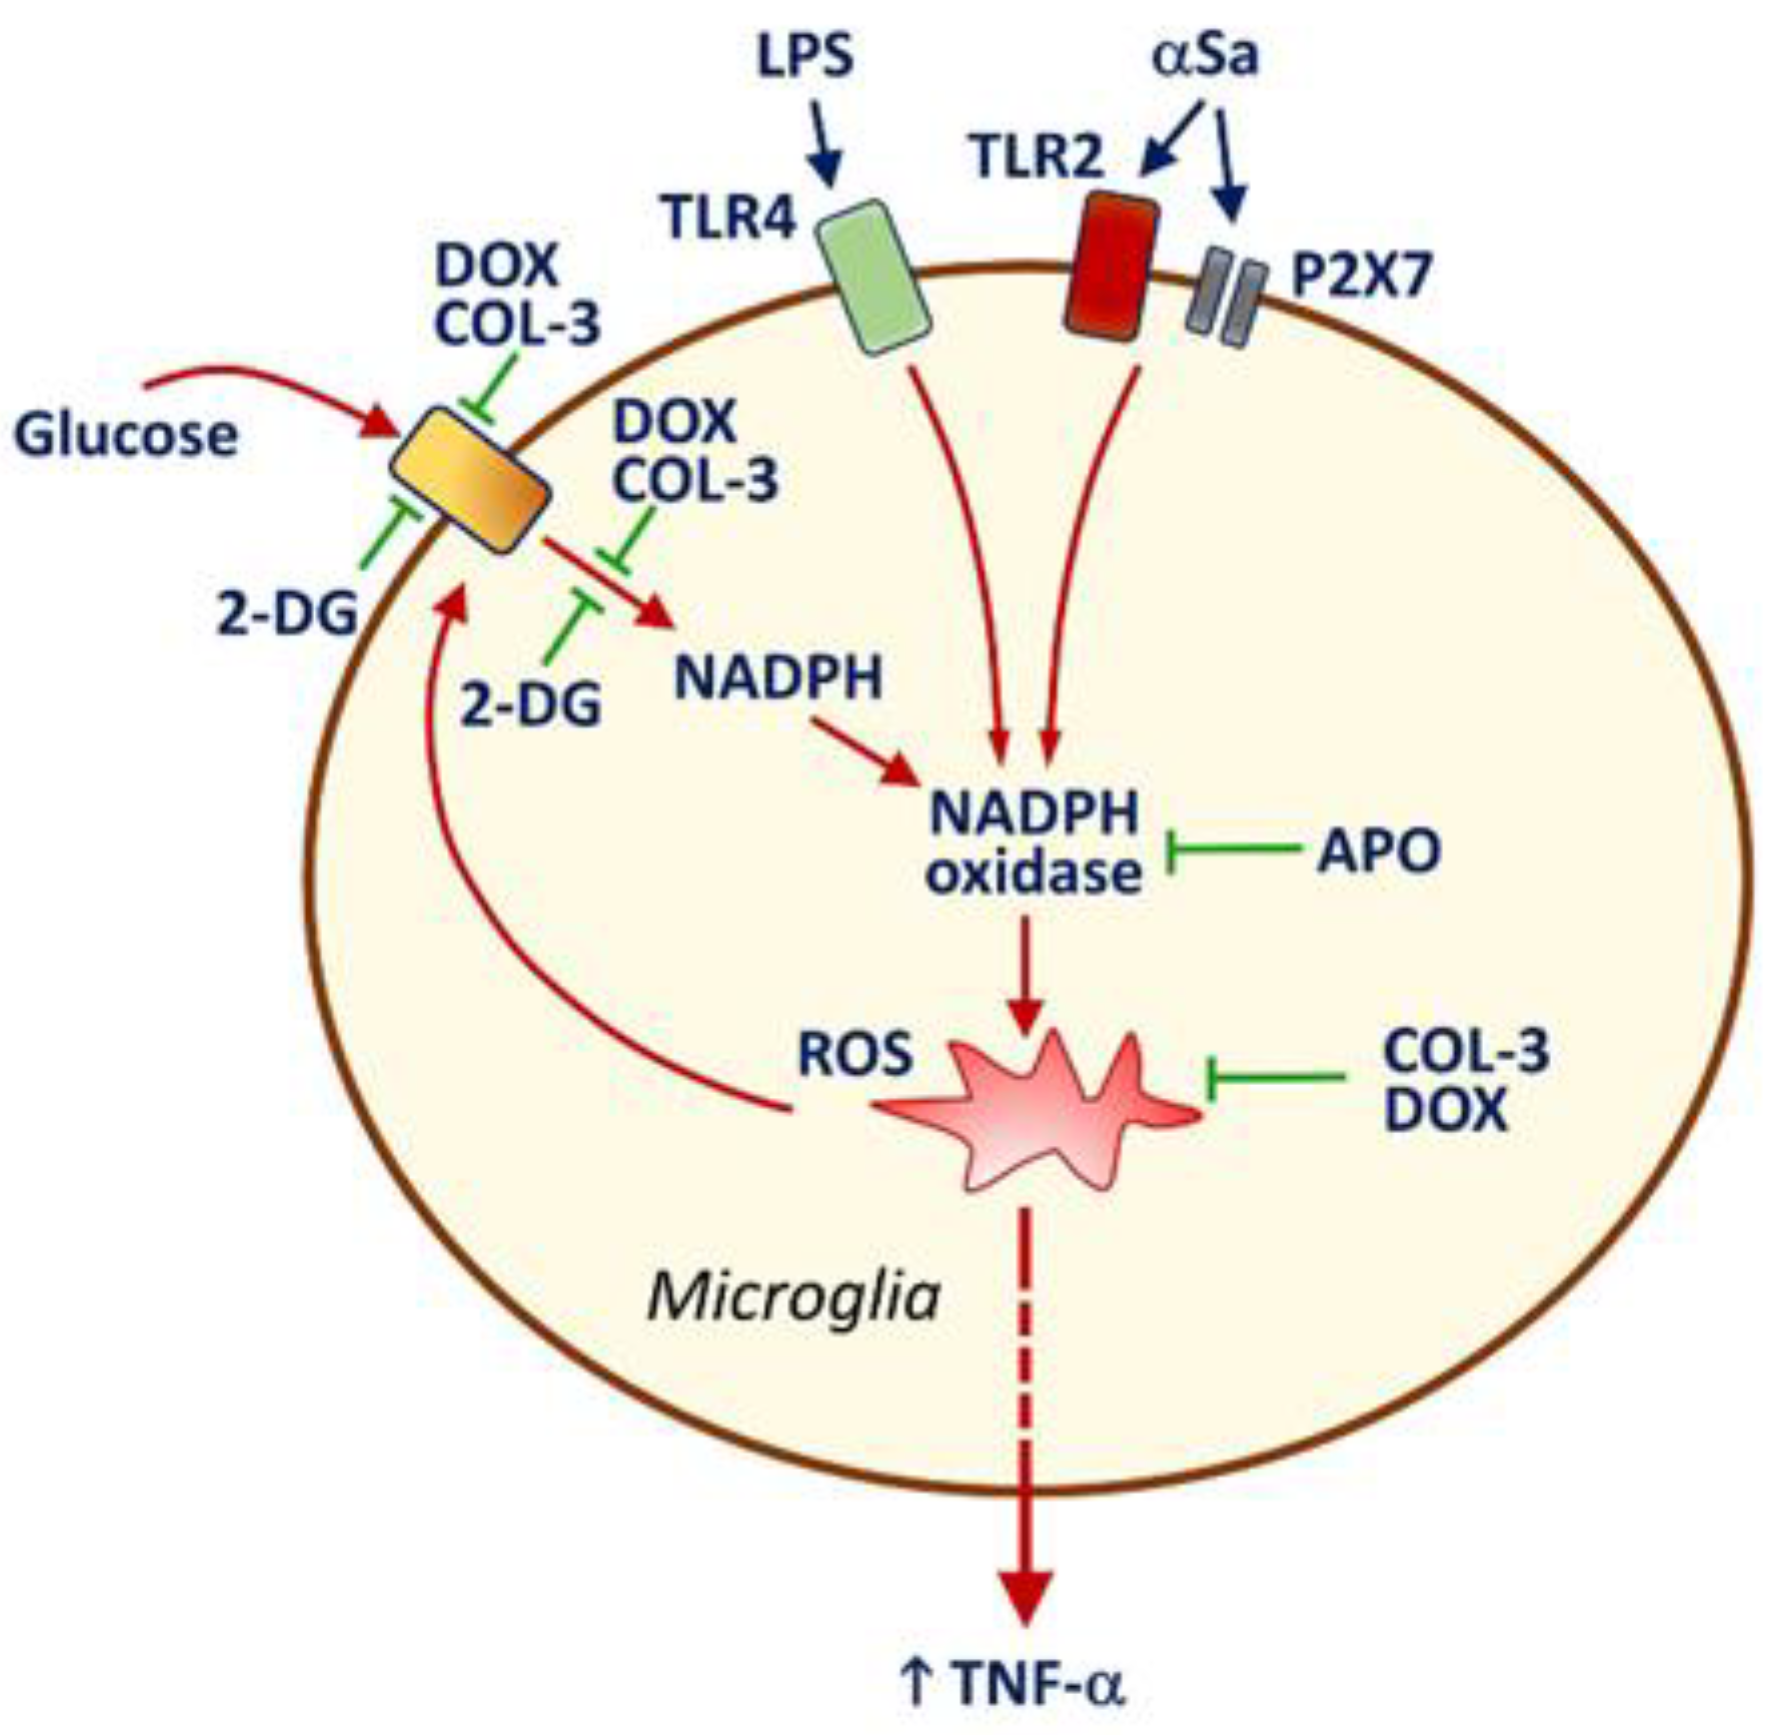
4.2. Anti-Inflammatory Properties of COL-3 Derive from Its Ability to Inhibit Glucose Uptake
4.3. COL-3 Prevents Glucose-Dependent NADPH Production
4.4. COL-3 Operates by Preventing Glucose-Dependent ROS Production
Author Contributions
Funding
Institutional Review Board Statement
Informed Consent Statement
Data Availability Statement
Acknowledgments
Conflicts of Interest
Abbreviations
| αS | α-synuclein |
| αSa | αS aggregates |
| αSm | αS monomers |
| APO | Apocynin |
| CMT-3 | Chemically modified tetracycline |
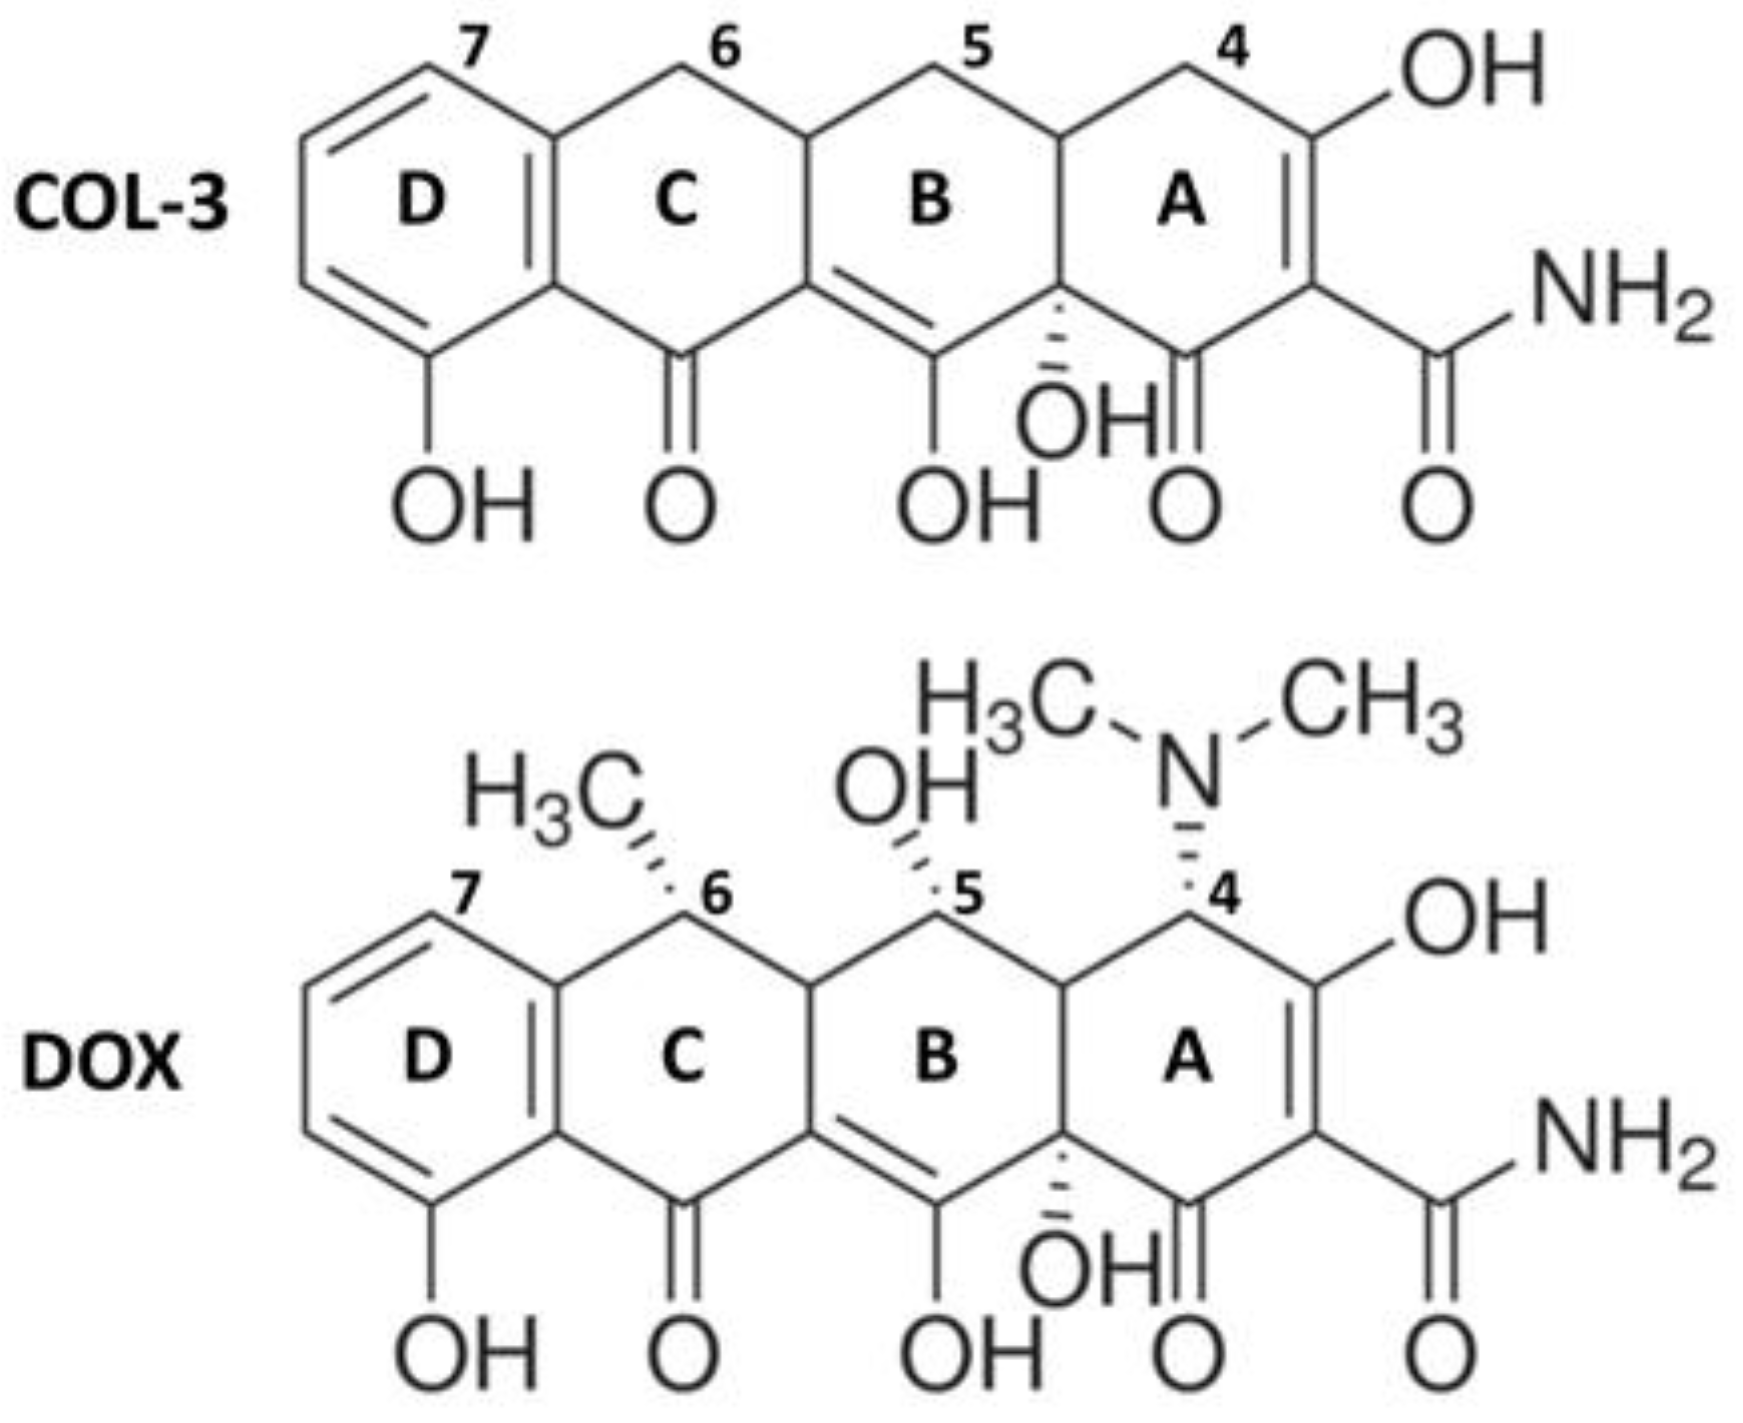
| COL-3 | 4-dedimethylaminosancycline or incyclinide |
| 2-DG | 2-deoxy-D-glucose |
| DMEM | Dulbecco’s modified Eagle’s medium |
| DOX | Doxycycline |
| FCS | Fetal calf serum |
| Iba-1 | ionized calcium-binding adaptor molecule-1 |
| LPS | Lipopolysaccharide |
| PD | Parkinson’s disease |
| PEI | Polyethyleneimine |
| ROS | Reactive oxygen species |
| TLR | Toll-like receptor |
| TROL | Trolox |
References
- Pioletti, M.; Schluenzen, F.; Harms, J.; Zarivach, R.; Glühmann, M.; Avila, H.; Bashan, A.; Bartels, H.; Auerbach, T.; Jacobi, C.; et al. Crystal structures of complexes of the small ribosomal subunit with tetracycline, edeine and IF3. EMBO J. 2001, 20, 1829–1839. [Google Scholar] [CrossRef] [PubMed] [Green Version]
- Mortison, J.D.; Schenone, M.; Myers, J.A.; Zhang, Z.; Chen, L.; Ciarlo, C.; Comer, E.; Natchiar, S.K.; Carr, S.A.; Klaholz, B.P.; et al. Tetracyclines Modify Translation by Targeting Key Human rRNA Substructures. Cell Chem. Biol. 2018, 25, 1506–1518. [Google Scholar] [CrossRef] [PubMed] [Green Version]
- Sapadin, A.N.; Fleischmajer, R. Tetracyclines: Nonantibiotic properties and their clinical implications. J. Am. Acad. Dermatol. 2006, 54, 258–265. [Google Scholar] [CrossRef] [PubMed]
- Bortolanza, M.; Nascimento, G.C.; Socias, S.B.; Ploper, D.; Chehín, R.N.; Raisman-Vozari, R.; Del-Bel, E. Tetracycline repurposing in neurodegeneration: Focus on Parkinson’s disease. J. Neural. Transm. 2018, 125, 1403–1415. [Google Scholar] [CrossRef] [PubMed]
- Orsucci, D.; Calsolaro, V.; Mancuso, M.; Siciliano, G. Neuroprotective effects of tetracyclines: Molecular targets, animal models and human disease. CNS Neurol. Disord. Drug Targets 2009, 8, 222–231. [Google Scholar] [CrossRef] [PubMed]
- Sánchez, J.L.; Valentin, S.; Morales, A.; Rivera, A. Safety and efficacy of doxycycline in the treatment of rosacea. Clin. Cosmet. Investig. Dermatol. 2009, 2, 129–140. [Google Scholar] [CrossRef] [Green Version]
- Zhong, W.; Chen, S.; Zhang, Q.; Xiao, T.; Qin, Y.; Gu, J.; Sun, B.; Liu, Y.; Jing, X.; Hu, X.; et al. Doxycycline directly targets PAR1 to suppress tumor progression. Oncotarget 2017, 8, 16829–16842. [Google Scholar] [CrossRef] [Green Version]
- Santa-Cecília, F.V.; Socias, B.; Ouidja, M.O.; Sepulveda-Diaz, J.E.; Acuña, L.; Silva, R.; Michel, P.P.; Del Bel, E.; Cunha, T.; Raisman-Vozari, R. Doxycycline Suppresses Microglial Activation by Inhibiting the p38 MAPK and NF-kB Signaling Pathways. Neurotox. Res. 2016, 29, 447–459. [Google Scholar] [CrossRef] [PubMed]
- Cho, Y.; Son, H.J.; Kim, E.-M.; Choi, J.H.; Kim, S.T.; Ji, I.J.; Choi, D.H.; Joh, T.H.; Kim, Y.S.; Hwang, O. Doxycycline is Neuroprotective Against Nigral Dopaminergic Degeneration by a Dual Mechanism Involving MMP-3. Neurotox. Res. 2009, 16, 361–371. [Google Scholar] [CrossRef]
- Lazzarini, M.; Martin, S.; Mitkovski, M.; Vozari, R.R.; Stühmer, W.; Del Bel, E. Doxycycline restrains glia and confers neuroprotection in a 6-OHDA Parkinson model. Glia 2013, 61, 1084–1100. [Google Scholar] [CrossRef]
- Bortolanza, M.; Nascimento, G.C.D.; Raisman-Vozari, R.; Del-Bel, E. Doxycycline and its derivative, COL-3, decrease dyskinesia induced by l -DOPA in hemiparkinsonian rats. Br. J. Pharmacol. 2021, 178, 2595–2616. [Google Scholar] [CrossRef]
- González-Lizárraga, F.; Ploper, D.; Ávila, C.L.; Socías, S.B.; Dos-Santos-Pereira, M.; Machín, B.; Del-Bel, E.; Michel, P.P.; Pietrasanta, L.I.; Raisman-Vozari, R.; et al. CMT-3 targets different α-synuclein aggregates mitigating their toxic and inflammogenic effects. Sci. Rep. 2020, 10, 20258. [Google Scholar] [CrossRef]
- González-Lizárraga, F.; Socías, S.B.; Avila, C.L.; Torres-Bugeau, C.M.; Barbosa, L.R.S.; Binolfi, A.; Sepulveda-Diaz, J.E.; Del-Bel, E.; Fernandez, C.O.; Papy-Garcia, D.; et al. Repurposing doxycycline for synucleinopathies: Remodelling of α-synuclein oligomers towards non-toxic parallel beta-sheet structured species. Sci. Rep. 2017, 7, 41755. [Google Scholar] [CrossRef] [Green Version]
- Medina, L.; González-Lizárraga, F.; Dominguez-Meijide, A.; Ploper, D.; Parrales, V.; Sequeira, S.; Cima-Omori, M.-S.; Zweckstetter, M.; Del Bel, E.; Michel, P.P.; et al. Doxycycline Interferes With Tau Aggregation and Reduces Its Neuronal Toxicity. Front. Aging Neurosci. 2021, 13, 635760. [Google Scholar] [CrossRef] [PubMed]
- Golub, L.M.; Lee, H.-M.; Ryan, M.E.; Giannobile, W.V.; Payne, J.; Sorsa, T. Tetracyclines Inhibit Connective Tissue Breakdown by Multiple Non-Antimicrobial Mechanisms. Adv. Dent. Res. 1998, 12, 12–26. [Google Scholar] [CrossRef]
- Golub, L.M.; Ramamurthy, N.S.; Llavaneras, A.; Ryan, M.E.; Lee, H.M.; Liu, Y.; Bain, S.; Sorsa, T. A chemically modified nonantimicrobial tetracycline (CMT-8) inhibits gingival matrix metalloproteinases, periodontal breakdown, and extra-oral bone loss in ovariectomized rats. Ann. N. Y. Acad. Sci. 1999, 878, 290–310. [Google Scholar] [CrossRef] [PubMed]
- Syed, S.; Takimoto, C.; Hidalgo, M.; Rizzo, J.; Kuhn, J.G.; Hammond, L.A.; Schwartz, G.; Tolcher, A.; Patnaik, A.; Eckhardt, S.G.; et al. A Phase I and Pharmacokinetic Study of Col-3 (Metastat), an Oral Tetracycline Derivative with Potent Matrix Metalloproteinase and Antitumor Properties. Clin. Cancer Res. 2004, 10, 6512–6521. [Google Scholar] [CrossRef] [PubMed] [Green Version]
- Rudek, M.A.; Figg, W.D.; Dyer, V.; Dahut, W.; Turner, M.L.; Steinberg, S.M.; Liewehr, D.J.; Kohler, D.R.; Pluda, J.M.; Reed, E. Phase I Clinical Trial of Oral COL-3, a Matrix Metalloproteinase Inhibitor, in Patients with Refractory Metastatic Cancer. J. Clin. Oncol. 2001, 19, 584–592. [Google Scholar] [CrossRef]
- Chu, Q.S.C.; Forouzesh, B.; Syed, S.; Mita, M.; Schwartz, G.; Copper, J.; Curtright, J.; Rowinsky, E.K. A phase II and pharmacological study of the matrix metalloproteinase inhibitor (MMPI) COL-3 in patients with advanced soft tissue sarcomas. Investig. New Drugs 2007, 25, 359–367. [Google Scholar] [CrossRef]
- Dezube, B.J.; Krown, S.E.; Lee, J.Y.; Bauer, K.S.; Aboulafia, D.M. Randomized Phase II Trial of Matrix Metalloproteinase Inhibitor COL-3 in AIDS-Related Kaposi’s Sarcoma: An AIDS Malignancy Consortium Study. J. Clin. Oncol. 2006, 24, 1389–1394. [Google Scholar] [CrossRef]
- Zhang, H.; Chang, M.; Hansen, C.N.; Basso, D.M.; Noble-Haeusslein, L.J. Role of Matrix Metalloproteinases and Therapeutic Benefits of Their Inhibition in Spinal Cord Injury. Neurotherapeutics 2011, 8, 206–220. [Google Scholar] [CrossRef] [PubMed] [Green Version]
- Edan, R.A.; Luqmani, Y.A.; Masocha, W. COL-3, a Chemically Modified Tetracycline, Inhibits Lipopolysaccharide-Induced Microglia Activation and Cytokine Expression in the Brain. PLoS ONE 2013, 8, e57827. [Google Scholar] [CrossRef] [Green Version]
- Zhang, W.; Wang, T.; Pei, Z.; Miller, D.S.; Wu, X.; Block, M.L.; Wilson, B.; Zhang, W.; Zhou, Y.; Hong, J.-S.; et al. Aggregated α-synuclein activates microglia: A process leading to disease progression in Parkinson’s disease. FASEB J. 2005, 19, 533–542. [Google Scholar] [CrossRef] [PubMed]
- Dos-Santos-Pereira, M.; Acuña, L.; Hamadat, S.; Rocca, J.; González-Lizárraga, F.; Chehin, R.; Sepulveda-Diaz, J.E.; Del-Bel, E.; Raisman-Vozari, R.; Michel, P.P. Microglial glutamate release evoked by α-synuclein aggregates is prevented by dopamine. Glia 2018, 66, 2353–2365. [Google Scholar] [CrossRef]
- Deng, I.; Wiese, M.D.; Zhou, X.-F.; Bobrovskaya, L. The efficacy of systemic administration of lipopolysaccharide in modelling pre-motor Parkinson’s disease in C57BL/6 mice. NeuroToxicology 2021, 85, 254–264. [Google Scholar] [CrossRef]
- Sepulveda-Diaz, J.E.; Ouidja, M.O.; Socias, S.B.; Hamadat, S.; Guerreiro, S.; Raisman-Vozari, R.; Michel, P.P. A simplified approach for efficient isolation of functional microglial cells: Application for modeling neuroinflammatory responsesin vitro. Glia 2016, 64, 1912–1924. [Google Scholar] [CrossRef]
- Rousseau, E.; Michel, P.P.; Hirsch, E. The Iron-Binding Protein Lactoferrin Protects Vulnerable Dopamine Neurons from Degeneration by Preserving Mitochondrial Calcium Homeostasis. Mol. Pharmacol. 2013, 84, 888–898. [Google Scholar] [CrossRef] [PubMed] [Green Version]
- Pereira, M.D.S.; Abreu, G.H.D.; Rocca, J.; Hamadat, S.; Raisman-Vozari, R.; Michel, P.P.; Del Bel, E. Contributive Role of TNF-α to L-DOPA-Induced Dyskinesia in a Unilateral 6-OHDA Lesion Model of Parkinson’s Disease. Front. Pharmacol. 2021, 11, 617085. [Google Scholar] [CrossRef]
- Hoyer, W.; Antony, T.; Cherny, D.; Heim, G.; Jovin, T.M.; Subramaniam, V. Dependence of alpha-synuclein ag-gregate morphology on solution conditions. J. Mol. Biol. 2002, 322, 383–393. [Google Scholar] [CrossRef] [Green Version]
- Acuña, L.; Hamadat, S.; Corbalán, N.S.; González-Lizárraga, F.; Dos-Santos-Pereira, M.; Rocca, J.; Díaz, J.S.; Del-Bel, E.; Papy-García, D.; Chehín, R.N.; et al. Rifampicin and Its Derivative Rifampicin Quinone Reduce Microglial Inflammatory Responses and Neurodegeneration Induced In Vitro by α-Synuclein Fibrillary Aggregates. Cells 2019, 8, 776. [Google Scholar] [CrossRef] [PubMed] [Green Version]
- Dos-Santos-Pereira, M.; Guimarães, F.S.; Del-Bel, E.; Raisman-Vozari, R.; Michel, P.P. Cannabidiol prevents LPS-induced microglial inflammation by inhibiting ROS/NF-κB-dependent signaling and glucose consumption. Glia 2020, 68, 561–573. [Google Scholar] [CrossRef]
- Döring, C.; Regen, T.; Gertig, U.; Van Rossum, D.; Winkler, A.; Saiepour, N.; Brück, W.; Hanisch, U.-K.; Janova, H. A presumed antagonistic LPS identifies distinct functional organization of TLR4 in mouse microglia. Glia 2017, 65, 1176–1185. [Google Scholar] [CrossRef]
- Qin, L.; Li, G.; Qian, X.; Liu, Y.; Wu, X.; Liu, B.; Hong, J.-S.; Block, M.L. Interactive role of the toll-like receptor 4 and reactive oxygen species in LPS-induced microglia activation. Glia 2005, 52, 78–84. [Google Scholar] [CrossRef]
- Ghosh, S.; Castillo, E.; Frias, E.S.; Swanson, R.A. Bioenergetic regulation of microglia. Glia 2018, 66, 1200–1212. [Google Scholar] [CrossRef]
- Hsieh, C.-F.; Liu, C.-K.; Lee, C.-T.; Yu, L.-E.; Wang, J.-Y. Acute glucose fluctuation impacts microglial activity, leading to inflammatory activation or self-degradation. Sci. Rep. 2019, 9, 1–16. [Google Scholar] [CrossRef] [PubMed] [Green Version]
- Parvathy, S.S.; Masocha, W. Matrix Metalloproteinase Inhibitor COL-3 Prevents the Development of Paclitaxel-Induced Hyperalgesia in Mice. Med. Princ. Pract. 2013, 22, 35–41. [Google Scholar] [CrossRef]
- Meesawatsom, P.; Hathway, G.; Bennett, A.; Constantin-Teodosiu, D.; Chapman, V. Spinal neuronal excitability and neuroinflammation in a model of chemotherapeutic neuropathic pain: Targeting the resolution pathways. J. Neuroinflamm. 2020, 17, 1–17. [Google Scholar] [CrossRef] [PubMed]
- Cazalis, J.; Tanabe, S.-I.; Gagnon, G.; Sorsa, T.; Grenier, D. Tetracyclines and Chemically Modified Tetracycline-3 (CMT-3) Modulate Cytokine Secretion by Lipopolysaccharide-Stimulated Whole Blood. Inflammation 2009, 32, 130–137. [Google Scholar] [CrossRef]
- Fodelianaki, G.; Lansing, F.; Bhattarai, P.; Troullinaki, M.; Zeballos, M.A.; Charalampopoulos, I.; Gravanis, A.; Mirtschink, P.; Chavakis, T.; Alexaki, V.I. Nerve Growth Factor modulates LPS—induced microglial glycolysis and inflammatory responses. Exp. Cell Res. 2019, 377, 10–16. [Google Scholar] [CrossRef] [PubMed]
- Gong, H.; Liu, L.; Ni, C.-X.; Zhang, Y.; Su, W.-J.; Lian, Y.-J.; Peng, W.; Zhang, J.-P.; Jiang, C.-L. Dexamethasone rapidly inhibits glucose uptake via non-genomic mechanisms in contracting myotubes. Arch. Biochem. Biophys. 2016, 603, 102–109. [Google Scholar] [CrossRef] [PubMed]
- Patil, R.H.; Kumar, M.N.; Kumar, K.K.; Nagesh, R.; Kavya, K.; Babu, R.; Ramesh, G.T.; Sharma, S.C. Dexamethasone inhibits inflammatory response via down regulation of AP-1 transcription factor in human lung epithelial cells. Gene 2018, 645, 85–94. [Google Scholar] [CrossRef]
- Vander Heiden, M.G.; Cantley, L.C.; Thompson, C.B. Understanding the Warburg effect: The metabolic requirements of cell proliferation. Science 2009, 324, 1029–1033. [Google Scholar] [CrossRef] [Green Version]
- Bedard, K.; Krause, K.H. The NOX Family of ROS-Generating NADPH Oxidases: Physiology and Pathophysiology. Physiol. Rev. 2007, 87, 245–313. [Google Scholar] [CrossRef] [PubMed]
- Taetzsch, T.; Levesque, S.; McGraw, C.; Brookins, S.; Luqa, R.; Bonini, M.G.; Mason, R.P.; Oh, U.; Block, M.L. Redox regulation of NF-κB p50 and M1 polarization in microglia. Glia 2015, 63, 423–440. [Google Scholar] [CrossRef] [Green Version]
- Tang, X.; Wang, X.; Zhao, Y.Y.; Curtis, J.M.; Brindley, D.N. Doxycycline attenuates breast cancer related inflammation by decreasing plasma lysophosphatidate concentrations and inhibiting NF-κB activation. Mol. Cancer 2017, 16, 1–13. [Google Scholar] [CrossRef] [PubMed] [Green Version]
- Henríquez-Olguin, C.; Knudsen, J.R.; Raun, S.H.; Li, Z.; Dalbram, E.; Treebak, J.T.; Sylow, L.; Holmdahl, R.; Richter, E.A.; Jaimovich, E.; et al. Cytosolic ROS production by NADPH oxidase 2 regulates muscle glucose uptake during exercise. Nat. Commun. 2019, 10, 1–11. [Google Scholar] [CrossRef] [PubMed] [Green Version]
- Kładna, A.; Michalska, T.; Berczyński, P.; Kruk, I.; Aboul-Enein, H.Y. Evaluation of the antioxidant activity of tetracycline antibiotics in vitro. Luminescence 2011, 27, 249–255. [Google Scholar] [CrossRef] [PubMed]
- Clemens, D.L.; Duryee, M.J.; Sarmiento, C.; Chiou, A.; McGowan, J.D.; Hunter, C.D.; Schlichte, S.L.; Tian, J.; Klassen, L.W.; O’Dell, J.R.; et al. Novel Antioxidant Properties of Doxycycline. Int. J. Mol. Sci. 2018, 19, 4078. [Google Scholar] [CrossRef] [PubMed] [Green Version]


Publisher’s Note: MDPI stays neutral with regard to jurisdictional claims in published maps and institutional affiliations. |
© 2021 by the authors. Licensee MDPI, Basel, Switzerland. This article is an open access article distributed under the terms and conditions of the Creative Commons Attribution (CC BY) license (https://creativecommons.org/licenses/by/4.0/).
Share and Cite
Ferreira Junior, N.C.; dos Santos Pereira, M.; Francis, N.; Ramirez, P.; Martorell, P.; González-Lizarraga, F.; Figadère, B.; Chehin, R.; Del Bel, E.; Raisman-Vozari, R.; et al. The Chemically-Modified Tetracycline COL-3 and Its Parent Compound Doxycycline Prevent Microglial Inflammatory Responses by Reducing Glucose-Mediated Oxidative Stress. Cells 2021, 10, 2163. https://0-doi-org.brum.beds.ac.uk/10.3390/cells10082163
Ferreira Junior NC, dos Santos Pereira M, Francis N, Ramirez P, Martorell P, González-Lizarraga F, Figadère B, Chehin R, Del Bel E, Raisman-Vozari R, et al. The Chemically-Modified Tetracycline COL-3 and Its Parent Compound Doxycycline Prevent Microglial Inflammatory Responses by Reducing Glucose-Mediated Oxidative Stress. Cells. 2021; 10(8):2163. https://0-doi-org.brum.beds.ac.uk/10.3390/cells10082163
Chicago/Turabian StyleFerreira Junior, Nilson Carlos, Maurício dos Santos Pereira, Nour Francis, Paola Ramirez, Paula Martorell, Florencia González-Lizarraga, Bruno Figadère, Rosana Chehin, Elaine Del Bel, Rita Raisman-Vozari, and et al. 2021. "The Chemically-Modified Tetracycline COL-3 and Its Parent Compound Doxycycline Prevent Microglial Inflammatory Responses by Reducing Glucose-Mediated Oxidative Stress" Cells 10, no. 8: 2163. https://0-doi-org.brum.beds.ac.uk/10.3390/cells10082163