Article

Unravelling Precipitation Trends in Greece since 1950s Using ERA5 Climate Reanalysis Data

by
George Varlas
1,*,
Konstantinos Stefanidis
1,
George Papaioannou
1,2,
Yiannis Panagopoulos
1,
Ioannis Pytharoulis
3,
Petros Katsafados
4,
Anastasios Papadopoulos
1 and
Elias Dimitriou
1
1
Institute of Marine Biological Resources and Inland Waters, Hellenic Centre for Marine Research, 19013 Anavyssos, Greece
2
Department of Forestry and Management of the Environment and Natural Resources, Democritus University of Thrace, 68200 Orestiada, Greece
3
Department of Meteorology and Climatology, School of Geology, Aristotle University of Thessaloniki, 54124 Thessaloniki, Greece
4
Department of Geography, Harokopio University of Athens, 17671 Kallithea, Greece
*
Author to whom correspondence should be addressed.
Submission received: 24 December 2021 / Revised: 14 January 2022 / Accepted: 15 January 2022 / Published: 18 January 2022
(This article belongs to the Special Issue Climate Change Impacts at Various Geographical Scales)

Abstract

:
Precipitation is one of the most variable climatic parameters, as it is determined by many physical processes. The spatiotemporal characteristics of precipitation have been significantly affected by climate change during the past decades. Analysis of precipitation trends is challenging, especially in regions such as Greece, which is characterized by complex topography and includes several ungauged areas. With this study, we aim to shed new light on the climatic characteristics and inter-annual trends of precipitation over Greece. For this purpose, we used ERA5 monthly precipitation data from 1950 to 2020 to estimate annual Theil–Sen trends and Mann–Kendall significance over Greece and surrounding areas. Additionally, in order to analyze and model the nonlinear relationships of monthly precipitation time series, we used generalized additive models (GAMs). The results indicated significant declining inter-annual trends of areal precipitation over the study area. Declining trends were more pronounced in winter over western and eastern Greece, but trends in spring, summer and autumn were mostly not significant. GAMs showcased that the trends were generally characterized by nonlinearity and precipitation over the study area presented high inter-decadal variability. Combining the results, we concluded that precipitation did not linearly change during the past 7 decades, but it first increased from the 1950s to the late 1960s, consequently decreased until the early 1990s and, afterwards, presented an increase until 2020 with a smaller rate than the 1950–1960s.

1. Introduction

Countries across the Mediterranean basin are susceptible to climate change, as water availability is expected to decrease in the future with a simultaneous expansion of aridity [1,2,3]. The climate change influences the alternation of seasons by increasing the disparity between wet and dry ones [4,5,6], while it changes the spatiotemporal distribution of precipitation, thus strongly affecting ecosystems and human activities [2,4,7]. This phenomenon is expected to be strong in countries such as Greece, which is characterized by large landscape variability additionally affecting the local climatic characteristics [6,8]. Although the typical climate of Greece is generally characterized by dry-hot summers and mild-wet winters, there are many Greek regions that present intense spatial and seasonal variabilities of precipitation [9,10]. The complex orography of Greece forces precipitation to follow an irregular pattern with a strong gradient between the western part and the other regions [11]. The topographic characteristics of Greece with steep mountains and sea–land transitions play a key role in the climatic pluralism holding, for example, more precipitation at northern–western mountainous areas in comparison to drier southern–eastern lowlands [6,12]. Therefore, the investigation of inter-annual precipitation trends is a difficult task in areas such as Greece, which includes many mountains, sea areas, islands, and several ungauged regions.
Previous studies have examined the temporal and/or spatial distribution of precipitation in Greece, applying statistical methods and using data retrieved from meteorological stations (e.g., [8,13,14,15,16,17]). It is noteworthy that previous studies found statistically significant declining trends for precipitation in Greek areas during the previous decades, mainly in the second half of the 20th century (e.g., [18,19,20]). For example, Feidas et al. [19] found decreasing trends in precipitation from 1955 to 2001 by statistically analyzing data from 24 Greek meteorological stations. In addition, Pnevmatikos and Katsoulis [21] implemented a statistical analysis using data from 36 Greek meteorological stations that resulted in clear evidence that most Greek territories have undergone shifts in their rainfall regimes. Apart from meteorological stations, another valuable source that can be used, especially at regions with poor observational data, is the spatially distributed precipitation data derived after reanalysis and reprocessing [22]. Furthermore, Philandras et al. [20] reported decrease of precipitation and rainy days in Greece from 1951 to 2009 by analyzing precipitation data from stations and spatially distributed datasets. In the study of Hatzianastassiou et al. [23], satellite-based monthly precipitation data obtained from the Global Precipitation Climatology Project (GPCP) were evaluated against measurements from 36 stations and then were used to examine the spatial and temporal variations of precipitation in Greece and surrounding regions from 1979 to 2004. This study presented decreasing and increasing trends of precipitation while it highlighted the value of using spatially distributed precipitation data in temporal analyses [23]. Therefore, the lack of dense, continuous, and long-term observational networks usually poses the necessity to employ long-term spatially distributed datasets for the investigation of inter-annual precipitation trends over continuous grids, including even ungauged areas. It is also important to consider the past 2 decades (i.e., 2000s and 2010s) in trend analyses due to their significance regarding climate change. However, the period since 2000 was not completely included in the previous relevant studies as also noted by Markonis et al. [8] and Katsafados et al. [24].
The main scope of this study was the identification of statistically significant (or simply significant hereafter) inter-annual trends of precipitation over Greece and neighboring areas for a 71-year period from 1950 to 2020, including even ungauged land regions as well as sea areas where precipitation has remarkable effects (e.g., on sea state and sea temperature [25,26]). To this aim, we used ERA5 reanalysis precipitation data, which are consistent in space and time covering 7 decades and which have recently been used by other studies, such as those by Mastrantonas et al. [27] and De Luca et al. [28], to identify spatiotemporal characteristics of precipitation in the Mediterranean. The innovation of our study lies in the processing of the abovementioned data with robust statistical techniques to explore statistically significant trends of precipitation over the study area and, subsequently, to quantify nonlinear variabilities that have occurred within the past approximately 7 decades. In this way, our study can reveal areas that have been mostly affected by climate change and, thus may be more vulnerable to climate change in the future.

2. Materials and Methods

In order to investigate statistically significant precipitation trends over Greece and neighboring areas we estimated Theil–Sen linear trends and Mann–Kendall significance. Then we used generalized additive models (GAMs) to analyze and model nonlinear variabilities of precipitation over the study area. Precipitation data, study area (Figure 1) and statistical methods used in this study are described in the following subsections. The main data processing and calculation stages are briefly illustrated in a flowchart (Figure 2) at the end of the section.

2.1. Climatological Precipitation Data and Study Area

The historical precipitation data used in this study were obtained from the ERA5 reanalysis dataset [29]. ERA5 climatological data were selected, as they are considered the most modern and reliable datasets that can be used in a wide range of long-term analyses and multidisciplinary studies (e.g., [27,30,31,32,33,34]). ERA5 data were produced by the European Centre for Medium-Range Weather Forecasts (ECMWF) and they are available online by the Copernicus Climate Change Service (C3S, [35]). ERA5 data cover both land and sea areas at a horizontal resolution of 0.25° × 0.25°. ERA5 multiyear reanalysis facilitates inter-annual and climatic analyses as they cover a long period from 1950 to nearly present (2–3 months before today). Until recently, ERA5 has been covering a period from 1979 to nearly the present, but currently they also cover the period 1950–1978, after their recent back extension [36]. It is important to note that this back extension of ERA5 for the period 1950–1978 is considered as preliminary due to an issue related to the representation of tropical cyclones. This issue concerns tropical areas away from our study area, and therefore preliminary 1950–1978 ERA5 data can be normally used in this study as a back extension of the dataset for the period from 1979 to nearly the present. An advantage of ERA5 data is that they provide high-quality climatological information on hourly or monthly averaged basis. It is easy to retrieve ERA5 data in friendly GRIB and NetCDF formats, and they are also available on custom regular latitude–longitude grids anywhere on Earth, thus facilitating various analyses and applications in any country, including Greece [12,37].
First, we selected the study area covering the entire territory of Greece and neighboring areas enclosed in a region between 18.75° W–29.75° E and 34.5° N–42° N, as demonstrated in Figure 1. Figure 1 also illustrates the topography of the study area using Terra Advanced Spaceborne Thermal Emission and Reflection Radiometer (ASTER) Global Digital Elevation Model (GDEM) Version 3 (ASTGTM) data at a spatial resolution of approximately 30 m [38]. The study area consists of 1395 ERA5 grid points. Consequently, we obtained ERA5 monthly precipitation data for each month in the 71-year period of the study, spanning from January 1950 to December 2020. The data were retrieved from the C3S service on a regular latitude–longitude grid covering the study area. They are known as ERA5 monthly averaged precipitation data and they are expressed in m day−1, representing the average precipitation amount per day for each month. Then, the monthly averaged precipitation values were used to estimate the respective monthly accumulated precipitation (or simply monthly precipitation hereafter) values expressed in mm month−1 or simply in mm, by multiplying the first ones by 1000 (conversion from m to mm) and, consequently, by the number of days of each month. The monthly precipitation values for each grid point were used as a basis for calculating annual values that were used to estimate Theil–Sen inter-annual trends. The monthly precipitation time series for each point were also employed for the estimations performed by GAMs.
Figure 1. Study area covering the entire territory of Greece and neighboring areas. The map also demonstrates topography (m) based on Terra Advanced Spaceborne Thermal Emission and Reflection Radiometer (ASTER) Global Digital Elevation Model (GDEM) Version 3 (ASTGTM) data at a spatial resolution of approximately 30 m [38].
Climate 10 00012 g001
Figure 2. Flowchart demonstrating the main data processing and calculation stages.
Climate 10 00012 g002

2.2. Data Formatting, Spatial Analysis and Estimation of Inter-Annual Trends

We edited the 71-year ERA5 dataset to come in a format serving the purposes of this study. First, we estimated annual accumulated precipitation (or simply annual precipitation hereafter) values for the 1395 ERA5 grid points, summing up the 12 monthly precipitation values for each year. Consequently, we estimated seasonal accumulated precipitation (or simply seasonal precipitation) values for each point considering the four seasons. We estimated seasonal precipitation values for winter (i.e., December, January, and February; DJF), spring (i.e., March, April, and May; MAM), summer (i.e., June, July, and August; JJA) and autumn (i.e., September, October and November; SON). Having calculated annual and seasonal precipitation fields for each year, then, we estimated the 71-year average of annual and seasonal precipitation for each grid point. We also created maps with these 71-year averaged values to present the spatial distribution of precipitation across the study area, on annual and seasonal basis. To better demonstrate the values for each reanalysis point, average annual and seasonal precipitation were depicted on raster-based maps avoiding spatial interpolation.
Afterwards, we estimated Theil–Sen linear trends [39,40] for each ERA5 grid point in the study area, considering the 71-year period from 1950 to 2020. The Theil–Sen trend estimation method is one of the most popular nonparametric techniques for estimating a linear trend. It is insensitive to outliers, and it can be better than simple linear regression for skewed and heteroskedastic datasets, competing also well against nonrobust least squares even for normally distributed data in terms of statistical power. To estimate Theil–Sen trends, we used annual precipitation values for each point considering the 71 years. We used annual precipitation values instead of monthly ones to make deseasonalized time series. In this way, we avoided probable errors in our estimations related with seasonal variability of precipitation within each year. We also applied Mann–Kendall (M–K) nonparametric tests for monotonic trends [41,42,43] to check the significance of the 71-year trends for each point. The M–K test is distribution-free and is used to detect the presence of both linear and nonlinear trends in time series assessing if they are steadily increasing/decreasing or are unchanging. Consequently, we estimated Theil–Sen linear trends and M–K significance considering time series of annual precipitation spatially averaged over the study area (annual areal precipitation hereafter). The annual areal precipitation is translated to the average water amount expressed in mm that drops across the entire study area each year and was calculated as the arithmetic mean of the 1395 annual precipitation amounts from the respective grid points covering the study area. The estimation of Theil–Sen trends and M–K test was based on the respective functions of NCL (National Center for Atmospheric Research-NCAR Command Language [44,45]).

2.3. Generalized Additive Models for Linear and Nonlinear Trends

After the estimation of the inter-annual Theil–Sen trends and the Mann–Kendall significance, we used GAMs to analyze and model the monthly precipitation time series data aiming beyond a fitting based on linear trends. We chose GAMs because they are capable of modelling nonlinear relationships between the response variable and the predictors [46] and therefore they have many applications in environmental sciences [47,48,49]. They are also widely used in time-series analysis since they can capture nonlinear trends in time series and deal with the irregular spacing of samples in time [37]. The components of a time series are represented as smooth functions, which are nonlinear representations of the covariates, composed by the sum of K simpler basis functions [48]. A general form of generalized additive model is:
g Y = β + f 1 x 1 + f 2 x 2 + + f n x n
where Y is the expected response value, β is the model intercept and f1, f2, fn are smooth functions of the predictors x1, x2, xn [50]. In our models the response variable Y is the monthly precipitation, and the predictors are the trend (named “Time”) and the intra-annual variation (named “Month”). The smoothness selection for each term was based on a restricted maximum likelihood approach (REML). Thus, we fitted 1395 models, one for each grid point, using for “Time” smooth term a cubic regression smoothing spline, while for “Month” we used the cyclic cubic spline with k = 12. We also fitted a model using the monthly areal precipitation values which were calculated as the arithmetic means of the monthly precipitation values from the 1395 grid points of the study area for each month to assess the inter-annual variability for the whole region of study. All models were fitted with the gam function of the “mgcv” package in R environment [51].

3. Results

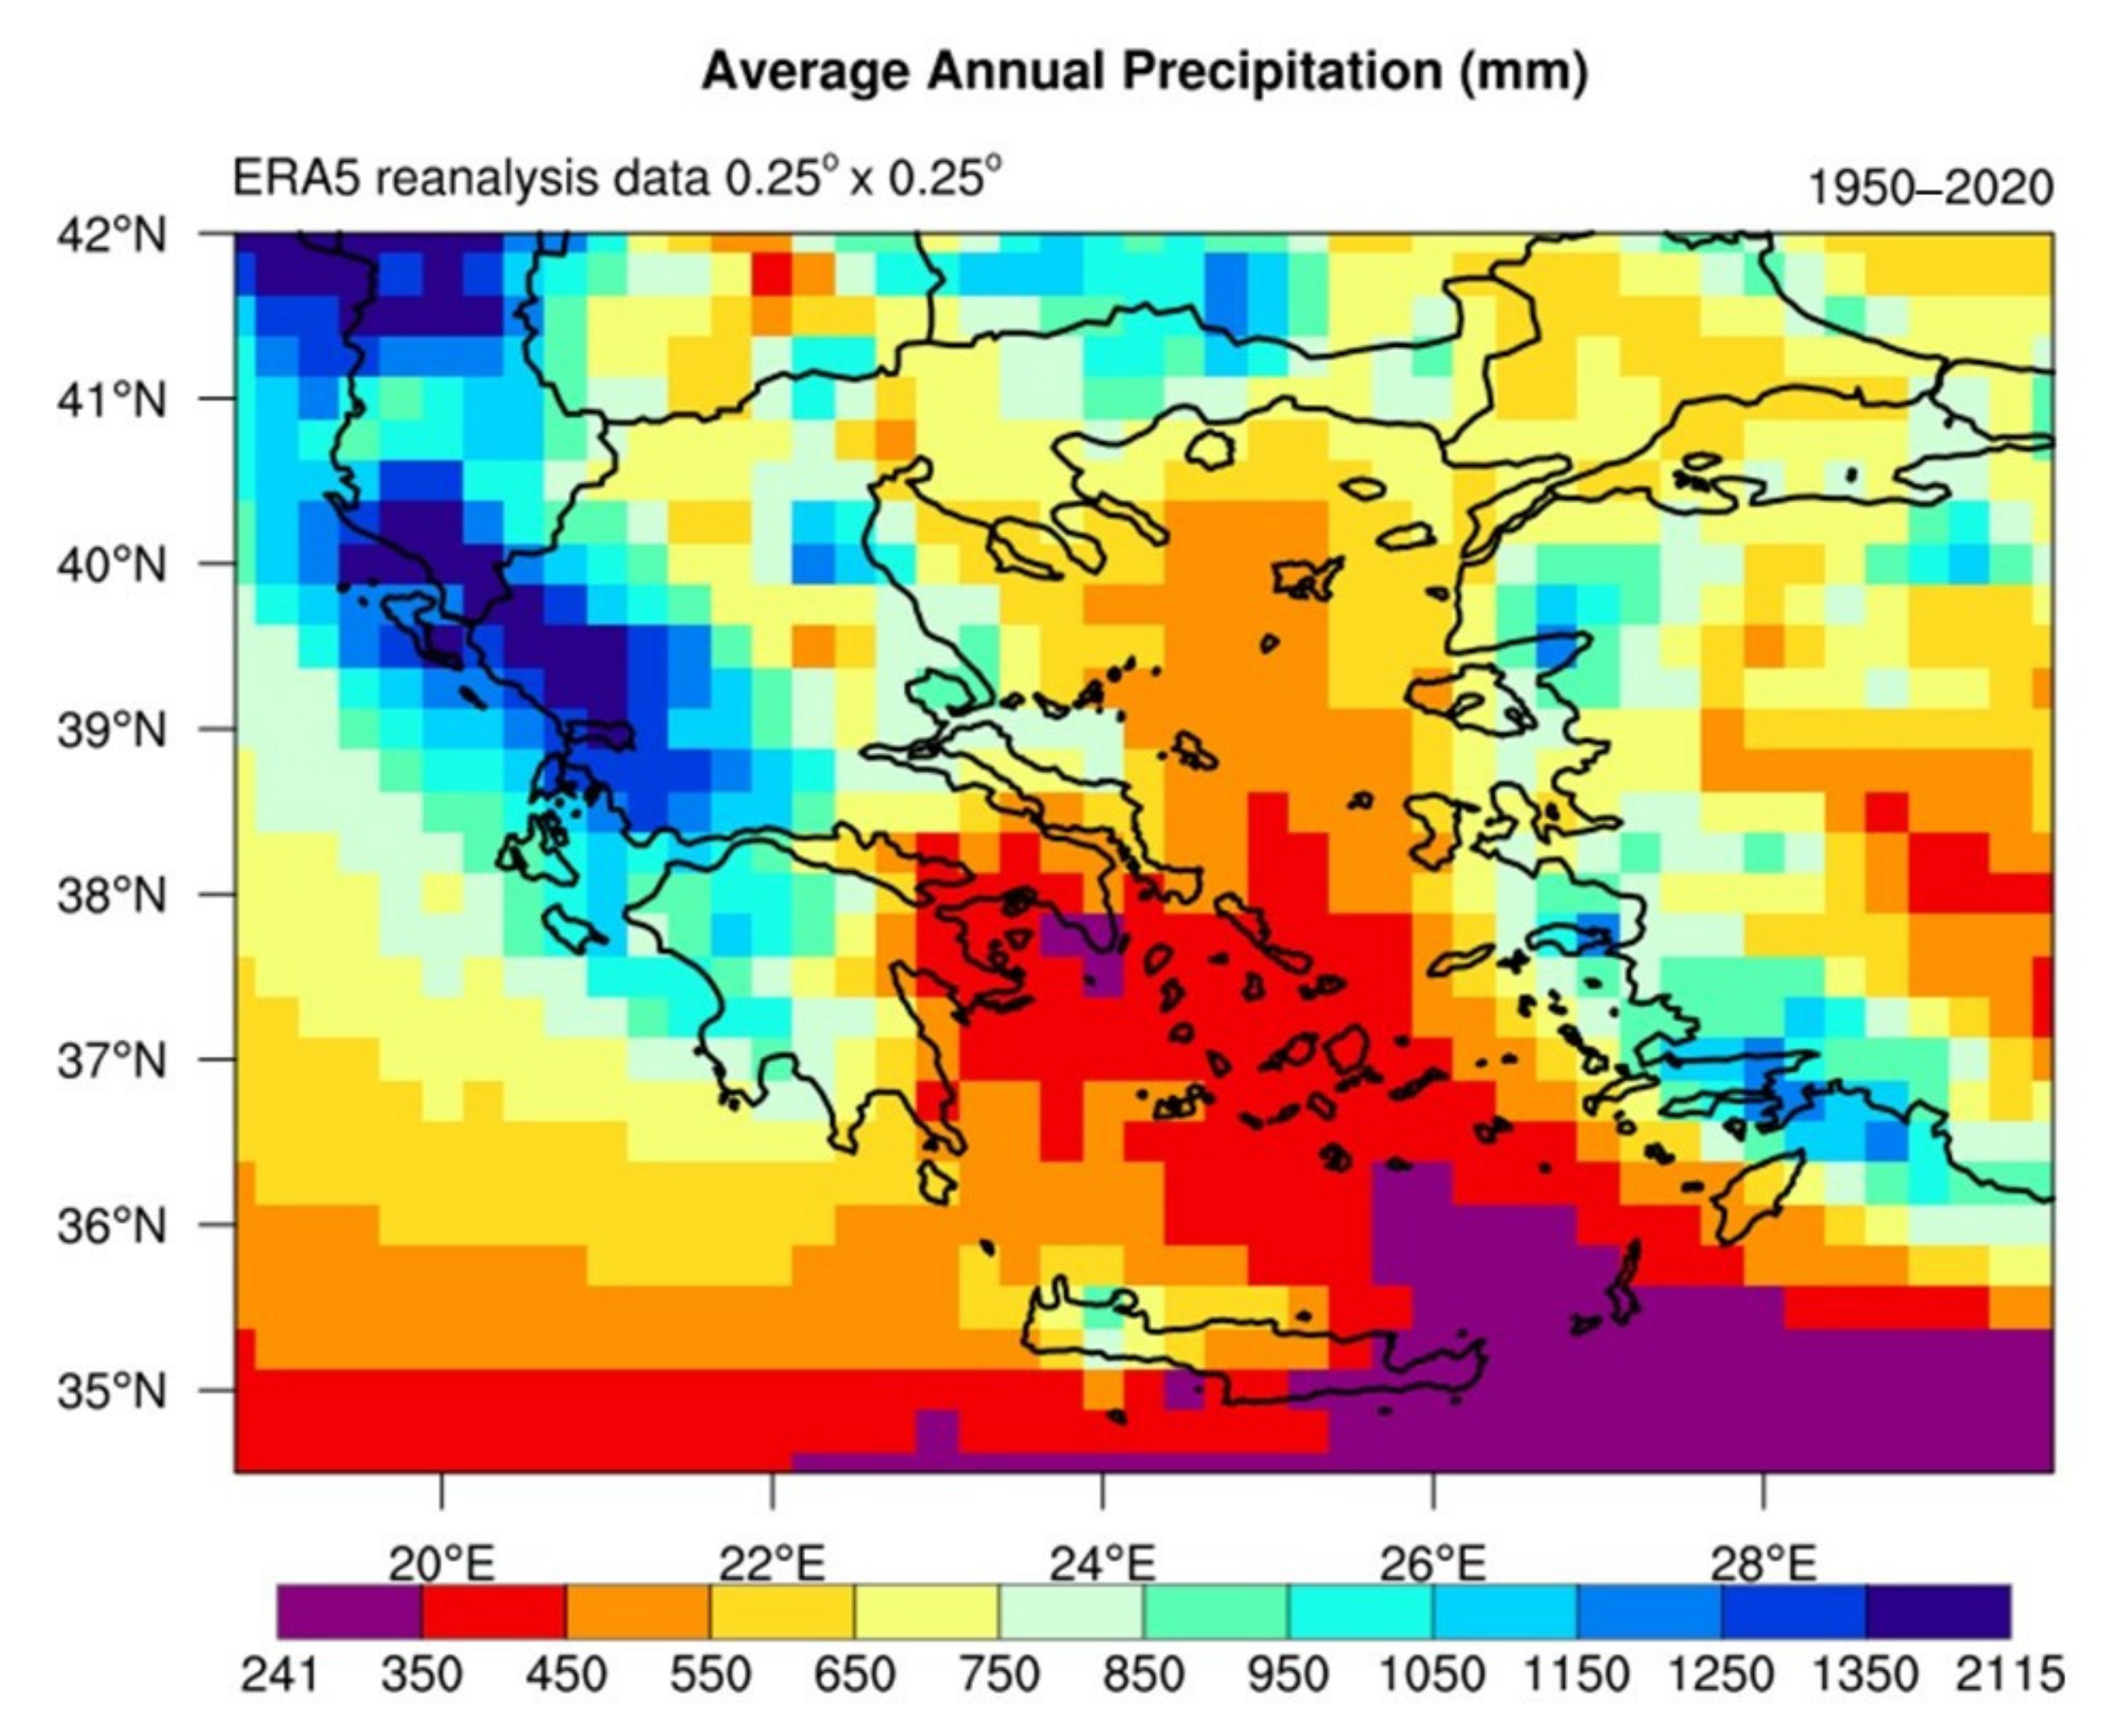
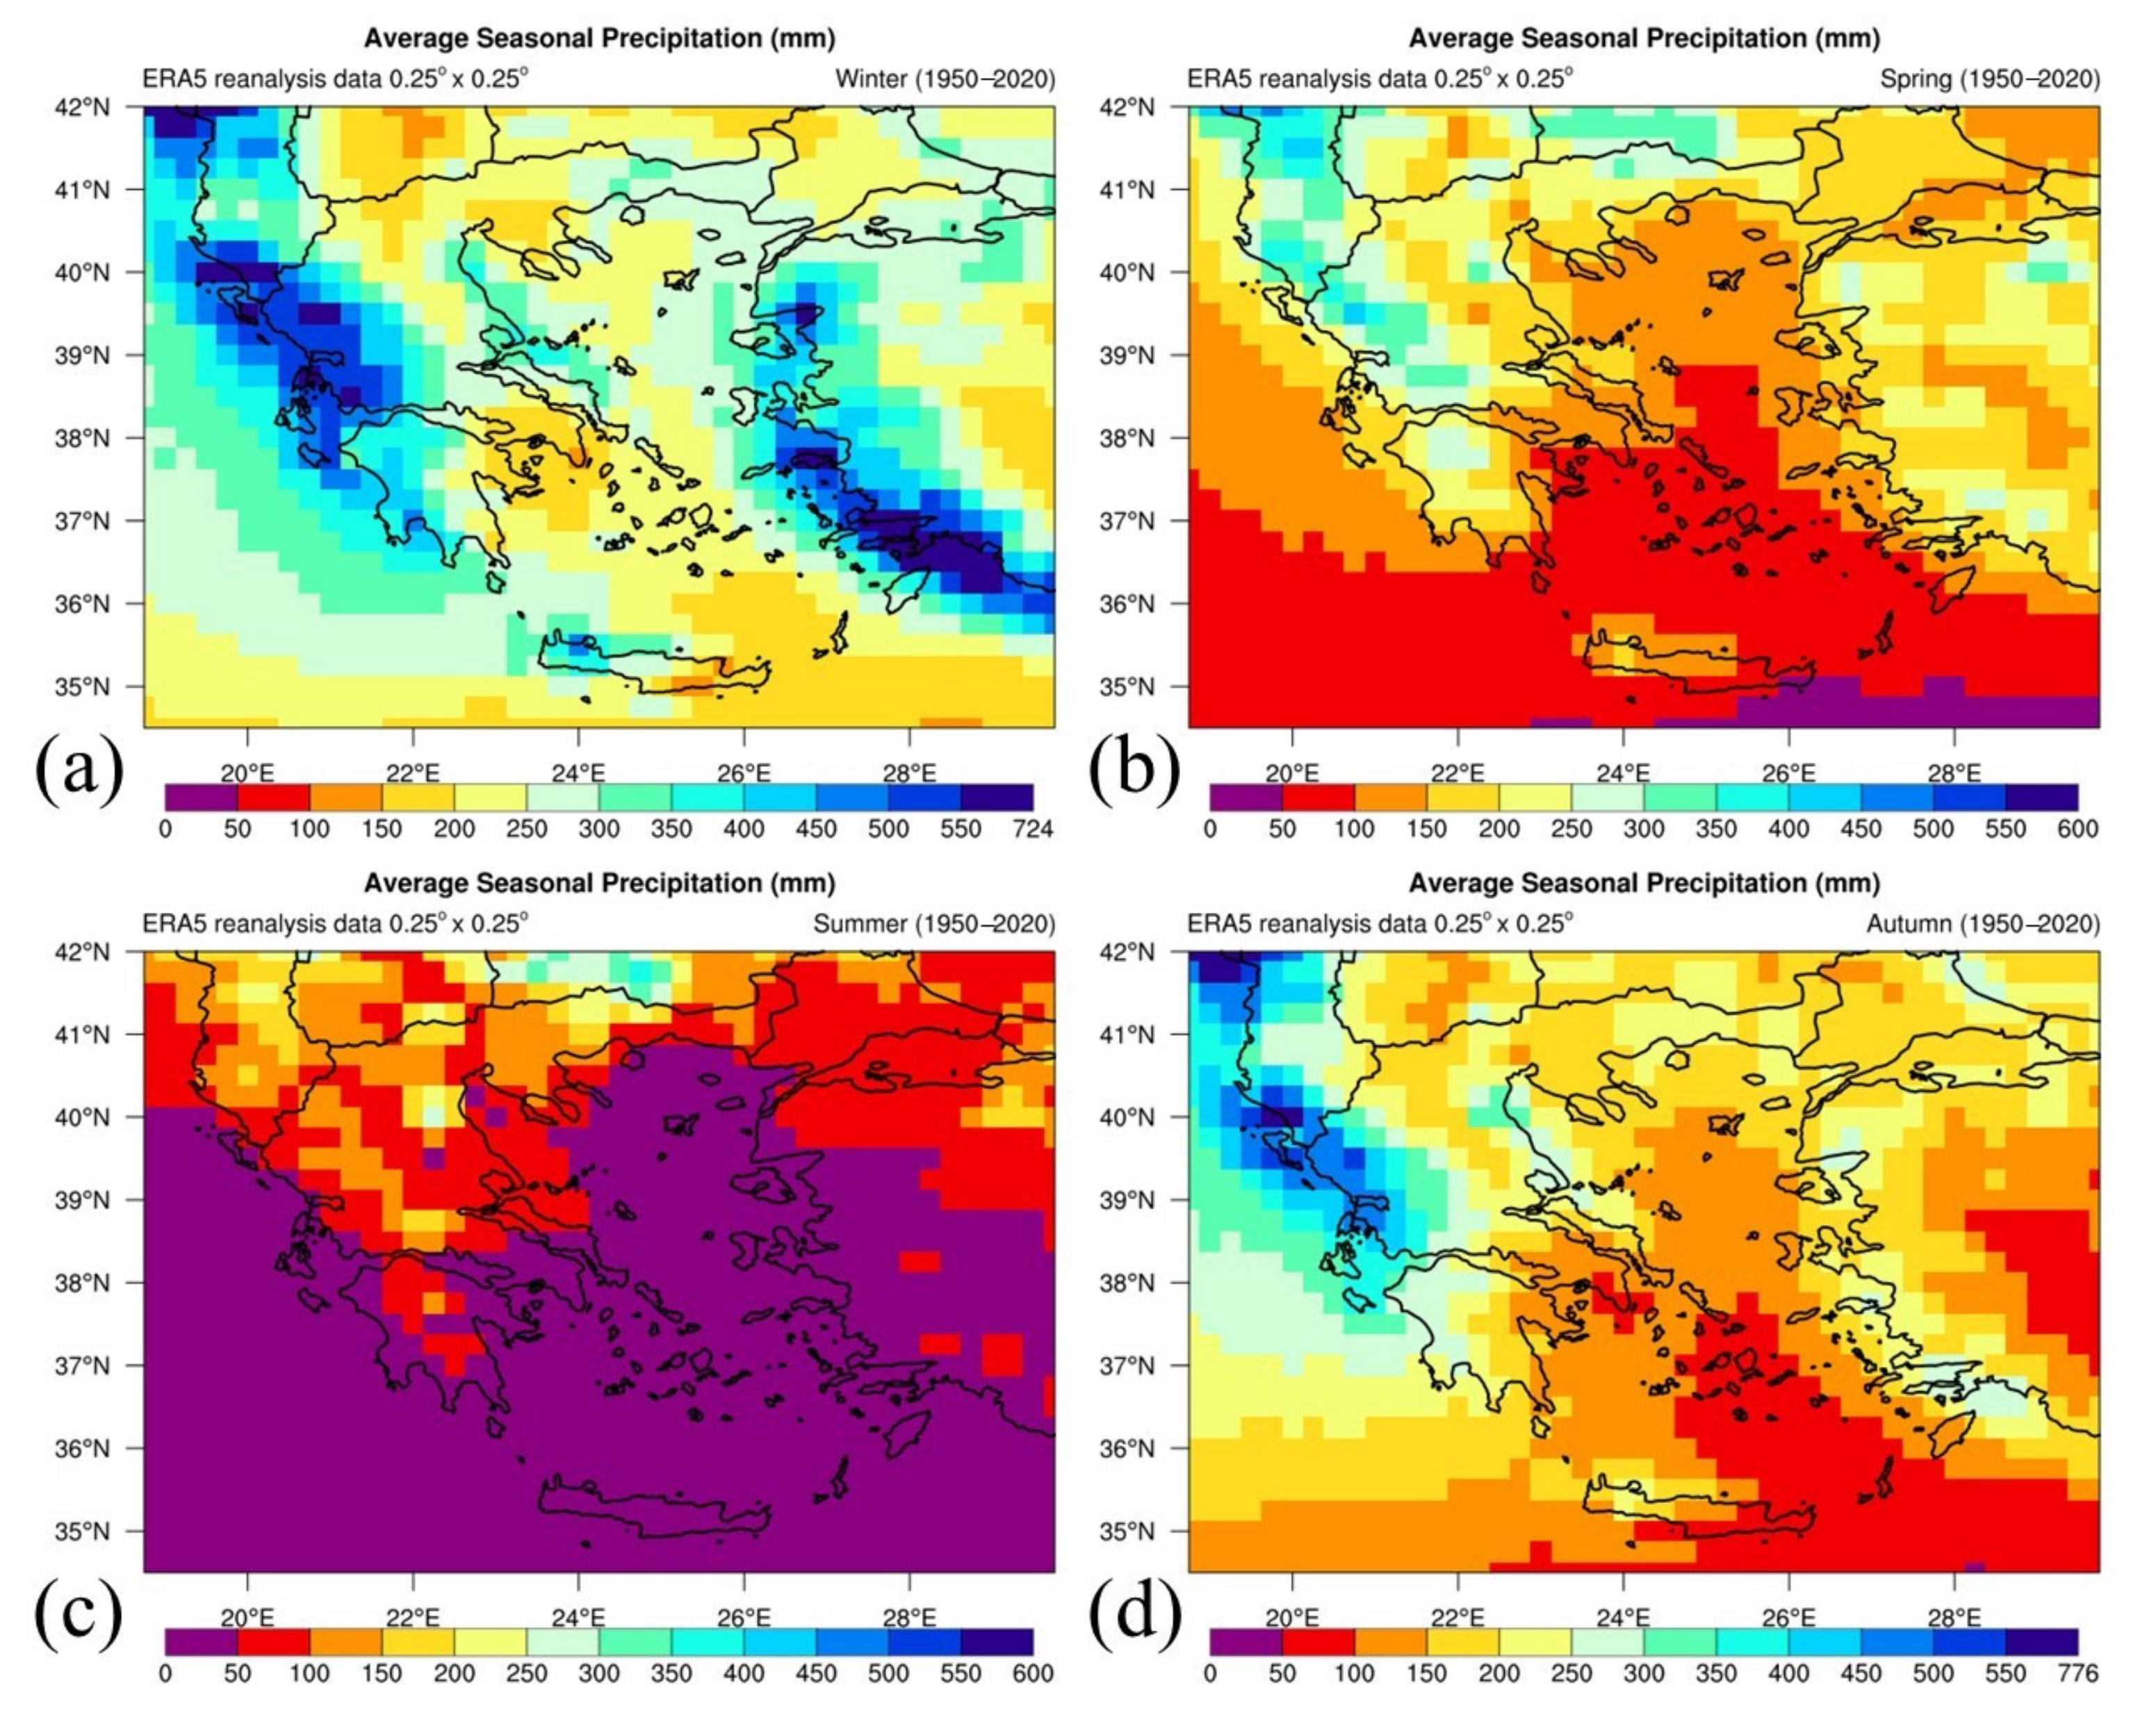
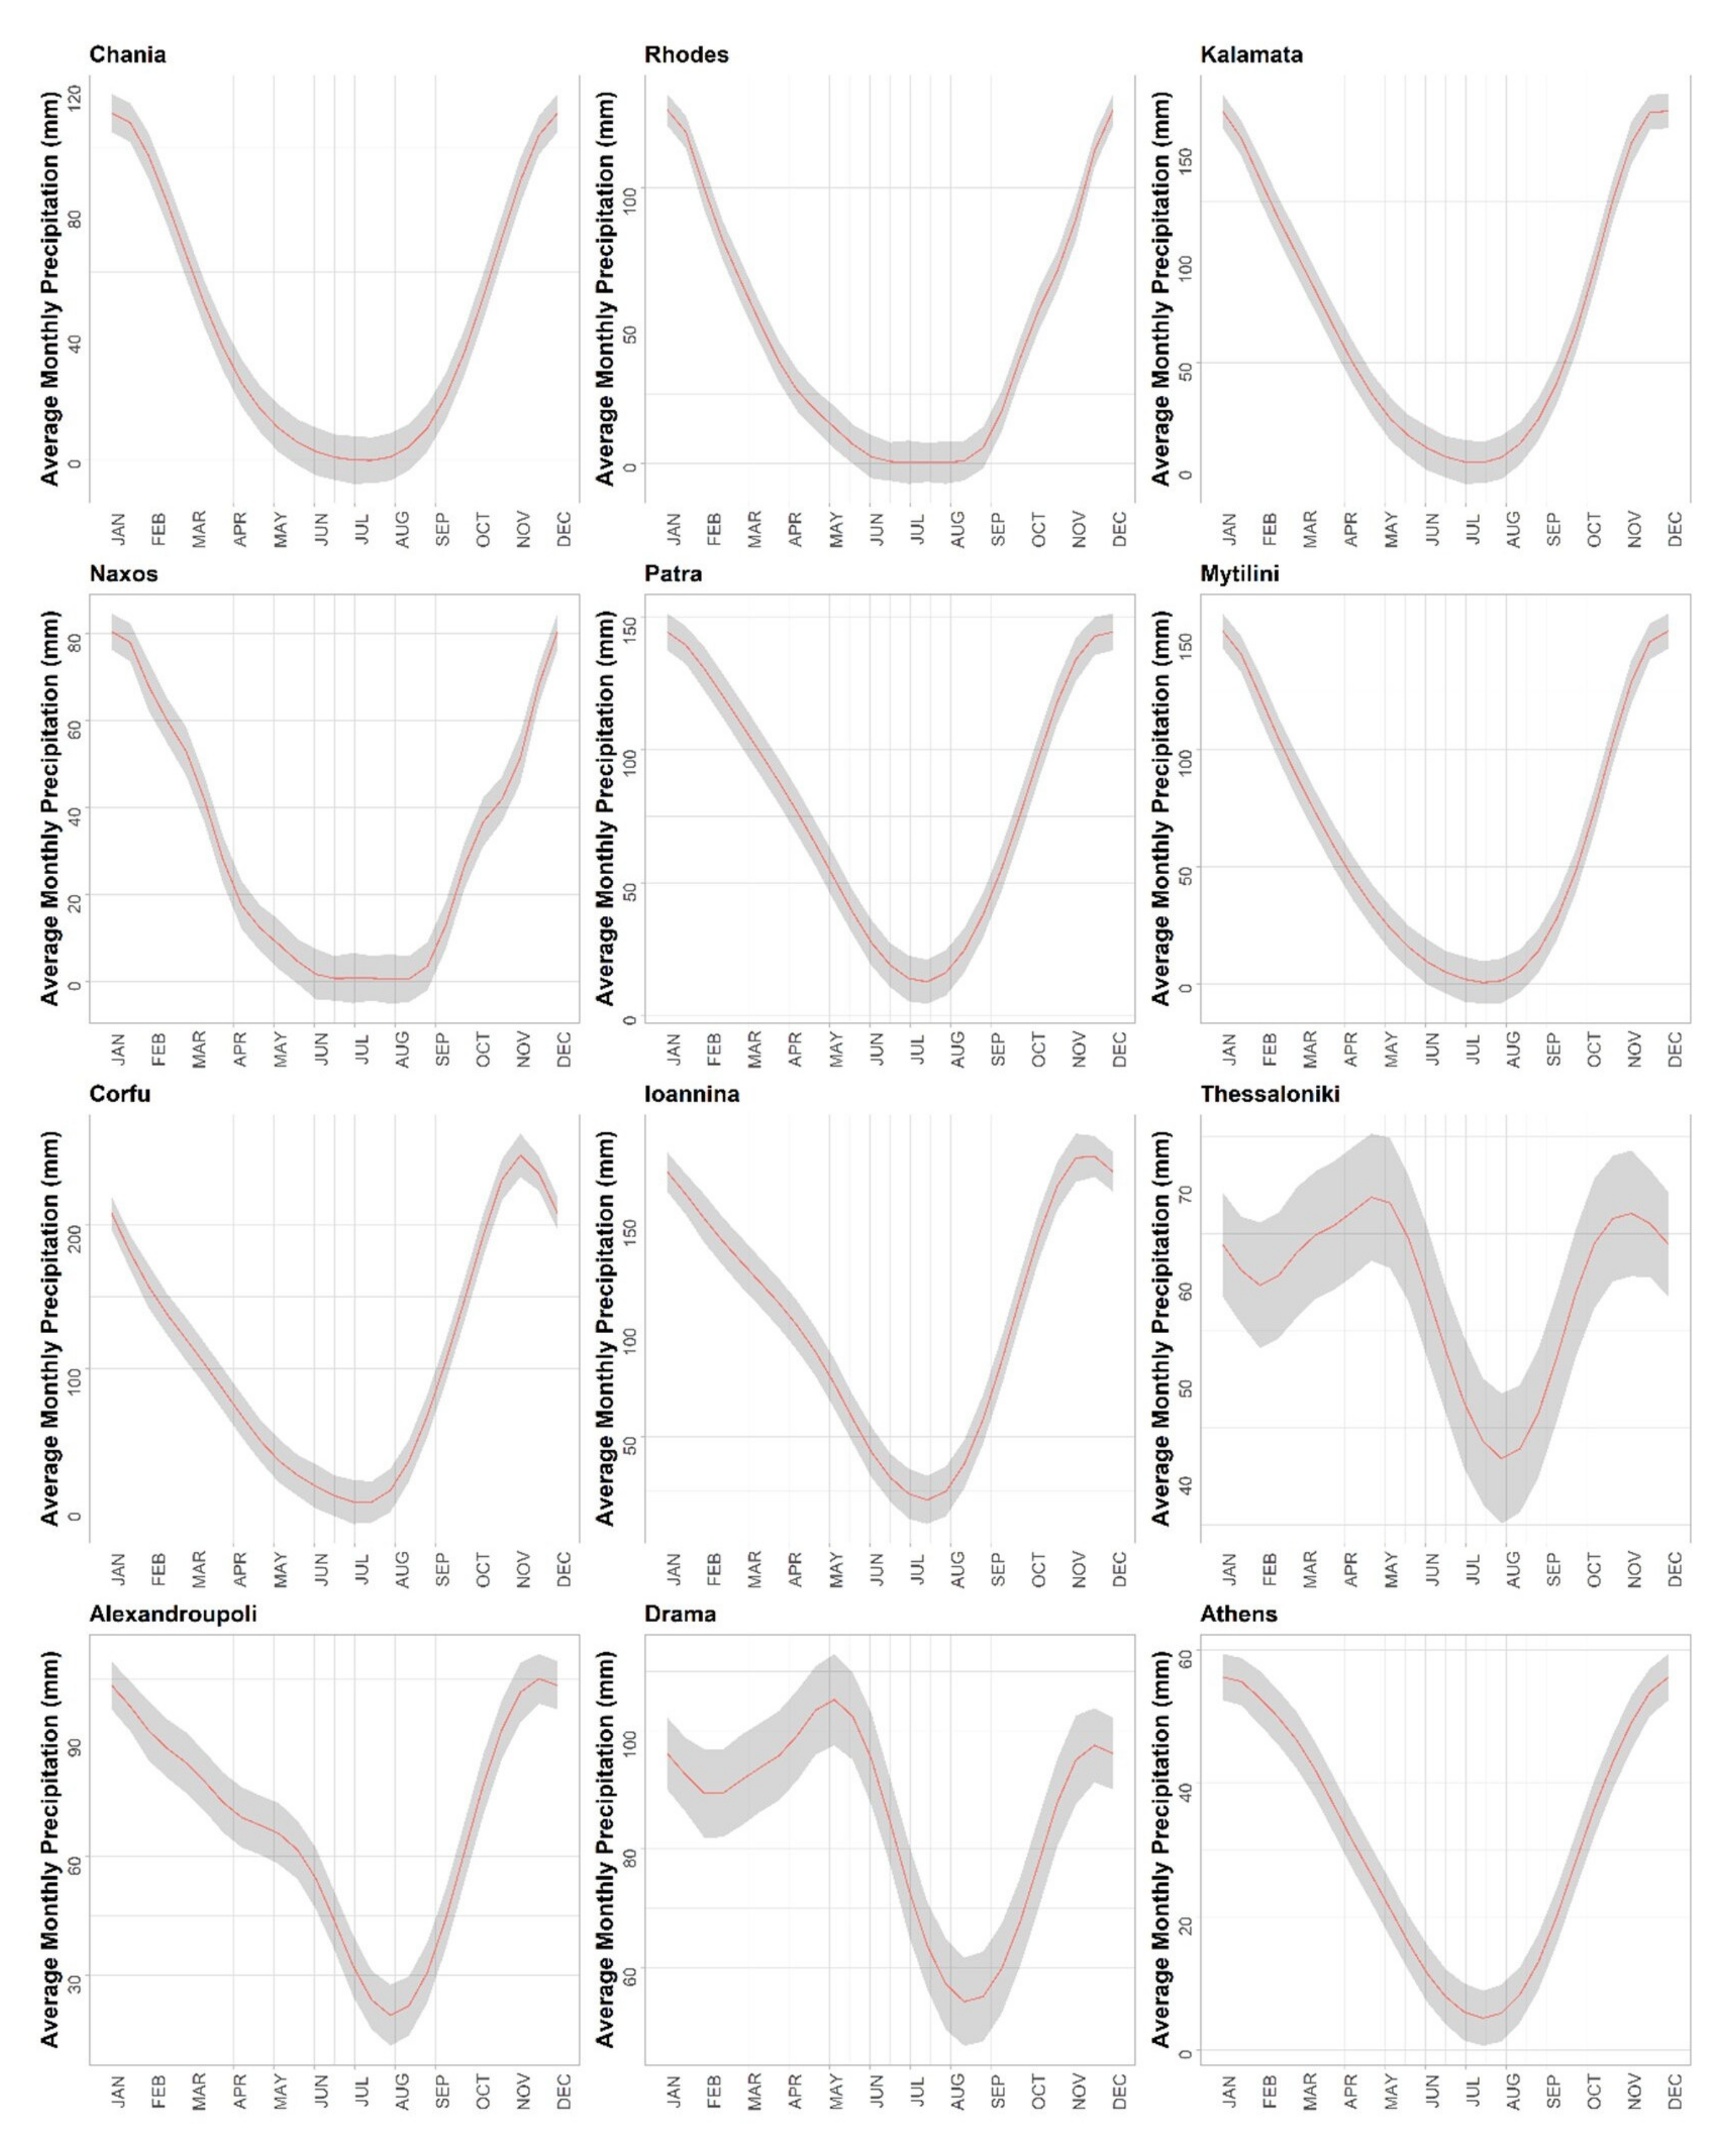
3.1. Distribution of Average Annual and Seasonal Precipitation

The spatial distribution of 71-year averaged annual and seasonal precipitation over the study area is presented in Figure 3 and Figure 4, respectively. The highest average annual precipitation values are depicted at western Greece with peaks over 1350 mm detected at Epirus and the Ionian Sea (Figure 3). There are some additional areas that are characterized by high precipitation values. These include the eastern Aegean Sea, western Peloponnese, northern Thessaly, eastern Macedonia, western Thrace, and western Crete. On the other hand, the lowest average annual precipitation values are demonstrated at eastern–southern Crete, and at the southeastern–southern–central Aegean Sea as well as at Athens and eastern Peloponnese (Figure 3). Precipitation values about 350–450 mm are illustrated at these areas, while values even lower than 350 mm can be detected at the southeastern Aegean Sea and southeast of Athens. The analysis of the 71-year ERA5 dataset conducted in this study generally corroborates previous studies. In particular, the spatial distribution of average annual precipitation over land areas of Greece agrees with the respective one presented in a map included in the classic book of Mariolopoulos and Karapiperis [52] for precipitation in Greece. It is also in agreement with the respective distribution demonstrated in the climatic atlas of Greece of the Hellenic National Meteorological Service [53,54]. The spatial distribution of annual precipitation is mostly determined by the mountains and the passage of barometric depressions accompanied by fronts, mainly occurring during the cold period. In general, the barometric systems move in a west-to-east direction bringing larger water amounts over the windward slopes of mountains in comparison to the leeward ones (Figure 1 and Figure 3), thus sufficiently explaining local variations of precipitation across Greece [9]. It is noteworthy that Pindus Mountain range (Figure 1) is a typical example as it plays a key role on the formation of a wetter climate over the western continental Greece in comparison with the drier climatic conditions that prevail over the eastern continental Greece.
The seasonal variability of precipitation in Greece follows a typical pattern with alternations of wet, transitional, and dry periods. The peak of precipitation occurs in winter (DJF) (Figure 4a) illustrating similar pattern as the annual distribution (Figure 3). Smaller precipitation amounts are generally shown for spring (MAM) with peaks located over mountainous areas (Figure 4b). Summer (JJA) is too dry especially for the islands and over the sea (Figure 4c). Especially for the Aegean Sea, Etesian winds which are dry north winds prevail for long periods in the summer [9]. However, some precipitation amounts are presented over the mainland areas in summer (Figure 4c), which are associated with thermal thunderstorms, usually occurring from late spring to early autumn. Significant amounts of precipitation are observed in autumn (SON), mainly over the windward slopes of mountains in western Greece (Figure 4d). Overall, the passage of barometric systems and fronts explains most of precipitation amounts in winter, autumn (especially late) and spring (especially early), while rainless Etesian winds over the Aegean Sea and local convective storms over continental areas strongly determine precipitation distribution in summer.

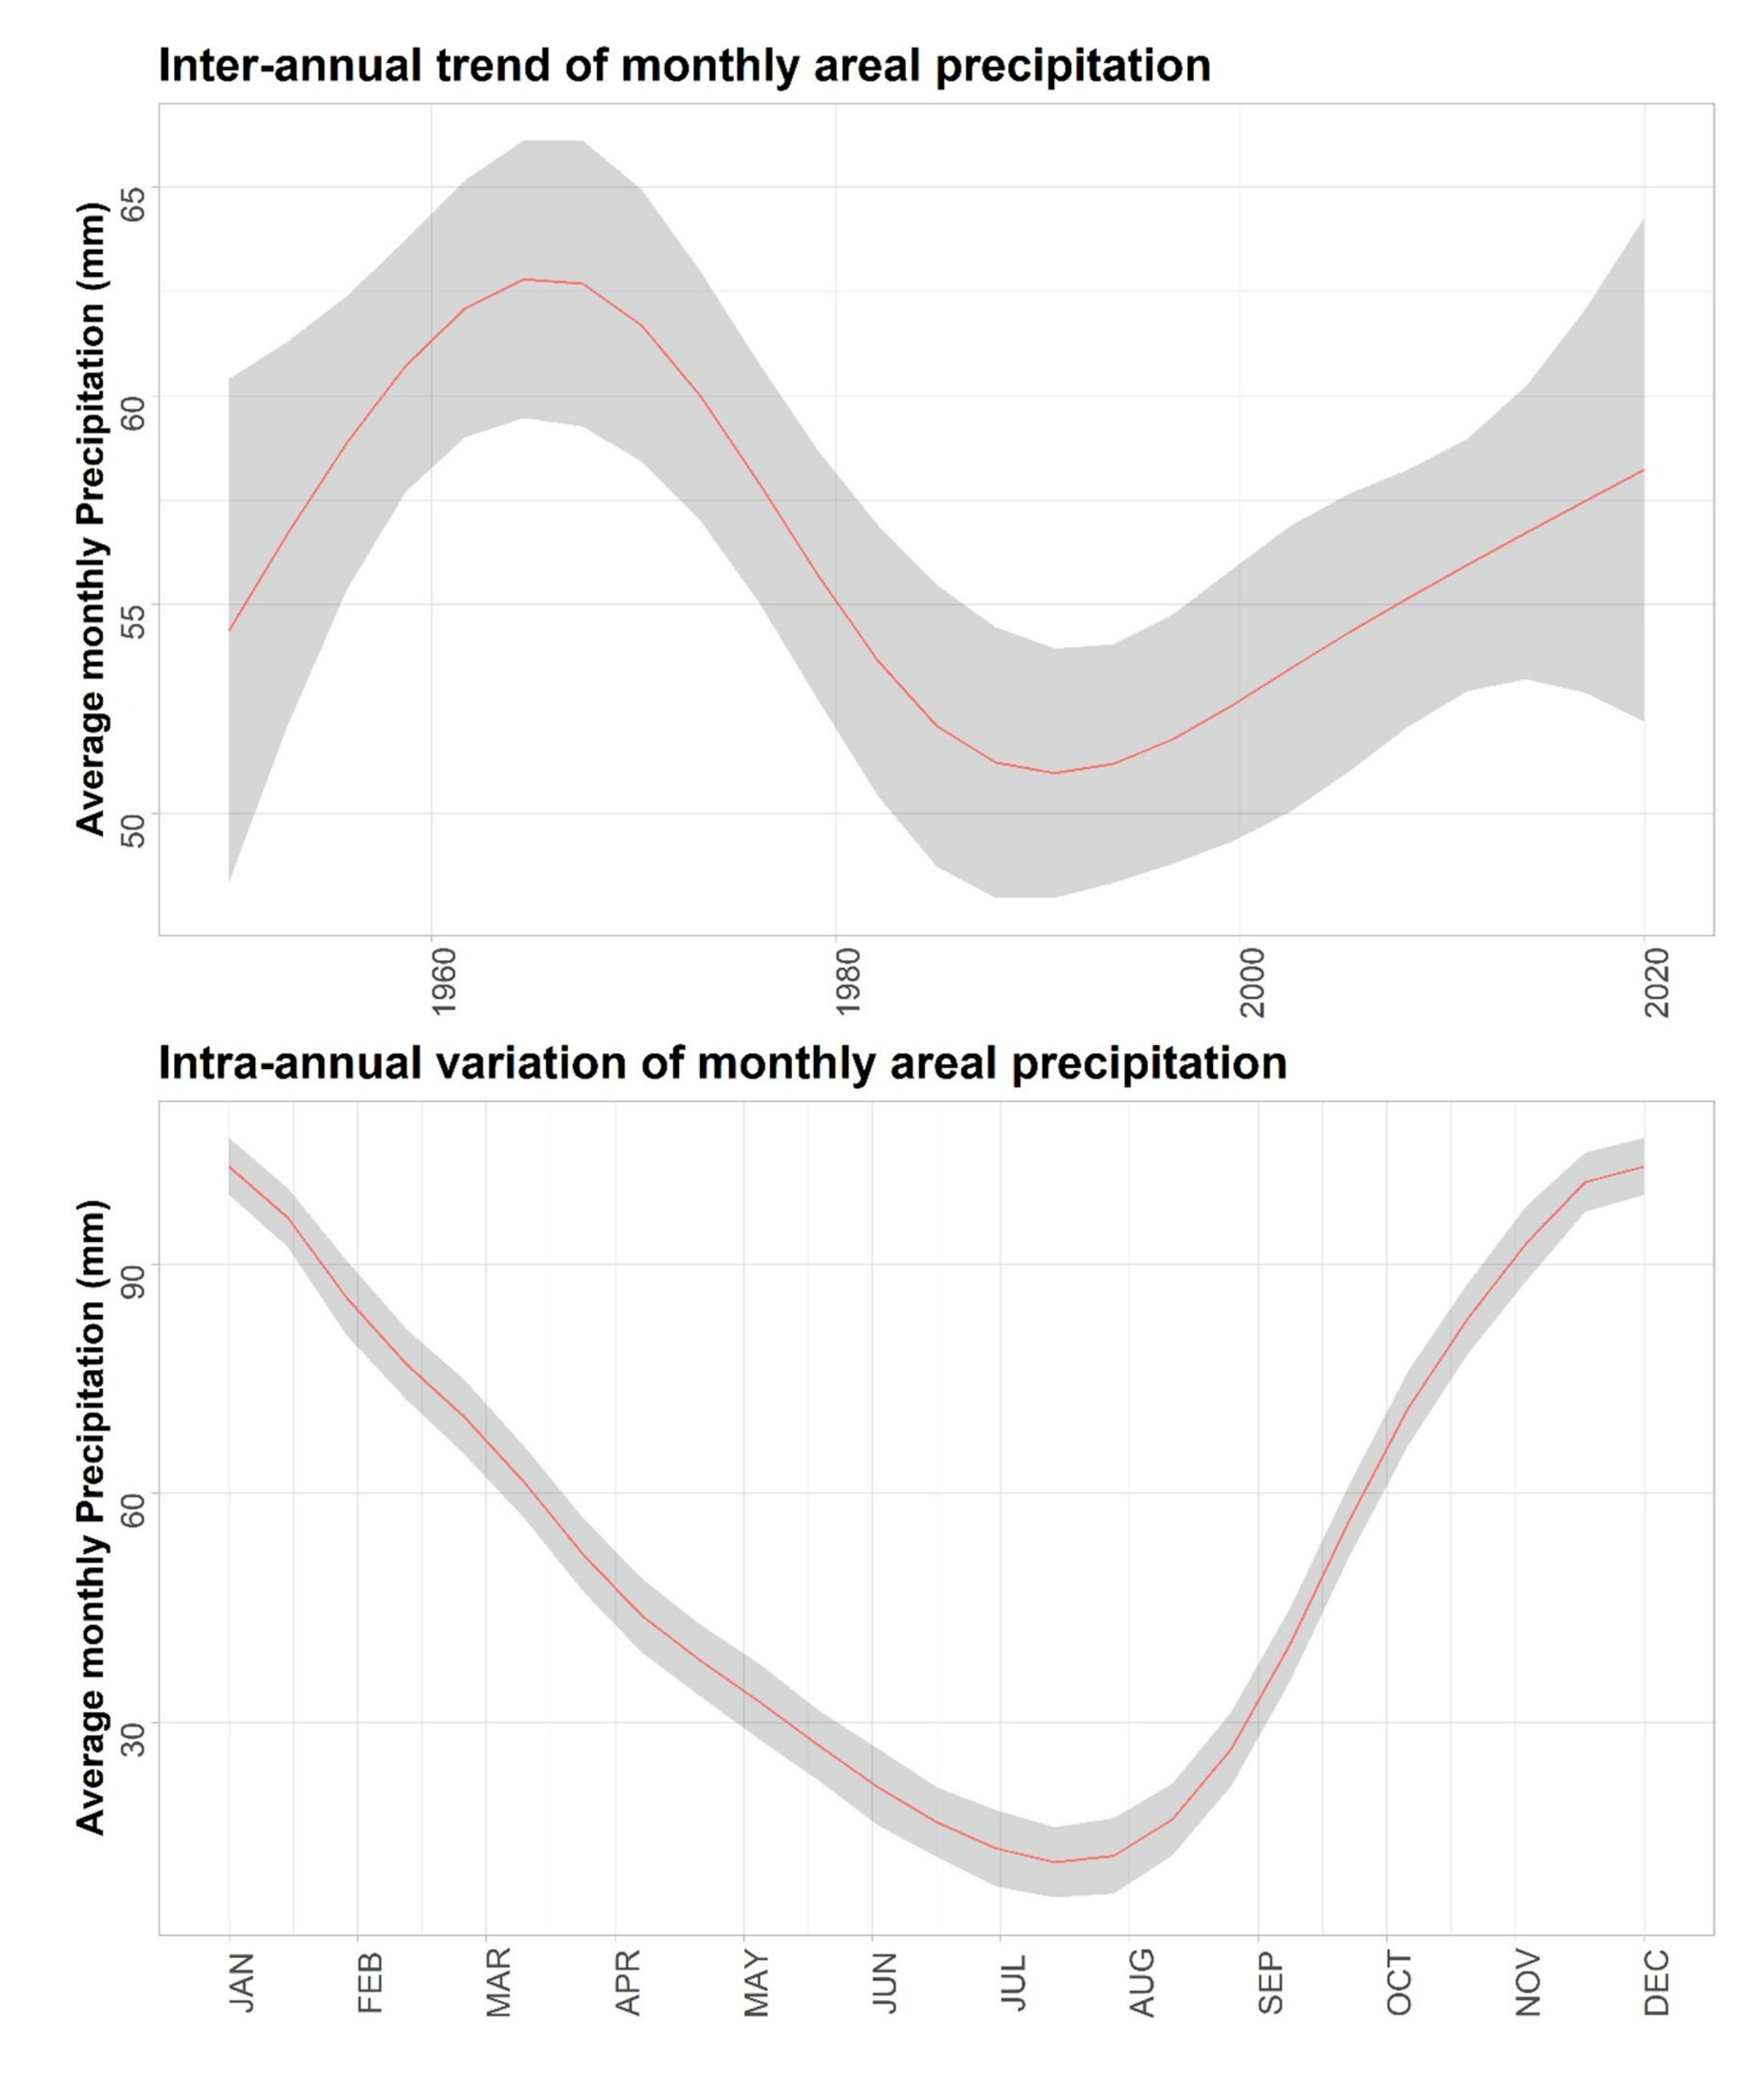
3.2. Inter-Annual Precipitation Trends
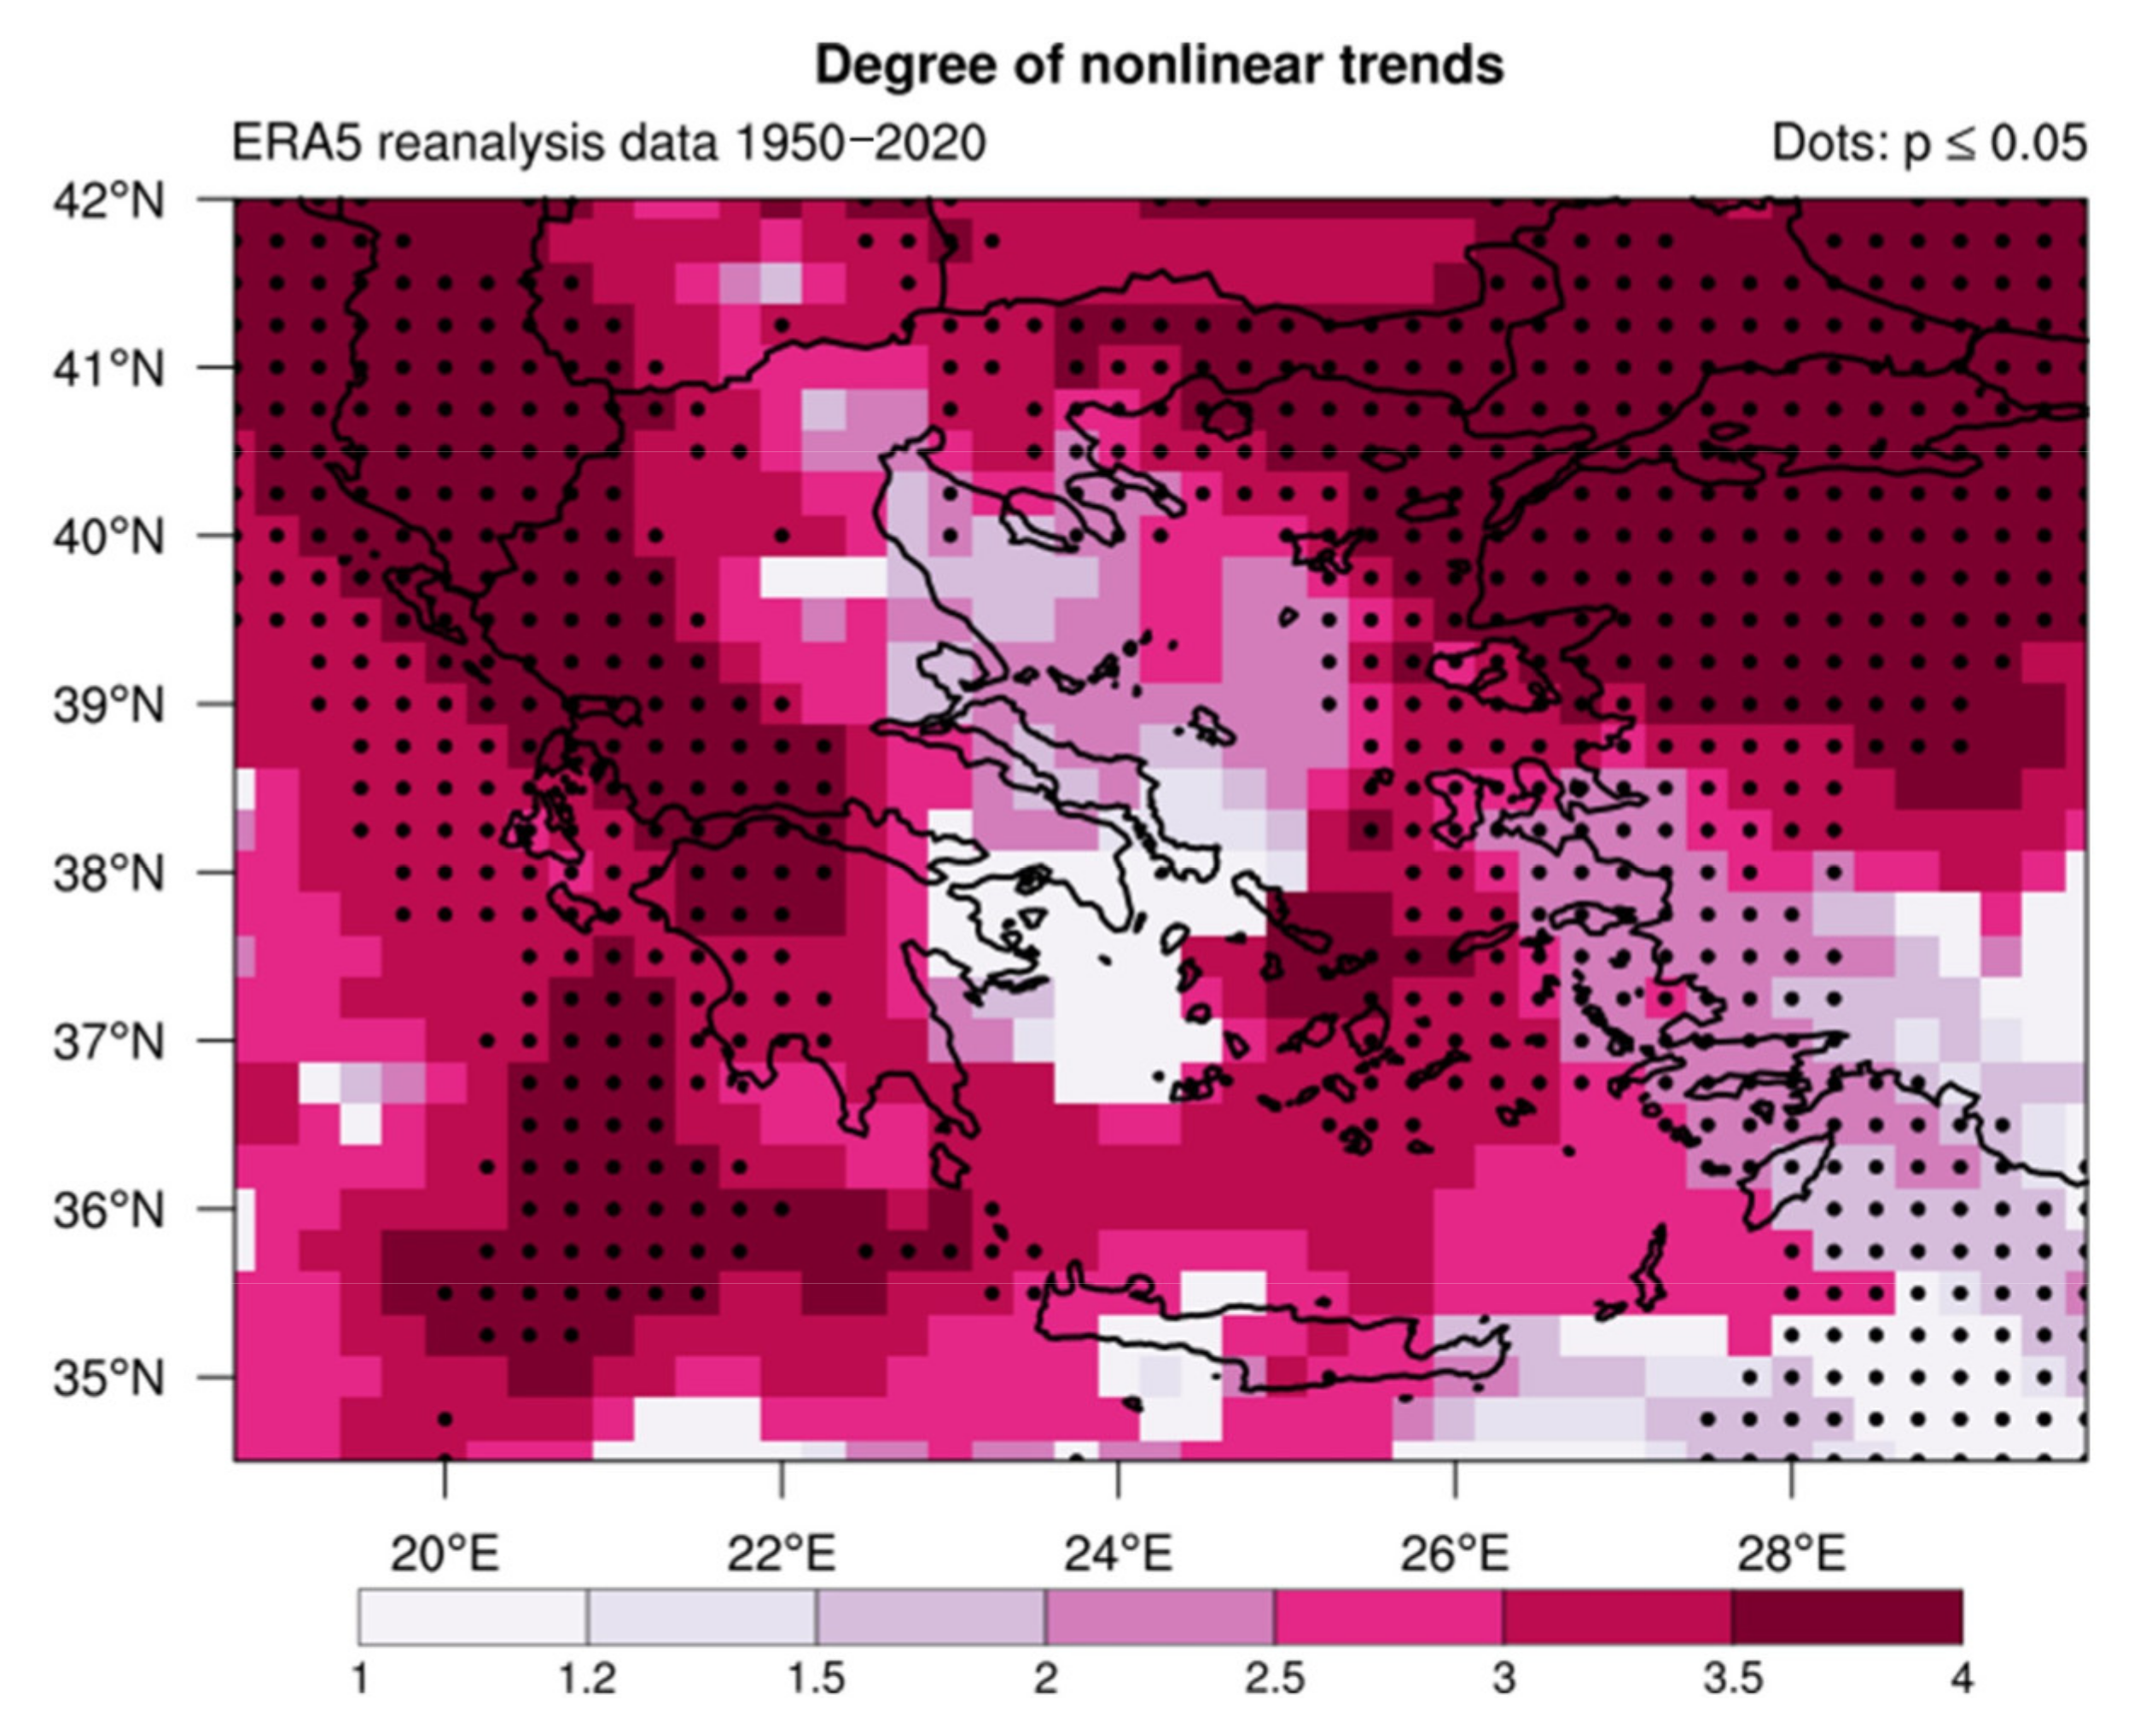
The results of trend analysis of annual precipitation conducted for each ERA5 grid point are presented in Figure 5. The map of Figure 5 spatially combines the trends estimated for the 1395 grid points to highlight areas with increasing, unchanging, and declining trends, also adding information for the Mann–Kendall significance. Figure 5 demonstrates a general declining trend of annual precipitation across the study area during the 71-year period from 1950 to 2020. The trends are significant, especially in western Greece and the eastern Aegean Sea, with some additional limited areas at the northern Aegean Sea and the sea area west of Crete. It is interesting to note that there are some areas such as Athens, northeastern Peloponnese, central–eastern Crete, and the central–western Aegean Sea where slight increasing trends are pronounced (Figure 5). Even though these increasing trends are not significant, they at least do not imply declining trends. This is an optimistic finding for those regions that are characterized by relatively low precipitation (Figure 3) and might be susceptible to desertification in the future.
It is obvious that annual precipitation trends are determined by winter (DJF) that demonstrates a similar pattern at the eastern Aegean Sea and western Greece (Figure 6a). Additionally, more grid points with significant trends at the Ionian Sea are presented for winter (Figure 6a). In spring (MAM) and summer (JJA), there are few points characterized by significant trends either unchanging or declining (Figure 6b,c). In autumn (SON), there are more points with significant trends compared with spring and summer but fewer than winter and limited at the southeastern Aegean Sea (Figure 6d). Therefore, winter seems to mostly determine the inter-annual trends of precipitation. The analysis resulted in declining trends of precipitation during the past 7 decades that are more pronounced over the wettest areas of Greece (i.e., western Greece and the eastern Aegean Sea as illustrated in Figure 3). This finding could be considered encouraging because these areas are not as vulnerable to drought as some drier Greek areas such as the region around Athens, the eastern Peloponnese, and eastern Crete. Nevertheless, the reduction of precipitation even at the wettest areas might have significant implications for ecosystems, agriculture, the economy, and society.
It is also important to investigate how the areal precipitation over the entire study area changes over time. In this context, Figure 7a demonstrates time series of annual areal precipitation over the study area. The most striking result to emerge from the 71-year time series is that the areal precipitation is not characterized by a linear inter-annual trend. In more detail, we can identify an increasing trend from 1950 to the late 1960s, followed by a declining trend until the late 1980s to the early 1990s and a relatively small increasing trend afterwards that gradually turns to an unchanging trend during the past decade. Overall, a 71-year declining Theil–Sen trend of −1.02 mm/yr was estimated for the 71-year period with Mann–Kendall significance equal to 93%. The overall inter-annual trend is not significant at the 95% level. This may be attributed to the increased nonlinearity of time series. Although the estimated trend did not reach 95% significance level, it is noteworthy that our study provides considerable insight into the impact of climate change on precipitation, which is not straightforward. The inter-annual variability of areal precipitation is also captured by the time series of anomalies. Precipitation anomalies were constructed by subtracting the 71-year average precipitation from annual precipitation values for each year (Figure 7b). In general, the 1950s and especially the 1960s and 1970s were characterized by high precipitation amounts across the study area; however, the 1980s and 1990s had lower ones. During the 2 most recent decades, i.e., the 2000s and 2010s, alternations between dry and wet years occurred. Weak increasing and unchanging phases can be also detected during the past 20 years.

3.3. GAM Results

Consequently, in order to identify significant linear and nonlinear inter-annual trends of precipitation, we fitted a total of 1395 models, one for each grid point. More than half of the grid points (732 from 1395) showed significant trends (p ≤ 0.05). R2 values for these models ranged from 0.06 to 0.66 with an average R2 of 0.46. Most grid points showed variable trends with precipitation following an increasing trend from the 1950s to the middle 1960s, to a decline until the middle 1980s and then an increase again until today (e.g., Figure 8). For some other areas (e.g., Chania and Rhodes, Figure 8) a declining nonlinear trend from the 1950s to the early–middle 1980s is apparent before a slight increase until 2020. Non-significant trends were mostly linear (Figure 11), as it was the trend for Athens that showed an increasing linear curve (Figure 8).
Regarding intra-annual variations, the majority of selected locations are characterized by a typical seasonal distribution, following alternations illustrated in Figure 9. Most of the areas have a dry summer (adding also late spring and early autumn), wet winter (adding also late autumn and early spring) and two transitional seasons, including sub-periods of autumn and spring. This distribution strongly depends on cyclonic and frontal activity at this area [9]. It is noteworthy that Drama, Thessaloniki and Alexandroupoli, which are cities in northern Greece, additionally present high precipitation amounts in late spring and early summer. These are explained by the frequent occurrence of convective storms there during this period.
The “whole region” model had an R2 of 0.65 and a significant trend (p < 0.001). The trend for the whole region (Figure 10) shows a highly variable trend with an increasing phase from the 1950s to the late 1960s, a decreasing period until the early 1990s and then again an increasing trend until 2020. However, the increasing precipitation during the past 3 decades has not managed to reach the levels of the period from the late 1950s to the early 1970s. This remains as a noteworthy issue for the coming years. Figure 10 also demonstrates the intra-annual variations of precipitation as represented by the “whole region” model, confirming the seasonal distribution shown in Figure 4a–d.
We also quantified the degree of nonlinear trends by using the effective degrees of freedom (edf), which reflects the nonlinearity of the fitted GAM curve [51]. Edf values close to 1 indicate a linear trend, whereas higher values show more complex and nonlinear trends. Figure 11 depicts the spatial distribution of significant (p ≤ 0.05) and nonlinear trends showing that areas of Western Greece, and the Ionian and Eastern Aegean are more likely to show significant and nonlinear trends (edf > 2.5). These findings agree with the results from the Theil–Sen trend analysis (Figure 5), although the analysis with GAMs revealed a notably higher number of cells with significant trends. This is attributed to the advantage of GAMs to better fit the data and deal with nonlinear trends.

4. Discussion

4.1. Variability and Trends of Precipitation in the Study Area

Our results corroborate previous studies that reported inter-annual trends of precipitation over the study area (e.g., [8,18,19,20,23]). For example, our study agrees with some findings from Feidas et al. [19], who found declining precipitation trends analyzing data from 24 Greek meteorological stations for the period from 1955 to 2001. This previous study also reported significant inter-annual trends of precipitation only for winter, which seems to mostly determine trends of annual precipitation in Greece over time. It is noteworthy that our study also provides considerable insight into the inter-decadal variabilities of precipitation, again substantiating the study of Feidas et al. [19]. They also stated that the decrease of precipitation during 1955–2001 is mostly attributed to the relatively drier period from the middle 1980s until 2001, which generally agrees with our findings. Our results are also in line with the study conducted by Philandras et al. [20]. They estimated declining precipitation trends across our study area for the period from 1951 to 2009, employing data from meteorological stations as well as lower-resolution gridded data. They reported significant declining trends for the rainy period (i.e., from October to March), that includes winter, more pronounced in western Greece, which is consistent with our findings. Our study is also in agreement with the study of Markonis et al. [8] highlighting that most of studied Greek regions (records from 136 stations) showed a decline in precipitation since 1950 and an increase since 1980, while they remained stable from the late 1990s to 2012. In addition, Hatzianastassiou et al. [23] reported an inter-annual variability of precipitation from 1979 to 2004, which largely fitted the one we presented in this study for the abovementioned period. They analyzed satellite-based data and found a decreasing trend from 1979 through the 1980s and an increase during the 1990s up to the early 2000s, which was followed by a decline up to 2004.
One of the innovative characteristics of our study is the use of ERA5 reanalysis precipitation data, which are consistent in space and time. Given the lack of a dense, continuous, and long-term network of meteorological stations in Greece, ERA5 reanalysis data can be a valuable basis to explore inter-annual precipitation variabilities even in ungauged areas. An additional advantage of our work is the long-term study period spanning 1950 to 2020. It is noteworthy that the study period includes the past 2 decades from 2000 to 2020. This is critical due to the growing impact of climate change on the spatiotemporal characteristics of precipitation during the past decades. It is worth mentioning that our study showed that precipitation was not characterized by a continuous declining trend from the 1950s up to 2020. It presented a small increasing trend during the past 2 decades, thus adding unexpected information in the research of inter-annual precipitation trends over Greece. It is also likely that a future continuation of the current increasing phase could potentially lead to precipitation levels of 1950 to the 1970s. In addition, we explored inter-annual trends of precipitation over Greece and neighboring areas, including sea areas, which are often excluded from precipitation trend analyses. Finally, we demonstrated the advantageous use of GAMs in analyzing inter-annual trends of precipitation data. In particular, we showed that GAMs can be employed to reveal hidden patterns in precipitation time series by using flexible and easy-to-apply functions with relatively high interpretability.

4.2. Possible Reasons of the Nonlinear Precipitation Variabilty over Time

The nonlinear variability of precipitation in Greece and surrounding areas is mostly determined by the general atmospheric circulation and large-scale climatic patterns that are affected by climate change over time. More specifically, the North Atlantic Oscillation (NAO), which is one of the main large-scale climatic patterns in the Northern Hemisphere, plays an important role in the long-term periodic variabilities of precipitation in Greece as highlighted by previous studies (e.g., [18,19,20,23,55]). NAO implies alternations of atmospheric pressure between the Azores high and the Icelandic low having either positive or negative phase (or index), while it is characterized by quasi-biennial to quasi-decadal and/or decadal time scales [23]. NAO impacts weather and climate conditions in various areas such as the Atlantic Ocean and Europe, causing strong precipitation variations even in the Mediterranean basin, as occurred, for example, during the dry period of the 1980s [56]. The declining precipitation trend in the 1980s, which was also evidenced by our analysis, was related to an increase in the NAO index [23]. On the other hand, the increasing precipitation trend in the 1990s, also identified by our study, was related to a decrease in the NAO index [23]. In general, precipitation trends in Greece during various periods seem to be anticorrelated with the NAO index as discussed by Feidas et al. [19] and Philandras et al. [20]. Except for NAO, studies have been conducted to investigate the effects of additional large-scale climatic patterns in parts of our study area (e.g., Greek Ionian Sea region [55]). These climatic patterns include the El Niño Southern Oscillation or ENSO, the East Atlantic or EA, the Scandinavian or SCAND, the East Atlantic–West Russian or EA–WR, and others (Kalimeris et al. [55] and references therein).

4.3. Implications of Precipitation Variability on Inland Freshwater Resources

The present findings have important implications for current and future freshwater availability, with particular focus set on the inland freshwater ecosystems and their delivered services. Several studies have reported declining river flows and changes in the water quantity during the past decades [57,58], but it remains unclear how reducing precipitation is linked with hydrological alterations. This is more prominent in the Mediterranean since river damming and water abstractions are major environmental problems that are responsible for changing flow patterns and reduced water quantity [59,60,61]. For instance, Mentzafou et al. [57] showed significant relationships between precipitation and discharge with similar fluctuation patterns for major Greek rivers but concluded that a more in-depth analysis that considers the water uses will reveal the actual causes of flow regime changes. Nevertheless, since our results showed small but significant declines of total precipitation for a considerably large share of the studied area, it becomes obvious that a decrease in water availability will impact both the anthropogenic water uses and the ecological integrity.

4.4. Necessity for Inter-Annual Analysis of Short-Term Extreme Precipitation

This study is a first step towards enhancing our understanding and interpreting of inter-annual precipitation trends over Greece focusing on annual and seasonal accumulated amounts. One of the major issues in the context of climate change in the Mediterranean area seems to be the change in frequency and intensity of heavy precipitation events [62]. Therefore, long-term analyses of short-scale precipitation are important to better explain how the large-scale climatic variabilities impact the spatiotemporal characteristics and the magnitude of precipitation extremes [15,17,27,63,64,65,66]. Furthermore, in order to quantify the potential impact of precipitation variability on the ecosystems, a more detailed and elaborate analytical approach of rainfall events is required that is based on the concept of individual rainfall episodes [67]. Particularly in the Mediterranean environments where precipitation shows high and irregular variability, the use of annual or monthly averages of precipitation might not be representative of the actual hydro-geomorphological processes [67,68,69]. Instead, precipitation intensity for short time scales (e.g., daily and hourly) might be more appropriate for assessing the impact on the water resources and their biotic components. Precipitation data at higher spatial resolution might also be more appropriate, especially in a mountainous country such as Greece.
In this context, the hourly ERA5-Land [70] reanalysis precipitation dataset masked over the land at a native horizontal resolution of 9 km × 9 km might be very useful. Just as the ERA5 data, ERA5-Land data were recently produced by the ECMWF and are freely available by the Copernicus-C3S platform [35]. A main advantage of ERA5-Land, compared to ERA5, is the higher horizontal resolution. Thus, considering the better representation of orography, ERA5-Land could facilitate a more accurate analysis of inter-annual trends of precipitation in a future study, calculating Theil–Sen trends and Mann–Kendall significance as well as executing GAMs. Moreover, an improved accuracy of hourly or daily ERA5-Land precipitation data can help to investigate inter-annual changes in the intensity and frequency of extreme precipitation events that often cause flash floods, having critical implications for freshwater ecosystems, the economy, and society [71,72,73,74,75,76,77,78]. It is also interesting that such future work using ERA5-Land data could facilitate applications of the Indicators of Hydrologic Alteration (IHA) methodology in river ecosystems to explore their ecological integrity and functioning [60].

5. Conclusions

This work presents a detailed overview of long-term trends of precipitation for the entire territory of Greece and neighboring areas, spanning 7 decades from 1950 to 2020. To this aim, we used ERA5 monthly averaged precipitation reanalysis data from January 1950 to December 2020. At first, we estimated Theil–Sen linear trends and Mann–Kendall significance considering annual precipitation time series for each ERA5 grid point and the areal precipitation over the study area. Consequently, we used GAMs to explore and analyze nonlinear inter-annual variabilities of precipitation.
Our results show a spatially variable pattern of changes over time. Significant Theil–Sen declining linear trends were limited mostly at the regions of western Greece and the eastern Aegean Sea. Declining linear trends were also estimated for winter more or less at the same areas, however, trends for spring, summer and autumn were not significant in the majority of areas. Overall, the results indicate large inter-decadal fluctuations of areal precipitation over the study area. The analysis of areal precipitation resulted to a declining linear trend, but significant at a 93% significance level. GAMs highlight that the trends are generally nonlinear. We identified significant nonlinear changes for more than half of the studied area. Both nonparametric and modelling analysis showed a complex pattern of precipitation trends for most of Greece. To summarize, overall precipitation over Greece was not characterized by a linear trend during the past 7 decades. Overall precipitation first increased until the late 1960s, consequently decreased until the early 1990s and then increased until 2020 with a relatively small rate.
We believe that such information can be exploited by other scientists for climate and interdisciplinary studies as well as by decision-makers and civil protection who will have to take into consideration precipitation variabilities when they make management plans. For example, our study sets a basis for long-term hydrological studies such as that of Mentzafou et al. [78]. Nevertheless, our study has identified some research issues in need of further examination. One of the most critical questions is whether there are inter-decadal variabilities of short-term extreme precipitation amounts, except for total annual and seasonal ones. In this context, the findings of this study would support in the future a trend analysis of the magnitude and frequency of extreme precipitation events during the past 7 decades. Such a work might unveil significant impacts of climate change on the characteristics of extreme precipitation having crucial implications on society and ecosystems.

Author Contributions

Conceptualization, G.V., K.S., G.P., A.P.; methodology, G.V., K.S., G.P., A.P.; formal analysis, G.V., K.S., G.P.; data curation, G.V.; visualization, G.V., K.S., G.P.; investigation, G.V., K.S.; software, G.V., K.S., G.P., A.P., E.D.; resources, A.P., E.D.; writing—original draft preparation, G.V., K.S., G.P., A.P.; writing—review and editing, G.V., K.S., G.P., Y.P., I.P., P.K., A.P., E.D.; supervision, A.P., E.D. All authors have read and agreed to the published version of the manuscript.

Funding

This research received no external funding.

Institutional Review Board Statement

Not applicable.

Informed Consent Statement

Not applicable.

Data Availability Statement

The ERA5 climate reanalysis dataset was generated using Copernicus Climate Change Service Information [2021]. ERA5 data used in this study for the period from 1979 to 2020 are available at: https://cds.climate.copernicus.eu/cdsapp#!/dataset/reanalysis-era5-single-levels-monthly-means?tab=overview (accessed on 24 December 2021), and respectively, for the period from 1950 to 1978 at: https://cds.climate.copernicus.eu/cdsapp#!/dataset/reanalysis-era5-single-levels-monthly-means-preliminary-back-extension?tab=overview, accessed on 24 December 2021.

Acknowledgments

We gratefully acknowledge Copernicus Climate Change Service for the provision of ERA5 climate reanalysis data that were used in this study.

Conflicts of Interest

The authors declare no conflict of interest.

References

  1. Sellami, H.; Benabdallah, S.; La Jeunesse, I.; Vanclooster, M. Quantifying hydrological responses of small Mediterranean catchments under climate change projections. Sci. Total Environ. 2016, 543, 924–936. [Google Scholar] [CrossRef]
  2. Stefanidis, K.; Panagopoulos, Y.; Mimikou, M. Response of a multi-stressed Mediterranean river to future climate and socio-economic scenarios. Sci. Total Environ. 2018, 627, 756–769. [Google Scholar] [CrossRef]
  3. Papadaki, C.; Soulis, K.; Muñoz-Mas, R.; Martinez-Capel, F.; Zogaris, S.; Ntoanidis, L.; Dimitriou, E. Potential impacts of climate change on flow regime and fish habitat in mountain rivers of the south-western Balkans. Sci. Total Environ. 2016, 540, 418–428. [Google Scholar] [CrossRef] [PubMed] [Green Version]
  4. Montaldo, N.; Oren, R. Changing Seasonal Rainfall Distribution with Climate Directs Contrasting Impacts at Evapotranspiration and Water Yield in the Western Mediterranean Region. Earth’s Future 2018, 6, 841–856. [Google Scholar] [CrossRef]
  5. Brogli, R.; Sørland, S.L.; Kröner, N.; Schär, C. Causes of future Mediterranean precipitation decline depend on the season. Environ. Res. Lett. 2019, 14, 114017. [Google Scholar] [CrossRef]
  6. Giannakopoulos, C.; Kostopoulou, E.; Varotsos, K.V.; Tziotziou, K.; Plitharas, A. An integrated assessment of climate change impacts for Greece in the near future. Reg. Environ. Chang. 2011, 11, 829–843. [Google Scholar] [CrossRef] [Green Version]
  7. Bucak, T.; Trolle, D.; Tavşanoğlu, N.; Çakıroğlu, A.I.; Özen, A.; Jeppesen, E.; Beklioğlu, M. Modeling the effects of climatic and land use changes on phytoplankton and water quality of the largest Turkish freshwater lake: Lake Beyşehir. Sci. Total Environ. 2017, 621, 802–816. [Google Scholar] [CrossRef]
  8. Markonis, Y.; Batelis, S.C.; Dimakos, Y.; Moschou, E.; Koutsoyiannis, D. Temporal and spatial variability of rainfall over Greece. Theor. Appl. Climatol. 2017, 130, 217–232. [Google Scholar] [CrossRef]
  9. Papadopoulos, A.; Varlas, G. Weather Systems Affecting the Meteorological Conditions over the Aegean Sea. In The Handbook of Environmental Chemistry; Springer: Berlin/Heidelberg, Germany, 2020. [Google Scholar] [CrossRef]
  10. Loukas, A.; Vasiliades, L.; Dalezios, N.; Domenikiotis, C. Rainfall-frequency mapping for Greece. Phys. Chem. Earth Part B Hydrol. Ocean. Atmos. 2001, 26, 669–674. [Google Scholar] [CrossRef]
  11. Maheras, P.; Tolika, K.; Anagnostopoulou, C.; Vafiadis, M.; Patrikas, I.; Flocas, H. On the relationships between circulation types and changes in rainfall variability in Greece. Int. J. Climatol. 2004, 24, 1695–1712. [Google Scholar] [CrossRef]
  12. Stefanidis, K.; Varlas, G.; Vourka, A.; Papadopoulos, A.; Dimitriou, E. Delineating the relative contribution of climate related variables to chlorophyll-a and phytoplankton biomass in lakes using the ERA5-Land climate reanalysis data. Water Res. 2021, 196, 117053. [Google Scholar] [CrossRef] [PubMed]
  13. Livada, I.; Charalambous, G.; Assimakopoulos, M.N. Spatial and temporal study of precipitation characteristics over Greece. Theor. Appl. Climatol. 2008, 93, 45–55. [Google Scholar] [CrossRef]
  14. Tolika, K.; Maheras, P. Spatial and temporal characteristics of wet spells in Greece. Theor. Appl. Climatol. 2005, 81, 71–85. [Google Scholar] [CrossRef]
  15. Karagiannidis, A.F.; Karacostas, T.; Maheras, P.; Makrogiannis, T. Climatological aspects of extreme precipitation in Europe, related to mid-latitude cyclonic systems. Theor. Appl. Climatol. 2011, 107, 165–174. [Google Scholar] [CrossRef]
  16. Amanatidis, G.T.; Paliatsos, A.G.; Repapis, C.C.; Bartzis, J.G. Decreasing precipitation trend in the Marathon area, Greece. Int. J. Climatol. 1993, 13, 191–201. [Google Scholar] [CrossRef]
  17. Nastos, P.T.; Zerefos, C.S. On extreme daily precipitation totals at Athens, Greece. Adv. Geosci. 2007, 10, 59–66. [Google Scholar] [CrossRef] [Green Version]
  18. Xoplaki, E.; González-Rouco, J.F.; Luterbacher, J.; Wanner, H. Wet season Mediterranean precipitation variability: Influence of large-scale dynamics and trends. Clim. Dyn. 2004, 23, 63–78. [Google Scholar] [CrossRef] [Green Version]
  19. Feidas, H.; Noulopoulou, C.; Makrogiannis, T.; Bora-Senta, E. Trend analysis of precipitation time series in Greece and their relationship with circulation using surface and satellite data: 1955–2001. Arch. Meteorol. Geophys. Bioclimatol. Ser. B 2006, 87, 155–177. [Google Scholar] [CrossRef]
  20. Philandras, C.M.; Nastos, P.T.; Kapsomenakis, J.; Douvis, K.C.; Tselioudis, G.; Zerefos, C.S. Long term precipitation trends and variability within the Mediterranean region. Nat. Hazards Earth Syst. Sci. 2011, 11, 3235–3250. [Google Scholar] [CrossRef] [Green Version]
  21. Pnevmatikos, J.D.; Katsoulis, B.D. The changing rainfall regime in Greece and its impact on climatological means. Meteorol. Appl. 2006, 13, 331–345. [Google Scholar] [CrossRef]
  22. Mavromatis, T.; Voulanas, D. Evaluating ERA-Interim, Agri4Cast, and E-OBS gridded products in reproducing spatiotemporal characteristics of precipitation and drought over a data poor region: The Case of Greece. Int. J. Climatol. 2021, 41, 2118–2136. [Google Scholar] [CrossRef]
  23. Hatzianastassiou, N.; Katsoulis, B.; Pnevmatikos, J.; Antakis, V. Spatial and Temporal Variation of Precipitation in Greece and Surrounding Regions Based on Global Precipitation Climatology Project Data. J. Clim. 2008, 21, 1349–1370. [Google Scholar] [CrossRef]
  24. Katsafados, P.; Kalogirou, S.; Papadopoulos, A.; Korres, G. Mapping long-term atmospheric variables over Greece. J. Maps 2012, 8, 181–184. [Google Scholar] [CrossRef] [Green Version]
  25. Katsafados, P.; Varlas, G.; Papadopoulos, A.; Spyrou, C.; Korres, G. Assessing the Implicit Rain Impact on Sea State during Hurricane Sandy (2012). Geophys. Res. Lett. 2018, 45, 12015–12022. [Google Scholar] [CrossRef]
  26. Varlas, G.; Vervatis, V.; Spyrou, C.; Papadopoulou, E.; Papadopoulos, A.; Katsafados, P. Investigating the impact of atmosphere–wave–ocean interactions on a Mediterranean tropical-like cyclone. Ocean Model. 2020, 153, 101675. [Google Scholar] [CrossRef]
  27. Mastrantonas, N.; Herrera-Lormendez, P.; Magnusson, L.; Pappenberger, F.; Matschullat, J. Extreme precipitation events in the Mediterranean: Spatiotemporal characteristics and connection to large-scale atmospheric flow patterns. Int. J. Climatol. 2020, 41, 2710–2728. [Google Scholar] [CrossRef]
  28. De Luca, P.; Messori, G.; Faranda, D.; Ward, P.J.; Coumou, D. Compound warm–dry and cold–wet events over the Mediterranean. Earth Syst. Dyn. 2020, 11, 793–805. [Google Scholar] [CrossRef]
  29. Hersbach, H.; Bell, B.; Berrisford, P.; Hirahara, S.; Horanyi, A.; Muñoz-Sabater, J.; Nicolas, J.; Peubey, C.; Radu, R.; Schepers, D.; et al. The ERA5 global reanalysis. Q. J. R. Meteorol. Soc. 2020, 146, 1999–2049. [Google Scholar] [CrossRef]
  30. Pelosi, A.; Terribile, F.; D’Urso, G.; Chirico, G.B. Comparison of ERA5-Land and UERRA MESCAN-SURFEX Reanalysis Data with Spatially Interpolated Weather Observations for the Regional Assessment of Reference Evapotranspiration. Water 2020, 12, 1669. [Google Scholar] [CrossRef]
  31. Liu, J.; Hagan, D.F.T.; Liu, Y. Global Land Surface Temperature Change (2003–2017) and Its Relationship with Climate Drivers: AIRS, MODIS, and ERA5-Land Based Analysis. Remote Sens. 2020, 13, 44. [Google Scholar] [CrossRef]
  32. Wu, Z.; Feng, H.; He, H.; Zhou, J.; Zhang, Y. Evaluation of Soil Moisture Climatology and Anomaly Components Derived From ERA5-Land and GLDAS-2.1 in China. Water Resour. Manag. 2021, 35, 629–643. [Google Scholar] [CrossRef]
  33. Galanaki, E.; Emmanouil, G.; Lagouvardos, K.; Kotroni, V. Long-Term Patterns and Trends of Shortwave Global Irradiance over the Euro-Mediterranean Region. Atmosphere 2021, 12, 1431. [Google Scholar] [CrossRef]
  34. Zhang, W.; Villarini, G.; Scoccimarro, E.; Napolitano, F. Examining the precipitation associated with medicanes in the high-resolution ERA-5 reanalysis data. Int. J. Climatol. 2020, 41, E126–E132. [Google Scholar] [CrossRef]
  35. Copernicus Climate Change Service. Access to ERA5 Reanalysis Data. Available online: https://climate.copernicus.eu/climate-reanalysis (accessed on 24 December 2021).
  36. Bell, B.; Hersbach, H.; Simmons, A.; Berrisford, P.; Dahlgren, P.; Horányi, A.; Muñoz-Sabater, J.; Nicolas, J.; Radu, R.; Schepers, D.; et al. The ERA5 global reanalysis: Preliminary extension to 1950. Q. J. R. Meteorol. Soc. 2021, 147, 4186–4227. [Google Scholar] [CrossRef]
  37. Stefanidis, K.; Varlas, G.; Papadopoulos, A.; Dimitriou, E. Four Decades of Surface Temperature, Precipitation, and Wind Speed Trends over Lakes of Greece. Sustainability 2021, 13, 9908. [Google Scholar] [CrossRef]
  38. NASA/METI/AIST/Japan Space Systems; U.S./Japan ASTER Science Team. ASTER Global Digital Elevation Model V003 [Dataset]. NASA EOSDIS Land Processes DAAC. 2019. Available online: https://search.earthdata.nasa.gov (accessed on 24 December 2021).
  39. Theil, H. A Rank-Invariant Method of Linear and Polynomial Regression Analysis I, II and III. In Proceedings of the Section of Sciences, Amsterdam, The Netherlands, 1 January 1950; pp. 386–392. [Google Scholar]
  40. Sen, P.K. Estimates of the regression coefficient based on Kendall’s Tau. J. Am. Stat. Assoc. 1968, 63, 1379–1389. [Google Scholar] [CrossRef]
  41. Mann, H.B. Non-Parametric Test Against Trend. Econometrica 1945, 13, 245–259. [Google Scholar] [CrossRef]
  42. Kendall, M.G. Rank Correlation Methods; Griffin: London, UK, 1975; ISBN 978-0-85264-199-6. [Google Scholar]
  43. Gilbert, R. Statistical Methods for Environmental Pollution Monitoring; Wiley: New York, NY, USA, 1987. [Google Scholar]
  44. The NCAR Command Language (Version 6.4) [Software], UCAR/NCAR/CISL/TDD, Boulder, CO, USA. 2017. Available online: https://Www.Ncl.Ucar.Edu/Citation.Shtml (accessed on 24 December 2021).
  45. NCL. Theil-Sen and Mann-Kendall Scripts. Available online: https://www.ncl.ucar.edu/Document/Functions/Built-in/trend_manken.shtml (accessed on 24 December 2021).
  46. Hastie, T.; Tibshirani, R. Generalized Additive Models. Stat. Sci. 1986, 1, 297–310. [Google Scholar] [CrossRef]
  47. Christ, A. Mixed Effects Models and Extensions in Ecology with R. J. Stat. Softw. 2009, 32, 13–29. [Google Scholar] [CrossRef] [Green Version]
  48. Pedersen, E.J.; Miller, D.L.; Simpson, G.L.; Ross, N. Hierarchical generalized additive models in ecology: An introduction with mgcv. PeerJ 2019, 7, e6876. [Google Scholar] [CrossRef] [PubMed] [Green Version]
  49. Guisan, A.; Edwards, T.C.; Hastie, T. Generalized linear and generalized additive models in studies of species distributions: Setting the scene. Ecol. Model. 2002, 157, 89–100. [Google Scholar] [CrossRef] [Green Version]
  50. Hastie, T.J.; Tibshirani, R.J. Generalized Additive Models; Chapman and Hall: London, UK, 2017; ISBN 9781351445979. [Google Scholar]
  51. Wood, S.N. Generalized Additive Models: An Introduction with R, 2nd ed.; CRC Press: Boca Raton, FL, USA, 2017; ISBN 9781498728348. [Google Scholar]
  52. Mariolopoulos, E.; Karapiperis, L. Rainfall in Greece; National Printing House: Athens, Greece, 1955. (In Greek) [Google Scholar]
  53. Gofa, F.; Mamara, A.; Anadranistakis, M.; Flocas, H. Developing Gridded Climate Data Sets of Precipitation for Greece Based on Homogenized Time Series. Climate 2019, 7, 68. [Google Scholar] [CrossRef] [Green Version]
  54. HNMS. Climatic Atlas of Greece. Available online: http://climatlas.hnms.gr/sdi/ (accessed on 24 December 2021).
  55. Kalimeris, A.; Ranieri, E.; Founda, D.; Norrant, C. Variability modes of precipitation along a Central Mediterranean area and their relations with ENSO, NAO, and other climatic patterns. Atmos. Res. 2017, 198, 56–80. [Google Scholar] [CrossRef]
  56. Hurrell, J.W. Decadal Trends in the North Atlantic Oscillation: Regional Temperatures and Precipitation. Science 1995, 269, 676–679. [Google Scholar] [CrossRef] [Green Version]
  57. Mentzafou, A.; Dimitriou, E.; Papadopoulos, A. Long-Term Hydrologic Trends in the Main Greek Rivers: A Statistical Approach. In Handbook of Environmental Chemistry; Springer: Berlin/Heidelberg, Germany, 2018; Volume 59, pp. 129–165. [Google Scholar]
  58. Masseroni, D.; Camici, S.; Cislaghi, A.; Vacchiano, G.; Massari, C.; Brocca, L. The 63-year changes in annual streamflow volumes across Europe with a focus on the Mediterranean basin. Hydrol. Earth Syst. Sci. 2021, 25, 5589–5601. [Google Scholar] [CrossRef]
  59. De Jalón, S.G.; del Tánago, M.G.; de Jalón, D.G. A new approach for assessing natural patterns of flow variability and hydrological alterations: The case of the Spanish rivers. J. Environ. Manag. 2018, 233, 200–210. [Google Scholar] [CrossRef]
  60. Stefanidis, K.; Panagopoulos, Y.; Psomas, A.; Mimikou, M. Assessment of the natural flow regime in a Mediterranean river impacted from irrigated agriculture. Sci. Total Environ. 2016, 573, 1492–1502. [Google Scholar] [CrossRef]
  61. Panagopoulos, Y.; Stefanidis, K.; Sanchez, M.F.; Weiland, F.S.; Van Beek, R.; Venohr, M.; Globevnik, L.; Mimikou, M.; Birk, S. Pan-European Calculation of Hydrologic Stress Metrics in Rivers: A First Assessment with Potential Connections to Ecological Status. Water 2019, 11, 703. [Google Scholar] [CrossRef] [Green Version]
  62. Cardell, M.F.; Amengual, A.; Romero, R.; Ramis, C. Future extremes of temperature and precipitation in Europe derived from a combination of dynamical and statistical approaches. Int. J. Climatol. 2020, 40, 4800–4827. [Google Scholar] [CrossRef]
  63. Zittis, G.; Bruggeman, A.; Lelieveld, J. Revisiting future extreme precipitation trends in the Mediterranean. Weather Clim. Extremes 2021, 34, 100380. [Google Scholar] [CrossRef]
  64. Fowler, H.J.; Lenderink, G.; Prein, A.F.; Westra, S.; Allan, R.P.; Ban, N.; Barbero, R.; Berg, P.; Blenkinsop, S.; Do, H.X.; et al. Anthropogenic intensification of short-duration rainfall extremes. Nat. Rev. Earth Environ. 2021, 2, 107–122. [Google Scholar] [CrossRef]
  65. Kioutsioukis, I.; Melas, D.; Zanis, P. Statistical downscaling of daily precipitation over Greece. Int. J. Climatol. 2007, 28, 679–691. [Google Scholar] [CrossRef]
  66. Toreti, A.; Xoplaki, E.; Maraun, D.; Kuglitsch, F.G.; Wanner, H.; Luterbacher, J. Characterisation of extreme winter precipitation in Mediterranean coastal sites and associated anomalous atmospheric circulation patterns. Nat. Hazards Earth Syst. Sci. 2010, 10, 1037–1050. [Google Scholar] [CrossRef]
  67. Camarasa-Belmonte, A.M.; Rubio, M.; Salas, J. Rainfall events and climate change in Mediterranean environments: An alarming shift from resource to risk in Eastern Spain. Nat. Hazards 2020, 103, 423–445. [Google Scholar] [CrossRef]
  68. Borga, M.; Stoffel, M.; Marchi, L.; Marra, F.; Jakob, M. Hydrogeomorphic response to extreme rainfall in headwater systems: Flash floods and debris flows. J. Hydrol. 2014, 518, 194–205. [Google Scholar] [CrossRef]
  69. Camarasa-Belmonte, A.; Soriano, J. Empirical study of extreme rainfall intensity in a semi-arid environment at different time scales. J. Arid Environ. 2014, 100–101, 63–71. [Google Scholar] [CrossRef]
  70. Muñoz-Sabater, J.; Dutra, E.; Agustí-Panareda, A.; Albergel, C.; Arduini, G.; Balsamo, G.; Boussetta, S.; Choulga, M.; Harrigan, S.; Hersbach, H.; et al. ERA5-Land: A state-of-the-art global reanalysis dataset for land applications. Earth Syst. Sci. Data 2021, 13, 4349–4383. [Google Scholar] [CrossRef]
  71. Diakakis, M. Have flood mortality qualitative characteristics changed during the last decades? The case study of Greece. Environ. Hazards 2016, 15, 148–159. [Google Scholar] [CrossRef]
  72. Papaioannou, G.; Varlas, G.; Terti, G.; Papadopoulos, A.; Loukas, A.; Panagopoulos, Y.; Dimitriou, E. Flood Inundation Mapping at Ungauged Basins Using Coupled Hydrometeorological–Hydraulic Modelling: The Catastrophic Case of the 2006 Flash Flood in Volos City, Greece. Water 2019, 11, 2328. [Google Scholar] [CrossRef] [Green Version]
  73. Varlas, G.; Anagnostou, M.N.; Spyrou, C.; Papadopoulos, A.; Kalogiros, J.; Mentzafou, A.; Michaelides, S.; Baltas, E.; Karymbalis, E.; Katsafados, P. A Multi-Platform Hydrometeorological Analysis of the Flash Flood Event of 15 November 2017 in Attica, Greece. Remote Sens. 2018, 11, 45. [Google Scholar] [CrossRef] [Green Version]
  74. Kanellopoulos, T.D.; Karageorgis, A.P.; Kikaki, A.; Chourdaki, S.; Hatzianestis, I.; Vakalas, I.; Hatiris, G.-A. The impact of flash-floods on the adjacent marine environment: The case of Mandra and Nea Peramos (November 2017), Greece. J. Coast. Conserv. 2020, 24, 56. [Google Scholar] [CrossRef]
  75. Borga, M.; Anagnostou, E.; Blöschl, G.; Creutin, J.-D. Flash flood forecasting, warning and risk management: The HYDRATE project. Environ. Sci. Policy 2011, 14, 834–844. [Google Scholar] [CrossRef]
  76. Papagiannaki, K.; Kotroni, V.; Lagouvardos, K.; Ruin, I.; Bezes, A. Urban Area Response to Flash Flood–Triggering Rainfall, Featuring Human Behavioral Factors: The Case of 22 October 2015 in Attica, Greece. Weather. Clim. Soc. 2017, 9, 621–638. [Google Scholar] [CrossRef]
  77. Terti, G.; Ruin, I.; Gourley, J.J.; Kirstetter, P.; Flamig, Z.; Blanchet, J.; Arthur, A.; Anquetin, S. Toward Probabilistic Prediction of Flash Flood Human Impacts. Risk Anal. 2017, 39, 140–161. [Google Scholar] [CrossRef] [PubMed]
  78. Mentzafou, A.; Varlas, G.; Dimitriou, E.; Papadopoulos, A.; Pytharoulis, I.; Katsafados, P. Modeling the Effects of Anthropogenic Land Cover Changes to the Main Hydrometeorological Factors in a Regional Watershed, Central Greece. Climate 2019, 7, 129. [Google Scholar] [CrossRef] [Green Version]
Figure 3. Spatial distribution of average annual precipitation (mm) for the period 1950–2020.
Climate 10 00012 g003
Figure 4. Spatial distribution of average precipitation (mm) for (a) winter (December, January, and February; DJF); (b) spring (March, April, and May; MAM); (c) summer (June, July and August; JJA); and (d) autumn (September, October and November; SON) for the period 1950–2020.
Climate 10 00012 g004
Figure 5. Spatial distribution of Theil–Sen trends for annual precipitation (mm/yr) during the period 1950–2020. Dots on maps indicate significant trends at the 95% significance level.
Climate 10 00012 g005
Figure 6. Spatial distribution of Theil–Sen trends for precipitation (mm/yr) in (a) winter (DJF), (b) spring (MAM), (c) summer (JJA), and (d) autumn (SON) for the period 1950–2020. Dots on maps indicate significant trends at the 95% significance level.
Climate 10 00012 g006
Figure 7. (a) Time series from 1950 to 2020 of annual areal precipitation across the study area. Theil–Sen trend, trend line, and Mann–Kendall significance are also demonstrated; (b) Same as (a) but for precipitation anomalies with 1950–2020 average precipitation used as reference.
Climate 10 00012 g007
Figure 8. Fitted GAM trends to monthly precipitation (mm) for 12 selected grid points near Greek cities. Note that the 12 illustrated points are not exactly at the locations of cities. City names are used for convenience. The diagrams have different y-axis scale to better present the temporal variabilities of precipitation for each location. The shaded area represents the 95% confidence intervals. GAM results for the 11 of 12 cities illustrated are significant (p ≤ 0.05), except for Athens in the last diagram.
Climate 10 00012 g008
Figure 9. Similar to Figure 8 for fitted intra-annual variation of monthly precipitation (mm). Some negative precipitation values in 95% confidence intervals are not considered as realistic, as they were algorithmically produced by the fitting of GAM.
Climate 10 00012 g009
Figure 10. Fitted GAM inter-annual trend and intra-annual variation to monthly areal precipitation (mm) over the study area. The shaded area represents the 95% confidence intervals.
Climate 10 00012 g010
Figure 11. Spatial distribution of GAM-derived effective degrees of freedom. Values close to 1 indicate linear trends. Higher values (>2) indicate nonlinear trends. Dots represent 95% confidence level.
Climate 10 00012 g011
Publisher’s Note: MDPI stays neutral with regard to jurisdictional claims in published maps and institutional affiliations.

