
Remarkable Resilience of Forest Structure and Biodiversity Following Fire in the Peri-Urban Bushland of Sydney, Australia

 , , , ,
Abstract
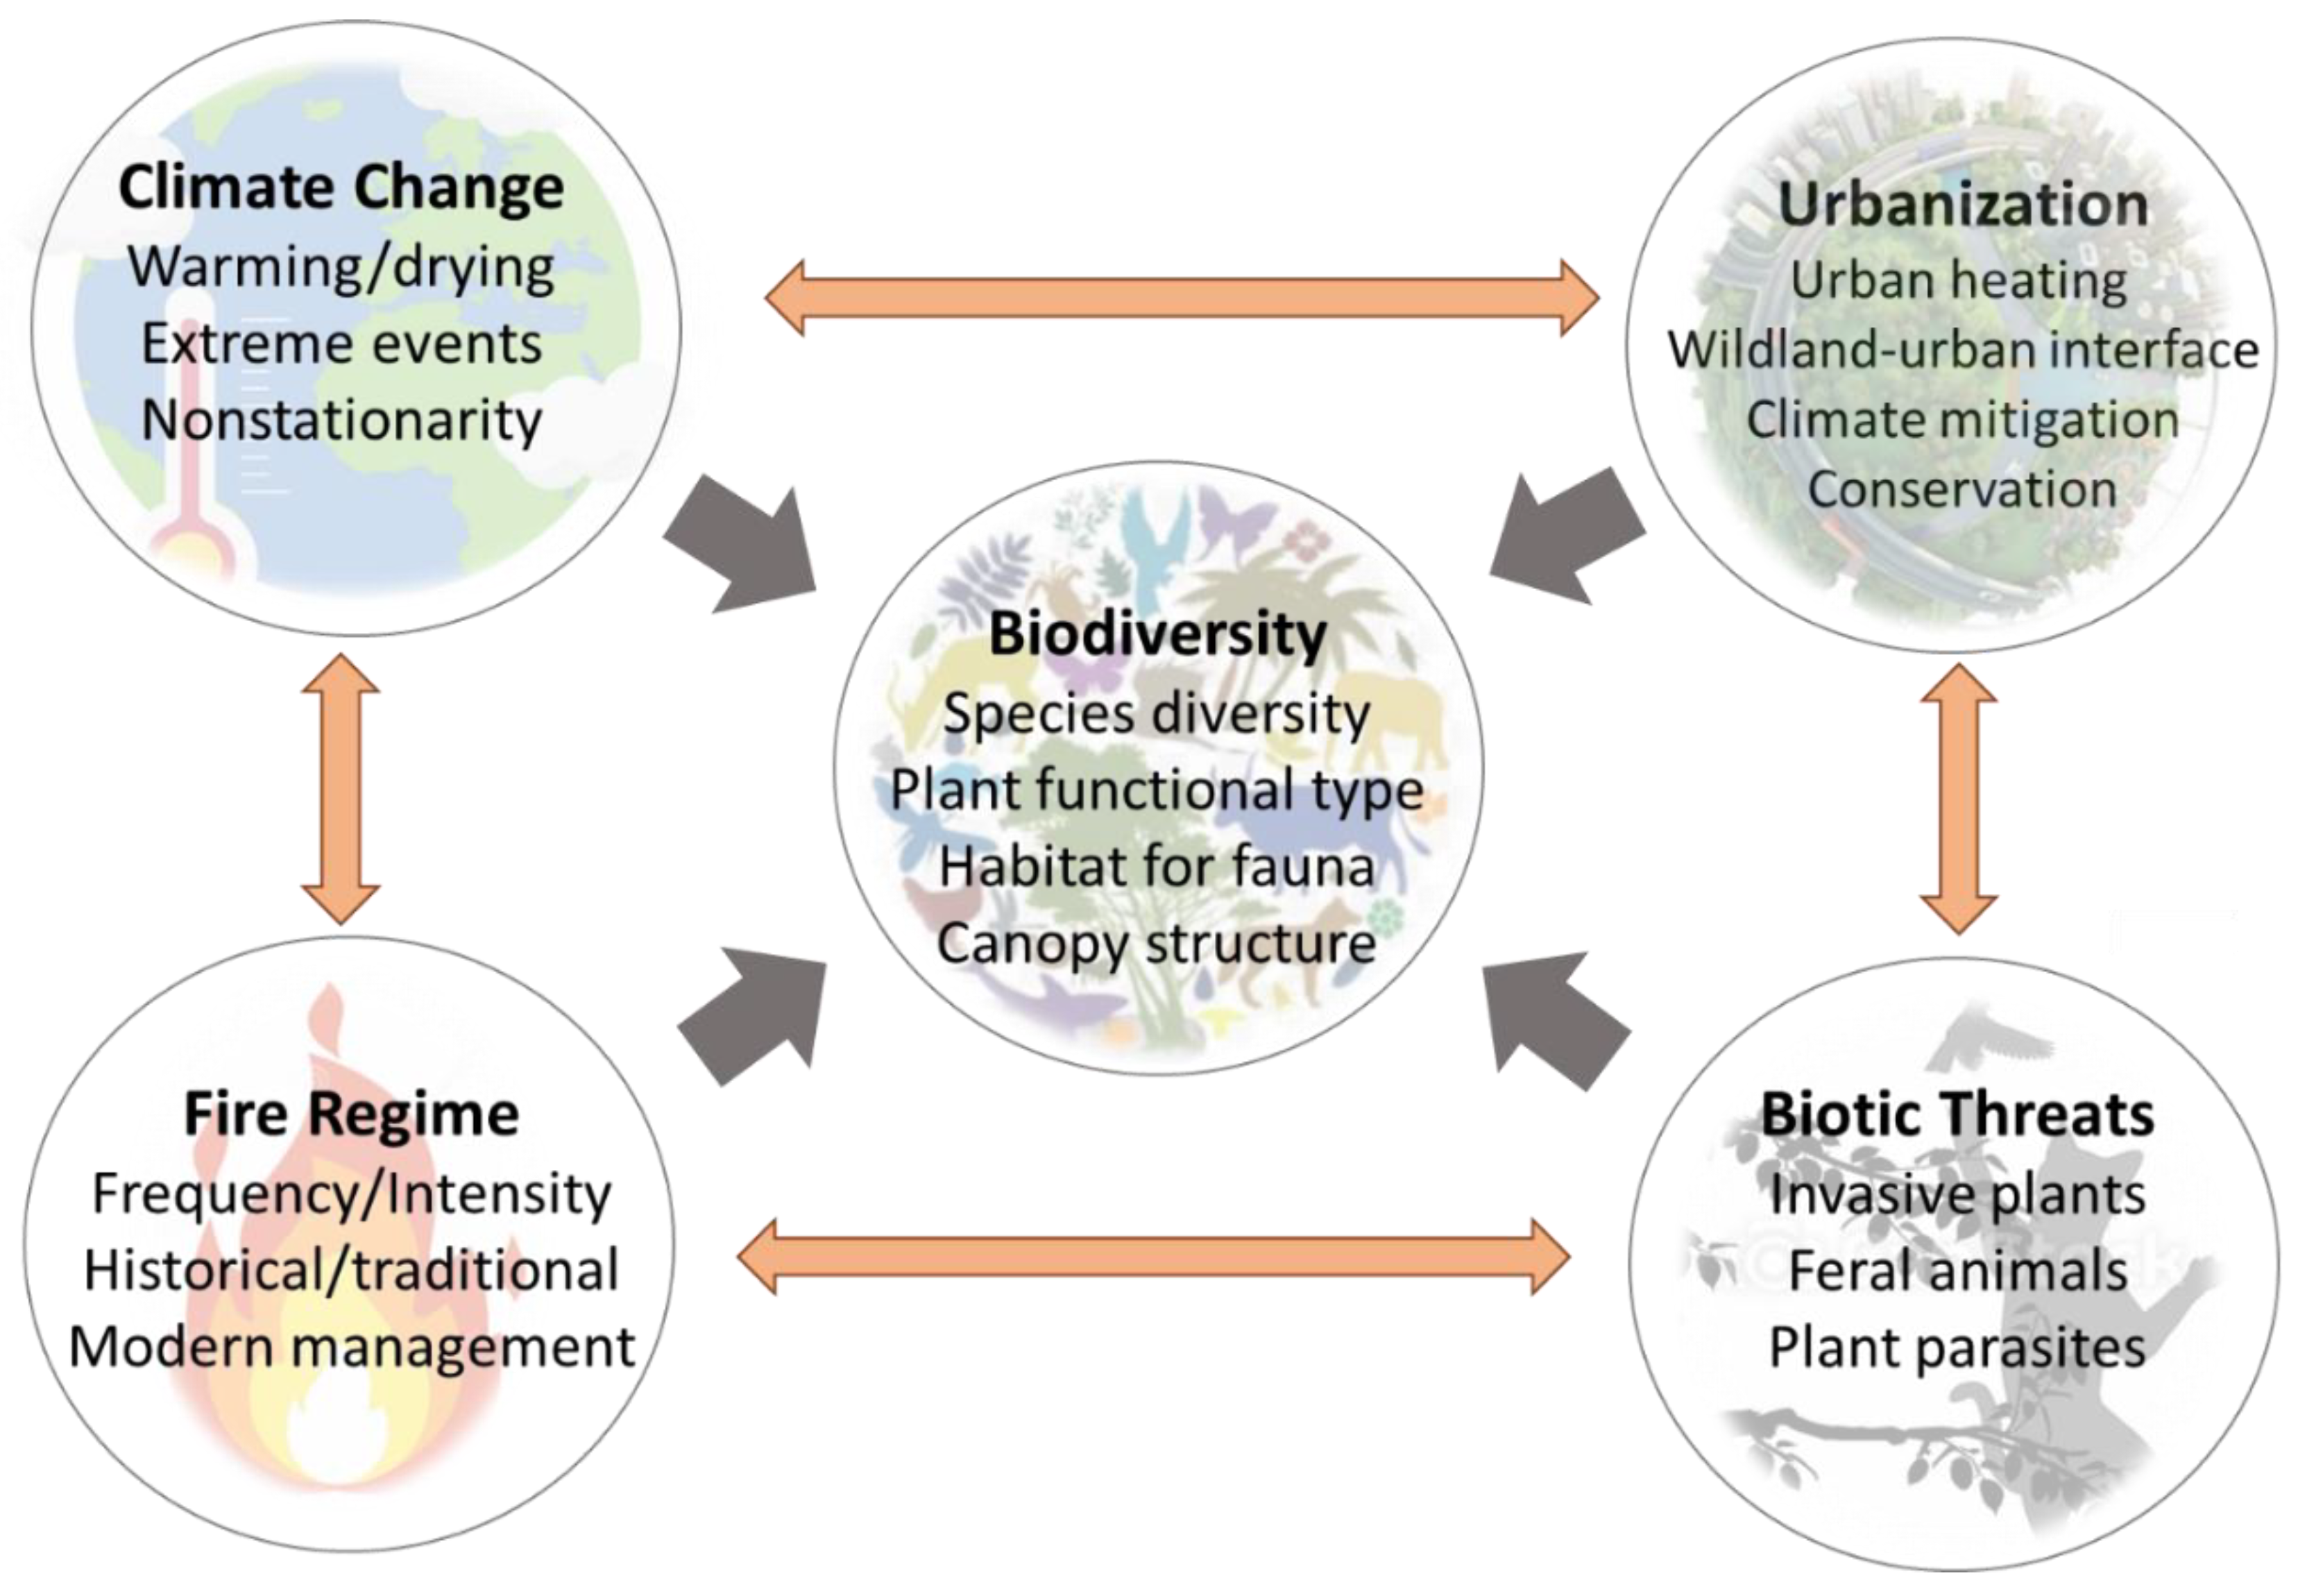
:1. Introduction
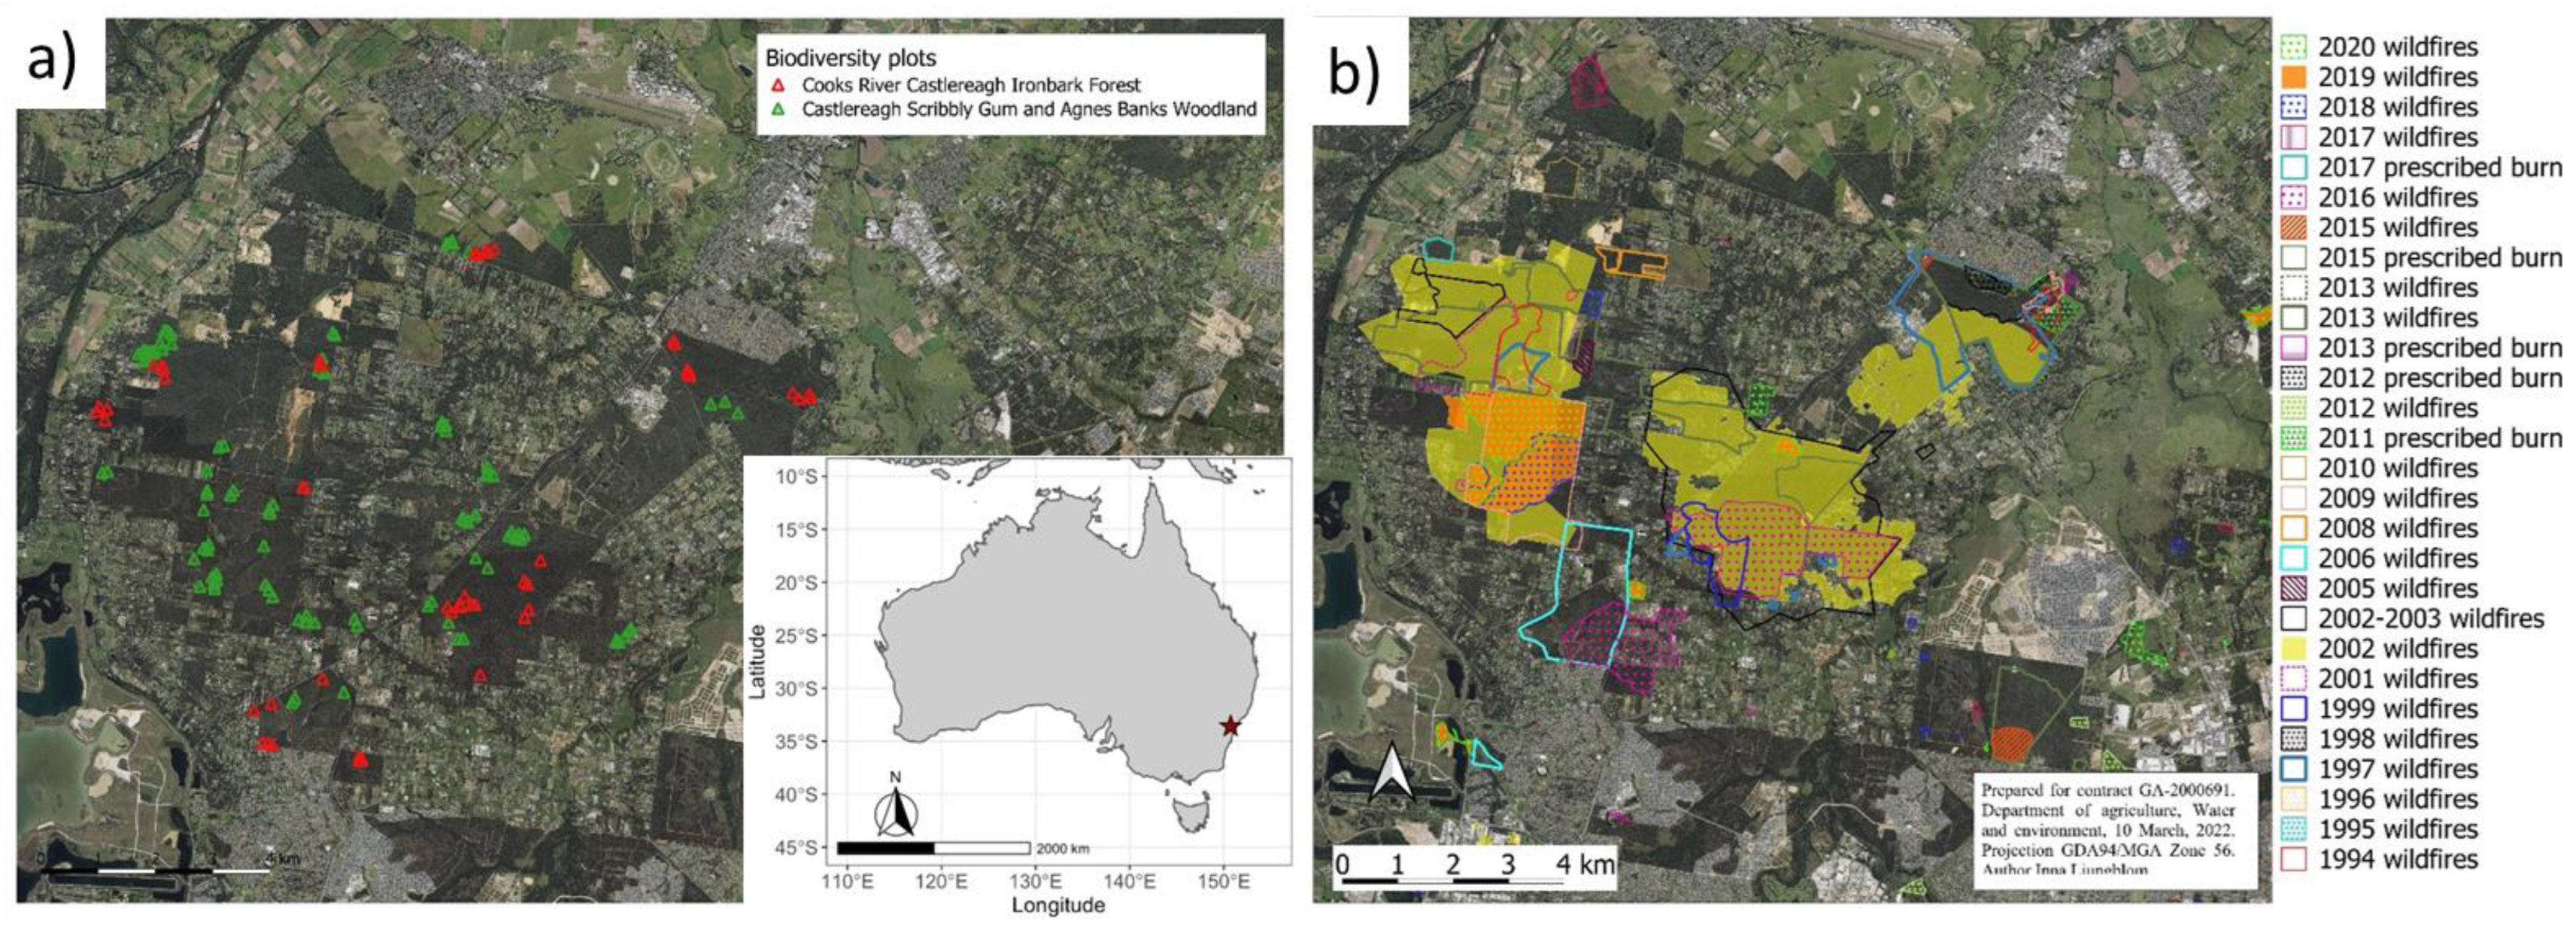
2. Study Area
3. Methods
3.1. Study Sites
3.2. Disturbance Histories
3.3. Biodiversity and Habitat Inventories
3.4. Biodiversity Metrics
3.5. Leaf Area Index
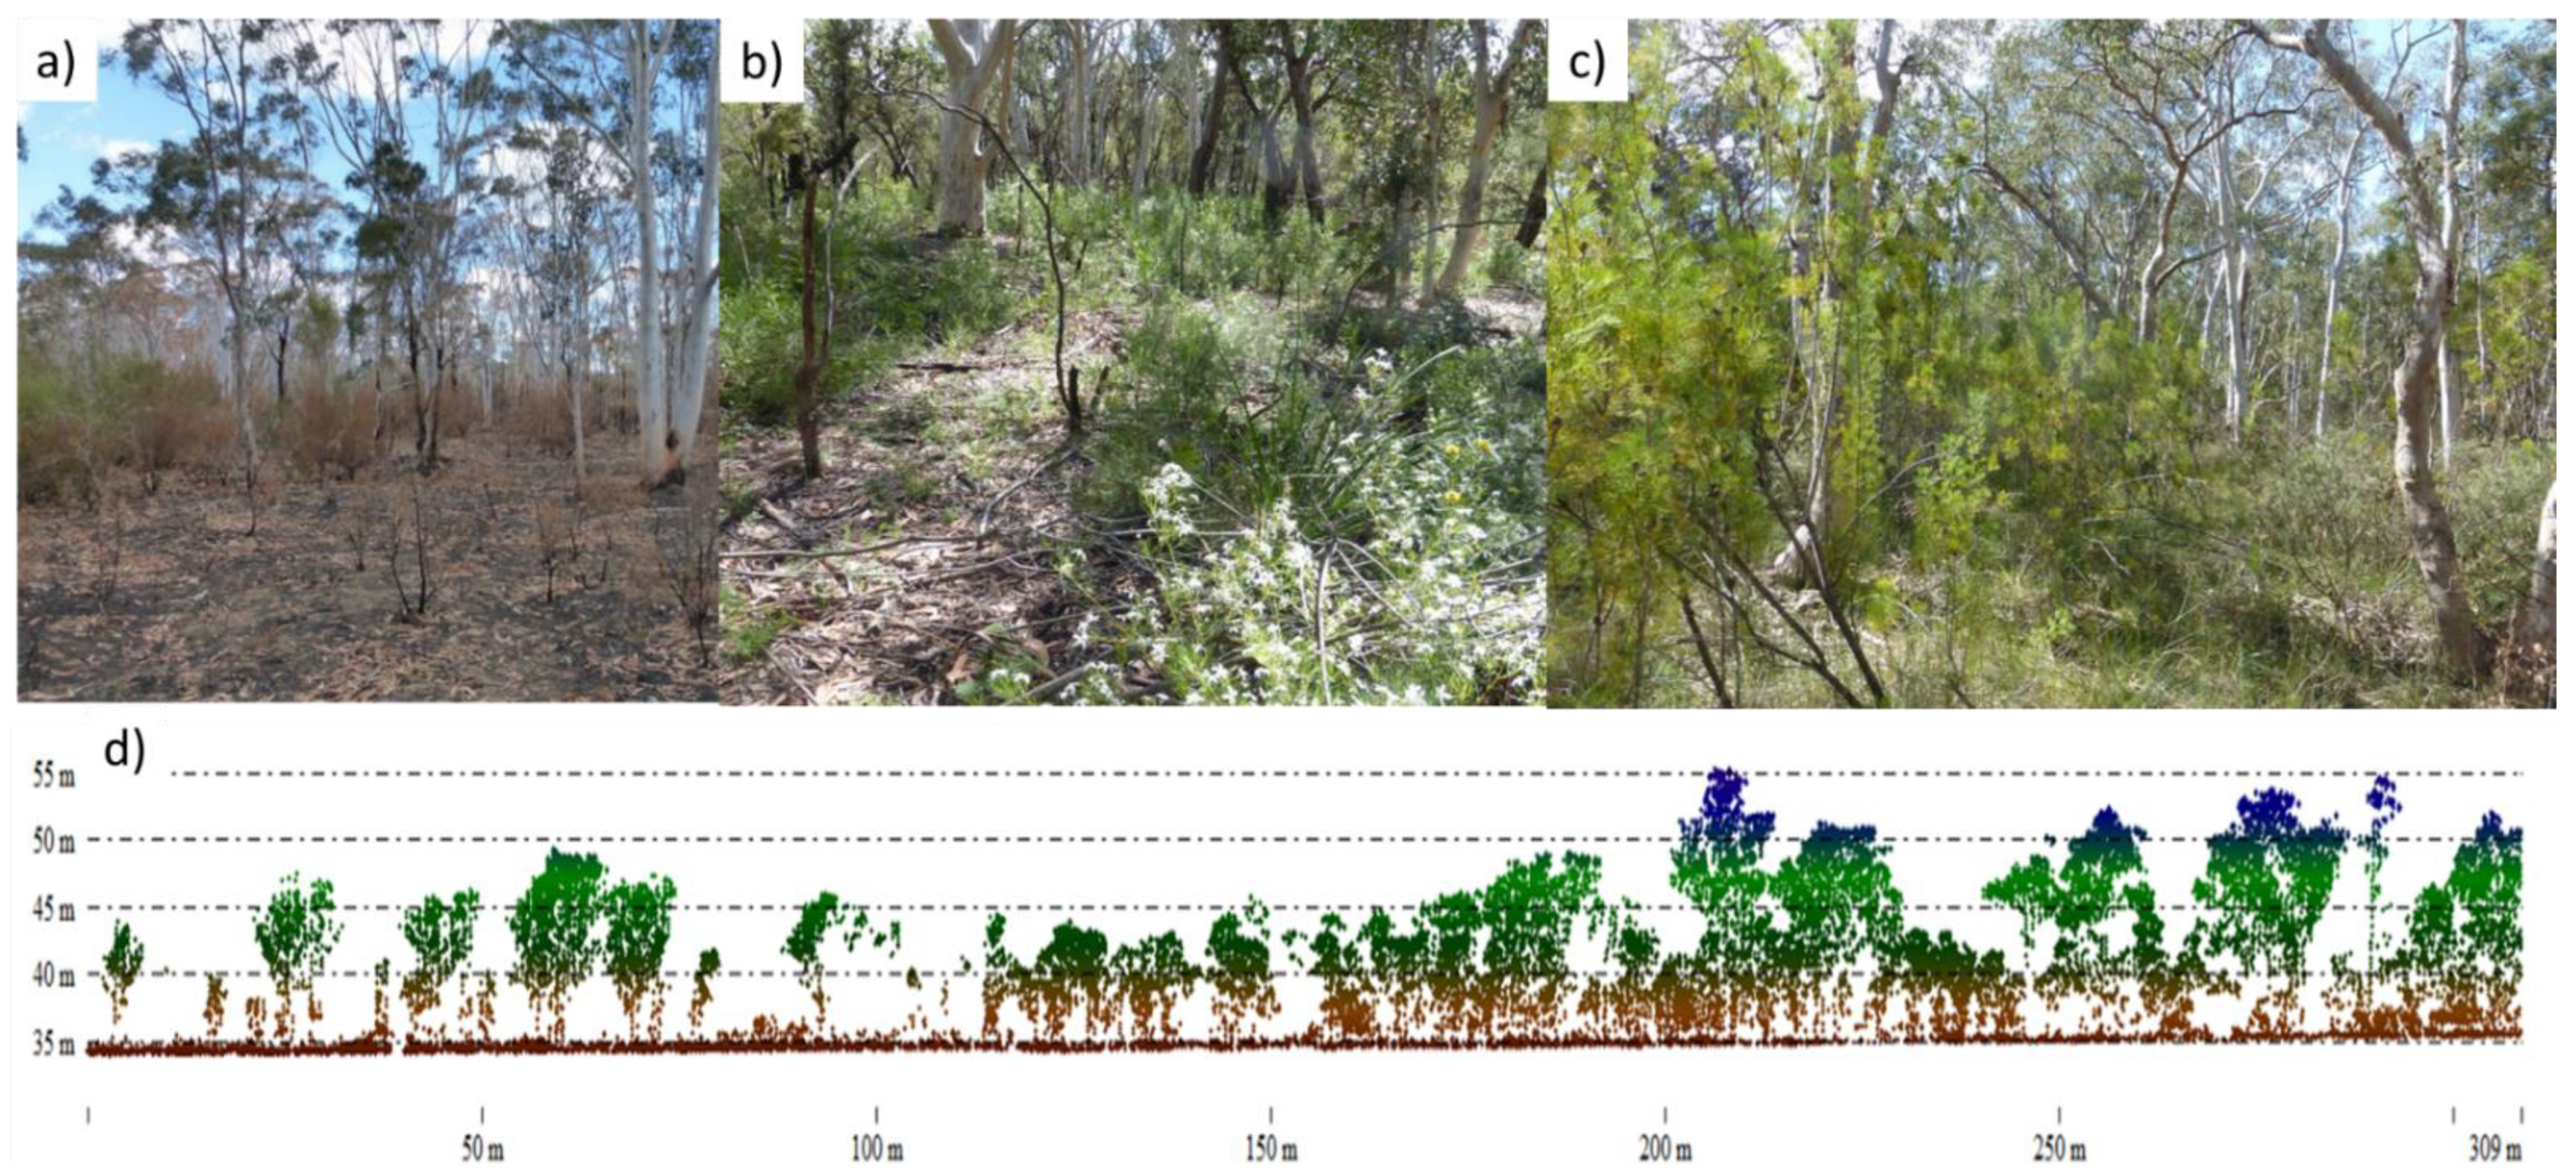
3.6. Airborne Lidar Acquisition and Analysis
3.7. Data Analysis
4. Results
4.1. Fire History
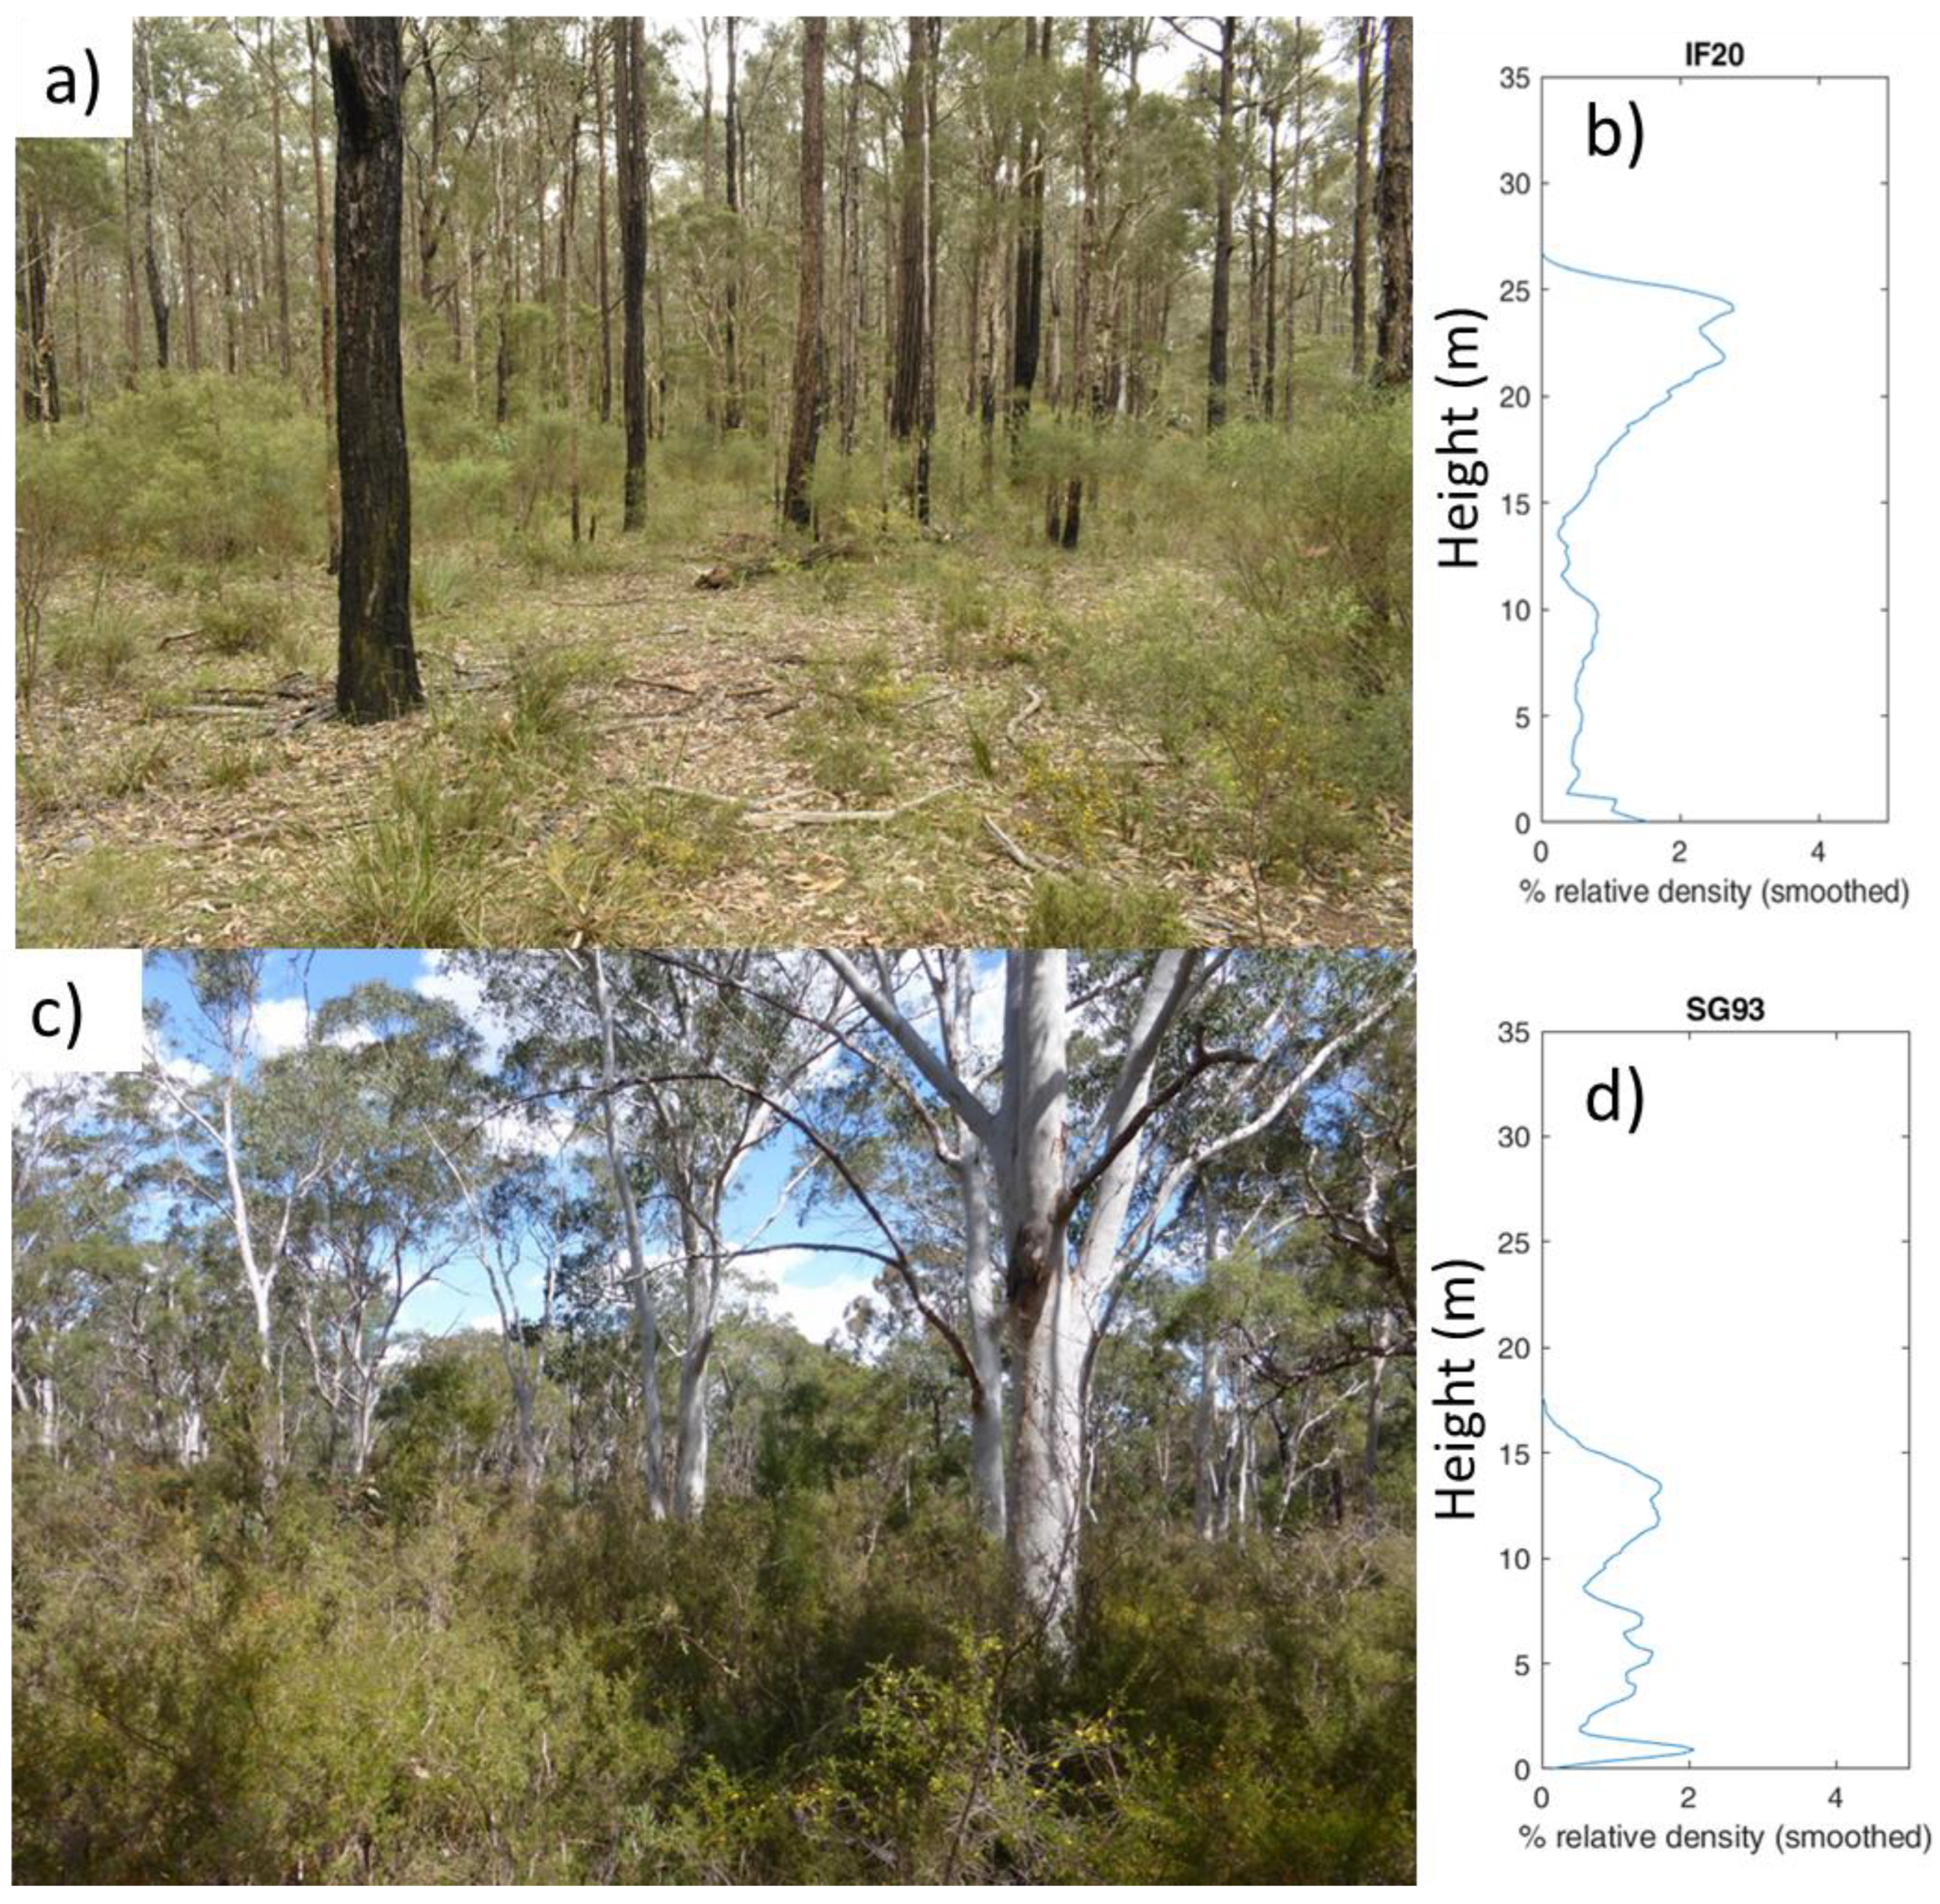
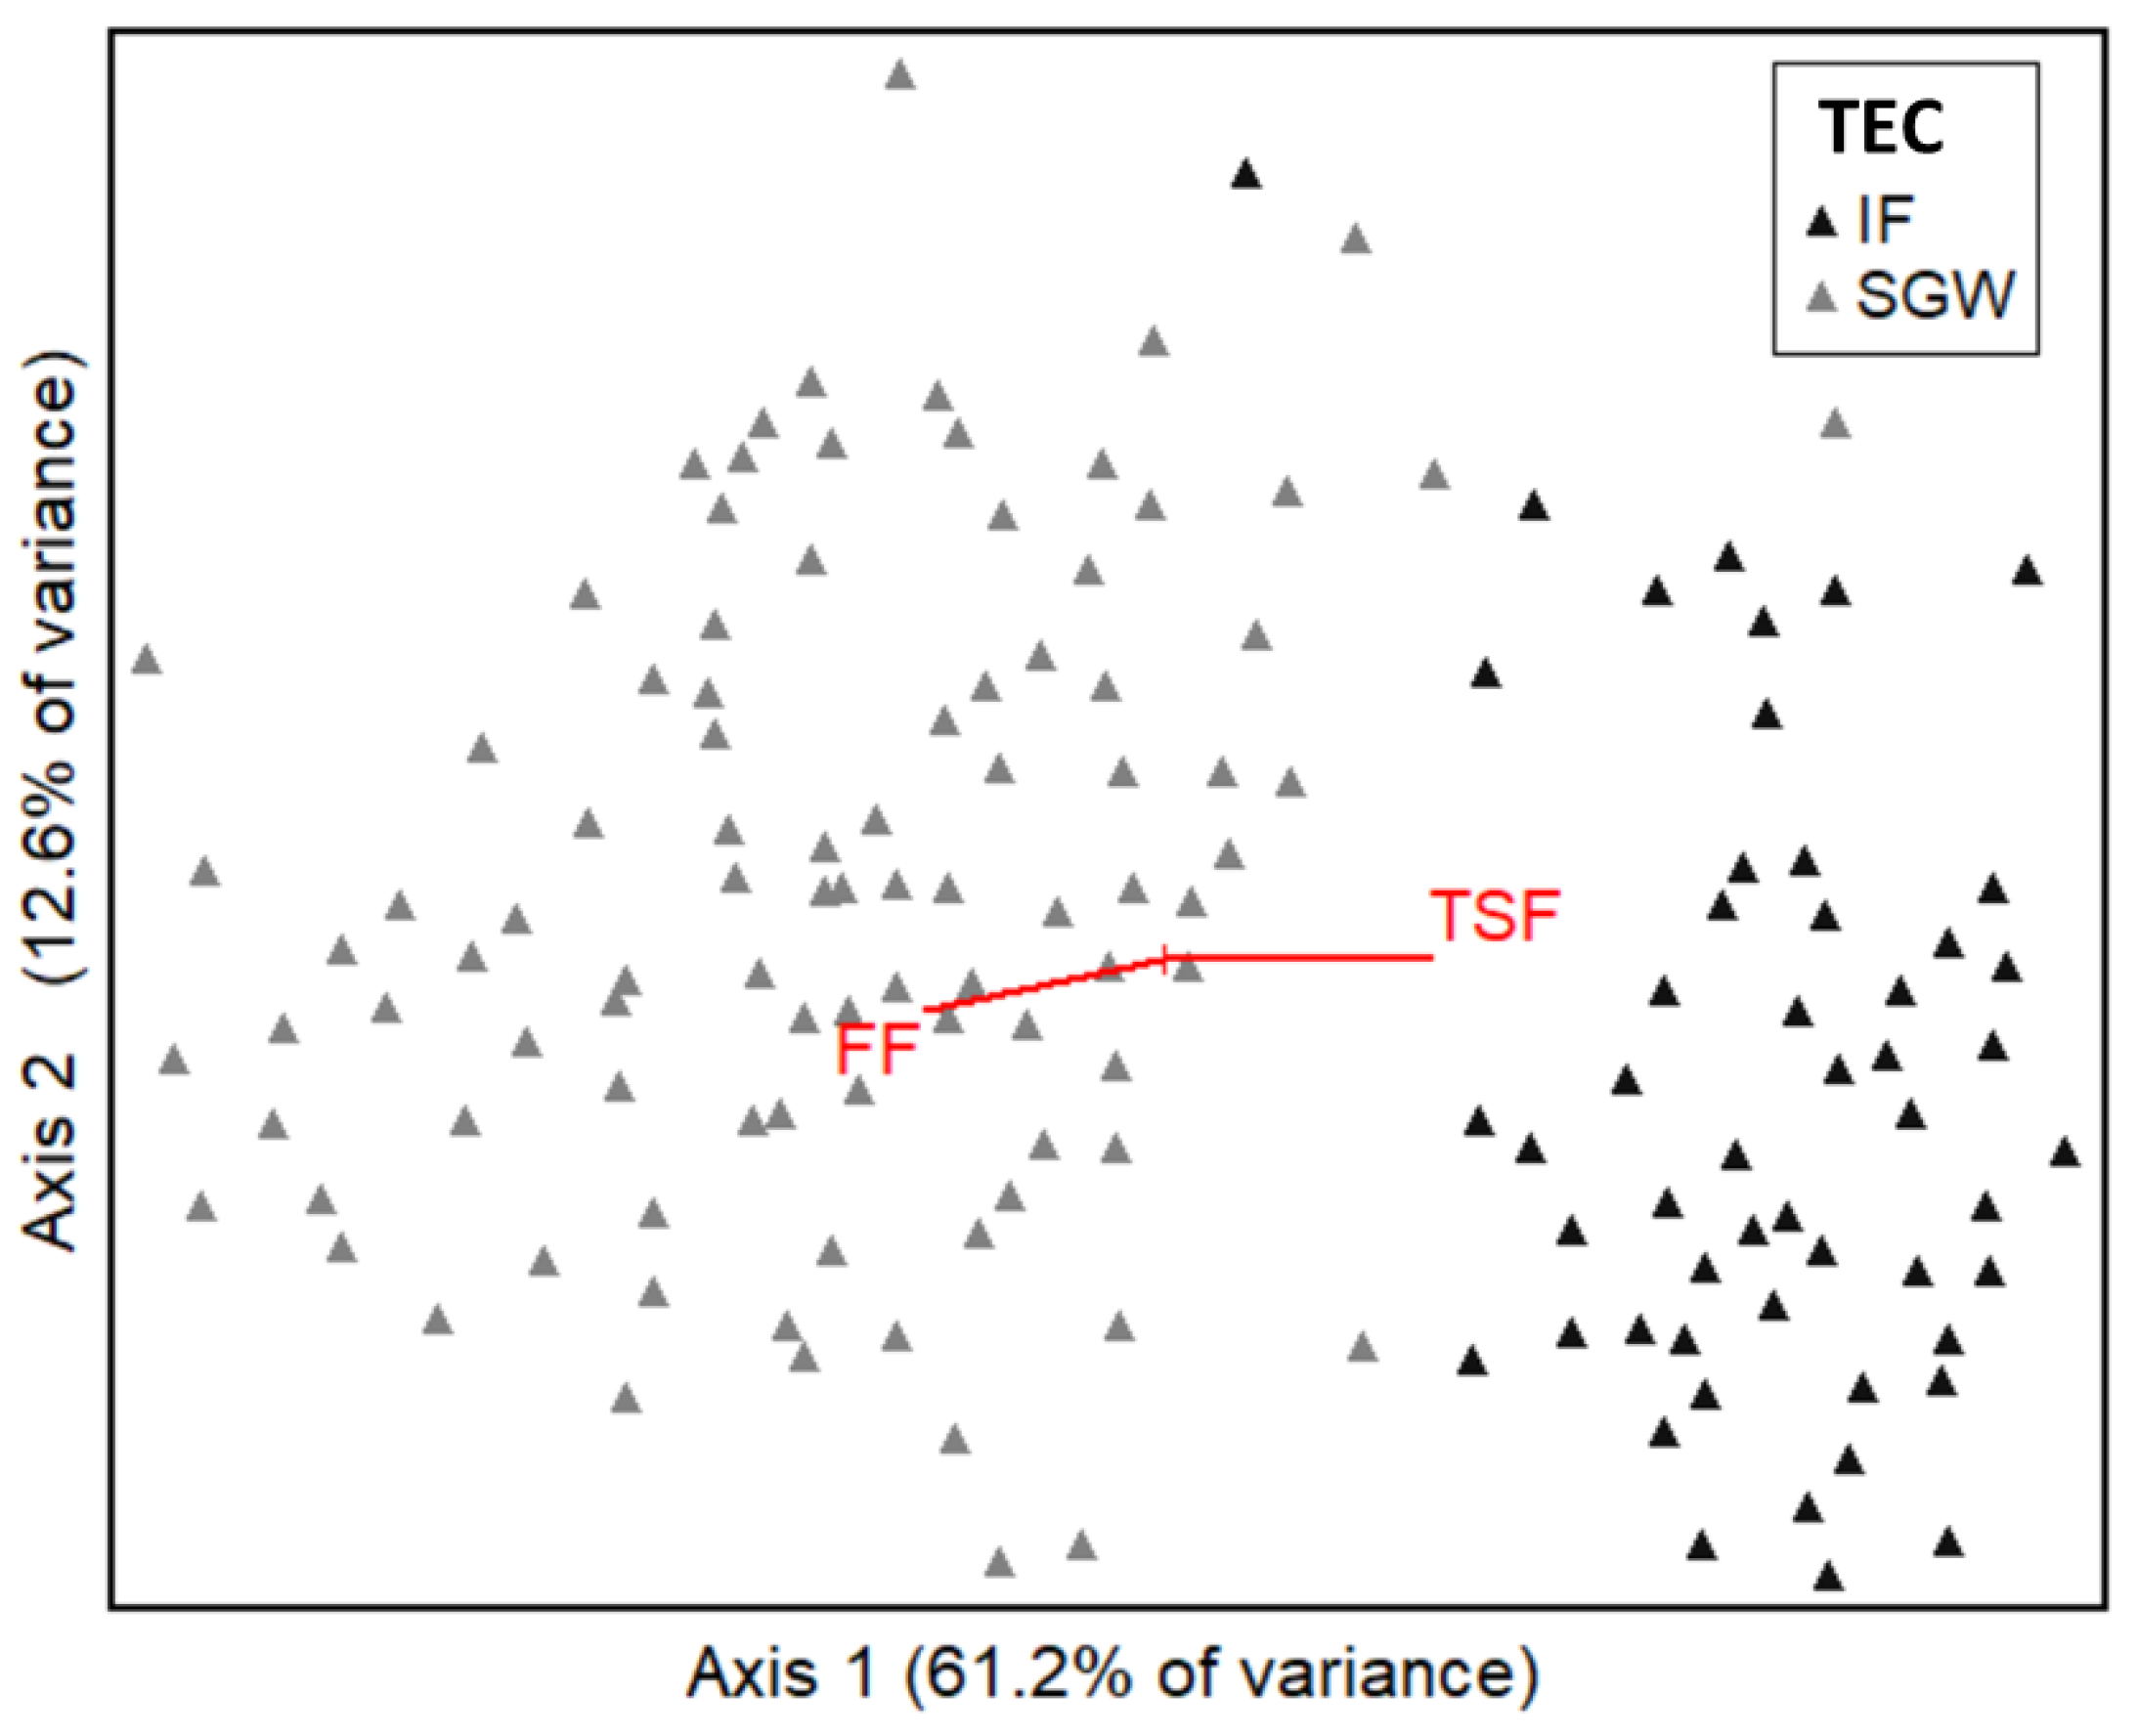
4.2. Canopy Structure, Habitat Values and Biodiversity in Two Communities
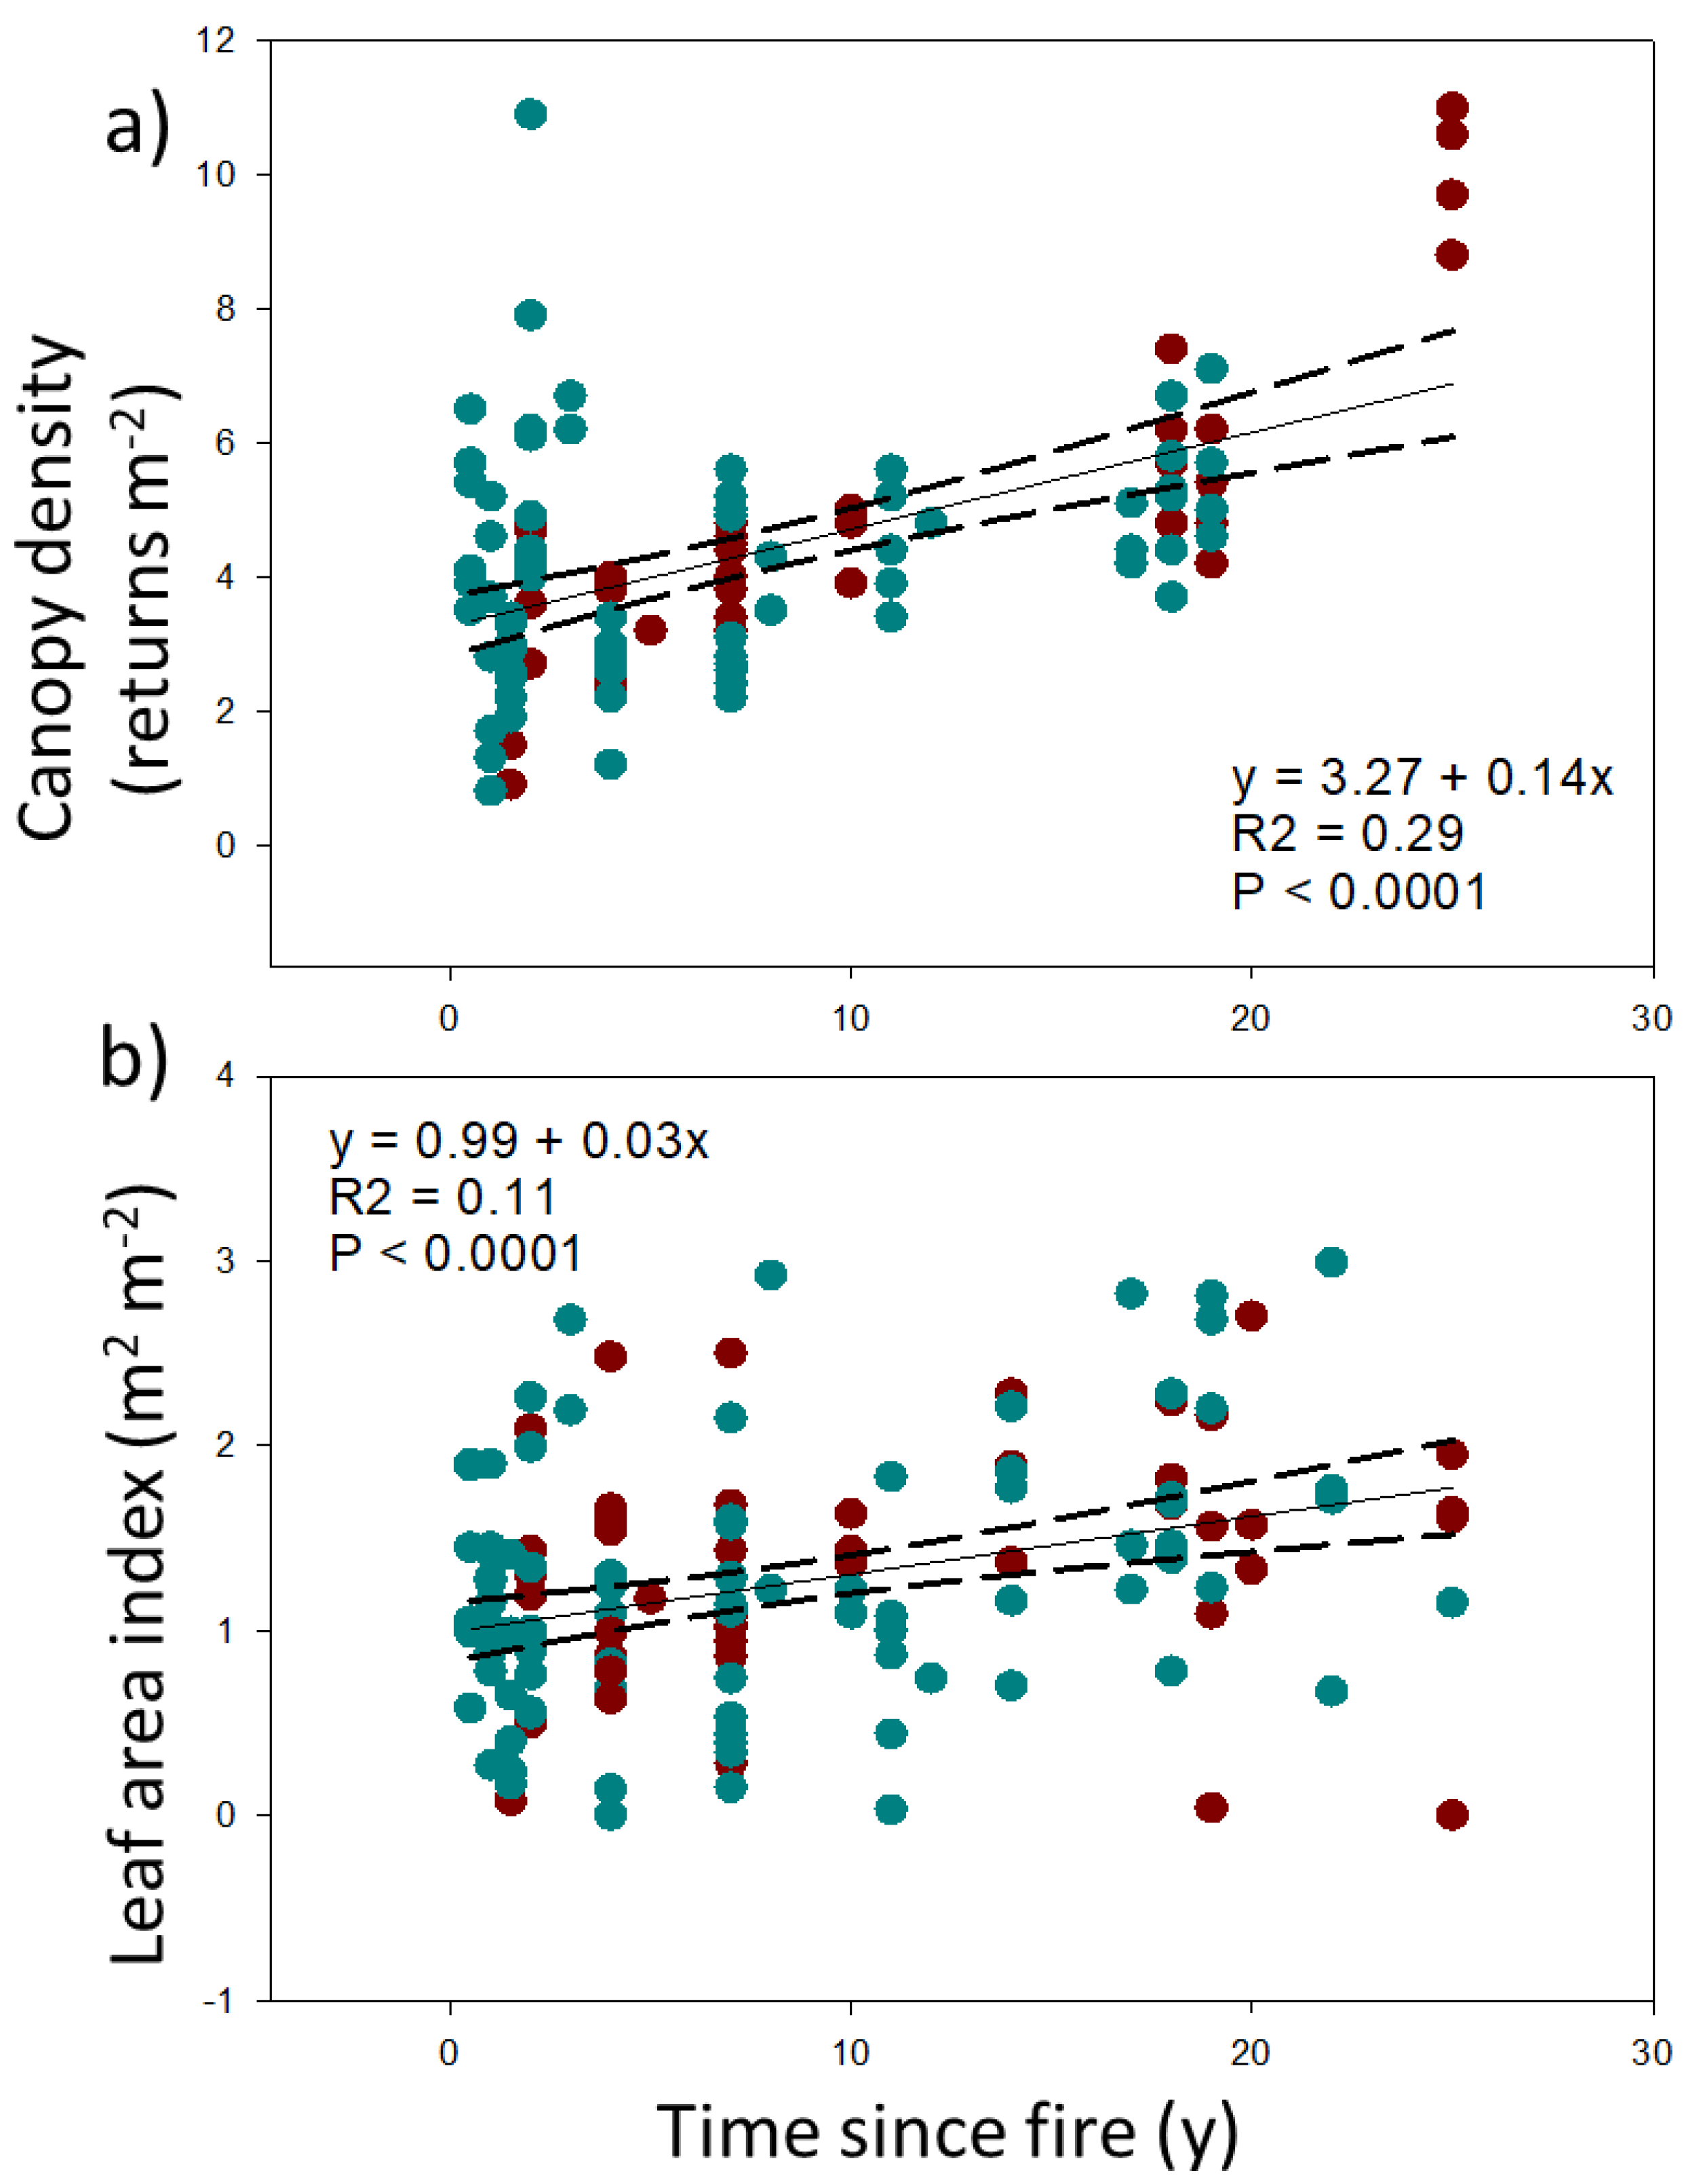
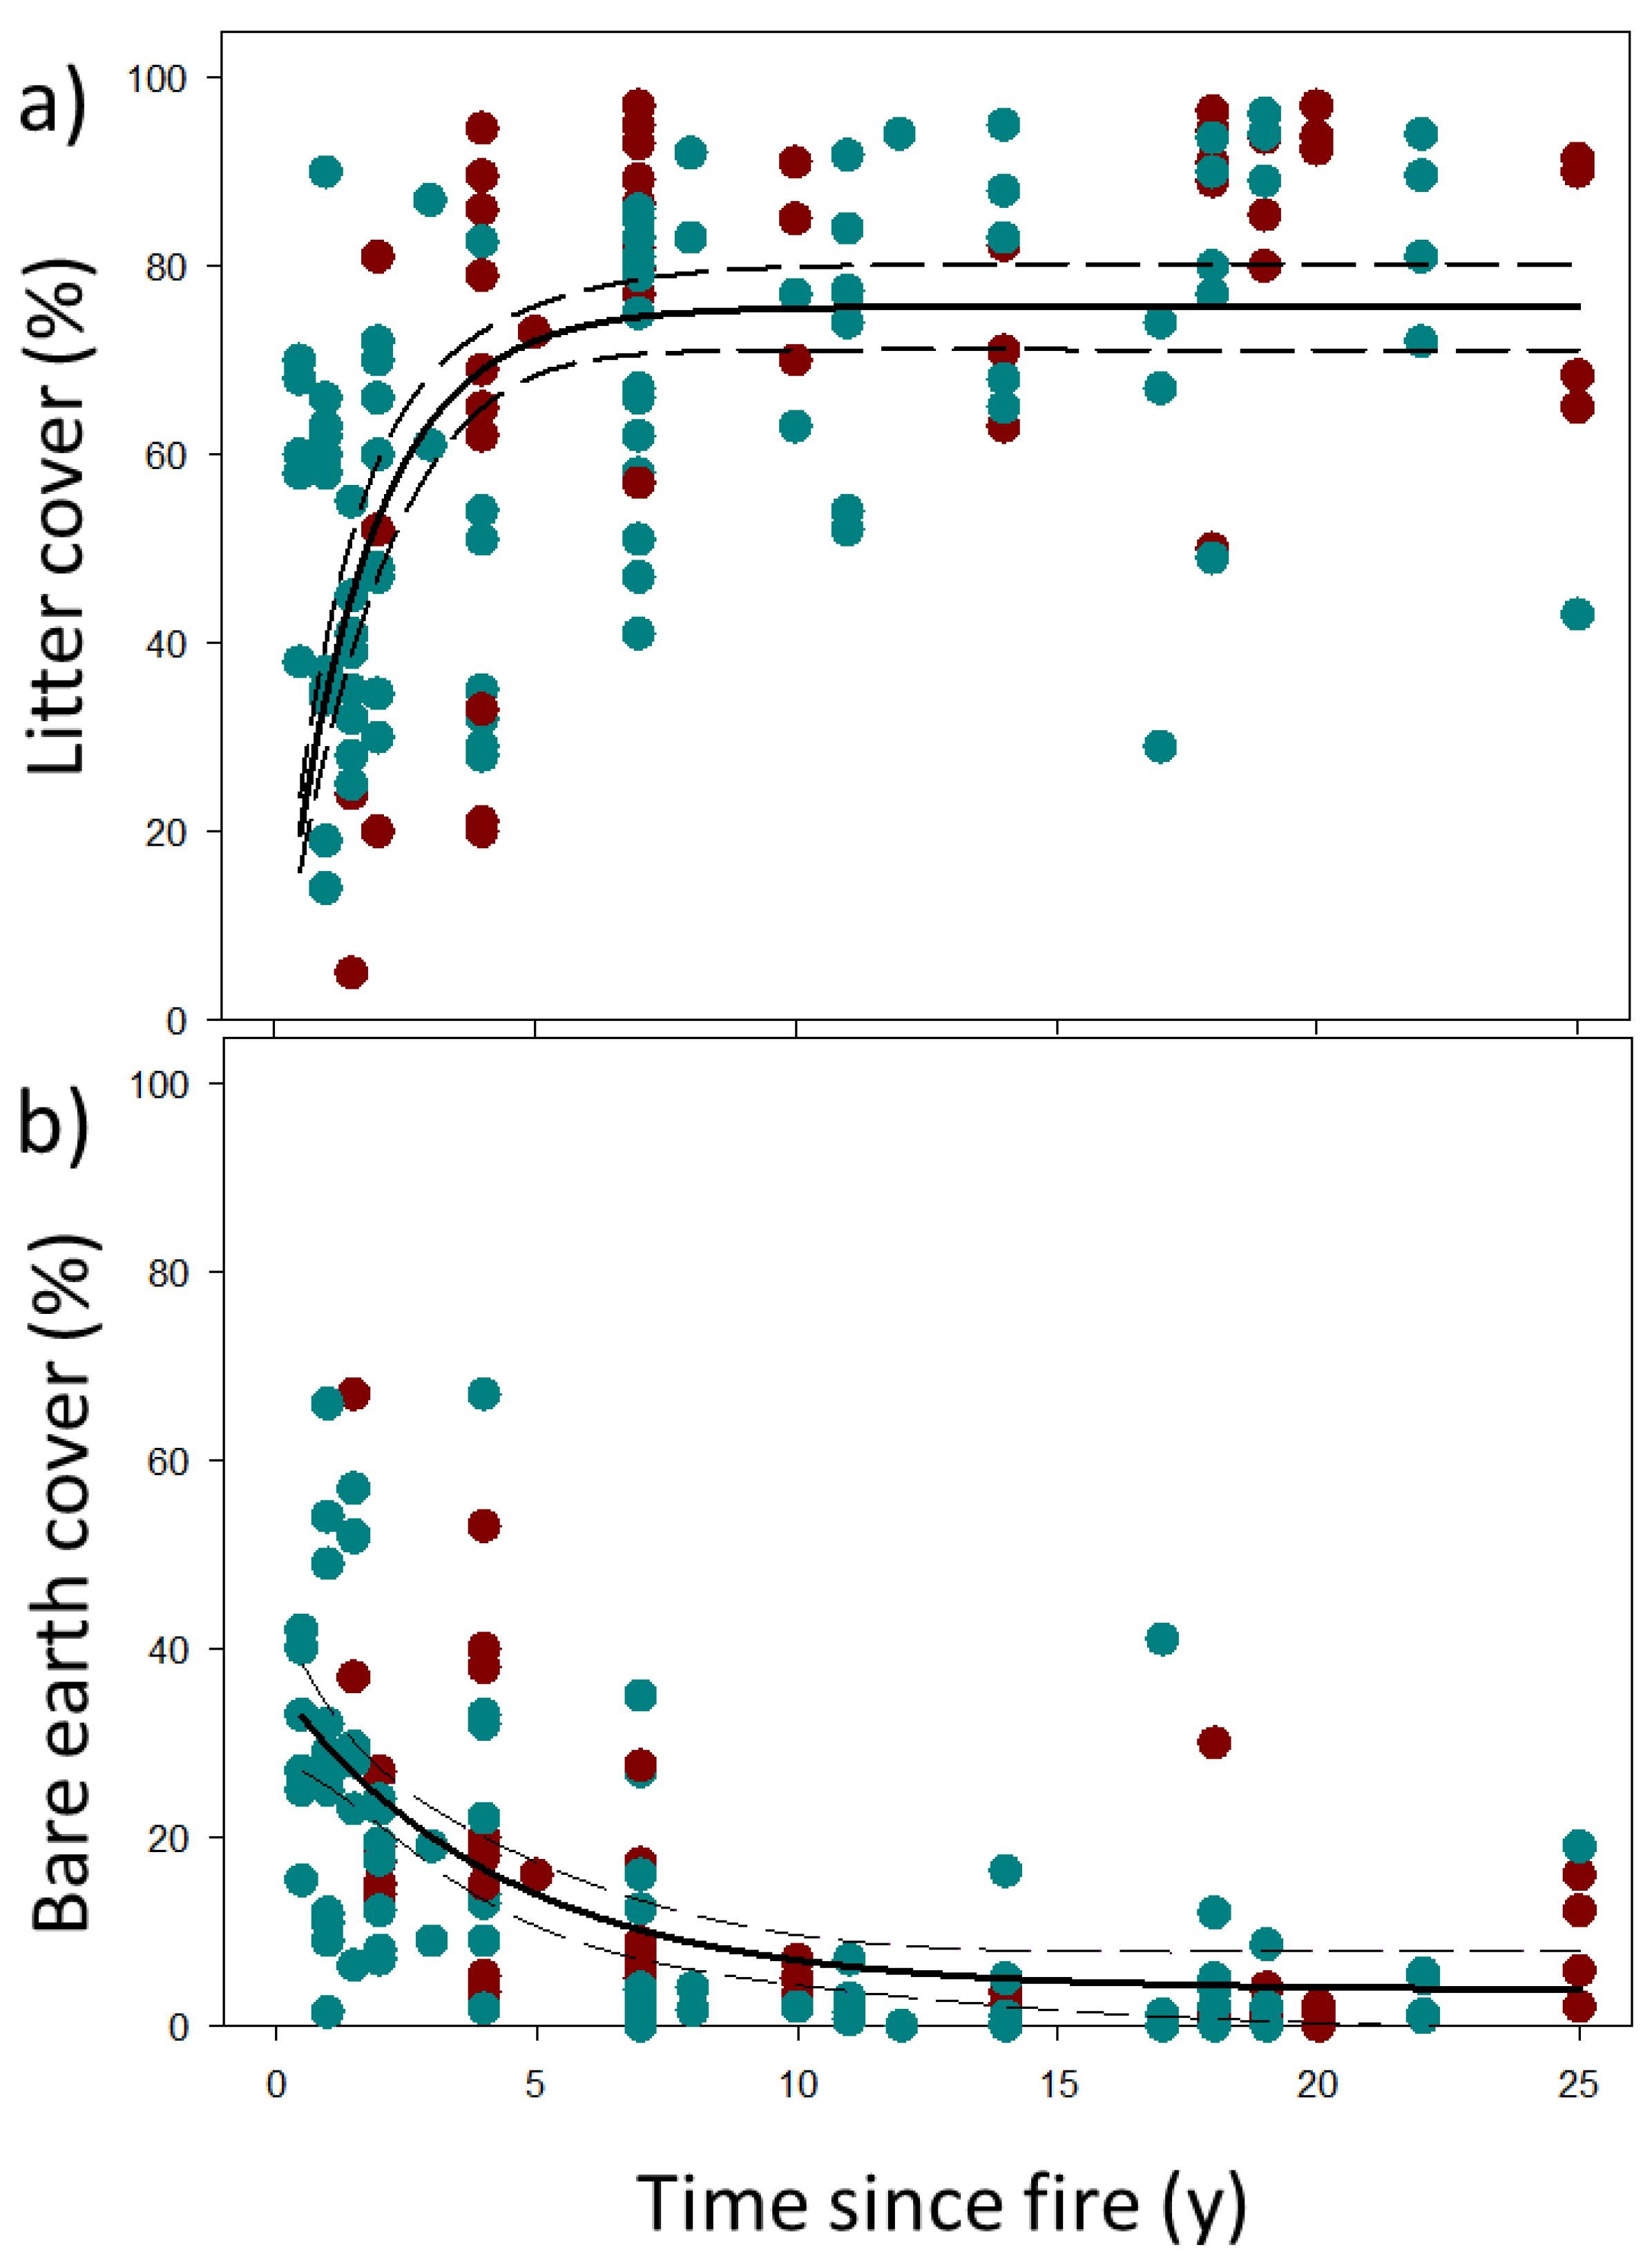
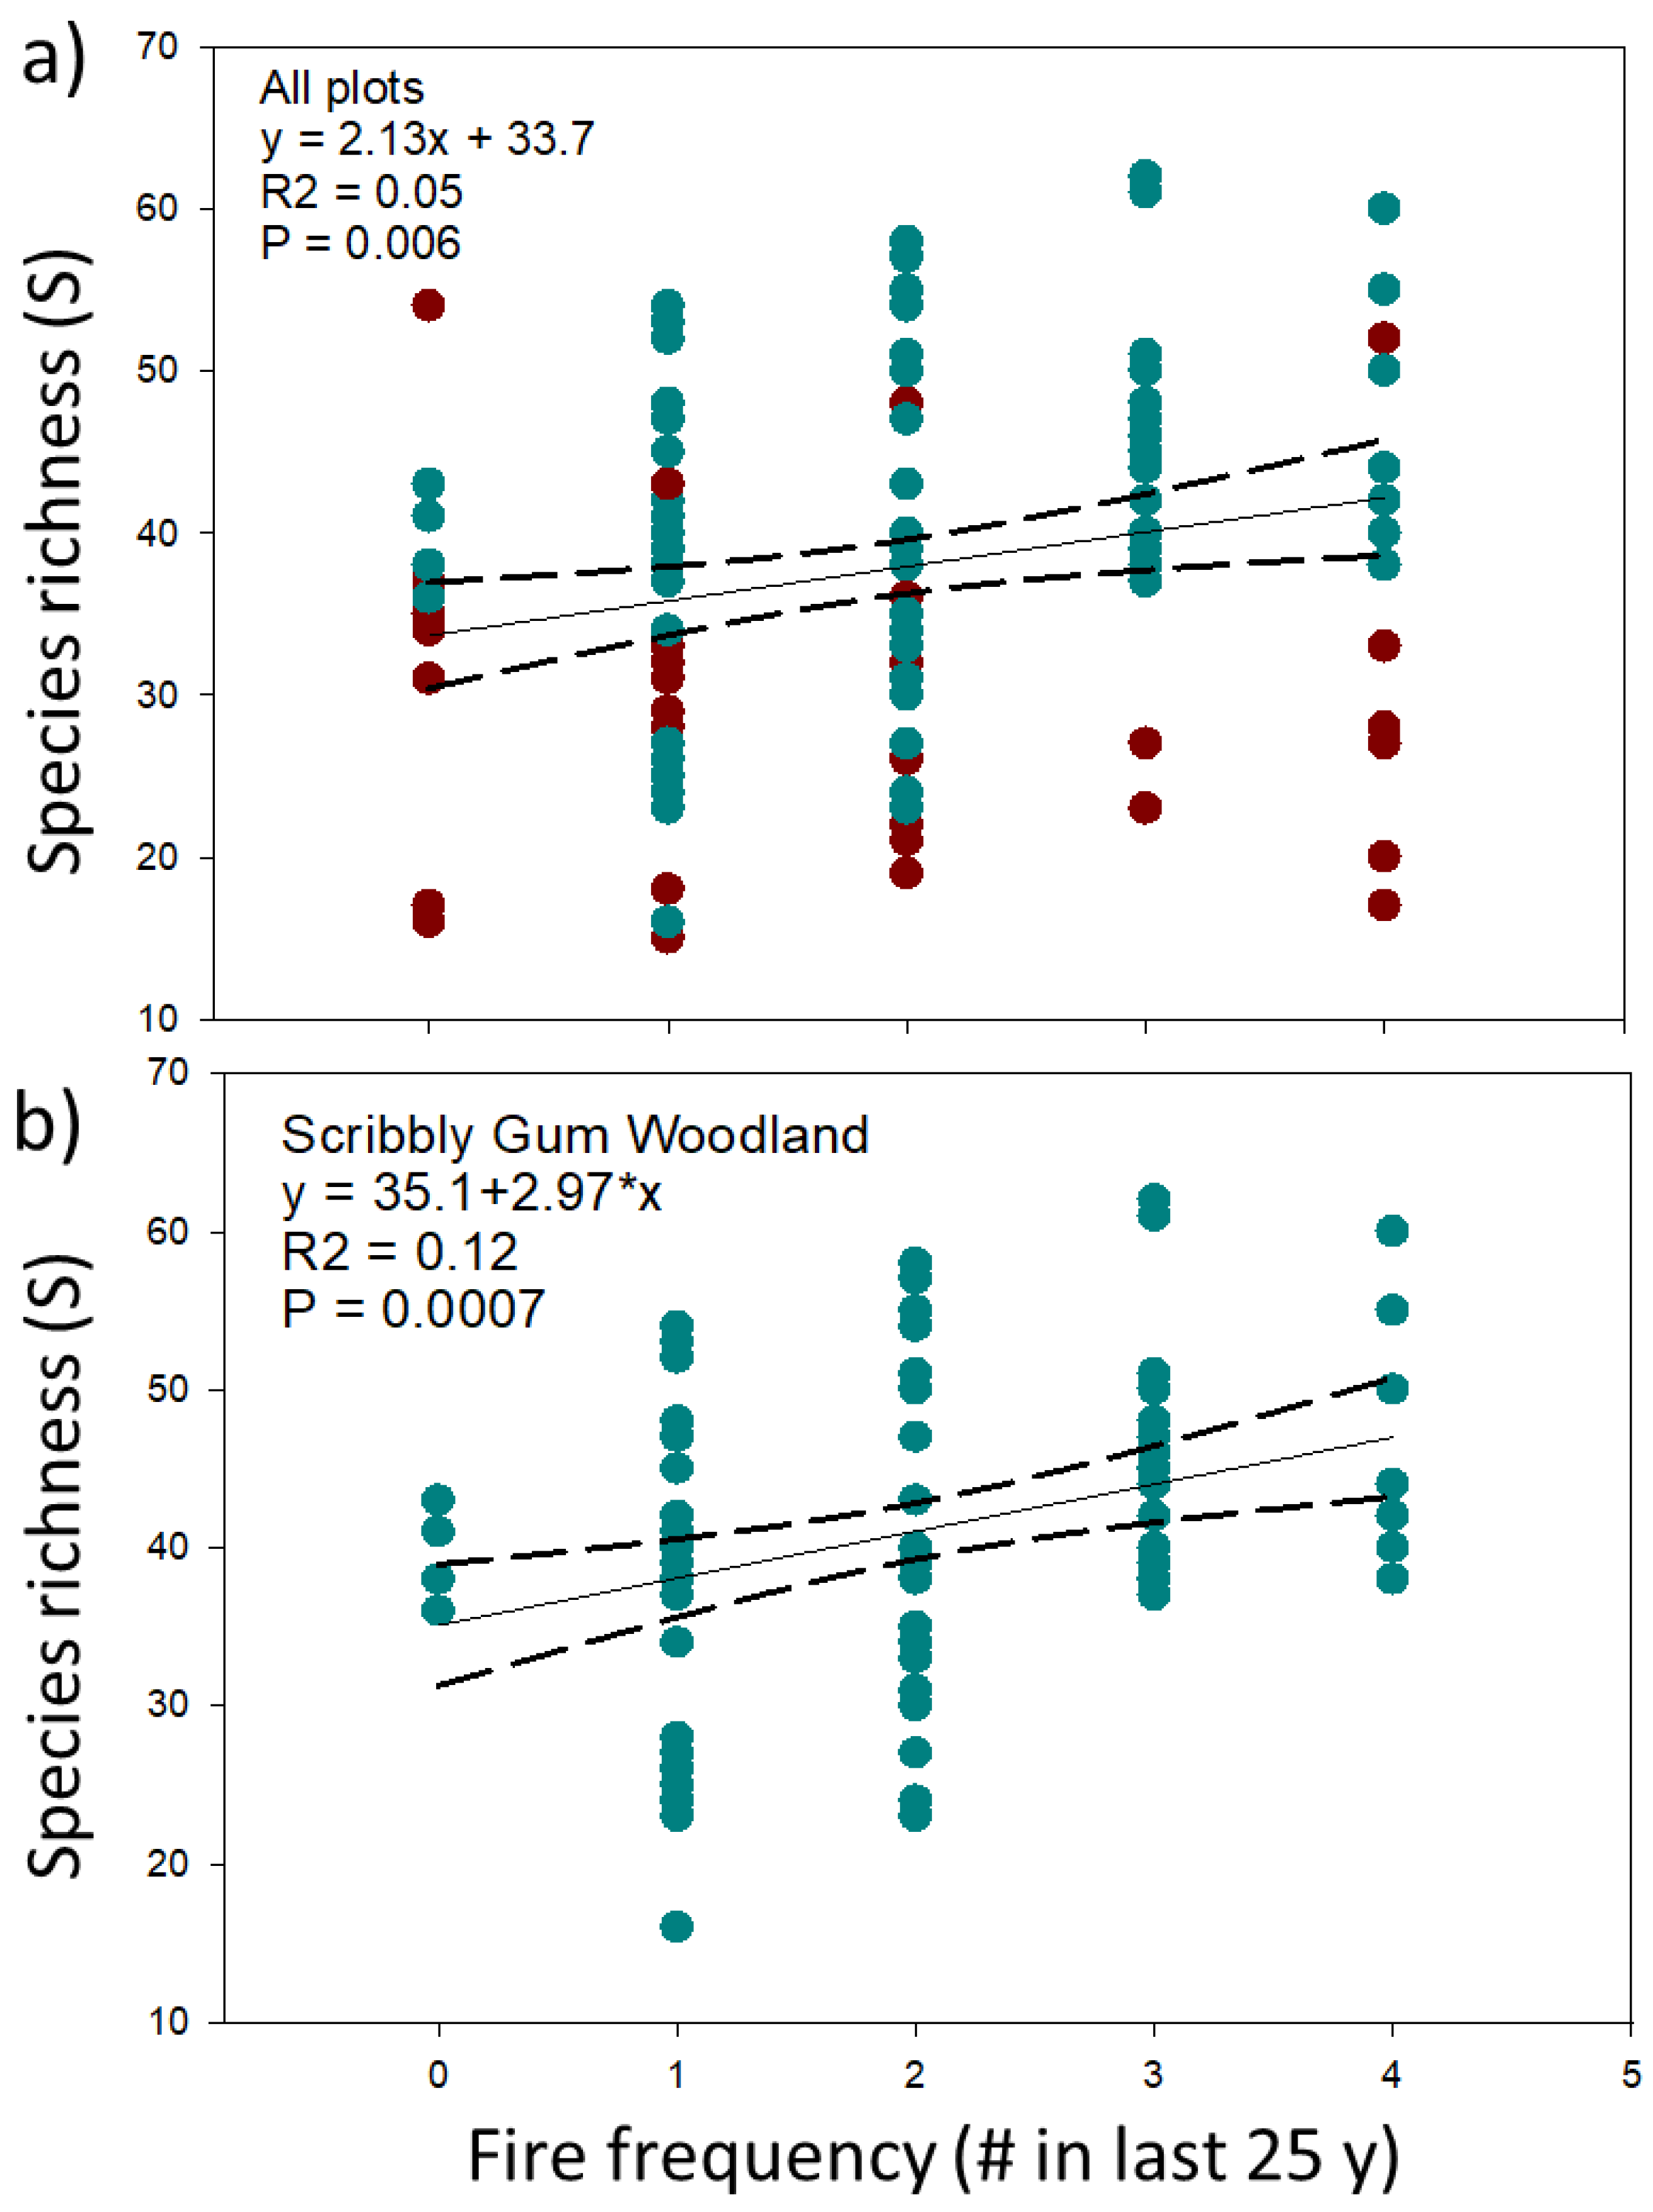
4.3. Responses of Ecosystem Structure and Biodiversity to Fire
5. Discussion
5.1. Vegetation Structure and Habitat Recovery
5.2. Biodiversity is Largely Resilient to the Fire Regimes Studied
6. Conclusions
Supplementary Materials
Author Contributions
Funding
Data Availability Statement
Acknowledgments
Conflicts of Interest
References
- Abram, N.J.; Henley, B.J.; Gupta, A.S.; Lippmann, T.J.R.; Clarke, H.; Dowdy, A.J.; Sharples, J.J.; Nolan, R.H.; Zhang, T.; Wooster, M.J.; et al. Connections of climate change and variability to large and extreme forest fires in southeast Australia. Commun. Earth Environ. 2021, 2, 8. [Google Scholar] [CrossRef]
- IPCC. Climate Change: The Physical Science Basis. Contribution of Working Group I to the Sixth Assessment Report of the Intergovernmental Panel on Climate Change; Cambridge University Press: Cambridge, UK, 2021. [Google Scholar]
- Murphy, B.P.; Bradstock, R.A.; Boer, M.M.; Carter, J.; Cary, G.J.; Cochrane, M.A.; Fensham, R.J.; Russell-Smith, J.; Williamson, G.J.; Bowman, D.M. Fire regimes of a ustralia: A pyrogeographic model system. J. Biogeogr. 2013, 40, 1048–1058. [Google Scholar] [CrossRef]
- Boer, M.M.; Resco de Dios, V.; Bradstock, R.A. Unprecedented burn area of Australian mega forest fires. Nat. Clim. Change 2020, 10, 171–172. [Google Scholar] [CrossRef]
- Nolan, R.H.; Bowman, D.M.; Clarke, H.; Haynes, K.; Ooi, M.K.; Price, O.F.; Williamson, G.J.; Whittaker, J.; Bedward, M.; Boer, M.M. What Do the Australian Black Summer Fires signify for the global fire crisis? Fire 2021, 4, 97. [Google Scholar] [CrossRef]
- Dickman, C.R. Ecological consequences of Australia’s “Black Summer” bushfires: Managing for recovery. Integr. Environ. Assess. Manag. 2021, 17, 1162–1167. [Google Scholar] [CrossRef]
- Legge, S.; Woinarski, J.C.; Scheele, B.C.; Garnett, S.T.; Lintermans, M.; Nimmo, D.G.; Whiterod, N.S.; Southwell, D.M.; Ehmke, G.; Buchan, A. Rapid assessment of the biodiversity impacts of the 2019–2020 Australian megafires to guide urgent management intervention and recovery and lessons for other regions. Divers. Distrib. 2022, 28, 571–591. [Google Scholar] [CrossRef]
- Bowman, D.M.J.S.; Balch, J.; Artaxo, P.; Bond, W.J.; Cochrane, M.A.; D’Antonio, C.M.; DeFries, R.; Johnston, F.H.; Keeley, J.E.; Krawchuk, M.A.; et al. The human dimension of fire regimes on Earth. J. Biogeogr. 2011, 38, 2223–2236. [Google Scholar] [CrossRef] [Green Version]
- Bowman, D.M.; Kolden, C.A.; Abatzoglou, J.T.; Johnston, F.H.; van der Werf, G.R.; Flannigan, M. Vegetation fires in the Anthropocene. Nat. Rev. Earth Environ. 2020, 1, 500–515. [Google Scholar] [CrossRef]
- Johnstone, J.F.; Allen, C.D.; Franklin, J.F.; Frelich, L.E.; Harvey, B.J.; Higuera, P.E.; Mack, M.C.; Meentemeyer, R.K.; Metz, M.R.; Perry, G.L.W.; et al. Changing disturbance regimes, ecological memory, and forest resilience. Front. Ecol. Environ. 2016, 14, 369–378. [Google Scholar] [CrossRef]
- Bradstock, R.A.; Williams, R.J.; Gill, A.M. Flammable Australia: Fire Regimes, Biodiversity and Ecosystems in a Changing World; CSIRO Publishing: Clayton, Australia, 2012. [Google Scholar]
- Nolan, R.H.; Collins, L.; Leigh, A.; Ooi, M.K.; Curran, T.J.; Fairman, T.A.; Resco de Dios, V.; Bradstock, R. Limits to post-fire vegetation recovery under climate change. Plant Cell Environ. 2021, 44, 3471–3489. [Google Scholar] [CrossRef]
- Dixon, K.W.; Roche, S.; Pate, J.S. The promotive effect of smoke derived from burnt native vegetation on seed germination of Western Australian plants. Oecologia 1995, 101, 185–192. [Google Scholar] [CrossRef] [PubMed]
- Thomas, P.B.; Morris, E.C.; Auld, T.D. Response surfaces for the combined effects of heat shock and smoke on germination of 16 species forming soil seed banks in south-east Australia. Austral. Ecol. 2007, 32, 605–616. [Google Scholar] [CrossRef]
- Thomas, P.B.; Morris, E.C.; Auld, T.D.; Haigh, A.M. The interaction of temperature, water availability and fire cues regulates seed germination in a fire-prone landscape. Oecologia 2010, 162, 293–302. [Google Scholar] [CrossRef] [PubMed]
- Lamont, B.B.; He, T.; Yan, Z. Evolutionary history of fire-stimulated resprouting, flowering, seed release and germination. Biol. Rev. 2019, 94, 903–928. [Google Scholar] [CrossRef]
- Chick, M.P.; York, A.; Sitters, H.; Di Stefano, J.; Nitschke, C.R. Combining optimization and simulation modelling to measure the cumulative impacts of prescribed fire and wildfire on vegetation species diversity. J. Appl. Ecol. 2019, 56, 722–732. [Google Scholar] [CrossRef]
- Clarke, P.J.; Lawes, M.J.; Murphy, B.P.; Russell-Smith, J.; Nano, C.E.; Bradstock, R.; Enright, N.J.; Fontaine, J.B.; Gosper, C.R.; Radford, I. A synthesis of postfire recovery traits of woody plants in Australian ecosystems. Sci. Total Environ. 2015, 534, 31–42. [Google Scholar] [CrossRef]
- Nitoslawski, S.; Wong-Stevens, K.; Steenberg, J.; Witherspoon, K.; Nesbitt, L.; Konijnendijk van den Bosch, C. The digital forest: Mapping a decade of knowledge on technological applications for forest ecosystems. Earth’s Future 2021, 9, e2021EF002123. [Google Scholar] [CrossRef]
- Kane, V.R.; North, M.P.; Lutz, J.A.; Churchill, D.J.; Roberts, S.L.; Smith, D.F.; McGaughey, R.J.; Kane, J.T.; Brooks, M.L. Assessing fire effects on forest spatial structure using a fusion of Landsat and airborne LiDAR data in Yosemite National Park. Remote Sens. Environ. 2014, 151, 89–101. [Google Scholar] [CrossRef]
- Senf, C.; Müller, J.; Seidl, R. Post-disturbance recovery of forest cover and tree height differ with management in Central Europe. Landsc. Ecol. 2019, 34, 2837–2850. [Google Scholar] [CrossRef] [Green Version]
- Fahey, R.T.; Atkins, J.W.; Gough, C.M.; Hardiman, B.S.; Nave, L.E.; Tallant, J.M.; Nadehoffer, K.J.; Vogel, C.; Scheuermann, C.M.; Stuart—Haëntjens, E. Defining a spectrum of integrative trait-based vegetation canopy structural types. Ecol. Lett. 2019, 22, 2049–2059. [Google Scholar] [CrossRef]
- Valbuena, R.; O’Connor, B.; Zellweger, F.; Simonson, W.; Vihervaara, P.; Maltamo, M.; Silva, C.A.; Almeida, D.R.; Danks, F.; Morsdorf, F. Standardizing ecosystem morphological traits from 3D information sources. Trends Ecol. Evol. 2020, 35, 656–667. [Google Scholar] [CrossRef] [PubMed]
- Coops, N.C.; Tompaski, P.; Nijland, W.; Rickbeil, G.J.; Nielsen, S.E.; Bater, C.W.; Stadt, J.J. A forest structure habitat index based on airborne laser scanning data. Ecol. Indic. 2016, 67, 346–357. [Google Scholar] [CrossRef]
- Gordon, C.E.; Price, O.F.; Tasker, E.M. Mapping and exploring variation in post-fire vegetation recovery following mixed severity wildfire using airborne Li DAR. Ecol. Appl. 2017, 27, 1618–1632. [Google Scholar] [CrossRef] [PubMed]
- Hillman, S.; Hally, B.; Wallace, L.; Turner, D.; Lucieer, A.; Reinke, K.; Jones, S. High-resolution estimates of fire severity—An evaluation of UAS image and LiDAR mapping approaches on a sedgeland forest boundary in Tasmania, Australia. Fire 2021, 4, 14. [Google Scholar] [CrossRef]
- Keeler, B.L.; Hamel, P.; McPhearson, T.; Hamann, M.H.; Donahue, M.L.; Meza Prado, K.A.; Arkema, K.K.; Bratman, G.N.; Brauman, K.A.; Finlay, J.C. Social-ecological and technological factors moderate the value of urban nature. Nat. Sustain. 2019, 2, 29–38. [Google Scholar] [CrossRef]
- Livesley, S.; McPherson, E.G.; Calfapietra, C. The urban forest and ecosystem services: Impact on urban water, heat, and pollution cycles at the tree, street, and city scale. J. Environ. Qual. 2016, 45, 119–124. [Google Scholar] [CrossRef]
- Florec, V.; Burton, M.; Pannell, D.; Kelso, J.; Milne, G. Where to prescribe burn: The costs and benefits of prescribed burning close to houses. Int. J. Wildland Fire 2019, 29, 440–458. [Google Scholar] [CrossRef]
- Penman, T.D.; Clarke, H.; Cirulis, B.; Boer, M.M.; Price, O.F.; Bradstock, R.A. Cost-effective prescribed burning solutions vary between landscapes in eastern Australia. Front. For. Glob. Change 2020, 3, 79. [Google Scholar] [CrossRef]
- Bento-Gonçalves, A.; Vieira, A. Wildfires in the wildland-Urban interface: Key concepts and evaluation methodologies. Sci. Total Environ. 2020, 707, 135592. [Google Scholar] [CrossRef]
- Bardsley, D.K.; Prowse, T.A.A.; Siegfriedt, C. Seeking knowledge of traditional Indigenous burning practices to inform regional bushfire management. Local Environ. 2019, 24, 727–745. [Google Scholar] [CrossRef]
- Mariani, M.; Connor, S.E.; Theuerkauf, M.; Herbert, A.; Kuneš, P.; Bowman, D.; Fletcher, M.S.; Head, L.; Kershaw, A.P.; Haberle, S.G. Disruption of cultural burning promotes shrub encroachment and unprecedented wildfires. Front. Ecol. Environ. 2021, 20, 292–300. [Google Scholar] [CrossRef]
- Karskens, G. Fire in the forests? Exploring the human-ecological history of Australia’s first frontier. Environ. Hist. 2019, 25, 391–419. [Google Scholar] [CrossRef]
- Levin, N.; Yebra, M.; Phinn, S. Unveiling the Factors Responsible for Australia’s Black Summer Fires of 2019/2020. Fire 2021, 4, 58. [Google Scholar] [CrossRef]
- NSW Government. Biodiversity Conservation Act. 2016. Available online: https://legislation.nsw.gov.au/view/html/inforce/current/act-2016-063#sec.1.1 (accessed on 20 January 2022).
- Tozer, M. The native vegetation of the Cumberland Plain, western Sydney: Systematic classification and field identification of communities. Cunninghamia 2003, 8, 1–75. [Google Scholar]
- Australian Bureau of Statistics. National Census. Available online: https://www.abs.gov.au/statistics/people/population/regional-population/latest-release (accessed on 30 May 2022).
- Etchells, H.; O’Donnell, A.J.; McCaw, W.L.; Grierson, P.F. Fire severity impacts on tree mortality and post-fire recruitment in tall eucalypt forests of southwest Australia. For. Ecol. Manag. 2020, 459, 117850. [Google Scholar] [CrossRef]
- Miller, R.G.; Tangney, R.; Enright, N.J.; Fontaine, J.B.; Merritt, D.J.; Ooi, M.K.; Ruthrof, K.X.; Miller, B.P. Mechanisms of fire seasonality effects on plant populations. Trends Ecol. Evol. 2019, 34, 1104–1117. [Google Scholar] [CrossRef]
- NSW Office of Environment and Heritage. The Native Vegetation of the Sydney Metropolitan Area—Version 3.1 VIS_ID 4489; 2016. [Google Scholar]
- Bannerman, S.; Hazelton, P. Soil Landscapes of the Penrith 1:100,000 Sheet Interactive CD-ROM; NSW Office of Environment and Heritage: Sydney, Australia, 2011.
- Santamouris, M.; Haddad, S.; Fiorito, F.; Osmond, P.; Ding, L.; Prasad, D.; Zhai, X.; Wang, R. Urban heat island and overheating characteristics in Sydney, Australia. An analysis of multiyear measurements. Sustainability 2017, 9, 712. [Google Scholar] [CrossRef]
- Greater Sydney Commission. Greater Sydney Region Plan; 2018. Available online: file://ad.uws.edu.au/dfshare/HomesPTA$/30021365/Downloads/greater-sydney-region-plan-0618.pdf (accessed on 20 January 2022).
- Dowdy, A.J. Seamless climate change projections and seasonal predictions for bushfires in Australia. J. South. Hemisph. Earth Syst. Sci. 2020, 70, 120–138. [Google Scholar] [CrossRef]
- Department of the Environment, Approved Conservation Advice (Including Listing Advice) for Castlereagh Scribbly Gum and Agnes Banks Woodlands of the Sydney Basin Bioregion; Canberra, Australia, 2015.
- NSW Scientific Committee, Castlereagh Scribbly Gum Woodland in the Sydney Basin Bioregion—Vulnerable Ecological Community Listing (Web Page); 2013.
- NSW Scientific Committee, Castlereagh Scribbly Gum Woodland in the Sydney Basin Bioregion—Vulnerable Ecological Community Listing; 2011.
- Department of the Environment, Approved Conservation Advice (Including Listing Advice) for Cooks River/Castlereagh Ironbark Forest of the Sydney Basin Bioregion; Canberra, Australia, 2015.
- NSW Scientific Committee, Cooks River/Castlereagh Ironbark Forest in the Sydney Basin Bioregion—Minor Amendment to Endangered Ecological Community Determination; 2011.
- National Parks and Wildlife Service. Interpretation Guidelines for the Native Vegetation Maps of the Cumberland Plain, Western Sydney, Final ed.; National Parks and Wildlife Service: Sydney, Australia, 2002.
- Watson, P.J. Fire Frequencies for Western Sydney’s Woodlands: Indications from Vegetation Dynamics; University of Western Sydney: Sydney, Australia, 2005. [Google Scholar]
- Department of Planning Industry and Environment, Biodiversity Assessment Method; 2020.
- Oliver, I.; McNellie, M.J.; Steenbeeke, G.; Copeland, L.; Porteners, M.F.; Wall, J. Expert allocation of primary growth form to the New South Wales flora underpins the biodiversity assessment method. Australas. J. Environ. Manag. 2019, 26, 124–136. [Google Scholar] [CrossRef] [Green Version]
- Macfarlane, C.; Grigg, A.; Evangelista, C. Estimating forest leaf area using cover and fullframe fisheye photography: Thinking inside the circle. Agric. For. Meteorol. 2007, 146, 1–12. [Google Scholar] [CrossRef]
- Griebel, A.; Metzen, D.; Pendall, E.; Nolan, R.H.; Clarke, H.; Renchon, A.A.; Boer, M.M. Recovery from severe mistletoe infection after heat-and drought-induced mistletoe death. Ecosystems 2022, 25, 1–16. [Google Scholar] [CrossRef]
- Hewitt, A. Revisiting Tony Price’s (1979) account of the native vegetation of Duck River and Rookwood Cemetery, western Sydney. Cunninghamia 2013, 13, 25–124. [Google Scholar] [CrossRef]
- Gibbons, P.; Lindenmayer, D. Conserving Hollow-Dependent Fauna in Timber Production Forests. Environmental Heritage Monograph Series no. 3; New South Wales NPWS: Sydney, Australia, 1997.
- Gibbons, P.; Lindenmayer, D. Tree Hollows and Wildlife Conservation in Australia; CSIRO Publishing: Collingwood, Australia, 2002. [Google Scholar]
- Department of Planning Industry and Environment, Loss of Hollow-Bearing Trees—Key Threatening Process Listing. NSW Scientific Committee—Final Determination; 2007.
- Bradstock, R.A. A biogeographic model of fire regimes in Australia: Current and future implications. Glob. Ecol. Biogeogr. 2010, 19, 145–158. [Google Scholar] [CrossRef]
- Pausas, J.G.; Keeley, J.E. Wildfires and global change. Front. Ecol. Environ. 2021, 19, 387–395. [Google Scholar] [CrossRef]
- Camac, J.S.; Williams, R.J.; Wahren, C.H.; Hoffmann, A.A.; Vesk, P.A. Climatic warming strengthens a positive feedback between alpine shrubs and fire. Glob. Change Biol. 2017, 23, 3249–3258. [Google Scholar] [CrossRef] [Green Version]
- Fisher, J.L.; Loneragan, W.A.; Dixon, K.; Delaney, J.; Veneklaas, E.J. Altered vegetation structure and composition linked to fire frequency and plant invasion in a biodiverse woodland. Biol. Conserv. 2009, 142, 2270–2281. [Google Scholar] [CrossRef]
- Gott, B. Aboriginal fire management in south-eastern Australia: Aims and frequency. J. Biogeogr. 2005, 32, 1203–1208. [Google Scholar] [CrossRef]
- Watson, P.J.; Bradstock, R.A.; Morris, E.C. Fire frequency influences composition and structure of the shrub layer in an Australian subcoastal temperate grassy woodland. Austral Ecol. 2009, 34, 218–232. [Google Scholar] [CrossRef]
- Gosper, C.R.; Yates, C.J.; Fox, E.; Prober, S.M. Time since fire and prior fire interval shape woody debris dynamics in obligate-seeder woodlands. Ecosphere 2019, 10, e02927. [Google Scholar] [CrossRef]
- Prior, L.D.; Murphy, B.P.; Williamson, G.J.; Cochrane, M.A.; Jolly, W.M.; Bowman, D.M. Does inherent flammability of grass and litter fuels contribute to continental patterns of landscape fire activity? J. Biogeogr. 2017, 44, 1225–1238. [Google Scholar] [CrossRef]
- Butler, O.M.; Lewis, T.; Chen, C. Fire alters soil labile stoichiometry and litter nutrients in Australian eucalypt forests. Int. J. Wildland Fire 2017, 26, 783–788. [Google Scholar] [CrossRef]
- Toberman, H.; Chen, C.; Lewis, T.; Elser, J.J. High-frequency fire alters C: N: P stoichiometry in forest litter. Glob. Change Biol. 2014, 20, 2321–2331. [Google Scholar] [CrossRef] [PubMed] [Green Version]
- York, A.; Bell, T.L.; Weston, C.J. Fire regimes and soil-based ecological processes: Implications for biodiversity. In Fire Regimes, Biodiversity and Ecosystems in a Changing World, Ross Andrew Bradstock, R.J.W., Gill, A.M., Eds.; CSIRO Publishing: Collingwood, ON, Canada, 2012. [Google Scholar]
- Gallagher, R.V.; Allen, S.; Mackenzie, B.D.; Yates, C.J.; Gosper, C.R.; Keith, D.A.; Merow, C.; White, M.D.; Wenk, E.; Maitner, B.S. High fire frequency and the impact of the 2019–2020 megafires on Australian plant diversity. Divers. Distrib. 2021, 27, 1166–1179. [Google Scholar] [CrossRef]
- Kenny, B. Fire interval guidelines–what’s missing? In Proceedings of the Ninth Biennial Bushfire Conference, Sydney, Australia, 4–5 June 2013. [Google Scholar]
- Bonebrake, T.C.; Syphard, A.D.; Franklin, J.; Anderson, K.E.; AkÇAkaya, H.R.; Mizerek, T.; Winchell, C.; Regan, H.M. Fire Management, managed relocation, and land conservation options for long-lived obligate seeding plants under global changes in climate, urbanization, and fire regime. Conserv. Biol. 2014, 28, 1057–1067. [Google Scholar] [CrossRef] [PubMed] [Green Version]
- Enright, N.J.; Fontaine, J.B.; Lamont, B.B.; Miller, B.P.; Westcott, V.C. Resistance and resilience to changing climate and fire regime depend on plant functional traits. J. Ecol. 2014, 102, 1572–1581. [Google Scholar] [CrossRef] [Green Version]
- NSW Office of Environment and Heritage. Flora Fire Response Database (Version 2.1); NSW Department of Planning Industry and Environment: Parramatta, Australia, 2014.
- Griebel, A.; Watson, D.; Pendall, E. Mistletoe, friend and foe: Synthesizing ecosystem implications of mistletoe infection. Environ. Res. Lett. 2017, 12, 115012. [Google Scholar] [CrossRef]
- Barea, L.P.; Watson, D.M. Temporal variation in food resources determines onset of breeding in an Australian mistletoe specialist. Emu 2007, 107, 203–209. [Google Scholar] [CrossRef]
- Turner, R.; Smith, P. Mistletoes increasing in eucalypt forest near Eden, New South Wales. Aust. J. Bot. 2016, 64, 171–179. [Google Scholar] [CrossRef]
- Gosper, C.R.; Prober, S.M. Using a Multi-Century Post-Fire Chronosequence to Develop Criteria to Distinguish Prior and Bowman’s (2020) Post-Fire Obligate Coloniser and Fire-Intolerant Flora. Fire 2020, 3, 48. [Google Scholar] [CrossRef]
- Read, J.L.; Firn, J.; Grice, A.C.; Murphy, R.; Ryan-Colton, E.; Schlesinger, C.A. Ranking buffel: Comparative risk and mitigation costs of key environmental and socio-cultural threats in central Australia. Ecol. Evol. 2020, 10, 12745–12763. [Google Scholar] [CrossRef]
- Setterfield, S.A.; Rossiter-Rachor, N.A.; Douglas, M.M.; Wainger, L.; Petty, A.M.; Barrow, P.; Shepherd, I.J.; Ferdinands, K.B. Adding fuel to the fire: The impacts of non-native grass invasion on fire management at a regional scale. PLoS ONE 2013, 8, e59144. [Google Scholar] [CrossRef] [PubMed]
- Valentine, L.E.; Schwarzkopf, L. Effects of weed-management burning on reptile assemblages in Australian tropical savannas. Conserv. Biol. 2009, 23, 103–113. [Google Scholar] [CrossRef] [PubMed]
- McCarthy, M.A.; Possingham, H.P. Active adaptive management for conservation. Conserv. Biol. 2007, 21, 956–963. [Google Scholar] [CrossRef] [PubMed]
- Hewitt, A.; Rymer, P.; Holford, P.; Morris, E.C.; Renshaw, A. Evidence for clonality, breeding system, genetic diversity and genetic structure in large and small populations of Melaleuca deanei (Myrtaceae). Aust. J. Bot. 2019, 67, 36–45. [Google Scholar] [CrossRef]
- Rymer, P.D.; Ayre, D.J. Does genetic variation and gene flow vary with rarity in obligate seeding Persoonia species (Proteaceae)? Conserv. Genet. 2006, 7, 919–930. [Google Scholar] [CrossRef] [Green Version]
- Driscoll, D.A.; Lindenmayer, D.B.; Bennett, A.F.; Bode, M.; Bradstock, R.A.; Cary, G.J.; Clarke, M.F.; Dexter, N.; Fensham, R.; Friend, G. Fire masnagement for biodiversity conservation: Key research questions and our capacity to answer them. Biol. Conserv. 2010, 143, 1928–1939. [Google Scholar] [CrossRef]


| Community | SGW | IF | p Value |
|---|---|---|---|
| Fire history metrics | |||
| Time since fire | 7.7 ± 6.8 | 10.3 ± 7.5 | 0.01 |
| Fire frequency | 2.0 ± 1.1 | 1.6 ± 1.2 | 0.03 |
| Structural and Habitat Properties | |||
| Canopy height (m) | 9.2 ± 2.1 | 13.1 ± 4.3 | 0.00 |
| Canopy density | 4.2 ± 1.7 | 4.8 ± 2.2 | 0.14 |
| Leaf area index (m2 m−2) | 1.2 ± 0.7 | 1.3 ± 0.6 | 0.32 |
| Litter cover (%) ^ | 62.2 ± 21.9 | 72.7 ± 23.3 | 0.01 |
| Bare earth cover (%) ^ | 15.0 ± 16.4 | 12.7 ± 14.2 | 0.37 |
| Microbiotic crust cover (%) ^ | 3.3 ± 4.7 | 3.3 ± 4.4 | 0.98 |
| Woody debris (m) ^ | 28.3 ± 25.3 | 40.2 ± 4.4 | 0.01 |
| Hollow bearing trees ^ | 1.7 ± 2.2 | 0.5 ± 1.1 | 0.00 |
| Total hollow count ^ | 3.7 ± 6.9 | 1.0 ± 2.3 | 0.00 |
| Large trees (>50 cm) ^ | 1.2 ± 1.2 | 0.7 ± 0.9 | 0.01 |
| Total cover (%) ^ | 58.6 ± 28.1 | 49.8 ± 21.2 | 0.07 |
| Tree cover (%) ^ | 22.3 ± 11.6 | 27.1 ± 11.3 | 0.01 |
| Shrub cover (%) ^ | 21.2 ± 18.9 | 14.7 ± 17.3 | 0.00 |
| Vine cover (%) ^ | 0.2 ± 0.1 | 0.2 ± 0.2 | 0.57 |
| Mistletoe cover (%) ^ | 0.0 ± 0.01 | 0.03 ± 0.11 | 0.01 |
| Forb cover (%) ^ | 2.0 ± 1.8 | 1.5 ± 2.4 | 0.00 |
| Grass cover (%) ^ | 3.6 ± 8.9 | 1.5 ± 2.3 | 0.14 |
| Sedge and rush cover (%) ^ | 8.0 ± 10.9 | 4.5 ± 8.1 | 0.00 |
| Fern cover (%) ^ | 0.2 ± 0.8 | 0.09 ± 0.2 | 0.35 |
| Total herbaceous ground cover (%) ^ | 14.2 ± 14.8 | 7.8 ± 9.5 | 0.00 |
| Biodiversity Properties | |||
| Species richness (S) | 41.1 ± 9.3 | 31.4 ± 9.4 | 0.00 |
| Evenness (E) | 0.6 ± 0.1 | 0.5 ± 0.1 | 0.00 |
| Tree species richness ^ | 3.2 ± 1.0 | 2.2 ± 1.1 | 0.00 |
| Shrub species richness | 18.1 ± 4.8 | 10.8 ± 4.2 | 0.00 |
| Forb species richness ^ | 9.6 ± 5.3 | 7.8 ± 4.9 | 0.03 |
| Grass species richness ^ | 5.3 ± 3.2 | 5.7 ± 2.5 | 0.45 |
| Sedge and rush species richness ^ | 4.6 ± 1.8 | 4.3 ± 1.7 | 0.20 |
| Herbaceous groundcover species richness | 20.5 ± 8.0 | 18.8 ± 7.8 | 0.23 |
| Threatened species richness ^ | 1.3 ± 1.1 | 1.5 ± 0.8 | 0.19 |
| Exotic species richness ^ | 0.9 ± 2.0 | 1.2 ± 0.3 | 0.22 |
| Exotic weed cover (%) ^ | 0.2 ± 0.8 | 2.3 ± 1.1 | 0.17 |
| Obligate seeder richness ^ | 7.9 ± 3.1 | 6.7 ± 3.1 | 0.02 |
| Obligate seeder cover ^ | 3.5 ± 4.0 | 4.0 ± 7.4 | 0.13 |
| Resprouter richness | 30.5 ± 7.8 | 22.7 ± 7.7 | 0.00 |
| Resprouter cover ^ | 53.8 ± 26.9 | 45.2 ± 18.7 | 0.10 |
| Species with canopy seed (%) | 7.2 ± 1.9 | 4.1 ± 1.8 | 0.00 |
| Species with soil seed (%) ^ | 22.9 ± 6.6 | 17.2 ± 6.0 | 0.87 |
| All plots | All plots | SGW | SGW | IF | IF | |
|---|---|---|---|---|---|---|
| TSF | FF | TSF | FF | TSF | FF | |
| Fire frequency | −0.601 | NA | −0.472 | NA | −0.806 | NA |
| Structural and Habitat Properties | ||||||
| Canopy height (m) | 0.264 | −0.160 | 0.158 | −0.009 | 0.014 | 0.117 |
| Canopy density | 0.436 | −0.661 | 0.250 | −0.653 | 0.777 | −0.660 |
| Leaf area index (m2 m−2) | 0.335 | −0.428 | 0.285 | −0.432 | 0.365 | −0.370 |
| Leaf litter (%) | 0.592 | −0.469 | 0.562 | −0.390 | 0.531 | −0.479 |
| Bare earth (%) | −0.653 | 0.407 | −0.646 | 0.294 | −0.674 | 0.615 |
| Microbiotic soil crust (%) | 0.421 | −0.227 | 0.394 | −0.182 | 0.515 | −0.309 |
| Woody debris (m) | 0.164 | −0.187 | 0.207 | −0.227 | −0.132 | 0.036 |
| Hollow bearing trees | 0.048 | −0.140 | 0.193 | −0.220 | 0.044 | −0.218 |
| Total hollow count | 0.009 | −0.132 | 0.126 | −0.209 | 0.034 | −0.214 |
| Large trees (>50 cm) | 0.029 | −0.116 | 0.171 | −0.270 | −0.167 | 0.108 |
| Total cover (%) | 0.083 | −0.106 | 0.193 | −0.267 | −0.050 | 0.065 |
| Tree cover (%) | 0.246 | −0.191 | 0.152 | −0.172 | 0.288 | −0.162 |
| Shrub cover (%) | −0.095 | 0.236 | 0.153 | 0.005 | −0.405 | 0.477 |
| Mistletoe cover (%) | 0.305 | −0.315 | 0.102 | −0.108 | 0.497 | −0.512 |
| Forb cover (%) | 0.045 | −0.140 | 0.131 | −0.240 | 0.041 | −0.158 |
| Grass cover (%) | 0.171 | −0.121 | 0.133 | −0.094 | 0.418 | −0.287 |
| Sedge and rush cover (%) | −0.198 | −0.012 | −0.117 | −0.047 | −0.156 | −0.118 |
| Fern cover (%) | 0.070 | −0.213 | 0.007 | −0.163 | 0.187 | −0.250 |
| Herbaceous ground cover (%) | −0.026 | −0.169 | 0.051 | −0.221 | 0.015 | −0.280 |
| Biodiversity Properties | ||||||
| Species richness (S) | −0.132 | 0.222 | 0.001 | 0.318 | −0.081 | −0.163 |
| Evenness (E) | 0.005 | 0.070 | 0.184 | −0.026 | 0.049 | 0.018 |
| Tree richness | 0.027 | −0.152 | 0.106 | −0.234 | 0.149 | −0.348 |
| Shrub richness | −0.217 | 0.394 | 0.087 | 0.341 | −0.531 | 0.366 |
| Forb richness | 0.028 | −0.041 | 0.036 | 0.063 | 0.127 | −0.291 |
| Grass richness | 0.147 | −0.034 | 0.046 | 0.207 | 0.349 | −0.420 |
| Sedge and rush richness | −0.289 | 0.257 | −0.347 | 0.419 | −0.116 | −0.1.00 |
| Herbaceous ground cover richness | 0.025 | −0.023 | −0.009 | 0.156 | 0.187 | −0.380 |
| Threatened species richness | 0.124 | 0.005 | 0.229 | −0.135 | −0.263 | 0.330 |
| Exotic species richness | 0.027 | −0.164 | −0.141 | 0.001 | 0.314 | −0.387 |
| Exotic species cover (%) | 0.027 | −0.137 | −0.137 | 0.015 | 0.280 | −0.316 |
| Obligate seeder richness | 0.120 | 0.049 | 0.319 | −0.016 | −0.155 | 0.013 |
| Obligate seeder cover (%) | 0.176 | −0.078 | 0.353 | −0.233 | −0.065 | 0.095 |
| Resprouter richness | −0.134 | 0.207 | −0.015 | 0.282 | −0.062 | −0.176 |
| Resprouter cover (%) | 0.071 | −0.097 | 0.159 | −0.242 | −0.021 | 0.035 |
| Species with canopy seed (%) | −0.115 | 0.125 | −0.002 | −0.031 | −0.068 | 0.099 |
| Species with soil seed (%) | −0.070 | 0.131 | 0.119 | −0.097 | −0.469 | 0.491 |
Publisher’s Note: MDPI stays neutral with regard to jurisdictional claims in published maps and institutional affiliations. |
© 2022 by the authors. Licensee MDPI, Basel, Switzerland. This article is an open access article distributed under the terms and conditions of the Creative Commons Attribution (CC BY) license (https://creativecommons.org/licenses/by/4.0/).
Share and Cite
Pendall, E.; Hewitt, A.; Boer, M.M.; Carrillo, Y.; Glenn, N.F.; Griebel, A.; Middleton, J.H.; Mumford, P.J.; Ridgeway, P.; Rymer, P.D.; et al. Remarkable Resilience of Forest Structure and Biodiversity Following Fire in the Peri-Urban Bushland of Sydney, Australia. Climate 2022, 10, 86. https://0-doi-org.brum.beds.ac.uk/10.3390/cli10060086
Pendall E, Hewitt A, Boer MM, Carrillo Y, Glenn NF, Griebel A, Middleton JH, Mumford PJ, Ridgeway P, Rymer PD, et al. Remarkable Resilience of Forest Structure and Biodiversity Following Fire in the Peri-Urban Bushland of Sydney, Australia. Climate. 2022; 10(6):86. https://0-doi-org.brum.beds.ac.uk/10.3390/cli10060086
Chicago/Turabian StylePendall, Elise, Alison Hewitt, Matthias M. Boer, Yolima Carrillo, Nancy F. Glenn, Anne Griebel, Jason H. Middleton, Peter J. Mumford, Peter Ridgeway, Paul D. Rymer, and et al. 2022. "Remarkable Resilience of Forest Structure and Biodiversity Following Fire in the Peri-Urban Bushland of Sydney, Australia" Climate 10, no. 6: 86. https://0-doi-org.brum.beds.ac.uk/10.3390/cli10060086