

Trees Diversity and Species with High Ecological Importance for a Resilient Urban Area: Evidence from Cotonou City (West Africa)
 , ,
, ,
Abstract
:1. Introduction
- -
- evaluating the floristic diversity in terms of tree composition of the different land use units through different ecological indexes.
- -
- prioritizing the top species that have ecological importance in order to allow future studies related to climate impacts on them and their preservation.
- -
- making recommendations to protect urban species from climate change impacts and other threats (like species invasion).
2. Methodology
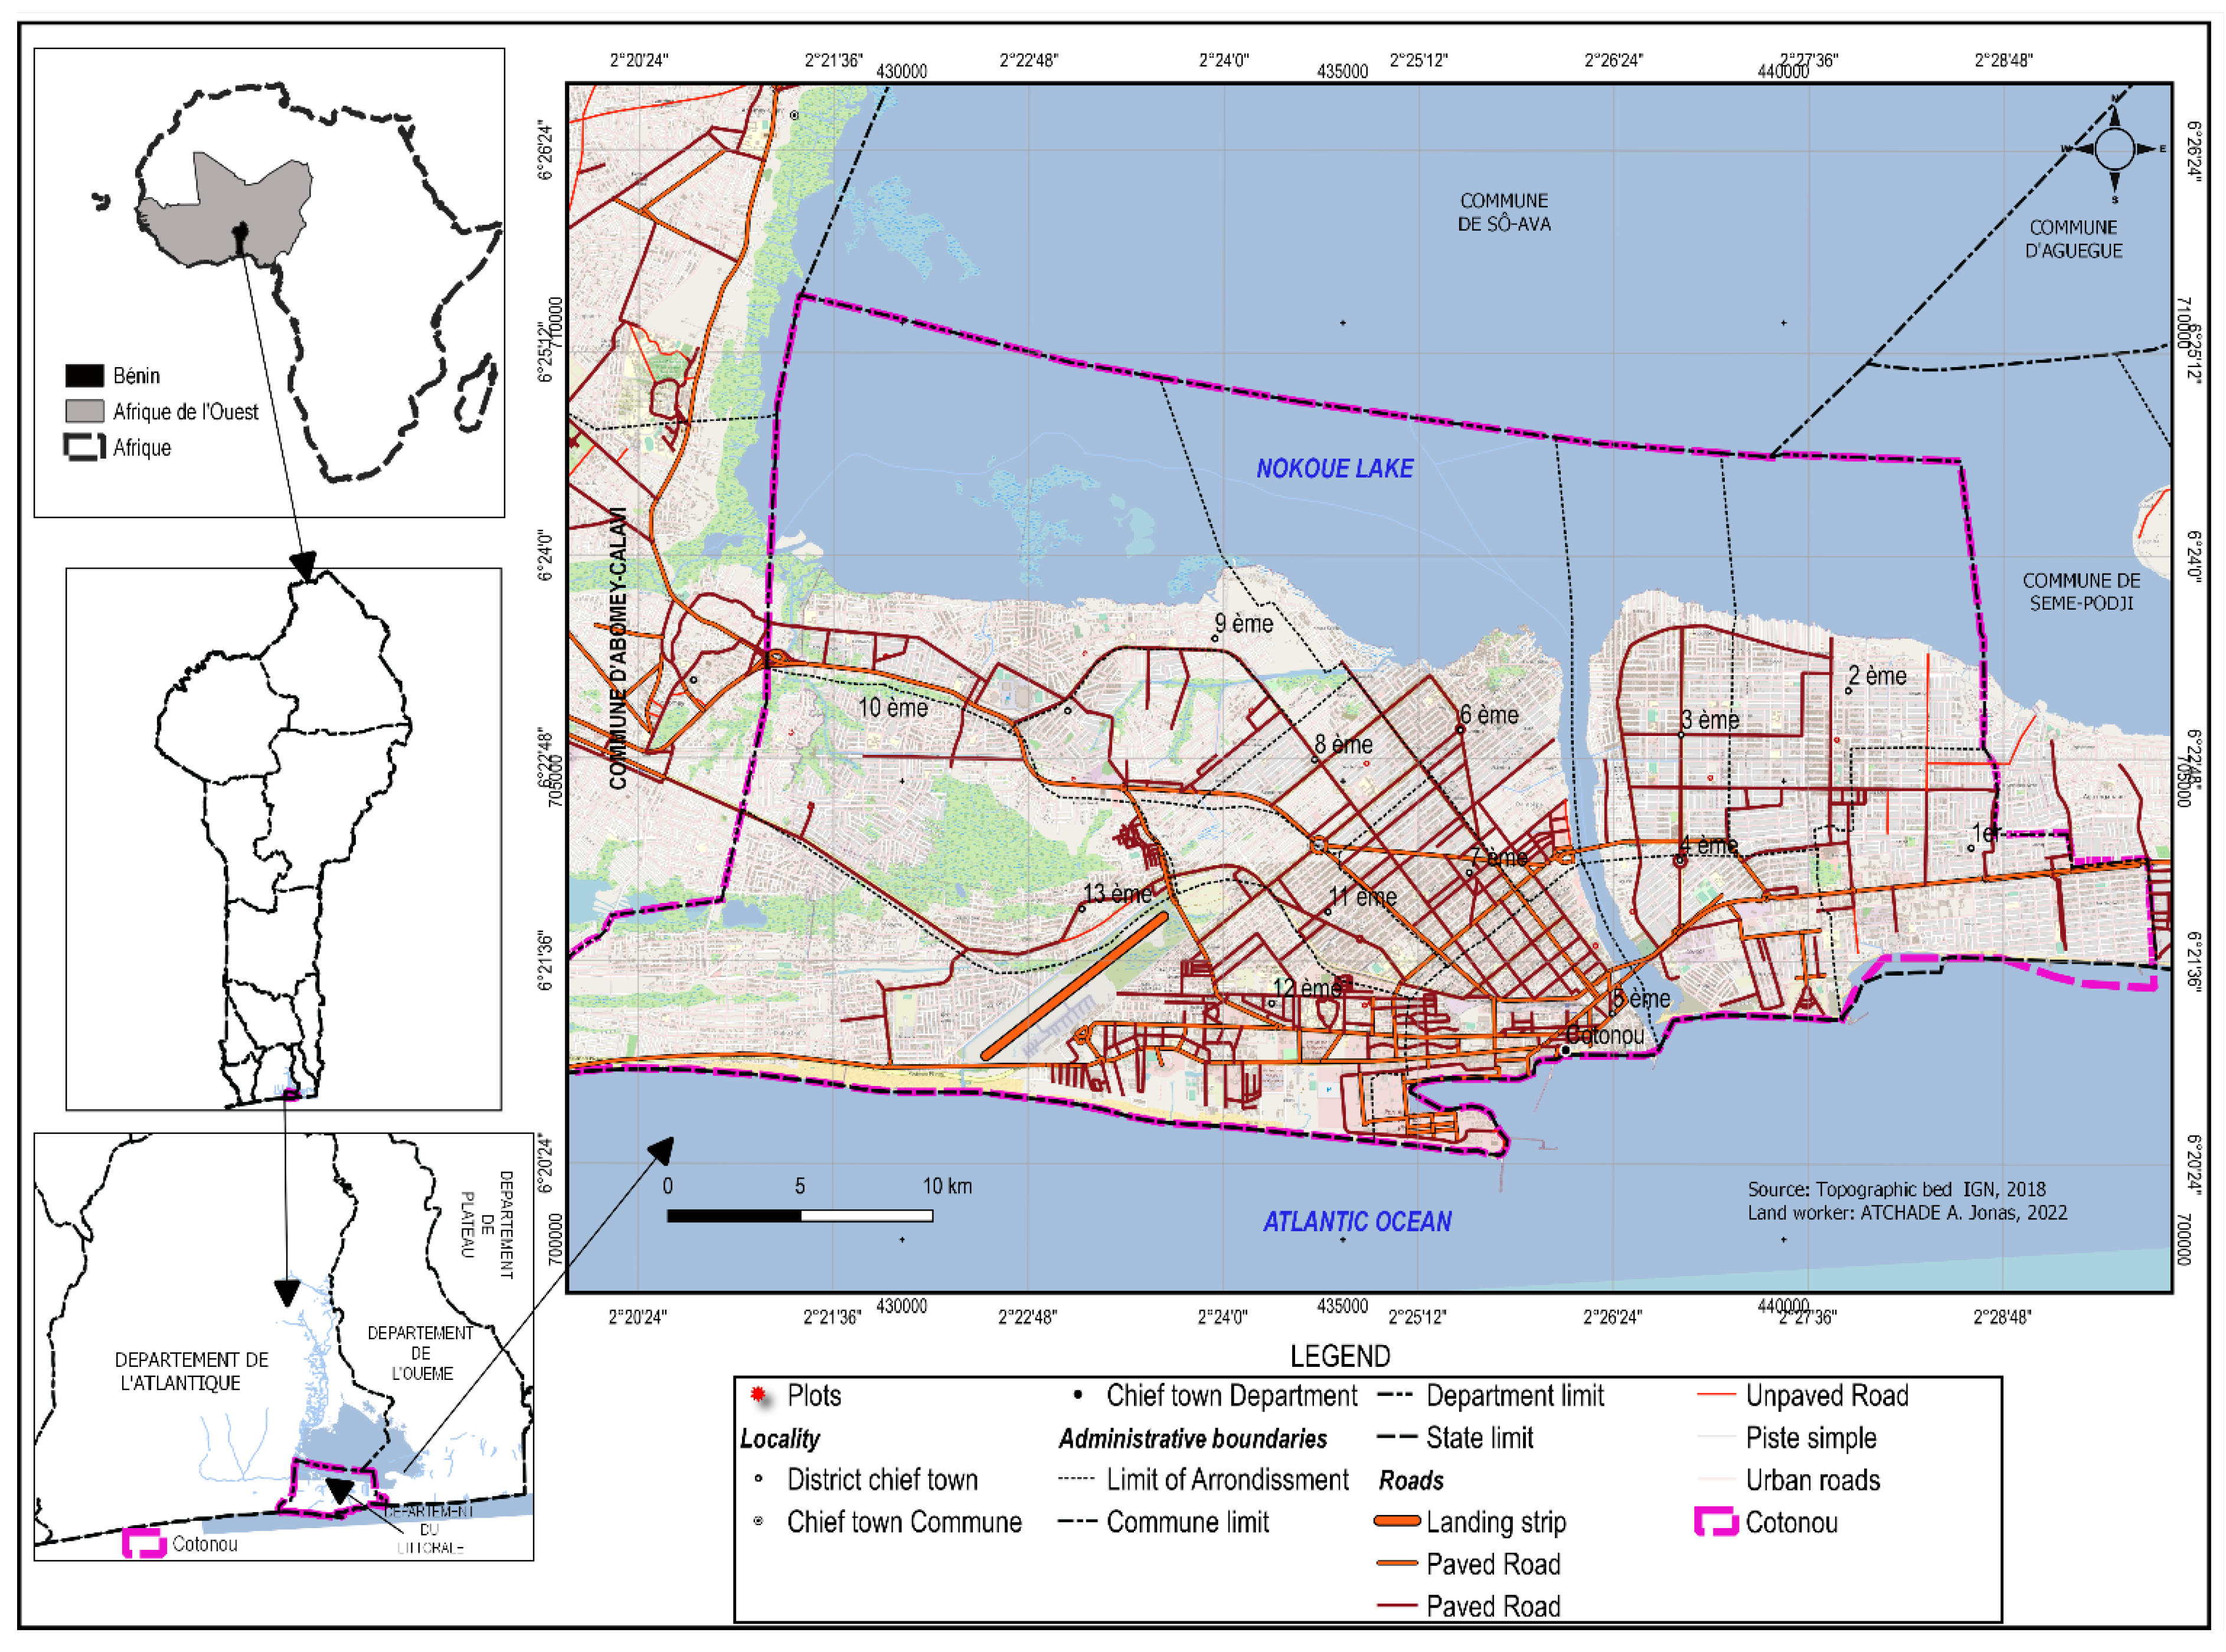
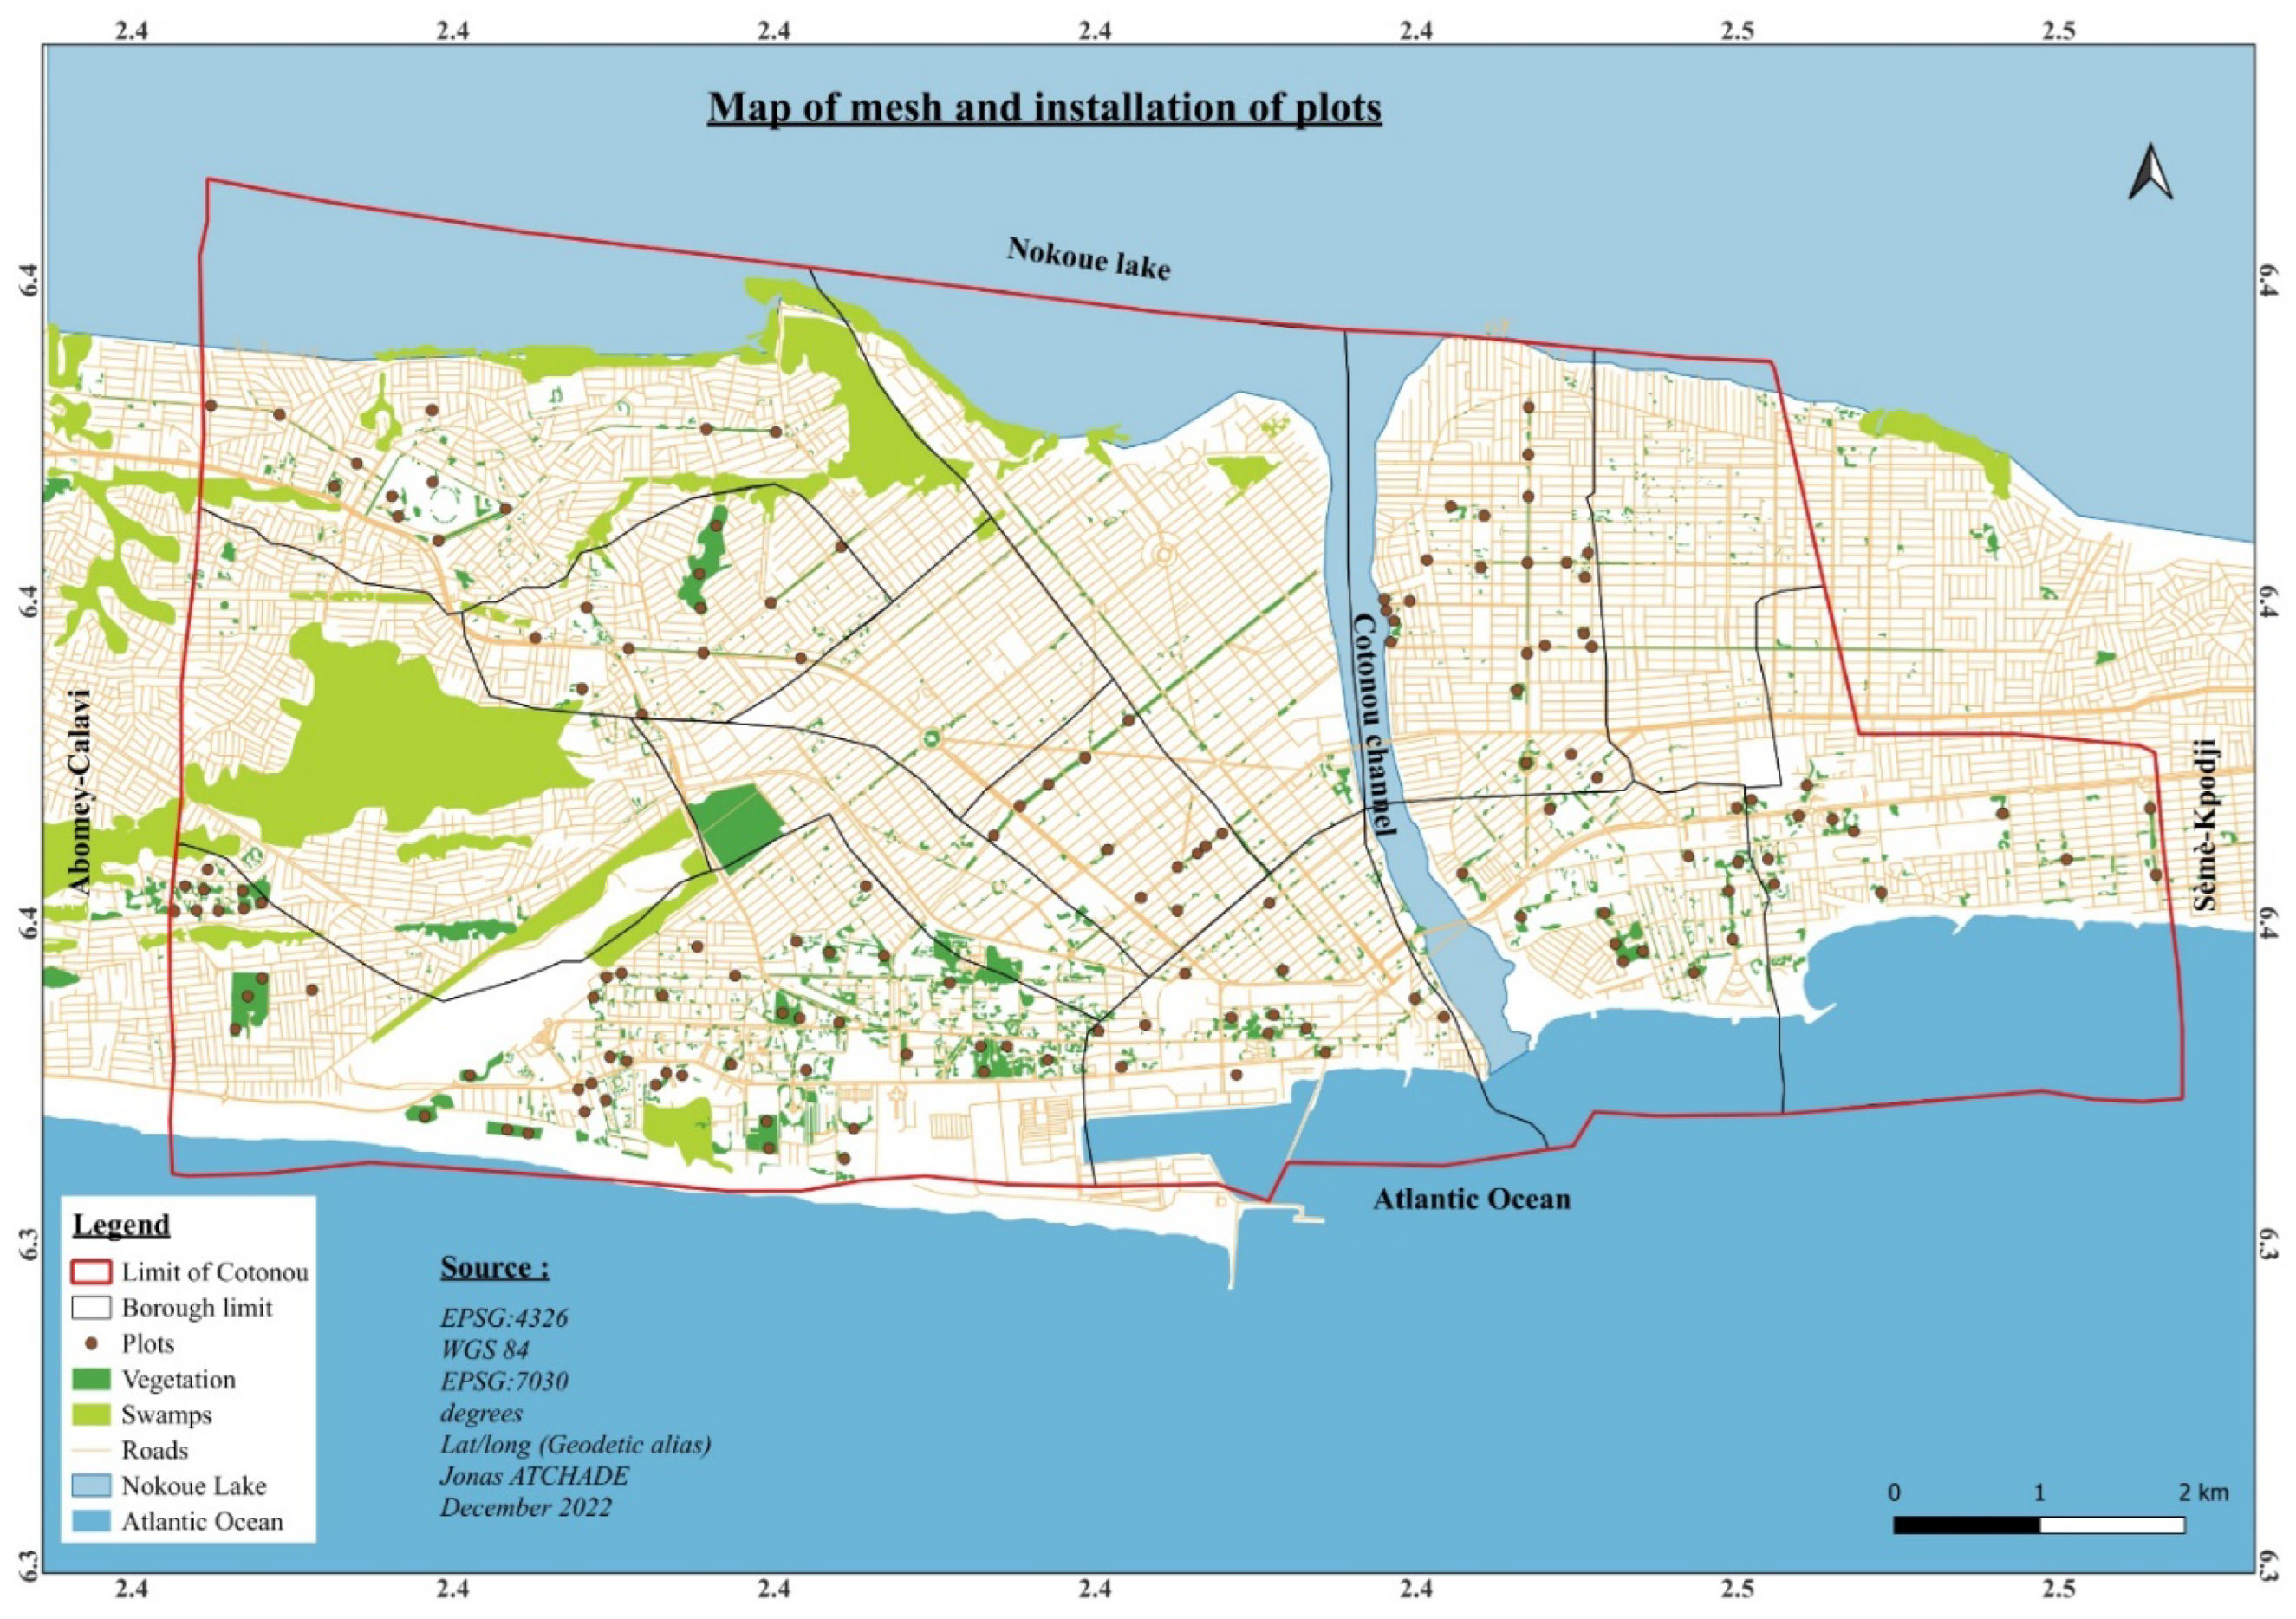
2.1. Study Area
2.2. Data Collection and Analysis
2.3. Data Processing and Analysis
2.3.1. Taxonomic Diversity
2.3.2. Study of Species with High Ecological Importance in the City of Cotonou
2.3.3. Statistical Software
3. Results
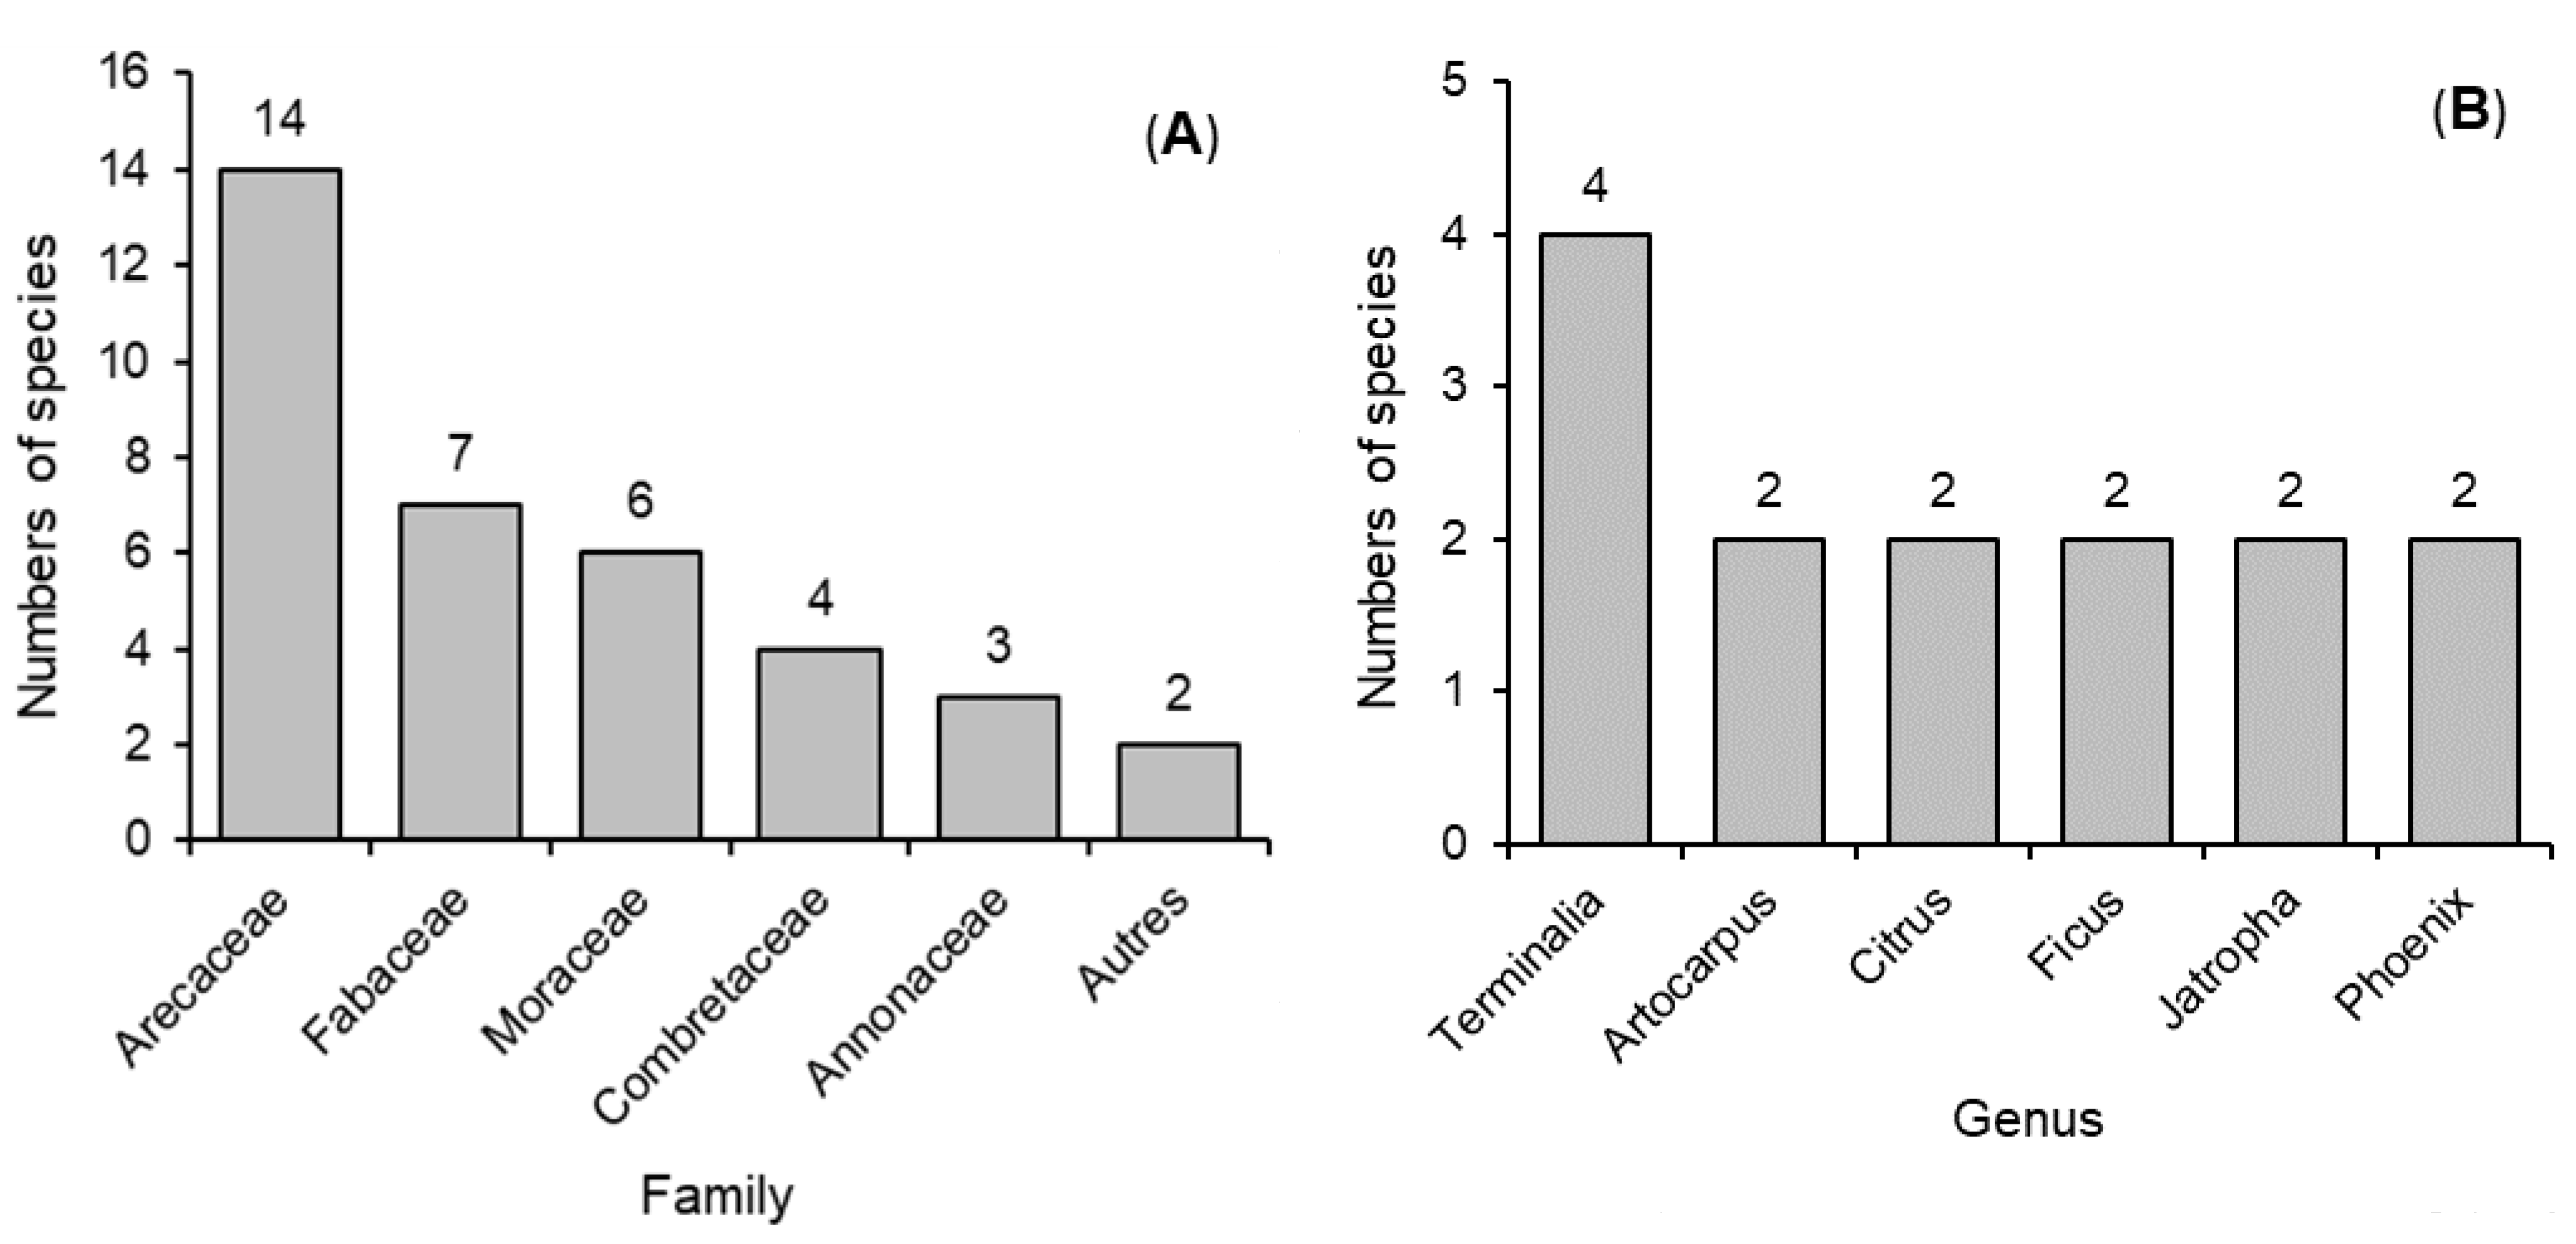
3.1. Floristic Diversity in the Land Use Units in the City of Cotonou
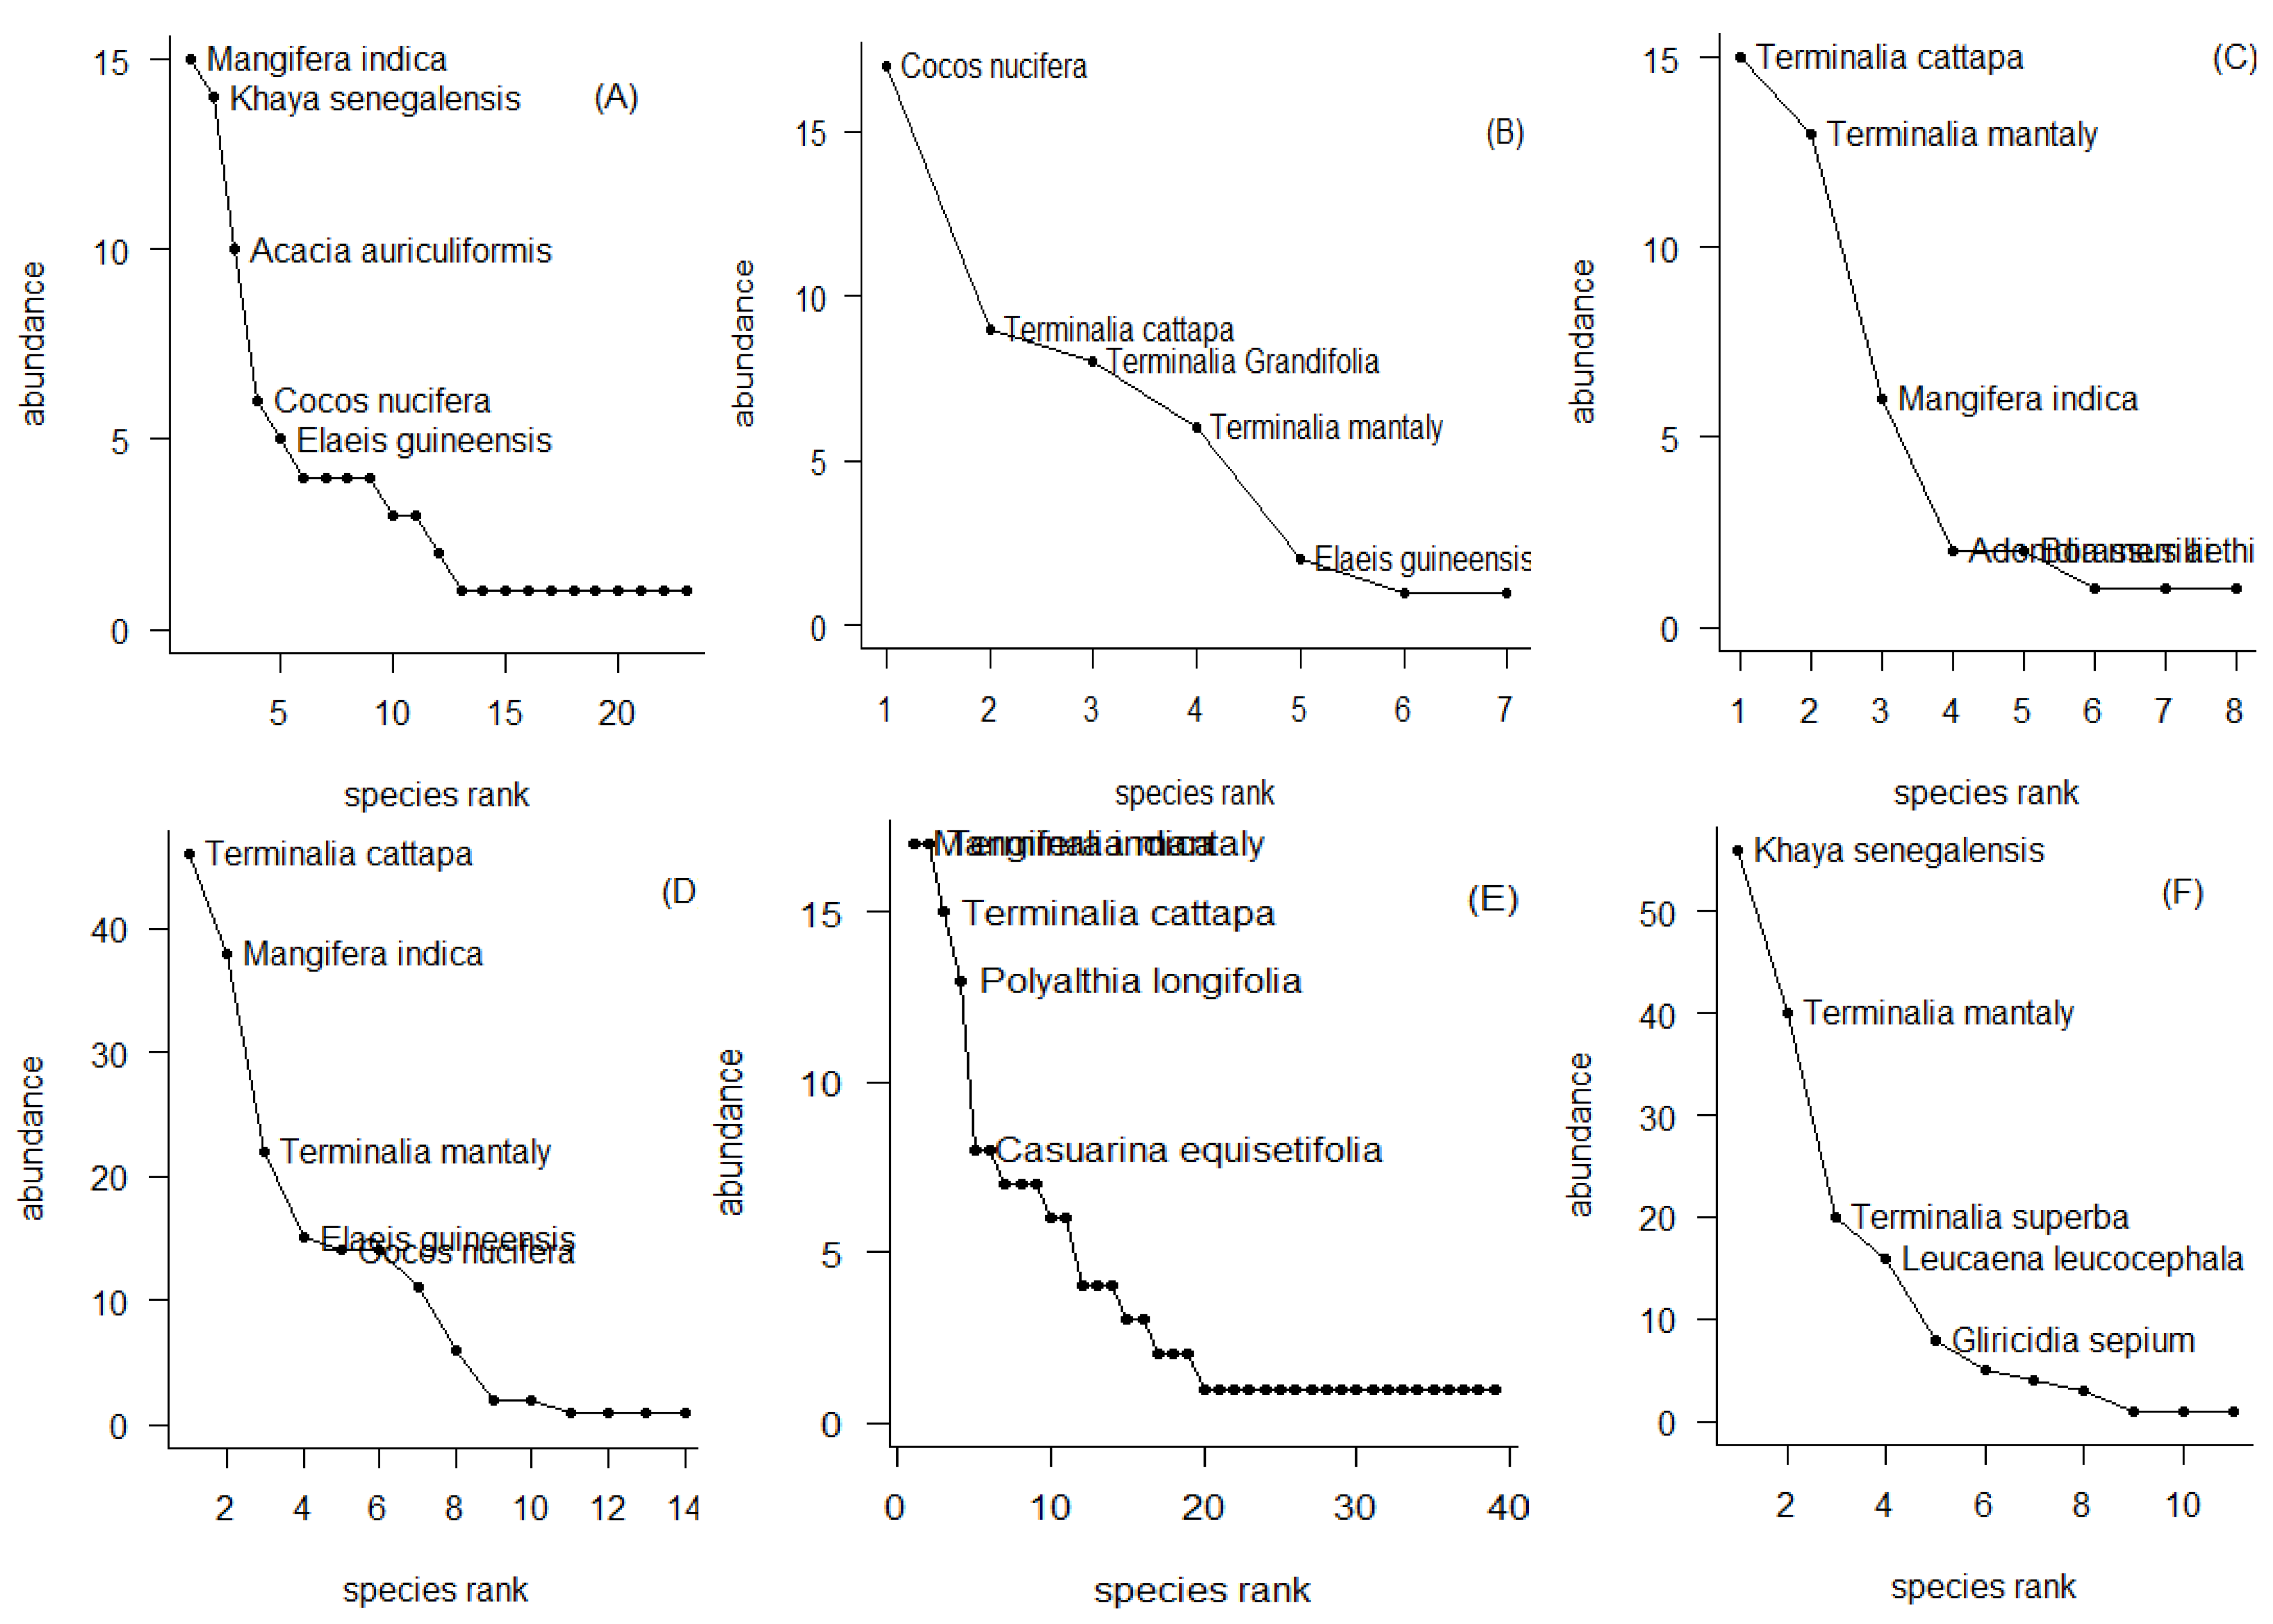
3.2. Top Five (5) Most Abundant Species in Land Use Units in the Cotonou City
3.3. Ecological Importance of Species in the City of Cotonou
4. Discussion
4.1. Floristic Composition and Specific Diversity of the Urban Vegetation
4.2. Specific Diversity of Vegetation, Abundance of Exotic Species, and Ecological Importance in the Land Use Units
5. Conclusions
Author Contributions
Funding
Institutional Review Board Statement
Informed Consent Statement
Data Availability Statement
Acknowledgments
Conflicts of Interest
References
- United Nations. Revision of World Urbanization Prospects. 2018. Available online: https://www.un.org/development/desa/pd/news/world-urbanization-prospects-2018 (accessed on 18 May 2023).
- Elmqvist, T.; Fragkias, M.; Goodness, J.; Güneralp, B.; Marcotullio, P.J.; McDonald, R.I.; Parnell, S.; Schewenius, M.; Sendstad, M.; Seto, K.C.; et al. Urbanization, Biodiversity and Ecosystem Services: Challenges and Opportunities: A Global Assessment; Springer: Dordrecht, The Netherlands, 2013; ISBN 978-94-007-7088-1. [Google Scholar]
- Selmi, W.; Weber, C. Évaluation des services écosystémiques urbains: De la rhétorique à la pratique. L’apport de l’approche par habitat. Environ. Urbain Urban Environ. 2017, 11. Available online: http://journals.openedition.org/eue/1799 (accessed on 24 August 2023). [CrossRef]
- Institut National de la Statistique et de l’Analyse Economique (INSAE). Rgph4: Que Retenir Des Effectifs De Population En 2013? Repub. Benin 2015, 35. Available online: http://arks.princeton.edu/ark:/88435/dsp017p88cj91w (accessed on 24 August 2023).
- Semeraro, T.; Scarano, A.; Pandey, R. Ecosystem Services Analysis and Design through Nature-Based Solutions in Urban Planning at a Neighbourhood Scale. Urban Sci. 2022, 6, 23. [Google Scholar] [CrossRef]
- McDonald, R.I.; Marcotullio, P.J.; Güneralp, B. Urbanization and global trends in biodiversity and ecosystem services. In Urbanization, Biodiversity and Ecosystem Services: Challenges and Opportunitie; Springer: Dordrecht, The Netherlands, 2013; pp. 31–52. [Google Scholar]
- Doucoure, D.; Fleury, A. La place de l’agriculture urbaine dans les dispositifs institutionnels et la planification. In Developpement Durable de L’agriculture Urbaine en Afrique Francophone: Enjeux, Concepts et Méthodes; Cirad, C., Ed.; CRDI: Ottawa, ON, Canada, 2004; pp. 45–78. ISBN 1-55250-134-5. Available online: http://www.crdi.ca (accessed on 24 August 2023).
- Reghezza-Zitt, M.; Sanseverino-Godfrin, V. Aménagement durable des territoires soumis à de fortes contraintes: Enjeux et perspectives à travers l’examen des outils juridiques. L’exemple de la basse vallée du Var (06). Ann. Georgr. 2012, 685, 242. [Google Scholar] [CrossRef]
- Fousséni, F.; Wouyo, A.; Madjouma, K.; Djibril, K.; Kissao, G.; Kperkouma, W.; Koffi, A. Flore des espaces verts urbains de la ville d’Atakpamé au Togo. Synth. Rev. Sci. Technol. 2019, 25, 25–39. [Google Scholar]
- Pendall, E.; Hewitt, A.; Boer, M.M.; Carrillo, Y.; Glenn, N.F.; Griebel, A.; Middleton, J.H.; Mumford, P.J.; Ridgeway, P.; Rymer, P.D.; et al. Remarkable Resilience of Forest Structure and Biodiversity Following Fire in the Peri-Urban Bushland of Sydney, Australia. Climate 2022, 10, 86. [Google Scholar] [CrossRef]
- Seastedt, T.R.; Oldfather, M.F. Climate Change, Ecosystem Processes and Biological Diversity Responses in High Elevation Communities. Climate 2021, 9, 87. [Google Scholar] [CrossRef]
- Atchadé, A.J.; Kanda, M.; Folega, F.; Atela, J.; Dourma, M.; Wala, K.; Akpagana, K. Urban Ecosystem Services and Determinants of Stakeholders’ Perception for Sustainable Cities Planning in Cotonou (Benin). Sustainability 2023, 15, 9424. [Google Scholar] [CrossRef]
- Adhikari, S.; Struwig, M.; Siebert, S.J. Identifying Common Trees and Herbaceous Plants to Mitigate Particulate Matter Pollution in a Semi-Arid Mining Region of South Africa. Climate 2023, 11, 9. [Google Scholar] [CrossRef]
- Gómez-Baggethun, E.; Barton, D.N. Classifying and valuing ecosystem services for urban planning. Ecol. Econ. 2013, 86, 235–245. [Google Scholar] [CrossRef]
- Li, K.; Zhang, G. Species Diversity and Distribution Pattern of Heritage Trees in the Rapidly-Urbanizing Province of Jiangsu, China. Forests 2021, 12, 1543. [Google Scholar] [CrossRef]
- Polorigni, B.; Radji, R.; Kokou, K. Perceptions, tendances et préférences en foresterie urbaine: Cas de la ville de Lomé au Togo. Eur. Sci. J. 2014, 10, 261–277. [Google Scholar]
- Nero, B.F.; Callo-Concha, D.; Denich, M. Structure, Diversity, and Carbon Stocks of the Tree, Community of Kumasi, Ghana. Forests 2018, 9, 519. [Google Scholar] [CrossRef]
- Alpaidze, L.; Pace, R. Ecosystem Services Provided by Urban Forests in the Southern Caucasus Region: A Modeling Study in Tbilisi, Georgia. Climate 2021, 9, 157. [Google Scholar] [CrossRef]
- Sehoun, L.C.; Lougbegnon, T.O.; Codjia, J.C.T. Connaissances Et Perceptions Des Services Écosystémiques Des Espaces Verts Des Villes De Cotonou, Abomey-Calavi Et Allada Du Sud Bénin: Implications Pour La Gestion Durable Des Forêts Urbaines Et Péri-Urbaines. Eur. Sci. J. 2020, 16, 284. [Google Scholar] [CrossRef]
- Teka, O.; Togbe, C.E.; Djikpo, R.; Chabi, R.; Djossa, B. Effects of Urban Forestry on the Local Climate in Cotonou, Benin Republic. Agric. For. Fish. 2017, 6, 123–129. [Google Scholar] [CrossRef]
- Wari, B.O.; Zakari, S.; Djaouga, M.; Imorou, I.T.; Yabi, I.; Tente, B.A.; Djego, J.G. Diversité et structure de la végétation ligneuse dans la ville de Malanville au Nord-Bénin. Int. J. Biol. Chem. Sci. 2021, 15, 129–143. [Google Scholar] [CrossRef]
- Moussa, S.; Boateng, K.; Shem, K.; Abasse, T.; Mahamane, S. Composition Floristique et Structure des Forêts Urbaines des Villes Sahéliennes: Cas de Niamey et Maradi, Niger. Sci. Vie Terre Agron. Rev. Ramres 2020, 7. [Google Scholar]
- Radji, R.; Kokou, K.; Akpagana, K. Etude diagnostique de la flore ornementale togolaise. Int. J. Biol. Chem. Sci. 2010, 4, 491–508. [Google Scholar] [CrossRef]
- Aronson, M.F.J.; La Sorte, F.A.; Nilon, C.H.; Katti, M.; Goddard, M.A.; Lepczyk, C.A.; Warren, P.S.; Williams, S.G.; Cilliers, S.; Clarkson, B.; et al. A global analysis of the impacts of urbanization on bird and plant diversiy reveals key anthropogenic drivers. Proc. R. Soc. B Biol. Sci. 2014, 281, 20133330. [Google Scholar] [CrossRef]
- Boko, M. Climats et Communautés Rurales du Bénin: Rythmes Climatiques et Rythmes de Développement. Doctorate Thesis, Université de Dijon, Dijon, France, 1988. [Google Scholar]
- FAO. Guidelines on Urban and Peri-Urban Forestry FAO. Forestry Paper; FAO: Rome, Italia, 2016. [Google Scholar]
- Amontcha, A.A.M. Typologie, Utilités et Contraintes à L’aménagement des Espaces Verts Dans les Villes du Grand Nokoué (sud-Bénin). Ph.D. Thesis, Université d’Abomey-Calavi, Abomey-Calavi, Benin, 2018; 243p. [Google Scholar]
- Thiombiano, A.; Glele Kakaï, R.; Bayen, P.; Boussim, J.I.; Mahamane, A. Méthodes et dispositifs d’inventaires forestiers en afrique de l’ouest: État des lieux et propositions pour une harmonisation. Ann. Sci. Agron. 2016, 20, 15–31. [Google Scholar]
- Akoegninou, A.; Van der Burg, W.J.; Van der Maesen, L.J.G. Flore Analytique du Bénin; Backhuys Publishers: Wageningen, The Netherlands, 2006. [Google Scholar]
- Oksanen, J.; Simpson, G.L.; Blanchet, F.G.; Kindt, R.; Legendre, P.; Minchin, P.R.; O’Hara, R.B.; Solymos, P.; Stevens, M.H.H.; Szoecs, E.; et al. vegan: Community Ecology Package. R Package Version 2.5-7. 2020. Available online: https://CRAN.R-project.org/package=vegan (accessed on 25 December 2022).
- Curtis, J.T.; McIntosh, R.P. An upland forest continuum in the prairie-forest border region of Wisconsin. Ecology 1951, 32, 476–496. [Google Scholar] [CrossRef]
- R Core Team. R: A Language and Environment for Statistical Computing; R Foundation for Statistical Computing: Vienna, Austria, 2021; Available online: https://www.R-project.org/ (accessed on 24 August 2023).
- Peters, D.P.C.; Savoy, H.M.; Stillman, S.; Huang, H.; Hudson, A.R.; Sala, O.E.; Vivoni, E.R. Plant Species Richness in Multiyear Wet and Dry Periods in the Chihuahuan Desert. Climate 2021, 9, 130. [Google Scholar] [CrossRef]
- Nero, B.F.; Campion, B.B.; Agbo, N.; Callo-Concha, D.; Denich, M. Tree and trait diversity, species coexistence, and diversityfunctional relations of green spaces in Kumasi, Ghana. Procedia Eng. 2017, 198, 99–115. [Google Scholar] [CrossRef]
- Xin, W.; Zhe, Z.; Haiguang, H.; Chao, Z.; Ding, W. Analysis on the effects of ecological conservation redline policies in the Pearl River Delta area, China. Front. Ecol. Evol. Sec. Urban Ecol. 2023, 11, 1164602. [Google Scholar] [CrossRef]
- Agbogidi, E.B.; Adolor, O.M. Home gardens in the maintenance of biological diversity. Appl. Sci. 2013, 1, 19–25. [Google Scholar]
- Eichemberg, M.T.; Amorozo, M.C.D.M.; Moura, L.C.D. Species composition and plant use in old urban homegardens in Rio Claro, Southeast of Brazil. Acta Bot. Bras. 2009, 23, 1057–1075. [Google Scholar] [CrossRef]
- Sinsin, B.; Oumorou, M. Étude de la diversité spécifique du groupement à Cochlospermum tinctorium A. Rich, des savanes arbustives du nord-Bénin. Acta Bot. Gall. 2000, 147, 345–360. [Google Scholar] [CrossRef]
- Osseni, A.; Toko, M.; Tohozin, B.; Sinsin, B. SIG et gestion des espaces verts dans la ville de PortoNovo au Bénin. Tropicultura 2015, 33, 146–156. [Google Scholar]
- Logbo, J.; Yedomonhan, P.; Tente Akoegninou, A. Distribution et habitats de Newbouldia laevis (P.Beauv.) Seemann ex Bureau et de Dracaena arborea (Willd.) Link dans les zones bioclimatiques du Bénin. Int. J. Biol. Chem. Sci. 2020, 14, 2903–2927. [Google Scholar] [CrossRef]
- Dardour, M.; Daroui, E.A.; Boukroute, A.; Kouddane, N.-E.; Berrichi, A. Inventaire et état sanitaire des arbres d’alignement de la ville de Saïdia (Maroc oriental). Nat. Technol. 2014, 10, 2. [Google Scholar]
- Vroh, B.T.A. Évaluation de la diversité et estimation de la biomasse aérienne des arbres du jardin botanique de Bingerville (District d’Abidjan, Côte d’Ivoire). Eur. Sci. J. 2016, 12, 185–201. [Google Scholar]


| Parameters | Formulars | Descriptions |
|---|---|---|
| Community density (N, tiges ha−1) | n: Total numbers of stems in the plot s: surface of the plot (ha−1) | |
| Basal surface (G, m2 ha−1) | di: diameter (cm) of the stem i of the plot; s: area of plot in ha | |
| Contribution to basal area (Cs, %) | Gpi: basal area of the individuals of species i; G: basal area of the whole individuals of the plot |
| Type Occupation | Specific Richness (S) | Shannon Index (H) | Piélou Equitability (Eq) | Number of Genera (GE) | Number of Families (FA) |
|---|---|---|---|---|---|
| Administrative | 23 | 2.68 a | 0.86 a | 21 | 11 |
| Commercial | 7 | 1.59 b | 0.82 a | 5 | 4 |
| Green spaces | 8 | 1.58 b | 0.76 a | 7 | 4 |
| Establishment | 14 | 2.07 b | 0.79 a | 13 | 10 |
| Residence | 39 | 3.15 a | 0.86 a | 37 | 20 |
| Roads | 11 | 1.75 b | 0.73 a | 8 | 6 |
| Total | 62 | 2.86 | 0.69 | 55 | 27 |
| Probability | - | <0.001 | >0.5 | - | - |
| Land Use Units | Species | RFα (%) | RDα (%) | DoRα (%) | IVI (%) |
|---|---|---|---|---|---|
| Administrative | Mangifera indica | 10.34 | 20.55 | 33.17 | 64.06 |
| Khaya senegalensis | 10.34 | 19.18 | 30.17 | 59.69 | |
| Acacia auriculiformis | 10.34 | 13.70 | 4.33 | 28.37 | |
| Terminalia mantaly | 3.45 | 5.48 | 10.29 | 19.22 | |
| Elaeis guineensis | 6.90 | 6.85 | 3.98 | 17.73 | |
| Commercial | Terminalia cattapa | 25.00 | 30.00 | 66.47 | 121.47 |
| Cocos nucifera | 37.50 | 56.67 | 18.82 | 112.99 | |
| Mangifera indica | 12.50 | 3.33 | 13.03 | 28.87 | |
| Elaeis guineensis | 12.50 | 6.67 | 0.86 | 20.03 | |
| Acacia auriculiformis | 12.50 | 3.33 | 0.81 | 16.65 | |
| Green spaces | Terminalia cattapa | 30.00 | 38.46 | 44.69 | 113.15 |
| Terminalia mantaly | 20.00 | 33.33 | 37.17 | 90.50 | |
| Mangifera indica | 10.00 | 15.38 | 16.37 | 41.75 | |
| Borassus aethiopum | 10.00 | 5.13 | 0.20 | 15.33 | |
| Khaya senegalensis | 10,00 | 2.56 | 1.48 | 14.04 | |
| Establishment | Terminalia cattapa | 23.40 | 27.61 | 35.15 | 86.16 |
| Mangifera indica | 17.02 | 23.31 | 30.13 | 70.47 | |
| Terminalia mantaly | 14.89 | 13.50 | 15.82 | 44.21 | |
| Khaya senegalensis | 8,51 | 8.59 | 11.08 | 28.18 | |
| Elaeis guineensis | 12,77 | 9.20 | 4.83 | 26.80 | |
| Residence | Mangifera indica | 12.00 | 14.17 | 25.90 | 52.06 |
| Terminalia mantaly | 6.00 | 14.17 | 26.02 | 46.18 | |
| Terminalia cattapa | 8.00 | 12.50 | 21.19 | 41.69 | |
| Khaya senegalensis | 6.00 | 6.67 | 12.89 | 25.56 | |
| Polyalthia longifolia | 6.00 | 10.83 | 3.63 | 20.46 | |
| Roads | Khaya senegalensis | 36.36 | 54.37 | 60.43 | 151.16 |
| Terminalia mantaly | 31.82 | 28.16 | 27.40 | 87.37 | |
| Terminalia cattapa | 13.64 | 4.85 | 568 | 24.17 | |
| Leucaena leucocephala | 4.55 | 7.77 | 5.80 | 18.11 | |
| Acacia auriculiformis | 4.55 | 2.91 | 4.61 | 12.07 |
| Species | Genus | Family |
|---|---|---|
| Acacia auriculiformis | Acacia | Fabaceae |
| Adonidia merrillii | Adonidia | Arecaceae |
| Anacardium occidentale | Anacardium | Anacardiaceae |
| Annona muricata | Annona | Annonaceae |
| Archontophoenix cunninghamiana | Archontophoenix | Arecaceae |
| Areca catechu | Areca | Arecaceae |
| Arenga pinnata | Arenga | Arecaceae |
| Artocarpus altilis | Artocarpus | Moraceae |
| Artocarpus heterophyllus | Artocarpus | Moraceae |
| Azadirachta indica | Azadirachta | Meliaceae |
| Blighia sapida | Blighia | Sapindaceae |
| Borassus aethiopum | Borassus | Arecaceae |
| Calotropis procera | Calotropis | Asclepiadaceae |
| Carica papaya | Carica | Caricaceae |
| Caryota urens | Caryota | Arecaceae |
| Casuarina equisetifolia | Casuarina | Casuarinaceae |
| Ceiba pentandra | Ceiba | Malvaceae |
| Chrysophyllum albidum | Chrysophyllum | Sapotaceae |
| Citrus sinensis | Citrus | Rutaceae |
| Citrus sp. | Citrus | Rutaceae |
| Cocos nucifera | Cocos | Arecaceae |
| Delonix regia | Delonix | Fabaceae |
| Dypsis lutescens | Dypsis | Arecaceae |
| Elaeis guineensis | Elaeis | Arecaceae |
| Eucalyptus camaldulensis | Eucalyptus | Myrtaceae |
| Eucalyptus torrelliana | Eucalyptus | Myrtaceae |
| Ficus benjamina | Ficus | Moraceae |
| Ficus spp. | Ficus | Moraceae |
| Gliricidia sepium | Gliricidia | Fabaceae |
| Gmelina arborea | Gmelina | Lamiaceae |
| Hyphaene thebaica | Hyphaene | Arecaceae |
| Irvingia gabonensis | Irvingia | Irvingiaceae |
| Jatropha curcas | Jatropha | Euphorbiaceae |
| Jatropha integerrima | Jatropha | Euphorbiaceae |
| Khaya senegalensis | Khaya | Meliaceae |
| Leucaena leucocephala | Leucaena | Fabaceae |
| Mangifera indica | Mangifera | Anacardiaceae |
| Moringa oleifera | Moringa | Moringaceae |
| Musa spp. | Musa | Musaceae |
| Newbouldia laevis | Newbouldia | Bignoniaceae |
| Persea americana | Persea | Lauraceae |
| Phoenix dactylifera | Phoenix | Arecaceae |
| Phoenix reclinata | Phoenix | Arecaceae |
| Polyalthia longifolia | Polyalthia | Annonaceae |
| Pouteria alnifolia | Pouteria | Sapotaceae |
| Prosopis africana | Prosopis | Leguminosae-Mim |
| Psidium guajava | Psidium | Myrtaceae |
| Pterocarpus erinaceus | Pterocarpus | Fabaceae |
| Raphia hookeri | Raphia | Arecaceae |
| Ravenala madagascariensis | Ravenala | Strelitziaceae |
| Roystonea regia | Roystonea | Arecaceae |
| Salix babylonica | Salix | Salicaceae |
| Sebestenia cordia | Sebestenia | Euphorbiaceae |
| Senna siamea | Senna | Fabaceae |
| Spondias mombin | Spondias | Anacardiaceae |
| Tectona grandis | Tectona | Lamiaceae |
| Terminalia cattapa | Terminalia | Combretaceae |
| Terminalia grandifolia | Terminalia | Combretaceae |
| Terminalia mantaly | Terminalia | Combretaceae |
| Terminalia superba | Terminalia | Combretaceae |
| Thevetia peruviana | Thevetia | Apocynaceae |
| Treculia africana | Treculia | Moraceae |
Disclaimer/Publisher’s Note: The statements, opinions and data contained in all publications are solely those of the individual author(s) and contributor(s) and not of MDPI and/or the editor(s). MDPI and/or the editor(s) disclaim responsibility for any injury to people or property resulting from any ideas, methods, instructions or products referred to in the content. |
© 2023 by the authors. Licensee MDPI, Basel, Switzerland. This article is an open access article distributed under the terms and conditions of the Creative Commons Attribution (CC BY) license (https://creativecommons.org/licenses/by/4.0/).
Share and Cite
Atchadé, A.J.; Kanda, M.; Folega, F.; Yédomonhan, H.; Dourma, M.; Wala, K.; Akpagana, K. Trees Diversity and Species with High Ecological Importance for a Resilient Urban Area: Evidence from Cotonou City (West Africa). Climate 2023, 11, 182. https://0-doi-org.brum.beds.ac.uk/10.3390/cli11090182
Atchadé AJ, Kanda M, Folega F, Yédomonhan H, Dourma M, Wala K, Akpagana K. Trees Diversity and Species with High Ecological Importance for a Resilient Urban Area: Evidence from Cotonou City (West Africa). Climate. 2023; 11(9):182. https://0-doi-org.brum.beds.ac.uk/10.3390/cli11090182
Chicago/Turabian StyleAtchadé, Assouhan Jonas, Madjouma Kanda, Fousseni Folega, Hounnankpon Yédomonhan, Marra Dourma, Kperkouma Wala, and Koffi Akpagana. 2023. "Trees Diversity and Species with High Ecological Importance for a Resilient Urban Area: Evidence from Cotonou City (West Africa)" Climate 11, no. 9: 182. https://0-doi-org.brum.beds.ac.uk/10.3390/cli11090182