Article

New Antioxidant Ingredients from Brewery By-Products for Cosmetic Formulations

by
Roberta Censi
1,
Dolores Vargas Peregrina
1,2,
Maria Rosa Gigliobianco
1,
Giulio Lupidi
1,
Cristina Angeloni
1,
Letizia Pruccoli
3,
Andrea Tarozzi
3 and
Piera Di Martino
1,*
1
School of Pharmacy, University of Camerino, 62032 Camerino, Italy
2
Recusol srl, 62032 Camerino, Italy
3
Department for Life Quality Studies, University of Bologna, 40126 Bologna, Italy
*
Author to whom correspondence should be addressed.
Submission received: 21 September 2021 / Revised: 28 September 2021 / Accepted: 5 October 2021 / Published: 7 October 2021
(This article belongs to the Special Issue Green Ingredients in Cosmetics and Food (Volume II))

Abstract

:
The purpose of this work was to evaluate the total phenol content and antioxidant activity of different types of handcrafted beers (Ego, Alter, Fiat Lux, Triplo Malto, Ubi, and Maior), as well as the starting materials (malts, hops, and yeast), the intermediate products, and the waste products (spent malts, hops, and yeast), in view of their use in innovative cosmetic formulations. Extractions from starting and spent samples were taken from water or 70° alcohol. The total phenol content (Folin Ciocalteau Essay) of all the brewing products depended on the specific product under investigation. The highest values were found in starting hops (ranging from approximately 93 to 155 mg GAE/g, according to the extraction solvent), intermediate ones in starting malt and starting yeast, and the lowest values in wort. The total phenol content in the final beers originates from the phenols that were extracted from the different ingredients, namely the starting malts, hops and yeast, but non-negligible values were still observed in spent products. The method used for the evaluation of the antioxidant activity, trolox equivalent antioxidant capacity (DPPH), ferric-ion reducing antioxidant parameter (FRAP), and radical cation scavenging activity and reducing power (ABTS) strongly influenced the results. In general, the results reflected the trend observed for the total phenol content: that beers are progressively enriched by phenols originating from all the starting ingredients, and that spent products still possess non-negligible antioxidant activity. It is interesting to note that waste yeast frequently showed higher values than those of the starting material; it can be inferred that yeast is able to absorb phenols from the beer during brewing. By considering the interest in exploiting waste derived from processing foods, the biological activity of waste Alter brewery products has been evaluated on a cell culture of keratinocytes (spent products of malt, hop, and yeast). Preliminary in vitro assays in keratinocyte HaCaT cells were carried out to assess the potential bioactivity of spent extracts. Among the spent extracts, the spent hop and yeast extracts showed the ability to improve the mitochondrial activity and prevent oxidative stress in HaCaT cells, two features in skin ageing. In conclusion, this study offers evidence that waste from handcrafted beers can be an interesting source of phenols for the preparation of skin anti-aging cosmetics.

1. Introduction

Craft beer has become increasingly popular in the US and Europe [1,2], with important repercussions for the economy [3]. This success has been fuelled by consumer interest in tasting new beers with different flavours and aromas [2], and attention to the health benefits of moderate beer consumption [4].
Unlike commercial beers, craft beers are non-filtered and unpasteurized, and thus their sensorial characteristics remain unaltered by the brewing process. In addition, substances beneficial for health, such as antioxidants, may also be spared.
Commercial beers and their waste products have already been evaluated for their antioxidant properties. Zhao et al. [5] determined the phenol profiles and corresponding antioxidant activities of 34 commercial beers, and found notable differences in total and individual phenolic contents and antioxidant activity. The most abundant phenolic compounds were gallic and ferulic acids. In the same period, Ribeiro Tafulo et al. [6] determined the antioxidant activity of 27 other commercial beers, using several spectrophotometric methods. That same year, Piazzon et al., 2010 [7] evaluated the antioxidant activity and phenolic content of different types of commercial beers (abbey, ale, bock, wheat, lager, pilsner, and dealcoholized), and found great variety among them. In a study on homemade beers, Fărcas et al. [8] determined the total polyphenol content and antioxidant activity during the entire production process, starting from raw materials (malt and hop) and ending with the recovered waste. They showed that an initial higher total polyphenol content and antioxidant activity in the raw materials was due to the presence of malt, and that the total polyphenol content strongly decreased when passing to beer and spent malt in the final beer product and in the spent malt. Yeast was not analysed.
The fact that the antioxidant compounds derives from malt was proved by Zhao and co-workers [9], who showed the antioxidant activity and total phenol content of several varieties of malting barley. Other authors identified forty-seven phenol compounds from four types of commercial beer, using liquid chromatography coupled with an electrospray ionization hybrid linear ion-trap quadrupole Orbitrap mass spectrometry technique [10]. Recently, the identification of low-molecular-weight phenolic and nitrogen compounds in craft beers was achieved by HPLC-ESI-MS/MS analyses [11]. The authors tried to differentiate the types of beers, such as IPA, Lager and Weiss, according to the phenolic and nitrogen compounds, but found no significant differences in these compounds among the various beer types.
More recently [12], 20 phenolic compounds, for example gallic acid, catechin, caffeic acid, quercetin, xanthohumol, humulone, were selected and quantified in different craft beers, worts, brewering starting ingredients (barley malt, hop, and yeast) and by-products (barley husk, spent hop, and spent yeast). From this study, it was found that significant differences existed among all the samples and that the beer composition depends on the receipt and brewing process. The phenolic compounds of beers mainly originated from barley malt, and, interestingly, yeast was able to absorb phenolic compounds for the other sources.
Thus, the evaluation of antioxidants in the waste products from beer production may be of great importance if one considers the rapid growth of the craft beer market worldwide.
The exploitation of brewery by-products to develop health products such as cosmetics and/or supplements would help increase the sustainability of beer production. This study has multiple objectives: evaluate the total phenol content and antioxidant activity of different types of Italian craft beers (lager, amber, triple malt, red, and black), and evaluate their intermediate of production, as well as their waste products. The biological activity of waste extracts from Alter brewery was thus evaluated on human keratinocytes. This opens new and interesting opportunities to exploit new ingredients from brewery by-products for cosmetic formulations.

2. Experimental

2.1. Materials

1,1-Diphenyl-2-picrylhydrazyl (DPPH), 2,4,6-Tris(2-pyridyl)-s-triazine (TPTZ), (±)-6-Hydroxy-2,5,7,8-tetramethylchromane-2-carboxylic acid (TROLOX), 2,2′-Azino-bis(3-ethylbenzothiazoline-6-sulfonic acid) diammonium salt (98%TLC) (ABTS), gallic acid, sodium carbonate monohydrate acs reagent, sodium acetate and ethanol (ethanol absolute grade) were purchased from Sigma-Aldrich (Stenheim, Germany). Manganese (IV) oxidize activated (≥90%) and Folin–Ciocalteu’s phenol reagent were purchased from Fluka (Buchs, Switzerland). Anhydrous sodium acetate and anhydrous iron (III) chloride were purchased from J.T. Baker (Center Valley, PA, USA) and anhydrous sodium carbonate was purchased from Carlo Erba (Milan, Italy). All solvents and reagents were of analytical grade. Ultrapure water was produced by Gradient Milli-Q® (Millipore, Molsheim, France). Starting materials, handcraft beers, worts, and their waste products were kindly supplied by Birrificio Collesi (Apecchio, Italy).
The detailed characteristics of the beers investigated in the present study are provided in Table 1. The type of starting malt and hops determined the main differences among all the beers. Five different starting malts can be used, frequently in mixes and in different proportions. The Perle and Saaz hops are used in different proportions for their different aromas. The same yeast, Saccharomyces Cerevisiae, was used for all the beers, which were all high-fermentation types. The various combinations yield different types of beers (lager, amber, triple malt, red, and black) with alcohol contents ranging from 6.0 to 9.0 % V/V.

2.2. Sample Preparation

Prior to the analyses, the starting materials (malt, hops, and yeast), beers, worts, and waste (spent malt, hop, and yeast) were subjected to different processes according to their physical state, which could be dried solid, humid solid, or turbid liquid (Table 2).
Humid solids and liquids were first subjected to lyophilisation at a temperature of −50 °C and a pressure of 0.03 bar (FreeZone 1 Liter Benchtop Series 77,400 freeze-dryer, LABCONCO, Kansans City, MO, USA). Dried solids were subjected to milling in a cutter miller. Next, all the samples were subjected to extractions. A sample amount was weighed carefully and dispersed in 100 mL of solvent (water or 70° ethanol). The resulting liquid was placed in Erlenmeyer flask, which were then closed carefully. Samples were magnetically stirred for 24 h at room temperature, then centrifuged at 12,000 rpm at 20 °C for 10 min to remove undissolved particles (Zetalab CNZ-140H-E, Padova, Italy). Samples were lyophilized and stored at −20 °C in 50 mL polyethylene vials with screw cap (BD Falcon ™, BD Biosciences, Bedford, MA, USA) in order to ensure optimal storage conditions.

2.3. Total Phenol Content Determination

The Total Phenol Content (TPC) of the samples was determined according to the Folin-Ciocalteu spectrophotometric method [13] with some modifications [14]. In brief, all the freeze dried products were used to prepare limpid solutions at a concentration of 10 mg mL−1. A 50 µL aliquot of this solution was added to 150 µL of Folin–Ciocalteu’s phenol reagent, diluted 1:4 with water. Then, 50 µL of Na2CO3 saturated solution was added. After incubation at room temperature for 10 min, the absorbance of each well was determined at 765 nm using a microplate reader (FLUOstar Omega, BMG Labtech GmbH, Ortenberg, Germany). The measurement was compared to a calibration standard solution of gallic acid (GA), and the results were expressed as milligrams of gallic acid equivalents (GAE) per grams of by-product (mg GAE/g).

2.4. Evaluation of the Antioxidant Activity

The antioxidant activity of the craft beer and the by-products was evaluated by measuring 1,1-Diphenyl-2-picrylhydrazyl (DPPH) radical scavenging activity, 2,2′-Azino-bis(3-ethylbenzothiazoline-6-sulphonic acid) (ABTS•+) radical cation scavenging capacity, and Ferric-Reducing Antioxidant Capacity (FRAP). Trolox (6-Hydroxy-2,5,7,8-tetramethylchroman-2-carboxylic acid) was used as calibration standard. Values were expressed as µmol Trolox equivalent/g of sample as a function of IC50, defined as the concentration of the tested material required to cause a 50% decrease in initial DPPH, ABTS or iron concentration.

2.5. Evaluation of the Trolox Equivalent Antioxidant Capacity (DPPH)

DPPH free radical scavenging activity was evaluated through a microplate analytical assay according to previously published methods [15] with some modifications [16]. In brief, a 50 µL aliquot of the sample (concentration of 10 mg mL−1) and standard were added to 150 µL of DPPH in absolute ethanol in a 96-well microtitre plate (BD FalconTM). After incubation at 37 °C for 20 min, the absorbance of each well was determined at 517 nm using a microplate reader. The antioxidant activity was calculated and expressed versus the trolox amount according to Equation (1) [17]
D P P H . s c a v e n t g n g   e c c i f i e n c y ( % ) = A 0 A A 0 × 100 %
where A0 and A are the absorbance of the DPPH• radical solution at 517 nm in the presence of the control sample and the extract samples, respectively.

2.6. Radical Cation Scavenging Activity and Reducing Power (ABTS)

The ABTS assay was performed following previous procedures [18], and applied to a 96-well microliter plate assay. The ABTS•+ solution (5 mM) was prepared by oxidizing ABTS with MnO2 in water for 30 min in the dark. A 50 µL aliquot of the different concentrations of sample and standard (trolox) was added to 150 µL of ABTS•+ solution in a 96-well microtitre plate (BD FalconTM). After incubation at room temperature for 10 min, the absorbance of each well was determined at 734 nm using a microplate reader. Values were calculated and expressed versus trolox amount according to Equation (2) [17]
O H . s c a v e n g i n g   e c c i f i e n c y ( % ) = A 0 A A 0 × 100 %
where A0 and A are the absorbance of the OH• radical solution at 734 nm in the presence of the control sample and the extract samples, respectively.

2.7. Ferric-Ion-Reducing Antioxidant Parameter (FRAP)

The FRAP values of craft beer/by-products were determined according to a previously published method [19], with some modifications [20]. The FRAP reagent was prepared by mixing the following three solutions:
  • 50 mL 0.3M acetate buffer pH 3.6 (1.23 g of sodium acetate in 50 mL of water acidifying with acetic acid);
  • 5 mL of stock solution of 5 mM TPTZ (2,4,6-Tripyridyl-s-triazine) (15.6 mg) in 40 mM HCl;
  • 5 mL of 5 mM FeCl3·6 H2O (16.2 mg) in 40 mM HCl.
The FRAP reagent was heated at 37 °C before use. Aliquots of a 25 µL sample (solutions at the concentration of 10 mg mL−1) were added in triplicate into wells of a 96-well plate (BD FalconTM). The assay was started by adding 175 µL of FRAP reagent to each well. The plate was immediately shaken in a FLUOstar Omega plate reader for 30 s and the reaction was allowed to run for 10 min after which the plate was read on a plate reader (593 nm). A reference solution of Trolox was run simultaneously and used to generate the calibration curve by linear regression. The standard curve was linear between 25 and 800 µM Trolox (TE). Results were expressed in µM trolox equivalent (TE) g−1 sample.

2.8. Cell Cultures

Human keratinocyte cell line, HaCaT, was routinely grown in Dulbecco’s modified Eagle’s Medium (DMEM), supplemented with 10 % fetal bovine serum (FBS), 2 mM L-glutamine, 50 U/mL penicillin and 50 µg/mL streptomycin at 37 °C in a humidified incubator with 5% CO2. To evaluate cytotoxicity, mitochondrial activity and intracellular ROS formation, HaCaT cells were seeded in 96-well plates at 2 × 10⁴ cells/well. All experiments were performed after 24 h of incubation at 37 °C in 5% CO2. For the experiments with HaCaT cells, stock solutions of spent extracts were prepared in water at 60 mg/mL. The stock solutions were then diluted in complete medium to obtain the desired concentrations of spent extracts.

2.9. Cytotoxicity and Mitochondrial Activity

Cell viability was evaluated by the reduction of 3-(4,5-Dimethyl-2-thiazolyl)-2,5-diphenyl-2H-tetrazolium bromide (MTT) to its insoluble formazan, as previously described [21]. In brief, HaCaT cells were treated for 24 h with different concentrations of extract (0.003–3 mg/mL) at 37 °C in 5 % CO2. Subsequently, the treatment medium was replaced with MTT in Hank’s Balanced Salt Solution (HBSS) (0.5 mg/mL) for 2 h at 37 °C in 5 % CO2. After washing with HBSS, formazan crystals were dissolved in isopropanol. The levels of formazan was measured (570 nm, reference filter 690 nm) using the multilabel plate reader VICTOR™ X3 (PerkinElmer, Waltham, MA, USA). The cell viability was expressed as a percentage of control cells.
Mitochondrial activity was determined by MTT, as previously described, with slight modifications [22]. In brief, HaCaT cells were treated for 4 h with either DMEM 10% FBS (nutrient medium) or Dulbecco’s phosphate-buffered saline (saline solution without nutrients) in presence of 0.03 mg/mL extract at 37 °C in 5% CO2. Subsequently, the treatment was replaced with MTT for 2 h at 37 °C in 5 % CO2. After washing with HBSS, formazan crystals were dissolved in isopropanol. The levels of formazan that correlated with mitochondrial activity were measured (570 nm, reference filter 690 nm) using the multilabel plate reader VICTOR™ X3 (PerkinElmer). The mitochondrial activity was expressed as percentage of control cells.

2.10. Intracellular ROS Formation

Reactive oxygen species (ROS) formation was evaluated by fluorescent probe 2′-7′ dichlorodihydrofluorescein diacetate (H2DCF-DA), as previously described [23] (HaCaT cells were treated for 2 h with 0.03 mg/mL extract at 37 °C in 5% CO2. Subsequently, treatment medium was removed and 100 µL of H2DCF-DA (10 µg/mL) was added to each well. After 30 min of incubation at room temperature, H2DCF-DA solution was replaced with a solution of H2O2 (100 µM) for 30 min. A parallel set of HaCaT cells was treated with H2O2 and 0.03 mg/mL extract for 30 min. The ROS formation was measured in terms of Arbitrary Units of Fluorescence, AUF (excitation at 485 nm and emission at 535 nm), using the multilabel plate reader VICTOR™ X3 (PerkinElmer). Data are expressed as fold increase in ROS formation versus untreated cells (i.e., AUF of cells treated with H2O2/AUF of untreated cells).

2.11. Statistical Analysis

Data are shown as mean ± standard deviation (SD) of at least three independent experiments. Statistical analysis was performed using one-way ANOVA with Dunnett or Bonferroni post hoc test and Student’s t-test, as appropriate. Differences were considered significant at p < 0.05. Analyses were performed using GraphPad PRISM software (version 5.0; GraphPad Software, La Jolla, CA, USA) on a Windows platform.

3. Results and Discussion

3.1. Brewing Process of Craft Beers under Study

Craft beers, unlike industrially produced beers, are not pasteurized or filtered, and thus preserve more of their composition, aroma, and taste. The composition of craft beers is simply water, malt, hops, and yeast (Saccharomices Cerevisiae), with no other additives, and thus the chemical ingredients present in the beer depend on the ingredients that are added and removed during the brewing process [8]. Craft beer producers generally avoid adding citric acid, which can contribute to reduced product oxidation, or other additives such as aroma, sugars, flavours, and juices [8]. In the beers studied in the present work, no additives were used and the components were unprocessed water, malt, hops and yeast.
Table 1 lists the beers studied in the present work, and provides their composition and main characteristics. Some other information about the beers is confidential and thus could not be disclosed. Figure 1 illustrates the brewing process of craft beers used for this work.
The craft beer brewing process begins with the mixture of malt and water in appropriate proportions. Five different malts can be used and mixed together according to different recipes (Table 1). Water and malt are heated at a temperature of 70 °C for 90 min and the resulting wort is filtered to remove the spent malt. In the next step, two different hops, Perle and Saaz, can be used in different proportions. The hops are added to the filtered wort and boiled at 100 °C for 90 min, after which the spent hops are removed by centrifugation (whirpool process) at an interval of 1300–1550, depending on the batch size. The subsequent step is fermentation, when Saccharomices Cerevisiae yeast is added and heated at 20–22 °C for 90 min to convert the sugars into alcohol. The spent yeast is then removed by centrifugation, the resulting beer is bottled and, after a variable period of maturation of 20–30 days, is ready for consumption.
To summarise, the brewing ingredients are water, malt, hops, and yeast. The intermediate products are wort, wort after hops (the wort after boiling with hops and subsequent removal of the spent hops), and the beer after yeast (the beer formed after fermentation and subsequent removal of the spent yeast). The final product, of course, is the matured beer. The spent materials are malt, hops and yeast. All these products were fully analysed for total phenol content and antioxidant capacity.

3.2. Determination of Total Phenol Content

A previous study [10] identified forty-seven polyphenols in four types of commercial beers, namely, lager, Pilsen, Märzebier and non-alcoholic beer, by using an electrospray ionization hybrid linear ion trap quadrupole Orbitrap mass spectrometry technique. Among the polyphenols, it is possible to list phenolic acids, hydroxycinnamoylquinics, flavonols, flavones, alkylmethpxyphenols, alpha- and iso-alpha-acids, hydroxyphenylacetic acids, and prenylflavonoids.
In craft beers, another study identified phenolic and nitrogenous compounds by high-performance liquid chromatography and mass spectrometry [11]. Fifty-seven phenol compounds were identified, together with eleven nitrogenous compounds belonging to the phenolide class.
In our previous study [12], twenty phenol compounds, for example gallic acid, catechin, or humulone, were quantified in the same six types of craft beers, worts, ingredients and spent products of the present study by a validated LC-MS/MS method. The sum of phenol compounds (SPC) identified and quantified in barley malts was non-negligible and was prevalently due to trans-p-coumaric acid, which was transferred to the worts during the must preparation and was responsible for the non-negligible SPC of worts. Bitter acids and prenylflavonoids were detected in the starting hops, while their concentration decreased in the spent hops, suggesting that they were transferred to the intermediate of production. Phenolic compounds, largely present in starting barley malts and hops, decreased in the final beers, because they were absorbed into the yeast added for the fermentation.
Based on these previous results, one can surmise that the phenol compounds may influence the Total Phenol Contents (TPC) of the beers under study. Looking at the results of our TPC analyses, reported in Table 3, it seems that the extraction solvent has a strong bearing on the TPC. In fact, starting malts subjected to ethanol extraction showed higher TPC values than those subjected to water extraction, with quite a large range of values for extract in ethanol, from 28 to 72 mg GAE/g, and a more limited range for extract in water, from approximately 11 to 16 mg GAE/g. This indicates that for the compounds that can influence the TPC in this study, extraction in ethanol is more effective than that in water. Similar results regarding TPC values were reported by Zhao et al. [9] for 14 varieties of barley subjected to extraction in acetone, yielding values from 2.17 to 2.56 mg GAE/g. Thus, in the work of Zhao et al. (2008) acetone appeared less effective at extracting phenol compounds from barley than water or ethanol 70° in this study. Several other studies have also demonstrated that ethanol is effective at extracting compounds that influence the TPC [24,25]. Our data on the starting malt types indicate that Type 3 and 5 malts have a higher TPC than the other ones (Table 1), because they are present when values are the highest.
Regarding the TPC of wort, it should be borne in mind that this product was not subjected to extraction, but used as received from the brewery. The TPC of wort was lower than that of starting malt, and depends on the first brew phase, which consists of heating malt and water at a temperature of 70 °C for 90 min. During this phase, phenols can diffuse from the coarse grains (malt grains are only coarsely ground) and dissolve into the wort. However, once received by us, starting malt was milled to recover fine particles to optimize the phenol extraction. This can explain the highest value of starting malt appearing with respect to wort: phenols can only partially be released from coarse particles during wort production, and phenols that are still inside the grains can be easily released from finest particles during extraction in water or in ethanol 70°.
The spent malts exhibited intermediate values between those of the starting malt and the corresponding worts, confirming that phenolic compounds were still present in spent malt: the extraction in water and ethanol 70° revealed appreciable TPC values ranging from approximately 9 to 14 mg GAE/g, and from 12 to 37 mg GAE/g, for extraction in water and ethanol, respectively.
Table 3 reports the TPC values of both pure hops Perle and Saaz. Both starting hops showed a very high TPC, and the values obtained after extraction in ethanol were again higher than those obtained in water, confirming ethanol as a better solvent than water for the extraction of phenols. The Perle starting hops showed a higher value than the Saaz one. Nevertheless, they were not used as pure hops, but mixed according to a secret recipe. Thus, the mix used for every brewing process was analysed. The TPC can correspond to the mix of the two different hops in various percentages, which is approximately intermediate between the percentage of pure hops. The TPC of worts obtained after the addition of hops was higher than that of worts before the addition of hops, which indicates that part of the phenolic compounds is transferred from the hops to the wort during the brewing process, which, in this phase, consisted of boiling hops in wort at 100 °C for 90 min. Nonetheless, despite the very high TPC of hops, the TPC of worts showed a modest increase. One might expect that the spent hops would have a high TPC, but the TPC was actually lower, which probably indicates that a large part of the phenolic compounds was lost during the process, due to the thermal instability of some phenolic compounds [26].
The starting yeast showed an appreciable TPC, particularly when the extraction was carried out in water, while a far lower value was obtained from extraction with 70° ethanol. This can be explained by the fact that pure yeast is less soluble and less hydrated in ethanol than in water, and thus the extraction is less efficient. It appears that part of the TPC in yeast was transferred to the beer, as there was an increase in the TPC of the corresponding beers. Again, it should be noted that the analysis was performed on beers that were not subjected to extraction, which were thus not influenced by the extraction method. However, the TPC of spent yeasts is of particular interest because it was non-negligible. In fact, the TPC of spent yeasts after water extraction was slightly lower than that of starting yeasts, while the values for spent yeasts after extraction in ethanol were even higher than those in starting yeasts. This is due to the hydration of the yeast during fermentation, which favoured the dissolution and extraction of phenols.
The TPC of the final beers was not statistically different (p < 0.05) from that of beers after yeast, indicating that the compounds remain stable during beer maturation.
To summarise, the final beers were enriched with phenolic compounds throughout the brewing process, during which the various ingredients transferred these compounds to the beer. The highest TPC was found in the Triplo Malto and the Maior beers. Waste was only partially exploited and non-negligible TPC values were highlighted and were particularly significant for yeast when extraction was carried out in water.

3.3. Evaluation of the Antioxidant Activities

The antioxidant activities were evaluated by assessing the trolox equivalent antioxidant capacity (DPPH), ferric-ion-reducing antioxidant parameter (FRAP), and radical cation scavenging activity and reducing power (ABTS), and respective results are reported in Table 4, Table 5 and Table 6.
DPPH for starting malt ranged from approximately 9 to 24 µmol TE/g for water extracts and from 20 to 42 µmol TE/g for ethanol extracts. The DPPH values were generally higher than the values obtained by Zhao et al. [9] after extraction in acetone. They actually reported that the radical scavenging activities of 14 samples of malts ranged from 9.33 to 11.78 µmol TE/g.
Regarding wort, one must note that values were the same for water and ethanol extraction. As explained before, wort was not subjected to extraction and was provided as a solution by the brewery. The wort of different malts exhibited lower values than those of the corresponding starting malts. The reason for this could be the same as that explained for TPC, that is, an incomplete dissolution of molecules from malt to wort during the brew process. The spent malts obtained after ethanol extractions exhibited higher values than those obtained after water extraction, but far lower values than those of starting malt. This means that some molecules were transferred to the wort, while others were lost during the process.
Both Perle and Saaz hops showed high DPPH values, particularly when extraction was carried out in ethanol (approximately 72–89 µmol TE/g after extraction in water, and 258–354 µmol TE/g after extraction in ethanol). Their mixes showed values that corresponded to the specific recipe used to produce each beer. The starting hops’ mix reflected the hops’ composition.
Wort after the addition of the hops showed slightly increased DPPH values compared to the previous wort, meaning that some molecules influencing DPPH value transferred to the wort, but if one considers the strong decrease in DPPH values for spent hops, it is possible to conclude that the molecules influencing DPPH were destroyed during this brewing stage because they were thermally unstable [26]. Spent hops showed a very important decrease in DPPH values with the respect to starting hops, confirming the thermal instability of molecules influencing the DPPH value. Starting yeast exhibited modest DPPH values for extracts in water and in ethanol. It was interesting to note an increase in the wort after yeast, and particularly in spent yeast, where a significant increase in DPPH values could be observed. The explanation can be found in the enzymatic reaction that occurred in presence of the yeast on flavonol glycosides: the enzymes of the yeast are able to convert glycosides to aglycones that are more reactant than the corresponding glycosides [27,28]. The DPPH values for final beers were not statistically different (p < 0.05) from those of wort after yeast.
The antioxidant activity determined by the ABTS of starting malt ranged from approximately 21 to 47 μmol TE/g for extraction in water and from 41 to 97 for ethanol extracts, values higher than those determined by Zhao et al. [9]. Our findings are in good agreement with the observation of higher TPC values when extraction was carried out in ethanol. The starting malt type 5, which was only used for the production of Maior beer, had particularly high values. In the case of worts, the ABTS values were higher than those of corresponding starting malts; this indicates that the wort production process is able to extract more molecules that can influence the ABTS result, as was demonstrated for DPPH values. Spent malts exhibited lower ABTS values lower than those of starting malt, confirming that molecules are transferred to the wort during the process. The ABTS for starting hops was very high, but decreased strongly in wort after hops. Residual molecules able to influence ABTS were present in spent hop. The ABTS of starting yeast was higher when extraction was carried out in water, confirming the previous observation, that is, a better solubility of yeast in water than in ethanol. Beer after yeast showed high ABTS values, while spent yeast exhibited lower values, very similar to those of final beers.
Antioxidant activity was then evaluated by FRAP. Starting malt showed values from 56 to 80 μmol TE/g for water extracts, and from 33 to 54 μmol TE/g for 70° ethanol extracts. For water extracts, the highest value was that of Ego, while for ethanol extracts, the highest one was that of Alter. Worts exhibited lower values than starting malts, and no significant differences were highlighted among the different types. Spent malts did not show significant differences to starting malt. Values for starting hops were nearly 332 and 377 μmol TE/g for Perle and Saaz, respectively, when extraction was carried out in water, while they were significantly lower, 120 and 110 μmol TE/g, for Perle and Saaz, respectively, when extraction was carried out in 70° ethanol, confirming the differences between the two extraction methods. This was also confirmed in the starting mixtures, which yielded higher values after water extraction compared to those after ethanol extraction. The values for worts after hops are highest with the respect to the previous worts, which indicates an increase in molecules able to influence FRAP values during the brew process. Waste hops had particularly high values when extraction was carried out in water (values ranged from 88 to 103 μmol TE/g), while they were far lower when it was carried out in 70° ethanol (values ranged from 29 to 33 μmol TE/g). Starting yeast exhibited the highest value (71.045 ± 5.859 μmol TE/g) when extraction was carried out in water, but the lowest value for 70° ethanol extracts (44.494 ± 0.501 μmol TE/g). Once again, FRAP values for waste yeasts were higher than starting values (from 103 to 136 μmol TE/g for water extracts and 70 to 82 μmol TE/g for 70° ethanol extracts), indicating that the yeast was enriched with molecules able to influence FRAP analysis during the brewery process. Beers after yeast exhibited higher values than the worts in the previous stage, after boiling with and the removal of hops, indicating that when beers are in contact with yeast, they become enriched with molecules that can influence FRAP values. Final beers also exhibited higher values than beers in the previous stage after yeast addition, fermentation, and removal, indicating that maturation can lead to an increase in the quantity of molecules that can influence FRAP analysis.
In several cases, it was observed that spent yeast showed higher values than starting yeast. One possible explanation for this is that yeast may be able to absorb molecules from other materials during the brewing process and promote a release of aglycones that are more reactive than corresponding glycosides 27,28]. The fact that, in beers, an increase in FRAP values is observed with the respect to the previous wort may be due to the presence of yeast that is not completely removed from the beer, which partially continue the fermentation process by releasing aglycones, which are more reactive than corresponding glycosides, as explained before.

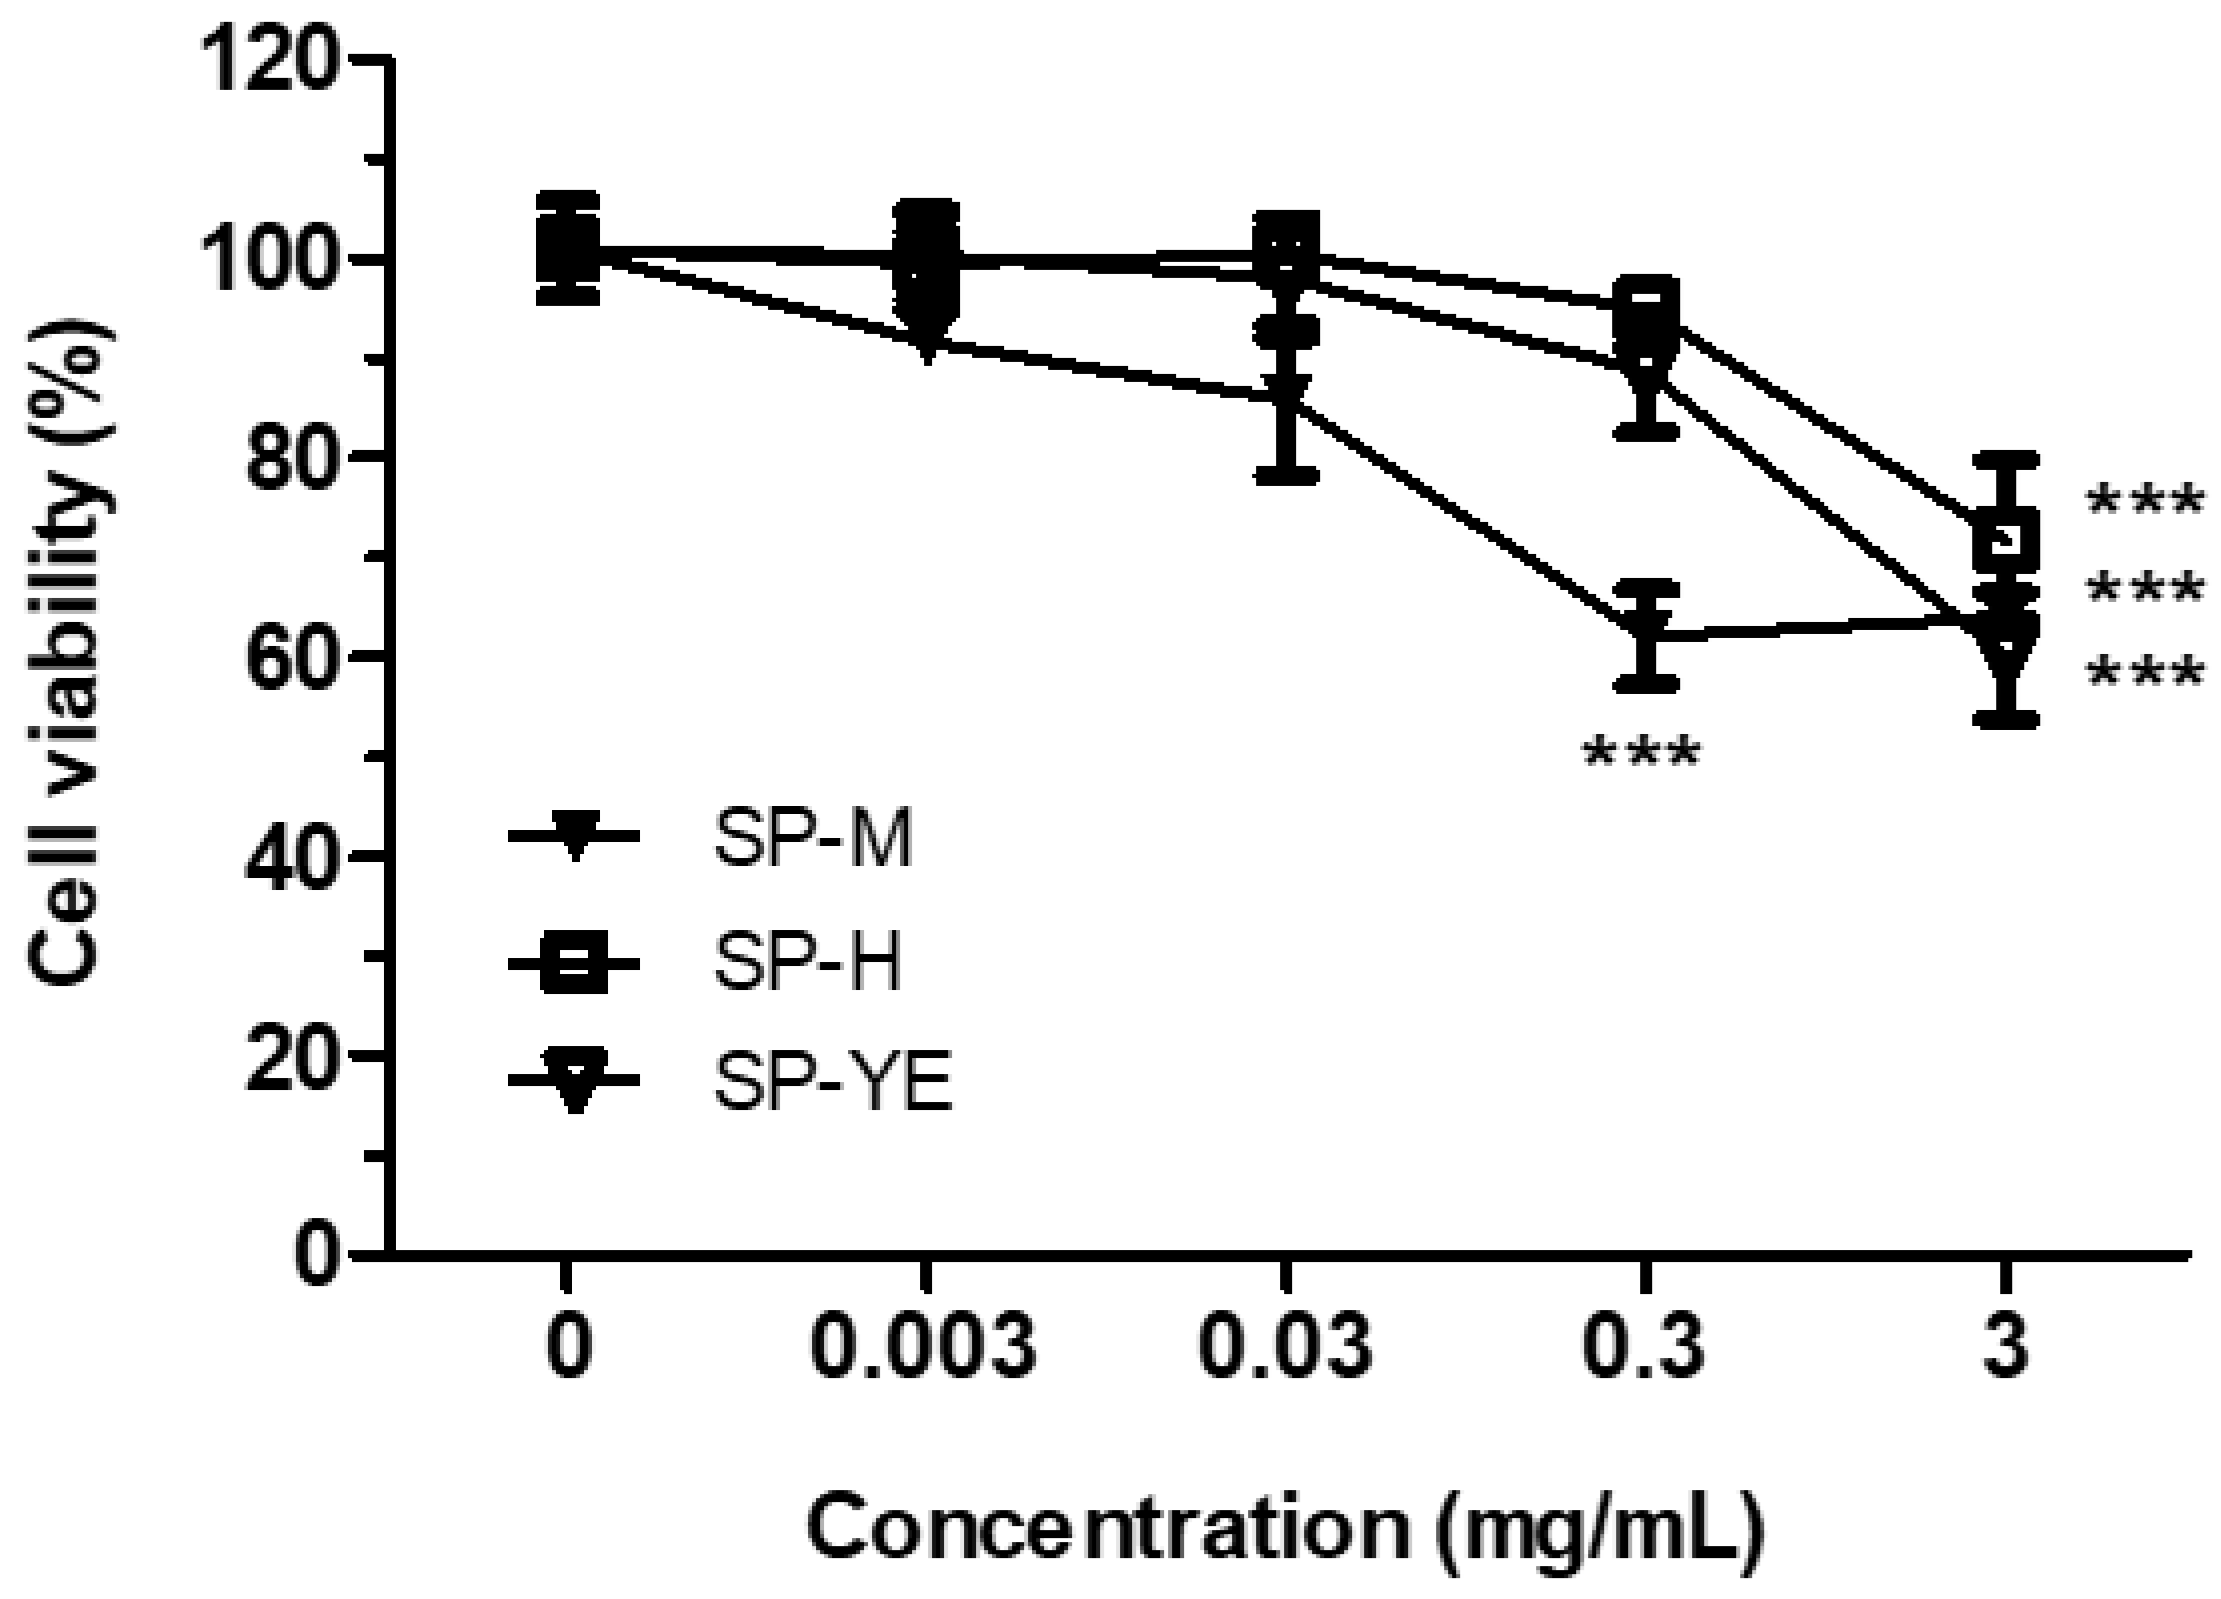
3.4. Bioactivity of Spent Extracts in Human Keratinocytes

The bioactivity was evaluated in spent extracts, particularly in those recovered under Alter brewery. We initially evaluated the cytotoxicity of the spent malt (SP-M), spent hop (SP-H) and spent yeast (SP-YE) extracts in keratinocyte HaCaT cells. HaCaT cells were treated with extract concentrations ranging from 0.003 to 3 mg/mL for 24 h and cell viability was evaluated by MTT assay. The treatment of HaCaT cells with the extracts at concentrations lower than 0.3 mg/mL did not affect cell viability (Figure 2). The concentration of 0.03 mg/mL was, therefore, selected for the subsequent experiments. Skin ageing is a complex process involving both internal and external factors, which leads to a progressive loss of cutaneous function and structure [29]. There is increasing evidence that mitochondrial dysfunction and oxidative stress are key features in skin ageing [30]. In this regard, the development of ingredients that improve the mitochondrial activity and prevent oxidative stress is, therefore, a potential skin anti-aging strategy.
To evaluate the ability of the extracts to improve the mitochondrial activity, HaCaT cells were treated with extracts in solution without nutrients for cellular metabolism. As shown in Figure 3, the treatment of HaCaT cells for 4 h with the solution and without nutrients significantly decreased the mitochondrial activity.
Under the same experimental conditions, the addition of 0.03 mg/mL SP-H and SP-YE, but not SP-M, significantly recovered mitochondrial activity, suggesting their ability to support the mechanisms of cellular nutrition. At the same concentration, SP-M, SP-H and SP-YE extracts were also evaluated for their antioxidant activity in HaCaT cells. HaCaT cells were treated with the extracts simultaneously or 2 h before the oxidative stress (100 μM H2O2 for 30 min), and the antioxidant activity was evaluated in terms of intracellular ROS formation. This experimental approach allowed for the discrimination of the ability of the extracts to counteract and/or prevent the intracellular ROS formation. All the SP-M, SP-H and SP-YE extracts directly counteracted H2O2 action with a ignificant reduction in ROS formation in HaCaT cells (Figure 4).
The pre-treatment of HaCaT cells with SP-H and SP-YE extracts also showed the ability to prevent the intracellular ROS formation invoked by H2O2, suggesting the ability of these components to act at the intracellular level (Figure 5).

4. Conclusions

In the present study, the total phenol content and antioxidant activities of different types of beers, starting materials, intermediates of the brewing process and spent malts, hops, and yeasts were evaluated. As noted by Zhao et al. [5], the differences in the results of the analyses of antioxidant activity should be viewed in the light of differences in the analytical methods used to evaluate these activities. Differences in the results of the analyses of antioxidant activity could also be due to variations in the processes and extraction methods, and varying reaction kinetics [31]. In addition, some differences between the samples depend on their composition and not on the brewing process, given that the same process was used for all the beers. This study offers evidence that beers become enriched in phenols from their ingredients, and that brewing products and waste are interesting sources for the preparation of dietary supplements and cosmetics. This study shows the anti-aging effects of waste products from handcrafted beers in human keratinocyte cells, suggesting their potential use as ingredients for the preparation of cosmetics. Thus, this study further confirms the interest in exploiting waste from food production. Future studies will be devoted to the study and development of new, finished cosmetic formulations from beer by-products in order to investigate their possible industrial cosmetic use.

Author Contributions

Conceptualization, P.D.M., A.T. and M.R.G.; methodology, G.L. and C.A.; software, M.R.G.; validation, R.C., G.L., A.T. and P.D.M.; formal analysis, D.V.P. and L.P.; M.R.G.; resources, P.D.M. and A.T.; data curation, M.R.G. and G.L.; writing—original draft preparation, R.C. and M.R.G.; writing—review and editing, M.R.G., A.T., C.A. and P.D.M.; supervision, P.D.M. and A.T.; funding acquisition, P.D.M. and A.T. All authors have read and agreed to the published version of the manuscript.

Funding

The authors acknowledge receipt of funding from the European Commission of an H2020-MSCA-RISE-2016 award through the CHARMED project (grant number 734684), an H2020-MSCA-RISE-2017 award through the CANCER project (grant number 777682).

Acknowledgments

The authors would like to thank Birrificio Collesi (Apecchio, Italy) for the financial support for this study.

Conflicts of Interest

The authors declare no conflict of interest.

References

  1. Ascher, B. Global Beer: The Road To Monopoly; American Antititrust Institute: Washington, DC, USA, 2012; Available online: https://www.antitrustinstitute.org/work-product/global-beer-the-road-to-monopoly/ (accessed on 14 November 2012).
  2. Aquilani, B.; Laureti, T.; Poponi, S.; Secondi, L. Beer choice and consuption determinants when craft beers are tasted: An exploratory study of consumer preferences. Food Qual. Prefer. 2015, 41, 214–224. [Google Scholar] [CrossRef]
  3. Berkhout, B.; Bertling, L.; Bleeker, Y.; de Wit, W.; Kruis, G.; Stokkel, R.; Theuws, R. The Contributionmade by Beer to the European Economy; Ernst & Young: Amsterdam, The Netherlands, 2013; pp. 1–290. [Google Scholar]
  4. Sohrabvandi, S.; Mortazavian, A.M.; Rezaei, K. Health-related aspects of beer: A review. Int. J. Food Prop. 2012, 15, 350–373. [Google Scholar] [CrossRef]
  5. Zhao, H.; Chen, W.; Lu, J.; Zhao, M. Phenolic profiles and antioxidant activities of commercial beers. Food Chem. 2010, 119, 1150–1158. [Google Scholar] [CrossRef]
  6. Ribeiro Tafulo, P.A.; Barbosa Queirós, R.; Delerue-Matos, C.M.; Sales, M.G.F. Control and comparison of the antioxidant capacity of beers. Food Res. Int. 2010, 43, 1702–1709. [Google Scholar] [CrossRef] [Green Version]
  7. Piazzon, A.; Forte, M.; Nardini, M. Characterization of phenolics content and antioxidant activity of different beer types. J. Agric. Food Chem. 2010, 58, 10677–10683. [Google Scholar] [CrossRef] [PubMed]
  8. Fărcaş, A.; Tofană, M.; Socaci, S.; Scrob, S.; Salanţă, L.; Borşa, A. Preliminary Study on Antioxidant Activity and Polyphenols Content in Discharged Waste from Beer Production. J. Agroaliment. Process. Technol. 2013, 19, 319–324. [Google Scholar]
  9. Zhao, H.; Fan, W.; Dong, J.; Lu, J.; Chen, J.; Shan, L.; Lin, Y.; Kong, W. Evaluation of antioxidant activities and total phenolic contents of typical malting barley varieties. Food Chem. 2008, 107, 296–304. [Google Scholar] [CrossRef]
  10. Quifer-Rada, P.; Vallverdu-Queralt, A.; Martinez-Huelamo, M.; Chiva-Blanch, G.; Jauregui, O.; Estruch, R.; Lamuela-Raventos, R. A comprehensive characterisation of beer polyphenols by high resolution mass spectrometry (LC-ESI-LTQ-Orbitrap-MS). Food Chem. 2015, 169, 336–343. [Google Scholar] [CrossRef]
  11. Cheiran, K.P.; Raimundo, V.P.; Manfroi, V.; Anzanello, M.J.; Kahmann, A.; Rodrigues, E.; Frazzon, J. Simultaneous identification of low-molecular weight phenolic and nitrogen compounds in craft beers by HPLC-ESI-MS/MS. Food Chem. 2019, 286, 113–122. [Google Scholar] [CrossRef] [PubMed]
  12. Cortese, M.; Gigliobianco, M.R.; Peregrina, D.V.; Sagratini, G.; Censi, R.; Di Martino, P. Quantification of phenolic compounds in different types of crafts beers, worts, starting and spent ingredients by liquid chromatography-tandem mass spectrometry. J. Chromatogr. A 2020, 1612, 460622. [Google Scholar] [CrossRef] [PubMed]
  13. Singleton, V.L.; Rossi, J.A. Colorimetry of total phenolics with phosphomolybdic-phosphotungstic acid reagent. Am. J. Enol. Vitic. 1965, 16, 144–158. [Google Scholar]
  14. Zorzetto, C.; Sanchez-Mateo, C.C.; Rabanal, R.M.; Lupidi, G.; Petrelli, D.; Vitali, L.A.; Bramucci, M.; Quassinti, L.; Caprioli, G.; Papa, F.; et al. Phytochemical analysis and in vitro biological activity of three Hypericum species from the Canary Islands (Hypericum reflexum, Hypericum canariense and Hypericum grandifolium). Fitoterapia 2015, 100, 95–109. [Google Scholar] [CrossRef]
  15. Brand-Williams, W.; Cuvelier, M.E.; Berset, C. Use of a free radical method to evaluate antioxidant activity. LWT—Food Sci. Technol. 1995, 28, 25–30. [Google Scholar] [CrossRef]
  16. Venditti, A.; Bianco, A.; Quassinti, L.; Bramucci, M.; Lupidi, G.; Damiano, S.; Papa, F.; Vittori, S.; Maleci Bini, L.; Giuliani, C.; et al. Phytochemical Analysis, Biological Activity, and Secretory Structures of Stachys annua (L.) L. subsp. annua (Lamiaceae) from Central Italy. Chem. Biodivers. 2015, 12, 1172–1183. [Google Scholar] [CrossRef]
  17. Moon, J.-Y.; Ngoc, L.T.N.; Chae, M.; Van Tran, V.; Lee, Y.-C. Effects of Microwave-Assisted Opuntia humifusa Extract in Inhibiting the Impacts of Particulate Matter on Human Keratinocyte Skin Cell. Antioxidants 2020, 9, 271. [Google Scholar] [CrossRef] [Green Version]
  18. Re, R.; Pellegrini, N.; Proteggente, A.; Pannala, A.; Yang, M.; Rice-Evans, C. Antioxidant activity applying an improved ABTS radical cation decolorization assay. Free Radic. Biol. Med. 1999, 26, 1231–1237. [Google Scholar] [CrossRef]
  19. Benzie, I.F.; Strain, J.J. The ferric reducing ability of plasma (FRAP) as a measure of “antioxidant power”: The FRAP assay. Anal. Biochem. 1996, 239, 70–76. [Google Scholar] [CrossRef] [Green Version]
  20. Ornano, L.; Venditti, A.; Ballero, M.; Sanna, C.; Quassinti, L.; Bramucci, M.; Lupidi, G.; Papa, F.; Vittori, S.; Maggi, F.; et al. Chemopreventive and antioxidant activity of the chamazulene-rich essential oil obtained from Artemisia arborescens L. growing on the Isle of La Maddalena, Sardinia, Italy. Chem. Biodivers. 2013, 10, 1464–1474. [Google Scholar] [CrossRef]
  21. Gigliobianco, M.R.; Campisi, B.; Vargas Peregrina, D.; Censi, R.; Khamitova, G.; Angeloni, S.; Caprioli, G.; Zannotti, M.; Ferraro, S.; Giovannetti, R.; et al. Optimization of the Extraction from Spent Coffee Grounds Using the Desirability Approach. Antioxidants 2020, 9, 370. [Google Scholar] [CrossRef] [PubMed]
  22. Ozanne, H.; Toumi, H.; Roubinet, B.; Landemarre, L.; Lespessailles, E.; Daniellou, R.; Cesaro, A. Laminarin Effects, a β-(1,3)-Glucan, on Skin Cell Inflammation and Oxidation. Cosmetics 2020, 7, 66. [Google Scholar] [CrossRef]
  23. Tarozzi, A.; Marchesl, A.; Hrelia, S.; Angeloni, C.; Andrisano, V.; Fiori, J.; Cantelli-Forti, G.; Hrella, P. Protective Effects of Cyanidin-3-O-β-glucopyranoside Against UVA-induced Oxidative Stress in Human Keratinocytes. Photochem. Photobiol. 2005, 81, 623–629. [Google Scholar] [CrossRef] [PubMed]
  24. Li, B.B.; Smith, B.; Hossain, M. Extraction of phenolics from citrus peels: I. Solvent extraction method. Sep. Purif. Technol. 2006, 48, 182–188. [Google Scholar] [CrossRef]
  25. Alothman, M.; Bhat, R.; Karim, A.A. Antioxidant Capacity and Phenolic Content of Selected Tropical Fruits from Malaysia, Extracted with Different Solvents. Food Chem. 2009, 115, 785–788. [Google Scholar] [CrossRef]
  26. Palma, M.; Pineiro, Z.; Barroso, C.G. Stability of phenolic compounds during extraction with superheated solvents. J. Chromatogr. A 2001, 921, 169–174. [Google Scholar] [CrossRef]
  27. Plumb, G.W.; Price, K.R.; Williamson, G. Antioxidant properties of flavonol glycosides from tea. Redox. Rep. 1999, 4, 13–16. [Google Scholar] [CrossRef]
  28. Plumb, G.W.; Price, K.R.; Williamson, G. Antioxidant properties of flavonol glycosides from green beans. Redox. Rep. 1999, 4, 123–127. [Google Scholar] [CrossRef]
  29. Naidoo, K.; Hanna, R.; Birch-Machin, M.A. What is the role of mitochondrial dysfunction in skin photoaging? Exp. Dermatol. 2018, 27, 124–128. [Google Scholar] [CrossRef] [Green Version]
  30. Stout, R.; Birch-Machin, M. Mitochondria’s Role in Skin Ageing. Biology 2019, 8, 29. [Google Scholar] [CrossRef] [Green Version]
  31. Campos, A.M.; Lissi, E.A. Kinetics of the reaction between 2,2-azinobis(3-ethylbenzothiazoline)-6-sulfonic acid (ABTS) derived radical cation and phenols. Int. J. Chem. Kinet. 1996, 29, 219–224. [Google Scholar] [CrossRef]
Figure 1. Illustration of the craft beer brewing process.
Cosmetics 08 00096 g001
Figure 2. Cytotoxicity of SP-M, SP-H and SP-Y extracts in HaCaT cells. Cells were treated with various concentrations of extract (0.003-3 mg/mL) for 24 h. At the end of treatment, cell viability was evaluated by MTT assay, as described in the method section. Data are expressed as percentage of control cells and expressed as mean ± SD of three independent experiments (*** p < 0.001 vs. untreated cells; one-way ANOVA with Bonferroni post hoc test).
Cosmetics 08 00096 g002
Figure 3. Effects of SP-M, SP-H and SP-Y extracts on mitochondrial activity in HaCaT cells. Cells were treated with 0.03 mg/mL extract for 4 h in absence of nutrient medium. At the end of treatment, mitochondrial activity was evaluated by MTT assay, as described in the method section. Data are expressed as percentage of control cells and expressed as mean ± SD of three independent experiments (§§§ p < 0.001 vs. cells with nutrient medium; * p < 0.05 and ** p < 0.01 vs. cells without nutrient medium; one-way ANOVA with Bonferroni post hoc test).
Cosmetics 08 00096 g003
Figure 4. SP-M, SP-H and SP-Y extracts counteract the ROS formation induced by H2O2 in HaCaT cells. Cells were treated with extract (0.03 mg/mL) and H2O2 (100 µM) for 30 min. At the end of treatment, intracellular ROS formation was evaluated using the fluorescent probe H2DCF-DA, as described in the method section. Data are expressed as fold increase in ROS formation versus untreated cells and reported as mean ± SD of three independent experiments (*** p < 0.001 vs. cells treated with H2O2; one-way ANOVA with Dunnett post hoc test).
Cosmetics 08 00096 g004
Figure 5. SP-H and SP-Y, but not SP-M, extracts prevent the ROS formation induced by H2O2 in HaCaT cells. Cells were treated with extract (0.03 mg/mL) for 2 h. Subsequently, the extract treatment was discarded and the cells was treated with H2O2 (100 µM) for 30 min. At the end of treatment, intracellular ROS formation was evaluated using the fluorescent probe H2DCF-DA, as described in the method section. Data are expressed as fold increase in ROS formation versus untreated cells and reported as mean ± SD of three independent experiments (* p < 0.05 vs. cells treated with H2O2; one-way ANOVA with Dunnett post hoc test).
Cosmetics 08 00096 g005
Table 1. General characteristics of six craft beers provided by Birrificio Collesi. The fermentation type, the alcohol content and the raw materials are indicated. Approximations of main differences in the concentrations of the raw materials are indicated and are relative to all the beers. No exact indications can be provided because they are confidential.
BeerType of BeerBeer Alcohol Content (%, V/V)Raw MaterialsMalt Type *Hops Type *YeastMain Differences
EGOLager6.0Water, malt,
hops, yeast
Type 1Perle + SaazSaccharomices
Cerevisiae
Lowest malt and hop concentration
ALTERLager6.0Water, malt,
hops, yeast
Type 1 + Type 2Perle + SaazSaccharomices
Cerevisiae
Lowest malt and hop concentration
FIAT LUXAmber7.5Water, malt,
hops, yeast
Type 1 + Type 3Perle + SaazSaccharomices
Cerevisiae
Intermediate malt and hop concentration
TRIPLO MALTOTriple malt8.0Water, malt,
hops, yeast
Type 1 + Type 4Perle + SaazSaccharomices
Cerevisiae
Highest malt and hop concentration
UBIRed9.0Water, malt,
hops, yeast
Type 1 + Type 3Perle + SaazSaccharomices
Cerevisiae
Intermediate malt and hop concentration
MAIORBlack8.0Water, malt,
hops, yeast
Type 1 + Type 3
+ Type 5
Perle + SaazSaccharomices
Cerevisiae
Intermediate malt and hop concentration
* The precise amounts of the ingredients can change according to the recipe, which is confidential.
Table 2. Processing of samples prior to analyses.
Starting MaltWortSpent MaltStarting HopWort after HopSpent HopStarting YeastBeer after YeastSpent YeastBeer
AspectDried solidTurbid liquidHumid solidDried solidTurbid liquidHumid solidDried solidTurbid liquidHumid solidTurbid liquid
Lyophilisation after receiptNoYesYesNoYesYesNoYesYesYes
MillingYesNoYesYesNoNoYesNoNoNo
Extraction in water at room temperature for 24 hYesYesYesYesYesYesYesYesYesYes
Extraction in ethanol at room temperature for 24 hYesYesYesYesYesYesYesYesYesYes
CentrifugedYesYesYesYesYesYesYesYesYesYes
Lyophilisation after extractionYesYesYesYesYesYesYesYesYesYes
Storage at −20 °C in 50 mL polyethylene vials with screw capYesYesYesYesYesYesYesYesYesYes
Table 3. Total phenolic content of brewing products determined after extraction in water or in 70° ethanol.
FOLINStarting MaltWort *Spent maltStarting Hops: PerleStarting Hop:SaazStarting Hop: Perle and SaazWort after HopsSpent HopsStarting YeastBeer after Yeast *Spent YeastBeer *
mg GAE/gmg GAE/gmg GAE/gmg GAE/gmg GAE/gmg GAE/g mg GAE/gmg GAE/gmg GAE/gmg GAE/gmg GAE/g
Water extracts
Ego14.687 ± 4.9587.164 ± 0.47614.102 ± 3.074108.583 ± 24.86393.703 ± 5.13592.506 ± 0.4469.263 ± 8.41915.983 ± 0.59453.844 ± 0.53917.672 ± 1.95038.949 ± 0.98318.961 ± 1.082
Alter12.119 ± 1.2739.699 ± 0.48814.286 ± 0.51192.299 ± 0.91911.335 ± 2.23415.833 ± 0.86026.708 ± 2.71436.655 ± 2.41225.493 ± 0.287
Fiat lux11.672 ± 1.8149.097 ± 0.6469.618 ± 2.888101.318 ± 0.83915.463 ± 3.05713.175 ± 0.71122.950 ± 3.42238.076 ± 3.43723.147 ± 5.996
Triplo malto15.794 ± 2.5286.899 ± 0.81911.798 ± 0.749104.397 ± 2.91119.063 ± 1.39013.346 ± 0.43335.600 ± 1.47444.521 ± 1.77735.822 ± 0.147
Ubi14.711 ± 0.89112.785 ± 1.85511.456 ± 0.33596.692 ± 1.94414.001 ± 0.61714.825 ± 3.86121.871 ± 1.24236.404 ± 2.85822.320 ± 0.882
Maior16.568 ± 2.41212.664 ± 1.39110.444 ± 1.30994.343 ± 2.00420.068 ± 7.33915.476 ± 2.87133.868 ± 8.93331.837 ± 1.34730.927 ± 0.667
70° ethanol extracts
Ego28.523 ± 0.6977.164 ± 0.47620.077 ± 2.533155.229 ± 9.768138.247 ± 11.788140.757 ± 3.5149.263 ± 8.4197.941 ± 0.3719.302 ±0.72117.672 ± 1.95022.833 ± 1.30918.961 ± 1.082
Alter53.230 ± 9.3619.699 ± 0.48826.463 ± 2.410140.537 ± 1.32611.335 ± 2.2348.947 ± 0.47426.708 ± 2.71418.889 ± 0.57525.493 ± 0.287
Fiat lux33.382 ± 1.0439.097 ± 0.64614.325 ± 1.242142.929 ± 10.68815.463 ± 3.0577.397 ± 0.43322.950 ± 3.42223.348 ± 4.20923.147 ± 5.996
Triplo malto28.101 ± 1.0526.899 ± 0.81912.763 ± 0.178145.847 ± 13.75919.063 ± 1.3907.902 ± 1.91035.600 ± 1.47421.623 ± 1.07735.822 ± 0.147
Ubi31.947 ± 3.69612.785 ± 1.85516.456 ± 0.443143.761 ± 5.30214.001 ± 0.6178.103 ±0.43221.871 ± 1.24219.678 ± 1.02822.320 ± 0.882
Maior72.143 ± 1.86612.664 ± 1.39137.569 ± 1.730143.668 ± 4.22920.068 ± 7.3398.723 ±0.57233.868 ± 8.93314.274 ± 1.50730.927 ± 0.667
* Samples were not subjected to extraction. They were used as received and then subjected to lyophilisation.
Table 4. Antioxidant activities DPPH.
DPPHStarting MaltWort *Spent MaltStarting Hops: PerleStarting Hops:
Saaz
Starting Hops: Perle and SaazWort after HopsSpent HopsStarting YeastBeer after YeastSpent
Yeast
Beer
TEAC (µmol TE/g)TEAC (µmol TE/g)TEAC (µmol TE/g)TEAC (µmol TE/g)TEAC (µmol TE/g)TEAC
(µmol TE/g)
TEAC (µmol TE/g)TEAC (µmol TE/g)TEAC (µmol TE/g)TEAC (µmol TE/g)TEAC (µmol TE/g)TEAC (µmol TE/g)
Water extracts
Ego12.281 ± 4.4972.549 ± 0.1913.212 ± 0.21289.243 ± 17.15772.382 ± 10.25772.467 ± 11.4254.233 ± 1.1233.114 ± 0.1129.191 ± 0.0015.324 ± 0.27818.991 ± 1.0095.544 ± 0.324
Alter23.982 ± 5.6241.946 ± 0.0484.215 ± 0.02573.152 ± 2.6553.544 ± 1.0222.645 ± 0.6925.466 ± 0.25512.757 ± 3.4295.268 ± 1.277
Fiat lux21.98 ± 2.7851.822 ± 0.0852.528 ± 0.06875.681 ± 14.1344.387 ± 1.8503.704 ± 0.0716.124 ± 1.24317.991 ± 1.6396.320 ± 1.123
Triplo malto9.527 ± 1.7708.503 ± 5.1792.433 ± 0.06375.977 ± 4.07212.798 ± 2.1503.604 ± 0.12515.177 ± 1.17828.593 ± 1.25714.785 ± 2.235
Ubi21.647 ± 1.1735.451 ± 0.2772.507 ± 0.12377.485 ± 16.27910.143 ± 1.2443.381 ± 0.14213.043 ± 0.12420.125 ± 2.67414.244 ± 1.466
Maior20.647 ± 1.1674.480 ± 1.7253.449 ± 0.05575.739 ± 5.9878.527 ± 2.3263.313 ± 0.05210.078 ± 1.25523.459 ± 3.2429.127 ± 0.675
70° ethanol extracts
Ego22.339 ± 0.2562.549 ± 0.1919.036 ± 0.191354.182 ± 78.223258.252 ± 27.154327.241 ± 77.9934.233 ± 1.1237.579 ± 0.4367.483 ± 0.7075.324 ± 0.27832.989 ± 5.9365.544 ± 0.324
Alter20.379 ± 0.2341.946 ± 0.0487.022 ± 1.241309.025 ± 66.4713.544 ± 1.0226.949 ± 0.5865.466 ± 0.25528.988 ± 3.9345.268 ± 1.277
Fiat lux39.954 ± 0.1451.822 ± 0.0859.174 ± 1.347341.825 ± 36.9864.387 ± 1.8506.149 ± 0.2526.124 ± 1.24330.263 ± 16.2186.320 ± 1.123
Triplo malto22.339 ± 0.0678.503 ± 5.1798.124 ± 1.256283.059 ± 31.74912.798 ± 2.1508.055 ± 1.82215.177 ± 1.17832.026 ± 18.56714.785 ± 2.235
Ubi40.765 ± 0.1455.451 ± 0.2779.756 ± 1.266270.852 ± 25.78210.143 ± 1.2449.412 ± 0.14213.043 ± 0.12458.675 ± 11.56614.244 ± 1.466
Maior42.387 ± 0.8934.480 ± 1.72510.244 ± 1.345260.854 ± 36.2458.527 ± 2.3266.759 ± 0.22710.078 ± 1.25519.799 ± 2.4539.127 ± 0.675
* Samples were not subjected to extraction. They were used as received and then subjected to lyophilisation.
Table 5. Antioxidant activities, ABTS.
ABTSStarting MaltWortSpent MaltStarting Hops: PerleStarting Hops: SaazStarting Hops: Perle and SaazWort after HopsSpent HopsStarting YeastBeer after YeastSpent YeastBeer
TEAC (µmol TE/g)TEAC (µmol TE/g)TEAC (µmol TE/g)TEAC (µmol TE/g)TEAC (µmol TE/g)TEAC (µmol TE/g)TEAC (µmol TE/g)TEAC (µmol TE/g)TEAC (µmol TE/g)TEAC (µmol TE/g)TEAC (µmol TE/g)TEAC (µmol TE/g)
Water extracts
Ego25.801 ± 2.49947.671 ± 3.02214.667 ± 3.0962233.942 ± 238.0771954.786 ± 259.234636.489 ± 20.753141.376 ± 62.4398.257 ± 1.318177.450 ± 4.346322.082 ± 104.79135.475 ± 0.94231.683 ± 2.487
Alter22.699 ± 0.95576.374 ± 6.20113.865 ± 15.869491.661 ± 4.66423.974 ± 5.3773.905 ± 0.347226.365 ± 38.85930.553 ± 3.34637.485 ± 1.723
Fiat lux24.045 ± 1.84961.555 ± 5.26717.855 ± 4.889527.328 ± 31.52949.818 ± 29.8087.967 ± 1.381251.736 ± 25.61128.107 ± 4.85543.687 ± 3.508
Triplo malto21.389 ± 2.69433.621 ± 2.99618.973 ± 10.953618.662 ± 2.42115.768 ± 25.8919.743 ± 0.730188.430 ± 11.98751.308 ± 3.04634.704 ± 0.607
Ubi25.519 ± 0.72198.108 ± 13.20318.890 ± 2.038424.874 ± 28.439214.435 ± 18.0757.150 ± 0.754122.265 ± 14.52122.373 ± 4.95433.742 ± 4.285
Maior46.823 ± 0.031112.802 ± 9.70316.890 ± 5.036314.732 ± 9.46757.636 ± 23.3096.704 ± 0.409255.149 ± 56.93426.103 ± 1.65228.452 ± 1.507
70° ethanol extracts
Ego50.669 ± 1.06647.671 ± 3.02220.341 ± 2.1636547.220 ± 174.5005405.892 ± 127.8972189.582 ± 329.231141.376 ± 62.4395.408 ± 2.85865.906 ± 4.600322.082 ± 104.79147.139 ± 0.32131.683 ± 2.487
Alter41.305 ± 2.77876.374 ± 6.20121.722 ± 2.1631807.521 ±23.974 ± 5.3775.256 ± 4.568226.365 ± 38.85941.372 ± 0.62337.485 ± 1.723
Fiat lux44.566 ± 6.73861.555 ± 5.26718.306 ± 0.4363935.707 ± 108.79849.818 ± 29.8084.724 ± 0.491251.736 ± 25.61141.194 ± 3.14943.687 ± 3.508
Triplo malto68.801 ± 1.38133.621 ± 2.99617.356 ± 0.2283859.089 ± 87.956115.768 ± 25.8916.479 ± 0.359188.430 ± 11.98745.35 ± 2.47634.704 ± 0.607
Ubi76.198 ± 7.22198.108 ± 13.20318.879 ± 2.7531158.326 ± 46.978214.435 ± 18.0755.987 ± 1.750122.265 ± 14.52136.723 ± 3.79833.742 ± 4.285
Maior97.207 ± 19.118112.802 ± 9.70310.097 ± 0.7611353.216 ± 10.05557.636 ± 23.3095.789 ± 1.098255.149 ± 56.93432.814 ± 1.54328.452 ± 1.507
Table 6. Antioxidant activities, FRAP. Potential reduction.
FRAPStarting MaltWortSpent MaltStarting Hops: PerleStarting Hops: SaazStarting Hops: Perle And SaazWort after HopsSpent HopsStarting YeastBeer after YeastSpent YeastBeer
TEAC (µmol TE/g)TEAC (µmol TE/g)TEAC
(µmol TE/g)
TEAC (µmol TE/g)TEAC (µmol TE/g)TEAC (µmol TE/g)TEAC (µmol TE/g)TEAC (µmol TE/g)TEAC (µmol TE/g)TEAC (µmol TE/g)TEAC (µmol TE/g)TEAC (µmol TE/g)
Water extracts
Ego68.336 ± 2.63726.036 ± 0.87667.712 ± 1.439332.045 ± 91.163377.423 ± 45.244141.194 ± 4.13152.563 ± 1.576102.657 ± 3.98771.045 ± 5.85988.967 ± 4.544123.906 ± 1.915109.843 ± 2.186
Alter80.394 ± 1.02528.144 ± 2.14065.103 ± 0.607131.694 ± 1.73658.827 ± 3,005101.557 ± 4.87884.849 ± 6.334103.154 ± 1.558110.550 ± 1.830
Fiat lux56.121 ± 1.48025.395 ± 2.76166.535 ± 1.079136.897 ± 5.02357.941 ± 12.18990.999 ± 14.97167.022 ± 2.444106.609 ± 0.937115.380 ± 0.051
Triplo malto59.357 ± 0.90429.073 ± 0.65169.598 ± 2.014151.032 ± 0.17935.117 ± 0.65087.898 ± 9.37349.944 ± 0,082124.793 ± 7.251104.046 ± 7.680
Ubi60.627 ± 2.15830.191 ± 0.25463.027 ± 2.711138.153 ± 5.39049.744 ± 2.12397.256 ± 5.04643.891 ± 0.378136.719 ± 2.908112.839 ± 0.457
Maior59.996 ± 1.43229.587 ± 0.82443.388 ± 0.952111.194 ± 3.84474.441 ± 10.74895.247± 4.45699.051 ± 15.886130.168 ± 14.966125.159 ± 1.237
70° ethanol extracts
Ego37.723 ± 0.98726.036 ± 0.87638.772 ± 1.639120.133 ± 44.166110.257 ± 37.122120.605 ± 1.12352.563 ± 1.57632.245 ± 1.23844.494 ± 0.50188.967 ± 4.54473.707 ± 1.224109.843 ± 2.186
Alter54.343 ± 2.83528.144 ± 2.14035.607 ± 0.560121.971 ± 11.64958.827 ± 3,00531.236 ± 1.16884.849 ± 6.33482.229 ± 2.623110.550 ± 1.830
Fiat lux40.644 ± 6.40525.395 ± 2.76130.618 ± 0.42553.718 ± 65.96657.941 ± 12.18933.813 ± 0.97767.022 ± 2.44474.299 ± 3.587115.380 ± 0.051
Triplo malto38.048 ± 0.15929.073 ± 0.65130.953 ± 0.041211.213 ± 1.22235.117 ± 0.65029.281 ± 1.01349.944 ± 0,08270.214 ± 2.305104.046 ± 7.680
Ubi47.207 ± 0.41830.191 ± 0.25433.143 ± 0.17981.798 ± 0.06849.744 ± 2.12330.911 ± 0.63443.891 ± 0.37877.751 ± 2.05112.839 ± 0.457
Maior33.932 ± 4.41529.587 ± 0.82436.506 ± 0.55970.116 ± 0.92374.441 ± 10.74829.812 ± 0.91399.051 ± 15.88672.187 ± 0.679125.159 ± 1.237
Publisher’s Note: MDPI stays neutral with regard to jurisdictional claims in published maps and institutional affiliations.

