Article

Unconventional Co-Existence of Insulating Nano-Regions and Conducting Filaments in Reduced SrTiO3: Mode Softening, Local Piezoelectricity, and Metallicity

1
Max-Planck-Institute for Solid State Research, Heisenbergstr. 1, D-70569 Stuttgart, Germany
2
Physik-Institut der Universität Zürich, Winterthurerstr. 190, Ch-8057 Zürich, Switzerland
3
Peter Grünberg Institut, Forschungszentrum Jülich and JARA, D-52425 Jülich, Germany
4
Institute for Advanced Simulation, Forschungszentrum Jülich and JARA, D-52425 Jülich, Germany
5
Institute of Physics, University of Silesia, ul. 75 Pułku Piechoty 1, 41-500 Chorzów, Poland
6
aixACCT-System, 52068 Aachen, Germany
*
Author to whom correspondence should be addressed.
Submission received: 3 May 2020 / Revised: 24 May 2020 / Accepted: 27 May 2020 / Published: 29 May 2020
(This article belongs to the Special Issue Electronic Phenomena of Transition Metal Oxides)

Abstract

:
Doped SrTiO3 becomes a metal at extremely low doping concentrations n and is even superconducting at n < 1020 cm−3, with the superconducting transition temperature adopting a dome-like shape with increasing carrier concentration. In this paper it is shown within the polarizability model and from first principles calculations that up to a well-defined carrier concentration nc transverse optic mode softening takes place together with polar nano-domain formation, which provides evidence of inhomogeneity and a two-component type behavior with metallicity coexisting with polarity. Beyond this region, a conventional metal is formed where superconductivity as well as mode softening is absent. For nnc the effective electron-phonon coupling follows the superconducting transition temperature. Effusion measurements, as well as macroscopic and nanoscopic conductivity measurements, indicate that the distribution of oxygen vacancies is local and inhomogeneous, from which it is concluded that metallicity stems from filaments which are embedded in a polar matrix as long as nnc.

1. Introduction

SrTiO3 (STO) is one of the best investigated systems for scientific and technological reasons. Early on, research activities focused on the cubic to tetragonal phase transition at TS = 105 K [1,2,3,4,5,6] and the transverse optic mode softening suggesting a polar instability [7,8,9,10]. While the structural instability was assigned to the rotation of oxygen octahedrons driven by a soft transverse acoustic zone boundary mode, the polar instability has been shown to be suppressed by quantum fluctuations and the phase named quantum paraelectric and/or incipient ferroelectric, respectively [1,5]. Ferroelectricity can, however, be induced by either isotopic substitution of 16O by 18O [11], or by replacing tiny amounts of Sr by Ca [12]. In the former case, the polar state remains incomplete [13,14], since it is inhomogeneous with coexisting paraelectric and ferroelectric domains, whereas in the latter, an XY pseudospin ferroelectric transition takes place [12]. Recently, it has been shown that the domain walls of STO in the tetragonal phase carry polar properties related to ferroelectricity [15,16]. Upon replacing Sr by Ca or La, or Ti with Nb, or removing oxygen, superconductivity has been observed at low temperature with a dome-like dependence of the transition temperature upon doping [17,18,19,20,21,22,23,24,25]. In all cases, the carrier concentrations are extremely small and the Fermi energies are an order of magnitude smaller than the Debye temperature. For oxygen deficient samples, superconductivity has early on been explained as soft mode- [26,27,28] or intervalley deformation potential-driven [23,29,30]. Another interpretation has combined both proposals by introducing unconventional anharmonicity [31]. Recent novel interest in STO has invoked ferroelectric mode fluctuations [32], longitudinal optical phonons [33], or plasmons [34] as possible sources of superconductivity. Besides its superconducting properties, also the metallic state of STO and its metal / insulator (M/I) transition have attracted intense attention, since metallicity is observed at a carrier concentration which reaches a critical value defined by the Mott’s criterion [35]. This transition can be induced through a reduction in high temperatures and under low oxygen partial pressure, e.g., in a vacuum, Ti-getter, or H2 atmosphere [18,36]. Macroscopic measurements of the Hall effect indeed provide some evidence that the critical concentration of free carriers required for the M/I transition should be of the order of n ≈ 1016/cm3 [25,36]. However, effusion measurements and macroscopic and nanoscopic conductivity measurements show that the removal of only 1013–1014 oxygen ions/cm3 turns STO into a metallic state [37,38], and thus violate the Mott criterion. In addition, such an extremely low distribution of oxygen vacancies gives rise to local inhomogeneity, which implies that the reduction process is of local character and takes place only near the core of dislocations [37,38,39]. This so-called self-doping is limited to the network of dislocations, increasing the local concentration of Ti d1 electrons to 1020–1021/cm3 [37,40,41]. These observations imply that the Mott criterion is satisfied locally, whereas from the point of view of average properties it is violated.
In this paper, the dynamical properties of doped STO are investigated and shown to be related to superconductivity. In particular, it is demonstrated that the soft optic mode persists up to a critical carrier concentration nc and leads to the formation of polar nano domains. Since ferroelectricity, and also incipient ferroelectricity as realized in undoped STO, are incompatible with metallicity, an inhomogeneous state emerges where the metallic conductivity is filamentary [39,42,43]. On the other hand, mode softening takes place in the embedding matrix which consists of polar nano-regions. Interestingly, superconductivity is confined to the regime of coexistence, thus highlighting the importance of the pseudo ferroelectric soft phonon mode. These results are supported by an experimental conductivity study which provides evidence that the filamentary character of the conductivity is in coexistence with polar nano-domains.

2. Theoretical Background

The dynamical properties of STO have been studied comprehensively experimentally since its discovery [2,3,4,6,9,10]. Intense theoretical work has been devoted to the understanding based on phenomenological modelling as well as ab initio theories. The presence of strong anharmonicity has been especially emphasized when concentrating on the essential temperature-dependent properties of this compound. A rather profound breakthrough was obtained by Migoni et al. [44], who introduced a nonlinear polarizability model to successfully quantitatively reproduce the characteristic dynamical properties of ferroelectric perovskites, including STO, within a self-consistent phonon approximation (SPA). This model has been cast into a more transparent pseudo-one-dimensional version and applied to a broad range of ferroelectrics [45,46,47,48]. The essential ingredient of the model as introduced by Migoni et al [44] is based on the nonlinear polarizability of the oxygen O2− ion, which depends strongly on its crystalline environment. In [44], this was accounted for by using two independent core-shell force constants with respect to the A and B neighbors in ABO3. The lowest term of the nonlinear core-shell interaction at the oxygen-ion site is of fourth order, because of inversion symmetry in the paraelectric phase. However, the temperature dependence of the soft mode and other low frequency modes, as well as the Raman spectra, depends on the coupling constant directed to the transition metal ion only. This corresponds to the modulation of the oxygen-ion polarizability in the direction of the neighboring Ti ion in STO and indicates that the phonon-induced change of the transition-metal —oxygen bond, i.e., the hybridization of oxygen p and transition metal d electrons, plays an essential role for the dynamical properties of ferroelectrics (“dynamical covalency”). The importance of the p-d hybridization has been demonstrated for various perovskites and successfully interpreted on the basis of a nonlinear polarizability model. The onsite potential in the core–shell interaction is of double-well character with g2 being the attractive harmonic coupling constant and g4 the fourth order repulsive anharmonic coupling constant, and can be written as V ( w 1 n   ) = g 2 w 1 n 2 + g 4 w 1 n 4 using the definition w 1 n = v 1 n u 1 n where u 1 n is the ionic displacement and v 1 n the electronic shell related one, respectively, at lattice site 1n. The relative displacement coordinate w 1 n characterizes the polarization and has the limits of a fully delocalized shell for complete ionization, and a rigidly bound shell for where p-d hybridization effects are irrelevant. In metallic samples, new or in-gap states appear at or close to the Fermi energy, which diminish these effects and correspondingly destroy the proximity to a polar instability.
A review on the model is given in [45,46]. For doped semiconducting STO, the observed soft transverse optic zone center mode has been shown to harden with increasing carrier concentration [49], and a linear relation between carrier concentration and g2, as well as g4, was established [50].
In the following, this relation is used to extract g2, as well as g4, for arbitrary carrier concentrations. This method allows us to obtain the related double-well potential and to calculate optic mode softening within the SPA, the coupling of optic and acoustic modes, the spatial extensions of polar nano-domains, and the effective electron-phonon coupling constant as a function of carrier concentration n.
In Figure 1, g2 and g4 are shown as functions of n. Clearly, the nonlinear interaction constant g4 is small and almost independent of n, whereas g2 rapidly increases with increasing n and changes sign for nc = 2.232 × 1020 cm−3, the carrier concentration for which the superconducting transition temperature Tc vanishes.
At nc, the double-well potential changes to a single-well one (Figure 2), where the depicted carrier concentrations refer to the ones discussed in [51,52] in order to provide the connection to experimental data.
Besides the fact that the potential changes from double-well to single well, it becomes also increasingly narrow with increasing n. This finding implies – counterintuitively – that the electrons within the TiO6 unit are more strongly localized (see above), and dynamical p-d hybridization effects lose importance. Since this happens with increasing carrier concentrations, other pathways for the conductivity of doped STO must be present. In various recent work, extended studies of STO and other perovskites have shown that dislocations and defects form types of filaments (within the polar matrix), which are responsible for conductivity [40,41,42,43].
The carrier concentration-dependent values of g2 and g4 allow one to calculate the temperature dependence of the lowest transverse optic and acoustic modes within the SPA. The squared optic mode frequency ω T O 2 ( q = 0 ) is inversely proportional to the permittivity, whereas the acoustic mode experiences anharmonic mode-mode coupling at finite momentum, as shown by anomalies in its dispersion [53,54,55]. This squared “soft” mode frequencies of doped STO are shown as a function of temperature in Figure 3.
As is clear from Figure 3, the modes can be grouped into two categories, namely ferroelectric type up to nc, and non-ferroelectric, like for n > nc, where only a minor softening with decreasing temperature is observed, which is consistent with the change in the potential from double to single well.
Since precursor dynamics have been predicted and experimentally confirmed in undoped STO [53,54,55], doped systems have also investigated for these features, which are signatures of polar or elastic nano-domain formation. This is better carried out by inspection of the dispersion of the lowest optic and acoustic modes. Typical dispersions are shown for three carrier concentrations, low, intermediate, and large, in Figure 4a–c.
In the cases with small and intermediate carrier concentrations, the increasing mode-mode coupling with decreasing temperature is apparent through anomalies at a small momentum in the acoustic mode dispersion, which was also observed experimentally [45,46]. This has completely vanished for n = 11.2 × 1020 cm−3, where the acoustic mode temperature dependence is almost absent, especially in the small q range. The momentum values where the coupling is largest are clearly obtained by calculating the difference of the optic and acoustic modes where the minimum indicates the spatial range of maximum mode-mode coupling. Again, the three above examples are shown in Figure 4d–f, and all other cases lie in between or beyond those. With increasing carrier density, the difference spectrum moves to a higher energy and the minimum momentum value qmin shifts to higher q-values. This implies that the spatial extent of these nano-domains decreases with increasing n and its volume fraction shrinks. The related spatial spread of the polar region with radius rc as a function of temperature is shown for all investigated carrier concentrations in Figure 5. For carrier concentrations smaller than nc, rc diverges with decreasing temperature and is only slightly dependent on the carrier concentration at high temperatures to saturate at a spatial spread of approximately 5 lattice constants. This means that at all temperatures, the system is inhomogeneous and consists of polar nano-domains as a matrix that coexists with conducting filaments. For n > nc, small nano-domains remain, but their spatial extent and volume fraction are small and almost independent of temperature. In this case, the sample inhomogeneity has almost completely vanished and the conductivity should be metallic-like, as observed experimentally. It is important to mention that effective Hamiltonian approaches are unable to capture these “local” spatially-confined features, since they rely on the lattice periodicity. This is, however, absent in the present approach and the appropriate modelling is not given.
All curves follow an exponential law where r0 is a polaronic radius and of the order of several lattice constants for n < nc and decreases substantially for a larger n. Similarly, A is almost constant for small carrier concentrations and decreases rapidly for larger ones. The crossover temperature TK shows similar trends, but increases enormously for n > nc. All parameters are summarized in Table 1.
The question remains whether the above dynamical properties can be related to the metal/insulator (M/I) transition and superconductivity. This is certainly not possible directly, however, upon multiplying the double-well potential depth with the density of states at EF and plotting this as a function of n, an approximate relation is obtained, as displayed in Figure 6. As soon as the potential changes shape at nc, the coupling is repulsive and is therefore not shown in the figure.
Clearly, a dome-like dependence of the “effective” coupling constant on n is obtained, which mimics the dependence of Tc on n, as observed experimentally [21]. It is, however, within the above presented results, not possible to link superconductivity directly to Figure 6. Hence, an Eliashberg-type calculation is in progress, and we are convinced that the data will indeed be relevant to superconductivity in STO. If so, it must be concluded that superconductivity occurs in a region with strong inhomogeneity where filamentary conductivity coexists with a polar matrix. It is worth mentioning that similar conclusions have already been reached for cuprate superconductors [56].

3. Experimental Results

The analysis of the electrical properties of doped STO is based on the volume concentration of carriers. Self-doped STO samples exhibit different electronic, chemical, and structural properties as compared to the matrix, which is not very affected by doping [57]. However, in core dislocations, the removal of oxygen is preferentially taking place along extended defects [40,58,59]. Consequently, a local reduction is observed, which cannot be measured by average macroscopic property detecting tools like, e.g., mobility and Hall measurements. This statement is supported by local conductivity atomic force microscopy (LC-AFM) data [39,40], which provides evidence that very low concentrations of oxygen deficiency assemble along the dislocations. In order to fulfill the Mott criterion for the M/I transition in reduced STO, these conclusions are necessary and sufficient. From a LC-AFM analysis of in-situ and ex-situ cleaved surfaces of reduced STO and the in-plane cleaved crystals, the resistivity data (Table 2) have been compared with the four point method taken at the maximum reduction process [60]. The measured resistance using the four-points method calculated resistivity values of Table 2 are in close agreement with data from Spinelli [36] and Schooley [18] for reduced STO either being metallic or superconducting. Since the reduction methods of [18,36] are not commonly used and differ from the ones of [40,58,59], we cannot prove that either the M/I or the superconducting transitions are confined to core dislocations or filaments. In order to provide more stringent evidence for our arguments, which do not support a statistical distribution of “defects”, a simple but impressive experiment has been carried out, which highlights the important role of dislocations and filament formation in the electric transport of reduced SrTiO3.
A reduced STO single crystal is cut into two identical parts where one has the original epi-polished surface whereas the other is scratched by using e.g., a diamond pyramid (Figure 7).
This procedure has increased the number of dislocations by one to two orders of magnitude from 109–10/cm2 to 1011–12/cm2 of the scratched sample [59]. Upon reducing both samples simultaneously under the same thermodynamic conditions, the resistivity of both has been monitored as a function of temperature (Figure 7b, bottom). As is obvious from the Figure 7b (bottom), the electrical transport properties of both samples are very different from each other in spite of the use of identical reduction processes. Even though both samples show metallic behavior, the resistivity of the polished one is shifted to higher values as compared to the scratched one, where not just a scaling factor enters. Apparently, the increase in the dislocation density of the scratched sample (c) by two orders of magnitude as compared to the epi-polished one (b) has decreased the resistivity by a factor of five, which intuitively was to be expected. While this observation seems to be counterintuitive to the initial argument, a decisive fact has been omitted, namely, the dislocation density on the edges (upper inset to Figure 7b, top) of both specimen are alike. By taking this fact into account, a simple count of dislocations stemming from both the faces and the edges of both samples contributing to the resistivity cannot be larger than approximately five as deduced from detailed resistivity measurements including the edges [38]. The role dislocations played for electrical transport can indirectly be proven through measurements of the temperature gradient (using an infrared camera) along the sample during poling. In the vicinity of regions with a high concentration of these extended defects, the local temperature is increased by 10 to 40 K, caused by the preferential current flow and the related Joule loss [59]. Thus, this experiment supports the basic assumption of filamentary conductivity in doped STO, which is intimately related to the two-component approach suggested to be realized in this system, an intact dielectric matrix and a hierarchic 3D network of metallic/superconducting filaments. An important ingredient is the interface between both, which mediates their interplay and most likely acts as an inter-band interaction term analogous to two-band superconductivity. A schematic view of the above scenario is shown in Figure 8, where doping is shown to be constrained to the core of filaments, whereas the polar properties are limited to the remaining regions, rendering the system intrinsically inhomogeneous.
As outlined above, even with increasing carrier density, mode softening persists on a dynamic time scale of ps and length scale of nm. This process can be confirmed experimentally on the nano-scale by using, e.g., time-resolved infrared spectroscopy or scanning near-field optical microscopy (SNOM). Alternatively, piezoelectric force microscopy (PFM) offers the possibility of locally detecting a piezoelectric response which is an indirect probe of mode softening through the creation of induced dipole moments. This has been shown in [60,61], where in the vicinity of the core of edge dislocations in a STO bicrystal, a polarization of the order of 20 µC/cm2 has been detected. Analogously, the steps of terrace piezoelectric activity can be expected [60,62]. This is demonstrated in Figure 9, where along a sharp step of a plastically deformed STO crystal, corresponding to a broad band of dislocations, piezoelectric responses are observed.
Using highly sensitive LC-AFM mapping of the near-step area, a series of dislocations (filaments), with considerably lower resistance than the rest of the stoichiometric crystal, exists (Figure 9b). This suggests that in the core of the dislocations, the local stoichiometry is different from that of the bulk.
When a crystal with semiconducting dislocation cores, dislocation bundles, steps or with a low/high angle boundary is additionally reduced, the dislocations are transformed into metallic filaments. These affect not only the electrical properties (e.g., the insulator-metal transition), but also produce enormous changes in the dielectric and piezoelectric properties. In the areas of high (metallic) conductivity, the piezoelectricity vanishes (Figure 10). This finding clearly questions the validity of the concept of metallic-ferroelectricity [63], or more precisely metallic-piezoelectricity. On the contrary, and considering the above results, the concept of essential heterogeneity in thermally reduced SrTiO3 crystals, namely a dielectric (ferroelectric) matrix and 3D network of metallic filaments, provides a reasonable and realistic picture of perovskite oxides.
It is important to note that aliovalent doping of STO (with, e.g., La or Nb), causing n type conductivity and an insulator metal transition for only 0.1–1% doping, leads to a more homogeneous distribution of carriers in the matrix. This implies that in STO:La or STO:Nb, the formation of polar nano-regions with the same radii throughout the crystal volume takes place, which is contrary to the thermally reduced STO crystal shown in Figure 8.

4. Conclusions

In conclusion, the dynamical properties of STO have been calculated as a function of carrier concentration. Up to a critical concentration nc, the lattice potential is of double-well character and strong transverse optic mode softening takes place. This is linked to the formation of polar nano-regions, which grow in size with decreasing temperature, implying substantial sample inhomogeneity. The “insulating” nano-domains coexist with the filamentary conductivity, and hence possible links to superconductivity have been suggested. As long as this coexistence persists, superconductivity survives. This suggests that the essential origin must be associated with the polar character and the two-component properties. Beyond nc, almost “normal” dynamics are observed with negligible mode softening and nano-domain formation. Typical metallicity is expected there as well as homogeneous sample properties.
The theoretical results are supported by experiments which demonstrate the local metallic character and the insulating behavior of the matrix. From additional PFM and LC-AFM data, the dielectric character of the matrix has been confirmed, together with the strong variations in the resistance upon crossing from the matrix to the metallic filaments. Here, especially, the comparison of stoichiometric crystals with scratched (i.e., with a high concentration of mechanically generated dislocations), and other epi-polished ones (with a low concentration of dislocations) has provided essential clues in understanding the role of filaments in electrical transport phenomena (in particular for the analysis of the type of transition I/M induced by reduction under vacuum conditions in the network of dislocation filaments), and in modifications of local polarization in the vicinity of conductive core of dislocations (filaments).

Author Contributions

A.B.-H. and G.B. performed the theoretical calculations. K.S. carried out the experiments. H.K., K.R., and A.S. contributed through numerous discussions. All authors reviewed the article. All authors have read and agreed to the published version of the manuscript.

Funding

This research received no external funding.

Conflicts of Interest

The authors declare no competing financial and non-financial interest.

References

  1. Müller, K.A.; Burkard, H. SrTiO3: An intrinsic quantum paraelectric below 4 K. Phys. Rev. B 1997, 19, 3593–3598. [Google Scholar] [CrossRef]
  2. Yamada, Y.; Shirane, G. Neutron Scattering and Nature of the Soft Optical Phonon in SrTiO3. J. Phys. Soc. Jpn. 1969, 26, 396–403. [Google Scholar] [CrossRef]
  3. Fleury, P.A.; Scott, J.F.; Worlock, J.M. Soft Phonon Modes and the 110° K Phase Transition in SrTiO3. Phys. Rev. Lett. 1968, 21, 16–19. [Google Scholar] [CrossRef]
  4. Riste, T.; Samuelsen, E.J.; Otnes, K.; Feder, J. Critical behaviour of SrTiO3 near the 105°K phase transition. Solid State Commun. 1971, 9, 1455–1458. [Google Scholar] [CrossRef]
  5. Müller, K.A.; Berlinger, W. Static Critical Exponents at Structural Phase Transitions. Phys. Rev. Lett. 1971, 26, 13–16. [Google Scholar] [CrossRef]
  6. Müller, K.A.; Berlinger, W.; Slonczewski, J. Order Parameter and Phase Transitions of Stressed SrTiO3. Phys. Rev. Lett. 1970, 25, 734–737. [Google Scholar]
  7. Spitzer, W.G.; Miller, R.C.; Kleinman, D.A. Dielectric dispersion in single crystal BaTiO3, SrTiO3 and TiO2. Bull. Am. Phys. Soc. 1962, 7, 280. [Google Scholar]
  8. Barker, A.S.; Tinkham, M. Far-infrared ferroelectric vibration mode in SrTiO3. Phys. Rev. 1962, 125, 1527–1530. [Google Scholar] [CrossRef]
  9. Cowley, R.A. Temperature Dependence of a Transverse Optic Mode in Strontium Titanate. Phys. Rev. Lett. 1962, 9, 159–162. [Google Scholar]
  10. Cowley, R.A. The Lattice Dynamics of Ionic and Covalent Crystals. Proc. R. Soc. A 1962, 268, 109–120. [Google Scholar]
  11. Itoh, M.; Wang, R.; Inaguma, Y.; Yamaguchi, T.; Shan, Y.-J.; Nakamura, T. Ferroelectricity Induced by Oxygen Isotope Exchange in Strontium Titanate Perovskite. Phys. Rev. Lett. 1999, 82, 3540–3543. [Google Scholar] [CrossRef]
  12. Bednorz, J.G.; Müller, K.A. Sr1−xCaxTiO3: An XY Quantum Ferroelectric with Transition to Randomness. Phys. Rev. Lett. 1984, 52, 2289–2292. [Google Scholar] [CrossRef]
  13. Bussmann-Holder, A.; Büttner, H.; Bishop, A.R. Stabilization of ferroelectricity in quantum paraelectrics by isotopic substitution. J. Phys. Condens. Matter 2000, 12, L115–L120. [Google Scholar] [CrossRef]
  14. Abe, K.; Yamashita, K.; Tomita, Y.; Shigenari, T.; Wang, R.; Itoh, M. Raman Spectra in Ferroelectric SrTi18O3. Ferroelectrics 2002, 272, 155–160. [Google Scholar] [CrossRef]
  15. Salje, E.K.H.; Aktas, O.; Carpenter, M.A.; Laguta, V.V.; Scott, J.F. Domains within Domains and Walls within Walls: Evidence for Polar Domains in Cryogenic SrTiO3. Phys. Rev. Lett. 2013, 111, 247603–247607. [Google Scholar] [CrossRef]
  16. Scott, J.F.; Salje, E.K.H.; Carpenter, M.A. Domain Wall Damping and Elastic Softening in SrTiO3: Evidence for Polar Twin Walls. Phys. Rev. Lett. 2012, 109, 187601–187604. [Google Scholar] [CrossRef]
  17. Koonce, C.S.; Cohen, M.L.; Schooley, J.F.; Hosler, W.R.; Pfeiffer, R.E. Superconducting Transition Temperatures of Semiconducting SrTiO3. Phys. Rev. 1967, 163, 380. [Google Scholar] [CrossRef]
  18. Schooley, J.F.; Hosler, W.R.; Cohen Marvin, L. Superconductivity in Semiconducting SrTiO3. Phys. Rev. Lett. 1964, 12, 474–477. [Google Scholar] [CrossRef]
  19. Matthias, B.T. Proc. Symp. On Ferroelectricity, Warren, Michigan; Weller, E.F., Ed.; Elsevier: Amsterdam, The Netherlands, 1966; p. 176. [Google Scholar]
  20. Sweedler, A.R.; Raub, C.J.; Matthias, B.T. Superconductivity of the alkali tungsten bronzes. Phys. Lett. 1965, 15, 108–109. [Google Scholar] [CrossRef]
  21. Binnig, G.; Baratoff, A.; Hoenig, H.E.; Bednorz, J.G. Two-Band Superconductivity in Nb-Doped SrTiO3. Phys. Rev. Lett. 1980, 45, 1352–1355. [Google Scholar] [CrossRef]
  22. Olaya, D.; Pan, F.; Rogers, C.T.; Price, J.C. Superconductivity in La-doped strontium titanate thin films. Appl. Phys. Lett. 2004, 84, 4020–4022. [Google Scholar]
  23. Collignon, C.; Fauqué, B.; Cavanna, A.; Gennser, U.; Mailly, D.; Behnia, K. Superfluid density and carrier concentration across a superconducting dome: The case of strontium titanate. Phys. Rev. B 2017, 96, 224506. [Google Scholar] [CrossRef] [Green Version]
  24. Rischau, C.W.; Lin, X.; Grams, C.P.; Finck, D.; Harms, S.; Engelmayer, J.; Lorenz, T.; Gallais, Y.; Fauque, B.; Hember, J.; et al. A ferroelectric quantum phase transition inside the superconducting dome of Sr1−xCaxTiO3−δ. Nat. Phys. 2017, 13, 643–648. [Google Scholar] [CrossRef]
  25. Lin, X.; Zhu, Z.; Fauqué, B.; Behnia, K. Fermi Surface of the Most Dilute Superconductor. Phys. Rev. X 2013, 3, 021002. [Google Scholar]
  26. Appel, J. Soft-Mode Superconductivity in SrTiO3−x. Phys. Rev. 1969, 180, 508. [Google Scholar] [CrossRef]
  27. Appel, J. Superconductivity in Pseudoferroelectrics. Phys. Rev. Lett. 1966, 17, 1045–1048. [Google Scholar] [CrossRef]
  28. Philip, B.A. Superconductivity and structural instability in SrTiO3. Solid State Commun. 1973, 13, 411–415. [Google Scholar]
  29. Koonce, C.S.; Cohen, M.L. Theory of Superconducting Semiconductors and Semimetals. Phys. Rev. 1969, 177, 707–719. [Google Scholar] [CrossRef]
  30. Cohen, M.L. Superconductivity in Many-Valley Semiconductors and in Semimetals. Phys. Rev. 1964, 134, A511–A521. [Google Scholar] [CrossRef]
  31. Bussmann-Holder, A.; Bishop, A.R.; Simon, A. SrTiO3: From Quantum Paraelectric to Superconducting. Ferroelectrics 2010, 400, 19–26. [Google Scholar]
  32. Edge, J.M.; Kedem, Y.; Aschauer, U.; Spaldin, N.A.; Balatsky, A.V. Quantum Critical Origin of the Superconducting Dome in SrTiO3. Phys. Rev. Lett. 2015, 115, 247002. [Google Scholar]
  33. Ruhman, J.; Lee, P.A. Superconductivity at very low density: The case of strontium titanate. Phys. Rev. B 2016, 94, 224515. [Google Scholar]
  34. Gorkov, L.P. Phonon mechanism in the most dilute superconductor n-type SrTiO3. Proc. Natl. Acad. Sci. USA 2016, 113, 4646–4651. [Google Scholar]
  35. Cox, P.A. Transition Metal Oxides; Clarendon Press: Oxford, UK, 1995; p. 199. [Google Scholar]
  36. Spinelli, A.; Torija, M.A.; Liu, C.; Jan, C.; Leighton, C. Electronic transport in doped SrTiO3: Conduction mechanisms and potential applications. Phys. Rev. B 2010, 81, 155110. [Google Scholar] [CrossRef]
  37. Szot, K.; Speier, W.; Carius, R.; Zastrow, U.; Beyer, W. Localized Metallic Conductivity and Self-Healing during Thermal Reduction of SrTiO3. Phys. Rev. Lett. 2002, 88, 075508. [Google Scholar]
  38. Szot, K.; Rodenbücher, C.; Bihlmayer, G.; Speier, W.; Ishikawa, R.; Shibata, N.; Ikuhara, Y. Influence of Dislocations in Transition Metal Oxides on Selected Physical and Chemical Properties. Crystals 2018, 8, 241. [Google Scholar] [CrossRef] [Green Version]
  39. Szot, K.; Speier, W.; Bihlmayer, G.; Waser, R. Switching the electrical resistance of individual dislocations in single-crystalline SrTiO3. Nat. Mater. 2006, 5, 312–320. [Google Scholar]
  40. Waser, R.; Dittmann, R.; Staikov, G.; Szot, K. Redox-Based Resistive Switching Memories—Nanoionic Mechanisms, Prospects, and Challenges. Adv. Mater. 2009, 21, 2632–2663. [Google Scholar] [CrossRef]
  41. Rodenbücher, C.; Wicklein, S.; Waser, R.; Szot, K. Insulator-to-metal transition of SrTiO3: Nb single crystal surfaces induced by Ar+ bombardment. Appl. Phys. Lett. 2013, 102, 101603. [Google Scholar] [CrossRef] [Green Version]
  42. Rodenbücher, C.; Speier, W.; Bihlmayer, G.; Breuer, U.; Waser, R.; Szot, K. Cluster-like resistive switching of SrTiO3: Nb surface layers. New J. Phys. 2017, 15, 103017. [Google Scholar]
  43. Muenstermann, R.; Dittmann, R.; Szot, K.; Mi, S.; Jia, C.L.; Meuffels, P.; Waser, R. Realization of regular arrays of nanoscale resistive switching blocks in thin films of Nb-doped SrTiO3. Appl. Phys. Lett. 2008, 93, 023110. [Google Scholar] [CrossRef]
  44. Migoni, R.; Bilz, H.; Bäuerle, D. Origin of Raman Scattering and Ferroelectricity in Oxidic Perovskites. Phys. Rev. Lett. 1976, 37, 1155–1158. [Google Scholar] [CrossRef]
  45. Bilz, H.; Benedek, G.; Bussmann-Holder, A. Theory of ferroelectricity: The polarizability model. Phys. Rev. B 1987, 35, 4840–4849. [Google Scholar]
  46. Bussmann-Holder, A. The polarizability model for ferroelectricity in perovskite oxides. J. Phys. Condens. Matter 2012, 24, 273202. [Google Scholar]
  47. Bussmann-Holder, A.; Büttner, H.; Bishop, A.R. Polar-Soft-Mode-Driven Structural Phase Transition in SrTiO3. Phys. Rev. Lett. 2007, 99, 167603. [Google Scholar] [CrossRef]
  48. Bussmann-Holder, A. Interplay of polarizability and ionicity in IV-VI compounds. Phys. Rev. B 1989, 40, 11639–11643. [Google Scholar] [CrossRef]
  49. Bäuerle, D.; Wagner, D.; Wöhlecke, M.; Dorner, B.; Kraxenberger, H. Soft modes in semiconducting SrTiO3: II. The ferroelectric mode. Z. Physik B—Condens. Matter 1980, 38, 335–339. [Google Scholar]
  50. Bussmann-Holder, A.; Bilz, H.; Bäuerle, D.; Wagner, D. A polarizability model for the ferroelectric mode in semiconducting SrTiO3. Z. Physik B Condens. Matter 1981, 41, 353–355. [Google Scholar]
  51. Tao, Q.; Loret, B.; Xu, B.; Yang, X.; Rischau, C.W.; Lin, X.; Fauqué, B.; Verstraete, M.J.; Behnia, K. Nonmonotonic anisotropy in charge conduction induced by antiferrodistortive transition in metallic SrTiO3. Phys. Rev. B 1981, 94, 035111. [Google Scholar] [CrossRef] [Green Version]
  52. Lin, X.; Rischau, C.W.; Buchauer, L.; Jaoui, A.; Fauqué, B.; Behnia, K. Metallicity without quasi-particles in room-temperature strontium titanate. Nat. NPJ Quantum Mater. 2017, 41, 2–8. [Google Scholar]
  53. Bussmann-Holder, A.; Roleder, K.; Ko, J.H. What makes the difference in perovskite titanates? J. Phys. Chem. Solids 2018, 117, 148–157. [Google Scholar] [CrossRef]
  54. Bussmann-Holder, A.; Roleder, K.; Ko, J.-H. Phase transitions and interrelated instabilities in PbHfO3 single crystals. J. Phys. Condens. Matter 2014, 26, 275402. [Google Scholar] [CrossRef]
  55. Ko, J.H.; Górny, M.; Majchrowski, A.; Roleder, K.; Bussmann-Holder, A. Mode softening, precursor phenomena, and intermediate phases in PbZrO3. Phys. Rev. B 2013, 87, 184110. [Google Scholar] [CrossRef]
  56. Müller, K.A. On the superconductivity in hole doped cuprates. J. Phys. Cond. Mat. 2007, 19, 251002. [Google Scholar] [CrossRef]
  57. Calvani, P.; Capizzi, M.; Donato, F.; Lupi, S.; Maselli, P.; Peschiaroli, D. Observation of a midinfrared band in SrTiO3−y. Phys. Rev. B 1993, 47, 8917–8922. [Google Scholar] [CrossRef]
  58. Wrana, D.; Rodenbücher, C.; Bełza, W.; Szot, K.; Krok, F. In situ study of redox processes on the surface of SrTiO3 single crystals. Appl. Surf. Sci. 2018, 432, 46–52. [Google Scholar] [CrossRef]
  59. Rodenbücher, C.; Menzel, S.; Wrana, D.; Gensch, T.; Korte, C.; Krok, F.; Szot, K. Current channeling along extended defects during electroreduction of SrTiO3. arXiv 2019, arXiv:1910.02748. Available online: https://arxiv.org/abs/1910.02748 (accessed on 29 May 2020).
  60. Gao, P.; Yang, S.; Ishikawa, R.; Li, N.; Feng, B.; Kumamoto, A.; Shibata, N.; Yu, P.; Ikuhara, Y. Atomic-Scale Measurement of Flexoelectric Polarization at SrTiO3 Dislocations. Phys. Rev. Lett. 2018, 120, 267601. [Google Scholar] [CrossRef]
  61. Szot, K.; Bihlmayer, G.; Speier, W. Chapter Four—Nature of the Resistive Switching Phenomena in TiO Origin of the Reversible Insulator–Metal Transition. Solid State Phys. 2014, 65, 359–559. [Google Scholar]
  62. Jin, L.; Guo, X.; Jia, C.L. TEM study of 〈110〉-type 35.26° dislocations specially induced by polishing of SrTiO3 single crystals. Ultramicroscopy 2013, 134, 77–85. [Google Scholar] [CrossRef]
  63. Shi, Y.; Guo, Y.; Wang, X.; Princep, A.J.; Khalyavin, D.; Manuel, P.; Michiue, Y.; Sato, A.; Tsuda, K.; Yu, S.; et al. A ferroelectric-like structural transition in a metal. Nature Mat. 2013, 12, 1024–1027. [Google Scholar] [CrossRef] [PubMed] [Green Version]
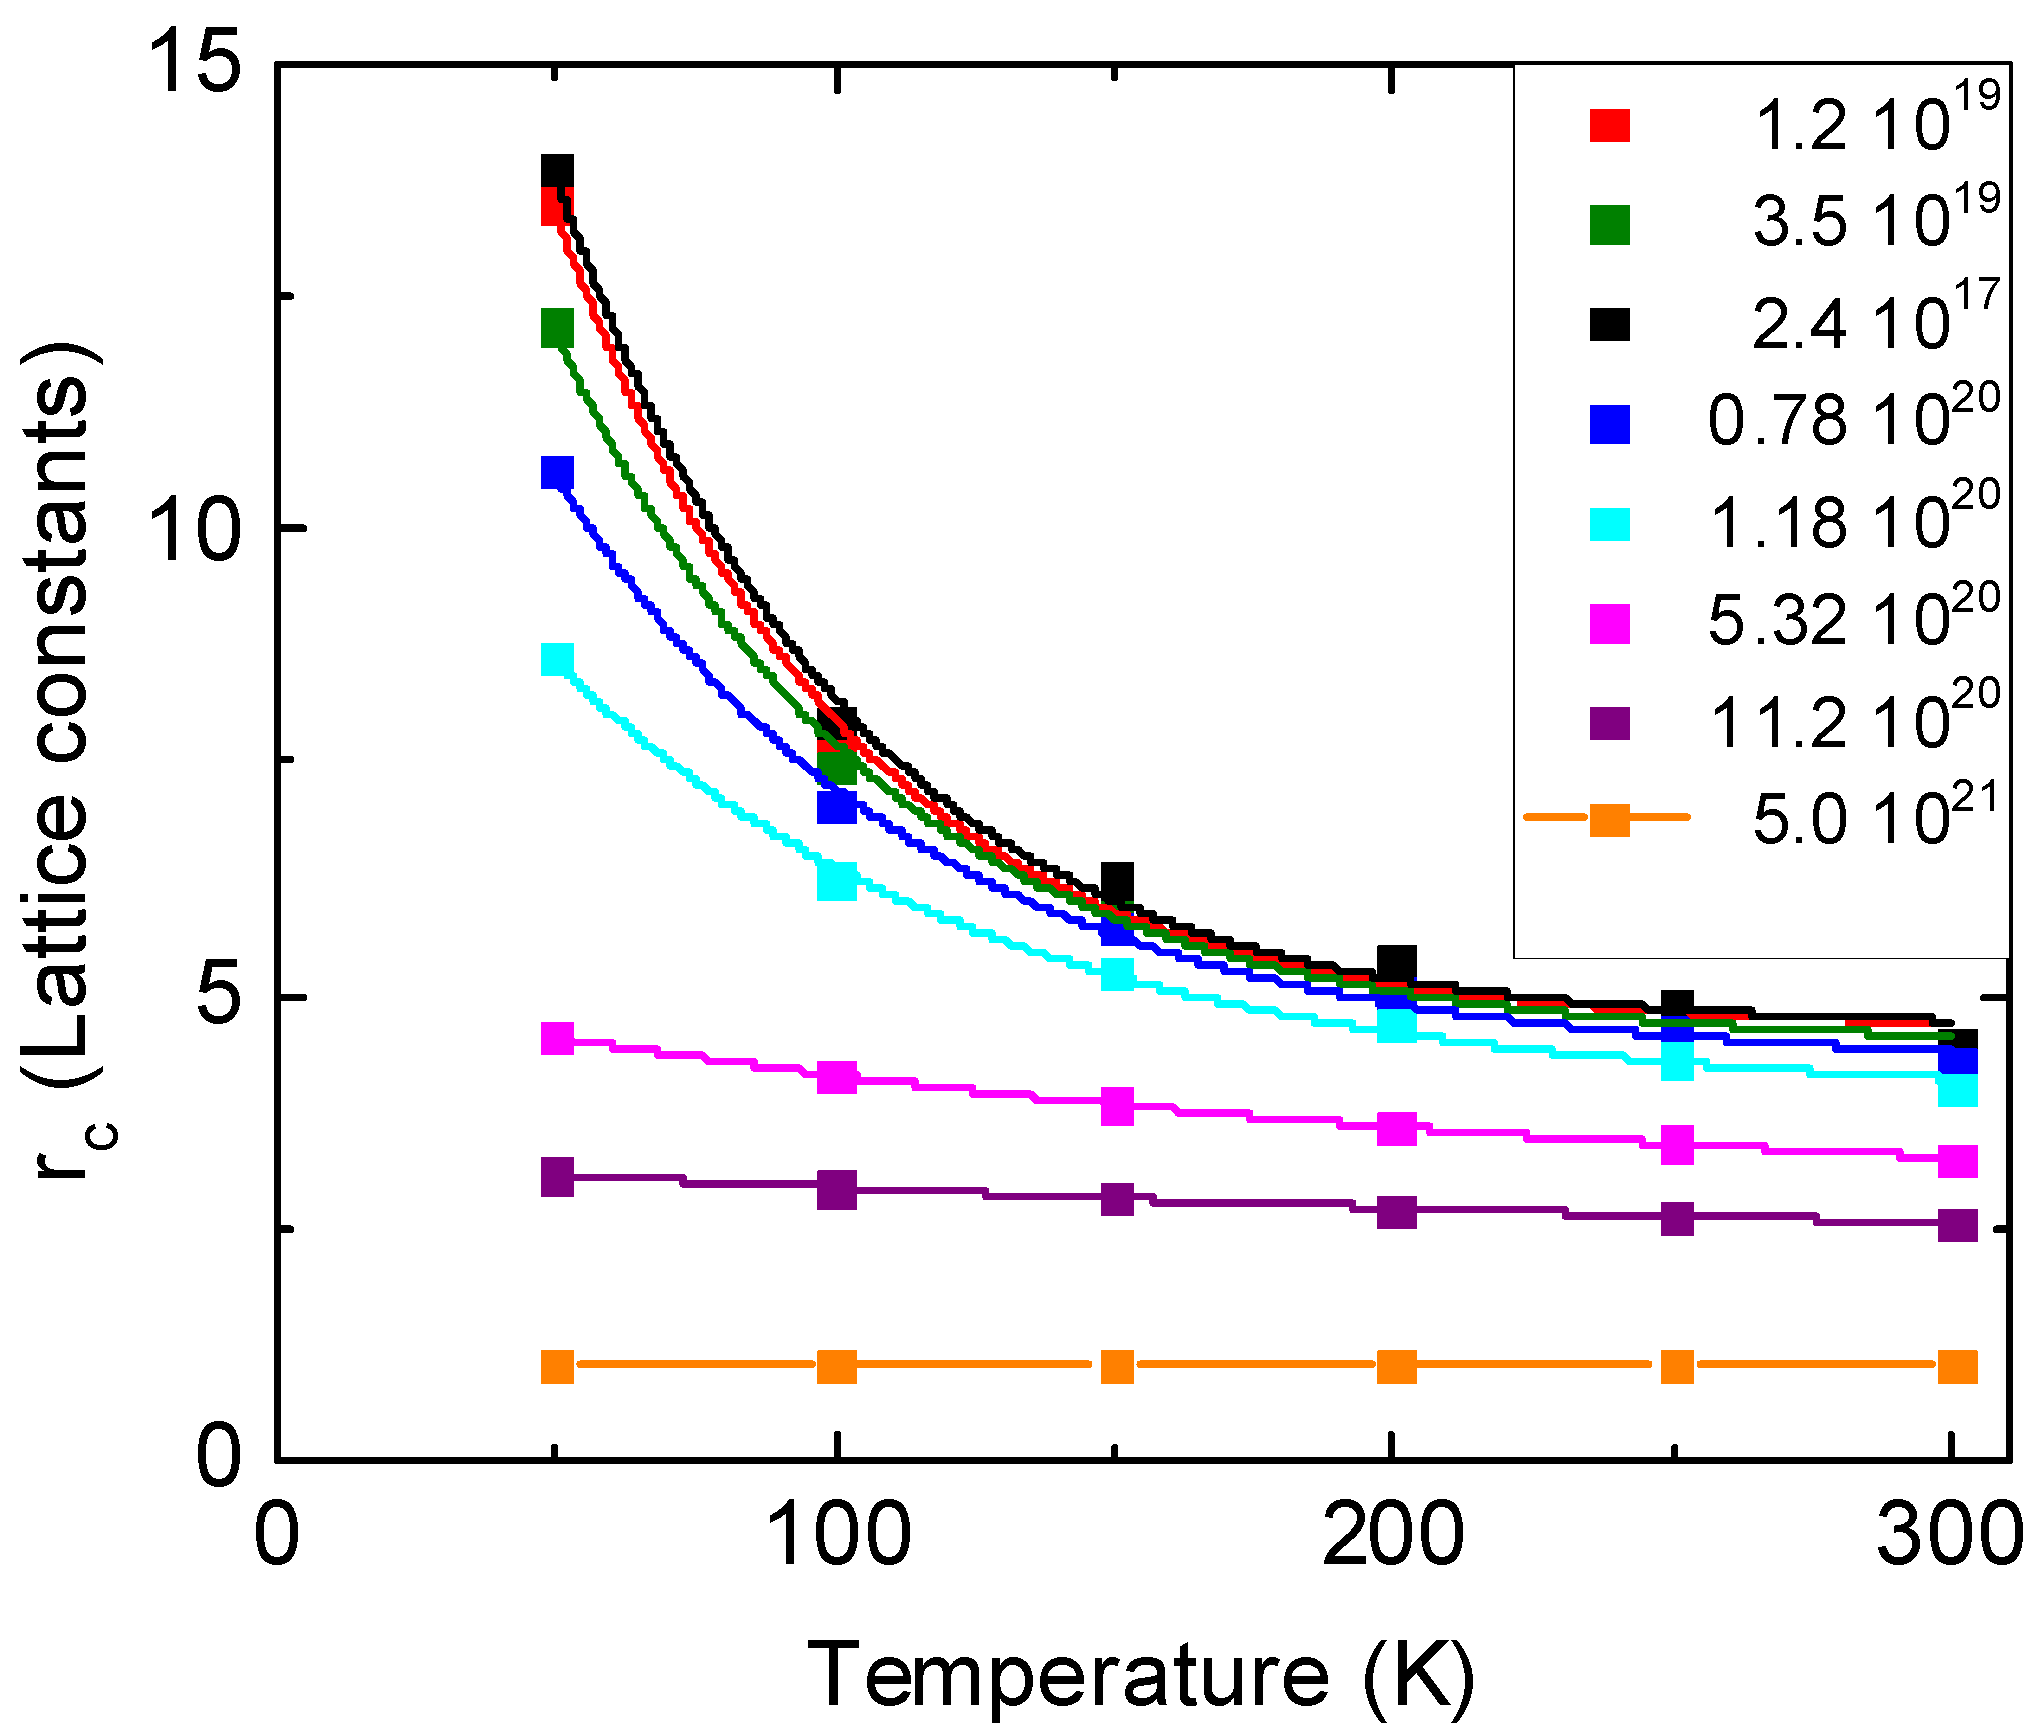
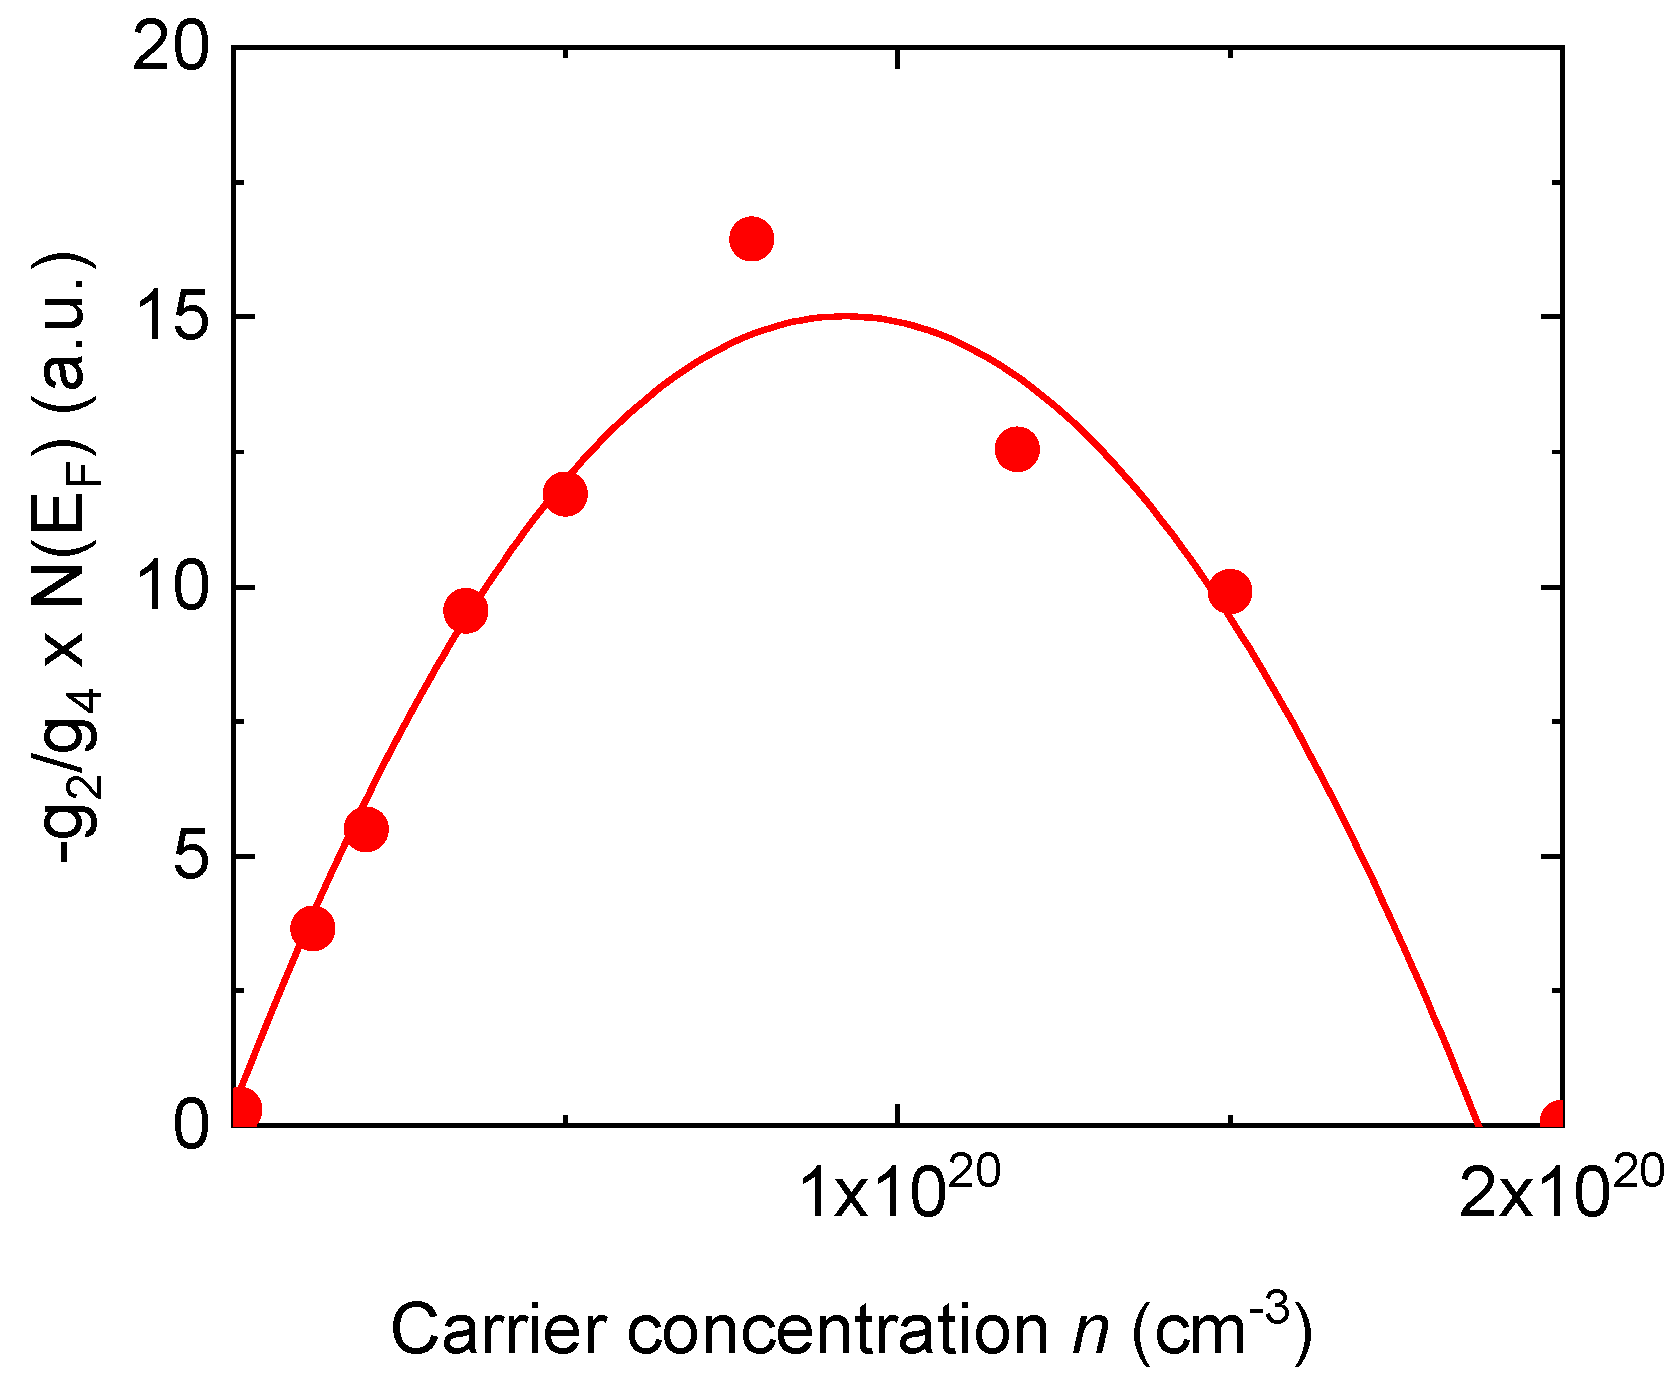
Figure 1. Carrier concentration dependence of the harmonic g2 and the fourth order anharmonic g4 coupling constants. Note that g2 changes sign at nc from attractive to repulsive.
Crystals 10 00437 g001
Figure 2. Local potential V in the core-shell related relative displacement coordinate w for various carrier concentration n (cm−3) (the color code is given in the inset). The bright dashed green line corresponds to nc.
Crystals 10 00437 g002
Figure 3. The squared ferroelectric soft mode as a function of temperature for various carrier concentrations n (cm−3), as given in the inset.
Crystals 10 00437 g003
Figure 4. Dispersion of the lowest transverse optic and acoustic modes for n = 2.4 × 1017 cm−3 (a), 0.78 × 1020 cm−3 (b), and 11.2 × 1020 cm−3 (c). The q-dependent frequency difference for n = 2.4 × 1017 cm−3 (d), 0.78 × 1020 cm−3 (e), and 11.2 × 1020 cm−3 (f). All curves are shown for different temperatures as given in the insets.
Crystals 10 00437 g004
Figure 5. Spatial extent of polar nano-regions as a function of temperature and various carrier concentrations n as indicated in the inset to the figure.
Crystals 10 00437 g005
Figure 6. Effective coupling constant as a function of carrier concentration n. Calculated results correspond to full circles, line is a parabolic fit.
Crystals 10 00437 g006
Figure 7. (Top) Schematic view of the preparation of SrTiO3 (STO) sample with different dislocation densities in the surface layer. After cleaving the sample, (a) the distribution of dislocations and their concentration is identical to the reference crystal (~109–10/cm2) in contrast to (c) where the surface area has been scratched and thereby has generated a value of 1011–12 dislocation/cm2. The upper inset (d) provides evidence that the edge of the reference crystal contains a substantially larger dislocation density as compared to (b). The local conductivity atomic force microscopy (LC-AFM) mapping (e) of the part of the crystal close to the edge of the reduced crystal shows an extremely high concentration increase of the conducting dislocations. The ratio of the conductivity of dislocations (represented by the dark brown color) to the matrix conductivity (represented by white color) is of about 3–4 orders of magnitude. (Bottom) Temperature dependence of the resistivity of samples b and c. Sample b is represented by the red line, and c by the blue one.
Crystals 10 00437 g007aCrystals 10 00437 g007b
Figure 8. Schematic representation of the distribution of polar nano clusters in reduced STO (insets a, and the corresponding local potential b-I), close to the conductive core of the dislocation (insets a, with the potential b-II) and inside the core (insets a, and potential b-III). In the matrix, far from the dislocations, the concentration of carriers is rather small and thus admits its unhindered clustering (inset b-I). For details, see Figure 2 and Figure 5, with a relatively large spatial extent (here ≈5 lattice constants (uc) at 300 K (inset c)). In the vicinity of conductive dislocations, their expansion is reduced to 2.5 unit cell (uc) (insets a, c) caused by the increase in the local concentration of d-electrons up to 1017–19/cm3 (inset d, cross-section A-B, and inset b-II). In the core of the dislocation, the concentration of carriers reaches a maximum value of 1020–21/cm3, which renders the formation of nano clusters unlikely (insets b-III and c). In the core of the dislocation with a typical radius of 2 nm, their size is not larger than 1 uc (insets a and c). Note: the average concentration of Ti d-electrons has been calculated from effusion data [37,38], and the change in carrier concentration, which depends on the distance from the core, was derived from the LC-AFM measurements as depicted in the inset d (for details see [38,39,40]).
Crystals 10 00437 g008
Figure 9. Topographic image of a step (AFM) of a plastically deformed stoichiometric SrTiO3 crystal. (a) Near the step there is a wide band of conductive dislocations/filaments (dark points on LC-AFMmap) (b) The position of the filaments is correlated with the position of the etch pits (see [38]). Along the step, a high piezo response (out-of-plane) (c), and in-plane, (d) with the clear maximum of the piezoelectric force microscopy (PFM) response, can be observed between both rows of conductive dislocations. Note: The rest of the crystal, far from the step, shows very low piezo activity.
Crystals 10 00437 g009
Figure 10. Topographic image of the exit of a dislocation bundle in thermally reduced STO: (a) the topography variation is about 0–4.8nm. In the area of the bundle (LC-AFM) (b) with metallic properties the piezo response (c) is absent. This can be observed at the cross sections of LC-AFM (b) and PFM (c) responses. The distribution of the resistance along the cross section (lower part of Figure 10) shows an anti-correlation with the distribution of the piezo activity on the cross section of the PFM. The resistance outside the bundle is much higher than shown on the cross section, which is related to the finite resolution of the analog-to-digital converters (here 4 decades), so that using additional measurements (only in this area), the resistance is higher than 1012–13 Ω.
Crystals 10 00437 g010
Table 1. Carrier concentration n, harmonic versus anharmonic coupling constant −g2/g4, polaronic radius r0, exponential prefactor A, and crossover temperature TK.
Carrier Concentration n [cm−3]−g2/g4 [10−18 cm2]r0 [lattice constants]A [lattice constants]TK [K]
2.4 × 101732.144.6423.8552.6
1.2 × 101930.464.6323.3452.6
3.5 × 101927.294.4618.2359.0
0.78 × 102021.084.2613.5766.7
1.18 × 102010.633.918.9077.0
5.32 × 10²⁰−52.132.802.29185.0
11.2 × 10²⁰−118.162.181.06286.0
Table 2. Resistivity and global and local concentration of oxygen defects induced in a SrTiO3 single crystal at different reduction temperatures.
Reduction Temperature (°C)Single Crystal Resistance Assigned by Four-Points Method (Ω) Calculated Volume Resistivity (Ω cm)Resistivity (Ωcm) at Room Temperature
for Vacuum Reduced SrTiO3,
after Spinelli
et al. [36]
Hall Concentration
of Carriers N at Room Temperature
(N/cm3),
after Spinelli
et al. [36]
Calculated Volume Concentration of Oxygen Vacancies N due to Oxygen Effusion per
Unit Volume (N/cm3)
[38]
Effective Oxygen Vacancies Non-Stoichiometry x in SrTiO3−x
Derivate From
[38]
Average Concentration
of Oxygen Vacancies N in the Core of the Dislocations Network (N/cm3)
Determined from Effusion Data and Extension of the Hierarchic Tree of Dislocations
[38]
60013204918.25.64 × 10162.2 × 10134.4 × 10−103.3 × 10¹⁹
620 2.2 × 1021.04 × 1016
650 89.1–2.2 × 1033.8 × 1015–1.98 × 10¹⁶
7001184.433.87–1.13 × 1033.76 × 1015–2.13 × 10173.4 × 10131.1 × 10−108.4 × 10¹⁹
80047
150 [61]
1.76
4.69
2.6 × 10¹³
3 × 10¹⁴ [37]
1.75 × 10−91.3 × 1020
2 × 10²⁰ [37]
90027
25
1.01
0.78
9.1 × 10133.34 × 10−92.6 × 10²⁰
100014.80.56 8.0 × 10135.03 × 10−93.8 × 10²⁰
1100 0.15–0.472.23 × 1018

