Article

Genetic Structure and Diversity of Native Tench (Tinca tinca L. 1758) Populations in Hungary—Establishment of Basic Knowledge Base for a Breeding Program

1
Doctoral School of Biological Sciences, Hungarian University of Agriculture and Life Sciences, 2100 Gödöllő, Hungary
2
National Centre for Biodiversity and Gene Conservation, Institute for Farm Animal Gene Conservation, 2100 Gödöllő, Hungary
3
Vaskos Csabak Ltd., 5540 Szarvas, Hungary
4
Institute of Aquaculture and Environmental Safety, Hungarian University of Agriculture and Life Sciences, 2100 Gödöllő, Hungary
*
Authors to whom correspondence should be addressed.
Submission received: 10 March 2022 / Revised: 15 April 2022 / Accepted: 21 April 2022 / Published: 25 April 2022

Abstract

:
Tench is a cyprinid fish that has undergone human-induced translocations. The natural populations of the species are on the decline due to habitat loss and spawning grounds degradation. The genetic diversity of seven natural populations was investigated to establish the genetic knowledge base for successful conservation efforts and for selective breeding. Twelve microsatellite markers, the sequencing of a 615 bp section of mtDNA (Cytb) and PCR-RFLP analysis of two nuclear markers (Act) and (RpS7) were used to analyze the genetic variation and structure among 175 individuals. All microsatellite loci were found to have moderate levels of polymorphism. The pairwise Fst values between population pairings were moderate; the populations were aligned to four clusters. The Cytb gene showed 20 haplotypes; 67.1% of individuals were categorized as Eastern, while 32.9% to the Western haplogroup. Analysis of the Act and RpS7 genes showed that the level of hybridization among the two haplogroups is high within the sampled populations. Hungarian Tench populations are genetically less diverse compared to natural populations in Western-Europe, but they still represent valuable genetic resources and Lake Fertő, Lake Kolon and Csörnöc-Herpenyő populations can be optimal candidates for future selective breeding programs.

1. Introduction

Tench (Tinca tinca L. 1758) is a native freshwater cyprinid fishin Europe and Asia [1], including Hungary’s Danube catchment region. The species thrives in lentic habitats such as shallow, densely vegetated lakes and backwaters. It can live in highly varying environments, and as a eurythermal species, it can adapt to a wide range of temperatures up to 37 °C and to extremely low oxygen levels. This hypoxic tolerance makes them able to outcompete native species that are sensitive to oxygen deficiency and are unable to survive in such habitats outside the native range of tench. During the winter, it is often buried in mud to await warmer weather [2]. These characteristics make it an ideal candidate for adaptability to a wide range of environmental conditions. Despite a long history of being regarded as a neglected pond fish species [3], the tench now has considerable aquaculture potential [4,5] and interest in its rearing has recently grown significantly [5,6,7,8,9,10]. Due to its flavour and high interest among sport anglers, tench production has expanded in Europe [11,12]. In some parts of the continent special breeds of the species, such as Tinca Gobba Dorata del Pianalto di Poirino, presents a special quality and value [13]. However, in other parts of Europe it has been reared almost as a supplementary fish in polyculture ponds for many years, alongside other cyprinid species, mainly for the purpose of increasing yield. Traditionally, tench is co-cultured with the common carp (Cyprinus carpio Linnaeus, 1758) [12,14,15]. Nowadays, this species is extensively domesticated, similar to how common carp was centuries ago [16] and studies were carried out focusing on solving the problems connected to intensive rearing of the species [17,18]. Thus, it is important to estimate genetic variation in its populations to promote tench production and genetic improvement, which is required for successful selective breeding.
Wachirachaikarn et al. [19] proposed that genetically differentiated populations be crossed to develope genetically diversified base populations as a foundation for targeted breeding programs. This method was used for selection of GIFT Tilapia (Oreochromis niloticus). As a basic step they selected 81 to 100 sires and 124 to 185 dams as parents for yearly propagations in the first 5 five generations of the selective breeding project to avoid inbreeding and the critical decrease in effective population size [20,21]. In this regard, genetic markers, either protein or DNA (mitochondrial DNA or nuclear DNA), are highly effective as a tool for assessment of genetic diversity in aquaculture systems [22,23], as well as natural populations [24,25,26]. Despite the fact that few studies on the genetic diversity and population structure of this species have been published, polymorphism of microsatellite markers [13,27,28] and mitochondrial DNA (mtDNA) [29,30,31] and a set of SNPs [32] has been shown to be an excellent tool for detecting genetic structure in tench populations.
Tench, similar to most of Eurasia’s freshwater fish species, have deep phylogeographic subdivisions within their geographic ranges [33,34]. Based onanalysis of nuclear and mitochondrial DNA sequence markers, recent phylogeographic research revealed that the species is divided into highly divergent Western and Eastern geographical clades [24,29,34,35]. Human-aided translocations, on the other hand, may cause introgressions between these phylogroups, resulting in phylogeographic patterns that do not represent natural historical processes [36]. However, the genetic structure of tench populations in the Carpathian Basin is currently unexplained. Against this background this is one of the first studies to describe genetic structure and diversity in native Hungarian tench populations. Thus, the objective of this study was to assess the level of genetic diversity and to identify the phylogeographic relationships of seven wild populations in Hungary using 12 microsatellite DNA markers, mitochondrial (mtDNA) Cytb gene sequences, and two nuclear markers (Act and RpS7). The results give insight into the genetic structure of this species, which is a fundamental step for developing successful selective breeding strategies on one hand and sustainable conservation strategies on the other.

2. Materials and Methods

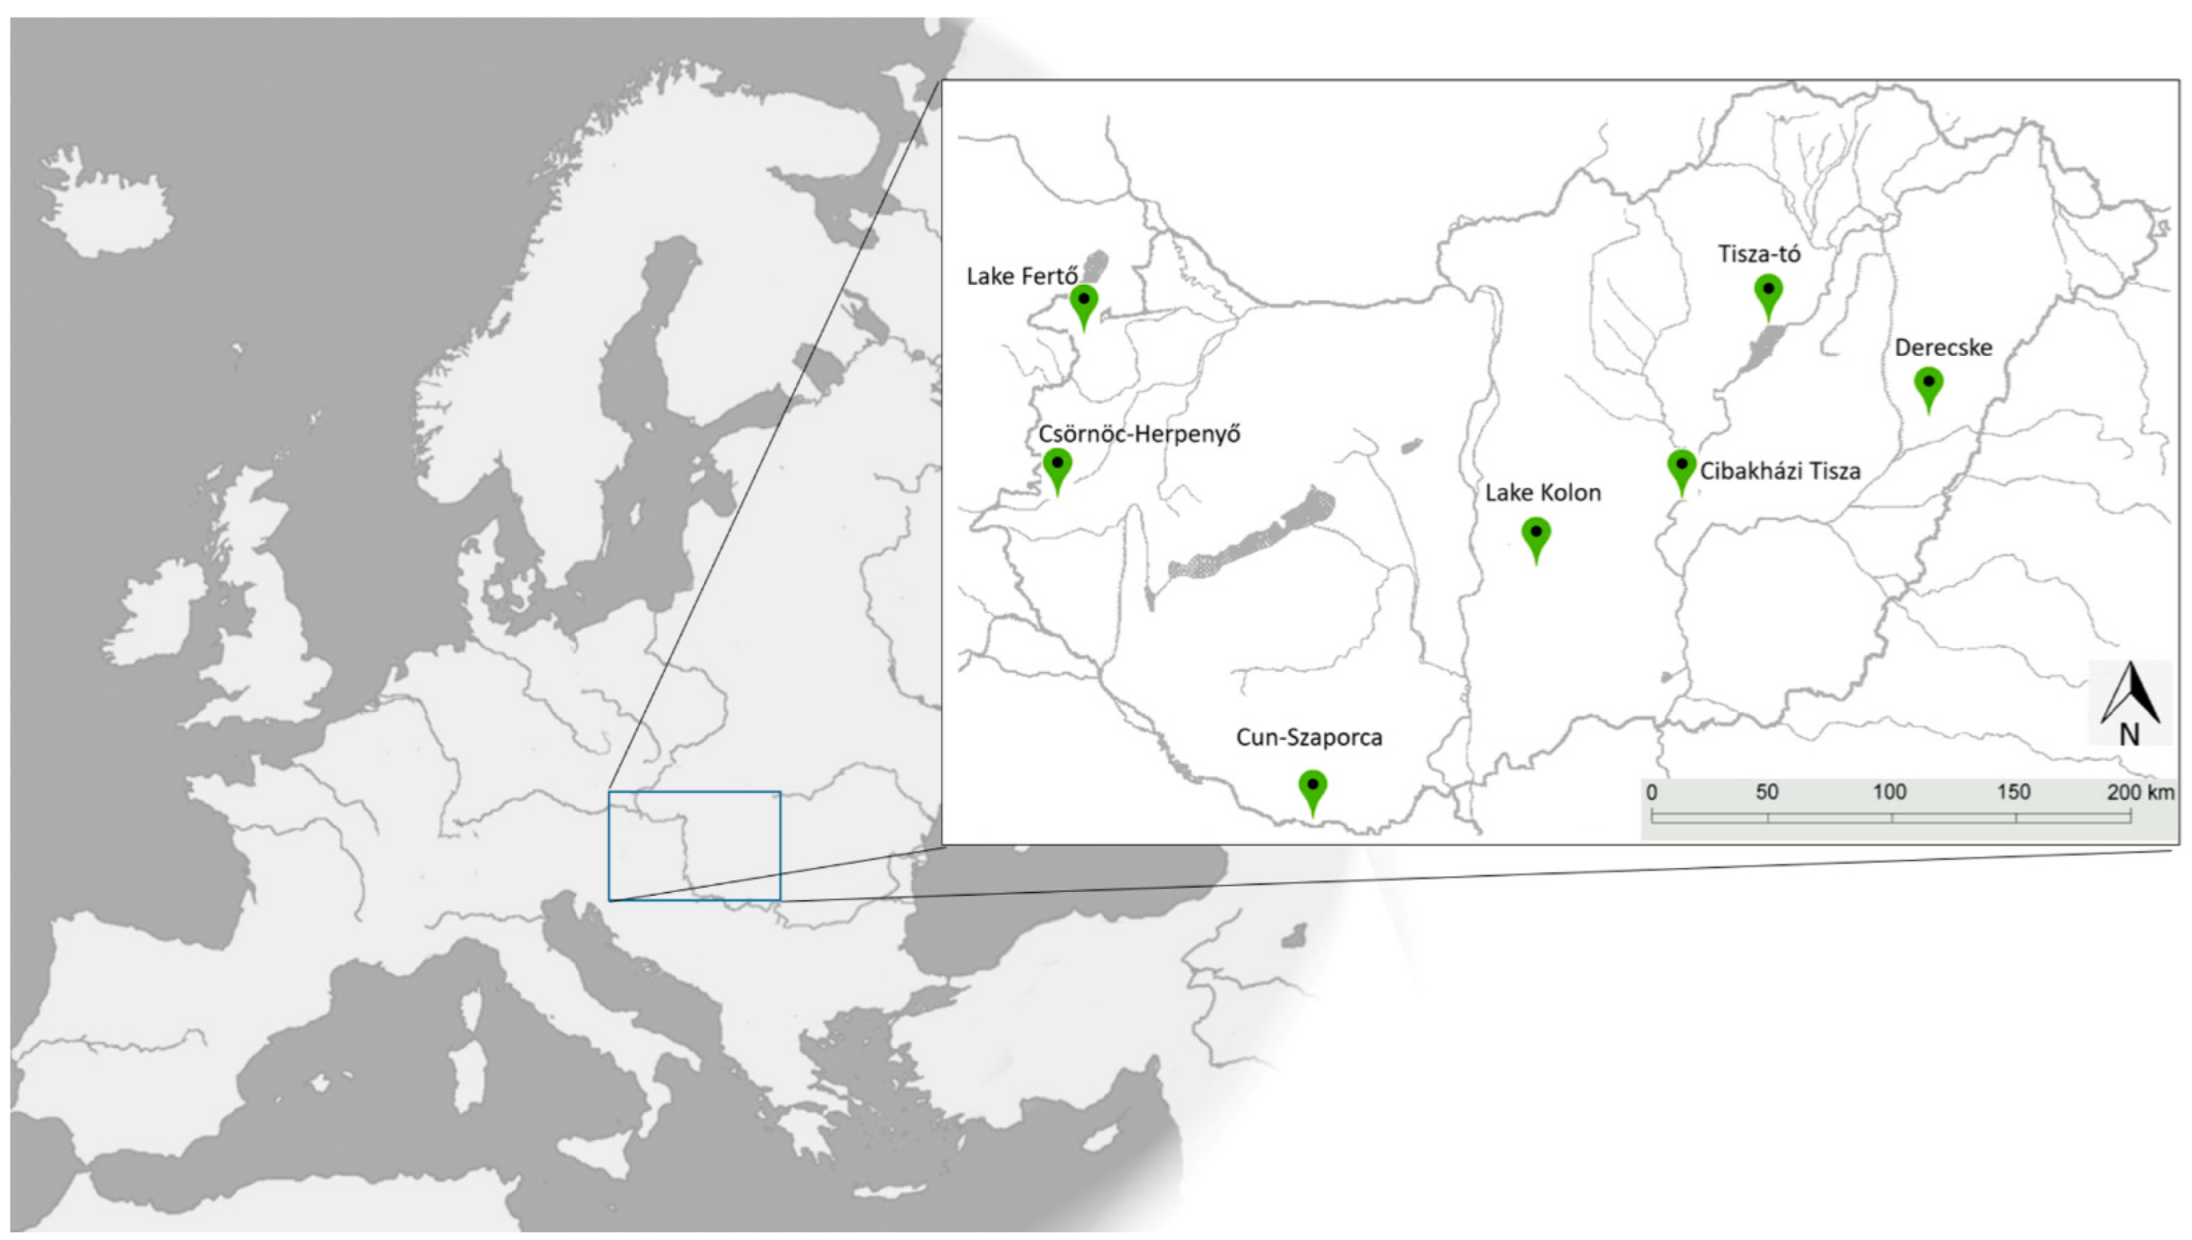
2.1. Sampling and DNA Extraction, Microsatellite Analysis

Fin tissue samples were collected from 175 tench individuals representing seven natural populations from the eastern, central, and western regions of Hungary (Table 1, Figure 1). Whole genomic DNA was extracted from the fin clips using the Qiagen DNeasy® Blood and Tissue Kit (Qiagen GmbH, Hilden, Germany) according to the manufacturer’s instructions. A spectrophotometer (NanoDrop 2000c, Thermo-Scientific, Waltham, MA, USA) was used to assess the quality and concentration of the extracted DNA.
The tench samples from the seven populations were genotyped using a total of twelve within/cross-species autosomal microsatellite markers (Table S1). Seven markers were developed for tench (MTT1-3, MTT5-6, MTT 8-9; [37]); two markers were adapted from common carp (MFW1, [38]; CypG24, [39]); and, further three markers were developed for tench in this study (MT1-3). These markers were developed with Primer 3 software run on tench transcriptome sequences containing repeat motifs. The sequences of the new markers are shown in Table S2.
The protocol for each marker was likewise modified and optimized before the actual amplification. Amplification for loci MTT-1, MTT-2, MTT-3, MTT-5, and MTT-6 was conducted in a 15 μL reaction volume containing 30 ng genomic DNA, 1.5 μL 10xDreamTaq Buffer with 20 mM MgCl2, 1 μL 25 mM dNTPmix, 0.4 μL of each fluorescently labelled locus-specific primer, and 0.1 μL DreamTaq DNA polymerase 5 Unit/μL (Thermo Fisher Scientific, Waltham, MA, USA). The PCR reactions were carried out in a Kyratec PCR thermal cycler (Applied Biosystems, Foster City, CA, USA). PCR reactions were programmed as follows; initial denaturation at 95 °C for 5 min; followed by 5 cycles of 95 °C for 1 min, annealing temperature at 55 °C for 1 min, and 72 °C for 1 min, then another 35 cycles of 1 min at 90 °C, 1 min at 55 °C, and 1 min at 72 °C. Final 7-min extension was performed at 72 °C. In the case of lociMTT-8, MTT-9, and CypG24 markers were amplified in a multiplex PCR reaction using the QIAGEN Multiplex kit with the manufacturer’s indicated reagent concentrations, including 6.15 μL of Multiplex mix, 40 ng genomic DNA, 0.3 μL 5 μM fluorescently labelled forward primer, 0.3 μL 5μM reverse primer, 2.40 μL Q solution, and RNase-free water in a final reaction volume of 12 μL. Initial denaturation at 95 °C for 15 min was followed by 35 cycles of 94 °C for 1 min, annealing temperature of 55 °C for 1 min, and 72 °C for 1 min in the PCR reactions. Final extension was performed at 60 °C for 45 min. The PCR mixtures for loci MT-3, MT-6, and MT-8 were prepared in a 15 μL reaction volume comprising 30 ng genomic DNA, 1.5 μL 10×DreamTaq Buffer with 20 mM MgCl2, 1.5 μL 25 mM dNTPmix, 0.3 μL 5 μM tailed forward primer, 0.3 μL 5 μM reverse primer, 0.3 μL 5 μM fluorescently-labelled tail sequence and 0.1 μL DreamTaq DNA polymerase 5 Unit/μL (Thermo Fisher Scientific, Waltham, MA, USA). Initial denaturation at 95 °C for 4 min was followed by 30 cycles of 95 °C for 30 s, annealing temperature at 58 °C for 30 s, and 72 °C for 1 min in the PCR reactions for these markers. The final 9 min extension was performed at 72 °C.
Similarly, the MFW1 microsatellite marker was amplified in a 15 μL reaction volume that included 30 ng genomic DNA, 1.5 μL 10×DreamTaq Buffer with 20 mM MgCl2, 0.3 μL 5 μM tailed forward primer, 0.3 μL 5 μM reverse primer, 0.3 μL 5 μM fluorescently-labelled tail sequqence, 1.5 μL 25 mM dNTP mix, and 0.1 μL DreamTaq DNA polymerase 5 Unit/μL (Thermo Fisher Scientific, Waltham, MA, USA). Initial denaturation at 95 °C for 5 min was followed by 35 cycles of 95 °C for 30 s, annealing temperature 55 °C for 45 s, and 72 °C for 90 s. Then, a 10 min extension at 72 °C was performed. An automated ABI Prism 3130 genetic analyzer (Applied Biosystems, Foster City, CA, USA) was used to analyze amplified fragments. As an internal standard, the Pop7 polymer, a 50-cm capillary array, and GS500-LIZ molecular size standard were employed in the ABI3130 Automatic Fragment Analyzer.

2.2. mtDNA Cytb Sequence Amplification and Analysis

The mitochondrial Cytb gene fragment (615-bp) was amplified for sequencing analysis using universal primer pairs Glu-F (5′-AACCACCGTTGTATTCAACTACAA-3′) and Thr-R (5′-ACCTCCGATCTTCGGATTACAAGACCG-3′), which were designed by using the flanking tRNAs sequences according to [40]. 15 μL of PCR master mix included 30 ng of genomic DNA, 1.2 μL 10× DreamTaq Buffer with 20 mM MgCl2, 1 μL 25 mM dNTP mix, 0.5 μL of each specific primer (5 μM), and 0.1 μL DreamTaq DNA polymerase 5 Unit/μL (Thermo Scientific, Waltham, MA, USA). The PCR reactions were carried out in aKyratec PCR thermal cycler (Applied Biosystems, Foster City, CA, USA) using the following protocol: initial denaturing at 95 °C for 5 min, then 2 cycles at 94 °C for 1 min, annealing temperature at 60 °C for 1 min 30 s, 72 °C for 2 min, then another 30 cycles at 94 °C for 1 min, 1 min 30 s at 54 °C, and 2 min at 72 °C, then final extension for 10 min at 72 °C. The NucleoSpin Gel and PCR purification kit (Macherey-Nagel, Düren, Germany) were used to purify the PCR products. The purified products were sequenced using an ABI 3130 (Applied Biosystems, Foster City, CA, USA) automated genetic analyzer, according to the manufacturer’s instructions for the Big Dye terminator v. 3.1 Cycle Sequencing Kit (Applied Biosystems, Foster City, CA, USA).

2.3. PCR RFLP Analysis

Two nuclear-encoded EPIC markers were used for RFLP analysis. The EPIC primers were selected to amplify a 335-bp nuclear DNA sequence encoding the second intron of the actin gene (Act), as designed by [41]. Similarly, the EPIC primers described by [42] were used to amplify a 923–927-bp amplicon containing the RpS7 intron. Each PCR reaction was conducted in a 15 μL PCR mixture containing 30 ng genomic DNA, 1.2 μL 10× DreamTaq Buffer with 20 mM MgCl2, 1 μL 25 mM dNTP mix, 0.5 μL of each specific primer (5 μM), and 0.1 μL Dream Taq DNA polymerase 5 Unit/μL (Thermo Scientific, Waltham, MA, USA). Two different PCR programs were used to ampify products as described in [41,42]. The amplified PCR products were digested using two different restriction enzymes, which were chosen based on previous findings [29]. The Act gene was digested by the Eco521 endonuclease enzyme, whereas the RpS7 gene was restricted by NdeI. At 37 °C for 10 h, 5 μL of the PCR products were digested in 11 μL volumes containing 9 μL of nuclease-free water, 1 μL of buffer, and 1 μL of restriction enzyme Eco52I or NdeI, (Thermo Scientific, Waltham, MA, USA). They were then inactivated by incubating for 20 min at 65 °C. The products digested by the aforementioned enzymes were helpful in predicting the haplotype patterns between the Western and Eastern haplotypes based on known DNA sequences for the amplified PCR products [34]. Restriction fragments were separated electrophoretically on a 2% agarose gel containing GelGreen Nucleic Acid Stain (Biotium Inc, Landing Parkway Fremont, CA, USA). The DNA fragment patterns were then analyzed and photographed under UV light by gel documentation system (Analytik Jena) utilizing VisionWorksLS analysis software (LTF Labortechnik GmbH & Co. KG., Wasserburg, Germany).

2.4. Statistical Analysis

The parameters of genetic variance, observed heterozygosity, expected heterozygosity (He and Ho, respectively), number of alleles (Na) and effective number of alleles (Neff) were calculated using GenAlEx 6.5 software [43]. MICRO-CHECKER version 2.2.3 (number of randomizations: 1000, 95% CI) was utilized to detect possible genotyping errors, allele dropouts and non-amplified null alleles [44]. The Ho and Fis values were standardized for population sizes using weighted means in cross-population comparisons. A Mann-Whitney U-test with Bonferroni correction (a significance threshold of 0.01) (SPSS for Windows 11.5) was used to compare indices of genetic variance. GENEPOP software [45,46] was used to assess deviations from the Hardy-Weinberg equilibrium (HWE) for each locus in each population using a Markov chain (5000 dememorizations, 500 batches, 5000 iterations per batch) [47].
Genetic divergence between populations was assessed by estimating the pairwise Fst of Weir (1996) [48] as well as Cavalli-Sforza and Edwards (1967) [49] genetic distance using FreeNA software [50]. The ENA correction was used for the Fst, while the INA correction was used for genetic distance. For the computation of the bootstrap 95% confidence intervals, 10,000 replicates were used. Using 9999 permutations in the GenAlEx 6.5 software, a paired Mantel test between Fst values and geographic distances of the populations was calculated. Based on linkage disequilibrium and allele frequencies, NeEstimator 2.1 software [51] was used to estimate the effective population size (Ne) of all natural populations. The bottleneck effect was tested using BOTTLENECK 1.2.02. [52]. The Wilcoxon signed-rank test was conducted to assess significance under the two-phase mutation model (TPM).
The analysis of the genetic structure of populations was inferred via a Bayesian clustering analysis using Structurev2.3.3 software [53,54]. The admixture model was used to assess the structure analysis parameters, and the analysis was run 10 times per K with a burn-in of 10,000, followed by 100,000 Markov chain-Monte Carlo (MCMC) repetitions. Structure Harvester software [55] was used to calculate the most likely cluster number K, the posterior probability (highest LnP (D)), and the ΔK [56].
The haplotype diversity (Hd), nucleotide diversity (π), the number of segregating sites, and the total number of mutations for all populations and regions were estimated by DnaSP 5.10 software [57]. Using Mega-X 10.1 software, https://www.megasoftware.net/, accessed on 6 February 2022. DNA sequences were edited and aligned. The Cytb gene’s revised alignment was 615 bp. Network10.0 software [58] was used to perform haplotype network analysis of the seven populations in this study as well as GenBank sequences. All haplotypes were linked to the NCBI BLAST nucleotide database using Megablast program [59].

3. Results

3.1. Microsatellite Analysis

3.1.1. Genetic Diversity and Population Size

Segregating null allele was detected at locus MTT8 in the Lake Fertő, Lake Kolon, and Derecske populations; MTT1 in the Lake Tisza population; and MT3 in the Lake Fertő population since there was no evidence of significant allelic dropout. The following loci were monomorphic: MT3 in the Derecske population, MT6 in the Derecske, Lake Tisza and Cun-Szaporca populations, and MTT8 in the Cun-Szaporca population. MTT6, MTT8, MT3 in the Lake Fertő population, MTT8, MTT2 in the Derecske population, MT3, MTT9 in the Lake Kolon population, MTT6, MTT8 in the Cibakházi Tisza population, and MT3 in the Cun-Szaporca population, were all found to be out of the HW equilibrium. The Fertő-Lake population had the highest diversity (Table 2). Significantly lower genetic diversity was observed in the Derecske population. The effective number of alleles, heterozygosity (He and Ho), and private allelic richness were significantly lower compared to the Lake Fertő population, and the Fis value was highest in the Derecske population.
Application of the linkage disequilibrium approach to Ne estimation yielded the following effective population sizes (Ne) in the seven tench populations: Lake Fertő-infinite (CI 95%: 108.8-infinite), Lake Kolon-25.9 (CI 95%: 15.7–47.9), Csörnöc-Herpenyő-59.8 (CI 95%: 19.5–21.3), Derecske-infinite (CI 95%: 20.9-infinite), Cibakházi Tisza-49.5 (CI 95%: 23.8–233.3), Tisza-tó-infinite (CI 95%: 14.6-infinite) and Cun-Szaporca 9.8 (CI 95%: 2.4-infinite) individuals. However, BOTTLENECK’s Wilcoxon signed-rank test for heterozygosity excess showed no evidence of a recent population bottleneck in any of the populations.

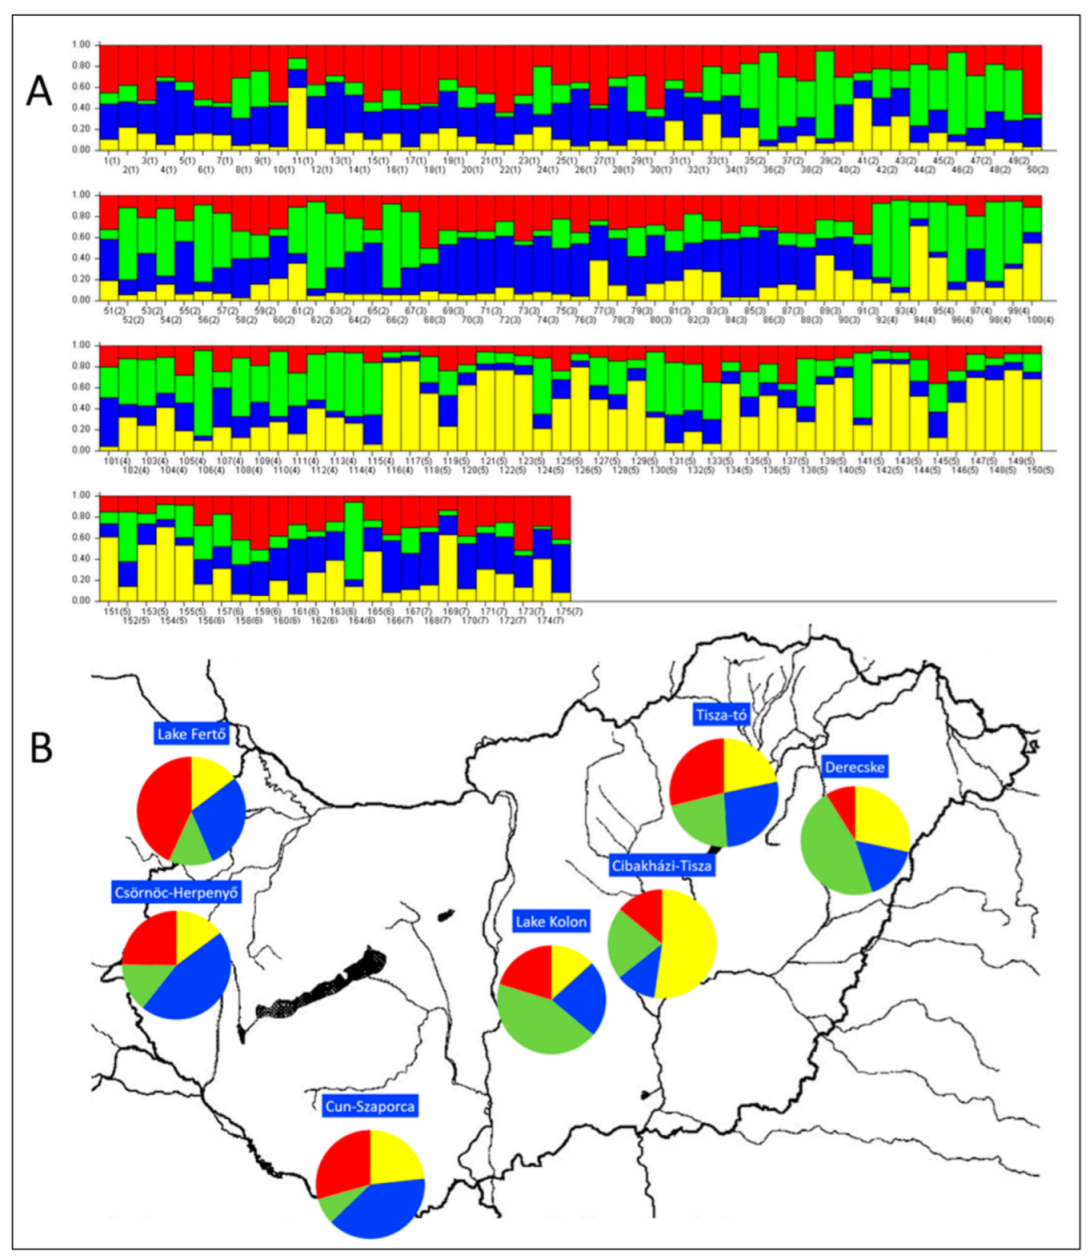
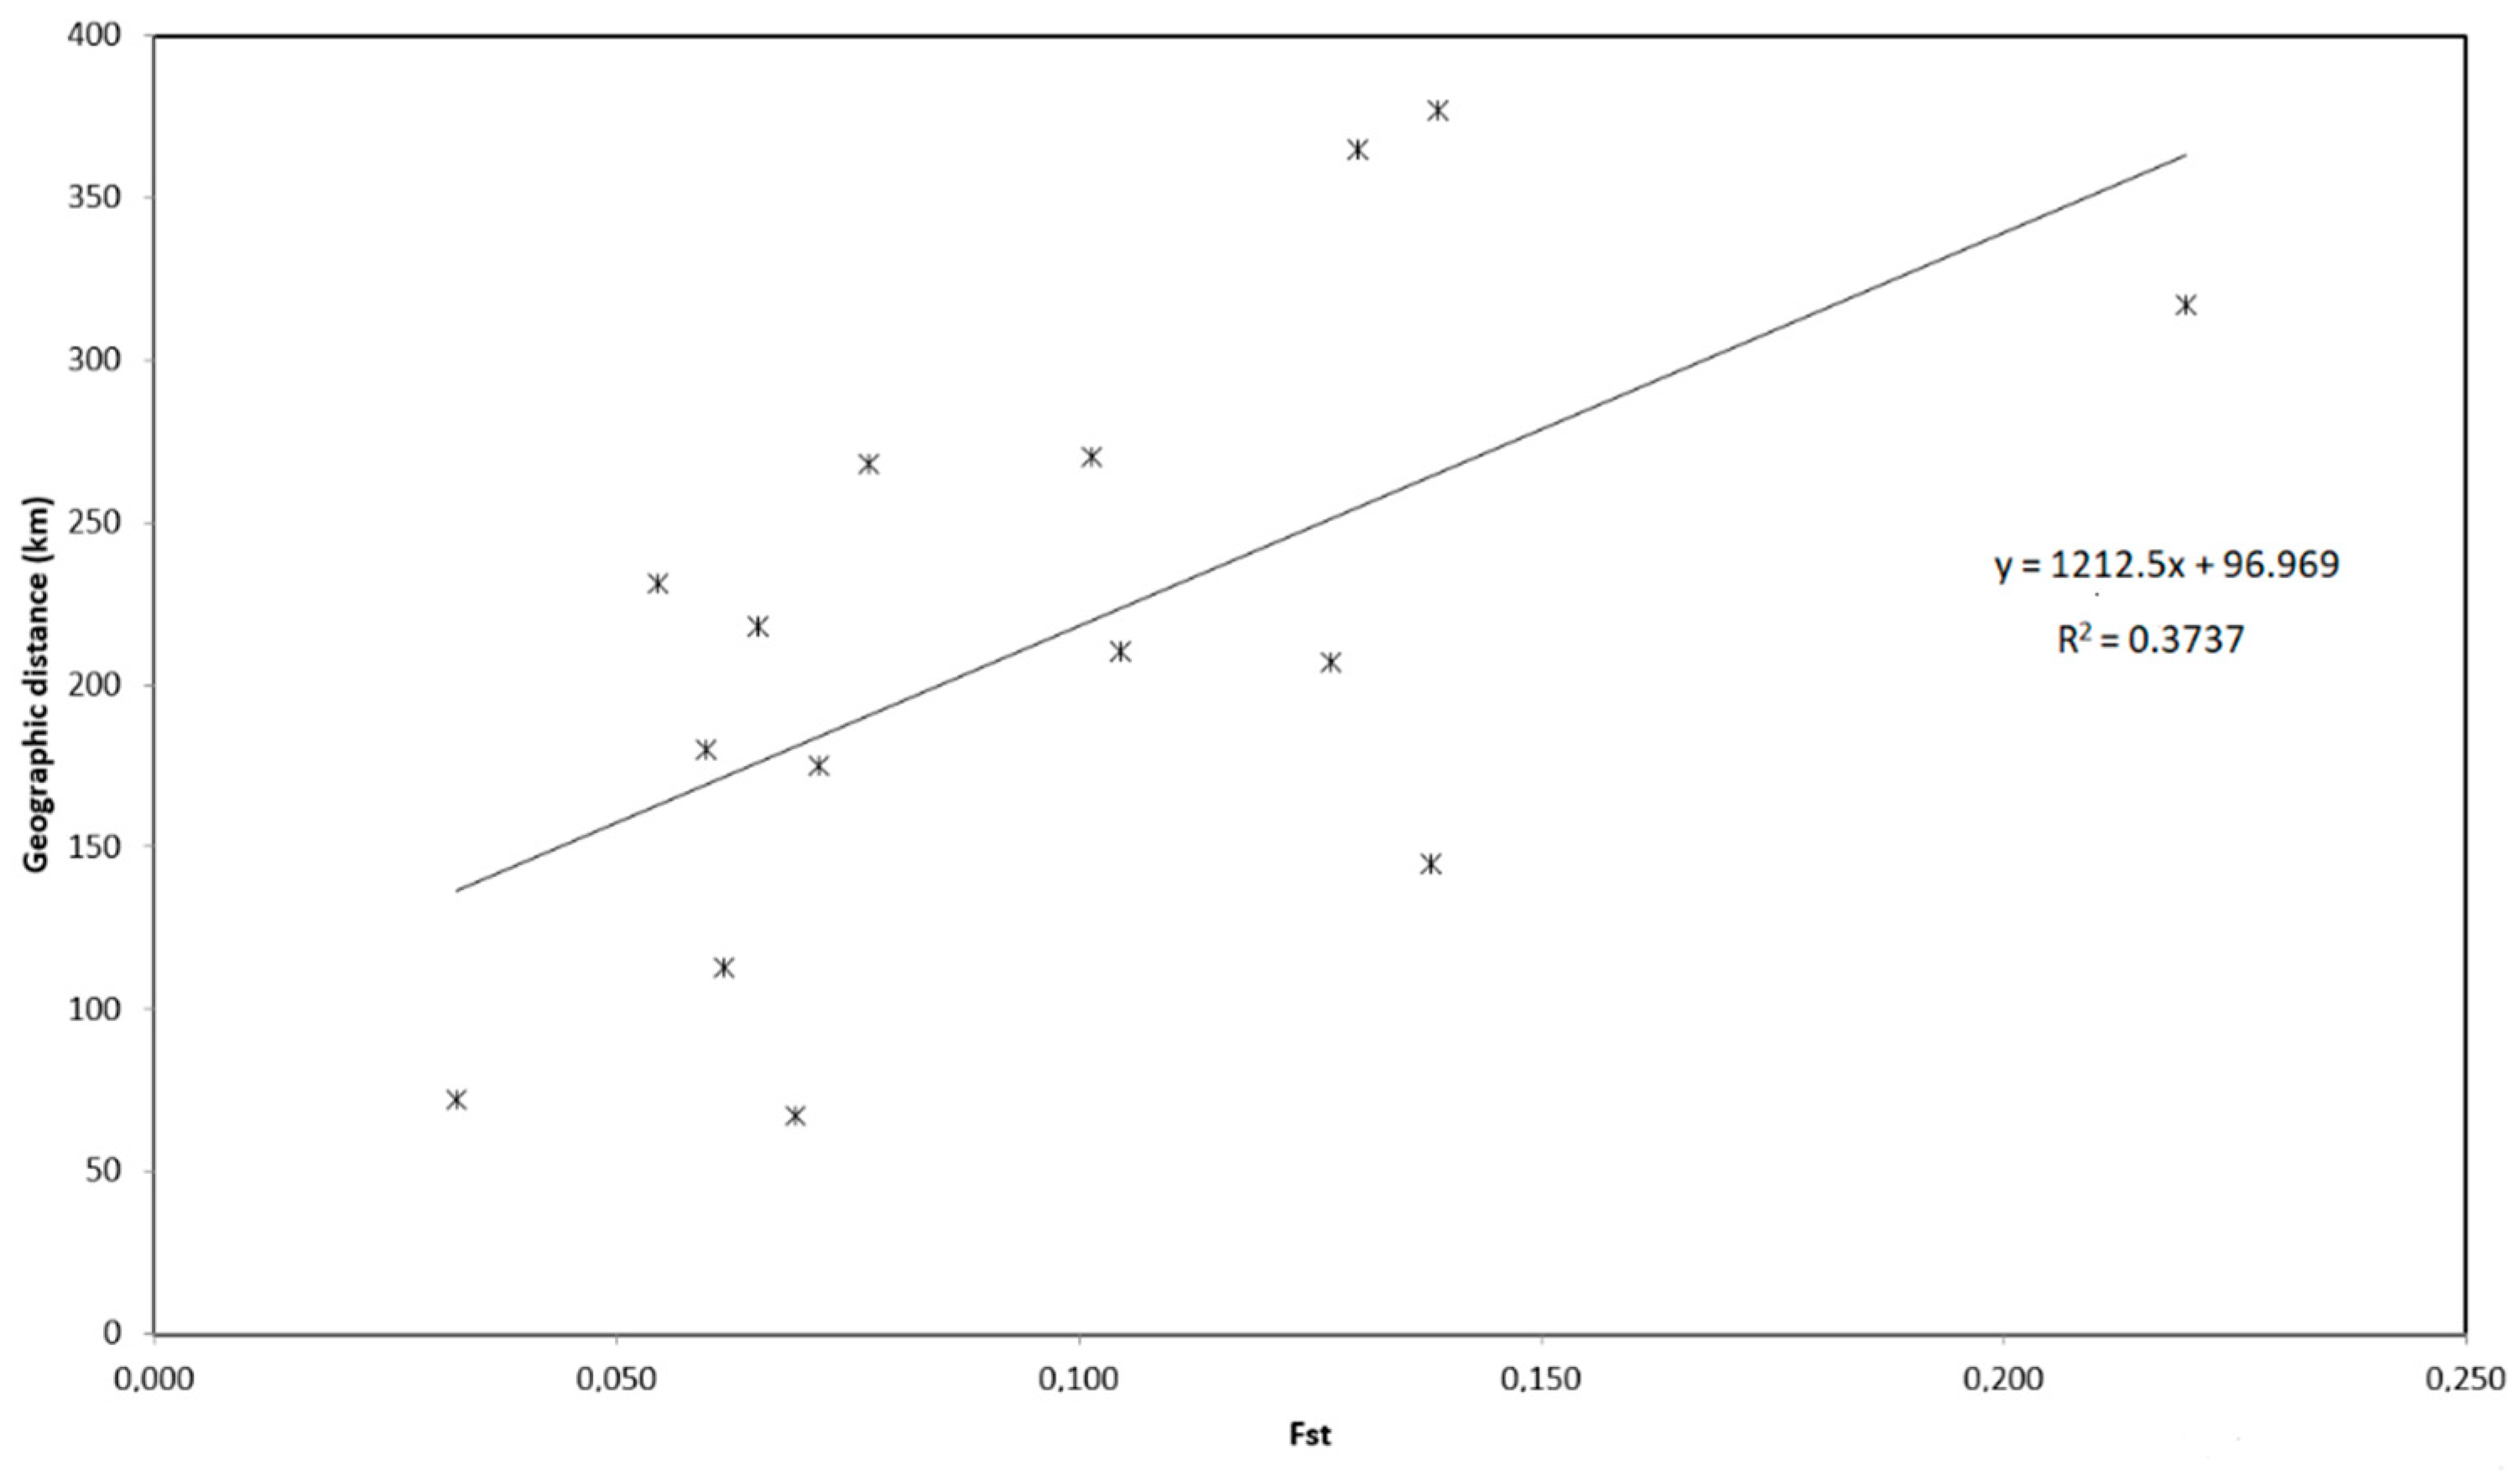
3.1.2. Genetic Structure

Clustering the 175 individuals by STRUCTURE software (Figure 2) resulted in the most probable number of K = 4 clusters. The mean log likelihood data and Evanno’s delta K of the hierarchical STRUCTURE analysis are shown in Table S5. Contrary to expectations, none of the four clusters were closely related to localizations within or between watersheds; only their proportions were different. The first cluster (red colour) is frequent in the North-Western region (Lake Fertő); the second (green colour) in the Central-Eastern region (Lake Kolon and Derecske); the third cluster (blue colour) in the Central and South-Western region (Csörnöc-Herpenyő, Cun-Szaporca) and the fourth (yellow colour) in the Eastern region (Cibakházi Tisza). Tisza-tó population was a mixed population with equal frequency for all clusters.
The global Fst was 0.080 (95% CI: 0.057–0.108) with ENA correction, showing relatively modest genetic distances. Table 3 shows the pairwise Fst and Cavalli-Sforza and Edwards genetic distance values between stock pairs. Table S6 displays the Bootstrap 95% intervals.
The Derecske population showed the highest separation (Fst ranged between 0.120 and 0.219) from all other populations except the Lake Kolon population, where the value was moderate (0.059). The mixed genetic background of the Lake Tisza population is well detectable in the Fst and genetic distance values: Fst range between 0.008 and 0.051 except the Derecske population (0.120).
The regional genetic separation of the populations was moderate. Considering all the seven populations the Mantel test resulted in non-significant association between the geographical distance (GeoD) and the Fst (GeoD = 617.8 × Fst + 158.93, R2 = 0.0983, p = 0.105). However, if the mixed Lake Tisza population was excluded, the association (GeoD = 1212.5 × Fst + 96.969, R2 = 0.3737; Figure 3) became significant (p = 0.032).

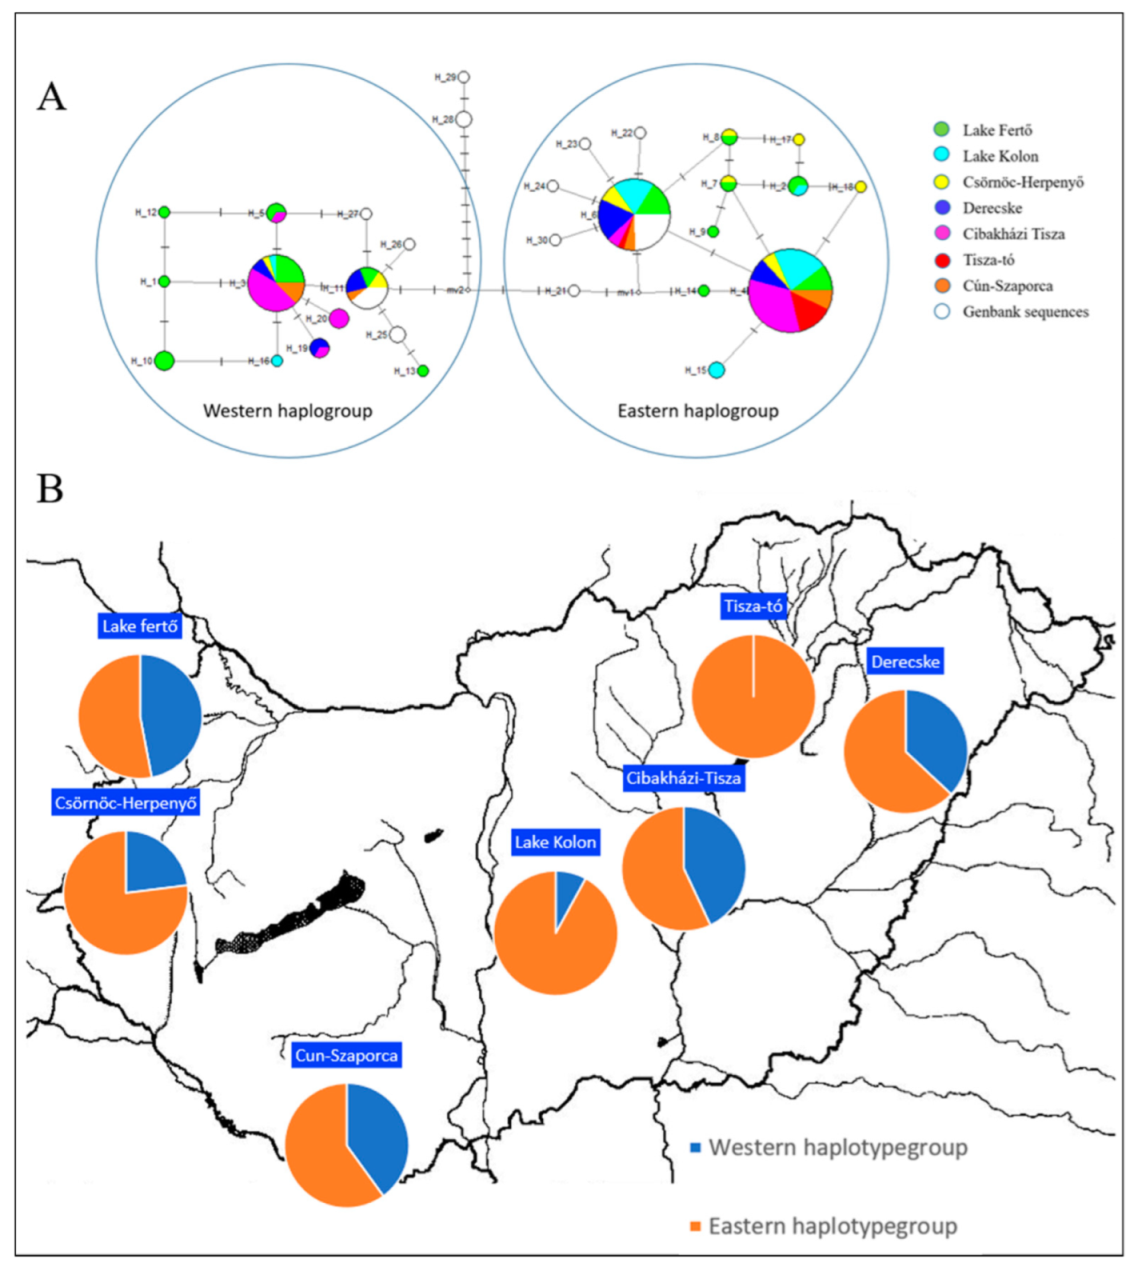
3.2. Mihtocondrial DNA Analysis

A total of 20 new mithocondrial Cyt b haplotypes were described in the 7 populations; two haplotypes were identical with sequences in the Genbank (hap6-HM560230.1, HM167941.1, HM167943.1, HM167945.1, HM167946.1, HM167949.1, JX974523.1, JX974524.1, JX974525.1 and hap11-NC_008648.1:14394-15, HM167950.1, HM167952.1, JX974520.1, JX974521.1). Four of the haplotypes (haplotype 3, 4, 6 and 11) were dominant in the samples. The haplotypes with small sample numbers were found mostly in the Lake Fertő population, and this population contained 14 of the total 20 haplotypes. (Figure 4, Table 4).
Within the haplotype groups, the number of polymorphic sites was 14 (Figure S1), and 13 sites were parsimony informative. The diversity metrics for the Cytb gene sequences within the seven populations are presented in Table 4.
The twenty Cytb haplotypes described in the seven populations are divided into two major haplogroups described by [29,60] (Figure 4 and Table 5). An average of 28% of the individuals belongs to the Western haplotype and 72% to the Eastern haplotype group. Interestingly 100% of the individuals originated from Lake Tisza belong to the Eastern haplotype, however since the lake is stocked with tench of unknown Cytb haplotype, this information must be regarded criticaly and it is not advisable to draw far-reaching conclusions. When we excluded the Tisza Lake population the highest proportion of eastern haplotypes was found in Lake Kolon (92%). The highest proportion of Western haplotypes were found in Lake Fertő, where 47% of the individuals belonged to this group.

3.3. PCR-RFLP Analysis of Act and Rps7 Genes

The PCR-RFLP analysis of Act and Rps7 genes showed that the proportion of heterozygote individuals was close to 50%, 41% in case of Rps7 and 50% in case of Act, respectively (Table 6). An average of 33% of the individuals belonged to the Western lineage based on both nuclear genes, while 17% (Act) and 26% (Rps7) of the individuals belonged to the Eastern lineage. Interestingly, 60% of the individuals belonged to the Western lineage in the case of both nuclear genes in the Cun-Szaporca population, with no individuals present from the Eastern lineage while 40% of the individuals were heterozygous. The Lake Tisza population showed the opposite picture for the 2 genes. In case of the Act gene, 90% of the individuals were heterozygotes, while in the case of the Rps7 gene only 10% of the fish belonged to this group and the Western lineage was dominant. In the other groups the proportion belonging to each lineage was more even.

4. Discussion

Knowledge on the genetic variability and phylogenetic status of wild and cultured tench populations is still limited; therefore, in the present study, we used 12 microsatellite DNA markers, the mitochondrial Cytb gene and two nuclear genes (Act and Rps7) to achieve deeper insight on genetic affinities of seven natural populations of the species living in the Carpathian basin. The genetic variability data obtained were mostly consistent with those of previous studies of different geographical regions, but with some differences. Kohlmann et al. [28] tested two wild populations (Döllnsee and Felchowsee) and four cultured strains (Königswartha/Germany/, Tabor, Marianske Lazne and Vodnany/Czech Republic/), and found that only seven of the originally developed and tested microsatellites were polymorphic. They described a total of 49 alleles throughout their study and found higher genetic diversity in wild populations compared to cultured strains. In their study, the average number of alleles per locus ranged from 2.57 (Ho: 0.273) to 5.86 (Ho: 0.367), while we found values between 2.41 (Ho: 0.170) and 4.16 (Ho: 0.43). The average allelic richness value was lower in Hungarian populations (2.66) than in German natural populations (3.73). In a subsequent study [27], they found similar values in terms of the average number of alleles per locus, adding that they also found three populations with extremely low within-population variability. One Spanish farm population from near Badajoz was homozygous at all loci in 50 analyzed individuals. The total number of alleles observed in the 21 populations was 66. They also tested a Hungarian strain originated from the live gene bank of Vodnany (Czech Republic); however, the original source of the stock was not mentioned. The average number of alleles per loci was 2.71, with an observed heterozygosity of 0.352. The number of private alleles was 13 in the study [28] while working with 200 individuals originating from six populations using seven microsatellites, and 20 in the [27] study when they used nine species-specific microsatellite markers to characterize 792 individuals representing 21 wild and cultured populations. The number of private alleles was lower (6) in the present study. Three of them were observed in the Lake Fertő population. Interestingly, on the Neighbor-joining tree in [27], the Hungarian stock is located separately from the other Central and Western European populations and much closer to the neighbouring branch of the tree where the Chinese, Turkish and Spanish (probably introduced from Central Europe) populations are located. The authors suggested that those three stocks may represent the Eastern lineage of the species. The Fis values (inbreeding coefficient) ranged between −0.03 to 0.28 in the present study, which is similar to the results of [34] but higher than described by [27]. The high inbreeding coefficient found in the Derecske population can be explained by the fact that the two small ponds where the population lives are landlocked and separated from all other surface water bodies.
The genetic variability found in nature is the existing basis of all future selective breeding programs. Artificial selection and selective breeding may have a negative effect on genetic diversity and effective population sizes [61]. When the aim to generate significant genetic gain is coupled with limited facilities and with the need to breed exclusively genetically and phenotypically superior individuals can cause the creation of small populations together with high probability of genetic drift and inbreeding. This phenomenon may hazard the sustainability of such programs [62]. Based on our results one can say that the maintenance of the genetic variability of natural Tench populations is not only important for conservation efforts but in order to be able to establish a selective breeding program for the species.
A total of 20 cytb haplotypes were described from Hungarian samples in the present study. Of these, 18 (including the common H3 and H4) have not been observed before.
Two out of the three haplotypes (C1, C2, C3) described in 50 samples by [35] show a match with two haplotypes described in this study: C1 is identical to the H11 that we describe, which characterizes the Western phylogroup, while C2 is identical to the H6 described here, and characterizes the Eastern phylogroup. Haplotype C3 (MT605881.1, hap 30 in the network diagram of our study) was not present among Hungarian samples; it was described in the Romanian samples and belongs to the Eastern phylogroup.
In a 2014 study [31], six cyt b haplotypes were presented, of which five had been previously described. Haplotype 6 (H6) of this study matched the sequences JX974523.1 (haplotypes H2a, H2b, H2d, H2e, H2f, H3 and H8), JX974524.1 (haplotype H2c) and JX974525.1 (haplotype H7) of the previously mentioned study, which belonged to the haplogroup B (Eastern) described by them. The Hap 11 haplotype (H11) of this study matched the sequences JX974520.1 (haplotype H1a) and JX974521.1 (haplotype H4), which belonged to the haplogroup A (Western) group in their study.
Based on the haplotype network, a total of 98 individuals (67.1%) were classified in the Eastern haplogroup and 48 individuals (32.9%) in the Western haplogroup (Table 5). Among the populations, the Tisza Lake population contained only individuals belonging to the Eastern haplogroup, while in the other populations individuals from both haplogroups were found in different proportions. The populations of Kolon Lake, Csörnöc Herpenyő and Derecske contained a higher proportion of Eastern haplotypes, while in the other populations the haplogroups were largely equally present.
The two phylogeographical lineages were probably separated after that Western Europe was colonized from the Black Sea Basin, during an interglacial period as a result of recurrent isolation in two refugia during the Pleistocene [60]. This separation produced a high evolutionary divergence (1.3% for the cytochrome b gene) approaching the level between different fish species [34]. The Ponto-Caspian region and the Danube basin formed the refuge of the eastern phylogroup during the glacial period [29]. The recolonization of the Central European area happened from the two refugees. However, the lineages did not show reproductive separation in the contact zone but a mixed ancestry hybrid zone was formed [34]. Lujic et al. [24] described hypothesis that there is a characteristic pattern of Cyt b haplotypes in the Balkan region, and the Eastern haplotypes dominate the region south of the Danube River while the Western haplotypes dominate the regions north of the river. based on the examination of the RPS7 and Cyt b genes this hypothesis suggests a natural invasion of the western lineage; the main route of which is the Danube and Tisza rivers. Our results can support this hypothesis only partially since it assumes a clear change in the ratio of the two lineages in the Hungarian populations. On the contrary, we found that on both sides of the Danube River, the Eastern Cyt b haplotypes were dominant with the proportion ranging from 53 to 100%. Nevertheless, the PCR-RFLP analysis of the nuclear Act and Rps7 genes showed results not consistent with the Cyt b results. The majority of the individuals belong to the hybrid group (50% in case of Act and 41% in case of Rps7 gene) or to the Western haplotype (33% in case of both genes), showing the evidence of a long term, repeated (hybrid) crossing of Western and Eastern clades. Probably, two main factors alter the pattern of the natural invasion of western lineage: the human-aided dispersal of the lineages [36,63] and the dispersal ability of the species in the different habitats [64,65]. The microsatellite analysis of the natural populations supports the human impact on the natural populations. None of the four genetic clusters were typical for locations, the admixture of the clusters showed only changes in the proportions according to the geographical differences.

5. Conclusions

Our investigation highlights that the wild living populations of tench in Hungary are genetically moderately diverse compared to other natural populations of the species living in Western Europe. However, they still represent considerable aquatic genetic resources and can act as a good basis for future selective breeding programmes. The genetically most variable Lake Fertő, Lake Kolon and Csörnöc-Herpenyő populations can be the promising candidates for future breeding programs, while populations with considerably high private allelic richness (such as Cibakházi-Tisza and Lake-Tisza) should be also involved in order to start such a program with the highest genetic variability involved. Thus the maintenance of genetic variability of the populations is essential both for conservation and selective breeding purposes. For the above mentioned reasons the development of an ex-situ live genebank and cryobank started in the National Centre for Biodiversity and Gene Conservation.
Hungary is in the transition zone of the two lineages of the species, and a high level of hybridization was described in this study. The natural and human-aided process of hybridization in this zone should be studied more deeply to better understand this phenomenon.

Supplementary Materials

The following are available online at https://0-www-mdpi-com.brum.beds.ac.uk/article/10.3390/d14050336/s1, Table S1: Description of the twelve microsatellite markers used in the study; Table S2: Sequences of the three microsatellite markers developed in the study; Table S3: The raw data of the experiment. Table S4: The sequences of the mtDNA haplotypes. Table S5: The mean log likelihood data and Evanno’s delta K of the hierarchical STRUCTURE analysis. Table S6: Bootstrap 95% intervals for Fst and Cavalli-Sforza and Edwards genetic distance. Figure S1: Polymorphic sites in the haplotypes.

Author Contributions

Conceptualization; I.L., B.K., B.U., E.V., F.A.A.F. and T.M.; visualization, F.A.A.F., E.E.M., B.K., T.M. and I.L.; data curation F.A.A.F., E.E.M., B.K., T.M. and I.L.; formal analysis, T.M.; software, T.M.; investigation, F.A.A.F., E.E.M., Z.S., B.K., T.M., G.S. and I.L.; methodology, F.A.A.F., E.E.M. and I.L.; project administration, I.L., E.V. and B.K.; resources, I.L. and B.K.; supervision, I.L.; funding acquisition, I.L.; writing original draft, F.A.A.F., T.M. and I.L.; writing—review and editing, F.A.A.F., E.E.M., Z.S., G.S., E.V., B.U., B.K., T.M. and I.L. All authors have read and agreed to the published version of the manuscript.

Funding

This research was funded by the VEKOP-2.3.2-15-2016-00012 (National Research, Development and Innovation Office) and the TKP2020-NKA-16 (National Research, Development and Innovation Office) projects and the Stipendium Hungaricum scholarship (115574) of F.A.A.F. (Government of Hungary).

Institutional Review Board Statement

The study was conducted according to the guidelines of the Declaration of Helsinki. The sampling was approved by the Hungarian Ministry of Agriculture (permit number: HHgF/269-1/2015).

Data Availability Statement

All data supporting the reported results can be found as Supplementary Material (Tables S3 and S4).

Conflicts of Interest

The authors declare no conflict of interest. The funders had no role in the design of the study; in the collection, analyses, or interpretation of data; in the writing of the manuscript; or in the decision to publish the results.

References

  1. Brylinska, M.; Brylinski, E.; Bninska, M. Tinca tinca (Linnaeus, 1758). In The Freshwater Fishes of Europe, 1st ed.; Banarescu, P., Ed.; Aula Verlag GmbH: Wiebelsheim, Germany, 1999; Volume 5, pp. 229–302. [Google Scholar]
  2. Kottelat, M.; Freyhof, J. Handbook of European Freshwater Fishes; Publications Kottelat: Cornol, Switzerland; Freyhof: Berlin, Germany, 2007; p. 646. [Google Scholar]
  3. Steffens, W. The Tench [Tinca tinca L.], a neglected pond fish species. Pol. Arch. Hydrobiol. 1995, 42, 161–180. [Google Scholar]
  4. Celada, J.D.; Aguilera, A.; Carral, J.M.; Sáez-Royuela, M.; Melendre, P.M.; Pérez, J.R. Effects of stocking density on survival and growth of juvenile Tench (Tinca Tinca L.). Aquac. Int. 2007, 15, 461–465. [Google Scholar] [CrossRef]
  5. Gela, D.; Flajšhans, M.; Kocour, M.; Rodina, M.; Linhart, O. Tench (Tinca tinca) broodstock management in breeding station under conditions of pond culture: A review. Aquac. Int. 2006, 14, 195–203. [Google Scholar] [CrossRef]
  6. Kujawa, R.; Kucharczyk, D.; Mamcarz, A.; Żarski, D.; Targońska, K. Artificial spawning of common Tench Tinca tinca (Linnaeus, 1758), obtained from wild and domestic stocks. Aquac. Int. 2011, 19, 513–521. [Google Scholar] [CrossRef] [Green Version]
  7. Moruzi, I.; Pishchenko, Y.; Kropachev, D. Results of the first experiment on domestication of the Tench (Tinca tinca, L., 1758) in ponds of the novosibirsk region. In Proceedings of the Sustainable Use, Protection Of Animal World And Forest Management in the Context of Climate Change, Chișinău, Moldova, 12–13 October 2016; pp. 213–214. [Google Scholar]
  8. Wang, J.; Min, W.; Guan, M.; Gong, L.; Ren, J.; Huang, Z.; Zheng, H.; Zhang, J.; Liu, H.; Han, Y. Tench farming in China: Present status and future prospects. Aquac. Int. 2006, 14, 205–208. [Google Scholar] [CrossRef]
  9. Wolnicki, J.; Myszkowski, L.; Korwin-Kossakowski, M.; Kamiński, R.; Stanny, L.A. Effects of different diets on juvenile Tench, Tinca tinca (L.) reared under controlled conditions. Aquac. Int. 2006, 14, 89–98. [Google Scholar] [CrossRef]
  10. Wolnicki, J.; Kamiński, R.; Sikorska, J. Combined effects of water temperature and daily food availability period on the growth and survival of Tench (Tinca tinca) larvae. Aquacult. Res. 2017, 48, 3809–3816. [Google Scholar] [CrossRef]
  11. Billard, R.; Flajshans, M. The current state of research and culture of Tench, Tinca tinca Linnaeus [1758]. Concluding remarks on the workshop. Pol. Arch. Hydrobiol. 1995, 42, 219–225. [Google Scholar]
  12. Ćirković, M.; Ljubojević, D.; Đorđević, V.; Novakov, N.; Petronijević, R.; Matekalo-Sverak, V.; Trbović, D. The breed effect on productivity and meat nutrient compsition of fish. Kafkas Univ. Vet. Fak. Derg. 2012, 18, 75–780. [Google Scholar]
  13. Lo Presti, R.; Kohlmann, K.; Kersten, P.; Gasco, L.; Di Stasio, L. Tinca Gobba Dorata del Pianalto di Poirino: Genetic characterization by microsatellite markers. Ital. J. Anim. Sci. 2010, 9, 4. [Google Scholar] [CrossRef] [Green Version]
  14. Adámek, Z.I.; Sukop, P.; Rendón, M.; Kouřil, J. Food competition between 2+ Tench (Tinca tinca L.), Common Carp (Cyprinus carpio L.) and Bigmouth buffalo (Ictiobus cyprinellus Val.) in pond polyculture: Food competition between Tench, Carp and Bigmouth Buffalo. J. Appl. Ichthyol. 2003, 19, 165–169. [Google Scholar] [CrossRef]
  15. Grozev, G.K.; Hubenova-Siderova, T.; Paskaleva, E. Natural feeding of Tench (Tinca tinca L.) at polyculture rearing in carp ponds. Bulg. J. Agric. Sci. 2000, 6, 209–214. [Google Scholar]
  16. Dulski, T.; Kozłowski, K.; Ciesielski, S. Habitat and seasonality shape the structure of Tench (Tinca tinca L.) gut microbiome. Sci. Rep. 2020, 10, 4460. [Google Scholar] [CrossRef] [PubMed]
  17. Pantazis, P. Culture potential of the cyprinid Tinca tinca Linnaeus 1758 (Tench) in Greece. In Proceedings of the 4th International Symposium on Hydrobiology and Fisheries, Volos, Greece, 9–11 June 2011. [Google Scholar]
  18. Kamiński, R.; Sikorska, J.; Wolnicki, J. Diet and water temperature affect growth and body deformities in juvenile Tench Tinca tinca (L.) reared under controlled conditions. Aquacult. Res. 2016, 48, 1327–1337. [Google Scholar] [CrossRef]
  19. Wachirachaikarn, A.; Sutthakiet, O.; Senanan, W.; Na-Nakorn, U. Development of the new microsatellite multiplex PCR panel and genetic variation of farmed snakeskin gourami, Trichopodus pectoralis. Aquac. Int. 2020, 28, 751–765. [Google Scholar] [CrossRef]
  20. Eknath, A.E.; Tayamen, M.M.; Palada-de Vera, M.S.; Danting, J.C.; Reyes, R.A.; Dionisio, E.E.; Capili, J.B.; Bolivar, H.L.; Abella, T.A.; Circa, A.V.; et al. Genetic improvements of farmed tilapias: The growth performance of eight strains of Oreochromis niloticus tested in different farm environments. Aquaculture 1993, 111, 171–188. [Google Scholar] [CrossRef]
  21. Eknath, A.E.; Acosta, B.O. Genetic Improvement of Farmed Tilapias (GIFT) Project: Final Report; International Center for Living Aquatic Resources Management: Makaty City, Philippines, 1998. [Google Scholar]
  22. Askari, G.H.; Shabani, A.; Kolangi Miandare, H. Application of molecular markers in fisheries and aquaculture. Sci. J. Anim. Sci. 2013, 2, 82–88. [Google Scholar]
  23. Chauhan, T.; Kumar, R. Molecular markers and their applications in fisheries and aquaculture. Adv. Biosci. Biotechnol. 2010, 1, 281–291. [Google Scholar] [CrossRef] [Green Version]
  24. Lujić, J.; Kohlmann, K.; Kersten, P.; Marinović, Z.; Ćirković, M.; Simić, V. Phylogeographic identification of Tench Tinca tinca (L., 1758) (Actinopterygii: Cyprinidae) from the Northern Balkans and adjacent regions and its implications for conservation. Zool. Stud. 2017, 56, 1–9. [Google Scholar] [CrossRef]
  25. Mastrochirico Filho, V.A.; Freitas, M.V.; Ariede, R.B.; Lira, L.V.; Mendes, N.J.; Hashimoto, D.T. Genetic applications in the conservation of Neotropical freshwater fish. In Biological Resources of Water; IntechOpen: Rijeka, Croatia, 2018; pp. 249–284. [Google Scholar]
  26. Hernandez, C.; Bougas, B.; Perreault-Payette, A.; Simard, A.; Côté, G.; Bernatchez, L. 60 specific eDNA qPCR assays to detect invasive, threatened, and exploited freshwater vertebrates and invertebrates in Eastern Canada. Environ. DNA 2020, 2, 373–386. [Google Scholar] [CrossRef]
  27. Kohlmann, K.; Kersten, P.; Panicz, R.; Memiş, D.; Flajšhans, M. Genetic variability and differentiation of wild and cultured tench populations inferred from microsatellite loci. Rev. Fish Biol. Fish. 2010, 20, 279–288. [Google Scholar] [CrossRef]
  28. Kohlmann, K.; Kersten, P.; Flajšhans, M. Comparison of microsatellite variability in wild and cultured Tench (Tinca tinca). Aquaculture 2007, 272, S147–S151. [Google Scholar] [CrossRef]
  29. Lajbner, Z.; Kotlik, P. PCR-RFLP assays to distinguish the Western and Eastern phylogroups in wild and cultured Tench Tinca tinca. Mol. Ecol. Resour. 2011, 11, 374–377. [Google Scholar] [CrossRef] [PubMed]
  30. Lo Presti, R.; Kohlmann, K.; Kersten, P.; Gasco, L.; Lisa, C.; Di Stasio, L. Genetic variability in Tench (Tinca Tinca L.) as revealed by PCR-RFLP analysis of mitochondrial DNA. Ital. J. Anim. Sci. 2021, 11, e19. [Google Scholar] [CrossRef]
  31. Lo Presti, R.; Kohlmann, K.; Kersten, P.; Lisa, C.; Di Stasio, L. Sequence variability at the mitochondrial ND1, ND6, Cyt b and D-Loop segments in Tench (Tinca tinca L.). J. Appl. Ichthyol. 2014, 30, 15–21. [Google Scholar] [CrossRef] [Green Version]
  32. Kumar, G.; Langa, J.; Montes, I.; Conklin, D.; Kocour, M.; Kohlmann, K.; Estonba, A. A novel transcriptome-derived SNPs array for Tench (Tinca tinca L.). PLoS ONE 2019, 14, e0213992. [Google Scholar] [CrossRef]
  33. Hewitt, G.M. Genetic consequences of climatic oscillations in the quaternary. Philos. Trans. R. Soc. Lond. B Biol. Sci. 2004, 359, 183–195. [Google Scholar] [CrossRef] [Green Version]
  34. Lajbner, Z.; Kohlmann, K.; Linhart, O.; Kotlík, P. Lack of reproductive isolation between the Western and Eastern phylogroups of the Tench. Rev. Fish Biol. Fish. 2010, 20, 289–300. [Google Scholar] [CrossRef]
  35. Karaiskou, N.; Gkagkavouzis, K.; Minoudi, S.; Botskaris, D.; Markou, K.; Kalafatakis, S.; Antonopoulou, E.; Triantafyllidis, A. Genetic structure and divergence of Tinca tinca European populations. J. Fish Biol. 2020, 97, 930–934. [Google Scholar] [CrossRef]
  36. Lajbner, Z.; Linhart, O.; Kotlík, P. Human-aided dispersal has altered but not erased the phylogeography of the Tench. Evol. Appl. 2011, 4, 545–561. [Google Scholar] [CrossRef]
  37. Kohlmann, K.; Kersten, P. Microsatellite loci in Tench: Isolation and variability in a test population. Aquac. Int. 2006, 14, 3–7. [Google Scholar] [CrossRef]
  38. Crooijmans, R.P.M.A.; Poel, J.V.D.; Groenen, M.A.M.; Bierbooms, V.A.F.; Komen, J. Microsatellite markers in Common Carp (Cyprinus carpio L.). Anim. Genet. 1997, 28, 129–134. [Google Scholar] [CrossRef]
  39. Baerwald, M.R.; May, B. Characterization of microsatellite loci for five members of the minnow family Cyprinidae found in the Sacramento-San Joaquin delta and its tributaries. Mol. Ecol. Notes 2004, 4, 385–390. [Google Scholar] [CrossRef]
  40. Machordom, A.; Doadrio, I. Evidence of a cenozoic betic–kabilian connection based on freshwater fish phylogeography (Luciobarbus, Cyprinidae). Mol. Phylogenet. Evol. 2001, 18, 252–263. [Google Scholar] [CrossRef] [PubMed]
  41. Touriya, A.; Rami, M.; Cattaneo-Berrebi, G.; Ibanez, C.; Augros, S.; Boissin, E.; Dakkak, A.; Berrebi, P. Primers for EPIC amplification of intron sequences for fish and other vertebrate population genetic studies. Biotechniques 2003, 35, 676–682. [Google Scholar] [CrossRef]
  42. Chow, S.; Hazama, K. Universal PCR primers for S7 ribosomal protein gene introns in fish. Mol. Ecol. 1998, 7, 1255–1256. [Google Scholar]
  43. Peakall, R.; Smouse, P.E. GenAlEx 6.5: Genetic analysis in Excel. Population genetic software for teaching and research—An update. Bioinformatics 2012, 28, 2537–2539. [Google Scholar] [CrossRef] [PubMed] [Green Version]
  44. Van Oosterhout, C.; Hutchinson, W.F.; Wills, D.P.M.; Shipley, P. Micro-checker: Software for identifying and correcting gen-otyping errors in microsatellite data. Mol. Ecol. Notes 2004, 4, 535–538. [Google Scholar] [CrossRef]
  45. Raymond, M.; Rousset, F. GENEPOP (Version 1.2): Population genetics software for exact tests and ecumenicism. J. Hered. 1995, 86, 248–249. [Google Scholar] [CrossRef]
  46. Rousset, F. Genepop’007: A complete re-implementation of the genepop software for Windows and Linux. Mol. Ecol. Resour. 2008, 8, 103–106. [Google Scholar] [CrossRef] [PubMed]
  47. Guo, S.W.; Thompson, E.A. Performing the exact test of Hardy-Weinberg proportion for multiple alleles. Biometrics 1992, 48, 361–372. [Google Scholar] [CrossRef] [PubMed]
  48. Weir, B.S. Genetic Data Analysis; Sinauer Associates, Inc.: Sunderland, MA, USA, 1996; pp. 166–167. [Google Scholar]
  49. Cavalli-Sforza, L.L.; Edwards, A.W. Phylogenetic analysis. Models and estimation procedures. Am. J. Hum. Genet. 1967, 19, 233–257. [Google Scholar]
  50. Chapuis, M.P.; Estoup, A. Microsatellite null alleles and estimation of population differentiation. Mol. Biol. Evol. 2007, 24, 621–631. [Google Scholar] [CrossRef] [PubMed] [Green Version]
  51. Do, C.; Waples, R.S.; Peel, D.; Macbeth, G.M.; Tillett, B.J.; Ovenden, J.R. NeEstimator v2: Re-implementation of software for the estimation of contemporary effective population size (Ne) from genetic data. Mol. Ecol. Resour. 2013, 14, 209–214. [Google Scholar] [CrossRef]
  52. Piry, S.; Luikart, G.; Cornuet, J.M. Computer note. BOTTLENECK: A computer program for detecting recent reductions in the effective size using allele frequency data. J. Hered. 1999, 90, 502–503. [Google Scholar] [CrossRef]
  53. Pritchard, J.K.; Stephens, M.; Donnelly, P. Inference of population structure using multil ocus genotype data. Genetics 2000, 155, 945–959. [Google Scholar] [CrossRef] [PubMed]
  54. Falush, D.; Stephens, M.; Pritchard, J.K. Inference of population structure using multilocus genotype data: Linked loci and correlated allele frequencies. Genetics 2003, 164, 1567–1587. [Google Scholar] [CrossRef] [PubMed]
  55. Earl, D.A.; VonHoldt, B.M. Structure Harvester: A website and program for visualizing STRUCTURE output and imple-menting the Evanno method. Conserv. Genet. Resour. 2012, 4, 359–361. [Google Scholar] [CrossRef]
  56. Evanno, G.; Regnaut, S.; Goudet, J. Detecting the number of clusters of individuals using the software structure: A simulation study. Mol. Ecol. 2005, 14, 2611–2620. [Google Scholar] [CrossRef] [PubMed] [Green Version]
  57. Librado, P.; Rozas, J. DnaSP v5: A software for comprehensive analysis of DNA polymorphism data. Bioinformatics 2009, 25, 1451–1452. [Google Scholar] [CrossRef] [Green Version]
  58. Bandelt, H.J.; Forster, P.; Röhl, A. Median-joining networks for inferring intraspecific phylogenies. Mol. Biol. Evol. 1999, 16, 37–48. [Google Scholar] [CrossRef]
  59. Zhang, Z.; Schwartz, S.; Wagner, L.; Miller, W. A greedy algorithm for aligning DNA sequences. J. Comput. Biol. 2000, 7, 203–214. [Google Scholar] [CrossRef] [PubMed]
  60. Lajbner, Z.; Linhart, O.; Kotlik, P. Molecular phylogeography of the Tench Tinca tinca (Linnaeus,1758). In Proceedings of the 12th European Congress of Ichthyology, Cavtat (Dubrovnik), Croatia, 9–13 September 2007; p. 35. [Google Scholar]
  61. Molnár, T.; Benedek, I.; Kovács, B.; Zsolnai, A.; Lehoczky, I. Genetic consequences of pond production of a pikeperch (Sander lucioperca L.) stock with natural origin: The effects of changed selection pressure and reduced population size. PeerJ 2020, 8, e8745. [Google Scholar] [CrossRef] [PubMed] [Green Version]
  62. Ponzoni, R.W.; Khaw, H.L.; Nguyen, N.H.; Hamzah, A. Inbreeding and effective population size in the Malaysian nucleus of the GIFT strain of Nile tilapia (Oreochromis niloticus). Aquaculture 2010, 302, 42–48. [Google Scholar] [CrossRef]
  63. Clavero, M. Beyond one bone: Interdisciplinarity to assess nativeness of the Tench (Tinca tinca) in Spain. Aquat. Conserv. 2019, 29, 1863–1869. [Google Scholar] [CrossRef]
  64. Morissette, O.; Lecomte, F.; Vachon, N.; Drouin, A.; Sirois, P. Quantifying migratory capacity and dispersal of the invasive Tench (Tinca tinca) in the St. Lawrence River using otolith chemistry. Can. J. Fish. Aquat. Sci. 2021, 78, 1628–1638. [Google Scholar] [CrossRef]
  65. Bernos, T.A.; Avlijaš, S.; Hill, J.; Morissette, O.; Ricciardi, A.; Mandrak, N.E.; Jeffries, K.M. Spatiotemporal changes in genetic diversity and structure of a recent fish invasion in eastern North America. bioRxiv 2022. [Google Scholar] [CrossRef]
Figure 1. Map of sample locations.
Diversity 14 00336 g001
Figure 2. (A) Structure of the seven tench populations for K = 4, based on the microsatellite data. Populations are the followings: 1 Lake Fertő, 2 Lake Kolon, 3 Csörnöc-Herpenyő, 4 Derecske, 5 Cibakházi Tisza, 6 Tisza-tó, 7 Cun-Szaporca. (B) Average contribution of the four genetic clusters in the seven tench populations.
Diversity 14 00336 g002
Figure 3. Regression between Fst and geographic distance calculated on the 15 pairing of the 6 populations (Mantel test, p = 0.028).
Diversity 14 00336 g003
Figure 4. (A) MtDNA haplotype networks for Cyt b mitochondrial DNA sequences. The size of the circles represent the number of observations of particular haplotypes. The GenBank identifiers of haplotypes described in the network figure but not found in the Hungarian samples are the following: H21: HM167942.1, H22: HM167944.1, H23: HM167947.1, H24: HM167948.1, H25: HM167951.1, JX974522.1, H26: HM167953.1, H27: HM167954.1, H28: HM167955.1, H29: HM167957.1, H30- MT605881.1. (B) The relative contributions of the two haplogroups to the seven tench populations.
Diversity 14 00336 g004
Table 1. Sampling locations and sample sizes.
LocationLabelGPS CoordinatesRegionSample Size
DerecskedN 47°20′20.48″E 21°34′25.13″eastern25
Lake TiszatN 47°39′31.10″E 20°41′54.25″eastern10
Cibakházi TiszachtN 46°59′03.53″E 20°10′21.77″eastern39
Lake KolonkN 46°45′35.05″E 19°20′26.80″central32
Cun-SzaporcacszN 45°46′55.10″E 18°06′09.31″central10
Csörnöc-HerpenyőcshN 46°59′37.83″E 16°36′55.11″western25
Lake FertőfN 47°38′08.30″E 16°44′39.28″western34
Table 2. Genetic diversity data of the seven tench populations studied.
Lake FertőLake KolonCsörnöc-HerpenyőDerecskeCibakházi TiszaLake TiszaCun-Szaporca
Na4.16 ± 2.243.83 ± 1.693.16 ± 1.402.41 ± 1.163.25 ± 1.422.91 ± 1.162.83 ± 1.19
Neff2.22 ± 0.78 a1.81 ± 0.57 ab1.92 ± 0.61 ab1.38 ± 0.29 b1.80 ± 0.63 ab1.92 ± 0.50 ab1.92 ± 0.69 ab
Ho0.43 ± 0.20 b0.32 ± 0.16 ab0.44 ± 0.22 b0.17 ± 0.13 a0.37 ± 0.20 ab0.36 ± 0.18 ab0.47 ± 0.31 b
uHe0.49 ± 0.18 a0.39 ± 0.20 ab0.43 ± 0.19 ab0.25 ± 0.16 b0.40 ± 0.18 ab0.47 ± 0.17 ab0.43 ± 0.25 ab
Fis0.11 ± 0.19 ab0.15 ± 0.18 ab−0.03 ± 0.15 a0.28 ± 0.31 b0.04 ± 0.19 ab0.16 ± 0.30 ab−0.12 ± 0.32 a
AR3.27 ± 1.362.74 ± 1.022.59 ± 1.052.02 ± 0.692.50 ± 0.932.78 ± 1.032.72 ± 1.11
ARp0.40 ± 0.42 a0.12 ± 0.22 ab0.16 ± 0.21 ab0.02 ± 0.06 b0.12 ± 0.24 ab0.12 ± 0.31 ab0.10 ± 0.29 ab
Na: number of alleles, Neff: effective number of alleles, uHe: unbiased expected heterozygosity, Ho: observed heterozygosity values, Fis: inbreeding coefficient, AR: allelic richness, ARp: private allelic richness. If indicated, superscript letters (a, b) indicate significant (p < 0.05) differences between the groups.
Table 3. Pairwise Fst with the ENA correction (below the diagonal) and the Cavalli-Sforza and Edwards genetic distances with the INA correction (above the diagonal).
Fst/Genetic
Distance
Lake FertőLake KolonCsörnöc-HerpenyőDerecskeCibakházi TiszaTisza-tóCun-Szaporca
Lake Fertő-0.2280.2090.2990.2560.2430.286
Lake Kolon0.065-0.2460.2320.2370.1950.291
Csörnöc-Herpenyő0.0320.104-0.2550.2360.2450.250
Derecske0.1300.0590.138-0.2270.2710.332
Cibakházi Tisza0.0770.0690.1010.061-0.2320.266
Tisza-tó0.0080.0290.0430.1200.042-0.258
Cun-Szaporca0.0540.1380.0710.2190.1270.051-
Table 4. Diversity data of the mtDNA sequences in the seven tench populations.
StockNhSEtaHd (Mean ± SD)Pi (Mean ± SD)
Lake Fertő1411120.909 ± 0.0260.00728 ± 0.00035
Lake Kolon5990.556 ± 0.1300.00290 ± 0.00123
Csörnöc-Herpenyő9990.813 ± 0.0810.00456 ± 0.00111
Derecske5880.789 ± 0.0570.00597 ± 0.00076
Cibakházi Tisza610100.655 ± 0.0600.00552 ± 0.00037
Tisza-tó2110.222 ± 0.1660.00036 ± 0.00027
Cun-Szaporca4770.778 ± 0.0910.00596 ± 0.00094
Nh—Number of haplotypes; S—Number of polymorphic (segregating) sites, Eta—total number of mutations, Hd—haplotype diversity, Pi—nucleotide diversity, SD-Standard Deviation.
Table 5. Proportion of Western and Eastern haplotypes of the mitochondrial Cytb gene in seven tench populations.
Cytb
Western (%)Eastern (%)
Derecske3763
Lake Tisza0100
Cibakházi Tisza4357
Lake Kolon892
Cun-Szaporca4060
Csörnöc-Herpenyő2377
Lake Fertő4753
Average2872
Table 6. Act and Rps7 haplotypes of the seven tench populations.
Act (Eco52l)Rps7 (Ndel)
W (%)E (%)WE-Het (%)W (%)E (%)WE-Het (%)
Derecske8365645640
Lake Tisza10090603010
Cibakházi Tisza50163437360
Lake Kolon163153124741
Cun-Szaporca6004060040
Csörnöc-Herpenyő541333123256
Lake Fertő322444441541
avarage331750332641
W—West; E—East; WE-het—Western-Eastern Heterozygote.
Publisher’s Note: MDPI stays neutral with regard to jurisdictional claims in published maps and institutional affiliations.

