
Dataset for the Solar Incident Radiation and Electricity Production BIPV/BAPV System on the Northern/Southern Façade in Dense Urban Areas


City and Regional Planning Group, Institute of Safety, Economics and Planning (ISØP), Faculty of Science and Technology, University of Stavanger, 4021 Stavanger, Norway
*
Author to whom correspondence should be addressed.
Data 2021, 6(6), 57; https://0-doi-org.brum.beds.ac.uk/10.3390/data6060057
Submission received: 26 March 2021
/
Revised: 24 May 2021
/
Accepted: 25 May 2021
/
Published: 26 May 2021
Abstract
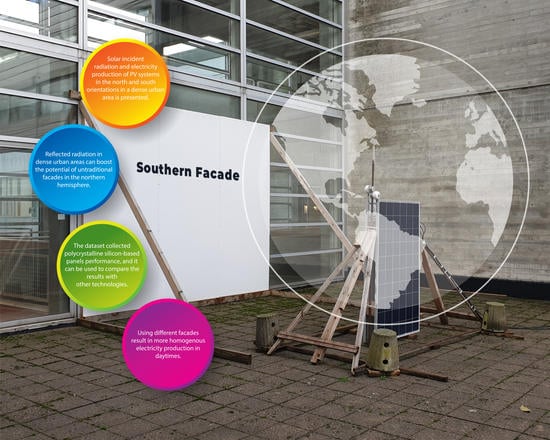
:The prosperous implementation of Building Integrated Photovoltaics (BIPV), as well as Building Attached Photovoltaics (BAPV), needs an accurate and detailed assessment of the potential of solar irradiation and electricity production of various commercialised technologies in different orientations on the outer skins of the building. This article presents a dataset for the solar incident radiation and electricity production of PV systems in the north and south orientations in a dense urban area (in the northern hemisphere). The solar incident radiation and the electricity production of two back-to-back PV panels with a ten-centimetre gap for one year are monitored and logged as primary data sources. Using Microsoft Excel, both panels’ efficiency is also presented as a secondary source of data. The implemented PV panels are composed of polycrystalline silicon cells with an efficiency of 16.9%. The results depicted that the actual efficiency of the south-facing panel (13–15%) is always closer to the standard efficiency of the panel compared to the actual efficiency of the north-facing panel (8–12%). Moreover, although the efficiency of the south-facing panel on sunny days of the year is almost constant, the efficiency of the north-facing panel decreases significantly in winter. This phenomenon might be linked to the spectral response of the polycrystalline silicon cells and different incident solar radiation spectrum on the panels. While the monitored data cover the radiation and system electricity production in various air conditions, the analysis is mainly conducted for sunny days, and more investigation is needed to analyse the system performance in other weather conditions (like cloudy and overcast skies). The presented database could be used to analyse the performance of polycrystalline silicon PV panels and their operational efficiency in a dense urban area and for different orientations.
Dataset License: Creative Commons Attribution 4.0 International
1. Summary
While electricity plays an essential role in the modern world, 13% of the world’s population, equal to 940 million people, are deprived of electricity [1]. This fact can lead us toward the importance of renewable energy resources, especially solar energy, which can be harnessed everywhere globally.
BAPV or Building Attached PV;
BAPV are added to the building without directly affecting the structure’s function. Roof-mounted PV systems in buildings are generally placed in this category.
BIPV or Building Integrated PV;
BIPV are photovoltaic modules which can be integrated into the building skin, such as the façade or roof, to generate electricity out of solar irradiation [9,10]. They are increasingly being incorporated into new buildings as a principal or ancillary source of electrical power [11,12]. However, existing buildings may be retrofitted with similar technology. The climate also plays a key role in the performance of such a system [13] and it can also be used in other industries, such as the ship manufacturing industry [14].
Researchers have recently sought to determine the feasibility of southern, eastern and western façades for BIPV and BAPV applications [15,16,17], while they have not treated northern façades in much detail. It seems there has been an assumption that the north façades (in the northern hemisphere) are unfeasible economically because the radiation there is low [11,18].
Therefore, the authors designed an experimental study to investigate the northern façade’s potential and compare it with the southern façade. The aim was to collect solar incident radiation and PV electricity production data on the north façade and evaluate the south façade materials’ effect as a reflector to the opposite north-facing façade of the neighbouring building.
2. Value of the Data and Data Specification
The value of the presented data in this paper can briefly be described as follows:
- The data depict the effect of dense urban areas on the solar incident radiation of the different orientations of building skins and BAPV/BIPV systems’ efficiencies with different orientations on building skins in the northern hemisphere.
- The monitored data help to identify the suitable locations for BAPV/BIPV on building skins and assess the feasibility of using the BAPV/BIPV system as a building envelope material for the entire building skins.
- The dataset collected polycrystalline silicon-based BAPV/BIPV panels’ performance, and it can be used to compare the results with other technologies, such as perovskite or organic solar cells.
- The reflected radiation in dense urban areas can boost the potential of untraditional façades in the northern hemisphere.
- Using different façades result in more homogenous electricity production. It also could lead to matching of demand and supply.
The specifications of the data are also presented in Table 1.
3. Methods
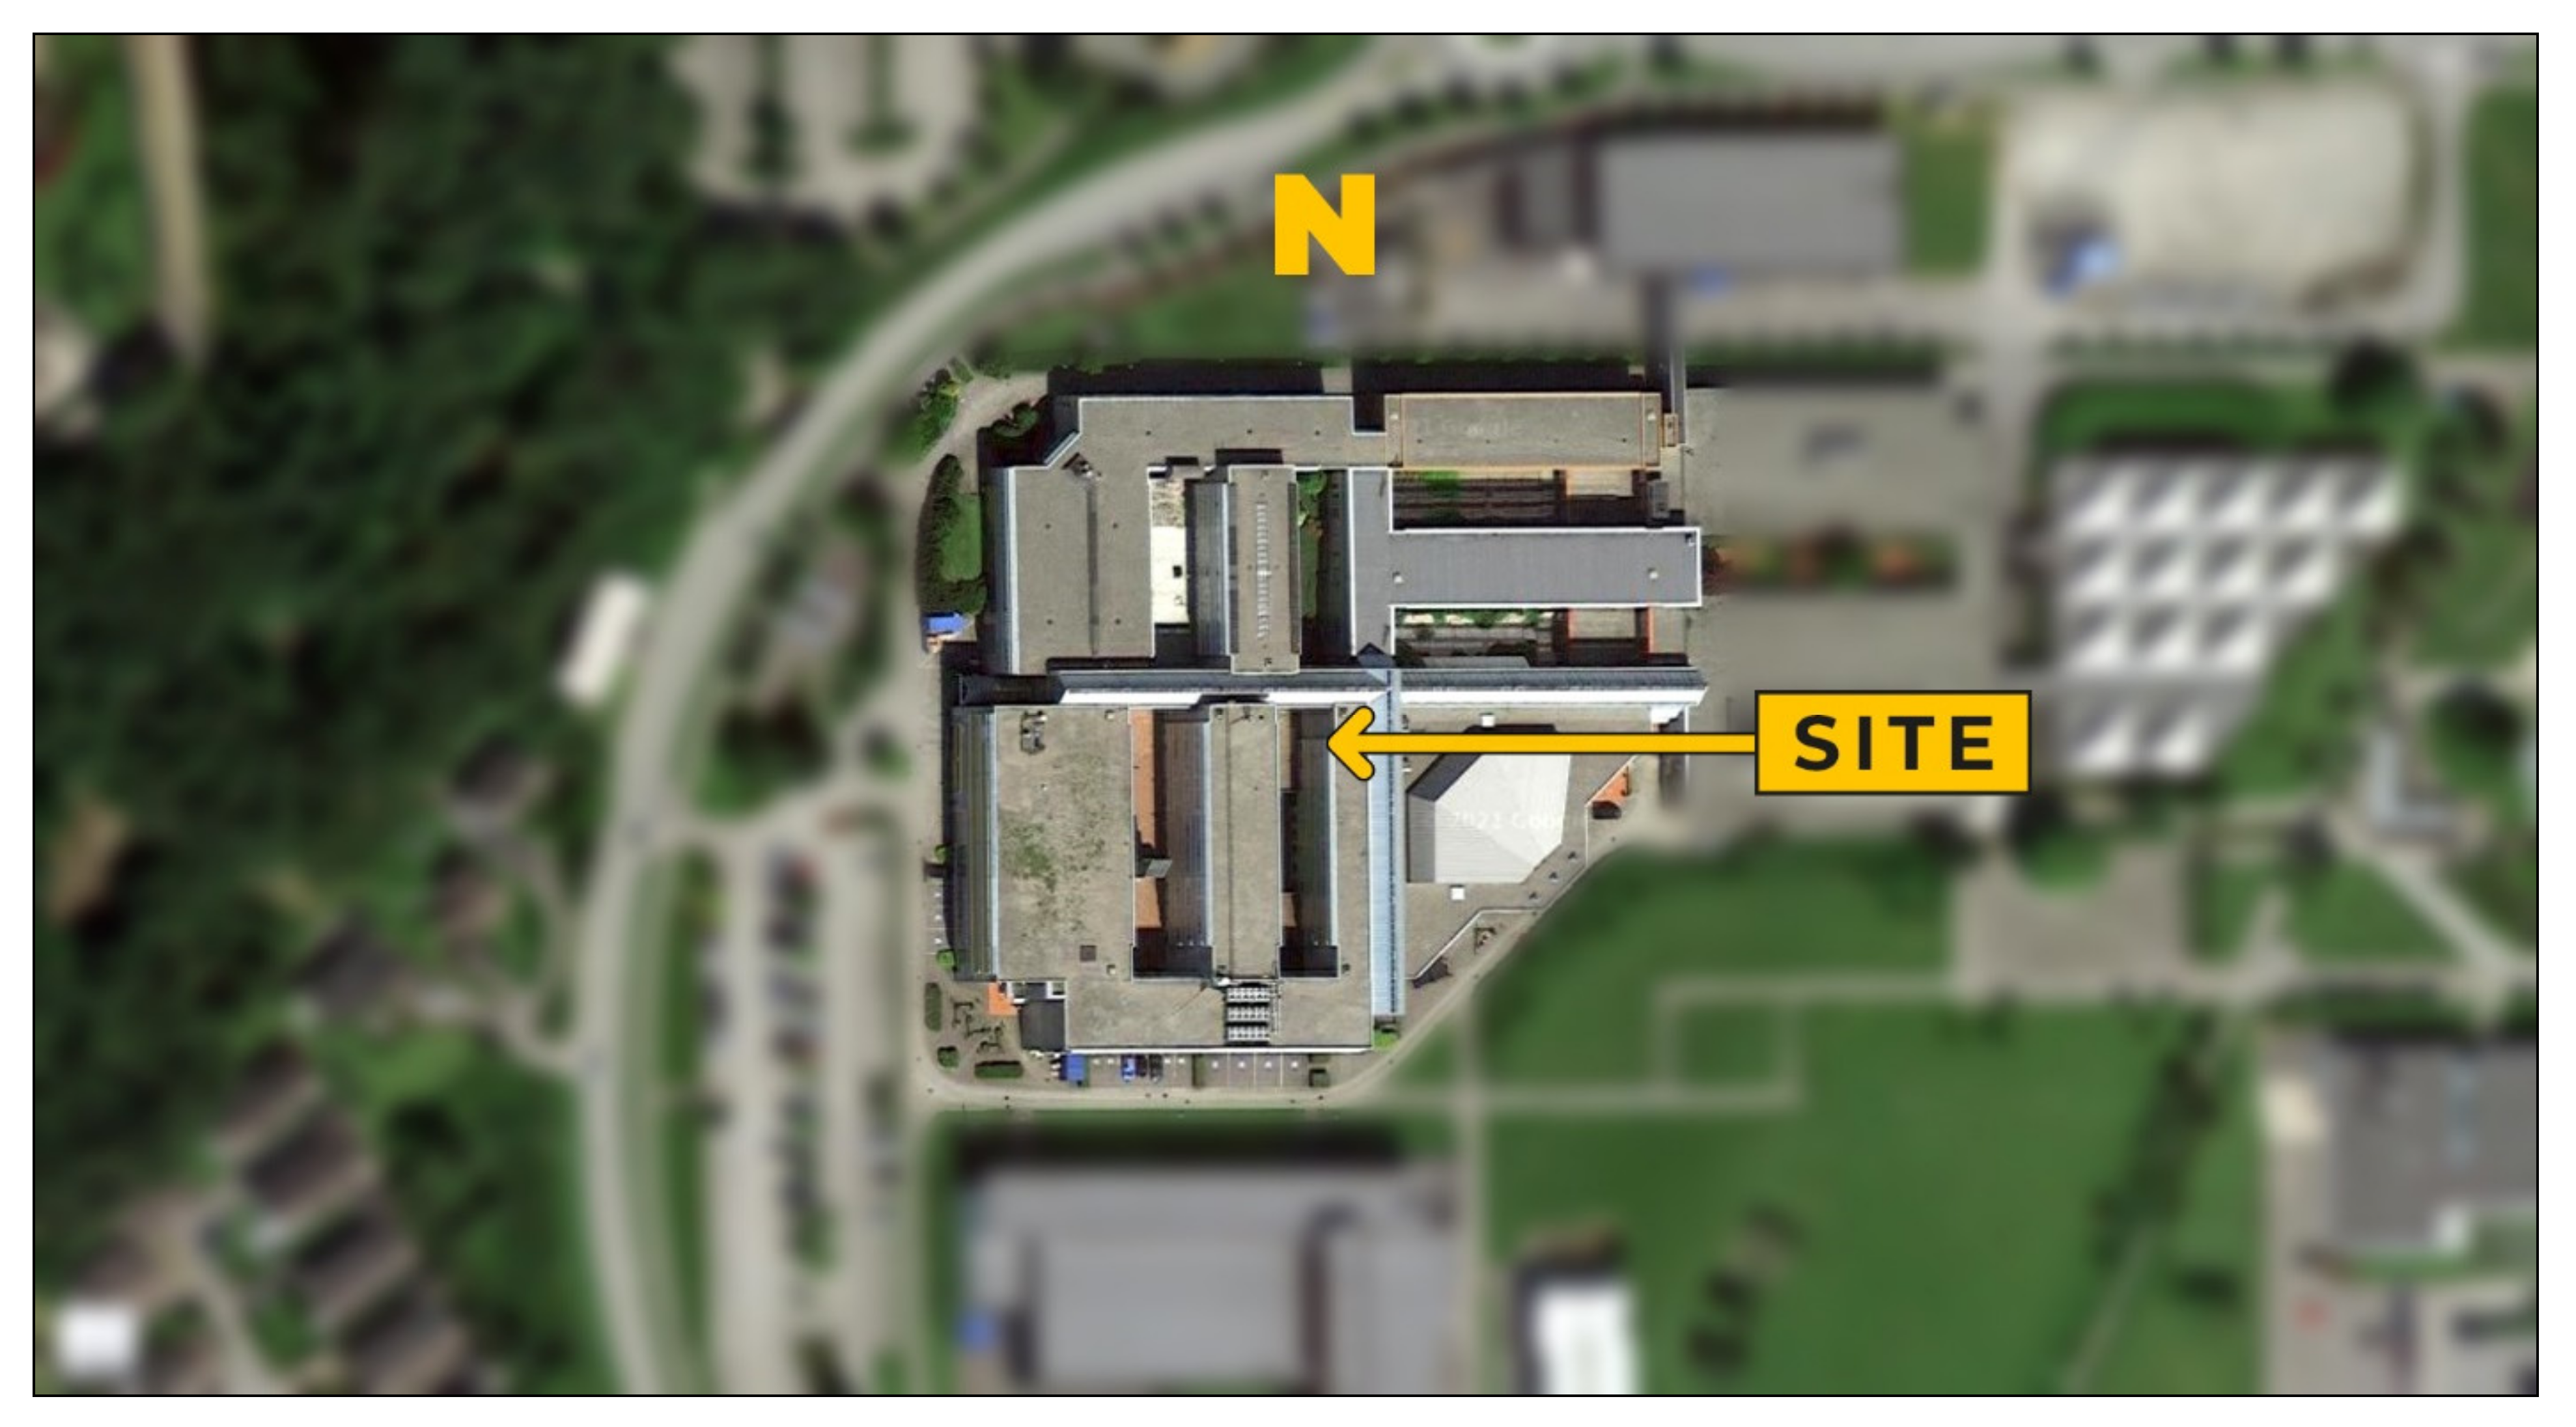
3.1. Site
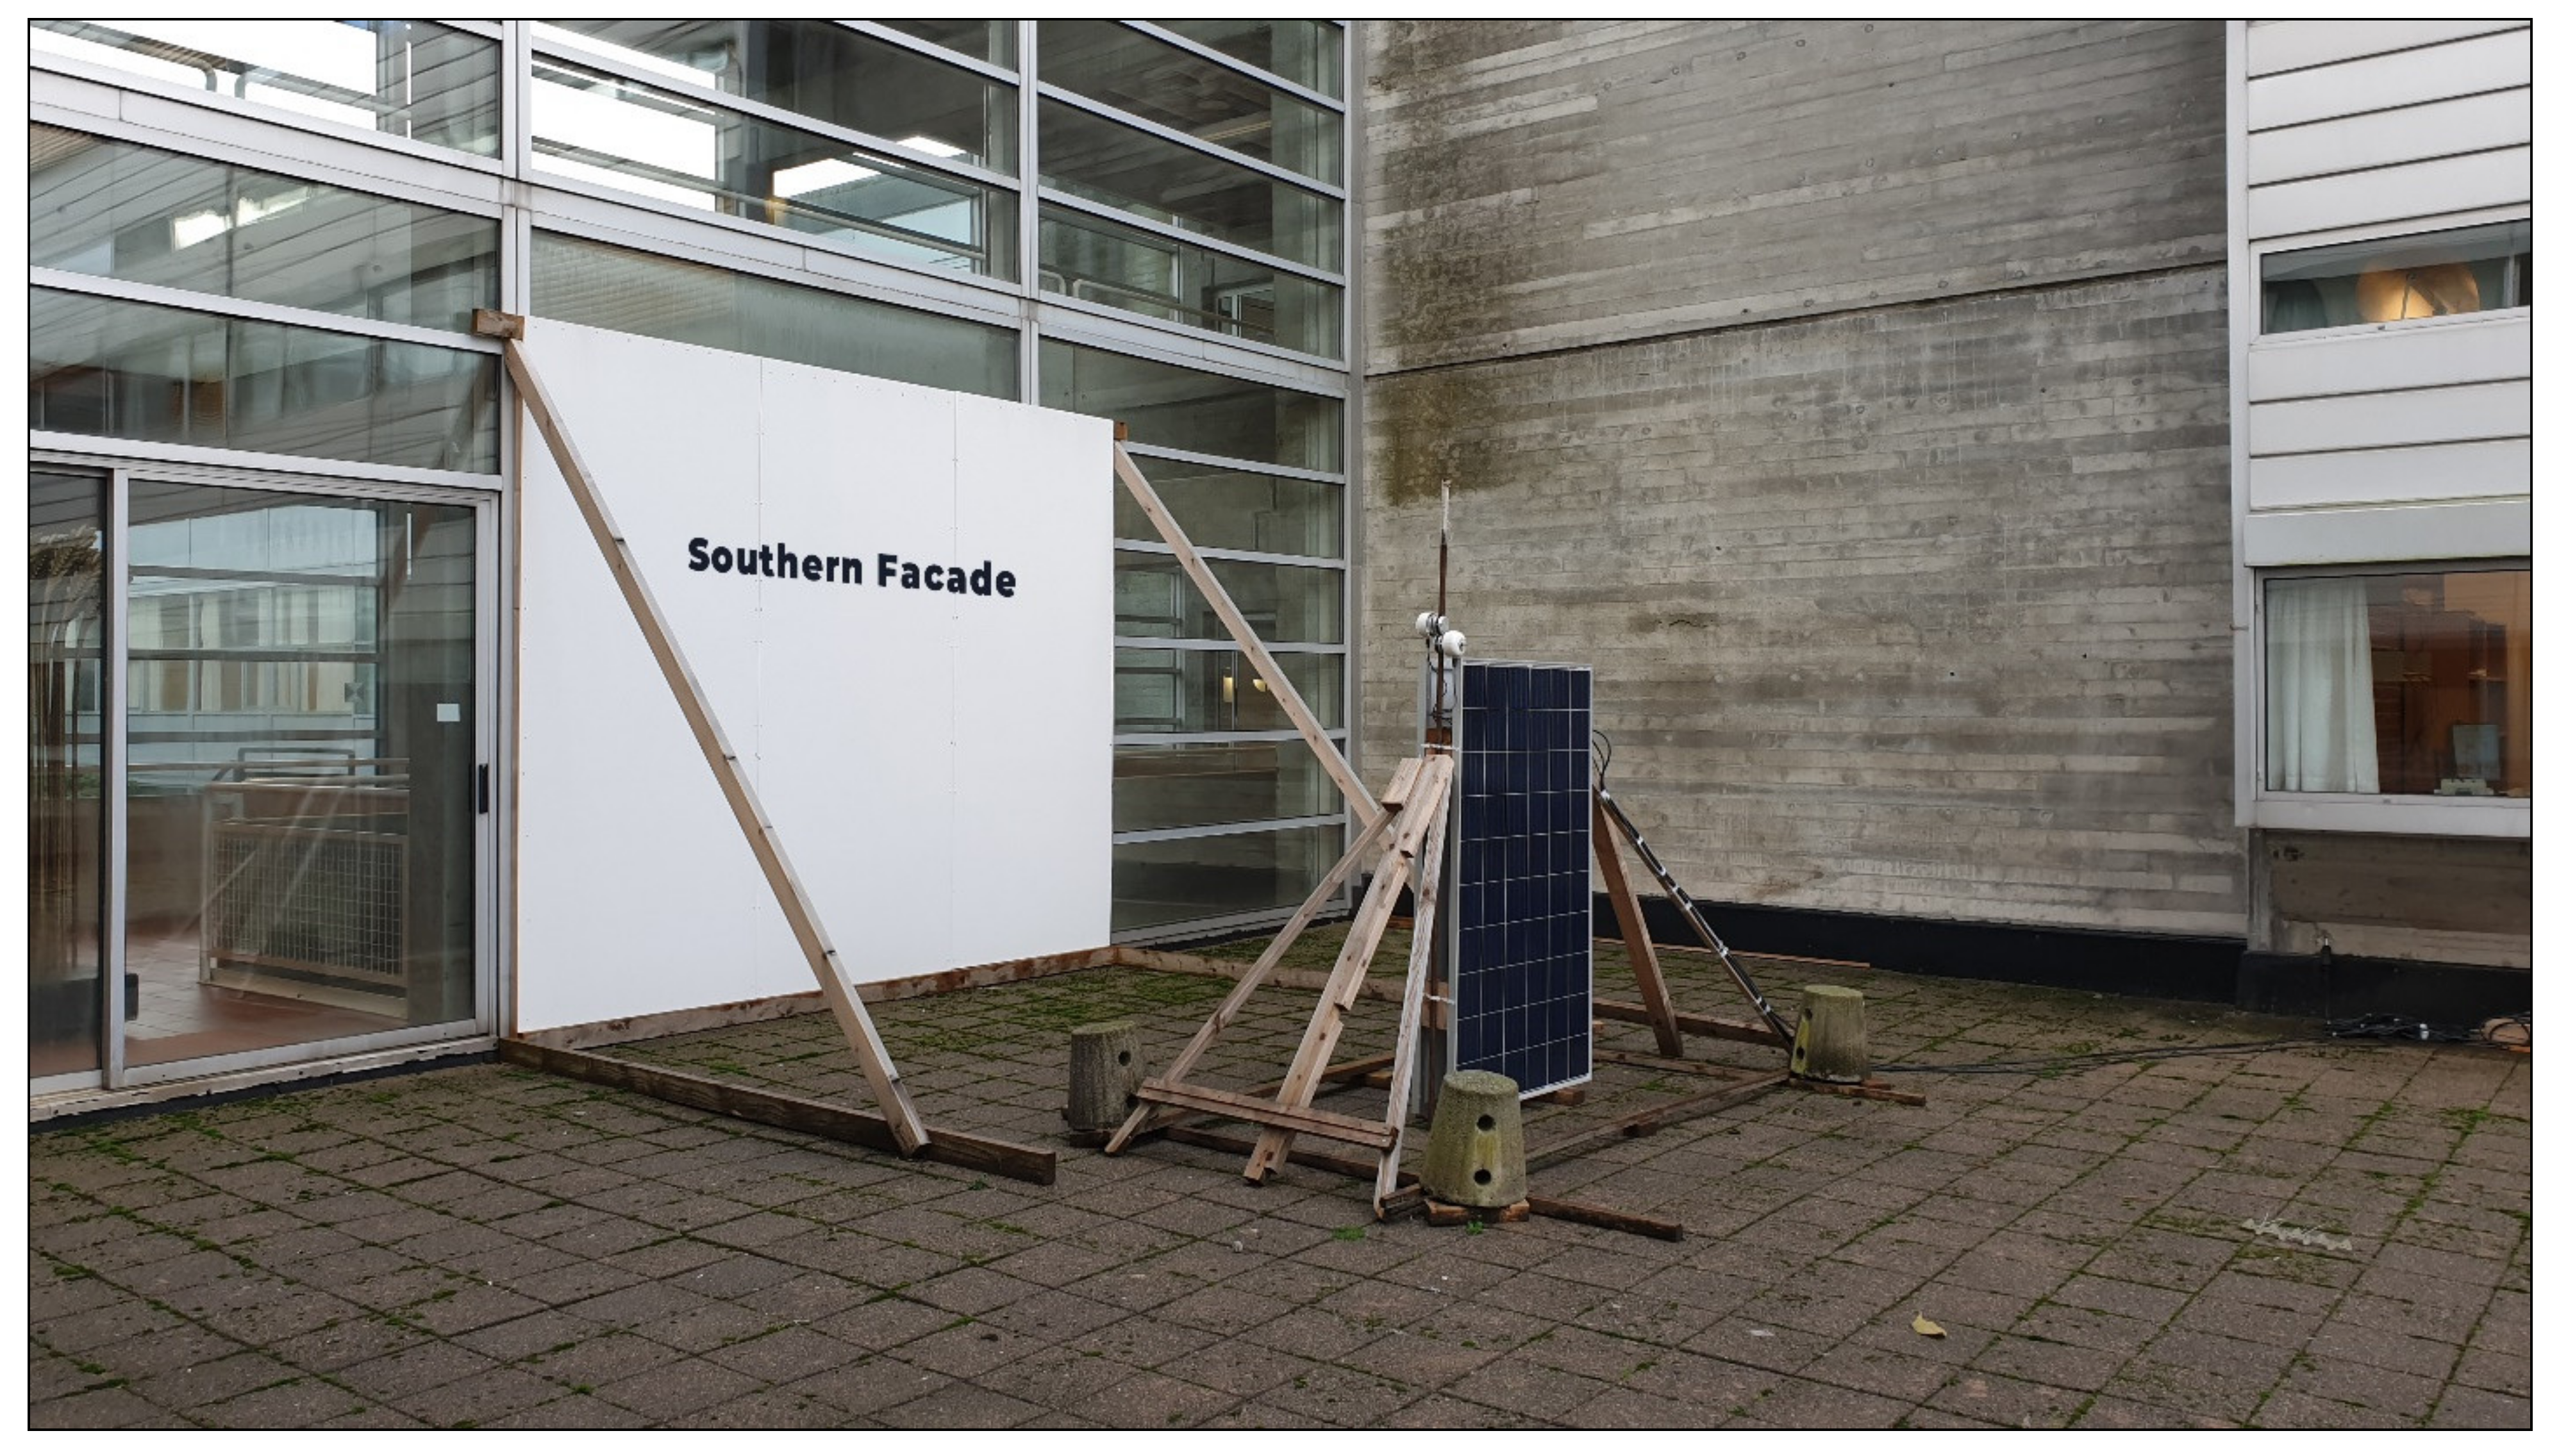
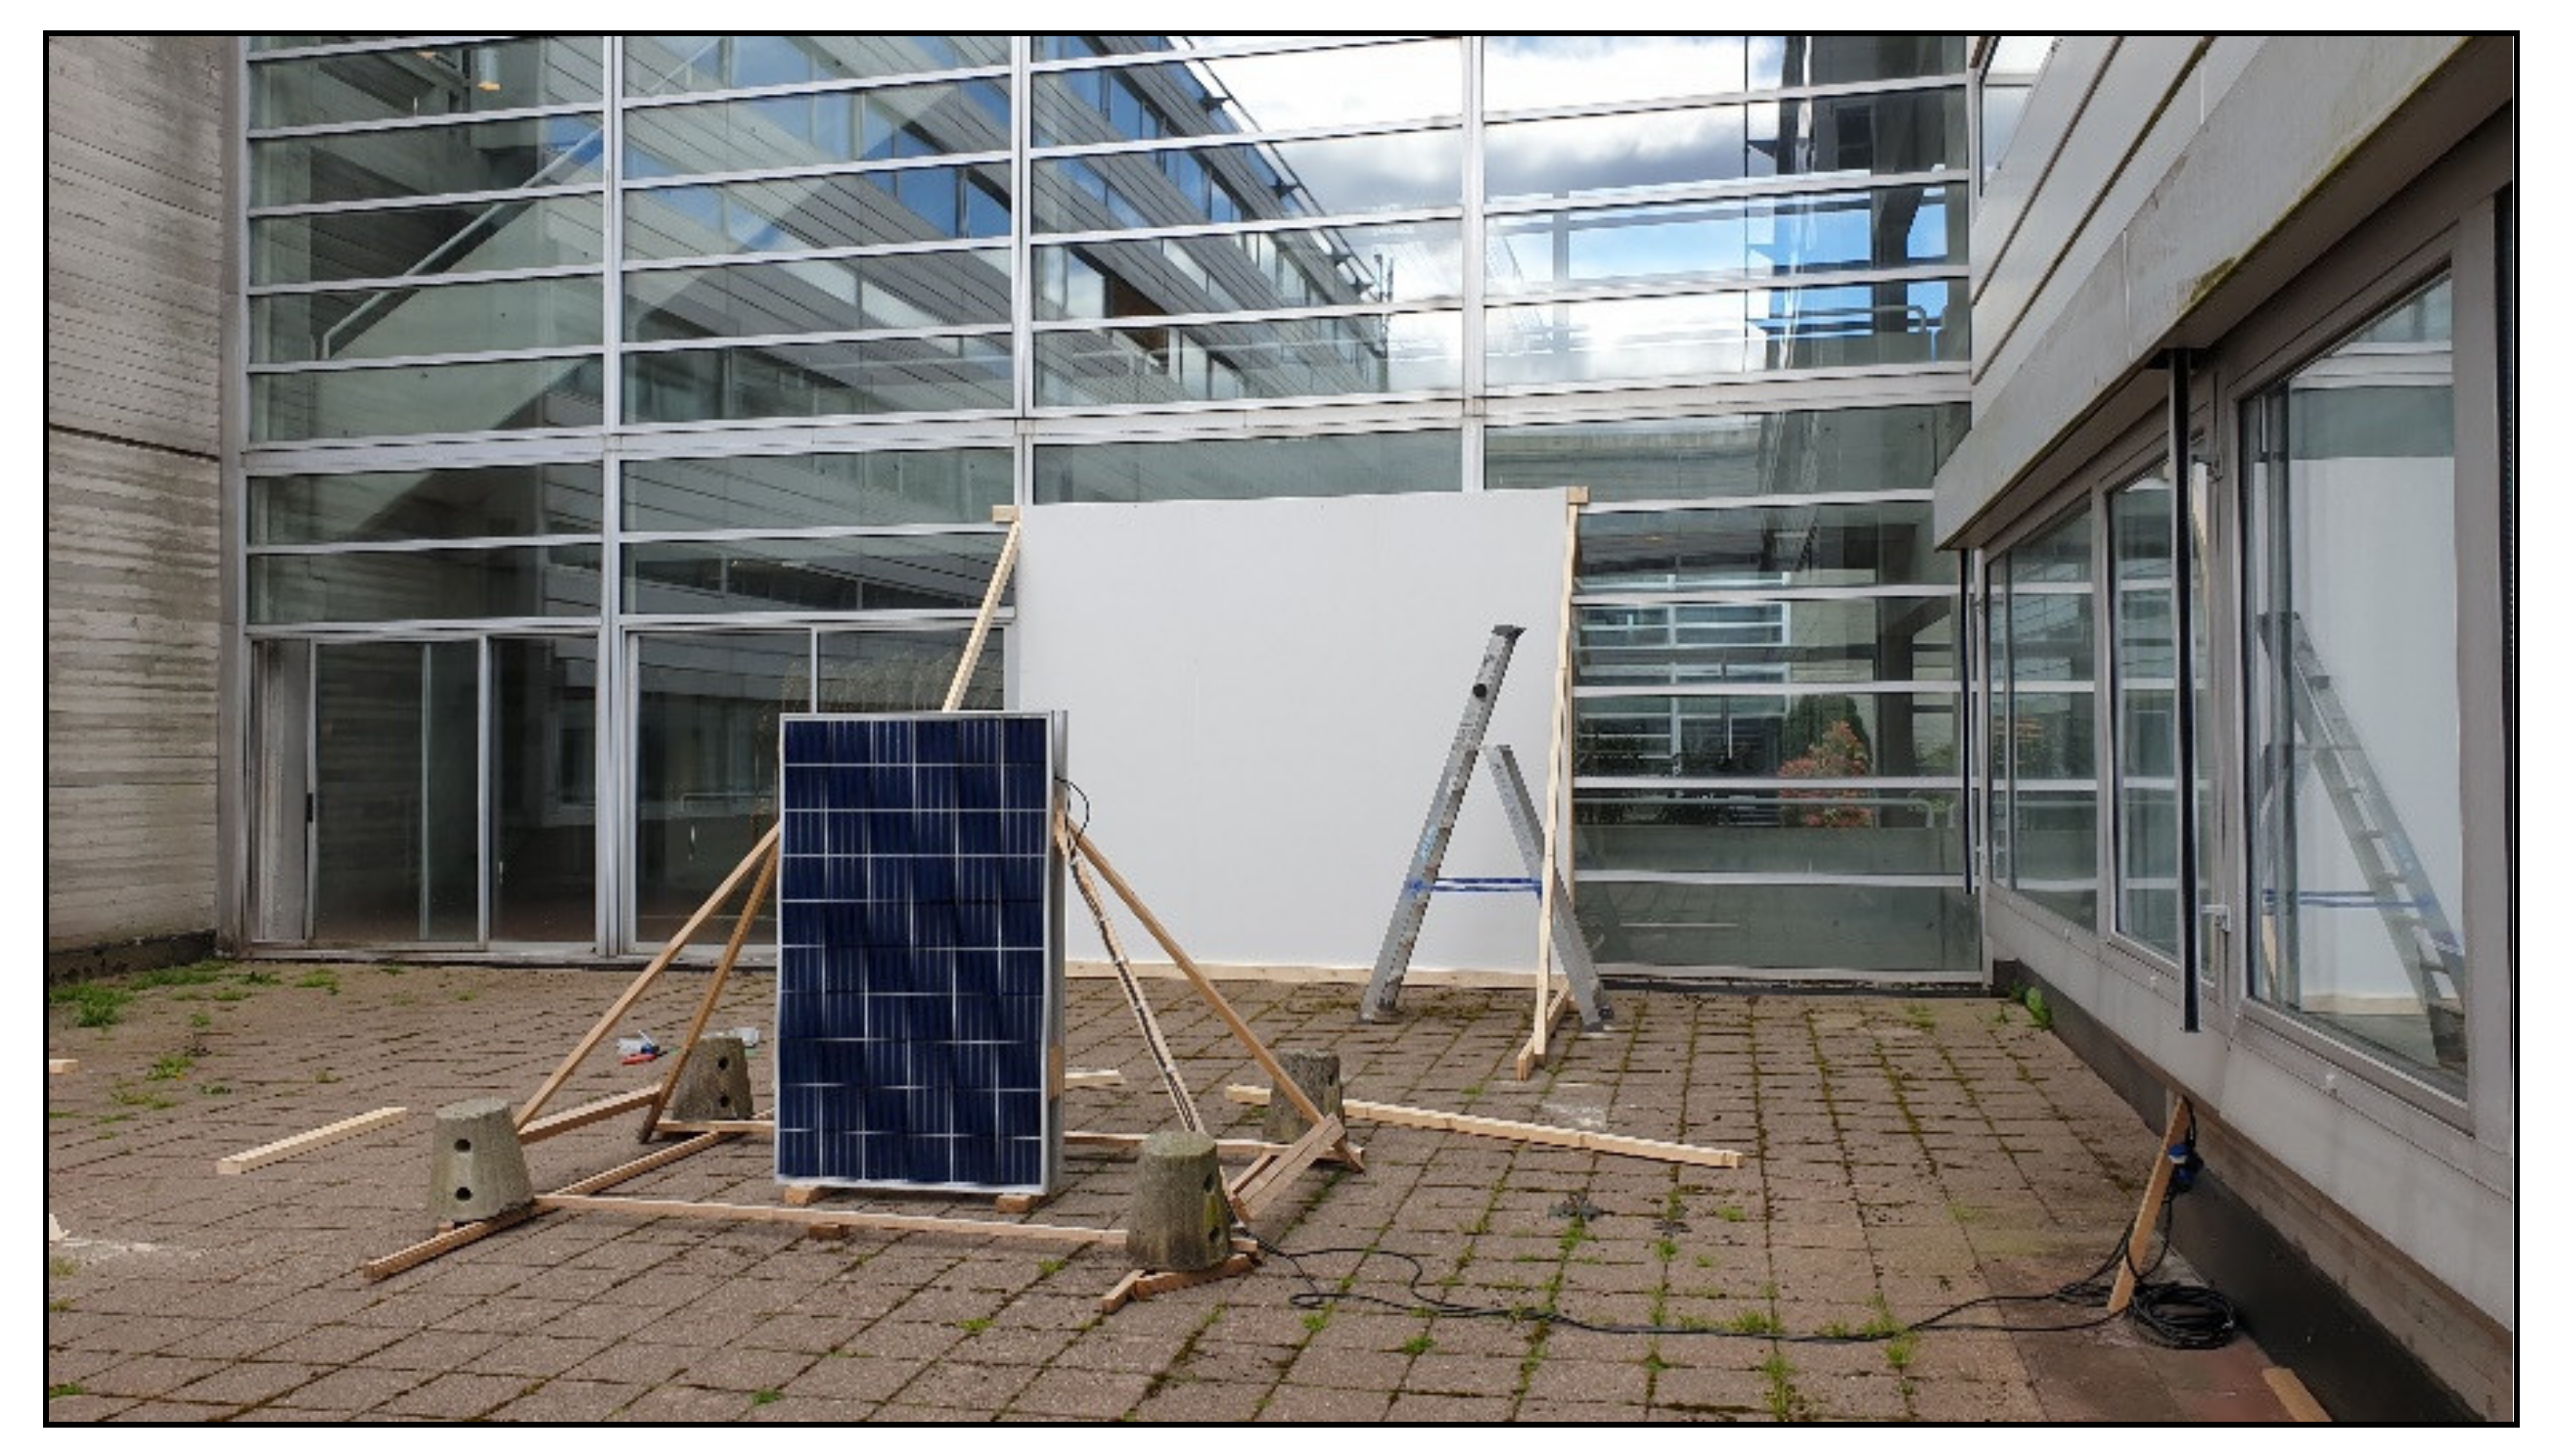
Figure 1 shows a picture of the site with all components and the location of the site. A 3D model of the site is also available as a supplement to this paper. The 3D model is a useful tool to investigate the boundary conditions (reflectance of ground surface/walls etc., the geometry of the complete building and the shading by neighbouring buildings) and the measurement results can therefore be used for the validation of simulations or for comparison with other measurements.
3.2. System Components
Table 2 indicates the components of the system and the implemented items. The datasheet and catalogue of the equipment as well as the 3D model of the site are available as Supplementary Materials, uploaded to Zenodo and is accessible by the following link: https://0-doi-org.brum.beds.ac.uk/10.5281/zenodo.4804993, accessed on 26 May 2021.
3.3. System Implementation
The timeline of the system configuration is as follows.
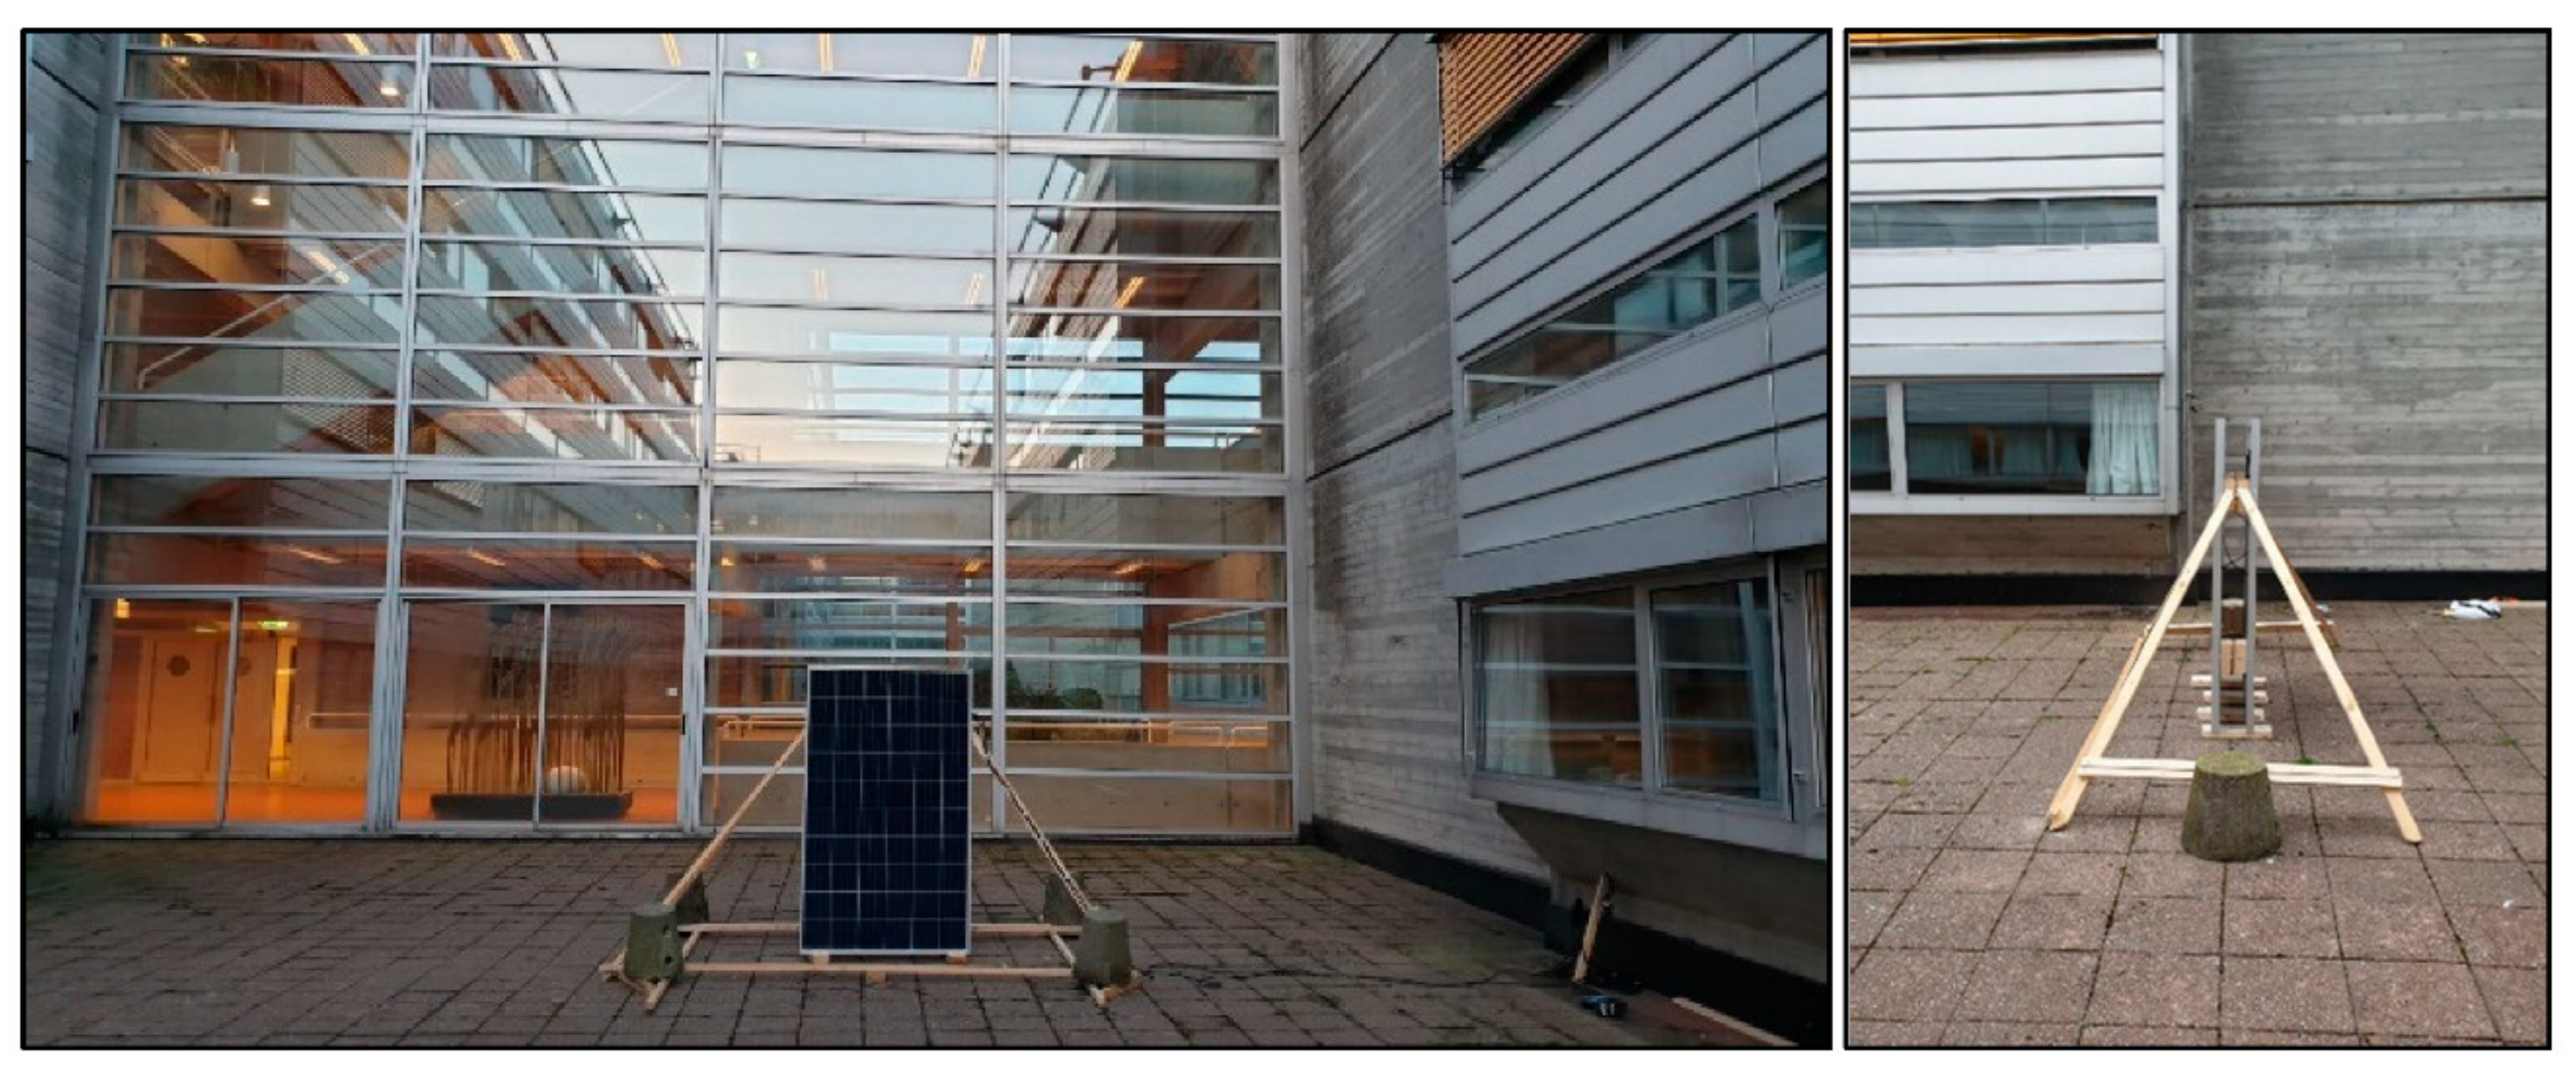
In December 2019, the PV system and microinverters and electricity monitoring equipment were implemented in front of a glass façade, as shown in Figure 2. Therefore, the electricity production data are available from the first day of January 2020, as presented in the dataset.
On 1 May 2020, a 3 × 3 square meter white panel cladding implemented in front of the PV panel to monitor the effect of the reflected radiation of the white façade on the solar incident radiation and, consequently, the electricity production of the north-facing PV panel (Figure 3).
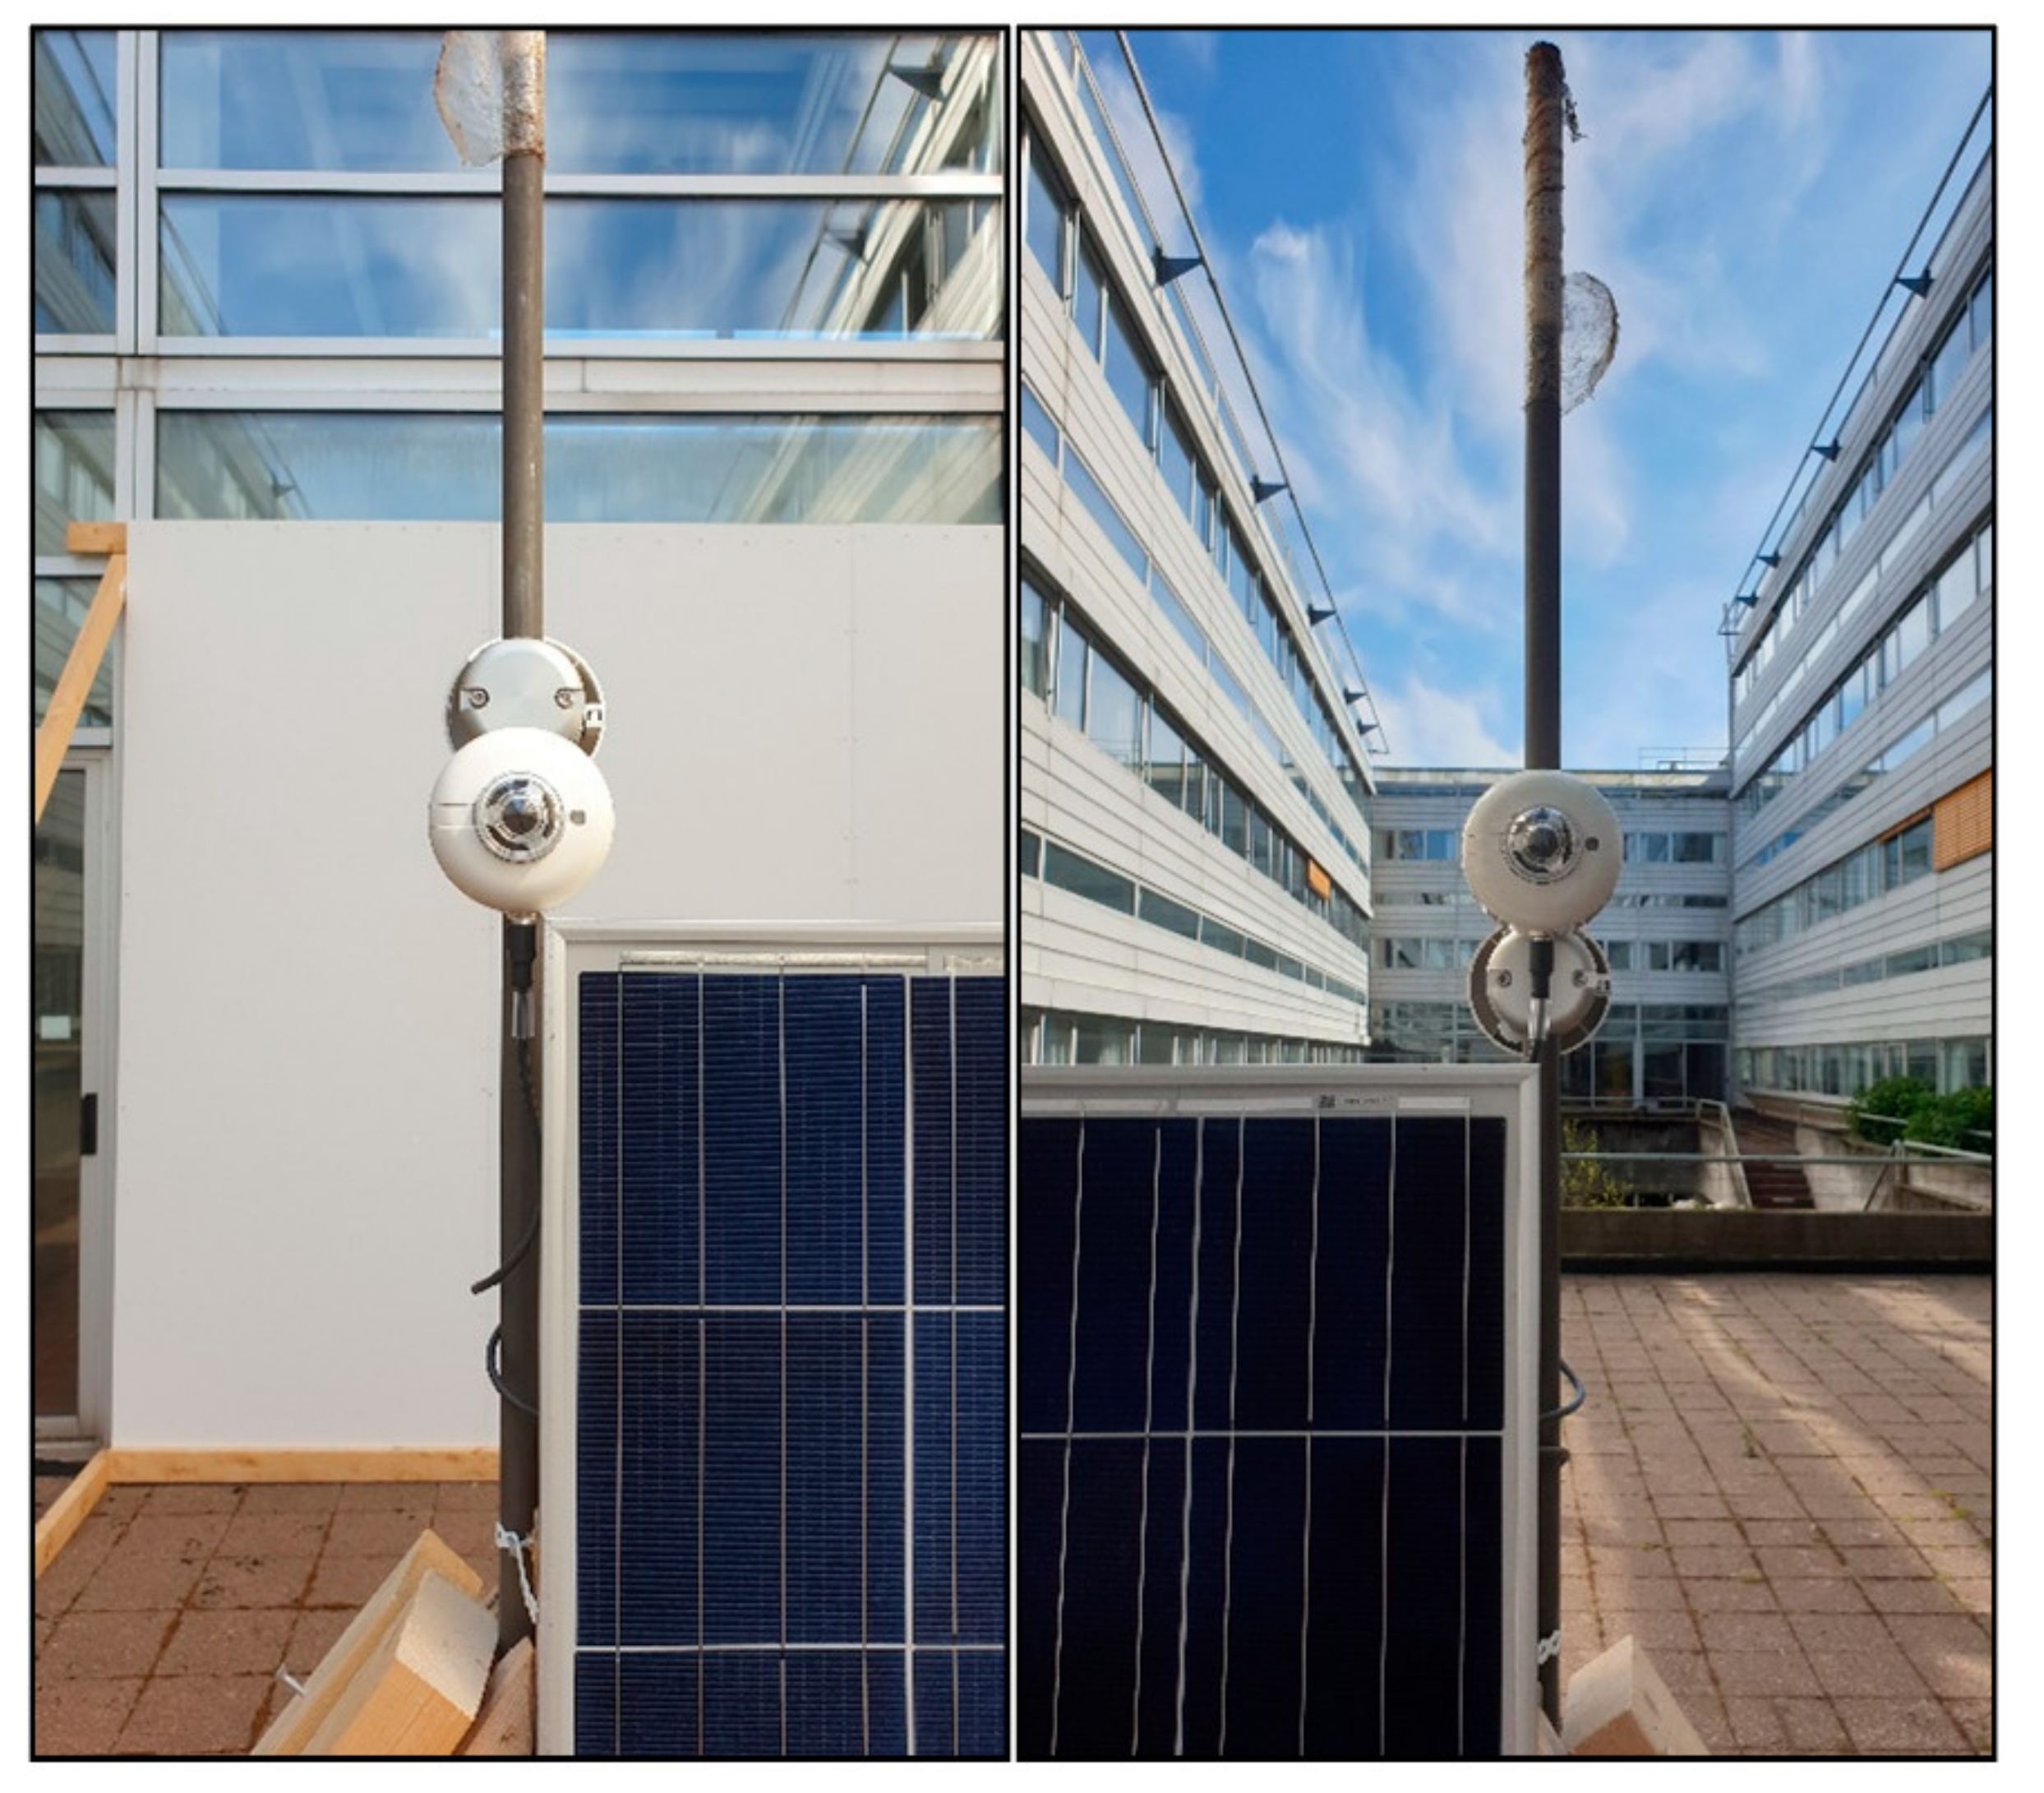
On 26 June 2020, two sets of solar incident radiation measuring equipment and logging equipment were implemented to calculate the PV system operational efficiency. Figure 4 shows two sets of pyranometers after installation at the site.
4. Data Description (Raw Data)
All the described data in this section are available as a supplement to this paper. The electricity production is presented based on produced power per panel. The incident solar radiation is presented based on solar irradiance (power) per square meter (and not per total area of the panel).
4.1. Electricity Production
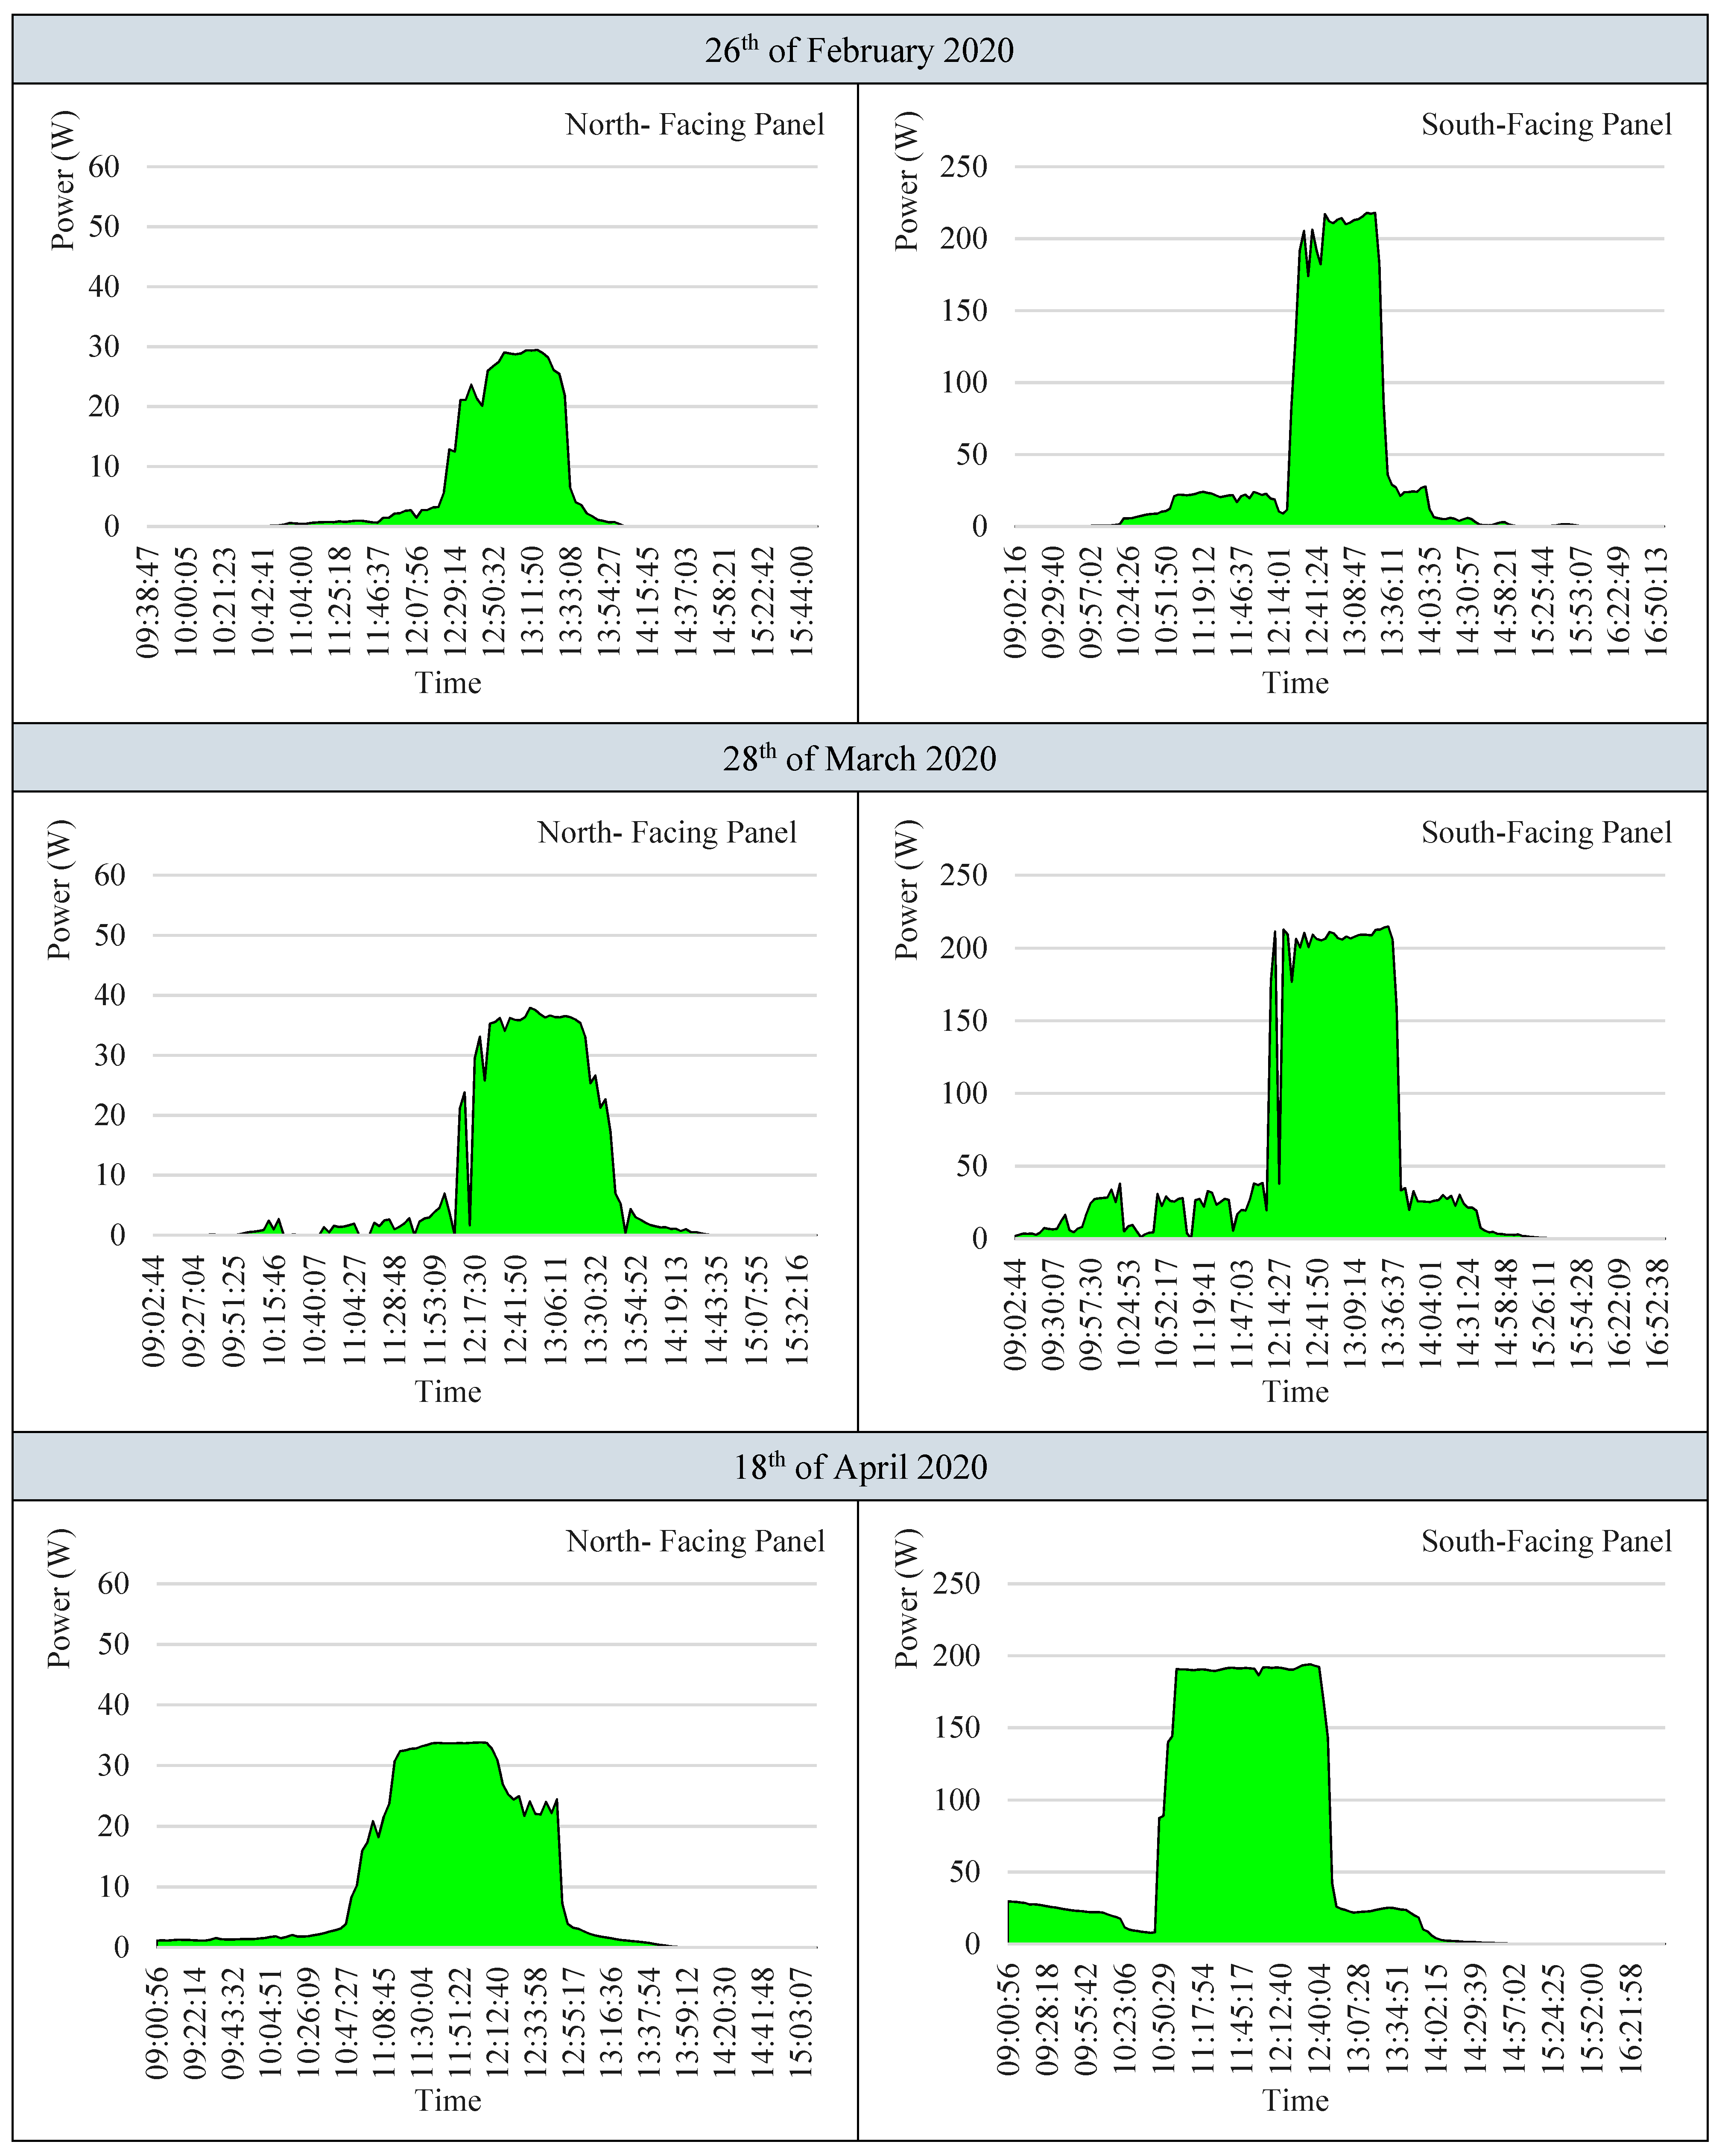
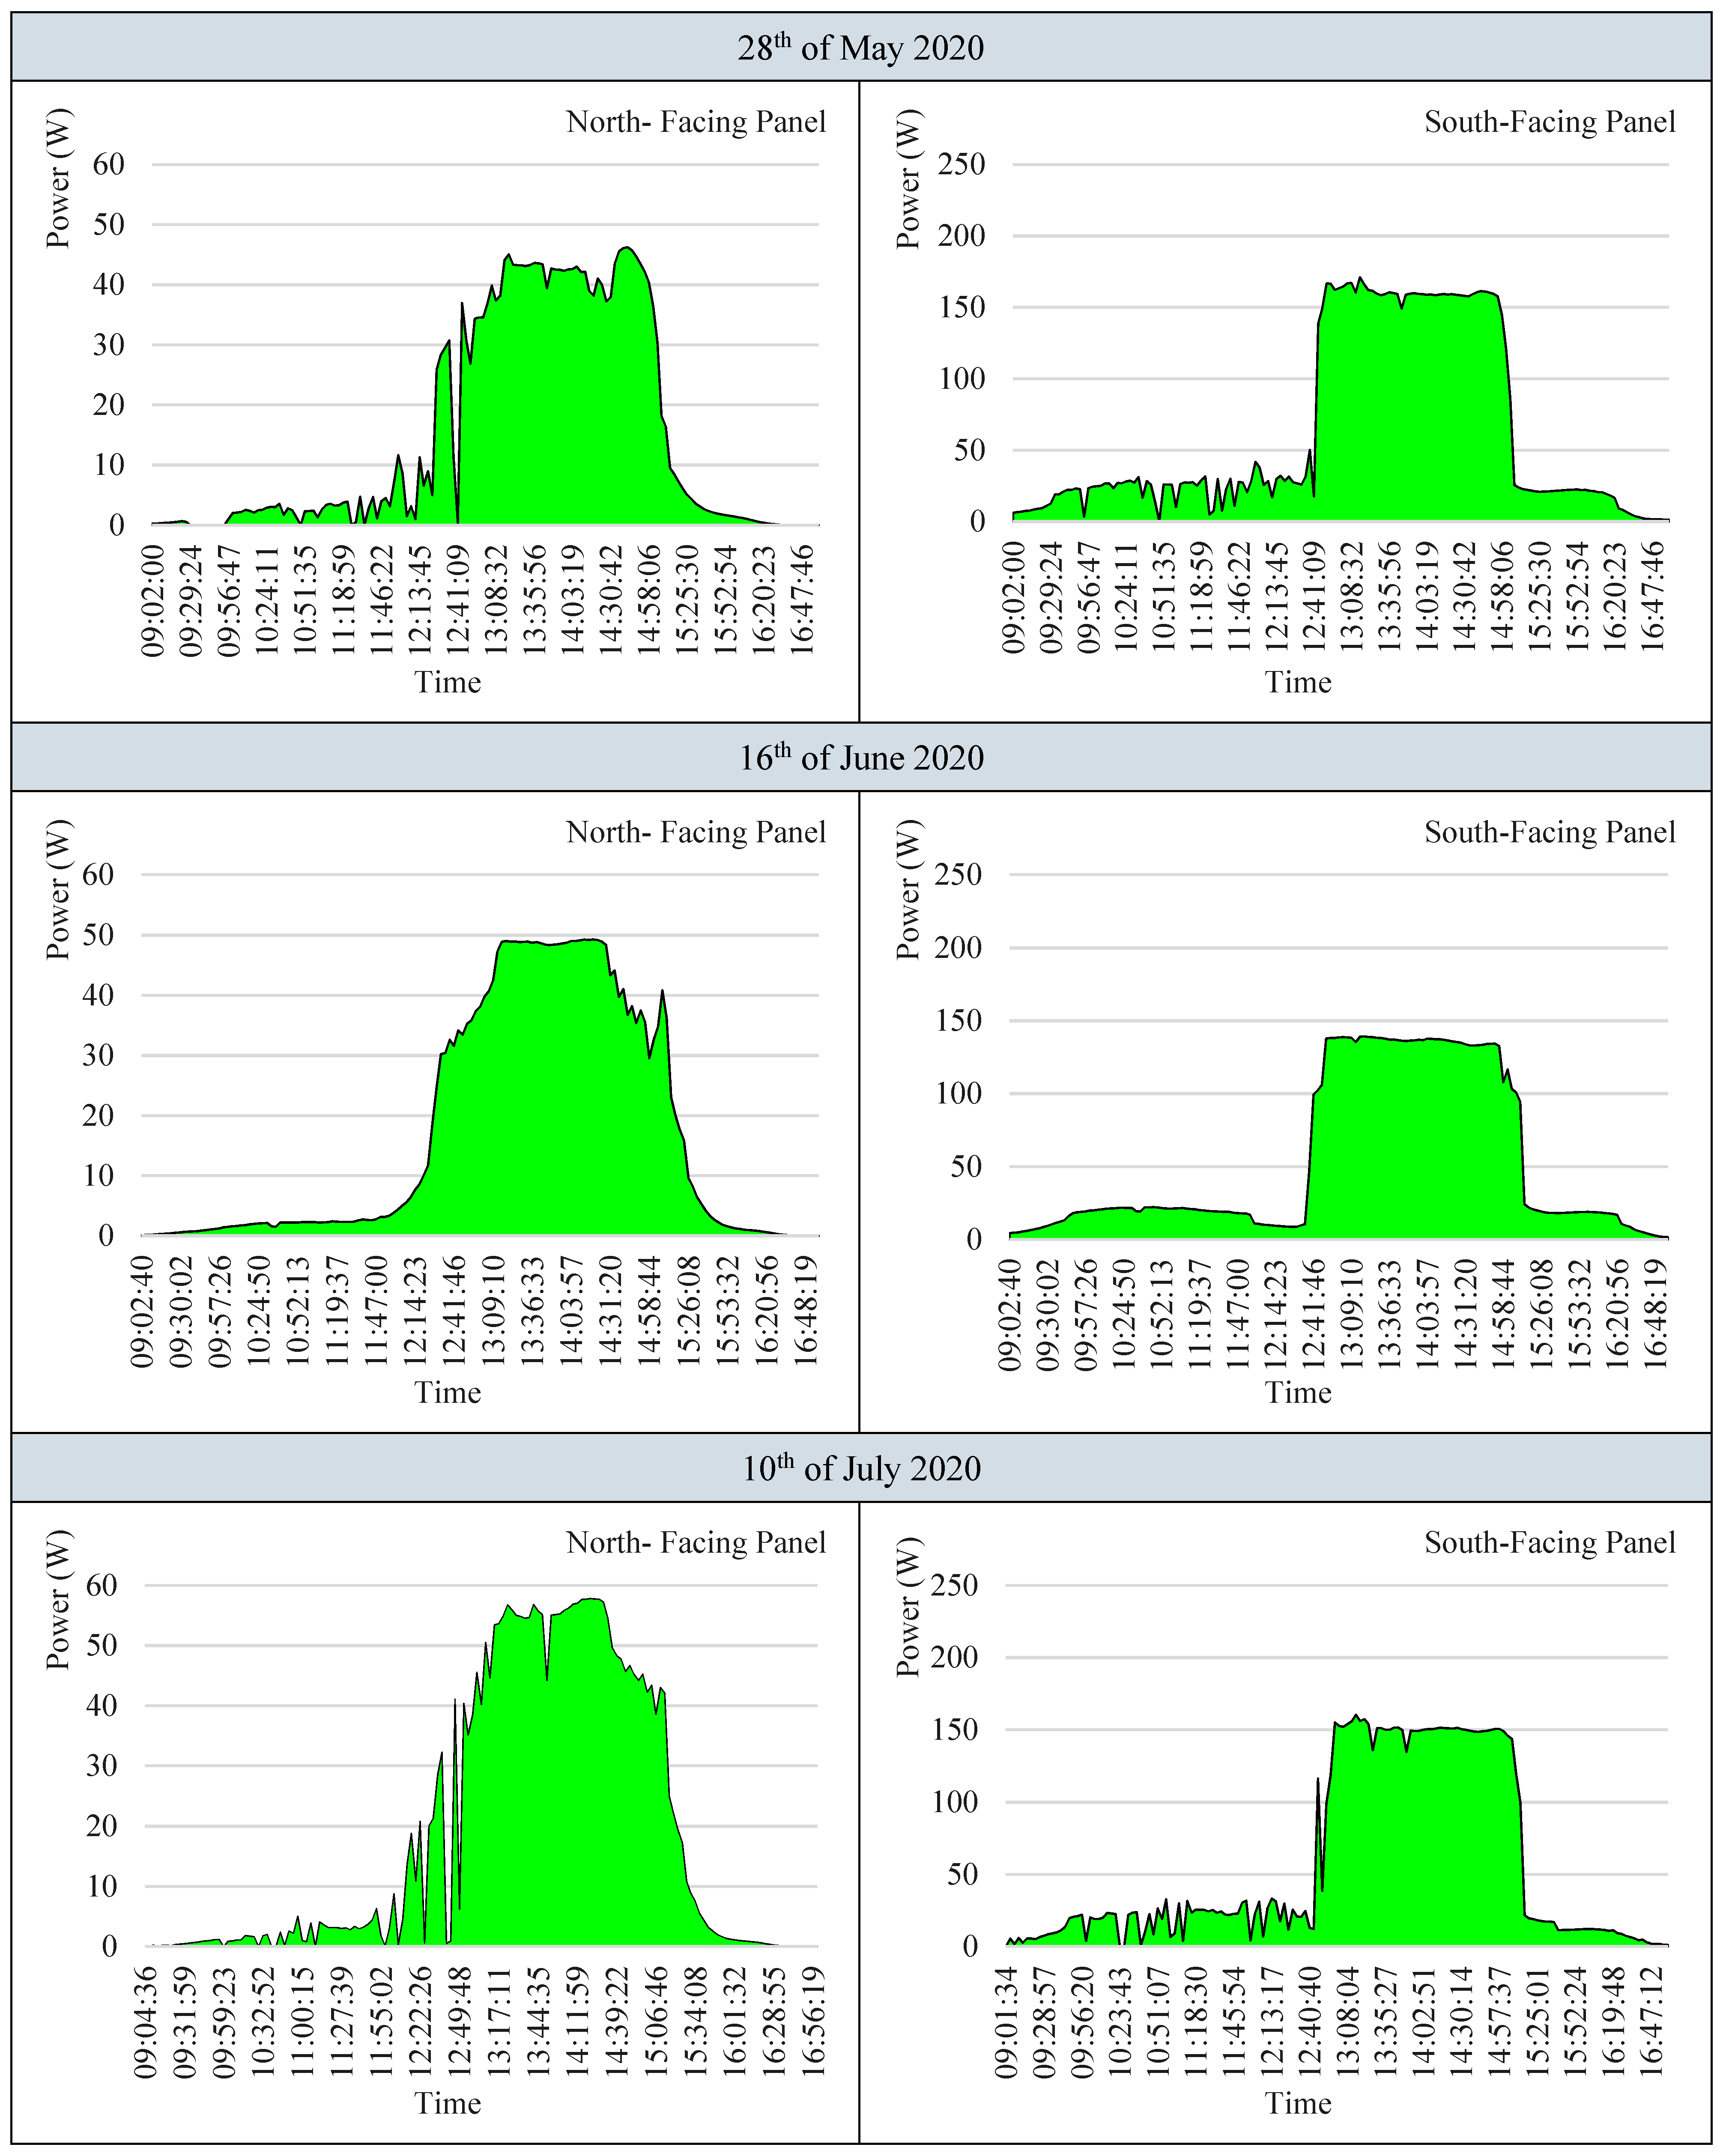
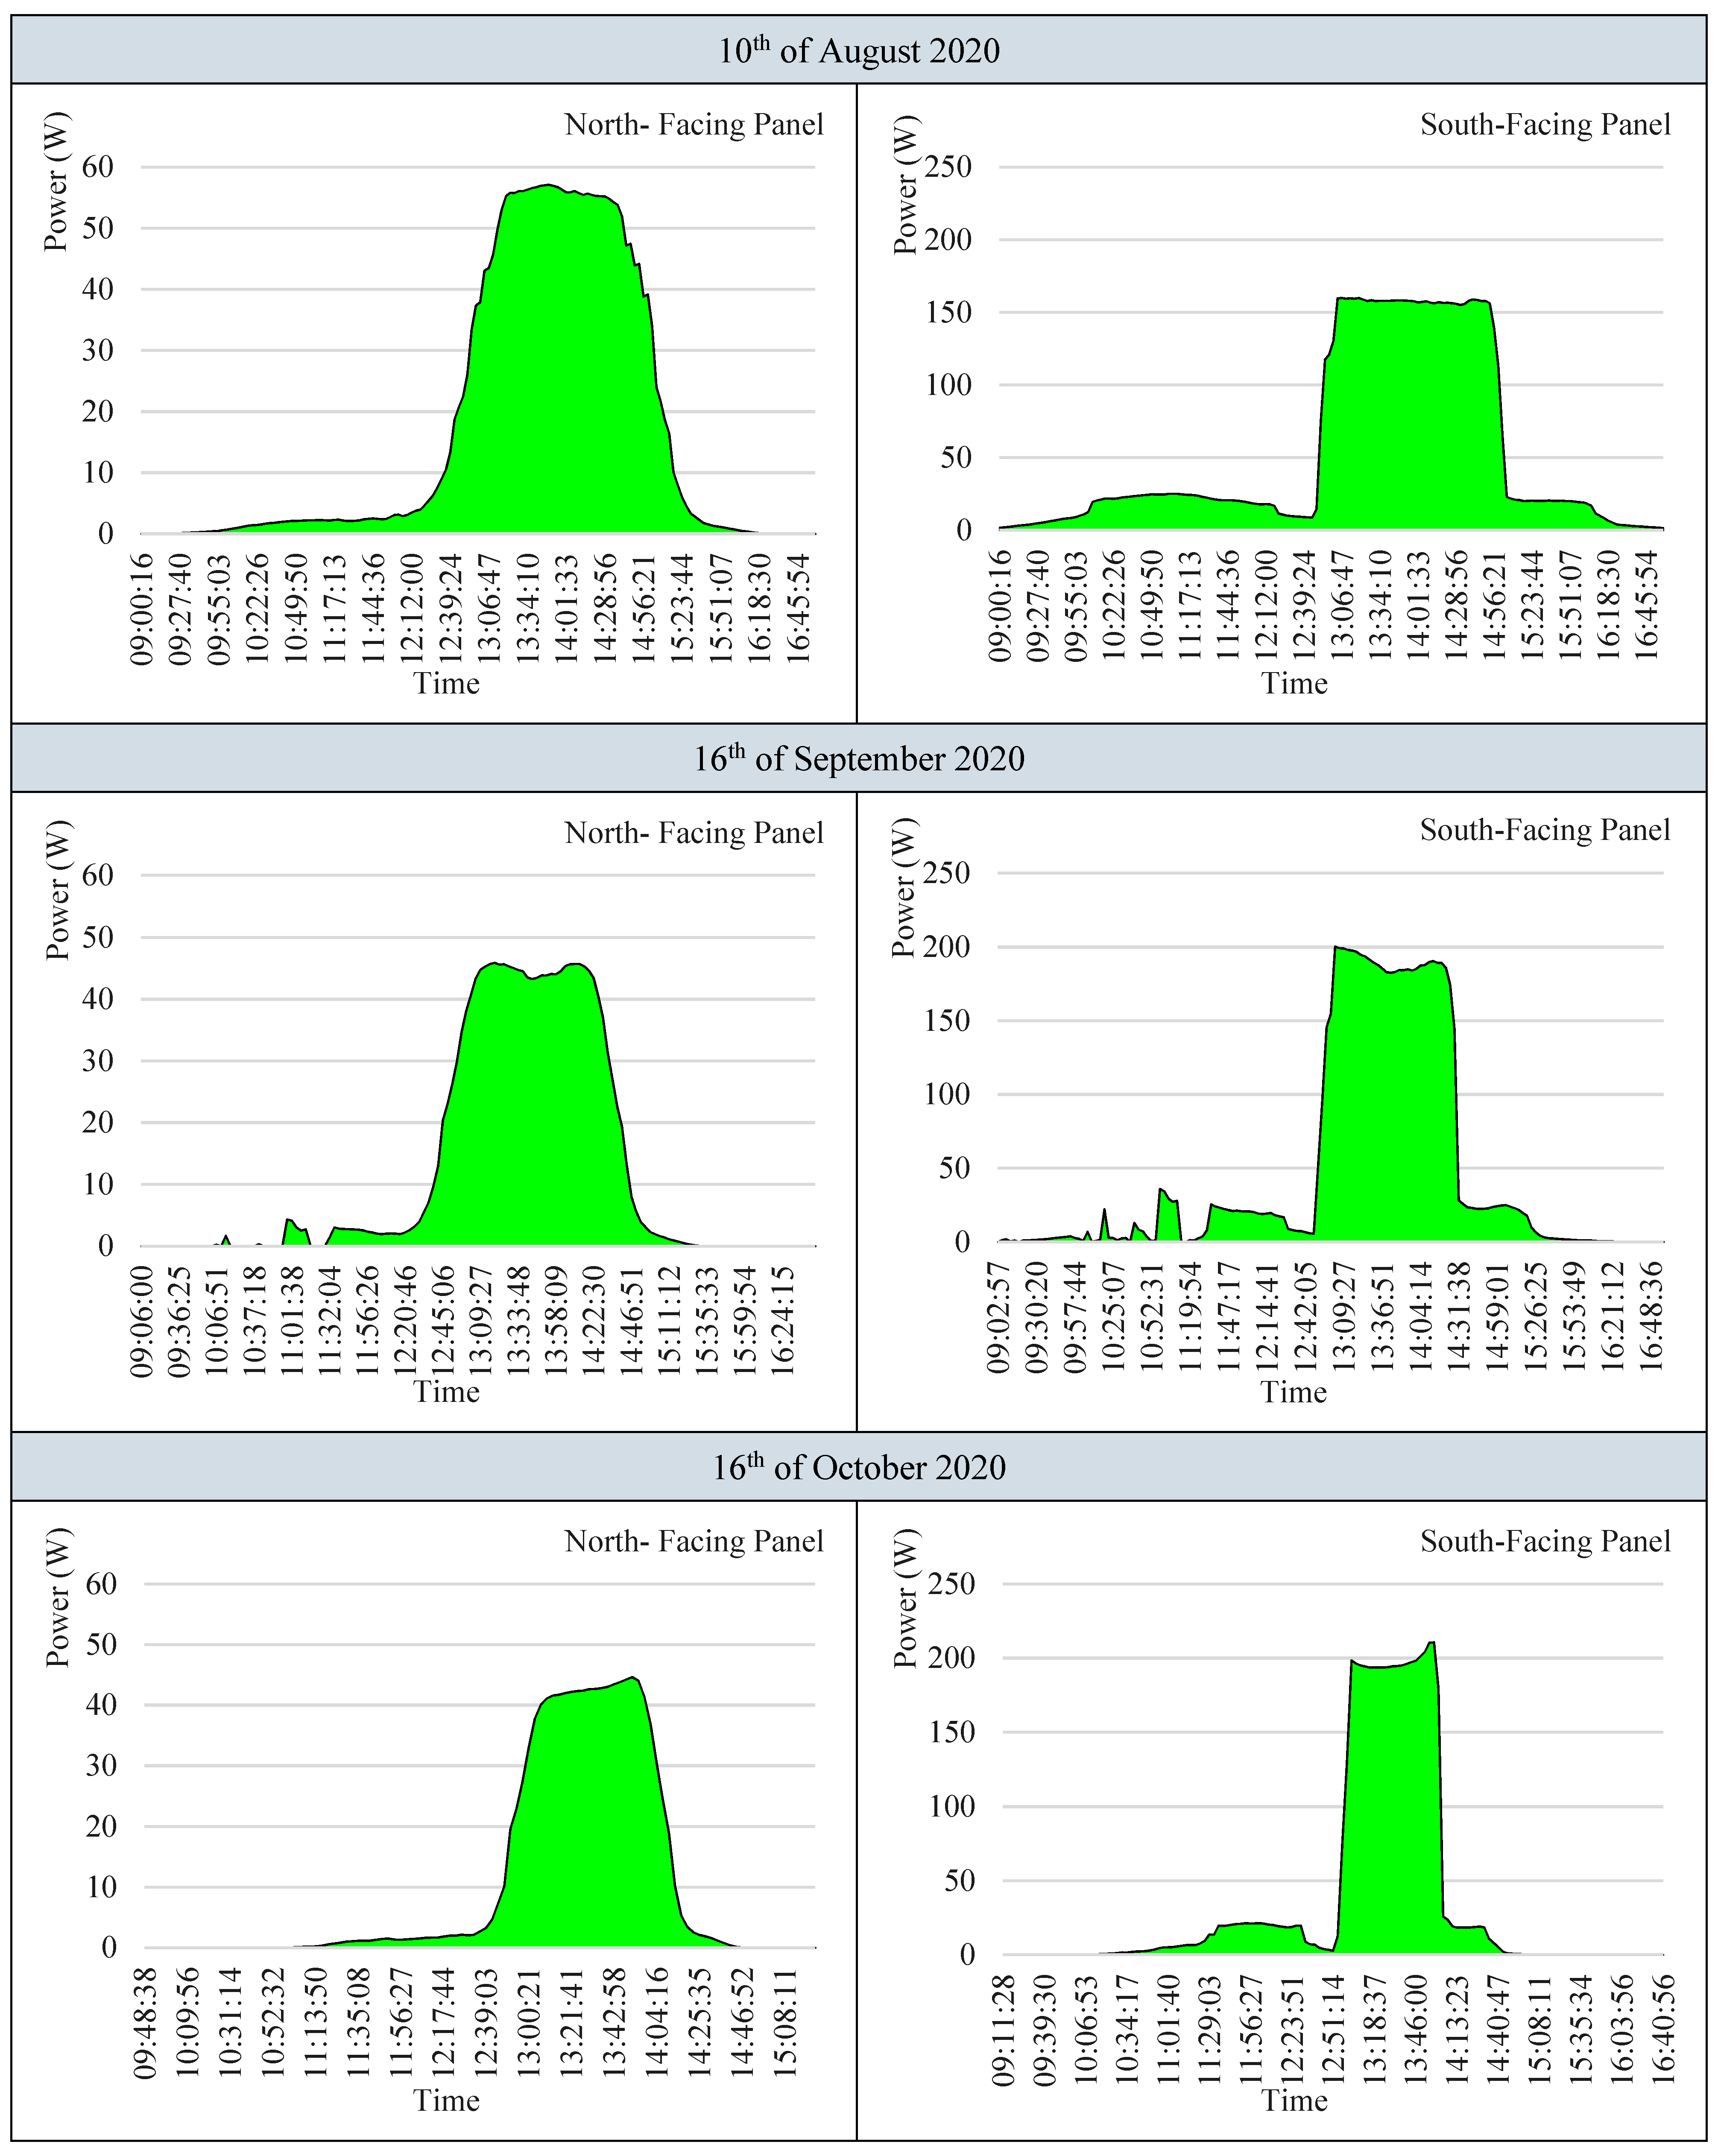
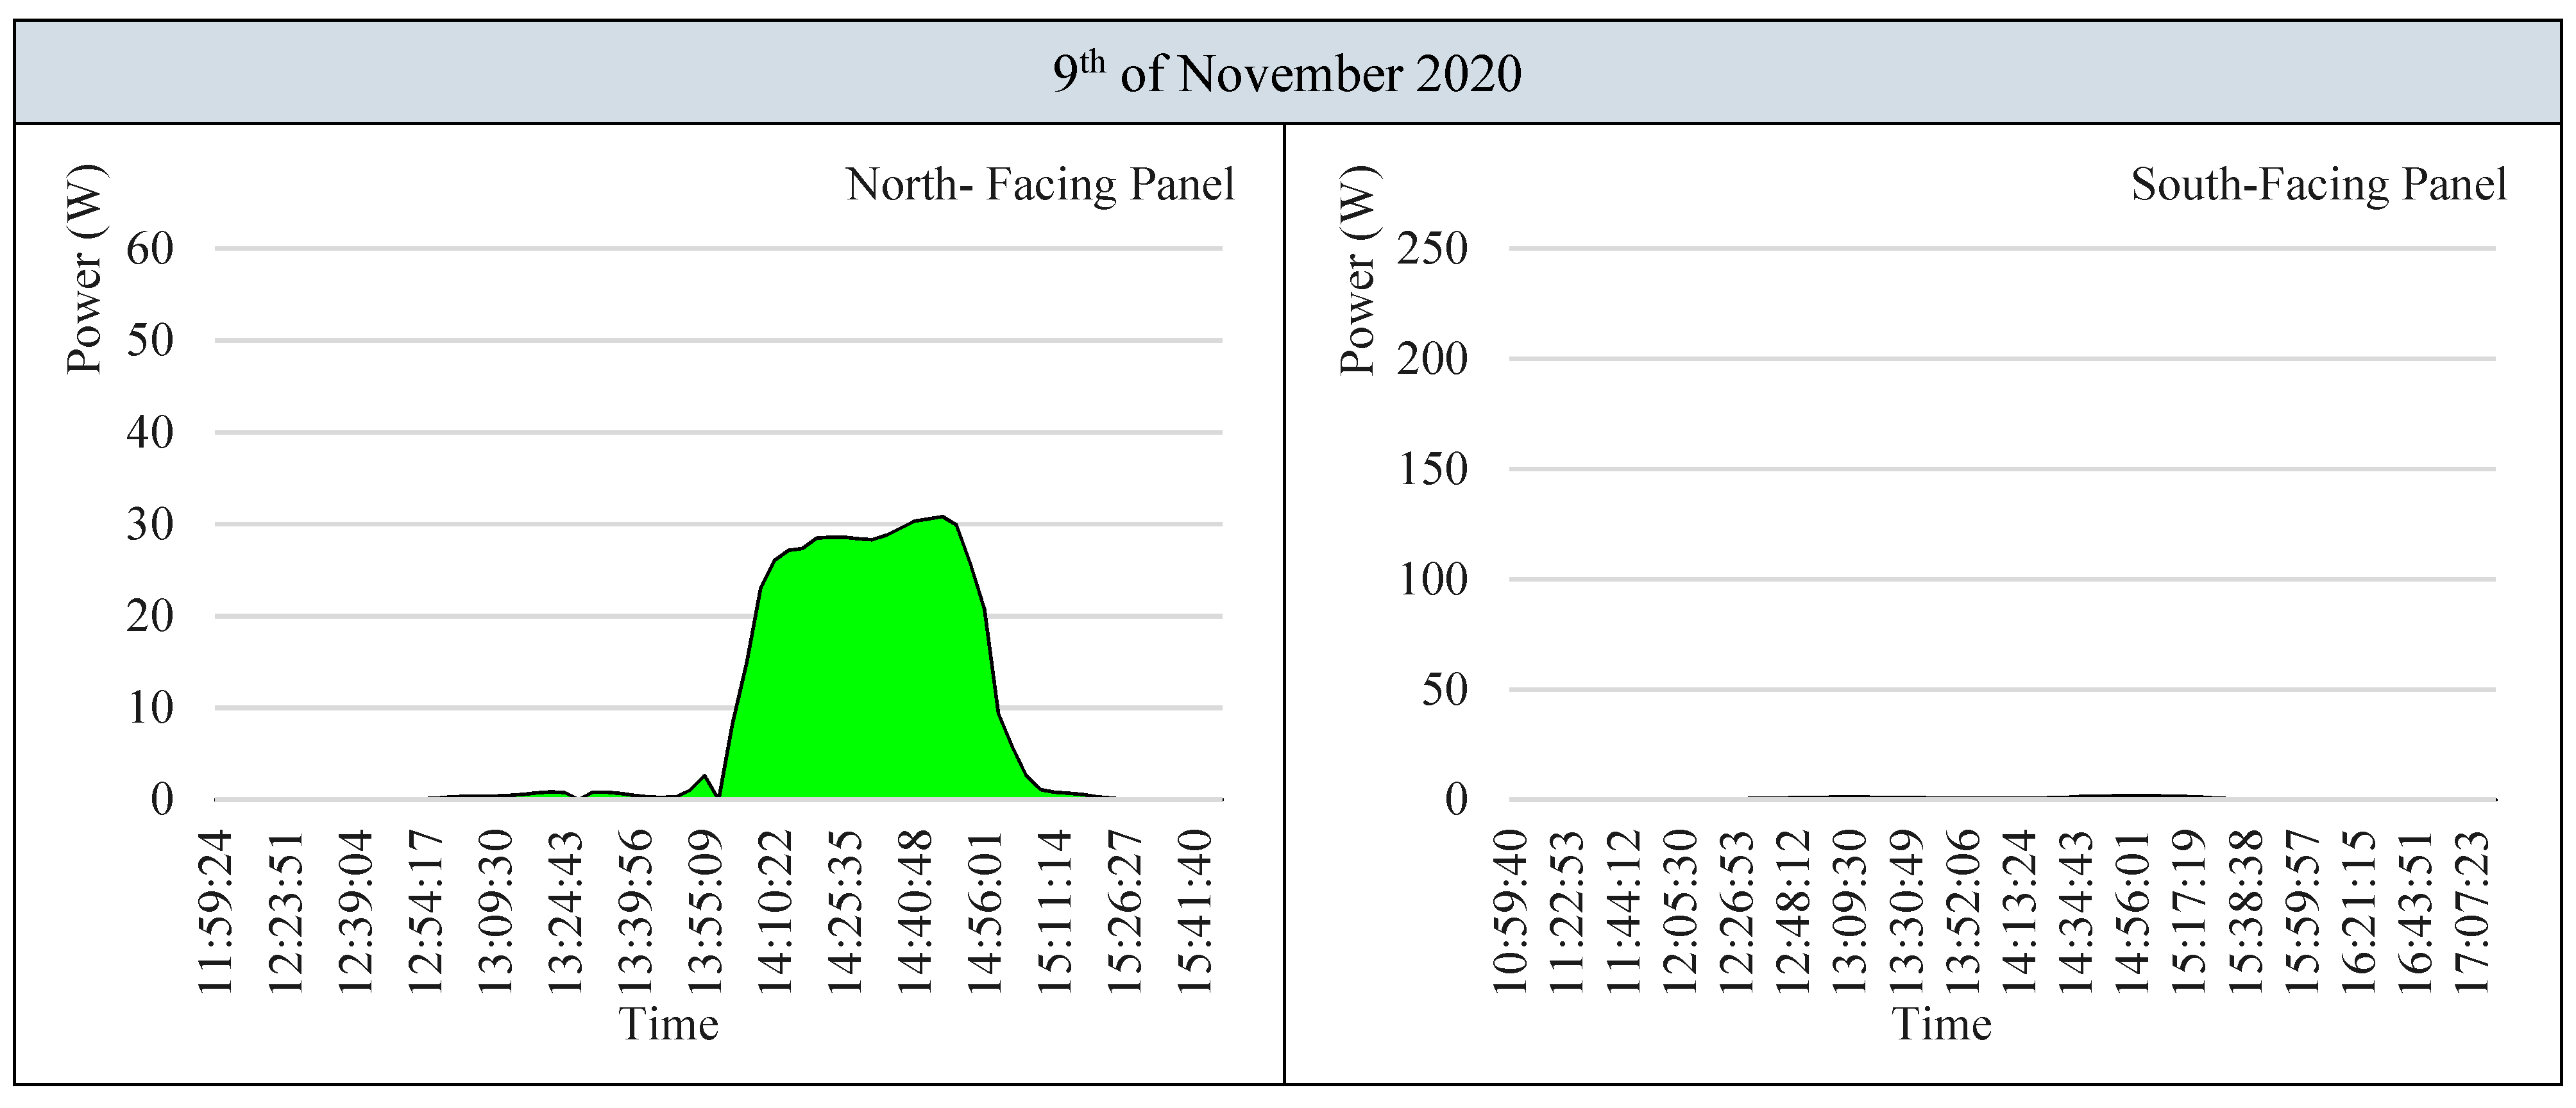
The electricity production of the system is available in the dataset as raw data. EN2020 and ES2020 tabs represent the PV panel’s electricity production in the north and south direction, respectively. Figure 5 illustrates each PV panel’s electricity production during a sunny day of each month from February 2020 to November 2020. The presented data in this figure can also be found in the dataset. The associated data of each day is available in the tab entitled to the investigated date. The selected days of each month are chosen to illustrate the system’s performance and irradiation on the system in different months of the year. When it comes to the ground reflection, it is worth mentioning that there was not any snowfall during the monitoring period. Therefore, the ground reflection was always from a grey cement floor.
The geometry of the location, building and walls around the site resulted in cuts in irradiation and electricity production figures. That is why a 3D model is presented to comprehend the system performance and investigate the boundary conditions better.
As can be seen from the dataset, the total electricity production of the south-facing panel and the north-facing panel is equal to 51.78 and 10.51 kWh, respectively.
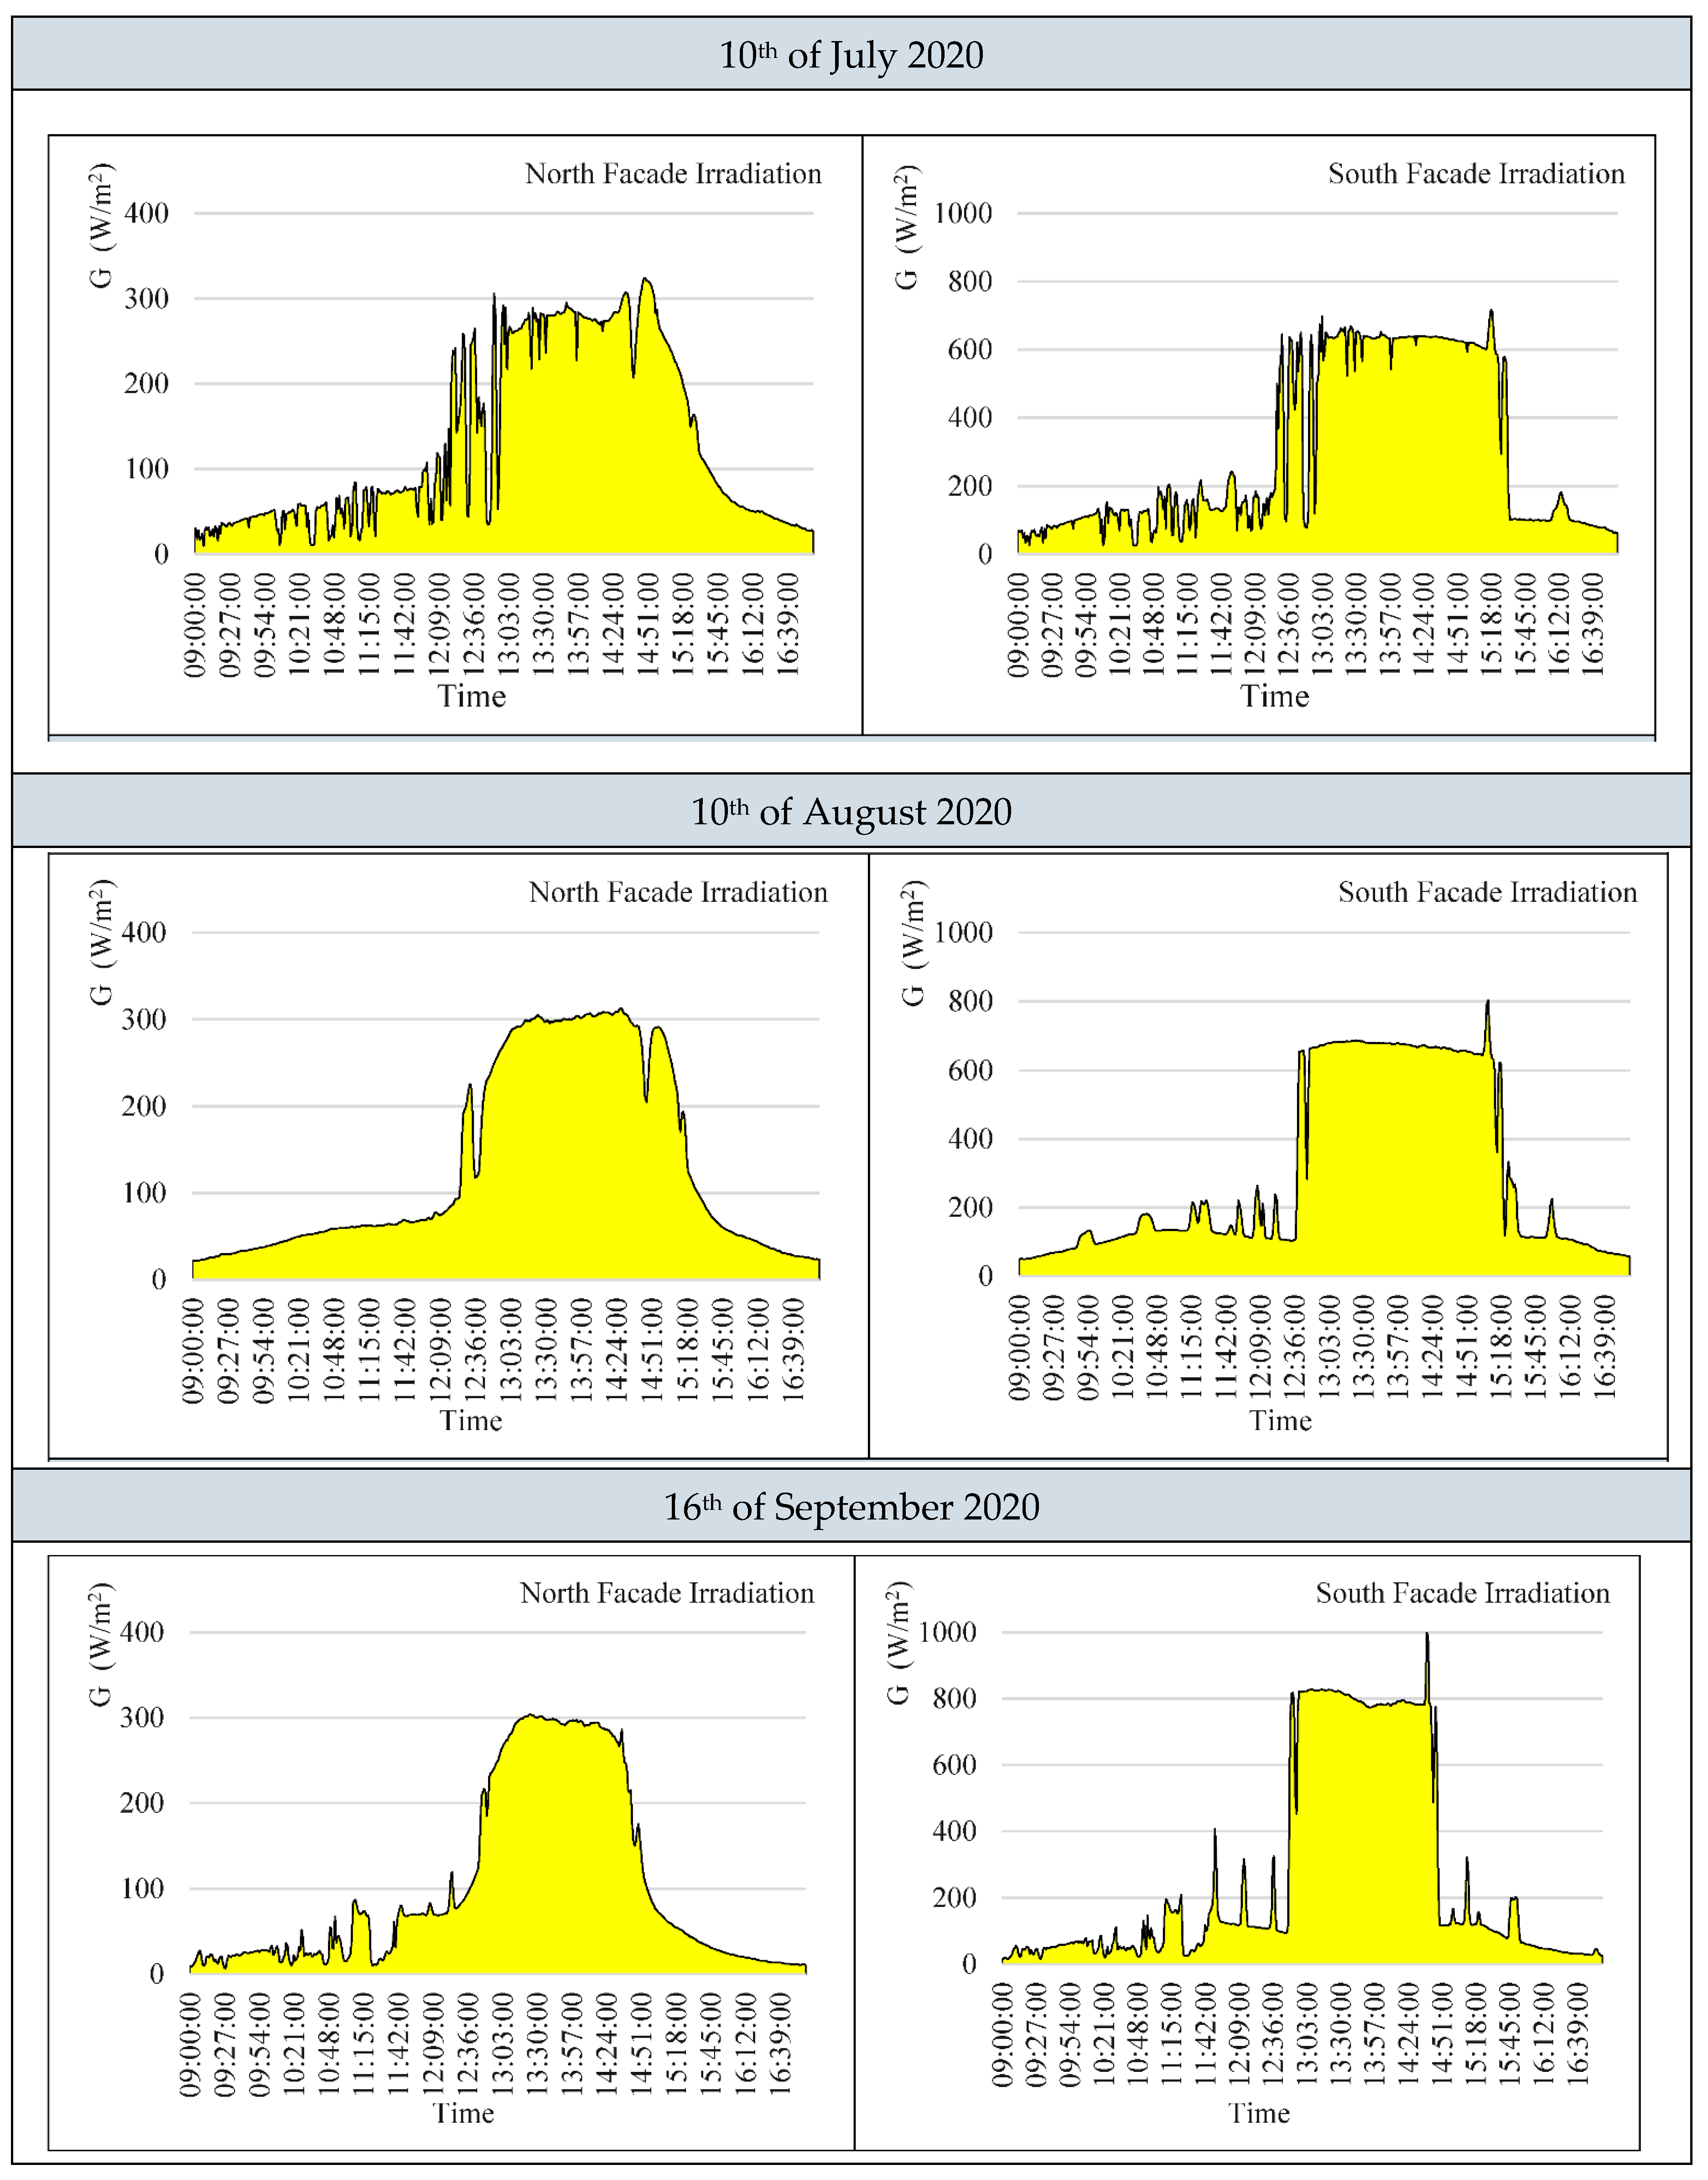
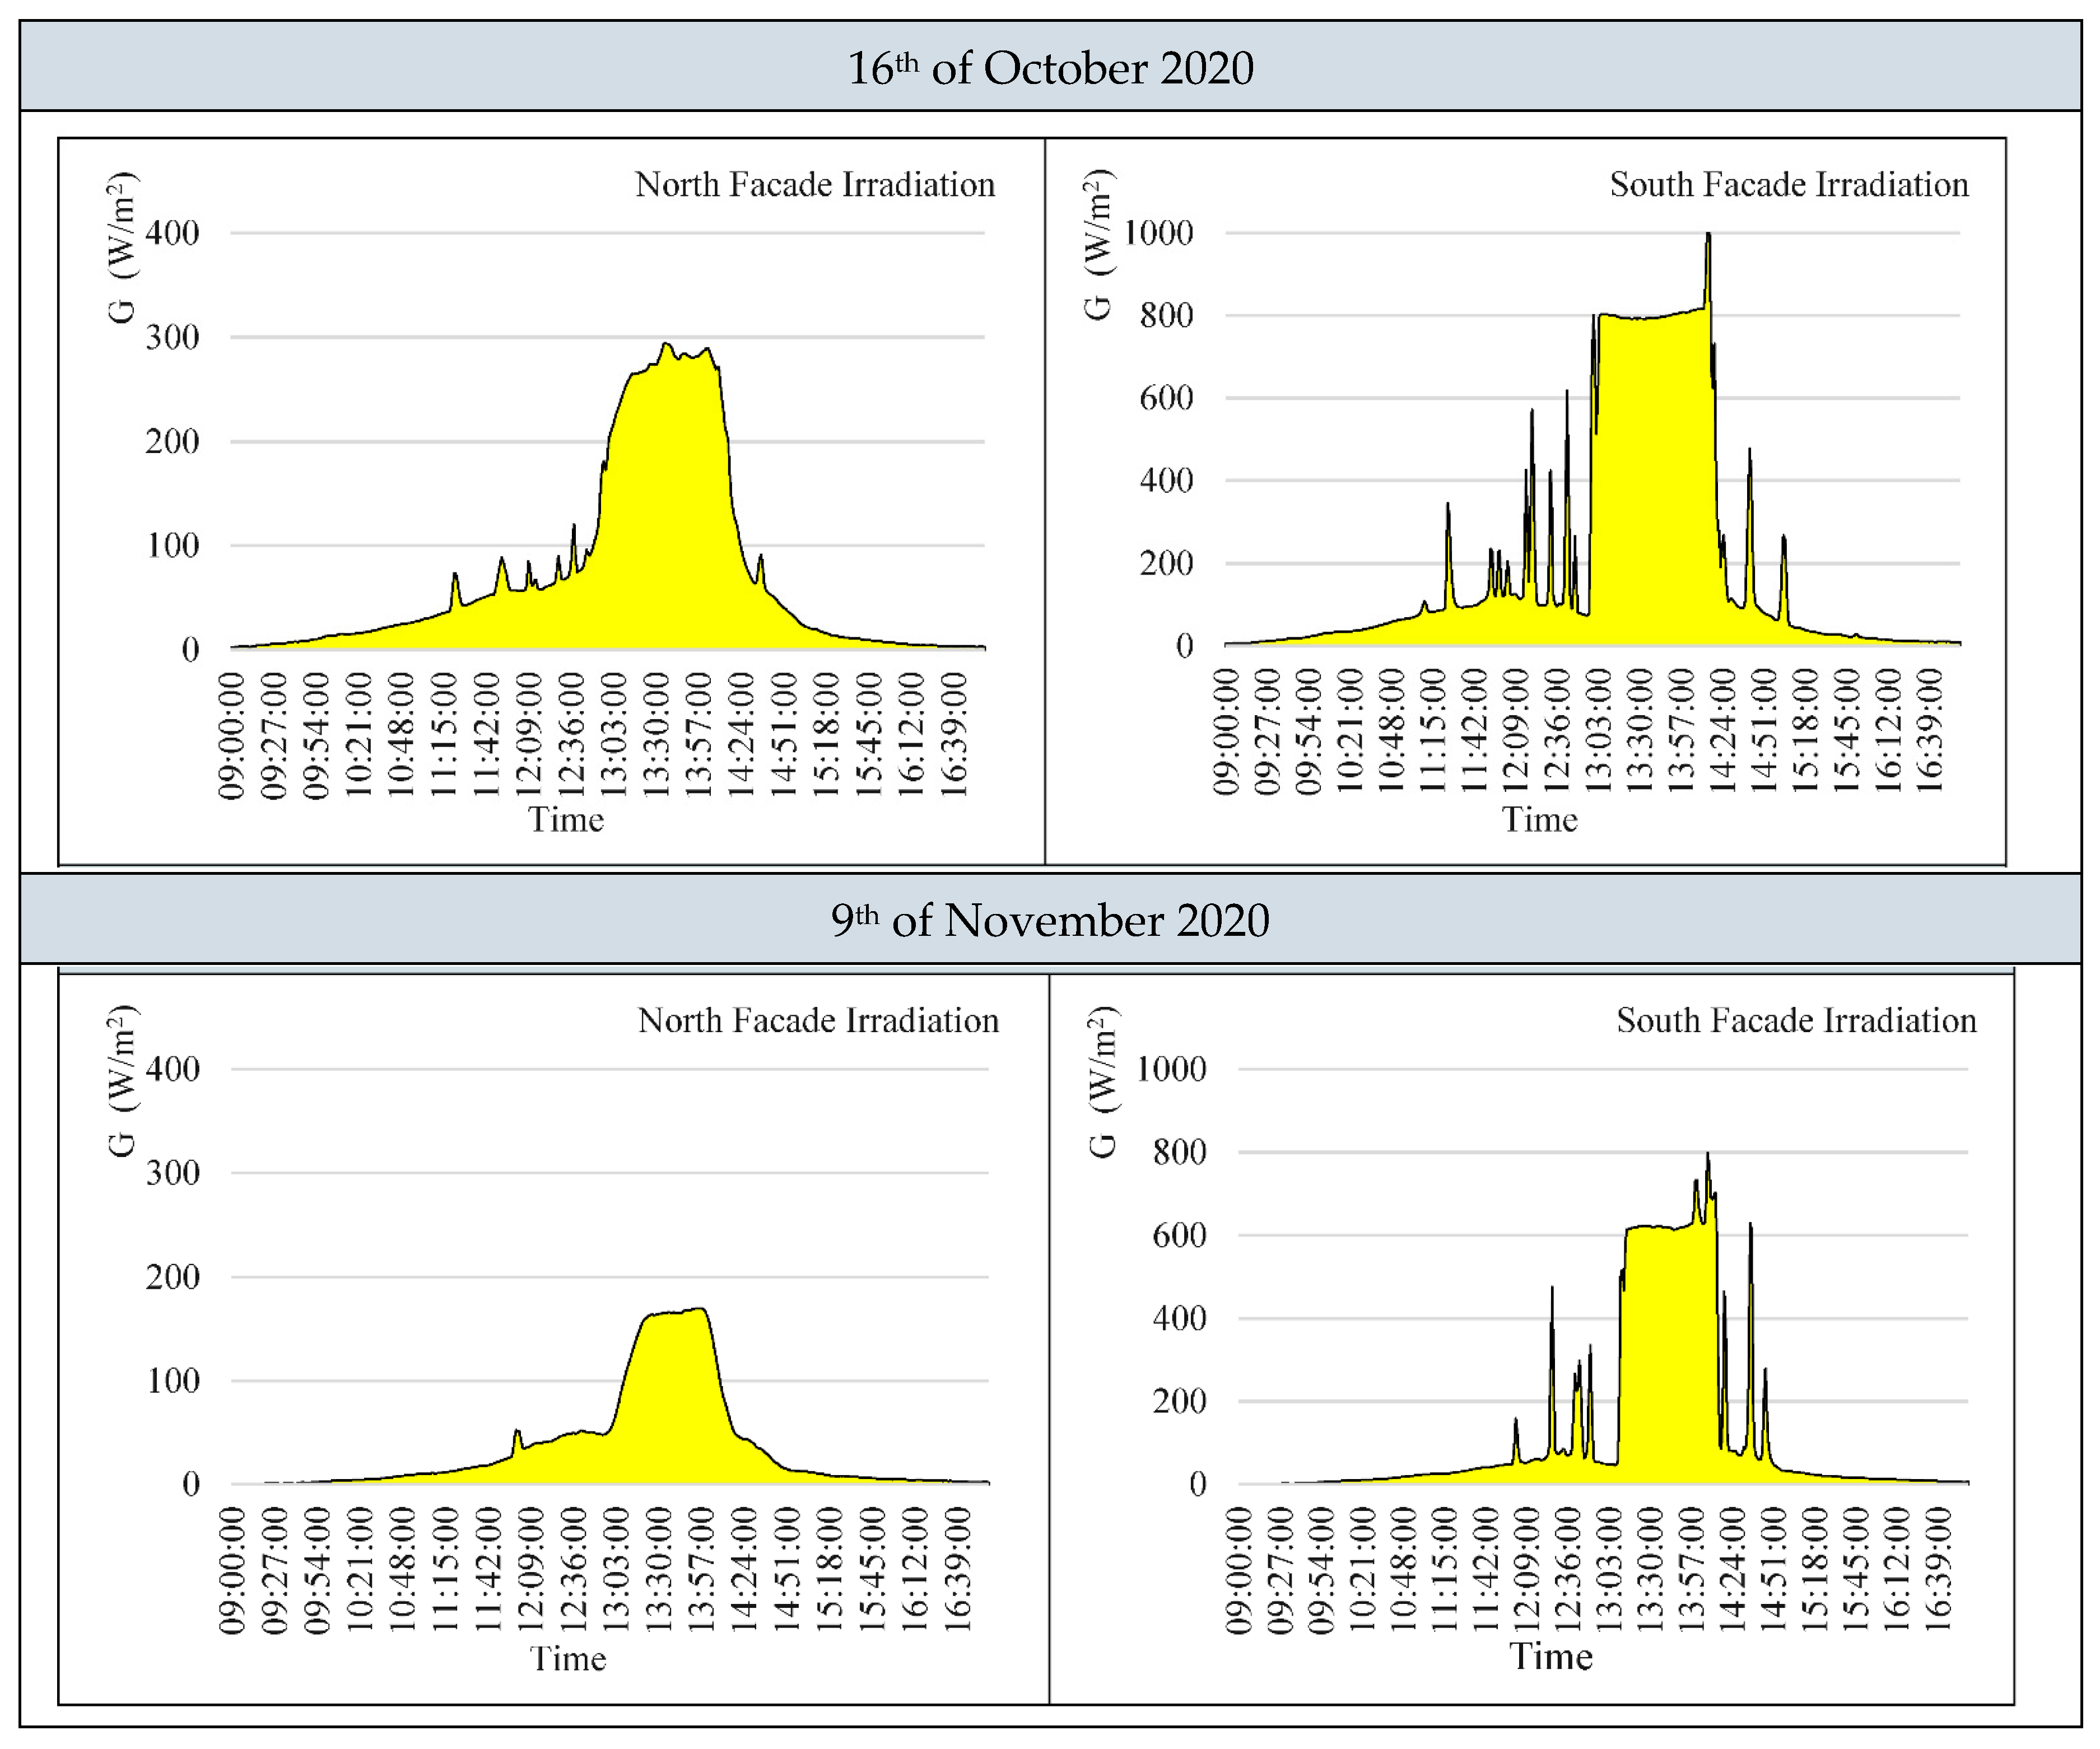
4.2. Solar Radiation
The solar incident radiation on the panels is available in the dataset as well as raw data. GN2020 and GS2020 tabs describe the solar incident radiation on the PV panel in the north and south direction, respectively. Figure 6 shows the solar incident radiation on the PV panels during a sunny day of each month from June 2020 to November 2020. The presented data in this figure can also be found in the dataset. The associated data of each day is available in the tab entitled to the investigated date.
As can be seen from Figure 5 and Figure 6, on 9 November 2020, the generated power for the south-facing panel was zero even though solar incident radiation of over 600 W/m2 was recorded. The reason lies behind the geometry of the site and surrounded objectives. The incident solar radiation hits the very upper part of the south-facing panel, where the pyranometer is installed (because of a very low solar altitude). Since there is no radiation on the remaining area of the south-facing panel (because of shading), the electricity production was zero.
On the other hand, since there was reflected radiation on the entire area of the north-facing panel, it produced electricity.
5. Discussion (Secondary Data)
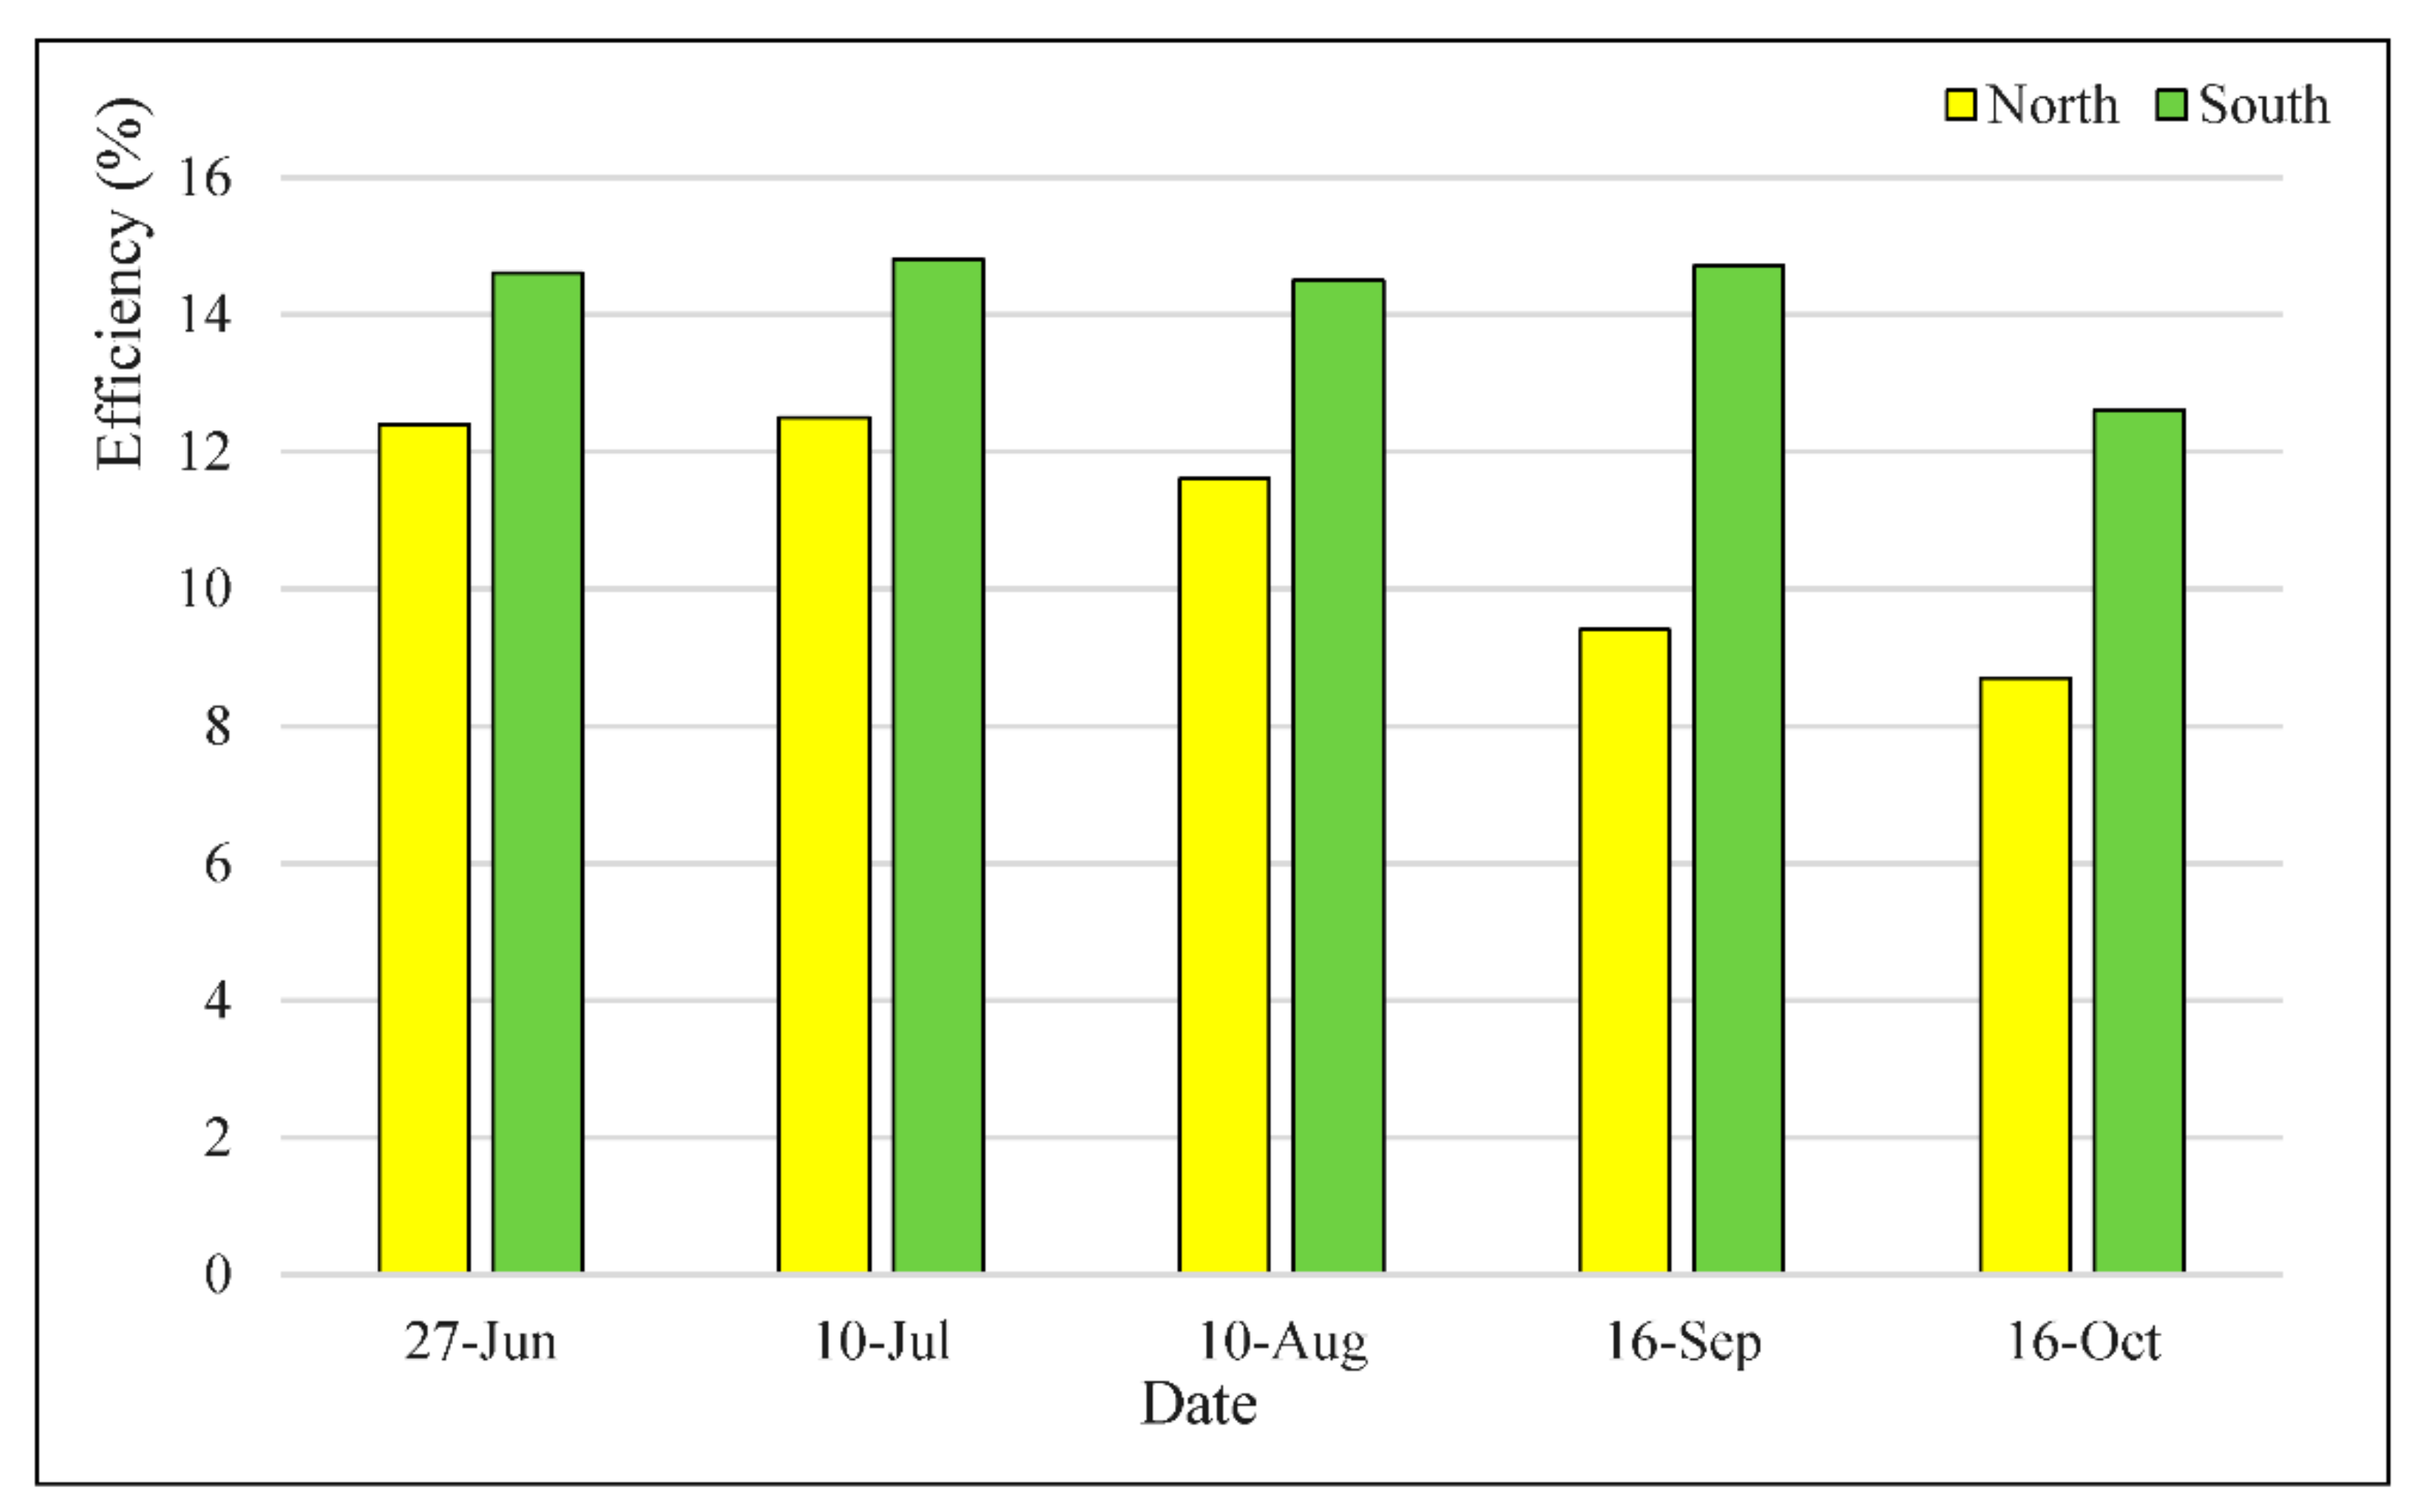
Figure 7 illustrates the PV panels’ average operational efficiency as a secondary source of data on discussed days and while there is no shading on the south-facing panel.
As can be seen from Figure 7, the efficiency of the north façade panel is always more than 2% less than the efficiency of the south façade panel on sunny days. The efficiency of the south-facing panel is between 13% to 15%. However, the efficiency of the north-facing panel is between 8% to 12% (on sunny days of the year). This gap becomes even more significant on cloudy days or overcast days.
The gap can be explained by the spectral response of the silicon-based PV cells to the incident solar radiation and the fact that the main radiation on the south-facing panel is direct radiation. In contrast, the main radiation on the north-facing panel is the reflected and diffuse radiation. That is why the south-facing panel’s efficiency is closer to the standard efficiency of the panel compared to the north-facing panel.
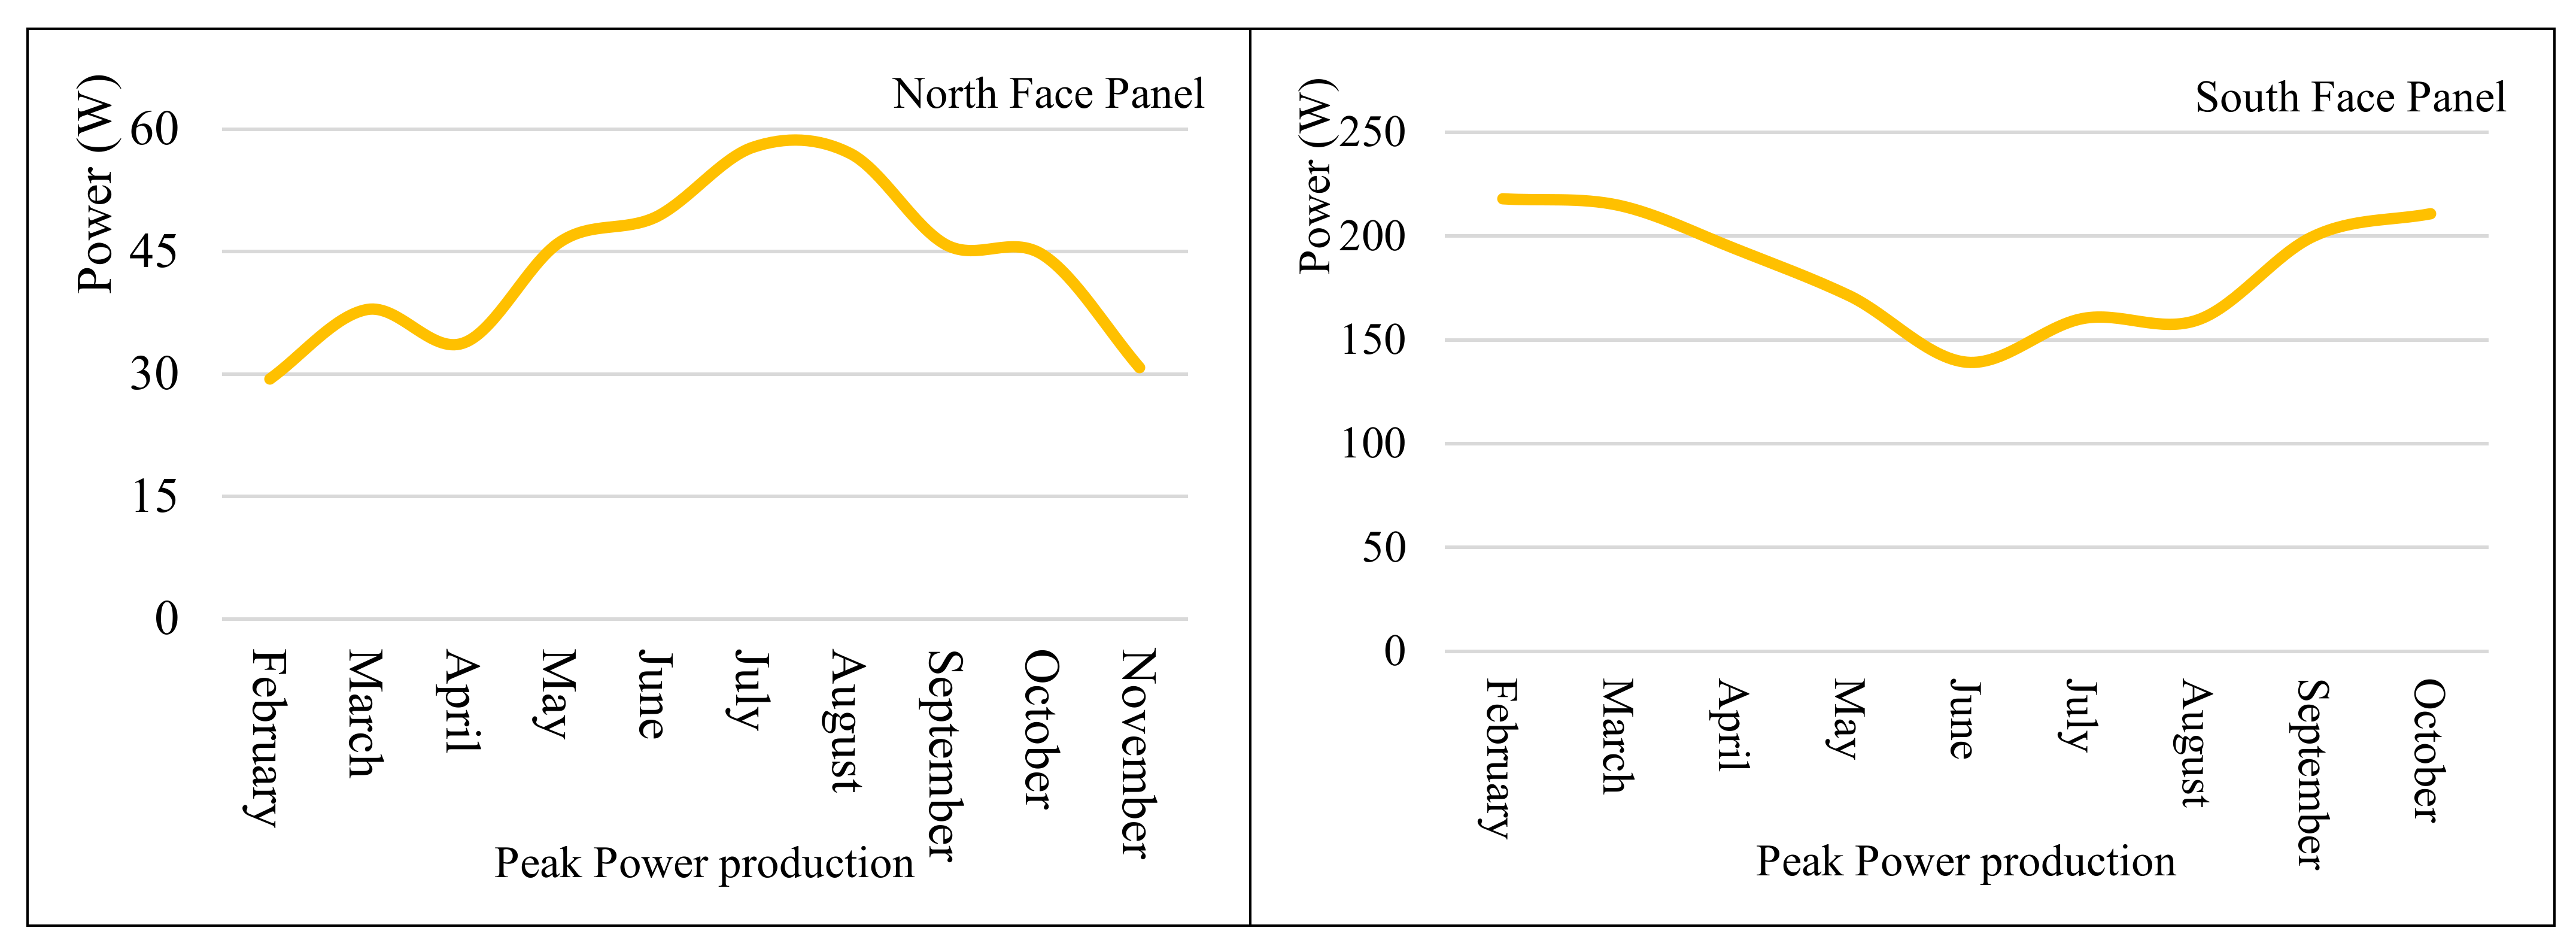
Figure 8 depicts the peak production of each month of panels.
The most interesting observation to emerge from the data comparison in Figure 8 is that the peak power production of the south-facing panel on sunny days in winter is more than its production on sunny days in summer, which is because of two reasons.
The first reason is the angle of solar radiation. In winter, the sun is more inclined towards the horizon and therefore, the solar altitude is smaller. Therefore, the incident radiation to a vertical south-faced panel is close to perpendicular, resulting in higher efficiency.
The second reason is the effect of temperature. The cold weather in winter contributes to a better performance of PV panels.
This also leads to a helpful match between electricity production and consumption in Scandinavian countries. Clear sky days in winter are generally the coldest days in these countries. Therefore, the energy consumption is high exactly when the PV system is producing at maximum power.
From the data in Figure 8, it is also apparent that the production of the north-facing panel follows the opposite trend of the south-facing panel, and its peak power production in summer is more than its peak power production in winter. The reason is the reflected radiation. In summer and because of higher solar altitude, the reflected radiation from the south façade on the north-facing panel is greater. However, in winter and because of the lower solar altitude and boundary condition of the site, the contribution of reflected radiation is less.
6. Conclusions
This project provided an important opportunity to advance the understanding of the performance of vertical BIPV/BAPV panels in urban areas of Scandinavian countries by presenting the performance of polycrystalline silicon PV panels in a dense urban area with the north- and south-facing orientations.
The results showed that the south-facing panel has its best performance in winter, while the north-facing panel presents its best performance in summer. Moreover, the efficiency of the south-facing panel is always more than the efficiency of the north-facing panel (at least 2%).
The findings observed in this study mirror those of our previous study [13] that have examined the effect of climate on the performance of different BIPV materials and technologies. Therefore, the data are a suitable source to compare this technology’s performance with other emerging technologies, such as perovskite and organic solar cells as a building envelope material in cities, and investigate the impact of quality and quantity of solar radiation components on the performance and efficiency of PV panels with different orientations.
Finally, when it comes to the performance of PV systems in urban areas, more analytical work should be conducted to investigate it more in detail in various weather conditions, such as cloudy and overcast skies.
Supplementary Materials
All attached to this paper and described in the paper and available at: https://0-www-mdpi-com.brum.beds.ac.uk/article/10.3390/data6060057/s1.
Author Contributions
Conceptualisation, H.G. and H.N.R.; Data curation, H.G.; Formal analysis, H.G.; Funding acquisition, H.G. and H.N.R.; Investigation, H.G.; Methodology, H.G. and H.N.R.; Project administration, H.G.; Resources, H.G. and H.N.R.; Software, H.G.; Supervision, H.N.R.; Validation, H.G.; Visualisation, H.G.; Writing—original draft, H.G.; Writing—review and editing, H.N.R. All authors have read and agreed to the published version of the manuscript.
Funding
The work reported in this paper was supported by the Department of Safety, Economics, and Planning of the University of Stavanger (Project name: Building Integrated photovoltaic (BIPV) in dense urban areas, Project number: IN-12011).
Institutional Review Board Statement
Not applicable.
Informed Consent Statement
Not applicable.
Data Availability Statement
Available at https://0-doi-org.brum.beds.ac.uk/10.5281/zenodo.4804993, accessed on 26 May 2021.
Acknowledgments
Special thanks goes to the Smart City Group and Future Energy Hub at the University of Stavanger for their support. The auhors would like to offer their gratitude to Steni AS and its Product Director, Ola Harildstad Olsen, for supporting and financing part of the equipment. The authors would also like to thank Trond-Ola Hågbo from the University of Stavanger for providing the 3D model of the site.
Conflicts of Interest
The authors declare that they have no known competing financial interests or personal relationships which have or could be perceived to have influenced the work reported in this article. The funders had no role in the design of the study; in the collection, analyses or interpretation of data; in the writing of the manuscript, or in the decision to publish the results.
References
- Ritchie, H.; Roser, M.; Access to Energy. Our World Data 2019. Available online: https://ourworldindata.org/energy-access (accessed on 26 May 2021).
- Barkaszi, S.; Dunlop, J. Discussion of strategies for mounting photovoltaic arrays on rooftops. Sol. Eng. 2001, 333–338. [Google Scholar] [CrossRef]
- Reddy, K.P.; Gupta, M.; Nundy, S.; Karthick, A.; Ghosh, A. Status of BIPV and BAPV System for Less Energy-Hungry Building in India—A Review. Appl. Sci. 2020, 10, 2337. [Google Scholar] [CrossRef] [Green Version]
- Ghosh, A. Potential of building integrated and attached/applied photovoltaic (BIPV/BAPV) for adaptive less energy-hungry building’s skin: A comprehensive review. J. Clean. Prod. 2020, 276, 123343. [Google Scholar] [CrossRef]
- Kumar, N.M.; Sudhakar, K.; Samykano, M. Performance comparison of BAPV and BIPV systems with c-Si, CIS and CdTe photovoltaic technologies under tropical weather conditions. Case Stud. Therm. Eng. 2019, 13, 100374. [Google Scholar] [CrossRef]
- Imenes, A.G. Performance of BIPV and BAPV installations in Norway. In Proceedings of the 2016 IEEE 43rd Photovoltaic Specialists Conference (PVSC), Portland, OR, USA, 5–10 June 2016; pp. 3147–3152. [Google Scholar]
- Wang, W.; Liu, Y.; Wu, X.; Xu, Y.; Yu, W.; Zhao, C.; Zhong, Y. Environmental assessments and economic performance of BAPV and BIPV systems in Shanghai. Energy Build. 2016, 130, 98–106. [Google Scholar] [CrossRef]
- Desi Luvita, N.R.; Mohammad Kholid, R.; Budiarto, R.O. A scenario of BAPV and BIPV system for long-term projection energy demand in YogyakartaProceedings of the American Institute of Physics Conference Series. AIP Conf. Proc. 2019, 2097, 030090. [Google Scholar]
- Gholami, H.; Nils Røstvik, H.; Manoj Kumar, N.; Chopra, S.S. Lifecycle cost analysis (LCCA) of tailor-made building integrated photovoltaics (BIPV) façade: Solsmaragden case study in Norway. Sol. Energy 2020, 211, 488–502. [Google Scholar] [CrossRef]
- Gholami, H.; Røstvik, H.N. Economic analysis of BIPV systems as a building envelope material for building skins in Europe. Energy 2020, 204, 117931. [Google Scholar] [CrossRef]
- Gholami, H.; Røstvik, H.N.; Müller-Eie, D. Holistic economic analysis of building integrated photovoltaics (BIPV) system: Case studies evaluation. Energy Build. 2019, 203, 109461. [Google Scholar] [CrossRef]
- Gholami, H.; Nils Røstvik, H. Levelised Cost of Electricity (LCOE) of Building Integrated Photovoltaics (BIPV) in Europe, Rational Feed-In Tariffs and Subsidies. Energies 2021, 14, 2531. [Google Scholar] [CrossRef]
- Gholami, H.; Nils Røstvik, H. The Effect of Climate on the Solar Radiation Components on Building Skins and Building Integrated Photovoltaics (BIPV) Materials. Energies 2021, 14, 1847. [Google Scholar] [CrossRef]
- Esmailian, E.; Gholami, H.; Røstvik, H.N.; Menhaj, M.B. A novel method for optimal performance of ships by simultaneous optimisation of hull-propulsion-BIPV systems. Energy Convers. Manag. 2019, 197, 111879. [Google Scholar] [CrossRef]
- Saretta, E.; Caputo, P.; Frontini, F. A review study about energy renovation of building facades with BIPV in urban environment. Sustain. Cities Soc. 2018, 44, 343–355. [Google Scholar] [CrossRef]
- Biyik, E.; Araz, M.; Hepbasli, A.; Shahrestani, M.; Yao, R.; Shao, L.; Essah, E.; Oliveira, A.C.; del Caño, T.; Rico, E. A key review of building integrated photovoltaic (BIPV) systems. Eng. Sci. Technol. Int. J. 2017, 20, 833–858. [Google Scholar] [CrossRef]
- Groppi, D.; de Santoli, L.; Cumo, F.; Garcia, D.A. A GIS-based model to assess buildings energy consumption and usable solar energy potential in urban areas. Sustain. Cities Soc. 2018, 40, 546–558. [Google Scholar] [CrossRef]
- Gholami, H.H.N.; Røstvik Müller-Eie, D. Analysis of solar radiation components on building skins for selected cities. In Proceedings of the 14th Conference on Advanced Building Skins, Bern, Switzerland, 28–29 October 2019; pp. 541–549. [Google Scholar]
Figure 1.
A picture of the site with components.


Figure 2.
The implementation phase of PV panels in front of glass cladding.

Figure 3.
The panel cladding installation phase.

Figure 4.
Implementation of irradiation measuring equipment.

Figure 5.
Electricity production of each PV panel on a sunny day of each month (February–November).


Figure 6.
Solar incident radiation on each PV panel on a sunny day of each month (June–November).


Figure 7.
The average efficiency of the PV panels in a clear sky condition.

Figure 8.
Recorded peak power production of each panel during the monitoring time.


Table 1.
Specifications table of the data.
| Subject | Renewable Energy, Sustainability and the Environment |
|---|---|
| Specific subject area | BAPV/BIPV potential in urban areas Solar energy in compact urban blocks BAPV/BIPV efficiency in different orientations of building skin BAPV/BIPV panels’ performance on north/south façades |
| Type of data | Table Image Figure |
| How data were acquired | Data are measured, monitored and logged by the equipment as follows: Two sets of SR30 sun[e] Pyranometer “ISO Secondary Standard”+ met[log] data logger Two sets of EVT300 microinverters with an EVB202 data logger |
| Data format | Raw time series data in csv format. The data are available with a sample resolution of a minute. |
| Parameters for data collection | Incident solar radiation and BIPV electricity production were collected at the site. |
| Description of data collection | Incident solar radiation data are logged with a minute sample resolution as raw data. PV electricity production and temperature data are logged with a sample resolution of three minutes as raw data. System efficiency is calculated, and the data are processed using Microsoft Excel as secondary data. |
| Data source location | Institution: University of Stavanger City/Town/Region: Stavanger Country: Norway Latitude and longitude for collected data: 58.9380454722466° N, 5.692057201993845° E |
| Data accessibility | With the article |
Table 2.
List of system components.
| Item | Schematic |
|---|---|
| TP660P Talesun 275 Wp panel Quantity: 2 |  |
| EVT300 Microinverters Quantity: 2 |  |
| EVB202 Data logger Quantity: 1 |  |
| SR30 Sun[e] Pyranometer Quantity: 2 |  |
| Met[log] data logger Quantity: 2 |  |
| Power[cube] 150W Quantity: 2 |  |
Publisher’s Note: MDPI stays neutral with regard to jurisdictional claims in published maps and institutional affiliations. |
© 2021 by the authors. Licensee MDPI, Basel, Switzerland. This article is an open access article distributed under the terms and conditions of the Creative Commons Attribution (CC BY) license (https://creativecommons.org/licenses/by/4.0/).
Share and Cite
MDPI and ACS Style
Gholami, H.; Nils Røstvik, H. Dataset for the Solar Incident Radiation and Electricity Production BIPV/BAPV System on the Northern/Southern Façade in Dense Urban Areas. Data 2021, 6, 57. https://0-doi-org.brum.beds.ac.uk/10.3390/data6060057
AMA Style
Gholami H, Nils Røstvik H. Dataset for the Solar Incident Radiation and Electricity Production BIPV/BAPV System on the Northern/Southern Façade in Dense Urban Areas. Data. 2021; 6(6):57. https://0-doi-org.brum.beds.ac.uk/10.3390/data6060057
Chicago/Turabian StyleGholami, Hassan, and Harald Nils Røstvik. 2021. "Dataset for the Solar Incident Radiation and Electricity Production BIPV/BAPV System on the Northern/Southern Façade in Dense Urban Areas" Data 6, no. 6: 57. https://0-doi-org.brum.beds.ac.uk/10.3390/data6060057