
Hydropower & HDI Nexus in Nordic Countries Using VAR Techniques

1
Department of Accounting, College of Business Administration, King Faisal University, Al-Ahsa 31982, Saudi Arabia
2
Department of Accounting, Faculty of Commerce, Assiut University, Assiut 71515, Egypt
3
Economics Department, Faculty of Management Sciences, October University of Modern Arts and Sciences, 6th October City 12451, Egypt
*
Author to whom correspondence should be addressed.
Economies 2024, 12(3), 60; https://0-doi-org.brum.beds.ac.uk/10.3390/economies12030060
Submission received: 27 December 2023
/
Revised: 10 February 2024
/
Accepted: 20 February 2024
/
Published: 1 March 2024
(This article belongs to the Special Issue Economics of Energy Market)
Abstract
:Although the movement of people from rural to urban areas has caused the increased use of energy, the abundance of water resources can be made into a form of renewable energy known as hydroelectricity. As European countries are ranked as the first users and exporters of hydropower, the production of renewable energy in developed countries such as the Nordic region has caused great impacts on economic growth and human development. The importance of this paper is to investigate the relationship between hydroelectricity and the Human Development Index by depending on some variables such as urbanization, rule of law, corruption, trade openness, and GDP per capita from 2002 to 2021 in Nordic countries. The results were estimated depending on impulse response function after conducting the Vector autoregressive model (VAR) model and Granger causality test. Results showed a negative impact from hydro plants in the short run but a significant positive impact in the long run in Nordic countries. The long-term sustainment of Human Development Index (HDI) is due to policies limiting the immigration of labor as well as protection of energy use. Water batteries are gaining popularity across Europe and their implementation is near mandatory.
1. Introduction
Urbanization has been the core reason for the unequivocal shift of production in all sectors of the economy. Moving across countries, from farmlands, has cost and benefited economies worldwide. Trade is one of the many factors that push toward globalization. Thus, countries have taken advantage of their geographical position to strengthen their comparative advantage. Moreover, as scarcity is inevitable, the costs have soon exceeded the benefits of urban life. One of the main blocks that sustain urban life is energy (Jones 1989). It is not possible to preserve fossil fuels let alone produce them. The fossil fuel energy will be depleted over time and the world will suffer from the lack of energy. Many pieces of literature examined the drawbacks of the use of this kind of fuel, as it can decrease the rates of economic growth over the long run (Martins et al. 2019) and increase sulfur dioxide emissions, in addition to carbon dioxide emissions (Ahmad and Zhao 2018; Vo et al. 2019). Therefore, the demand for renewable sources of energy is at an all-time high. Renewable sources can be extracted from all forms of natural earth resources. Countries are trying to acquire such technological progress that allows them to govern power for their daily activities.
Renewable energy contributes to all activities surrounding us but the main activity that humans and government look at is electricity. Electricity is considered as an indicator to measure the poverty of individuals. International energy agency (IEA) recognized the consumption of electricity as an indicator in measuring energy poverty as the absolute poverty countered at 100 Gwh per annum and 300 Gwh per annum to satisfy the basic access and 1500 Gwh per annum (IEA 2023). As there are many types of renewable energy resources, hydropower comes to cope with the claims of climate change and how to use them on a wide range. The main types of renewable energy are wind (generated by wind turbines), solar (nuclear infusion by the sun), geothermal (heat energy produced by the planet), hydro (dams altering the natural flow of water), and bioenergy (recycling of living organisms). Additionally, renewable energy extraction has impacted many developed and developing countries in terms of human development. Renewable energy will increase the productivity of the countries without causing negative impacts on human health or the surrounding environment. The impact of the shift in energy sources has caused a tremendous impact on the fluctuations in the standard of living, quality of life, and gross production.
Hydropower has become a crucial source of energy in northern Europe. Furthermore, Nordic countries have replenished their economy after the financial and oil crisis by the enormous production of hydropower over the past decades (Tellefsen et al. 2020). Yet, hydroelectricity dams have not contributed to human development in Nordic countries but in fact caused unforeseen damage for some time. Clearly, there is an impact from hydroelectricity production on the standard of living and GDP (Ohler and Fetters 2014).
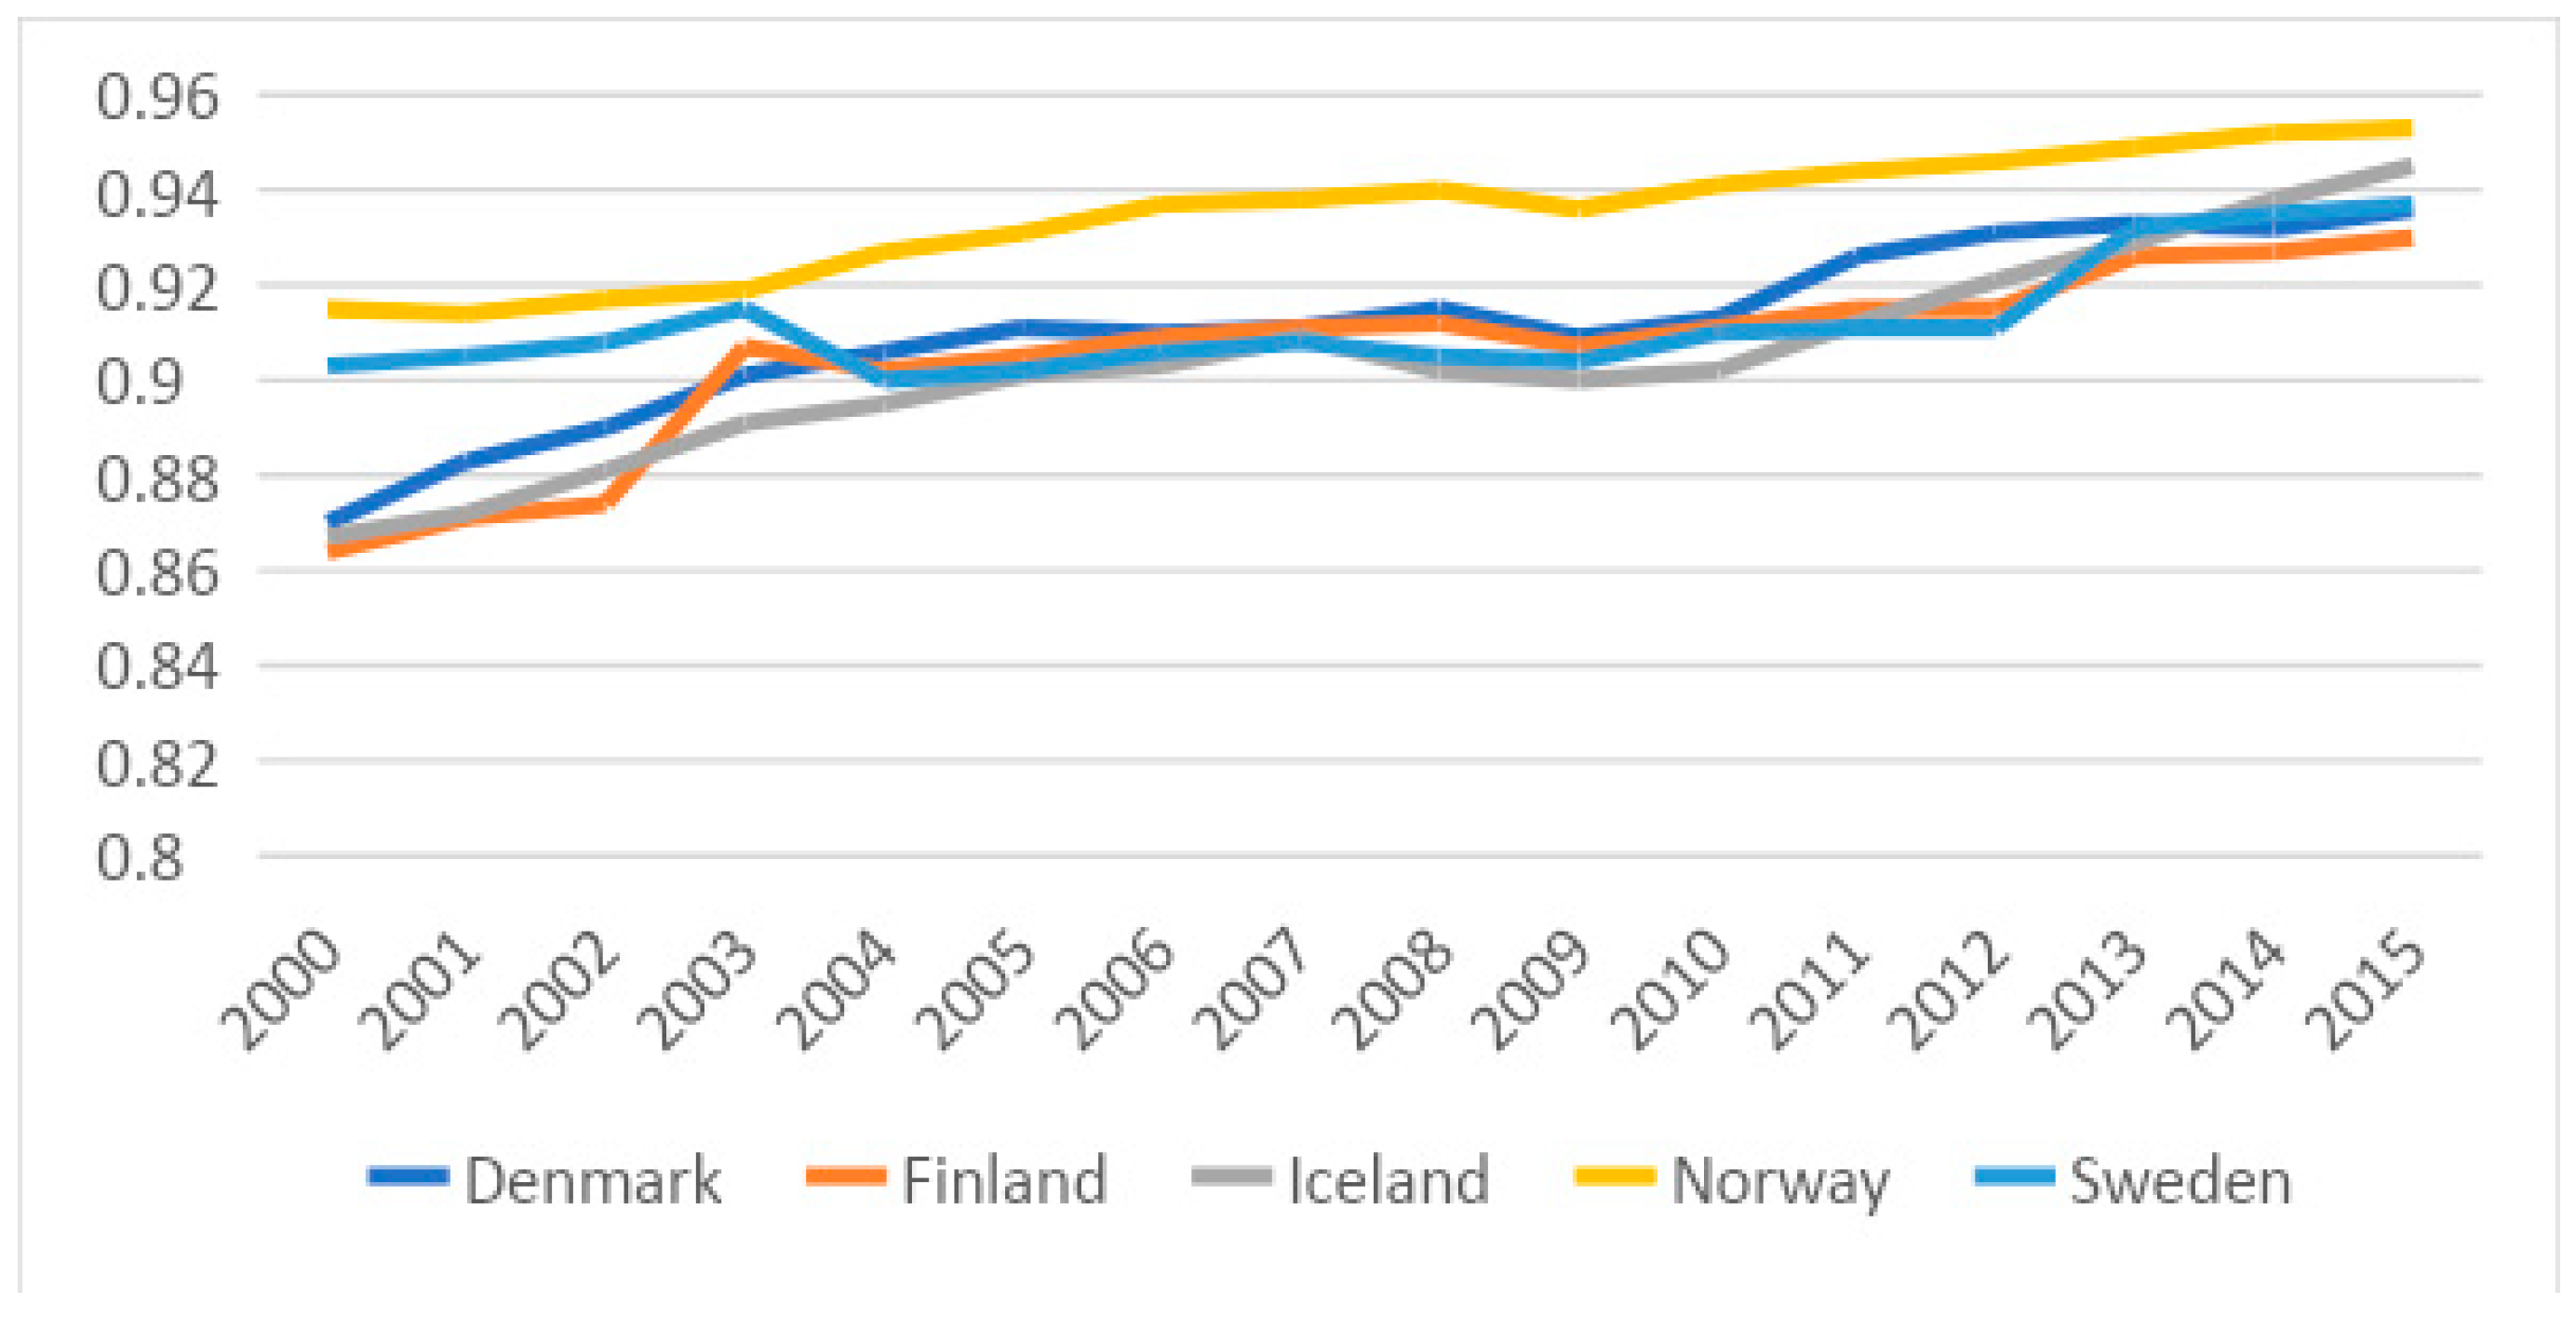
Growth rates were remarkable during the first few years of the use of hydropower in Europe. Specifically, hydropower was heavily dominated by Nordic countries a century ago. Additionally, the past decades have been used in extensive research and development to ensure technological progress to ease renewable energy extraction (Vik and Smith 2009). Therefore, the main explanatory variable is electricity production from hydroelectric sources (%) on the Human Development Index. The Human Development Index (HDI) is a composite measure that determines the level of well-being in a country. The three dimensions of the Human Development Index are ealth, knowledge, and standard of living measured by an equal weighted average (UNDP 2024). To achieve better economic development, there should be more mindfulness when sustaining scarce resources. Sustainability, as a goal, can be achieved through efficient allocation of resources and control over environmental factors (Costantini and Monni 2005). The top 15 list includes Nordic countries at the top. Norway’s HDI has risen by 6.6% reaching 0.936 in 2015. Furthermore, Norway is a mixed economy heavily depending on its private sector; thus, allowing more labor participation rate and equal distribution of income. Additionally, the surplus in the trade of oil has led to increased public funding of educational and healthcare systems (Ozturk and Suluk 2020). From 2002 to 2004, Finland experienced extreme fluctuations in HDI. The rapid increase from 0.874 to 0.907 and the slight decrease to 0.902 was caused by the focus on the management of four natural resources (water, land, forest, and environment) as shown in Figure 1. Additionally, Finland has offered Official Development Assistance (ODA) to Vietnam; therefore, increasing welfare and foreign direct investment. Denmark and Sweden’s freedom from poverty policy allows for enhancement in human welfare and equality among citizens. However, there are fluctuations in their HDI due to increased income gaps between immigrants and citizens (Blume et al. 2007). In the case of Iceland, the urban population grew rapidly after 2008. Consequently, urbanization increased in Iceland due to government policy on housing prices. Therefore, low-income families were able to cover rental costs and move from rural to urban areas, thus increasing employment.
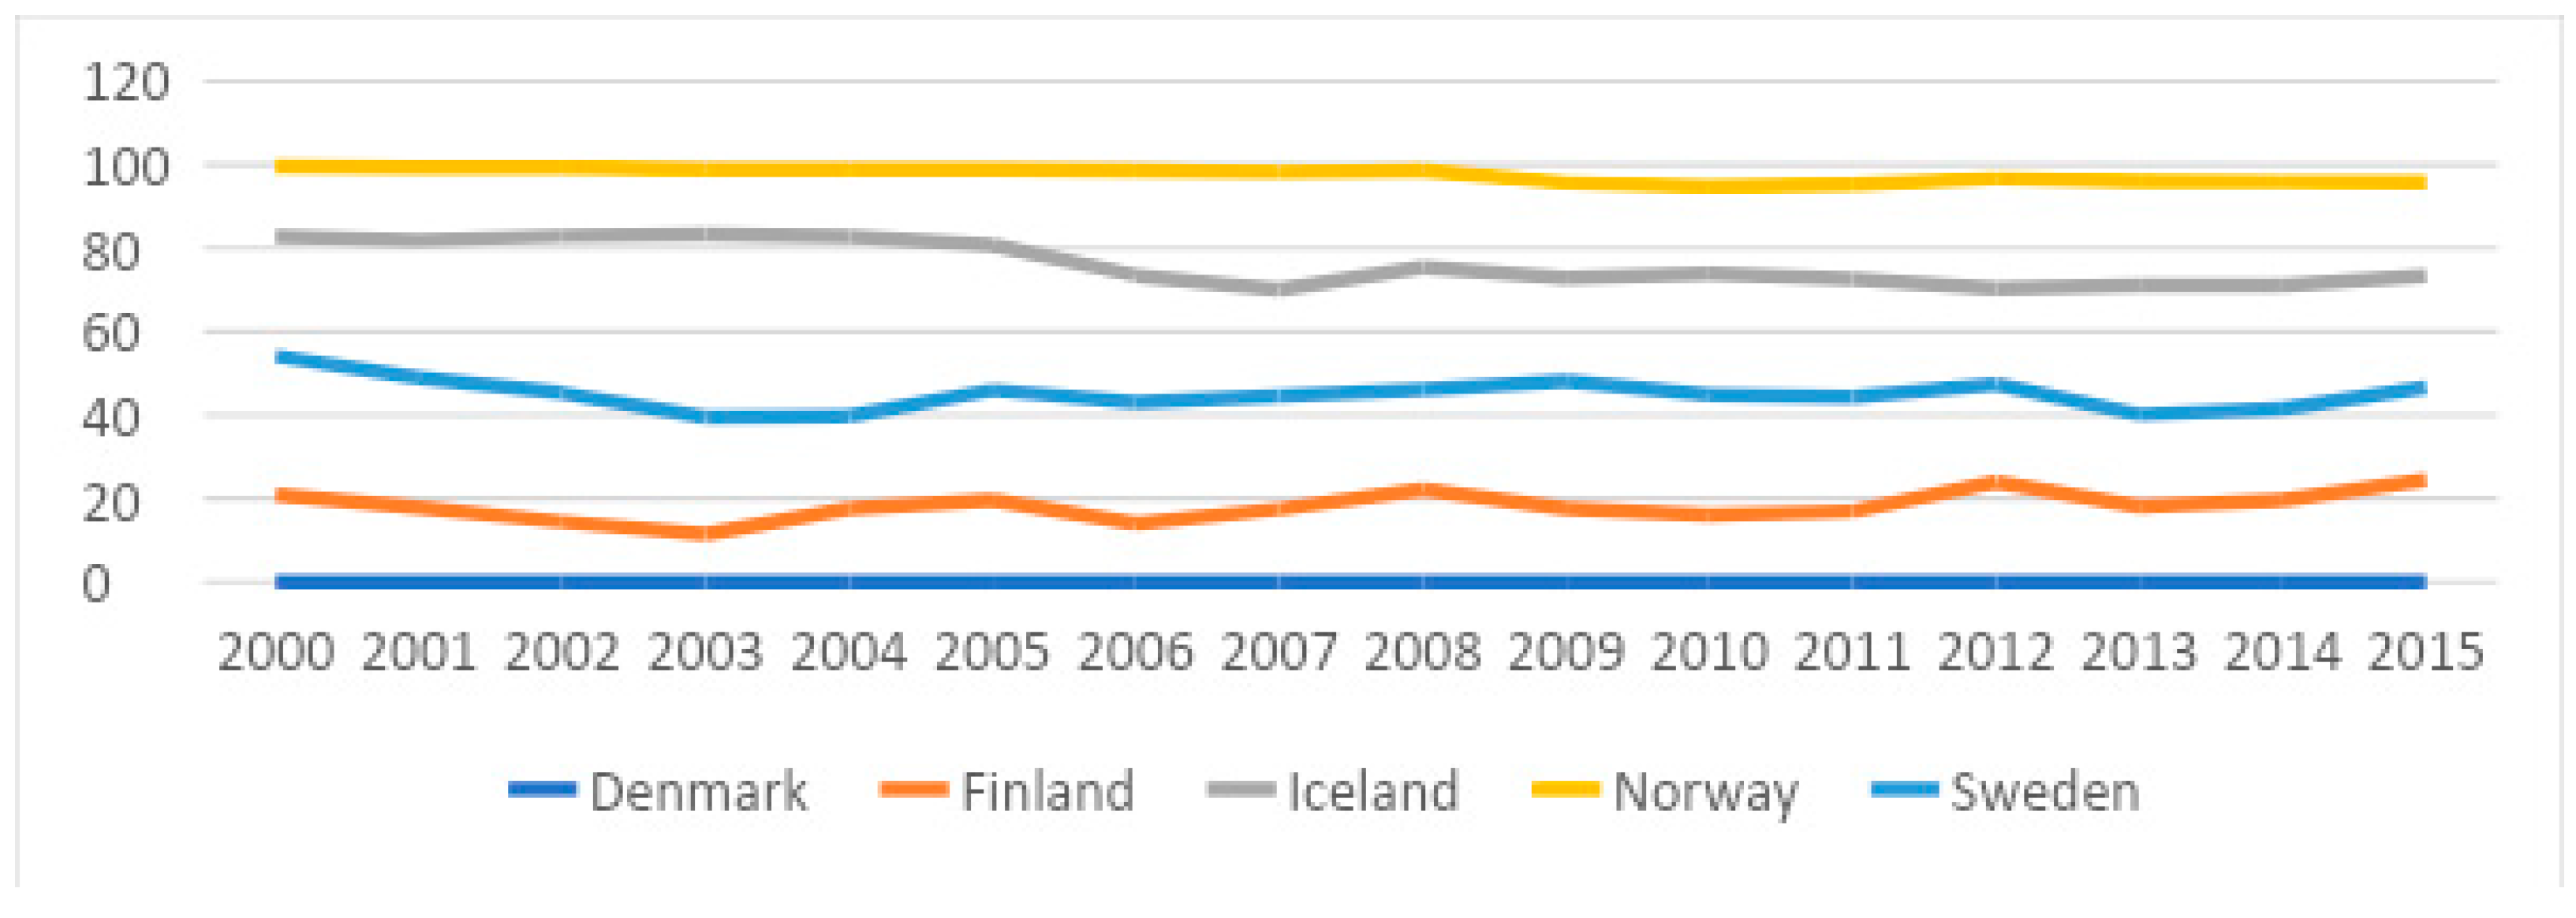
Hydroelectricity is a form of renewable energy generated through water dams placed in rivers and basins where kinetic energy spins the turbines (Delrio and Burguillo 2008). Hydropower remains the oldest way of energy production (Bakis 2007). Nordic countries have a larger sea area than land, which allows them to produce hydroelectricity much easier than other developed countries. Norway’s main exports include oil and renewable electricity. Therefore, there is an average steady production of 98% of hydroelectricity. From 2014 to 2015, Norway experienced an oil crisis which slightly dropped the hydroelectricity production by 3%. Norway was able to make up for hydroelectricity exports by the ripple effect made by the central bank (Sivramkrishna 2019). Moreover, the stocks of foreign currency reserves aided this loss in GDP. Denmark holds a steady level of hydropower production of 8% annually with no fluctuations as it has a net-zero commitment from hydropower production since 1990. Finland’s production of hydropower is fluctuating due to increased carbon dioxide emissions from other sources (Ericsson et al. 2004). Iceland’s main exports are aluminum and fish products. Furthermore, Iceland is known for its glacial rivers. Recently, due to climate change, the glaciers have been melting, which has increased the flow of water (Steingrímsson et al. 2008). Moreover, 75% of Iceland’s energy is hydropower making it the second highest after Norway as shown in Figure 2.
Therefore, the main aim of this paper is to highlight the gaps and identify a relationship between hydropower and HDI in Nordic countries. This will be done by depending on hydroelectricity consumption and to what extent it helps the countries that are recognized as pioneers in the field to achieve higher rates of economic development. This study will be divided into five sections: Section 1 is the literature review that will be divided into theoretical and empirical framework, and background. Section 2 will handle the methodology, while Section 3 deals with the discussion, and finally, conclusion. Consequently, the conclusion will provide some policy adjustments to efficiently benefit from Nordic’s comparative advantage.
2. Literature Review
Due to the depletion of non-renewable resources and its negative implications on the environment, policymakers and economists give greater attention to the use of renewable resources and their impacts on human development. Thus the literature review will be divided into two main parts that will tackle the theoretical background besides the empirical literature.
2.1. Theoretical Framework
2.1.1. Theory of Comparative Advantage
The theory of comparative advantage vividly illustrates the idea of using all naturally available resources in favor of the production of one or more goods. Comparative advantage as a phenomenon was first introduced by the political economist, David Riccardo. It was first mentioned in his famous book “Principles of Political Economy and Taxation” published in 1817. Ricardo aimed to spread the ideology of international trade by producing more of what a country had readily available from various resources. When countries focus on producing things they are good at, it becomes easier to balance the negative impact of scarcity. Through trade, open economies have directly impacted many economies’ gross domestic production. According to (Costinot and Donaldson 2012), the only impracticality of Ricardo’s classical theory is that relative productivity and labor specialization cannot be observed nor quantified. Moreover, this causes a disequilibrium effect in the short run in terms of supply and demand. Additionally, Comparative advantage heavily depends on the relative firmness of financial systems, subsequently allowing economies to invest in technological requirements (Costinot 2009).
Furthermore, the lack of empirical coverage and simplicity in Ricardo’s model allowed a no-tariff trade system. (Golub and Hsieh 2000) explored a more developed and confined model that accounted for the gaps in Ricardo’s model. (Krugman 2009) theory exploited the home market effect by which countries will produce products that have a relatively larger demand to allow more industries to cross-compete (Davis and Weinstein 2003). Nordic countries (Denmark, Finland, Iceland, Norway, and Sweden) have highly explored and developed their competitiveness in technological innovation. Specifically, Finland and Sweden’s investments in Research and Development have led to lower costs in the extraction of oil and increased exports of crude and refined petroleum. Nordic has marked a blueprint for the manipulation of different sources of renewables in energy production. Therefore, portraying effective use of their geographical location and maximizing Pareto efficiency.
2.1.2. Theory of Pareto Efficiency and Pareto Improvements
Pareto efficiency or optimality is an economic state whereby the redistribution of resources cannot make someone better off without making someone else worse off. This has been the makeup of the well-established idea of opportunity cost. Economies can only efficiently produce what is affordable and attainable to them in terms of budget and other main resources. Therefore, it is a measure of social welfare and development (Gayer et al. 2014). The economist, Vilferdo Pareto, developed the concept of distributional efficiency and equity in 1906. There are three conditions to satisfy the theory of Pareto. Firstly, in a free market, there should be efficiency in the allocation of commodities. Secondly, efficiency in the allocation of factors of production. Thirdly, efficiency in the composition of output. However, the Pareto efficiency model only works by theory. In contrast, the Pareto improvement model suggests a more practical approach. Pareto improvement is attained when giving up something benefits at least one person but does not negatively affect anyone else (Chen et al. 2023). Specifically, two countries can gain with trade while making neither worse off. Therefore, Scandinavian countries are ranked top in tax payments whereby it is easier to attain Pareto improvement (Kleven 2014). Therefore, higher taxes on commodities result in a decrease in social risk.
Additionally, Kaldor–Hicks elaborated on a slightly different approach for the efficiency model. No matter how many people are worse off than better off, allocation of resources should result in more benefits than costs. Furthermore, costs here are considered externalities. The cost of energy production through renewables could be unaccounted for, such as carbon dioxide emissions, therefore, severely impacts human life and development.
2.1.3. Solow Growth Model
Adam Smith’s theory of economic growth suggested wealth through the efficient use of resources and labor specialization given the accumulation of capital. Additionally, a higher rate of saving would mean a higher rate of growth through investment (Negishi 2014). Moreover, specialization here does not only consider vertical integration but also task distribution (Ortman and Lobo 2020). The model existed long before the Industrial Revolution in non-industrial societies. Thus, post-revolution, urbanization has caused market expansions and more room for employment which resulted in steady economic growth. Yet, the Smithian classical model fails to project the reasoning behind sudden economic bursts. This model also depends on the innovations in technological progress as well as the level of research and development of the economy. There is a close link between the Smithian model and energy consumption (Komal and Abbas 2015). Therefore, increasing energy consumption will theoretically increase economic output and growth. The model discusses a prediction known as “Conditional Convergence” (Bloom et al. 2019). The hypothesis states that countries that have similar technological progress, population growth, and institutions will determine the economic growth of the economies, like the case of Nordic countries.
2.1.4. Regional Sustainable Development
Human activities and saturation in urban areas have caused changes in the climate. Sustainable Development was proposed based on the satisfaction of human needs in developing countries (Chichilnisky 1997). Diversification in products and services directly led to social and ecological damage in many countries. Recently, it has become a social concern to protect the environment, with the role of the United Nations playing a pivotal role in setting social developmental goals. Economists heavily discuss the role of renewable energy deployment in achieving regional sustainability. In 2015, a goal set by the United Nations was to ensure access to clean and affordable energy. Regional sustainability is defined as continuous support of human quality of life while maintaining ecological capacity (Wackernagel and Yount 1998). There are three dimensions regarding regional sustainability which are environmental, economic, and social (Delrio and Burguillo 2008). The dissection of economic aspects includes the improvement of living standards as well as increasing output per capita through sustainable goals. Additionally, the social instrument of this model suggests that institutional development will positively impact sustainability. However, urban growth has led to catastrophic environmental damage which is directly interlinked with the socioeconomic aspects. Furthermore, the contribution of renewable energy use has dealt with many environmental improvements in economies due to the substituting of conventional energy.
2.2. Empirical Framework
Many studies have examined the relationship between renewable energy and HDI. The results of these studies varied; as some of them found positive relationships, others found that there are negative relationships, and some concluded that there is no relationship.
Regarding the studies that found a positive relationship between HDI and renewable energy, previous papers have mainly studied the effect of energy consumption on economic growth, with an emphasis on HDI. Most papers look at hydroelectricity production in developing countries. In the case of India and Pakistan, a cross-country analysis was conducted. Gaussian Mixture Models (GMM) were used to predict estimators (Komal and Abbas 2015). Variables were measured accordingly: energy consumption in kilotons, urbanization as a percentage of total population, trade openness as a percentage of GDP, and human capital measured by years of secondary enrollment (one of the components of HDI). Results prove a positive and significant impact from growth and urbanization as an indicator of HDI development on renewable energy growth.
Additionally, (Siraj et al. 2022) used the income index to measure GDP per capita. Each HDI component was calculated separately in each of the 10 electrified villages. The author measured differences in HDI by comparing villages with small hydropower projects and villages with none. Gender is used as a dummy variable in the model. While the study focused on socio-economic factors, results prove that there are major improvements in Pakistan’s HDI being a developing country. The improvement in HDI was not significant but hydropower plants have increased it from 0.412 to 0.459. Thus, Pakistan had surpassed its steady state of human development. Therefore, there is a positive impact of very small hydroelectricity projects on HDI, especially in rural areas. Additionally, research was carried out to investigate the nexus between hydropower use and urbanization in China and Brazil.
(Tiwari et al. 2022) analyzed the impact of this relationship with regard to carbon-dioxide emissions. Moreover, the study stated a heterogeneous distribution of renewable energy among both countries. A Quantile auto regression distributed lag (QARDL) was used to integrate such a connection between the explanatory variables in a time-series analysis. Additionally, the QARDL’s advantage is it predicts the long-term equilibrium influence of hydroelectric consumption as data does not follow normal distribution. It was proven that urbanization had a positive impact on ecological footprints and hence, increased economic growth. Furthermore (Kazar and Kazar 2014) examined the relationship between renewable energy and HDI in 154 countries in the short run and long run using the Granger causality test. This study concluded that there is a bidirectional relationship between them that ensures the long run relationship and the use of renewable energy more than non-renewable ones.
In studying this relationship in different regions, this relationship was investigated in OECD countries. (Liu et al. 2015) examined 105 OECD countries from high-income countries and emerging economies within it. This study used the elasticity of using energy, electricity consumption per person, and HDI by using panel data analysis methods and concluded that the use of energy, especially renewable ones can accelerate the human development process. In Sub-Saharan countries, this relationship was studied by (Bello 2015) from 1980 to 2010. It depends on some variables, these were renewable energy resources, non-renewable energy resources, economic development, HDI, and GDP growth rates using the cointegration test. Then it concluded that renewable energy can help in promoting socio-economic activities.
Regarding hydroelectricity, a study carried out in Brazil, identified the impact of hydropower plant projects on socio-economic factors (De Faria et al. 2017). Firstly, the paper identified sources of investment in constructing water dams on the Human Development Index including income, education, and public access to electricity and water. The research used an event-study approach, in a panel model, to identify differences between control and treated groups in Brazilian counties across time. The variables used were hydroelectricity measured in megawatts, agricultural GDP, Industrial GDP, percentage of public electricity access, percentage of public water access. Results imply that there is a short-term improvement in employment and energy accessibility, yet there is a long-term negative impact from hydro dams on socioeconomic indicators.
Finally, a little literature found that there is no or insignificant relationship between HDI and renewable energy. (Amer 2020) studied this relationship in four panels of countries that included high-income countries, upper middle-income countries, lower middle-income countries, and lower-income countries from 1990 to 2015. This study uses HDI, CO2 emissions per capita, renewable energy consumption, energy intensity, financial development, and trade openness using the PVAR model. It showed that there is an insignificant relationship between renewable energy and HDI in these countries except in lower-income countries.
Regarding hydropower and HDI, (Gyamfi et al. 2020) examined this relationship in the G7 countries during the period 1990–2018. This was tested by using some variables such as HDI, hydroelectricity energy, renewable energy consumption, non-renewable energy consumption, CO2 emissions, population, and GDP per capita depending on the Kao cointegration technique. It ends with U-shaped relations in the long run in these countries. Therefore Table 1 below summarized the main empirical literature tackled that relationships.
Therefore, this paper will test the following hypothesis:
Hypothesis 0 (H0).
Hydroelectricity has no impact on HDI.
Hypothesis 1 (H1).
Hydroelectricity has an impact on HDI.
Hypothesis 2 (H2).
Any increase in trade openness will increase the HDI.
Hypothesis 3 (H3).
Urbanization has a positive impact on HDI.
Thus, no paper explores the direct relationship between HDI and hydroelectricity in Nordic countries which gave the paper the advantage in that respect. Also, this paper will fill the gap about the link between HDI, urbanization, and the use of clean energy which is very limited in the literature.
3. Methodology
This section will use annual secondary data provided by the World Bank and United Nations Development Indicators (UNDP) from 2002 to 2021 for five Nordic countries: Denmark, Finland, Iceland, Sweden, and Norway. We will use six variables that are shown in Table 2. There was a huge difference between the maximum and minimum values in both hydroelectricity and trade; therefore, a logged form was conducted for both variables.
The paper will begin by analyzing the cross-panel data properties by applying unit root tests using two main techniques that are Augmented Dickey–Fuller (ADF) and Phillips Perron (PP) tests. This can be expressed by the following equation (Dickey and Fuller 1979):
∆Yt = ∝ + 1 + θYt − 1 + i − 1kδ∆ X YT − 1 + t
Moreover, a vector autoregression (VAR) model test was conducted ending with a Granger causality test to examine cointegration over the long run.
VAR is one of the econometric models used to control the relationships between different variables across time and is known as the theory of free model (Sims 1980). This model explains a set of variables over a statistical period to investigate the impact of random shock (Dizaji and Badri 2020). The use of the VAR model is widely used in many literatures that tackle the link between clean energy and HDI (Akbar et al. 2021; Amer 2020; Hao 2022). In order to estimate the VAR model, some steps were adopted as follows in Equation (2):
where log (HYDRO/TRADE/LAW/CPT/URB) is the logarithmic form of the variables hydroelectricity, trade openness, rule of law, corruption index, and urbanization growth rate, respectively. CV standards for the control variables, u for error term, and p for optimal lag length.
The error terms in the VAR model should be uncorrelated; therefore, lag length will be the second point after the unit root test. That will be examined by the following Equation (3):
HDI = αo + LnHYDRO + ln trade + rule + corr + URB + ε
Then different diagnostic tests will be performed to test the heteroscedasticity, multicollinearity, stability, and serial correlation.
Moreover, the Granger causality test was conducted to examine the following hypotheses:
Hypothesis 0 (H0).
The variable X does not Granger cause Y.
Hypothesis 1 (H1).
Variable X Granger causes Y.
Finally, the impulse response analysis will be conducted to examine the impact of shocks on HDI over the next 10 years. This analysis will use Monte Carlo over 200 confidence intervals. The variance inflation decomposition will depend on Choleski’s decomposition techniques.
4. Results
In the investigation of the relationship between hydroelectricity and HDI in Nordic countries, the VAR model will be used. This will be examined through four main steps that begin with the descriptive data, correlation, and unit root test. Moreover, Johansen’s maximum likelihood will be tested in the second step. Then the checkup of the VAR model will take place in the third step. The model diagnostics will be examined in the fourth step. These results will be implemented in step five. Finally, Granger causality test will be used to evaluate the causal relationship between hydroelectricity and HDI in Nordic countries in the final step.
4.1. Descriptive Data and Unit Root Test
Before conducting the econometric tests, descriptive data, correlation tests, and unit root tests will be examined in Table 3. The number of observations is 100 after interpolating 10 missing data in the rule of law and control of corruption for each country during the year 2001. The mean for HDI is 0.92 with a minimum of 0.886, which is relatively high given that Nordic countries are developed. The median of HDI is 0.199701, which is close to zero indicating less variation and homoscedastic data. The average production of hydroelectricity is 2.5523 with a median of 2.776552. The minimum of hydropower production is negative indicating that there is a supply shock due to European crises. The institutional measures such as control of corruption (average of 2.15) and rule of law (average of 1.88) data are very close, which means that there is a strong institutional power. Trade has a mean of 4.40 indicating variability due to trade disruptions and changes in policies. Lastly, urbanization in Nordic countries is relatively close as the mean is 86 and the minimum is 76.7 indicating an increase in movement in population from rural lands to cities.
A correlation test was conducted in Table 4. There is a weak negative correlation between HDI and Hydroelectricity, which is significant at 10%. There is a weak negative correlation between HDI and the urban population, significant at 10%. The reason behind the negative impact is that increased saturation by people in cities will cause an increase in electricity and water usage. Lastly, there is a strong negative relation between control of corruption and HDI, significant at 1% because the government has firm regulations and policies to protect social interest from private gains due to public power. Thus, controlling trade regulations in the Nord pool prevents illegal exports and policies to prevent illegal migration by foreigners.
By conducting the unit root test using two different techniques, ADF and PP, the results of the data used for the variables were stationary at first difference I (1), whether in interceptor with “trend and intercept”, as shown in Table 5 at 1%.
4.2. Maximum Likelihood
The log length table was estimated in Table 6. The results showed that the first lag is allowed to select the maximum lag due to the small period and the small number of countries found in Nordic countries (Wooldridge 2013) by using FRE, AIC, SC, and HQ tests.
4.3. VAR Model Estimation
The results of Table 7 were consistent with the results of lag length criteria that were created in Table 6 at VAR2. In the first VAR period (VAR1), HDI has a positive relation with all variables except with urban population growth compared to the second VAR period (VAR2) that were negative only with trade openness and hydroelectricity capacity
Regarding HDI, it had a negative relationship with the rule of law and trade openness in VAR1 and only corruption in VAR2 according to Table 7. Compared to the relation of the corruption that was positive for all variables except for HDI in VAR1 and trade openness in VAR2.
Rule of law had negative relationships with hydroelectricity capacity, corruption, and trade openness in VAR1 and with HDI, hydroelectricity, rule of law, and urbanization rate in VAR2. Trade openness had only positive relationships with HDI, and trade openness in VAR1. Finally, urbanization had only negative relationships with hydroelectricity consumption and the rule of law in VAR1 and with HDI, corruption, trade openness, and the rule of law. Therefore, these results showed that there is a positive relationship between HDI and hydroelectricity consumption in the short run and a negative relation in the long run. This was validated by the value of adjusted R2 which comes at 95%.
4.4. Model Diagnostics
Here the diagnostics tests for VAR were conducted to test the heteroscedasticity, multicollinearity, stability, and serial correlation. Table 6 confirms that there is no serial correlation as it lies at the VAR 1 and VAR2 according to (Liew 2004) who found that the assumption of absence of the serial correlation is accepted till the fourth lag length criteria.
Also, the results of variance inflation factors (VIF) show that all values for all variables are less than 10 according to (Aljandali and Tatahi 2018) as shown in Table 8 below. Therefore, there is no multicollinearity between variables.
Table 9 shows the results of heteroscedasticity as it tests the null hypothesis that assumes that there is no heteroscedasticity between variables. As the probability is high and exceeds 0.05 then the null hypothesis is accepted.
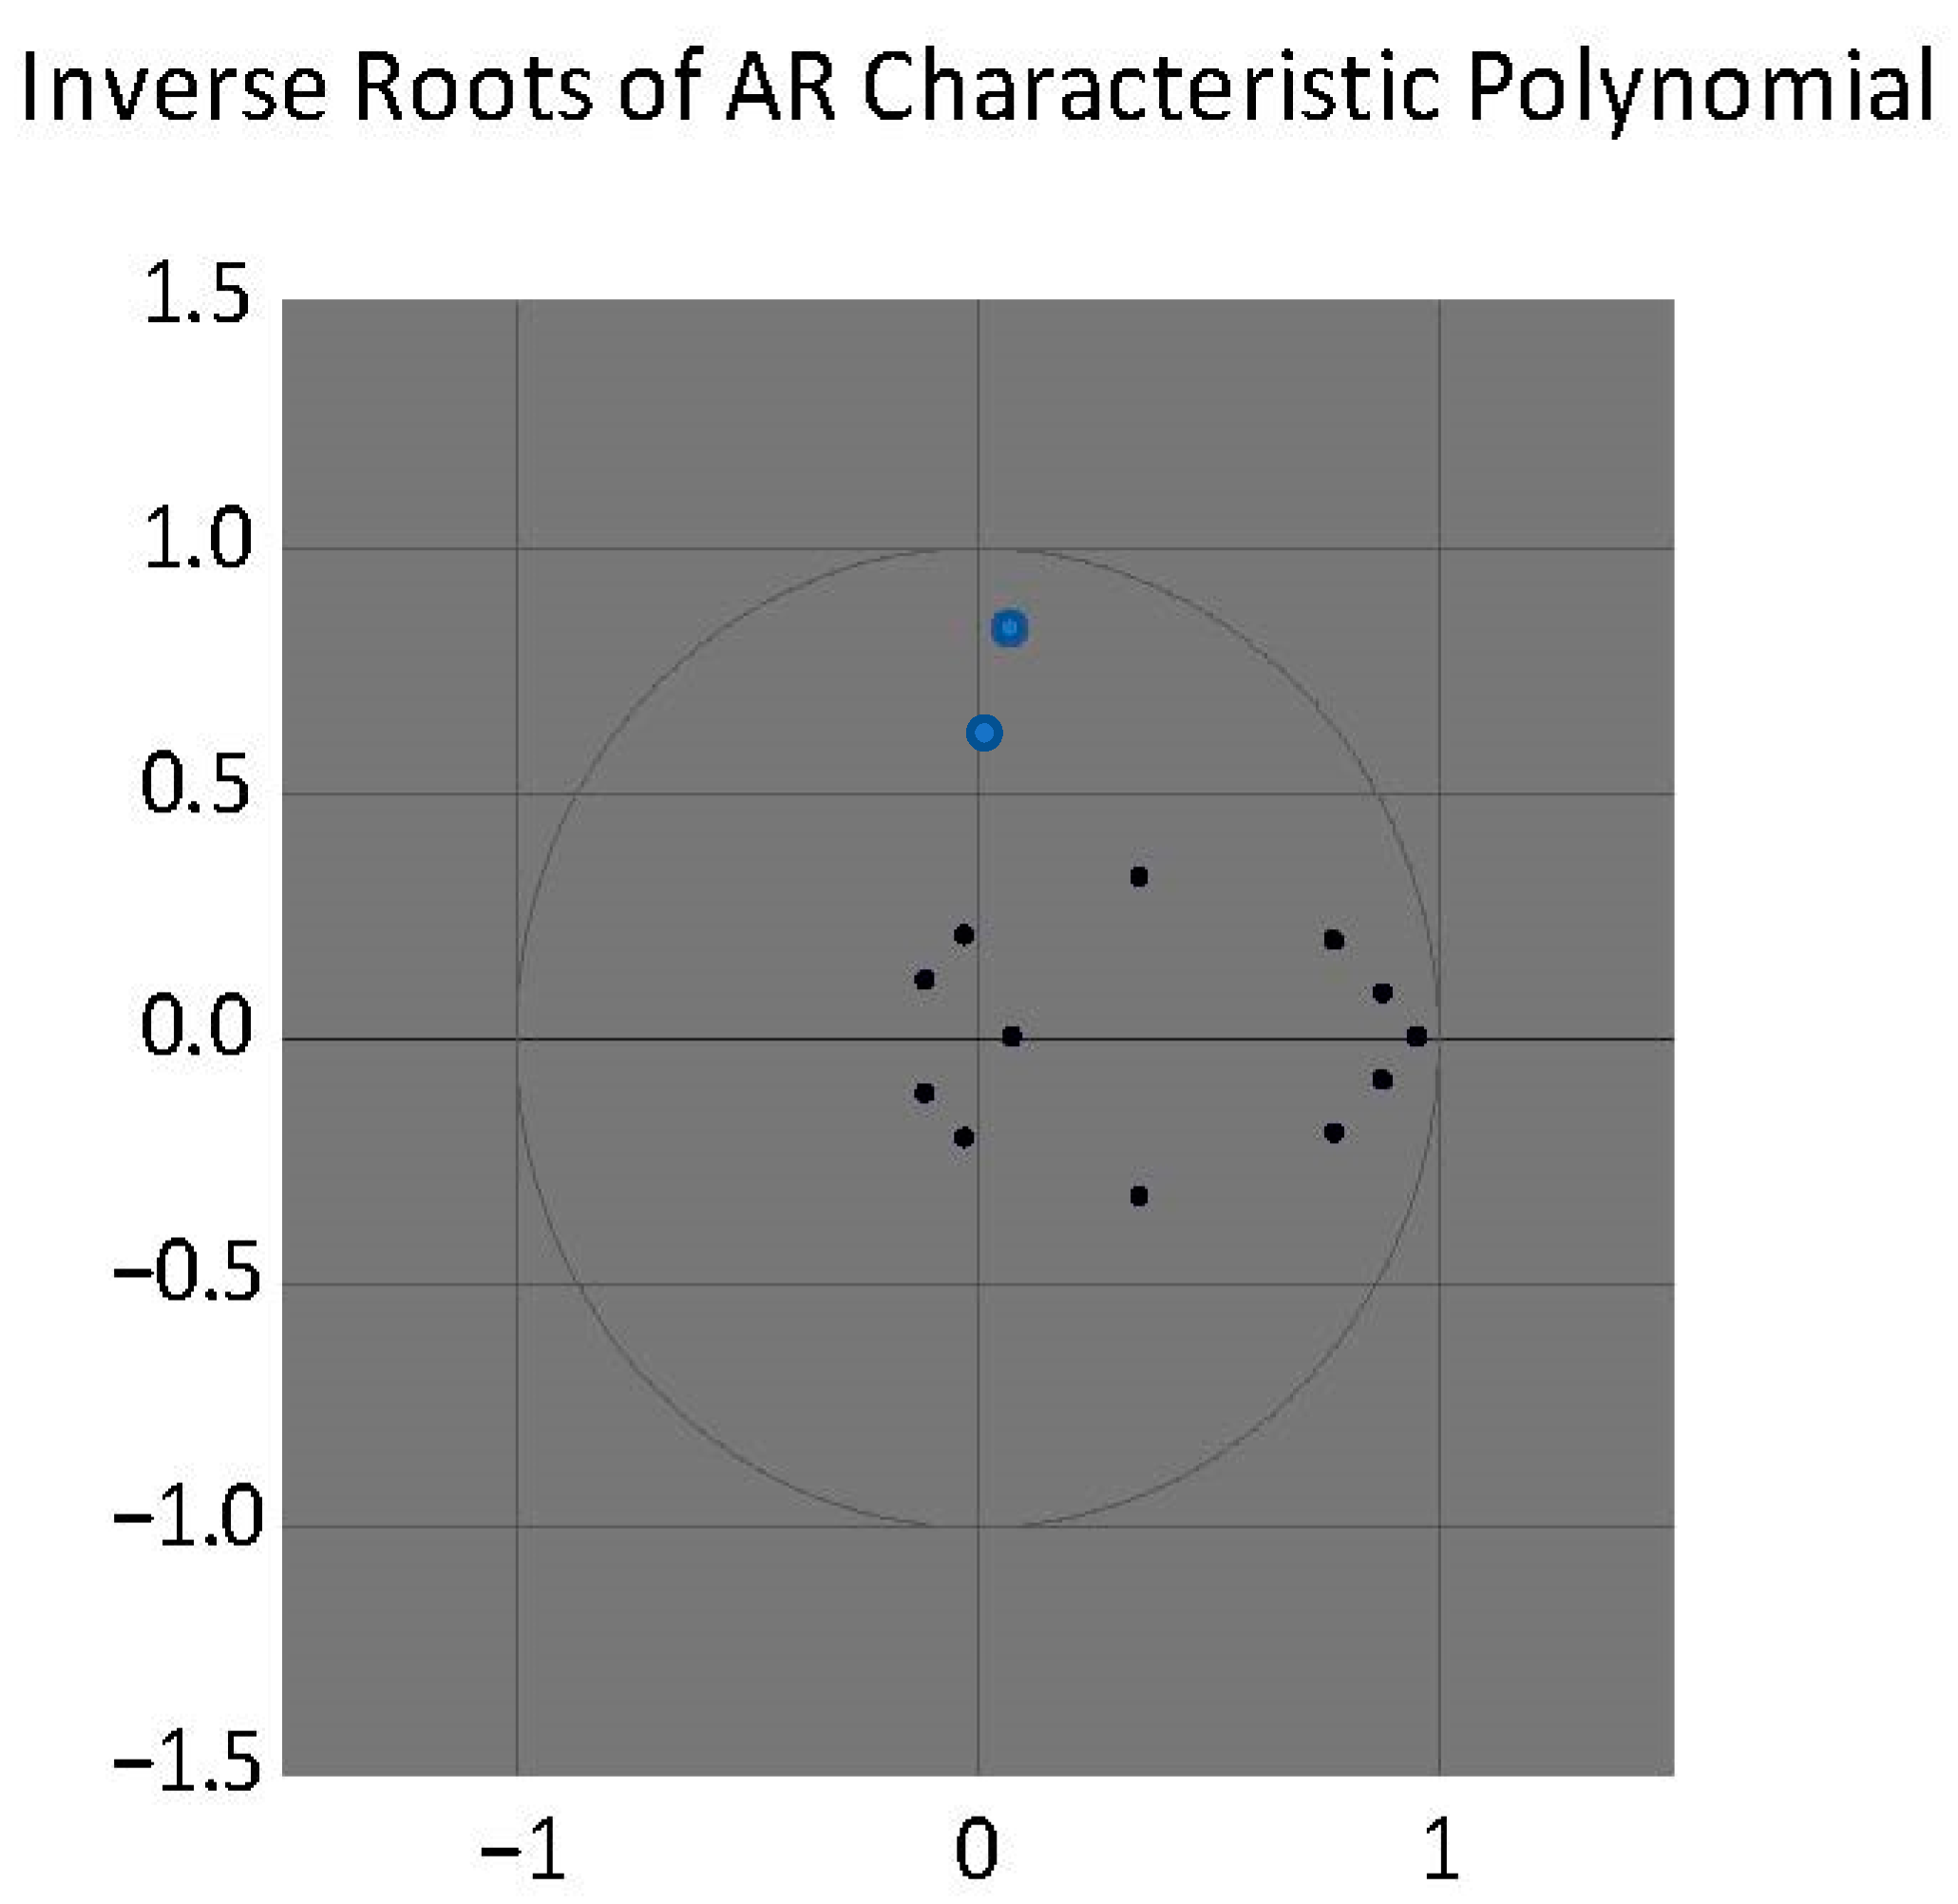
In order to ensure the stability of the VAR model, (Altman and Krzywinski 2016; Hatemi-J 2004) concluded that the VAR model is stable if its residuals are less than 1 and inside the circle. Therefore, Table 10 and Figure 3 below shows that the roots lie inside the circle that satisfies the stability condition. Then variance decomposition of HYDRO, HDI, and all other variables results were estimated and shown in Appendix B. This was conducted for the next 10 years using Monte Carlo of 200 intervals.
4.5. Impulse Response Results
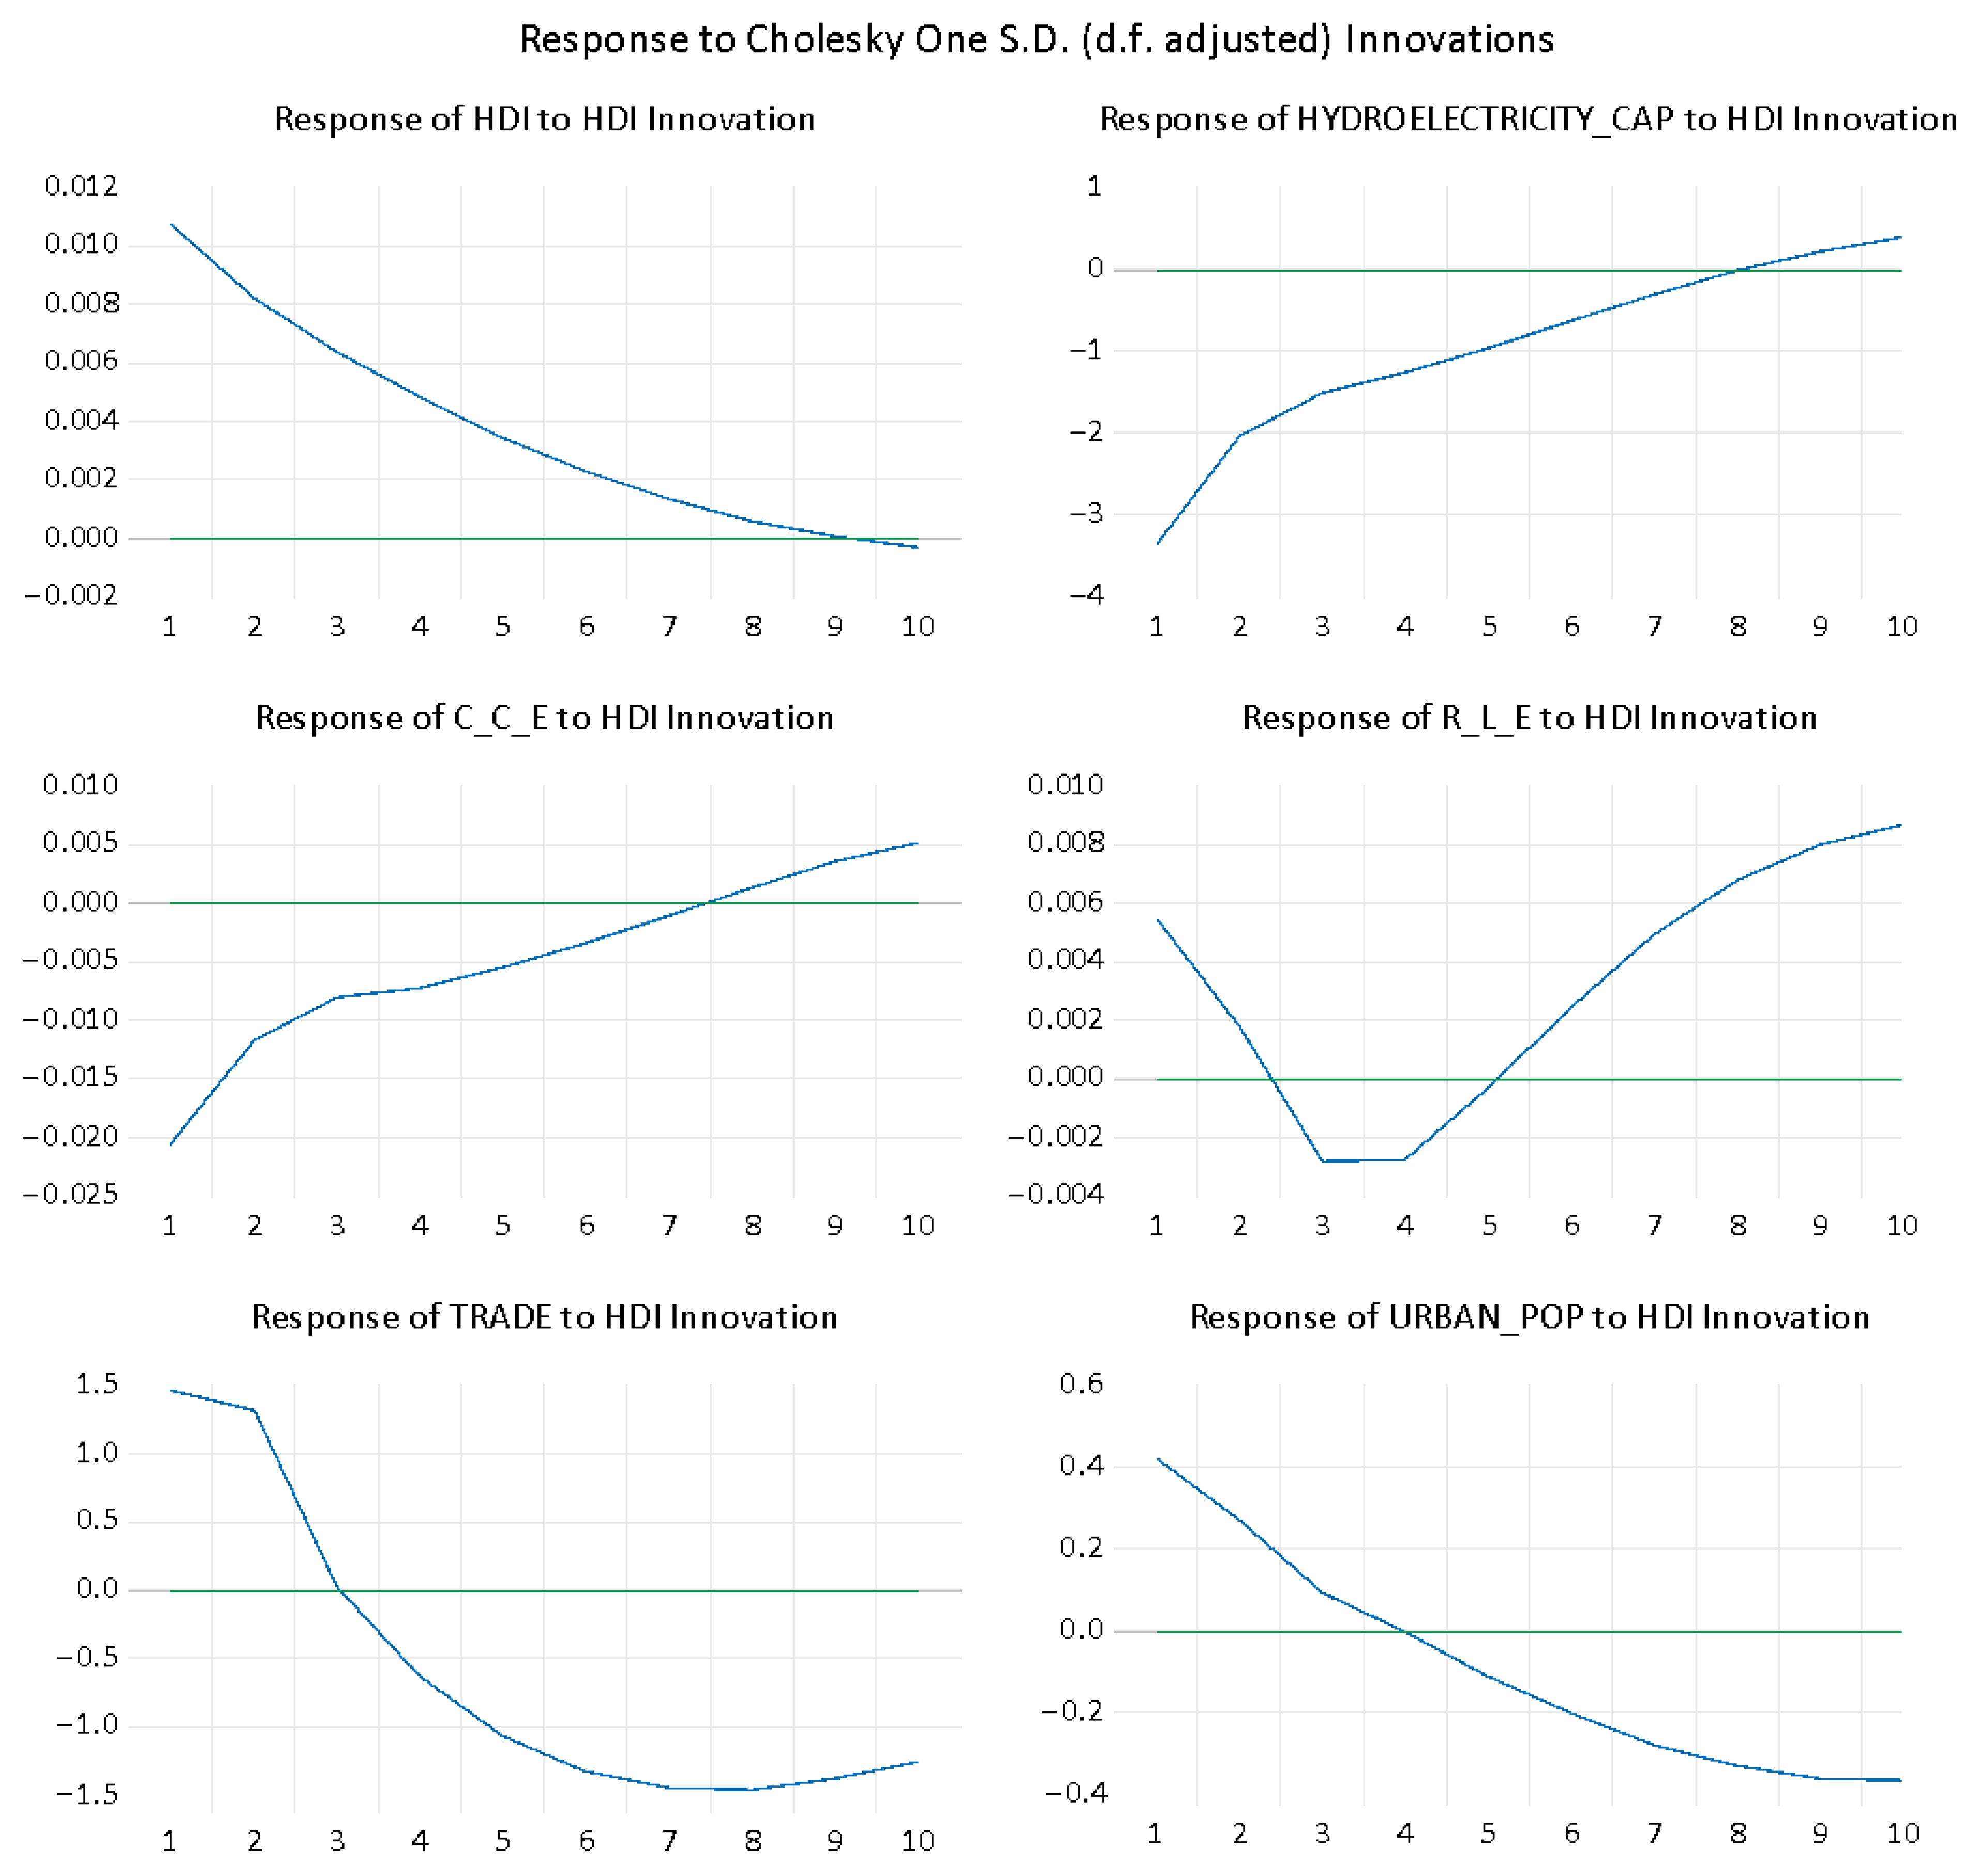
This section will deal with the relationship between HDI, oil prices, and government expenditures over 10 years. The impact of the variables was different as sometimes it appeared above zero (with a positive effect) or below zero (in other words with a negative effect). Figure 4 shows the value of all variables to HDI. The results show that the variables have negative shocks on HDI over the next 10 years in both the short and long run. This implies that the increase in trade openness and urbanization rate transmit negative shocks to HDI with a negative slope, which is consistent with the results of the VAR model. This can be explained by the good policies in the field of education and human welfare, which will decrease HDI, bringing it closer to 1. In contrast, the increase in the use of hydroelectricity will increase the HDI which can be explained by the increase in a clean environment that has positive impacts on human health and therefore, welfare.
4.6. Granger Causality
Finally, these relationships that were concluded in Table 7 were tested by the Granger causality test to come with a result that these relations were not significant as shown in Appendix A.
5. Discussion
The results indicate an insignificant positive relationship between hydroelectricity production (independent variable) on HDI (dependent variable) in the short run but an insignificant negative relationship in the long run (Tomczyk and Wiatkowski 2020). Hydropower has dominated many parts of Europe over the last several years. Additionally, the European Union aims to increase the domestic use of renewable electricity to sustain its environment. Upon the available results, the null hypothesis is rejected. This proves that there is a relationship between the dependent variable (Human Development Index) and the main independent variable (hydroelectricity production).
According to (Espoir and Sunge 2021), carbon dioxide emissions showed no effect on HDI. Hence, carbon dioxide measurement was not used in the model. Thus, the coefficient of HDI is less than 1. Nordic countries such as Norway and Denmark are two of the largest exporters of hydropower energy as rainfall peaks. However, Norway has plans to cut its exports of hydropower as its reservoirs dropped by 10% to prevent an energy crisis. Evidently, Sweden, Finland, and Denmark are bound to suffer as they depend on Norway for their hydro exports (IEA 2023). Sweden is not able to afford hydro energy as plant costs increase. In contrast, the increase in overall long-run expenditure on reducing environmental degradation through controlling temperature will enhance HDI. Especially since increased global warming will lead to a decrease in water distribution efficiency (Opoku et al. 2021). Also, investments in hydro dams have led to advancements in human innovation and development in technical knowledge of labor (Pietrosemoli and Rodríguez Monroy 2013). Nordic countries prosperity had sparked from social capital which decreased corruption. Social capital has flourished in renewable energy production as employment levels have risen (Oxford Institute for Energy Studies and Patonia 2020).
Finally, the hypotheses examinations show that hydroelectricity has a positive impact on HDI in Nordic countries in the short run which implies the acceptance of the first hypothesis and rejection of the null hypothesis.
6. Conclusions
This paper aimed to study the nexus between hydroelectricity and HDI. The similarities between Nordic countries in terms of institutions, geographical advantages, and policies have led to similar growth in human development. For example, immigration policies to limit refugees forming the labor market as it was linked to increased crime rates (Tiwari et al. 2022). Although the short-term fluctuations, depending on hydropower for improved ecological footprint are negatively impacting human development, the cooperation in policy implementation is becoming stricter to sustain the green and blue environment. The use of hydroelectricity is very essential for these countries as they are characterized by the high rate of migration whether internally or externally (from other countries) and low corruption with a high rule of law. This helped us to choose the variables that may affect the Nordic countries—that are consistent with the economic and social environment in them. These variables are the rule of law, corruption, and urbanization that have a negative impact on the economic development in Nordic countries. Also, hydroelectricity and trade openness are positively related to economic development. The data regarding these variables were used in the period from 2002 to 2021 in this region.
Subsequently, Nordic could broaden its use of renewable energy to wind, solar, geothermal, and bioenergy, and not limit it to just hydropower. Therefore, the main policy implications include:
- Increase public funding in research and development as well as cutting carbon emissions through carbon tax, subsidies, or tradable permits.
- Allow investments in the technological sector as well as boost European cooperation for enhanced energy infrastructure and distribution.
This study has some limitations that can be used in further research as HDI is a multidimensional index that has some variables that can be discussed separately with the new sources of clean energy. Additionally, a comparison between these developed countries and developing countries can be used to fill the gaps between them but this acts as an obstacle due to the limited availability of data among many developing countries. Finally, the study focused on the short run rather than the long run that can be applied in the long run.
Recently, electricity prices have risen in Denmark. Moreover, inflation remains very high in Denmark and in many countries in Europe. Especially after the COVID-19 crisis, the purchasing power parity of consumers has weakened. However, in efforts to minimize such disparities the Swedish invention of water batteries has shifted the renewable energy industry. Water batteries, also known as pumped storage hydropower, are dually used in storing electricity from seawater to charge the battery and the reversal of water to generate turbines. Although lithium is considered a costly substance used in water battery manufacturing, the battery itself does not require any additional construction. In fact, water batteries are meant to save time and money in hydro dam renovations.
Author Contributions
Conceptualization, A.B.M.M. and M.M.Y.; methodology, A.B.M.M., S.M.N. and M.M.Y.; software, A.B.M.M.; validation A.B.M.M., M.M.Y. and S.M.N.; analysis and interpretation of the data A.B.M.M., S.M.N. and M.M.Y.; the drafting of the paper A.B.M.M., M.M.Y. and S.M.N.; revising it critically for intellectual content A.B.M.M., S.M.N. and M.M.Y.; funding acquisition, A.B.M.M., S.M.N. and M.M.Y. All authors have read and agreed to the published version of the manuscript.
Funding
This research was funded by the Deanship of Scientific Research, Vice Presidency for Graduate Studies and Scientific Research, King Faisal University, Saudi Arabia [Project No. GRANT 5413].
Informed Consent Statement
No consent statement as there is no study on humans.
Data Availability Statement
Data are available upon request from researchers who meet the eligibility criteria. Kindly contact the corresponding author privately through e-mail.
Conflicts of Interest
The authors declare no conflict of interests.
Abbreviations
| ARDL | auto regressive distributed lag |
| CO2 | carbon dioxide |
| FMOLS | fully modified ordinary least squared |
| G7 | great seven countries |
| GDP | gross domestic product |
| GMM | Gausian mixture method |
| GMM | Generalized method of moments |
| HDI | human development index |
| ODA | official development assistance |
| OECD | organization of economic cooperation and development |
| OLS | ordinary least squared |
| QARDL | quantile auto regressive distributed lag |
| UNDP | United Nations development program |
| VAR | Vector autoregressive model |
Appendix A. Granger Causality Results
| Null Hypothesis: | Obs | F-Statistic | Prob. |
| HYDRO does not Granger Cause HDI | 98 | 0.10181 | 0.9033 |
| HDI does not Granger Cause HYDRO | 0.92475 | 0.4002 | |
| CPT does not Granger Cause HDI | 98 | 0.91122 | 0.4056 |
| HDI does not Granger Cause CPT | 0.03958 | 0.9612 | |
| LAW does not Granger Cause HDI | 98 | 0.57696 | 0.5636 |
| HDI does not Granger Cause LAW | 0.33486 | 0.7163 | |
| TRADE does not Granger Cause HDI | 98 | 0.79711 | 0.4537 |
| HDI does not Granger Cause TRADE | 6.03477 | 0.0034 | |
| URB does not Granger Cause HDI | 98 | 0.09857 | 0.9062 |
| HDI does not Granger Cause URB | 1.39115 | 0.2539 | |
| CPT does not Granger Cause HYDRO | 98 | 0.02969 | 0.9708 |
| HYDRO does not Granger Cause CPT | 1.65336 | 0.1970 | |
| LAW does not Granger Cause HYDRO | 98 | 0.12487 | 0.8828 |
| HYDRO does not Granger Cause LAW | 0.21192 | 0.8094 | |
| TRADE does not Granger Cause HYDRO | 98 | 6.66767 | 0.0020 |
| HYDRO does not Granger Cause TRADE | 1.35398 | 0.2633 | |
| URB does not Granger Cause HYDRO | 98 | 1.06132 | 0.3502 |
| HYDRO does not Granger Cause URB | 0.00230 | 0.9977 | |
| LAW does not Granger Cause CPT | 98 | 2.09831 | 0.1284 |
| CPT does not Granger Cause LAW | 1.11365 | 0.3327 | |
| TRADE does not Granger Cause CPT | 98 | 0.36816 | 0.6930 |
| CPT does not Granger Cause TRADE | 1.20166 | 0.3053 | |
| URB does not Granger Cause CPT | 98 | 1.05460 | 0.3525 |
| CPT does not Granger Cause URBAN_POP | 2.13701 | 0.1238 | |
| TRADE does not Granger Cause LAW | 98 | 1.17666 | 0.3129 |
| LAW does not Granger Cause TRADE | 0.84885 | 0.4312 | |
| URB does not Granger Cause LAW | 98 | 3.27057 | 0.0424 |
| LAW does not Granger Cause URB | 0.48080 | 0.6198 | |
| URB does not Granger Cause TRADE | 98 | 0.52345 | 0.5942 |
| TRADE does not Granger Cause URB | 0.65919 | 0.5197 |
Appendix B. Variance Decomposition Results (Authors Calculations)
| Period | S.E. | HDI | HYDRO | C_C_E | R_L_E | TRADE | URB |
| 1 | 0.010769 | 100.0000 | 0.000000 | 0.000000 | 0.000000 | 0.000000 | 0.000000 |
| 2 | 0.013608 | 98.87031 | 0.095164 | 0.465960 | 0.248814 | 0.319418 | 0.000339 |
| 3 | 0.015248 | 96.04626 | 0.178521 | 0.666940 | 0.326812 | 2.329893 | 0.451577 |
| 4 | 0.016369 | 92.04415 | 0.239027 | 0.706685 | 0.284573 | 5.269742 | 1.455823 |
| 5 | 0.017176 | 87.61136 | 0.294276 | 0.746182 | 0.337656 | 8.307956 | 2.702563 |
| 6 | 0.017771 | 83.47641 | 0.355129 | 0.832337 | 0.458755 | 10.95096 | 3.926412 |
| 7 | 0.018207 | 80.06005 | 0.433102 | 0.980703 | 0.591073 | 12.97912 | 4.955946 |
| 8 | 0.018522 | 77.46726 | 0.538499 | 1.186058 | 0.708786 | 14.37818 | 5.721214 |
| 9 | 0.018747 | 75.61633 | 0.679586 | 1.430225 | 0.805392 | 15.24550 | 6.222962 |
| 10 | 0.018910 | 74.34637 | 0.861853 | 1.691499 | 0.880939 | 15.71665 | 6.502686 |
References
- Ahmad, Munir, and Zhen-Yu Zhao. 2018. Empirics on linkages among industrialization, urbanization, energy consumption, CO2 emissions and economic growth: A heterogeneous panel study of China. Environmental Science and Pollution Research 25: 30617–32. [Google Scholar] [CrossRef] [PubMed]
- Akbar, Minhas, Ammar Hussain, Ahsan Akbar, and Irfan Ullah. 2021. The dynamic association between healthcare spending, CO2 emissions, and human development index in OECD countries: Evidence from panel VAR model. Environment, Development and Sustainability 23: 10470–89. [Google Scholar] [CrossRef]
- Aljandali, Abdulkader, and Motasam Tatahi. 2018. Economic and Financial Modelling with EViews: A Guide for Students and Professionals. Cham: Springer International Publishing. [Google Scholar] [CrossRef]
- Altman, Naomi, and Martin Krzywinski. 2016. Regression diagnostics. Nature Methods 13: 385–86. [Google Scholar] [CrossRef]
- Amer, Haidy. 2020. The Impact of Renewable Energy Consumption on the Human Development Index in Selected Countries: Panel Analysis (1990–2015). International Journal of Economy, Energy and Environment 5: 47. [Google Scholar] [CrossRef]
- Bakis, Recep. 2007. The Current Status and Future Opportunities of Hydroelectricity. Energy Sources, Part B: Economics, Planning, and Policy 2: 259–66. [Google Scholar] [CrossRef]
- Bello, Mukhtar. 2015. Renewable Energy for Sustainable Socio-Economic Development in Developing Countries: A Case Study of Sub-Saharan Africa. Advanced Materials Research 1116: 33–44. [Google Scholar] [CrossRef]
- Bloom, David, David Canning, Rainer Kotschy, Klaus Prettner, and Johannes Schünemann. 2019. Health and Economic Growth: Reconciling the Micro and Macro Evidence. Cambridge: National Bureau of Economic Research, p. w26003. [Google Scholar] [CrossRef]
- Blume, Kraen, Bjorn Gustafsson, Peder J. Pedersen, and Mette Verner. 2007. At the Lower End of the Table: Determinants of Poverty among Immigrants to Denmark and Sweden. Journal of Ethnic and Migration Studies 33: 373–96. [Google Scholar] [CrossRef]
- Chen, Yongqiang, Kaiwen Zhou, Yatao Bian, Binghui Xie, Bingzhe Wu, Yonggang Zhang, Kaili Ma, Han Yang, Pelin Zhao, Bo Han, and et al. 2023. Pareto Invariant Risk Minimization: Towards Mitigating the Optimization Dilemma in Out-of-Distribution Generalization. arXiv arXiv:2206.07766. [Google Scholar]
- Chichilnisky, Garciela. 1997. What Is Sustainable Development? Land Economics 73: 467. [Google Scholar] [CrossRef]
- Costantini, Valeria, and Salvatore Monni. 2005. Sustainable Human Development for European Countries. Journal of Human Development 6: 329–51. [Google Scholar] [CrossRef]
- Costinot, Arnaud. 2009. On the origins of comparative advantage. Journal of International Economics 77: 255–64. [Google Scholar] [CrossRef]
- Costinot, Arnaud, and Dave Donaldson. 2012. Ricardo’s Theory of Comparative Advantage: Old Idea, New Evidence. American Economic Review 102: 453–58. [Google Scholar] [CrossRef]
- Davis, Donald R., and David E. Weinstein. 2003. Market access, economic geography and comparative advantage: An empirical test. Journal of International Economics 59: 1–23. [Google Scholar] [CrossRef]
- De Faria, Felipe, Alex Davis, Edson Severnini, and Paulina Jaramillo. 2017. The local socio-economic impacts of large hydropower plant development in a developing country. Energy Economics 67: 533–44. [Google Scholar] [CrossRef]
- Delrio, Pablo Del, and Mercedes Burguillo. 2008. Assessing the impact of renewable energy deployment on local sustainability: Towards a theoretical framework. Renewable and Sustainable Energy Reviews 12: 1325–44. [Google Scholar] [CrossRef]
- Dickey, David, and Wayne Fuller. 1979. Distribution of the Estimators for Autoregressive Time Series With a Unit Root. Journal of the American Statistical Association 74: 427. [Google Scholar] [CrossRef]
- Dizaji, Monireh, and Arash Ketabforoush Badri. 2020. Human Development, Social Security Costs and Poverty with a VAR Approach. Asian Journal of Sociological Research 3: 5–18. [Google Scholar]
- Ericsson, Karin, Suvi Huttunen, Lars J. Nilsson, and Per Svenningsson. 2004. Bioenergy policy and market development in Finland and Sweden. Energy Policy 32: 1707–21. [Google Scholar] [CrossRef]
- Espoir, Delphine Kamanda, and Regret Sunge. 2021. Co2 emissions and economic development in Africa: Evidence from a dynamic spatial panel model. Journal of Environmental Management 300: 113617. [Google Scholar] [CrossRef]
- Gayer, Gabrielle, Itzhar Gilboa, Larry Samuelson, and David Schmeidler. 2014. Pareto Efficiency with Different Beliefs. The Journal of Legal Studies 43: S151–S171. [Google Scholar] [CrossRef]
- Golub, Steven S., and Chang-Tai Hsieh. 2000. Classical Ricardian Theory of Comparative Advantage Revisited. Review of International Economics 8: 221–34. [Google Scholar] [CrossRef]
- Gyamfi, Bright Akwasi, Murad A. Bein, and Festus Vector Bekun. 2020. Investigating the nexus between hydroelectricity energy, renewable energy, nonrenewable energy consumption on output: Evidence from E7 countries. Environmental Science and Pollution Research 27: 25327–39. [Google Scholar] [CrossRef] [PubMed]
- Hao, Yuanyuan. 2022. Effect of Economic Indicators, Renewable Energy Consumption and Human Development on Climate Change: An Empirical Analysis Based on Panel Data of Selected Countries. Frontiers in Energy Research 10: 841497. [Google Scholar] [CrossRef]
- Hatemi-J, Abdelnasser. 2004. Multivariate tests for autocorrelation in the stable and unstable VAR models. Economic Modelling 21: 661–83. [Google Scholar] [CrossRef]
- IEA. 2023. Hydropower Special Market Report: Analysis and Forecast to 2030. Available online: https://www.iea.org/reports/hydropower-special-market-report (accessed on 15 December 2023).
- Jones, Donald. 1989. Urbanization and Energy Use In Economic Development. The Energy Journal 10: 29–45. [Google Scholar] [CrossRef]
- Kazar, Gorkemli, and Altug Kazar. 2014. The Renewable Energy Production-Economic Development Nexus. International Journal of Energy Economics and Policy 4: 312–19. [Google Scholar]
- Khezri, Mohsen, Mohammed Sharif Karimi, Jamal Mamkhezri, Reza Ghazal, and Larry Blank. 2022. Assessing the Impact of Selected Determinants on Renewable Energy Sources in the Electricity Mix: The Case of ASEAN Countries. Energies 15: 4604. [Google Scholar] [CrossRef]
- Kleven, Henrik Jacobsen. 2014. How Can Scandinavians Tax So Much? Journal of Economic Perspectives 28: 77–98. [Google Scholar] [CrossRef]
- Komal, Rabia, and Faisal Abbas. 2015. Linking financial development, economic growth and energy consumption in Pakistan. Renewable and Sustainable Energy Reviews 44: 211–20. [Google Scholar] [CrossRef]
- Krugman, Paul. 2009. The Increasing Returns Revolution in Trade and Geography. American Economic Review 99: 561–71. [Google Scholar] [CrossRef]
- Liew, Venus Khim-Sen. 2004. Which Lag Length Selection Criteria Should We Employ? Economic Bulletin 3: 1–9. [Google Scholar]
- Liu, Yansui, Yang Zhou, and Wenxiang Wu. 2015. Assessing the impact of population, income and technology on energy consumption and industrial pollutant emissions in China. Applied Energy 155: 904–17. [Google Scholar] [CrossRef]
- Martins, Florinda, Carlos Felgueiras, Miroslava Smitkova, and Nidia Caetano. 2019. Analysis of Fossil Fuel Energy Consumption and Environmental Impacts in European Countries. Energies 12: 964. [Google Scholar] [CrossRef]
- Negishi, Takashi. 2014. Microeconomic Foundations of Macroeconomics. In Elements of Neo-Walrasian Economics. Edited by T. Negishi. Japan: Springer, vol. 5, pp. 167–84. [Google Scholar] [CrossRef]
- Nguyen, Tran Thai Ha, Phan Gia Quyen, Kian Tran, and Ha Manh Bui. 2023. The role of renewable energy technologies in enhancing human development: Empirical evidence from selected countries. Case Studies in Chemical and Environmental Engineering 8: 100496. [Google Scholar] [CrossRef]
- Ohler, Adrienne, and Ian Fetters. 2014. The causal relationship between renewable electricity generation and GDP growth: A study of energy sources. Energy Economics 43: 125–39. [Google Scholar] [CrossRef]
- Opoku, Samuel Kwasi, Walter Leal Filho, Fudjumdjum Hubert, and Oluwabunmi Adejumo. 2021. Climate Change and Health Preparedness in Africa: Analysing Trends in Six African Countries. International Journal of Environmental Research and Public Health 18: 4672. [Google Scholar] [CrossRef]
- Ortman, Scott, and Jose Lobo. 2020. Smithian growth in a nonindustrial society. Science Advances 6: eaba5694. [Google Scholar] [CrossRef] [PubMed]
- Oxford Institute for Energy Studies, and Aliaksei Patonia. 2020. Trust in Ultima Thules: Social Capital and Renewable Energy Development in Iceland and Greenland. Part I. Arctic and North 41: 182–219. [Google Scholar] [CrossRef]
- Ozturk, Serdar, and Seher Suluk. 2020. The granger causality relationship between human development and economic growth: The case of Norway. International Journal of Research in Business and Social Science 9: 143–53. [Google Scholar] [CrossRef]
- Pietrosemoli, Licia, and Carlos Rodríguez Monroy. 2013. The impact of sustainable construction and knowledge management on sustainability goals. A review of the Venezuelan renewable energy sector. Renewable and Sustainable Energy Reviews 27: 683–91. [Google Scholar] [CrossRef]
- Sims, Christopher. 1980. Macroeconomics and Reality. Econometrica 48: 1–18. [Google Scholar] [CrossRef]
- Siraj, Mahwish, Shahid Ali, Syed Shah, Farhat Khan, and Imran Khalid. 2022. Effect of small hydropower projects on human development index in Azad Jammu and Kashmir. International Journal of Agricultural Extension 10: 291–99. [Google Scholar] [CrossRef]
- Sivramkrishna, Sashi. 2019. Paradox of plenty: Norway’s macroeconomic policy dilemmas during the oil price crash, 2014–2015. Journal of Post Keynesian Economics 42: 191–214. [Google Scholar] [CrossRef]
- Steingrímsson, Benedikt, Sveinbjorn Björnsson, and Hakon Aðalsteinsson. 2008. Master Plan for Geothermal and Hydropower Development in Iceland. The second African Rift Geothermal Conference (ARGeo_C2). Available online: https://www.bgr.de/geotherm/argeoc2/docs/sessions/s4_Steingrimsson_Master_Plan.pdf (accessed on 11 November 2023).
- Tellefsen, Tom, Jan Van Putten, and Ole Gjerde. 2020. Norwegian Hydropower. IEEE Power and Energy Magazine. Available online: https://0-www-ieee-org.brum.beds.ac.uk/ns/periodicals/PES/Articles/PE_SeptOct2020_Hydropower.pdf (accessed on 15 November 2023).
- Tiwari, Aviral Kumar, Mustafa Kocoglu, Umer Jeelanie Banday, and Ashar Awan. 2022. Hydropower, human capital, urbanization and ecological footprints nexus in China and Brazil: Evidence from quantile ARDL. Environmental Science and Pollution Research 29: 68923–40. [Google Scholar] [CrossRef] [PubMed]
- Tomczyk, Pawel, and Miroslaw Wiatkowski. 2020. Challenges in the Development of Hydropower in Selected European Countries. Water 12: 3542. [Google Scholar] [CrossRef]
- UNDP. 2024. Human Development Index. Available online: https://hdr.undp.org/data-center/human-development-index#/indices/HDI (accessed on 10 December 2023).
- Vik, Amund, and Benjamin Smith. 2009. Nordic energy Technology: Enabling a Sustainable Nordic Energy Future. In Nordic Energy Research. Available online: https://www.osti.gov/etdeweb/servlets/purl/967577 (accessed on 11 November 2023).
- Vo, Anh, Duc Hong Vo, and Quan Thai-Thuong Le. 2019. CO2 Emissions, Energy Consumption, and Economic Growth: New Evidence in the ASEAN Countries. Journal of Risk and Financial Management 12: 145. [Google Scholar] [CrossRef]
- Wackernagel, Mathis, and David Yount. 1998. The ecological footprint: An indicator of progresstowards regional sustainability. Environmental Monitoring and Assessment 51: 511–29. [Google Scholar] [CrossRef]
- Wooldridge, Jeffrey. 2013. Introductory Econometrics: A Modern Approach, 5th ed. Mason: South-Western Cengage Learning. [Google Scholar]
Figure 1.
Human Development Index (composite). Source: done by the author depending on the data of United Nations Development Program.
Figure 1.
Human Development Index (composite). Source: done by the author depending on the data of United Nations Development Program.

Figure 2.
Electricity production from hydroelectric sources (% of total). Source: done by the authors depending on the data provided by World Bank.
Figure 2.
Electricity production from hydroelectric sources (% of total). Source: done by the authors depending on the data provided by World Bank.

Figure 3.
Roots of residuals. (done by authors).

Figure 4.
Impulse response analysis (authors’ calculations).


Table 1.
Summary of some literature.
| Source | Variables | Application | Model | Results |
|---|---|---|---|---|
| (De Faria et al. 2017) | Hydroelectricity measured in megawatts, agricultural GDP, Industrial GDP, % of public electricity access, % of public water access. | Brazil & China (1999–2010) | event-study and difference-in-differences | Negative significant relation |
| (Amer 2020) | HDI, CO2 per capita, renewable energy consumption, energy intensity, financial development, trade openness | High, middle, and lower income countries (1990–2015) | VAR | Insignificant relationship except in lower income countries |
| (Gyamfi et al. 2020) | HDI, hydroelectricity energy, renewable energy consumption, non-renewables energy consumption, CO2 emissions, population, and GDP per capita | G7 countries (1990–2018) | Kao integration model | It ends with U-shaped relation in the long run in these countries. |
| (Khezri et al. 2022) | CO2, HDI, hydroelectricity share in electricity generation, ratification of Kyoto protocol, number of patents, average OPEC prices, energy use, population, share of geothermal in electricity generation, share of bioenergy in electricity generation, share of wind in electricity generation, share of solar energy in electricity generation | ASEAN (2000–2018) | FMOLS | Insignificant |
| (Nguyen et al. 2023) | HDI, inflation, gross national income per capita, renewable energy consumption per capita, wind energy consumption per capita, hydro energy consumption per capita, financial development index, economic growth, FDI, globalization index, urbanization rate, solar energy consumption per capita | 110 countries (2000–2019) | Panel corrected standard error model | Positive relation between hydro energy and HDI |
Table 2.
List of Variables.
| Variable | Stands for | Source |
|---|---|---|
| HDI | Human Development Index | UNDP |
| Hydro | Hydroelectricity Capacity (% of total) | World Bank Data |
| CPT | Control of Corruption: Estimate | World Bank Data |
| LAW | Rule of Law: Estimate | World Bank Data |
| TRADE | Trade Openness (% of GDP) | World Bank Data |
| URB | Urban Population Growth (annual %) | World Bank Data |
Table 3.
Descriptive Data (Authors Calculations).
| HDI | HYDRO | TRADE | URB | LAW | CPT | |
|---|---|---|---|---|---|---|
| Mean | 0.926960 | 2.552318 | 4.40255 | 86.05640 | 1.888961 | 2.158503 |
| Median | 0.199701 | 2.776552 | 0.1442932 | 4.61927 | 0.1124793 | 0.1716438 |
| Max | 0.962 | 4.599390 | 4.720107 | 93.94400 | 2.124782 | 2.459118 |
| Min | 0.886000 | −3.547892 | 4.179818 | 76.73300 | 1.483637 | 1.667649 |
| N | 100 | 100 | 100 | 100 | 100 | 100 |
Table 4.
Correlation results (Authors Calculations).
| Probability | HDI | HYDRO | C_C_E | R_L_E | TRADE | URB |
|---|---|---|---|---|---|---|
| HDI | 1 | |||||
| HYDRO | 0.244596 ** | 1 | ||||
| C_C_E | −0.474171 *** | −0.579831 *** | 1 | |||
| R_L_E | −0.142190 | −0.249858 ** | 0.588297 *** | 1 | ||
| TRADE | −0.032935 | −0.553772 *** | 0.105214 | −0.336148 *** | 1 | |
| URB | −0.081949 | −0.084606 | −0.282592 *** | −0.589812 *** | 0.472327 *** | 1 |
** significant at 5%, *** significant at 1%.
Table 5.
Unit root test results (Authors Calculations).
| Level | 1st Difference | |||
|---|---|---|---|---|
| Intercept | Trend & intercept | Intercept | trend & intercept | |
| HDI | ADF: −3.000095 ** | ADF: −3.066967 | ADF: 10.37061 *** | ADF: −10.31690 *** |
| PP: −3.19852 ** | PP: −3.294007 * | PP: −10.36974 *** | PP: −10.31609 *** | |
| Hydro | ADF: −2.03863 | ADF: −1.53284 | ADF: −10.46094 *** | ADF: −10.58098 *** |
| PP: −2.038639 | PP: −1.490561 | PP: −10.45959 *** | PP: −10.58098 *** | |
| URB | ADF: −2.078750 | ADF: −2.074136 | ADF: −9.61441 *** | ADF: −9.566405 *** |
| PP: −2.177221 | PP: −2.177009 | PP: −9.614418 *** | PP: −9.566405 *** | |
| CPT | ADF: −2.74687 * | ADF: −2.947731 | ADF: −11.31307 *** | ADF: −11.27192 *** |
| PP: −2.746872 * | PP: −2.877031 | PP: −11.66981 *** | PP: −11.64127 *** | |
| LAW | ADF: −2.491330 | ADF: −2.586796 | ADF: −10.13882 *** | ADF: −10.10399 *** |
| PP: −2.518556 | PP: −2.617339 | PP: −10.20728 *** | PP: −10.16939 *** | |
| TRADE | ADF: −2.469987 | ADF: −2.612657 | ADF: −10.1755 *** | ADF: −10.12317 *** |
| PP: −2.545127 | PP: −2.772847 | PP: −10.1755 *** | PP: −10.12317 *** |
* significant at 10%, ** significant at 5%, *** significant at 1%.
Table 6.
Lag length table (authors calculations).
| Lag | LogL | LR | FPE | AIC | SC | HQ |
|---|---|---|---|---|---|---|
| 0 | 25.24650 | NA | 2.65 × 10¹¹ | −0.418402 | −0.253938 | −0.352023 |
| 1 | 422.5030 | 734.0610 | 1.03 × 10¹¹ | −8.271805 * | −7.120553 * | −7.807150 * |
| 2 | 454.3382 | 54.67347 | 1.14 × 10¹¹ * | −8.181265 | −6.043227 | −7.318335 |
| 3 | 471.0100 | 26.45743 | 1.78 × 10¹¹ | −7.761087 | −4.636262 | −6.499881 |
| 4 | 488.3835 | 25.30489 | 2.80 × 10¹¹ | −7.356163 | −3.244552 | −5.696682 |
| 5 | 509.0551 | 27.41236 | 4.23 × 10¹¹ | −7.022938 | −1.924539 | −4.965181 |
| 6 | 556.1417 | 56.29918 | 3.77 × 10¹¹ | −7.263950 | −1.178765 | −4.807918 |
| 7 | 602.6237 | 49.51347 | 3.60 × 10¹¹ | −7.491821 | −0.419848 | −4.637513 |
| 8 | 662.8816 | 56.32803 | 2.76 × 10¹¹ | −8.019166 | 0.039593 | −4.766583 |
* significant at 10%.
Table 7.
VAR results (authors calculations).
| HDI | HYDRO | CPT | LAW | TRADE | URB | |
|---|---|---|---|---|---|---|
| HDI (−1) | [5.79779] | [0.75071] | [0.23630] | [−0.40696] | [0.11536] | [−0.38114] |
| HDI (−2) | [0.13462] | [−0.00830] | [−0.90985] | [0.2191] | [−1.80470] | [0.17301] |
| HYDRO (−1) | [0.11465] | [6.50678] | [0.50540] | [−1.07585] | [−1.18433] | [0.10119] |
| HYDRO (−2) | [0.26967] | [1.55390] | [−1.60516] | [0.50048] | [0.51859] | [0.72484] |
| CPT (−1) | [−0.83226] | [0.16533] | [5.98485] | [0.10400] | [0.04115] | [−0.09349] |
| CPT (−2) | [0.15646] | [0.90512] | [−0.71751] | [0.91463] | [−0.18831] | [1.41035] |
| LAW (−1) | [0.45975] | [−0.08392] | [−0.46881] | [6.10477] | [−1.77301] | [0.55609] |
| LAW (−2) | [−0.53574] | [−0.22294] | [1.34525] | [−1.29612] | [0.83380] | [−0.10226] |
| TRADE (−1) | [0.15721] | [−2.95902] | [−0.00586] | [−1.96538] | [5.68106] | [−0.10079] |
| TRADE (−2) | [1.55193] | [2.78730] | [−1.44045] | [0.18478] | [0.10397] | [1.81912] |
| URB (−1) | [0.00179] | [−0.85799] | [0.49287] | [−0.15494] | [0.40741] | [7.53830] |
| URB (−2) | [−0.96122] | [1.10057] | [−0.66549] | [−0.86252] | [−0.31811] | [−0.14055] |
| C | [1.20990] | [−0.82722] | [2.29133] | [2.81503] | [3.74191] | [−1.02485] |
| R-squared | 0.735582 | 0.961098 | 0.792932 | 0.776608 | 0.814933 | 0.854647 |
| Adj. R-squared | 0.698252 | 0.955606 | 0.763699 | 0.745070 | 0.788806 | 0.834127 |
Table 8.
VIF results (authors calculations).
| Coefficient | Uncentered | Centered | |
|---|---|---|---|
| Variable | Variance | VIF | VIF |
| HYDRO | 5.72 × 10⁻⁹ | 6.977007 | 2.555980 |
| C_C_E | 0.000220 | 356.9200 | 2.220480 |
| R_L_E | 0.000587 | 727.7542 | 2.545640 |
| TRADE | 4.55 × 10⁻⁸ | 109.4631 | 2.326558 |
| URBAN_POP | 2.44 × 10⁻⁷ | 627.3050 | 1.784257 |
| C | 0.006340 | 2194.702 | NA |
Table 9.
Heteroscedasticity tests results (authors’ calculations).
| Test | Df | Probability |
|---|---|---|
| Chi-squared | 1943.443 | 0.1916 |
Table 10.
Roots of residuals (authors calculations).
| Root | Modulus |
|---|---|
| 0.955410 | 0.955410 |
| 0.880816 − 0.088918i | 0.885293 |
| 0.880816 + 0.088918i | 0.885293 |
| 0.775367 − 0.197154i | 0.800040 |
| 0.775367 + 0.197154i | 0.800040 |
| 0.353833 − 0.325499i | 0.480777 |
| 0.353833 + 0.325499i | 0.480777 |
| −0.025225 − 0.206371i | 0.207907 |
| −0.025225 + 0.206371i | 0.207907 |
| −0.110622 − 0.115492i | 0.159924 |
| −0.110622 + 0.115492i | 0.159924 |
| 0.078156 | 0.078156 |
Disclaimer/Publisher’s Note: The statements, opinions and data contained in all publications are solely those of the individual author(s) and contributor(s) and not of MDPI and/or the editor(s). MDPI and/or the editor(s) disclaim responsibility for any injury to people or property resulting from any ideas, methods, instructions or products referred to in the content. |
© 2024 by the authors. Licensee MDPI, Basel, Switzerland. This article is an open access article distributed under the terms and conditions of the Creative Commons Attribution (CC BY) license (https://creativecommons.org/licenses/by/4.0/).
Share and Cite
MDPI and ACS Style
Metwally, A.B.M.; Nabil, S.M.; Yasser, M.M. Hydropower & HDI Nexus in Nordic Countries Using VAR Techniques. Economies 2024, 12, 60. https://0-doi-org.brum.beds.ac.uk/10.3390/economies12030060
AMA Style
Metwally ABM, Nabil SM, Yasser MM. Hydropower & HDI Nexus in Nordic Countries Using VAR Techniques. Economies. 2024; 12(3):60. https://0-doi-org.brum.beds.ac.uk/10.3390/economies12030060
Chicago/Turabian StyleMetwally, Abdelmoneim B. M., Shahd M. Nabil, and Mai M. Yasser. 2024. "Hydropower & HDI Nexus in Nordic Countries Using VAR Techniques" Economies 12, no. 3: 60. https://0-doi-org.brum.beds.ac.uk/10.3390/economies12030060
Note that from the first issue of 2016, this journal uses article numbers instead of page numbers. See further details here.