Article

Environmental Perception Q-Learning to Prolong the Lifetime of Poultry Farm Monitoring Networks

1
Beijing Orient Institute of Measurement and Test, China Academy of Space Technology, Beijing 100094, China
2
School of Electronic Engineering, Beijing University of Posts and Telecommunications, Beijing 100876, China
*
Authors to whom correspondence should be addressed.
Submission received: 29 October 2021 / Revised: 25 November 2021 / Accepted: 27 November 2021 / Published: 3 December 2021
(This article belongs to the Collection Electronics for Agriculture)

Abstract

:
The reduction of the effects of heat-stress phenomena on poultry health and energy conservation of poultry farm monitoring networks are highly related problems. To address these problems, we propose environmental perception Q-learning (EPQL) to prolong the lifetime of poultry farm monitoring networks. EPQL consists of an environmental-perception module and Q-learning. According to the temperature and humidity model of heat stress, an environmental-perception module determines the transmission rate, while Q-learning adjusts the transmission rate according to the success rate of packet transmission and the remaining energy. In real-world tests, our poultry farm monitoring networks used only about 8% of energy in a month. The real-time information of these monitoring networks was available on smartphones. In laboratory tests, compared with CSMA/CA (23.67 days), S-MAC (109.37 days), and T-MAC (252.79 days) under real systems with 2000 mAh battery, the battery-life performance of EPQL (436.48 days) was better. Moreover, EPQL reduces the packet loss rate by about 60% while simultaneously decreasing the average delay by about 20%. Generally, based on the framework of EPQL, the implemented temperature and humidity model of heat stress for poultry could be replaced by other models to extend its applicability range.

1. Introduction

With the large-scale deployment of wireless sensor networks (WSNs), intelligent algorithms are widely used to enhance equipment performance. This not only expands our perception capability of monitoring environments but also improves the production efficiency of equipment [1]. In poultry farm monitoring networks, the energy-saving performances of sensor nodes are important. The research background is as follows.
(i) From a communications perspective, the RF modules of sensor nodes consume most of the energy by transmitting and receiving data. We review and discuss the related technology of commercialized protocols in Section 2.1.
(ii) Besides, poultry is prone to be in heat stress because of high temperature and humidity. Heat stress seriously affects the health of poultry [2,3]. Recently, most companies have used WSNs to monitor feeding environments and respond to unfavorable environmental conditions by adjusting temperature, humidity, wind speed, and air quality [4,5,6]. We review and discuss the related technology of real-world monitoring applications in Section 2.2. However, as far as we know, there is little research concerning energy-saving schemes for poultry farm monitoring networks. Poultry farming is practiced extensively around the world. Meanwhile, with the scale of poultry farming increasing, the number of sensor nodes also increases. This indicates the conflict between the large data-transmission requirements and energy-saving requirements.
This paper proposes environmental perception Q-learning (EPQL) to prolong the lifetime of poultry farm monitoring networks. Our contributions are as follows. To save energy, we designed an EPQL-based poultry farm monitoring network that is characterized by the use of professional knowledge of heat-stress phenomena. EPQL focuses on the heat-stress phenomena of poultry to design an environmental-perception module, which determines the transmission rate. Based on the determined transmission rate, EPQL uses Q-learning to adjust the transmission rate according to the success rate of packet transmission and the remaining energy. Our poultry farm monitoring networks realized energy saving in real-world tests. The real-time information of these monitoring networks were available on smartphones. Moreover, the laboratory tests under real systems with 2000 mAh battery demonstrate that EPQL could effectively prolong the lifetime of poultry farm monitoring networks.
This paper is organized as follows. Section 2 introduces related works and discusses the research background. Section 3 presents our poultry farm monitoring network, whichfocuses on the framework and implementation of EPQL. Section 4 presents the results and a discussion of the real-world and laboratory tests. Section 5 gives concluding remarks and findings.

2. Related Work

2.1. Energy-Saving Protocols

Etnergy-saving protocols focus on the MAC layer. Generally, this researche falls into two categories.
One is characterized by adjusting duty cycle and reducing energy consumption in the idle monitoring state. By adding a TA period, timeout-MAC (T-MAC) is proposed, and nodes compete with each other in the TA period [7]. The nodes that fail to win channels directly enter the dormant state after TA. This reduces the overhead of idle monitoring. Sensor-MAC (S-MAC) realizes energy efficiency as its primary goal in environmental-monitoring sensor networks [8]. S-MAC uses periodic sleeping to achieve the low-duty-cycle operation and prolongs the network lifetime compared with 802.11-like protocols without sleeping. To further enhance adaptability, Zhao et al. propose an adaptive duty cycle MAC, such as SEA-MAC, which can flexibly schedule data transmission during hibernation. When the network experience load is very low (or very high), SEA-MAC dynamically adjusts the work cycle, thereby reducing the inefficient work cycles (or end-to-end delay) [9]. Based on Q-learning, Ye and Zhang propose a self-adaptive sleep/wake-up scheduling approach (SA-Mech) [10]. This enables nodes to independently decide their operations (i.e., sleep, listen, or transmit) in each slot and then achieves adaptive duty cycle.
Besides, there are some research lines that focus on reducing the frame-collision probability, decreasing the number of retransmissions, and avoiding the wasted energy of continuously retransmitting frames. Nur et al. propose a distributed MAC protocol (i.e., DCD-MAC) by taking advantage of spatial reusability from directional communications [11]. DCD-MAC synchronizes transmission and reception for each pair of parent and child nodes. This is effective to minimize collisions in order to save energy. Except for applying micro-cycles and adaptive micro-cycle duty-cycle mechanisms, Xu and Wang propose MDA-SMAC [12]. This protocol includes binary exponential backoff algorithms to reduce data latency and energy consumption. Nguyen et al. propose the energy-efficient QoS-based congestion-control scheme (named eqCC), which uses the remaining battery level, monitors queue length, and estimates throughput to adjust the data-transmission rate [13]. This is effective to save energy and maintain high QoS levels. Kumar and Kim propose contention-free TDMA scheduling algorithms (named cf-TDMA) based on multiple RF channels [14]. This can eliminate collisions and overhearing to reduce energy consumption while simultaneously supporting concurrent communications. Masud et al. propose an improved traffic-class-prioritization-based carrier sense multiple access/collision avoidance (TCP-CSMA/CA) scheme for prioritized channel access [15]. This kind of channel access assigns a distinct and prioritized backoff period range to each traffic class in every backoff, which can effectively reduce delay, packet loss rate, and energy consumption.
As previously reviewed, ensuring two or more objectives (like saving energy and improving throughput) in the universal commercialized fields is difficult. From a requirement perspective, these commercialized protocols consider the demands of various fields. The discussions of these schemes are given in Table 1.

2.2. Monitoring Applications

Recently, there have been some new monitoring applications to save energy, such as monitoring of crops, greenhouses, smart offices, forest fires, farmlands, animal behaviors, and so on.
One kind of research focuses on data features. Ahmedy et al. propose smart agriculture monitoring networks (SAMNs) instead of multi-hop networks for large geographical greenhouse monitoring [16]. This kind of SAMN is characterized by constantly monitoring higher sensitivity crops and occasionally monitoring lower sensitivity crops, thereby reducing the average energy consumption and average delay. Li et al. propose a data-compression technique for multi-parameter farmland WSN [17]. This technique takes advantage of continuity in time and spatial variation of parameter data in farmlands, thereby reducing the data-transmission quantity and reducing energy consumption.
Another kind of research is based on the specific-field models. To simultaneously optimize energy efficiency and packet delay, Luo et al. studied the two-side tradeoff as an optimization problem [18]. They propose a traffic prediction method to estimate the next-period packet number and control sleep time to achieve the desired energy efficiency and delay in real-world environments, such as green belts, greenhouses, and smart offices. Tian et al. propose a weather-adaptive, receiver-initiated MAC protocol (WA-MAC), which uses weather forecast information (like rainfall information) to schedule sensors in order to avoid data loss and shorten delay in the coming time slots [19]. WA-MAC reduces idle listening time to effectively save energy. Kang et al. propose an adaptive duty-cycled hybrid X-MAC (ADX-MAC) protocol for energy-efficient forest-fire prediction, which can adjust the duty cycle according to computation of forest-fire risk [20]. With increasing forest-fire risk, the duty cycle is shortened to ensure detection of forest fires at a faster cycle rate. Kiani et al. propose an energy-saving technique for monitoring animal behaviors to control the transmission rate in the time-varying network topology [6]. By classifying cow behaviors, the system reduces energy consumption. To realize easy installation and maintenance, Valente et al. designed a cluster network based on LoRaWAN for intelligence agriculture [21]. This network and system could measure soil and air temperature, wind speed, gust and direction, soil water content, water tension, and so on. This information is aggregated and analyzed in the background platform. To counter unstable network connections, Prakosa et al. present the IoT scheme based on LoRa for real-world long-range agriculture areas, which could monitor temperature, humidity, soil moisture, and soil pH [22].
As previously reviewed, there are some new monitoring systems. In general, these systems usually make use the professional knowledge in their own field. Discussions of these systems are given in Table 2.
Generally, these technologies use field-specific knowledge to reduce the amount of data to be sent. This kind of technical idea is not suitable for the universal commercialized fields. However, it is effective for field-specific applications. If the amount of data to be sent could be reasonably reduced, and then the network performances could be improved. Inspired by these kinds of technical ideas, we used the temperature and humidity regression equations to reduce the amount of data to be sent in poultry farm monitoring networks.

3. Materials and Methods

3.1. Motivation

Since 1980 or earlier, the effect temperature and humidity on poultry has been studied [23]. However, as far as we know, there is little research using the related temperature and humidity model [3,24] to prolong the lifetime of poultry farm monitoring networks.

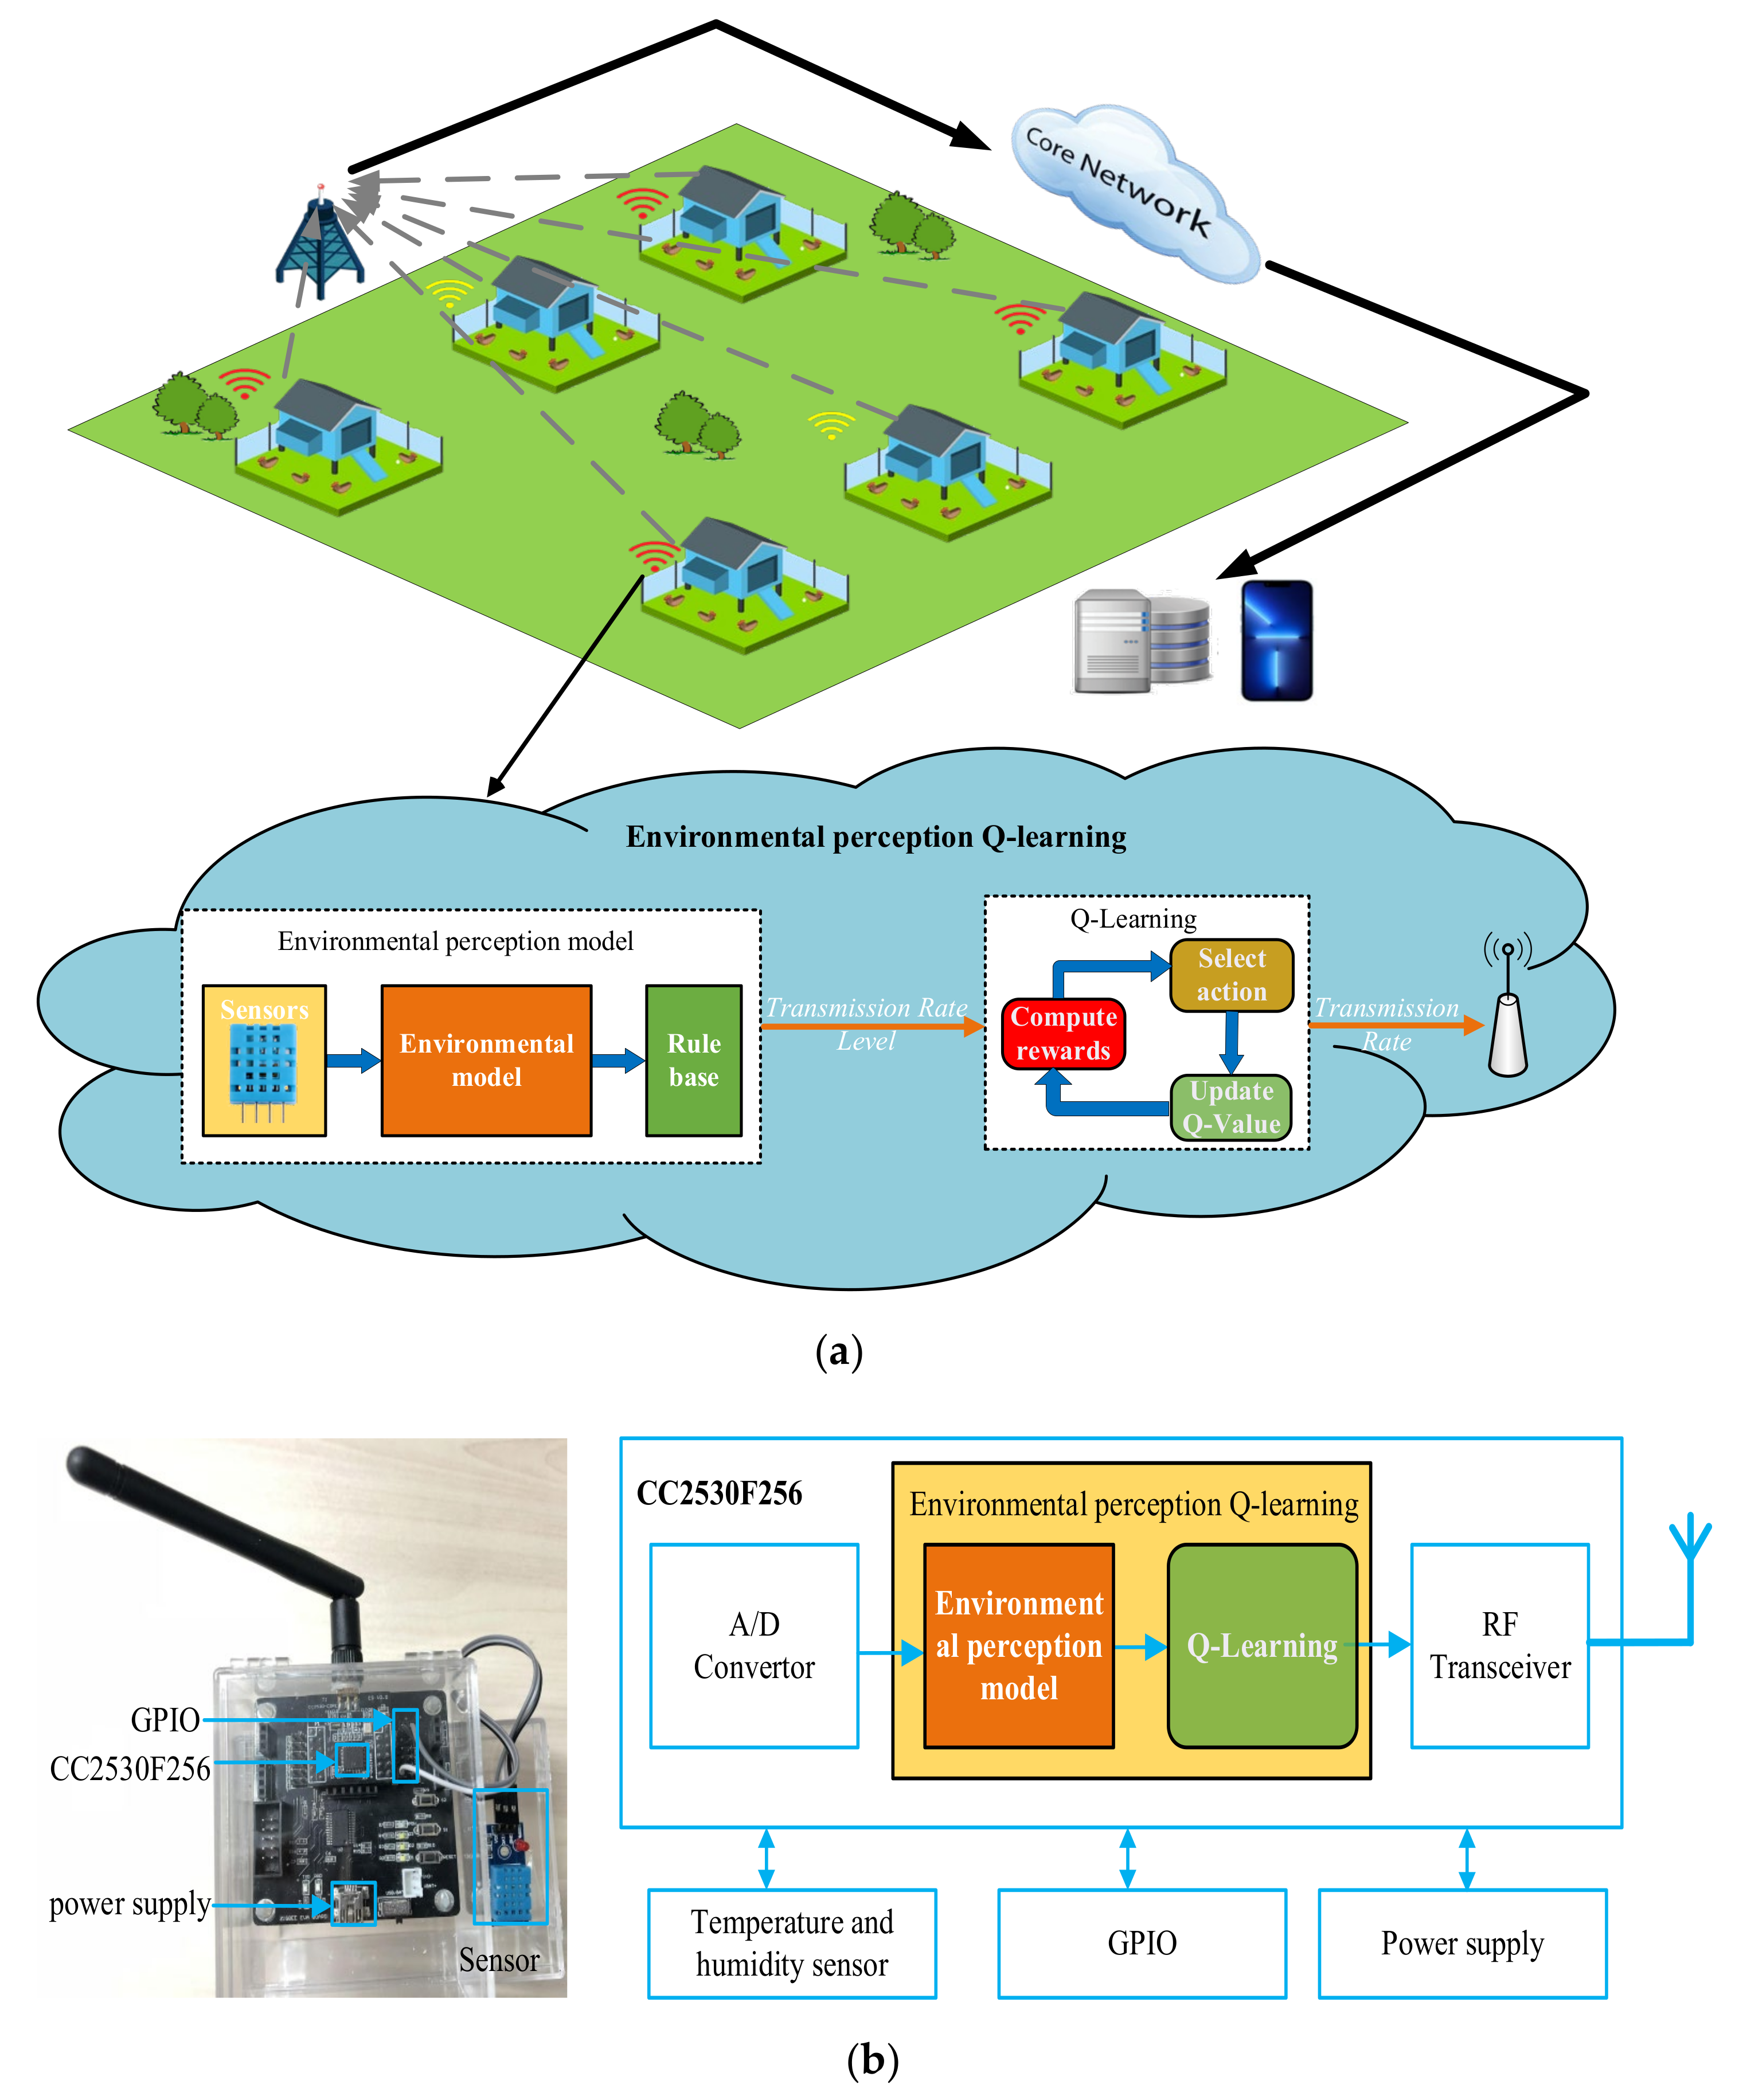
3.2. System Overview

Figure 1a presents a poultry farm monitoring network on the top side and explains EPQL’s framework on the bottom side. Sensor nodes are deployed in poultry farms, and the temperature and humidity data are collected by remote cloud servers. Meanwhile, Figure 1b provides a block diagram of sensor nodes to demonstrate the different parts of sensor nodes and EPQL’s position in sensor nodes. A sensor node includes a CPU (i.e., CC2530F256 with A/D converter and RF transceiver), a temperature and humidity sensor, GPIO, and a power supply. We describe a real application of this system in Section 4.1.
EPQL consists of an environmental-perception module and Q-learning, which is given in Algorithm 1. According to the temperature and humidity model of heat stress [3], the environmental-perception module decides the transmission rate according to the real-time temperature and humidity data. Besides, Q-learning adjusts the transmission rate and then reduced the energy consumption of the poultry farm monitoring network.
Algorithm 1 Environmental perception Q-learning
Input: learning rate a, discount factor r
1:Initialize the system of sensor node and set the Q-value table to zero.
2:For each round (one round corresponds to τ seconds)
3:Each sensor collects the temperature, T, and humidity, H, on poultry farms.
4:Use environmental-perception module in Section 3.3 and then decide the transmission rate.
5:Use Q-learning in Algorithm 2 to adaptively adjust the transmission rate.
6:End

3.3. Environmental-Perception Module

According to the real-time temperature and humidity data, the environmental-perception module decides the transmission rate. As shown in Figure 1a, the environmental-perception module includes environmental model and rule base.

3.3.1. Environmental Model

The environmental model gives the temperature and humidity constraints to guarantee mortality rates and egg-production rates.
First, indoor temperature and relative humidity play a significant role in mortality rates and egg-production rates. According to real-world data, between April and August, Bayhan et al. obtained the temperature and humidity regression equations in Equations (1)–(3) [3]. THI is the temperature-humidity index, T is the indoor temperature (°C), H is the indoor relative humidity, MR is the mortality rate, EPR is the egg-production rate, and Age is the poultry’s age. In this paper, we assume that Age = 90 days.
THI = 1.8 T − (1 − H) × (T − 14.3) + 32
MR = −2.14 + 0.0346 THI
EPR = 116 − 0.256THI − 0.0528 Age
Secondly, according to [3], from an egg-production-rate perspective, THI is divided into three zones (i.e., comfort zone: THI < 70, stress zone: 75 < THI < 78, extreme-stress zone: THI ≥ 78), and these zones correspond to different egg-production rates, such as “>90%”. Similarly, from a mortality-rate perspective, THI is also divided into different zones, such as 65 < THI < 70. Generally, there are mapping relationships among THI, mortality rate, and egg-production rate.
Lastly, when the poultry-farm administrators set the expected mortality rate, Emr, and the expected egg-production rate, Eepr, the transmission rate can be decided based on these relationships. Equations (4) and (5) define mortality-rate state, Smr, and egg-production-rate state, Segr, respectively. Note that comfort and stress zones in Equations (4) and (5) mean good state and bad state, respectively. In this paper, Emr = 0.2‰, and Eepr = 90%.
S mr = comfort   zone   MR   E mr stress   zone others
S egr = comfort   zone   EPR     E egr stress   zone others

3.3.2. Rule Base

The rule base is used to decide the transmission rate (i.e., [the lower limit of transmission rate Limitl, the upper limit of the transmission rate Limitu]). According to Smr and Segr, there are high, medium, and low rate levels in Equations (6)–(8), respectively.
IF   S m   =   stress   zone   and   S egr   =   stress   zone THEN   high   rate   level   ( i . e . ,   [ L i m i t l   =   2480   bps ,   L i m i t u   =   5680   bps ] )
IF   ( S m   =   comfort   zone   and   S egr   =   stress   zone )   or   ( S m   =   stress   zone   and   S egr   =   comfort   zone ) THEN   medium   rate   level   ( i . e . ,   [ L i m i t l   =   1704   bps ,   L i m i t u   =   2840   bps ] )
IF   ( S m   =   comfort   zone   and   S egr   =   comfort   zone THEN   low   rate   level   ( i . e . ,   [ L i m i t l   =   568   bps ,   L i m i t u   =   1704   bps ] )

3.4. Q-learning

Q-learning in Algorithm 2 is a kind of reinforcement learning algorithms. As shown in Figure 1a, Q-learning consists of three parts: compute rewards, select action, and update Q-Value. In this paper, action set A corresponds to various transmission rates {a1, a2, …, am…, aM}. am is equal to Limitl + (m − 1)(LimituLimitl)/M. As shown in Algorithm 2, each node learns by trial and error. For example, one node adjusts the transmission rate in Step 3. If the node has a better reward for saving energy in Step 1, then its behavior is reinforced. Otherwise, its behavior is weakened.
Algorithm 2 Q-learning
Input: learning rate a, discount factor r
1:Step 1: Compute rewards by using Equation (9). st is the current-round state (i.e., the success rate of packet transmission PSR and the rate of the remaining energy (RER), and at is the current-round action (i.e., the current-round transmission rate and at ∈ action set A). The greater the reward, R(st, at), the better energy savings.
2:
R(st, at) = 0.5 × PSR + 0.5 × RER
3:Step 2: Wait next round (i.e., wait τ seconds) and observe the next-round state st+1.
4:Step 3: Select the next-round action, at+1, as follows. First, search in the Q-value table, find the maximum Q-Value (i.e., MaxQValue)), and record the index of this maximum Q-value (i.e., MaxQValueIndex). Then, obtain the transmission rate, at+1, at+1 = A(MaxQValueIndex) and then adjust the transmission rate.
5:Step 4: Update the Q-value table by
6:
Q(st,at) ← Q(st,at) + a×[R(st,at) + r×MaxQValueQ(st,at)]

3.5. Discussions

In poultry farm monitoring networks, sensor nodes are low-cost, with limited resources. Thus, the energy-saving problem is a serious challenge, especially for these low-cost nodes. Better energy-saving performance means lower maintenance costs (like reducing the cost of purchasing the battery and manually replacing nodes). We used EPQL to address this problem because of the following reasons, including:
First, EPQL is a software-improvement scheme, and its computational complexity is mainly based on Q-learning. In Table 1 of [25], the computational complexity of Q-learning is equal to O(T), and T is the total number of steps. In practice, the computation cost of EPQL is relatively low, as shown by its limited number of multiplications and additions in Algorithm 2. The computing performance of existing network nodes is sufficient to be implemented without additional hardware. Moreover, we realized EPQL on the CPU of cc2530F256.
Secondly, by continuously adjusting the transmission rate, EPQL ensures the monitoring performance of the stress zone while simultaneously reducing energy consumption of the comfort zone. These are adjusted by Q-learning in the sensor nodes. The response process of Q-learning is real-time, and the environmental feedback that consists of PSR and RER does not require models and complex computations. Therefore, compared with other methods, such as using deep learning to generate transmission rates at different periods, EPQL can be more flexible to adapt to sudden environmental changes.
Lastly, EPQL is a combination of professional knowledge and Q-learning. Due to the use of poultry farming expertise, it could well meet the communication and energy-saving requirements of poultry farms. The environment model in EPQL can be replaced by other models in poultry farms or even other field models. Moreover, EPQL’s framework can still be used.
There is a limit of EPQL. The generality of EPQL is strictly restricted by its professional knowledge model (i.e., Equations (1)–(3)).

4. Results and Discussions
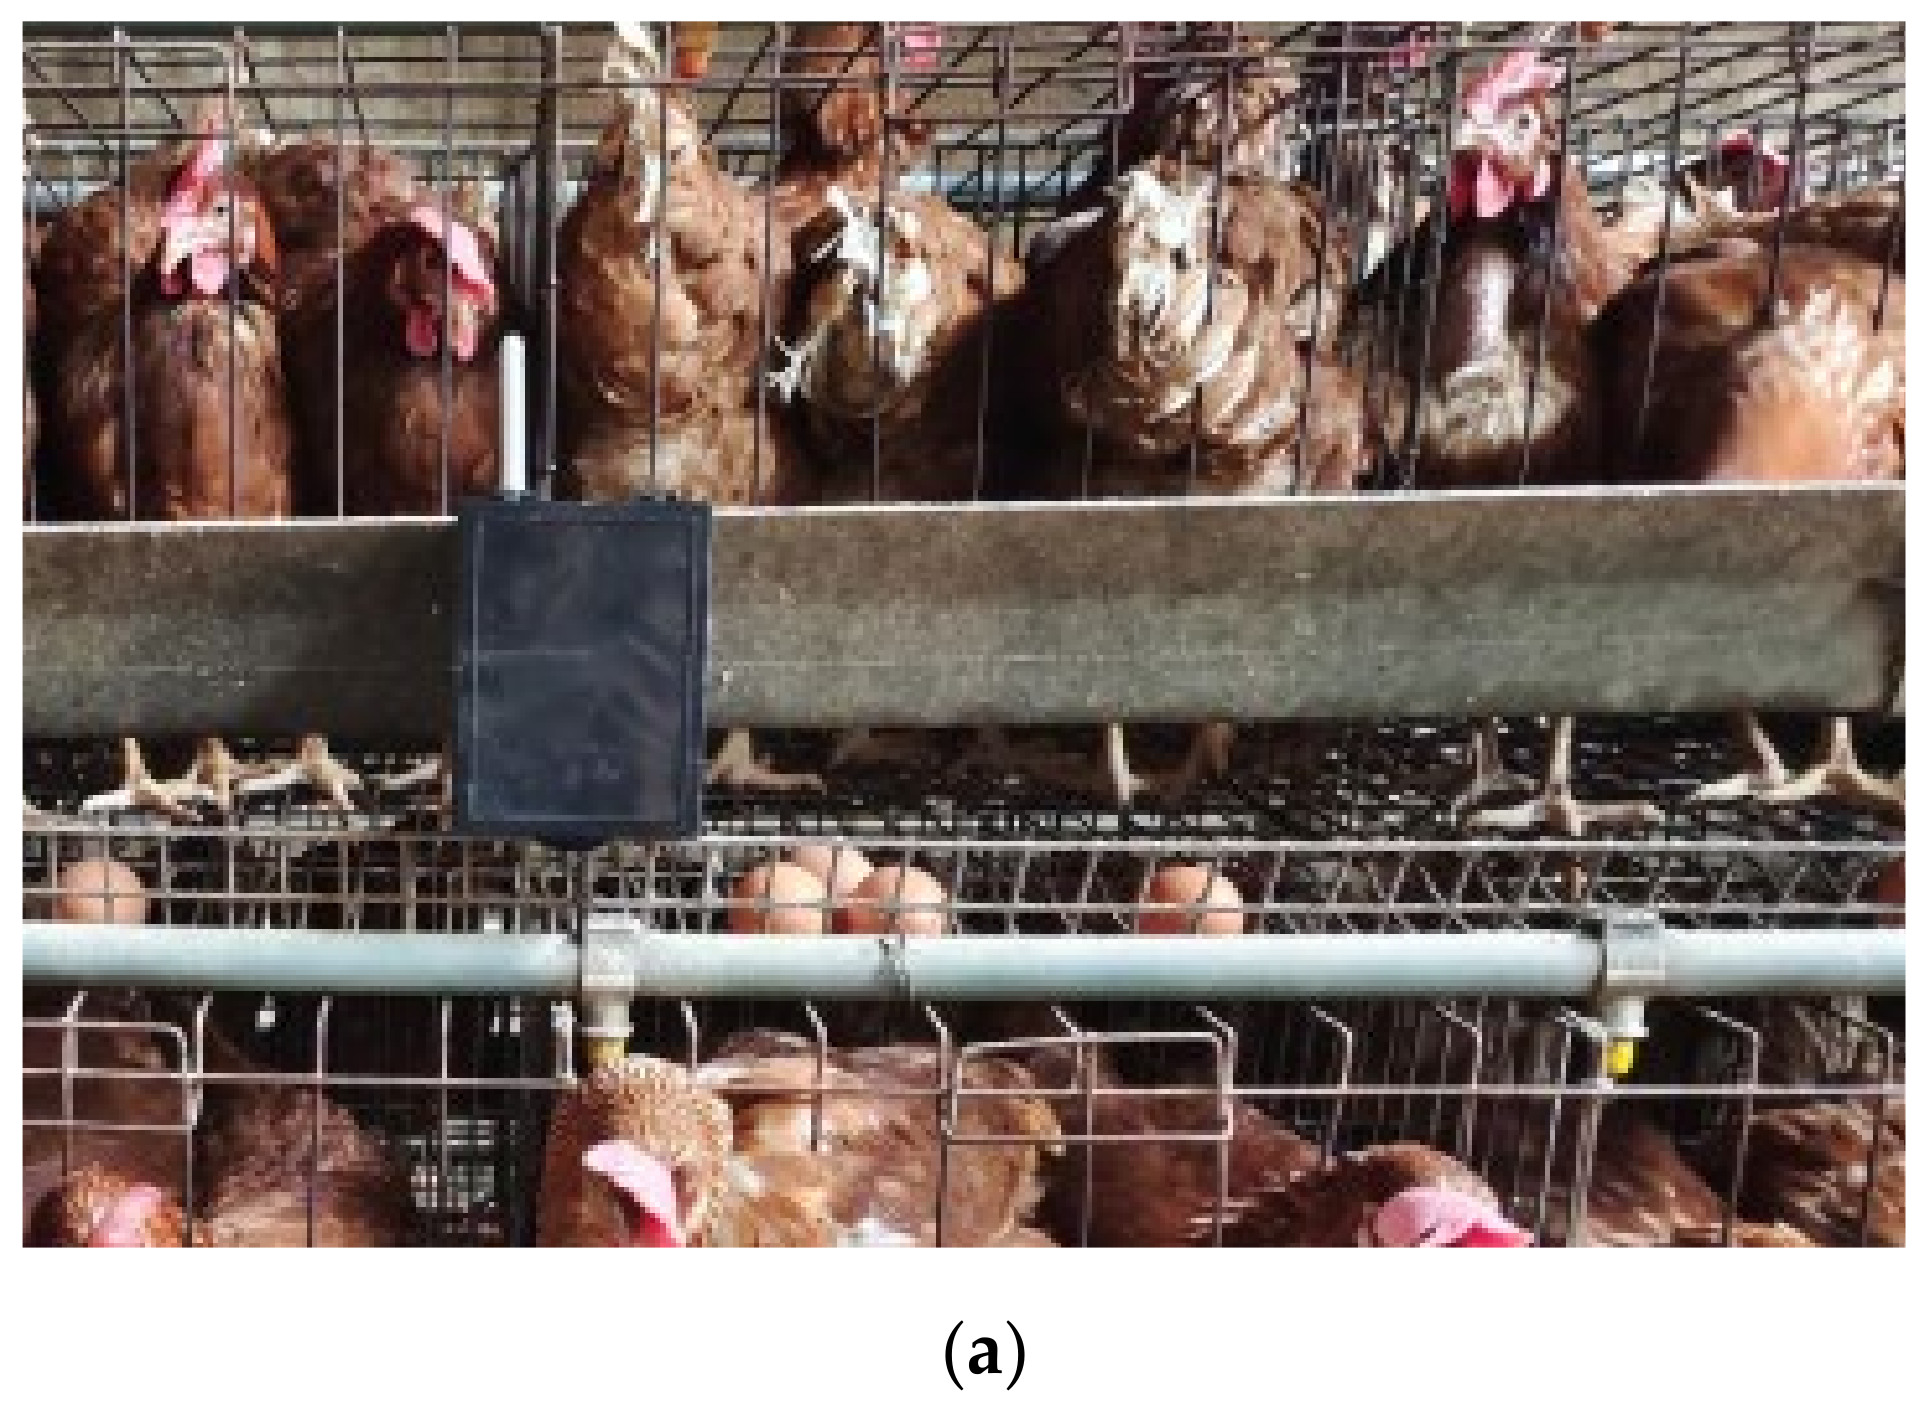
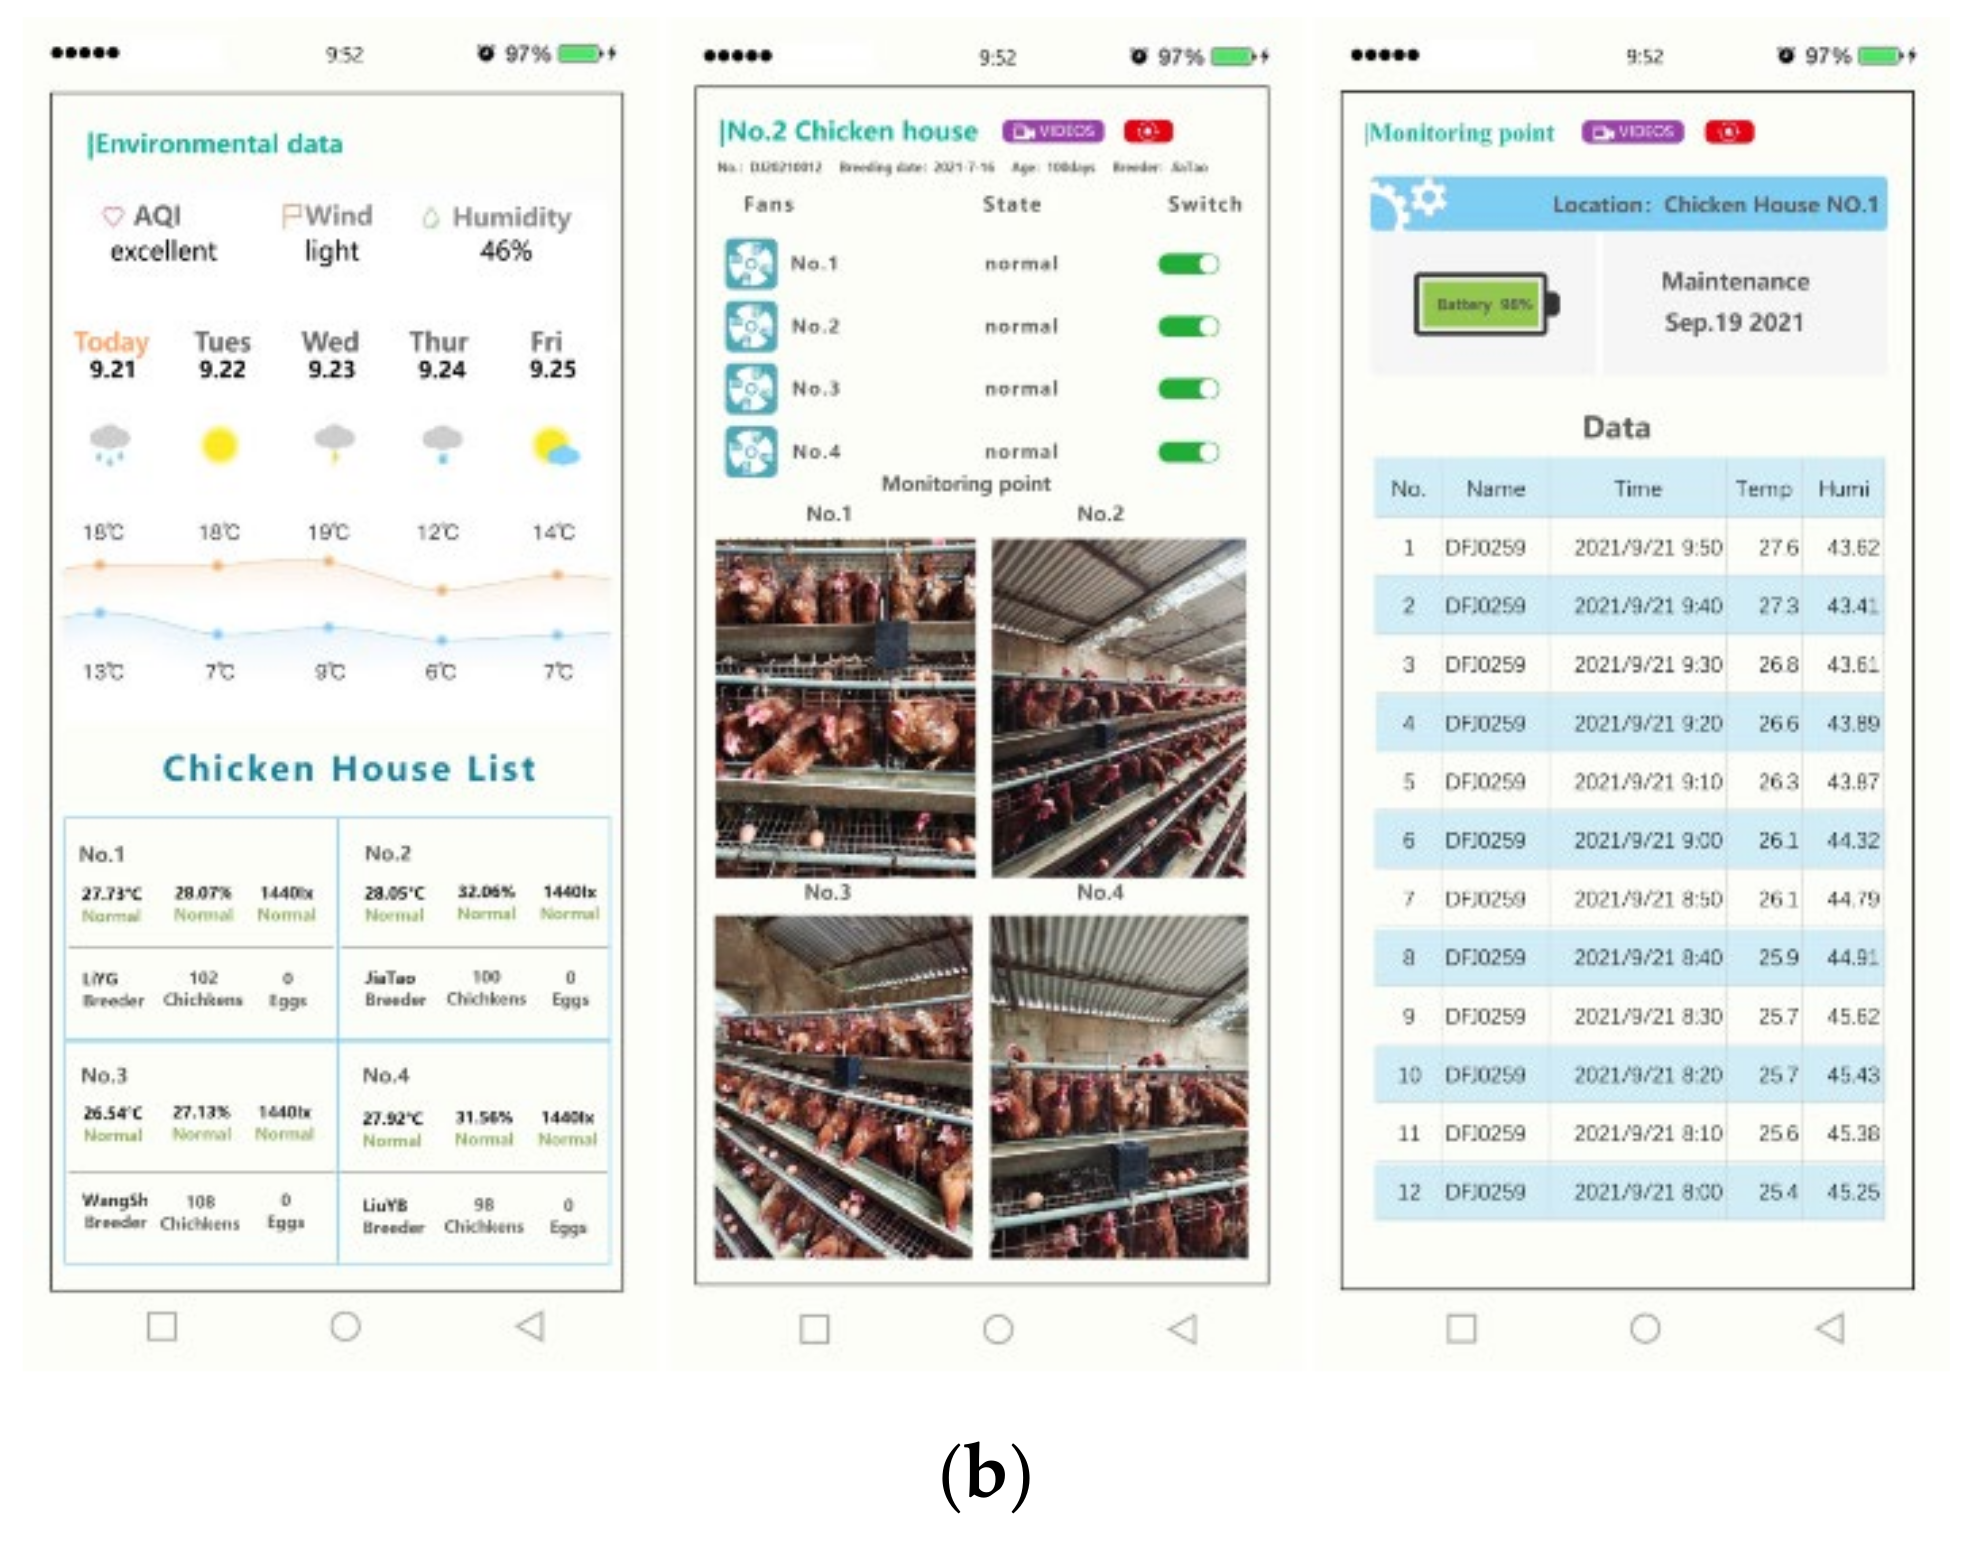
4.1. Real Test

Figure 2 presents our established set of temperature- and humidity-monitoring networks and provides the services of WeChat applets on Huaxing poultry farm in Henan, China. Sensor nodes transmitted data by using EPQL, which were installed to collect temperature and humidity data in multiple chicken houses. Users could obtain the temperature and humidity information of these chicken houses through WeChat applets. Moreover, users could also control the operation of air-conditioning fans. It is difficult to precisely estimate how much electricity is saved in real poultry-farm scenarios. Note that one uncertain factor is that temperature and humidity in all chicken houses could be regulated by users through air-conditioning fans. Moreover, the time-varying temperature and humidity in one day and the uncertain control signals of air-conditioning fans could cause much more uncertainty in monitoring networks.

4.2. Laboratory Test

4.2.1. Experimental Setting

We used the SmartRF Packet Sniffer tool to capture the frame information and then compute real results. Meanwhile, we used the star topology network with six sensor nodes and compared EPQL with CSMA/CA, S-MAC, and T-MAC. Table 3 gives our experimental parameters. Besides, we use Equation (11) to estimate energy consumption. All parameters in Equation (11) come from the CC2530F256 manual, and the idle listening time, Tidle, is given by:
E = 38 mW × Ttx + 39.5 mW × Trx + 36.5 mW × Tidle + 2.97μW × Tsleep
Tidle = TFrame − Ttx − Trx − Tsleep
To compare with CSMA/CA, S-MAC, and T-MAC objectively, we used the environmental temperature and humidity models [26,27,28,29]. This means that the temperature and humidity data of these models were simulated in laboratory tests. Moreover, in this manner, the temperature and humidity data in four kinds of real systems (i.e., CSMA/CA, S-MAC, T-MAC, and EPQL real-world systems) was the same for 24 h. In our model, the temperature ranged from 25 °C to 35 °C, and the humidity ranged from 31% to 64.5%. We used the diurnal temperature cycle model [26,27,28] in Equation (13) and the humidity model [29] in Equation (14).
temperature ( t ) = 25 + 10 cos π 12 t 14                               D a y : t   i s   f r o m   7 : 00   t o   19 : 00 25 + [ 10 cos π 12 t 14 ] e t 19 3.08                 N i g h t : t   i s   f r o m   19 : 00   t o   7 : 00
humidity(t) = exp(−0.0735 × temperature(t) + 1.4) × 100%

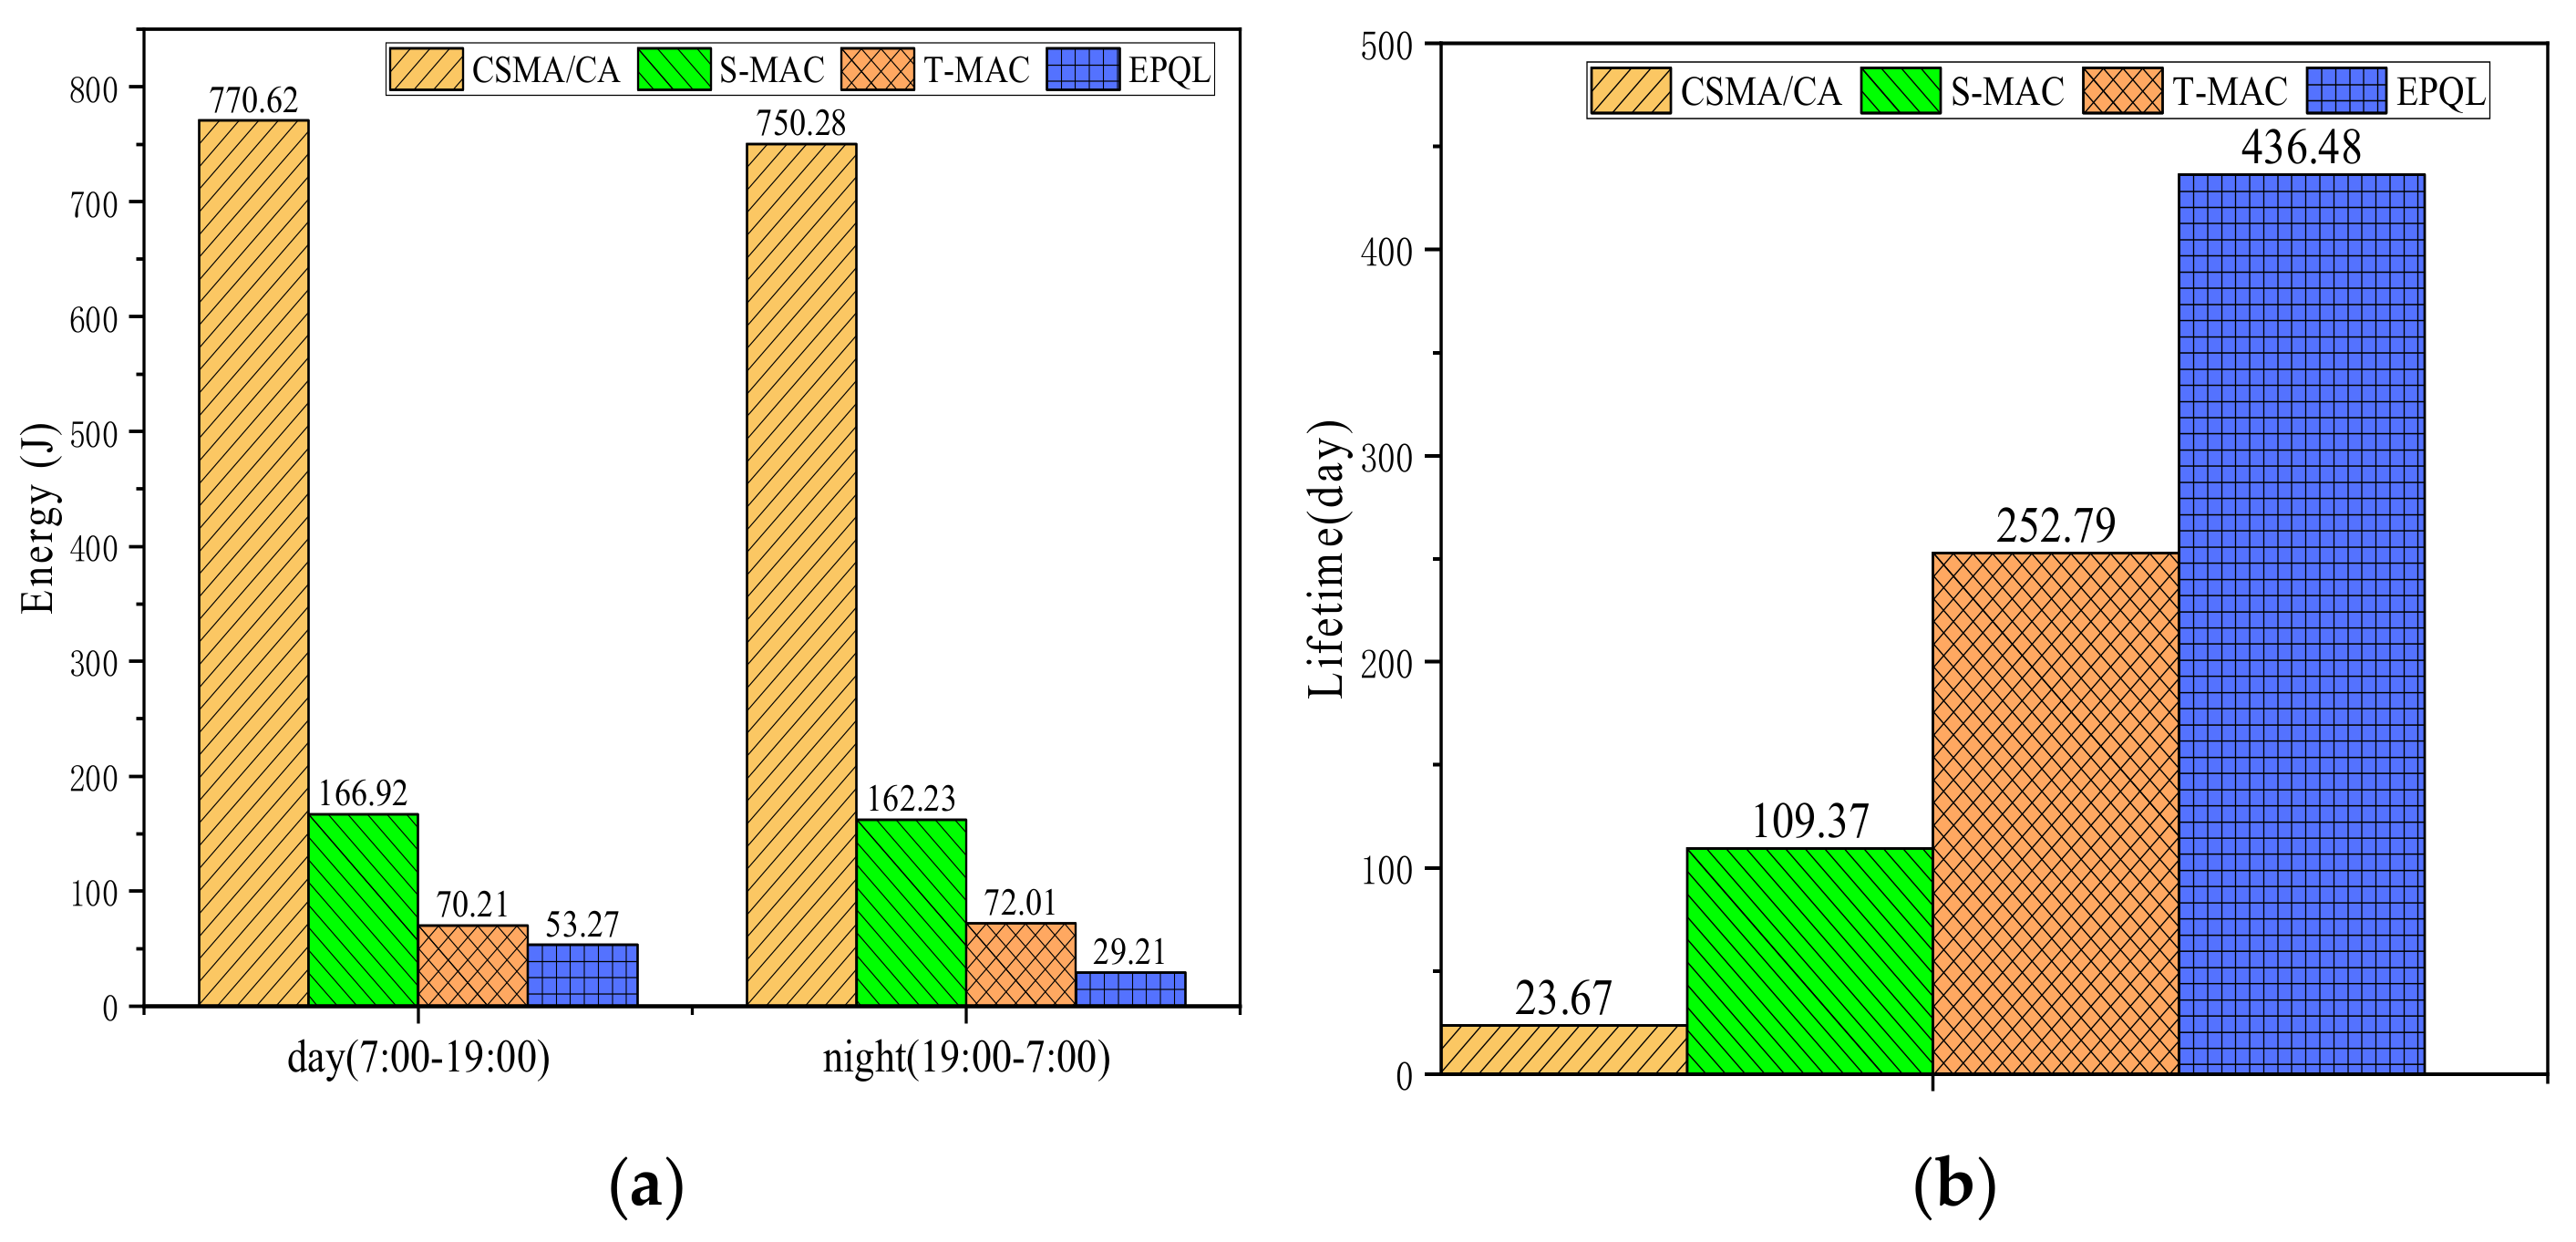
4.2.2. Performance Analysis

Figure 3 provides the energy consumption and the lifetime for a 2000 mAh battery. In Figure 3a, the energy consumptions of CSMA/CA, S-MAC, T-MAC, and EPQL are 1520.89 J, 329.15 J, 142.41 J, and 82.47 J, respectively. Besides, in Figure 3b, the lifetimes of CSMA/CA, S-MAC, T-MAC, and EPQL are 23.67 days, 109.37 days, 252.79 days, and 436.48 days, respectively. Generally, the energy-saving performance of EPQL is clear. The reason is that EPQL uses the professional knowledge of [3] to construct poultry farm monitoring networks. Note that compared with the energy consumption of EPQL in the day (7:00–19:00), the energy consumption of EPQL in the night (19:00–7:00) decreases by about 45%. This indicates that this knowledge is effective to improve the energy-saving performance of poultry farm monitoring networks.
To further demonstrate the energy-saving performance of EPQL, Figure 4 gives the detailed results of energy consumption and PSRs every 2 h. Note that Figure 4a provides the temperature and humidity curves over 24 h, which are based on Equations (13) and (14). According to these curves, we discuss the energy-saving performance of EPQL as follows. From 7:00 to 13:00, EPQL often uses the low or medium rates. From 13:00 to 17:00, EPQL usually uses the medium or high rates. Generally, even when using the high rates, EPQL still has better energy-saving performance and better PSRs, simultaneously. Similarly, the energy-saving performance and PSR of EPQL are also better during the night. These results mean that Q-learning is effective to adjust the transmission rate as a distributed manner. Generally, EPQL does not sacrifice PSRs to obtain better energy-saving performance.
Besides, to demonstrate other performances of EPQL, Figure 5 is used to give the packet loss rate and average delay. Compared with the packet loss rates of CSMA/CA, S-MAC, and T-MAC, EPQL decreases by about 65.9%, 66.2%, and 66.2%, respectively. Moreover, compared with the average delays of CSMA/CA, S-MAC, and T-MAC, EPQL decreases by about 21.2%, 22.0%, and 23.1%, respectively.

5. Conclusions

By reducing the amount of transmission data, retransmissions, and collisions, EPQL could prolong the network lifetime. Meanwhile, EPQL could also meet the requirement of different transmission rates under the heat-stress effect of poultry. In practice, the performance of EPQL is proven by real-world system results. From a poultry-feeding perspective, EPQL could help poultry farms monitor and manage temperature and humidity with low energy consumption, thereby controlling mortality and egg production. With the deployment of 5G increasing, NBIoT nodes are becoming more popular. To reduce the service charges of operators, EPQL could also be used in these nodes.
Future work includes collecting more experimental data in real-world tests, taking into account other factors that affect poultry farming, and continuing to explore other machine-learning algorithms.

Author Contributions

Conceptualization, Z.W., P.P. and H.Z.; methodology, Z.W. and P.P.; resources, J.L.; software, J.L., B.S. and M.Y.; validation, Z.W. and P.P.; writing–original draft, Z.W., P.P. and J.L.; writing–review and editing, P.P. and M.Y. All authors have read and agreed to the published version of the manuscript.

Funding

This work was supported by National Natural Science Foundation of China (Grant No. 61876199).

Institutional Review Board Statement

Not applicable.

Informed Consent Statement

Not Applicable.

Data Availability Statement

Data sharing not applicable. No new data were created in this study.

Acknowledgments

Special thanks to the staff at Huaxing poultry farm, who provided the verification environments for our experiments, in particular, Ai Ting, Cui Jian, and Cui YuMei for all their cooperation.

Conflicts of Interest

The authors declare that they have no known competing financial interests or personal relationships that could have appeared to influence the work reported in this paper.

References

  1. Muangprathub, J.; Boonnam, N.; Kajornkasirat, S.; Lekbangpong, N.; Wanichsombat, A.; Nillaor, P. IoT and agriculture data analysis for smart farm. Comput. Electron. Agric. 2019, 156, 467–474. [Google Scholar] [CrossRef]
  2. Liang, H.M.; Lin, D.Y.; Hsuuw, Y.D.; Huang, T.P.; Chang, H.L.; Lin, C.Y.; Wu, H.H.; Hung, K.H. Association of heat shock protein 70 gene polymorphisms with acute thermal tolerance, growth, and egg production traits of native chickens in Taiwan. Arch. Anim. Breed. 2016, 59, 173–181. [Google Scholar] [CrossRef]
  3. Bayhan, A.K.; Karaman, S.; Koskan, O. Effects of heat stress on egg yield and mortality rates of caged poultry houses. Kafkas Univ. Vet. Fak. Derg. 2013, 19, 881–887. [Google Scholar] [CrossRef]
  4. Nadimi, E.S.; Jorgensen, R.N.; Blanes-Vidal, V.; Christensen, S. Monitoring and classifying animal behavior using ZigBee based mobile ad hoc wireless sensor networks and artificial neural networks. Comput. Electron. Agric. 2012, 82, 44–54. [Google Scholar] [CrossRef]
  5. Guo, Y.; Corke, P.; Poulton, G.; Wark, T.; Bishop-Hurley, G.; Swain, D. Animal behaviour understanding using wireless sensor networks. In Proceedings of the 31st IEEE Conference on Local Computer Networks, Tampa, FL, USA, 14–16 November 2006. [Google Scholar] [CrossRef] [Green Version]
  6. Kiani, F. Animal behavior management by energy-efficient wireless sensor networks. Comput. Electron. Agric. 2018, 151, 478–484. [Google Scholar] [CrossRef]
  7. Dam, T.V.; Langendoen, K. An adaptive energy-efficient MAC protocol for wireless sensor networks. In Proceedings of the First International Conference on Embedded Networked Sensor Systems, Los Angeles, CA, USA, 5–7 November 2003. [Google Scholar] [CrossRef]
  8. Ye, W.; Heidemann, J.; Estrin, D. Medium access control with coordinated adaptive sleeping for wireless sensor networks. IEEE/Acm Trans. Netw. 2004, 12, 493–506. [Google Scholar] [CrossRef] [Green Version]
  9. Zhao, Y.Z.; Miao, C.Y.; Ma, M. An energy-efficient self-adaptive duty cycle MAC protocol for traffic-dynamic wireless sensor networks. Wirel. Pers. Commun. 2013, 68, 1287–1315. [Google Scholar] [CrossRef]
  10. Ye, D.; Zhang, M. A self-adaptive sleep/wake-up scheduling approach for wireless sensor networks. IEEE Trans. Cybern. 2018, 48, 979–992. [Google Scholar] [CrossRef]
  11. Nur, F.N.; Sharmin, S.; Razzaque, M.A.; Islam, M.S.; Hassan, M.M. A low duty cycle MAC protocol for directional wireless sensor networks. Wirel. Pers. Commun. 2017, 96, 5035–5059. [Google Scholar] [CrossRef]
  12. Xu, D.H.; Wang, K. MDA-SMAC: An energy-efficient improved SMAC protocol for wireless sensor networks. KSII Trans. Internet Inf. Syst. 2018, 12, 4754–4773. [Google Scholar] [CrossRef]
  13. Nguyen, B.T.; Murphy, L.; Muntean, G. Energy-efficient QoS-based congestion control for reliable communications in wireless multimedia sensor wetworks. In Proceedings of the 2018 IEEE International Conference on Communications (ICC)/Workshop on Integrating UAVs into 5G, Kansas City, MO, USA, 20–24 May 2018. [Google Scholar] [CrossRef]
  14. Kumar, S.; Kim, H. Energy efficient scheduling in wireless sensor networks for periodic data gathering. IEEE Access 2019, 7, 11410–11426. [Google Scholar] [CrossRef]
  15. Masud, F.; Abdullah, A.H.; Altameem, A.; Abdul-Salaam, G.; Muchtar, F. Traffic class prioritization-based slotted-CSMA/CA for IEEE 802.15.4 MAC in intra-WBANs. Sensors 2019, 19, 466. [Google Scholar] [CrossRef] [PubMed] [Green Version]
  16. Ahmedy, I.; Shehadeh, H.A.; Idris, M.Y.I. An estimation of QoS for classified based approach and nonclassified based approach of wireless agriculture monitoring network using a network model. Wirel. Commun. Mob. Comput. 2017, 2017, 3626571. [Google Scholar] [CrossRef]
  17. Li, F.F.; Zhu, H.J.; Wu, H.R. Farmland multi-parameter wireless sensor network data compression strategy. Intern. J. Ad Hoc Ubiq. Comput. 2018, 29, 221–231. [Google Scholar] [CrossRef]
  18. Luo, H.B.; He, M.H.; Ruan, Z.Q.; Zeng, X.X. Optimal sleep time controller based on traffic prediction and residual energy in duty-cycled wireless sensor networks. Intern. J. Distrib. Sens. Netw. 2017, 13, 1550147717748909. [Google Scholar] [CrossRef]
  19. Tian, J.; Wang, Y.; Liang, X.; Wang, G.; Zhang, Y. WA-MAC: A weather adaptive MAC protocol in survivability-heterogeneous wireless sensor networks. Ad Hoc Netw. 2017, 67, 40–52. [Google Scholar] [CrossRef]
  20. Kang, J.G.; Lim, D.W.; Jung, J.W. Energy-efficient forest fire prediction model based on two-stage adaptive duty-cycled hybrid X-MAC protocol. Sensors 2018, 18, 2960. [Google Scholar] [CrossRef] [Green Version]
  21. Valente, A.; Silva, S.; Duarte, D.; Pinto, F.C.; Soares, S. Low-cost LoRaWAN node for agro-intelligence IoT. Electronics 2020, 9, 987. [Google Scholar] [CrossRef]
  22. Prakosa, S.W.; Faisal, M.; Adhitya, Y.; Leu, J.S.; Köppen, M.; Avian, C. Design and implementation of LoRa based IoT scheme for Indonesian rural area. Electronics 2021, 10, 77. [Google Scholar] [CrossRef]
  23. Hurwitz, S.; Weiselberg, M.; Eisner, U.; Bartov, I.; Riesenfeld, G.; Sharvit, M.; Bornstein, S. The energy requirements and performance of growing chickens and turkeys as affected by environmental temperature. Poult. Sci. 1980, 59, 2290–2299. [Google Scholar] [CrossRef]
  24. Ferraz, P.F.P.; Yanagi, T.; de Lima, R.R.; Ferraz, G.; Xin, H.W. Performance of chicks subjected to thermal challenge. Pesqui. Agropecu. Bras. 2017, 52, 113–120. [Google Scholar] [CrossRef] [Green Version]
  25. Jin, C.; Allen-Zhu, Z.; Bubeck, S.; Jordan, M.I. Is Q-Learning provably efficient? In Proceedings of the 32nd Conference on Neural Information Processing Systems, Montreal, QC, Canada, 2–8 December 2018; Available online: https://arxiv.org/abs/1807.03765 (accessed on 29 November 2021).
  26. Gholamnia, M.; Alavipanah, S.K.; Darvishi Boloorani, A.; Hamzeh, S.; Kiavarz, M. Diurnal air temperature modeling based on the land surface temperature. Remote Sens. 2017, 9, 915. [Google Scholar] [CrossRef] [Green Version]
  27. Göttsche, F.M.; Olesen, F.S. Modelling the effect of optical thickness on diurnal cycles of land surface temperature. Remote Sens. Environ. 2009, 113, 2306–2316. [Google Scholar] [CrossRef]
  28. Duan, S.B.; Li, Z.L.; Wang, N.; Wu, H.; Tang, B.H. Evaluation of six land-surface diurnal temperature cycle models using clear-sky in situ and satellite data. Remote Sens. Environ. 2012, 124, 15–25. [Google Scholar] [CrossRef]
  29. Kottayil, A.; John, V.O.; Buehler, S.A. Evaluating the diurnal cycle of upper tropospheric humidity in two different climate models using satellite observations. Remote Sens. 2016, 8, 325. [Google Scholar] [CrossRef] [Green Version]
Figure 1. Overview of a poultry farm monitoring network and environmental perception Q-learning. (a) Poultry farm monitoring network and the framework of environmental perception Q-learning. (b) Block diagram of a sensor node to demonstrate the position of environmental perception Q-learning.
Electronics 10 03024 g001
Figure 2. Real-world test and WeChat applets. (a) Sensor nodes on a poultry farm in Henan, China. (b) WeChat applets of smart poultry farms.
Electronics 10 03024 g002aElectronics 10 03024 g002b
Figure 3. Comparison of energy consumption and lifetime. (a) Energy consumption over 24 h. (b) Lifetime of the 2000 mAh battery.
Electronics 10 03024 g003
Figure 4. Energy consumption and the success rate of packet transmission over 24 h. (a) Temperature and humidity curves of Equations (13) and (14) over 24 h. (b) Energy consumption over 24 h. (c) Success rate of packet transmission over 24 h.
Electronics 10 03024 g004
Figure 5. Comparison of the packet loss rate and average delay. (a) Packet loss rate. (b) Average delay.
Electronics 10 03024 g005
Table 1. The discussions of the commercialized protocols, which consider the demands of various fields.
Name/ReferenceDiscussions
T-MAC [7]
S-MAC [8]
SEA-MAC [9]
SA-Mech [10]
Adjusting duty cycle with sleeping in a periodic or non-periodic manner is effective to improve the efficiency of channel utilization. However, channel competition is unavoidable when the network’s throughput increases. Simply put, in a unit of time, with the number of frames to be sent increasing, frame collision becomes more serious.
DCD-MAC [11]
MDA-SMAC [12]
eqCC [13]
cf-TDMA [14]
TCP-CSMA/CA [15]
There are different methods to reduce the frame-collision probability and avoid wasted energy of retransmissions. In principle, these methods are usually based on some assumptions or additional hardware. However, there are many uncertain factors in the real-world applications, such as time shifts in low-cost nodes, mutual interferences in the densely deployed node regions, the sink-node-region congestion in the star topology, and so on.
Table 2. Discussions of the new energy-saving monitoring systems, which usually use professional knowledge in their own field.
Name/ReferenceDiscussions
SAMN [16]Field: agriculture
Professional knowledge: distinguish the crop’s sensitivity to select monitoring model
MFWSN [17]Field: farmland
Professional knowledge: take advantage of continuity in time and spatial variation of parameter data in farmlands
a tradeoff algorithm [18]Field: green belts, greenhouses, and smart offices
Professional knowledge: a traffic-prediction method to estimate the next-period packet number
WA-MAC [19]Field: the known weather-forecast-information applications
Professional knowledge: use weather forecast information to schedule sensors
ADX-MAC [20]Field: detect forest fires
Professional knowledge: based on forest-fire prediction knowledge
animal behavior monitoring WSN [6]Field: monitor animal behaviors
Professional knowledge: classify each kind of animal behavior and transmit the corresponding information
cluster network based on LoRaWAN [21]Field: intelligence agriculture
Professional knowledge: cluster network for realizing easy installation and maintenance
LoRa system [22]Field: smart agriculture
Professional knowledge: improve the maximum coverage using different factors and bandwidths
Table 3. Parameters used in this paper.
ParametersValues
Channel bit rate250 kbps
Packet header length7 bytes
Payload length64 bytes
ACK packet’s length10 bytes
Beacon length6 bytes
Beacon interval100 ms
TA duration (T-MAC)6134 us
Sleep time(S-MAC, T-MAC)25 ms
The TX time (i.e., Ttx)2272 us
The RX time (i.e., Trx)512 us
The battery’s capacity2000 mAh
Learning rate α (EPQL) 0.1
Discount rate r (EPQL)0.2
Publisher’s Note: MDPI stays neutral with regard to jurisdictional claims in published maps and institutional affiliations.

