Article

Closing the Wearable Gap—Part III: Use of Stretch Sensors in Detecting Ankle Joint Kinematics During Unexpected and Expected Slip and Trip Perturbations

1
Department of Kinesiology, Mississippi State University, Mississippi State, MS 39762, USA
2
Electrical and Computer Engineering, Mississippi State University, Mississippi State, MS 39762, USA
3
Department of Industrial Systems Engineering, Mississippi State University, Mississippi State, MS 39762, USA
4
Department of Agricultural and Biomedical Engineering, Mississippi State University, Mississippi State, MS 39762, USA
*
Author to whom correspondence should be addressed.
Submission received: 19 August 2019 / Revised: 10 September 2019 / Accepted: 21 September 2019 / Published: 24 September 2019
(This article belongs to the Special Issue Recent Advances in Motion Analysis)

Abstract

:
Background: An induced loss of balance resulting from a postural perturbation has been reported as the primary source for postural instability leading to falls. Hence; early detection of postural instability with novel wearable sensor-based measures may aid in reducing falls and fall-related injuries. The purpose of the study was to validate the use of a stretchable soft robotic sensor (SRS) to detect ankle joint kinematics during both unexpected and expected slip and trip perturbations. Methods: Ten participants (age: 23.7 ± 3.13 years; height: 170.47 ± 8.21 cm; mass: 82.86 ± 23.4 kg) experienced a counterbalanced exposure of an unexpected slip, an unexpected trip, an expected slip, and an expected trip using treadmill perturbations. Ankle joint kinematics for dorsiflexion and plantarflexion were quantified using three-dimensional (3D) motion capture through changes in ankle joint range of motion and using the SRS through changes in capacitance when stretched due to ankle movements during the perturbations. Results: A greater R-squared and lower root mean square error in the linear regression model was observed in comparing ankle joint kinematics data from motion capture with stretch sensors. Conclusions: Results from the study demonstrated that 71.25% of the trials exhibited a minimal error of less than 4.0 degrees difference from the motion capture system and a greater than 0.60 R-squared value in the linear model; suggesting a moderate to high accuracy and minimal errors in comparing SRS to a motion capture system. Findings indicate that the stretch sensors could be a feasible option in detecting ankle joint kinematics during slips and trips.

1. Introduction

Falls are one of the leading causes of both fatal and nonfatal injuries in clinical [1], geriatric [1], occupational [2], and healthy athletic populations [3] and can be induced due to environmental factors as well as physical and psychological human factors [4]. Subsequently, fall prevention methods and interventions are carried out by a wide range of healthcare and rehabilitation professionals [1]. With the advent of technology, multiple smart tools and applications have been used to combat falls using fall prevention intervention and specifically for detecting and diagnosing falls and fall risk [1]. Detecting falls or fall risks during everyday activities through activity monitoring can be beneficial during both prefall intervention, for individuals who are at fall risk, and postfall intervention, and for individuals who have already sustained a fall, in order to reduce their risk of subsequent falls [1]. While fall injury prevention sensor systems focus on responding to a fall after it has occurred and aid in contacting emergency medical assistance, fall detection sensor systems attempt to identify discrete fall events over the course of the day [1] and subsequently detect fall risk.
Wearable sensors have been used for human activity monitoring in various fields such as sports, training, fitness for improving performance, and preventing injuries and additionally, have also been used successfully in monitoring physical activity in clinical, pathological, and aging populations [5]. These wearable devices include different types of sensors such as inertial motion sensors (IMUs) [6,7], accelerometers [8,9], gyroscopes, magnetometers, switches, pedometers, goniometers, and foot pressure sensors that can provide kinematic and kinetic information of the body’s movement [4,10,11,12]. Additionally, these devices have also been used in conjunction with other smart tools such as smart phones, smart shoes, modern camera systems, and even low-cost infrared thermal imaging sensors [13,14,15,16,17]. However, these sensors also have their own limitations, with a critical one being IMU distortion and drift [18,19], which can lead to an inaccurate representation of human activity monitoring. With the fast growth of sensor technology, several challenges towards design, development, fabrication, implementation, and utilization for continuous monitoring exist [9]. Recently, Luczak et al. [20] reported the current status of lack of wearbale solutions to accurately capture data “from the ground up” and the need for “closing the wearbale gap” through development and validation of novel types of sensors. Although this was specific to sensors used for the athletic population [20], there has also been a need for developing and validating novel sensors for fall detection, which is a leading cause for fatal and nonfatal injuries across different populations [1,2,3,4]. Hence, development and validation of other forms and types of wearable sensors to monitor human activity with more accuracy and less limitations, specifically for fall detection is required to close the wearable gap.
A hierarchy of approaches for fall detection has been previously proposed that includes camera-based systems to assess change in body shape, inactivity detection or three-dimensional (3D) head motion analysis, an ambience device that determines posture and presence, and wearable devices that evaluate posture and motion [5]. However, the camera-based systems and ambient device systems have their own limitations [6] such as capture obstruction, privacy concerns, false alarms, battery life, and sole intended use of the device [7,8]. Previous literature has reported that wearable devices can successfully detect induced falls in a laboratory setting [21] or other indoor environments [8]. Subsequently, different types of body-worn or wearable sensors appear to be the prominent choice for fall detection [5,10,22]. Early detection of fall risk, near falls, and incidences of falls classified by types (slip or trip induced) using wearable sensor technology can help aid in minimizing fall and fall-related injuries [11,21,22,23]. Due to higher precision, lower time commitment, easy administration, and feasibility, wearable biomechanical sensors are becoming popular for early detection of falls [8]. A recent review paper by Rucco et al. [22] addressed the impact of wearable sensors in fall detection by reporting the average number/age of participants; number of sensors, type of sensors, and their placement used in such fall detection studies. The predominant sample of populations tested included young and old individuals with age groups of less than 30 years of age and more than 64 years of age, and used a sample size of less than 10, 10–19, and 20–100 more commonly [22]. The most commonly used type of sensor being an accelerometer (more than 70%), followed by pressure sensors and gyroscopes, magnetometers with one or two sensors, predominantly placed and located on the trunk, foot, and leg [22]. More recently, a stretchable soft robotic sensor (SRS) that records a change in resistance values when stretched was used to determine if ankle joint-type movements could be inferred by using a custom-built rigid-body ankle joint mechanical device [20]. Based on the findings from this study, the SRS was capable of providing significant linear models in predicting sagittal plane ankle joint movement specific to plantarflexion [20]. As an extension of this research, a follow-up study by the same researchers successfully used similar stretch sensors that record capacitance change in response to stretch, to identify and detect ankle joint movements of plantarflexion (PF), dorsiflexion (DF), inversion (INV), and eversion (EVR) in human participants during non-weight-bearing isolated ankle movements [24]. Results from these research studies are published as “Closing the wearable gap: Part I and Part II” [20,24]. However, these stretch or flexible sensors have not yet been utilized to identify ankle joint movements in the more dynamic range, such as during slips and trips for fall detection.
Placement and position of wearable sensors used for quantifying body movements, balance, gait, and overall physical activity vary greatly across different parts of the body, ranging from the upper torso, lower torso, and lower extremities [10]. Specific to fall detection, the most commonly used sensor placement position includes the waist or hip, followed by trunk attachments [10]. Head and neck placements have also been used to assess acceleration patterns of the head during falls [25]. A higher success in detecting falls has been achieved by placing wearable sensors at the center of mass of the body [7]. However, the human body is considered as an inverted pendulum during upright balance maintenance, with the ankle joint serving as the axis of rotation [26]. Hence, placing wearable sensors on the foot and ankle segment can aid to capture recoveries and falls from a distal-to-proximal direction (ankle strategy) [26]. Previous research has used IMU sensors placed at the left and right ankle and sternum to successfully classify fall types based on slips and trips [27]. However, the use of an SRS sensor placed at the ankle and foot segment in detecting falls has not been analyzed.
Falls due to slips and trips are induced by a postural perturbation to the human body [28,29]. A postural perturbation is a sudden change in the orientation of the body that causes body disequilibrium and may lead to the displacement of the total body center of mass [26], thereby contributing to falls. One of the primary needs for fall detection is the assessment of postural responses during unexpected and expected postural perturbations, be it the “closed-loop” feedback postural control system when the external perturbations are unexpected and governed by an anticipatory sensory–motor, or “open-loop” feedforward postural control system when the external perturbations are expected [28]. Falls in the backward and forward directions are commonly studied in both real-world falls and simulated falls [10]. Simulated falls in a closed and controlled environment have been commonly used to analyze falls using fall prevention harness systems to protect the participants from any undesired falls. A systematic review on fall detection with body-worn sensors reported that 90 different studies (93.8% of the studies) used simulated falls [10]. Biomechanical analyses of human movement have evolved from simple goniometric measures to technologically advanced optical three-dimensional (3D) motion capture systems, with the latter seen as the gold-standard measure. However, the combination of SRS with ankle–foot placements during different postural perturbations in detecting falls, validated against a 3D motion capture system, has not been examined. Therefore, the purpose of the study was to validate the use of a stretchable SRS against a 3D motion capture system to identify ankle joint kinematics during both unexpected and expected slip and trip perturbations for fall detection. It was hypothesized that the SRS would be a valid tool for detecting ankle joint movements during both unexpected and expected postural slip and trip perturbations.

2. Materials and Methods

2.1. Participants

A total of 10 healthy adults (5 males and 5 females; age: 23.7 ± 3.13 years; height: 170.47 ± 8.21 cm; mass: 82.86 ± 23.4 kg) with no self-reported history of any musculoskeletal, neurological, cardiovascular, or vestibular disorders were recruited for the study. The participants’ physical fitness status was also above recreationally trained (>3–4 days/week with consistent aerobic and anaerobic training for a minimum of the last 3 months leading up to testing). The average foot size of all participants was a size 10, and all males used the large/extra-large size socks, while all females used the small/medium size socks. Informed consent was obtained from the participants based on the approved protocol from the University’s Institutional Review Board (IRB protocol # 18-121) after fully explaining the protocol along with the risks and benefits.

2.2. Instrumentation and Testing Environment

All experimental procedures were conducted in the University’s Neuromechanics Laboratory. Biomechanical analysis of bilateral (left and right) ankle joint angular kinematics was assessed using a 3D motion capture system (Motion Analysis Corporation, Santa Rosa, CA, USA) using the Cortex software (Version 7.2.6). Four separate SRS (StretchSense, Auckland, New Zealand) were used to create an ankle fall sensor system (two stretch sensors on each leg) capable of detecting bilateral ankle joint movements that occur predominantly in the sagittal plane (ankle dorsiflexion and plantarflexion) [24]. The motion capture data were sampled at 100 Hz, and the SRS data were sampled at 25 Hz. An oscilloscope was used to measure the output from the StretchSense board. A sinusoidal voltage signal was applied for measuring the sensor capacitance. Characteristics of this signal include the following: Peak-to-peak voltage: 1.2 V; Frequency: 250 Hz; RMS: 417 mV; DC Offset: 1.6V was observed. A Burdick treadmill (Kone Instruments Inc., Milton, WI, USA) was used to provide the slip and trip perturbation, and the start and stop of the perturbation was controlled using the TA 520 treadmill controller (Kone Instruments Inc., Milton, WI, USA). All participants also wore a standardized safety harness (Protecta PRO harness) that meets or exceeds Occupational Safety and Health Administration (OSHA) 1910.66, OSHA 1926.502, American National Standard Institute (ANSI) A10.32, ANSI Z359.1, and ANSI Z359.3 during the slip and trip trials.

2.3. Experimental Procedures

All participants visited the Neuromechanics Laboratory for testing. The first 15–20 min was treated as the familiarization session, during which participants had their anthropometry measurements taken and were given an opportunity to get exposed to the fall safety harness and two trials each of slip and trip perturbations when standing on the treadmill (explained under procedures). The second session, following the familiarization was treated as the experimental testing session. Participants were provided with athletic compression garments, and reflective markers were placed on the lower extremity using a modified Helen Hayes model for the lower extremity [30]. Additionally, participants had four SRS, two each on the anterior and posterior side of each foot–ankle segment, placed in position using a compression sleeve. The SRS arrangement used in the current study is depicted in Figure 1.
Participants were then directed to stand on the treadmill, and the fall-arrest harness system was attached to protect from undesired falls due to the treadmill perturbations. Participants were instructed to stand erect, being as still as possible each time before the beginning of slip or trip trials, during which the treadmill belt was turned on and off to provide a short brief postural perturbation. The treadmill was operated manually at a preset velocity of 0.67 m/s to provide both slip and trip perturbations. The participant was standing facing backward on the treadmill for slip perturbations (Figure 2) and standing facing forward on the treadmill for trip perturbations (Figure 3). All participants were exposed to one unexpected slip (US) and one unexpected trip (UT) in a counterbalanced order, followed by a series of three expected slips (ES) and a series of three expected trips (ET) in counterbalanced order, with randomized time intervals between the three slip and trip trials. During US and UT trials, participants were not aware of the time of perturbation, which was randomly provided within a 20 s interval to replicate an unexpected postural response through feedback postural control. The timing of the perturbation was random, and the instructions to the participants were always the same for US and ES, during which participants were instructed to stand as erect and still as possible. However, during ES and ET trails, participants were provided a countdown of three seconds before initiation of the treadmill perturbation, to replicate an expected postural response through feedforward postural control. Completion of two unexpected trials (one US and one UT) and six expected trials (three ES and three ET) marked the completion of experimental testing.

2.4. Data Analysis and Statistical Analysis

Motion capture kinematic data for ankle joint range of motion was determined using a modified Helen Hayes model for the lower extremity through Cortex software. Raw kinematic data were filtered with a low-pass third-order Butterworth filter with a cut-off frequency of 30 Hz. The raw capacitance values of the SRS were measured using the 10 Channel Serial Peripheral Interface (SPI) Sensing Circuit in conjunction with the Bluetooth Low Energy (BLE) module, both made by StretchSense. The values were recorded using the proprietary StretchSense BLE iOS application. Due to the nature of the study, every trial produced a unique response for motion capture data and SRS data. In order to conduct the analysis of each trial in a consistent manner, data was only observed from the beginning of the slip or trip perturbation until the joint angle returned to its baseline value prior to the perturbation, which was identified as the “base angle”. The absolute max joint angle that occurred in each trial was identified as the “peak angle.” Similar peak and base values were collected for the SRS. Each trial consisted of joint angle data collected from the motion capture system and capacitance data collected from the StretchSense module. Peak values were noted for each trial, being either in DF or PF, depending on whether the joint angle increased or decreased in value upon activation of the treadmill perturbation. The difference between the peak value and base value was calculated to indicate the range of motion (ROM) and the capacitance change that occurred for each trial. For motion capture range of motion, negative values indicate PF ROM and positive values indicate DF ROM. Additionally, each trial dataset was scaled down and verified to ensure that the data was adjusted adequately over time and formatted for both motion capture and StretchSense data. For each trial, a model depicting SRS capacitance versus joint angle was created for each foot based on whether the foot initially went into PF or DF (for slip trials and trip trials, respectively). For PF, the posterior SRS was analyzed, while the anterior SRS was analyzed for DF.
An R (statistical computing software) script was used to generate the linear models and calculate adjusted R-squared and root mean square error (RMSE) values to determine a relative and absolute goodness of fit. A detailed description of the linear model comparing motion capture data and stretch sensor data is provided in Part I and Part II of “closing the wearable gap” papers, recently published from the same researchers in 2018 and 2019, respectively [20,24]. These measures provided metrics to indicate how well the SRS modeled the ankle joint movement during the slip and trip perturbations. For each trial, the base angle (i.e., the joint angle value immediately before perturbation occurred) and peak angle (most extreme angle value in first response) were analyzed for both feet. Additionally, the base and peak capacitance were analyzed for each SRS. The movement that occurred first for each foot (i.e., PF or DF) was noted for each trial. A difference was calculated between all the peak and base values, producing a total joint ROM that occurred during the trial as well as total capacitance change. An example of a bad processing trial that produced bad/poor results and an example of a good processing trial that produced good/great results are depicted in Figure 4 and Figure 5, respectively. A bad processing trial rendered an R-squared value of 0.7524, and a good processing trial rendered an R-squared value of 0.9781. Finally, additional comparisons such as peak joint angle value comparisons across both feet as an average for each trial and comparisons between males and females were performed to see if there was an observed difference in range of motion and capacitance change and to identify how they affect range of motion as well SRS modelling performance. PF and DF movements were contrasted to see if one type of movement was easier to model with the SRS than the other movement.

3. Results

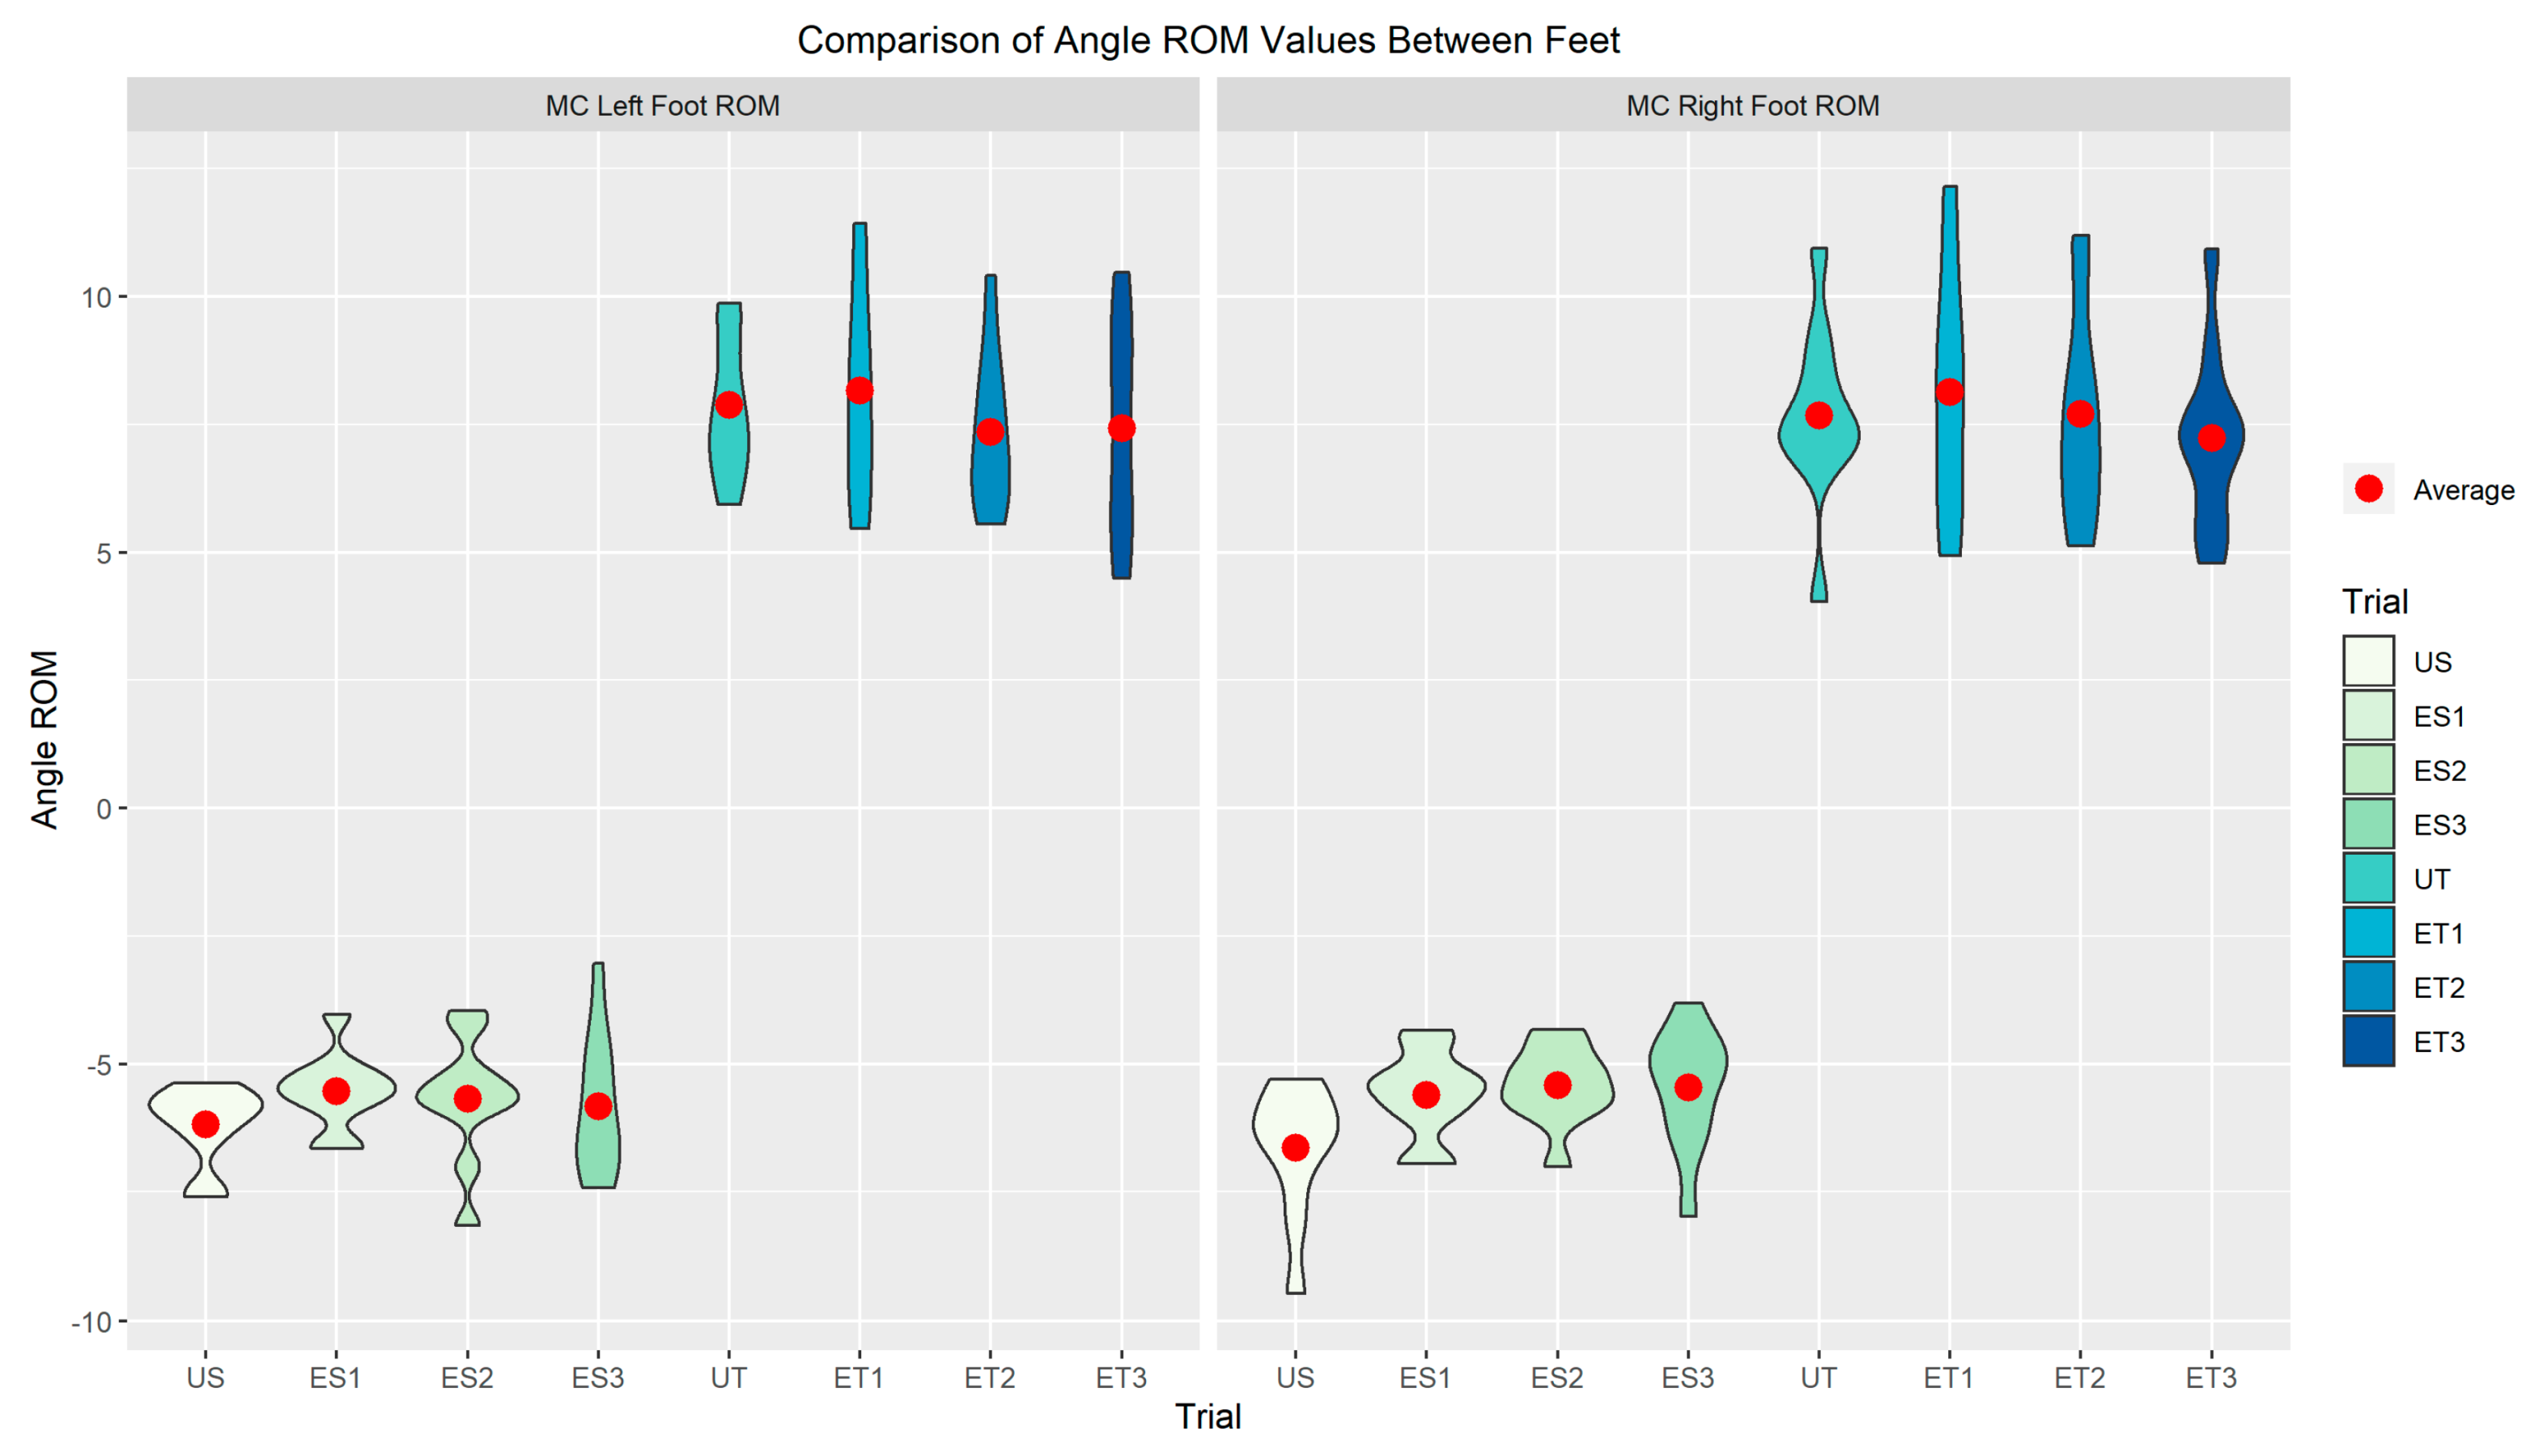
Legends: US—Unexpected Slip, ES1—Expected Slip Trial 1, ES2—Expected Slip Trial 2, ES3—Expected Slip Trial 3, UT—Unexpected Trip, UT1—Unexpected Trip Trial 1, UT2—Unexpected Trip Trial 2, UT3—Unexpected Trip Trial 3.
Results from both the motion capture data and the SRS data were used to identify ankle joint ROM change from base angle to peak angle and change in capacitance from the base angle position to peak angle position. A series of violin plots are used to present the observed data from the slip and trip trials for all ten participants. The violin plots provide curved areas for each of the slip and trip trials that provides an idea of the “spread” of the data. These violin plots represent a kernel density distribution portrayed vertically. A greater horizontal width of a curve in the plot indicates a greater portion of participants that produced results near the value on the y-axis [24]. Additionally, the presented individual participant data points reiterate the “spread” of the data, so that outliers can be easily identified as well.
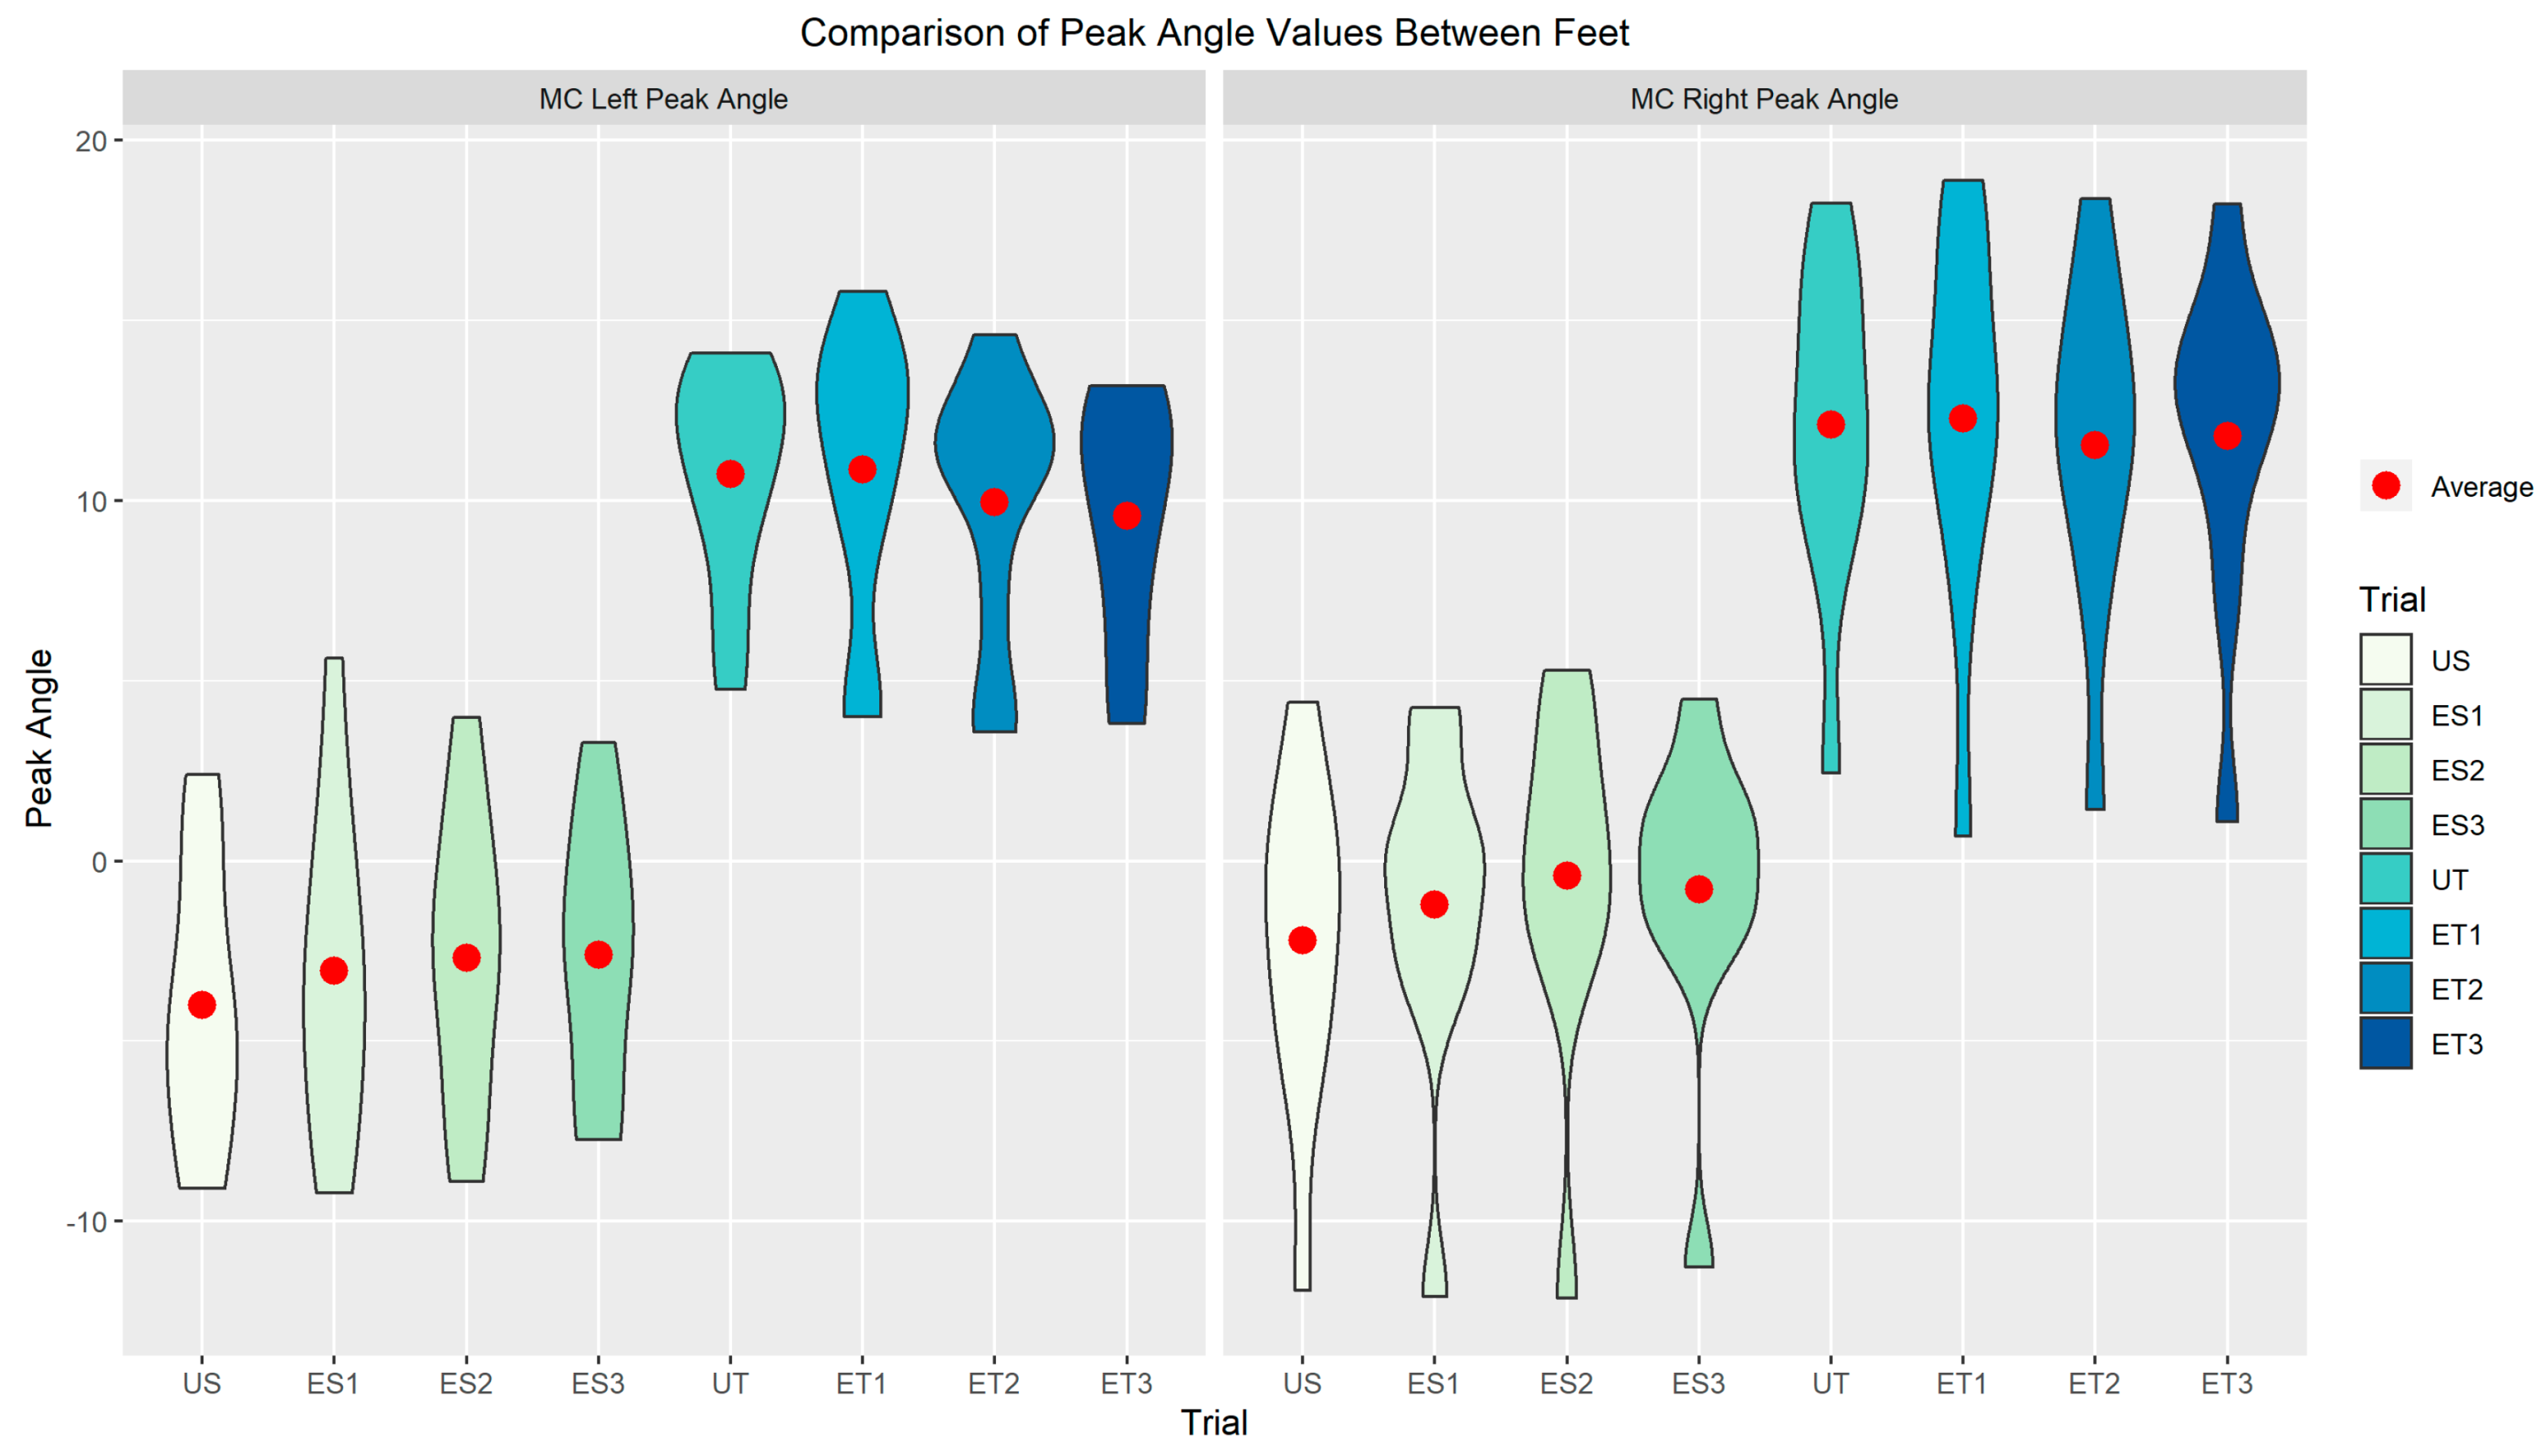
In Figure 6 and Figure 7, the average and spread of ankle ROM and peak ROM in plantarflexion for slip trials and dorsiflexion for trip trials are presented respectively. Figures indicate the behavior of ankle joint movement going into plantar flexion during slip perturbations and going into dorsiflexion during trip perturbations. In 
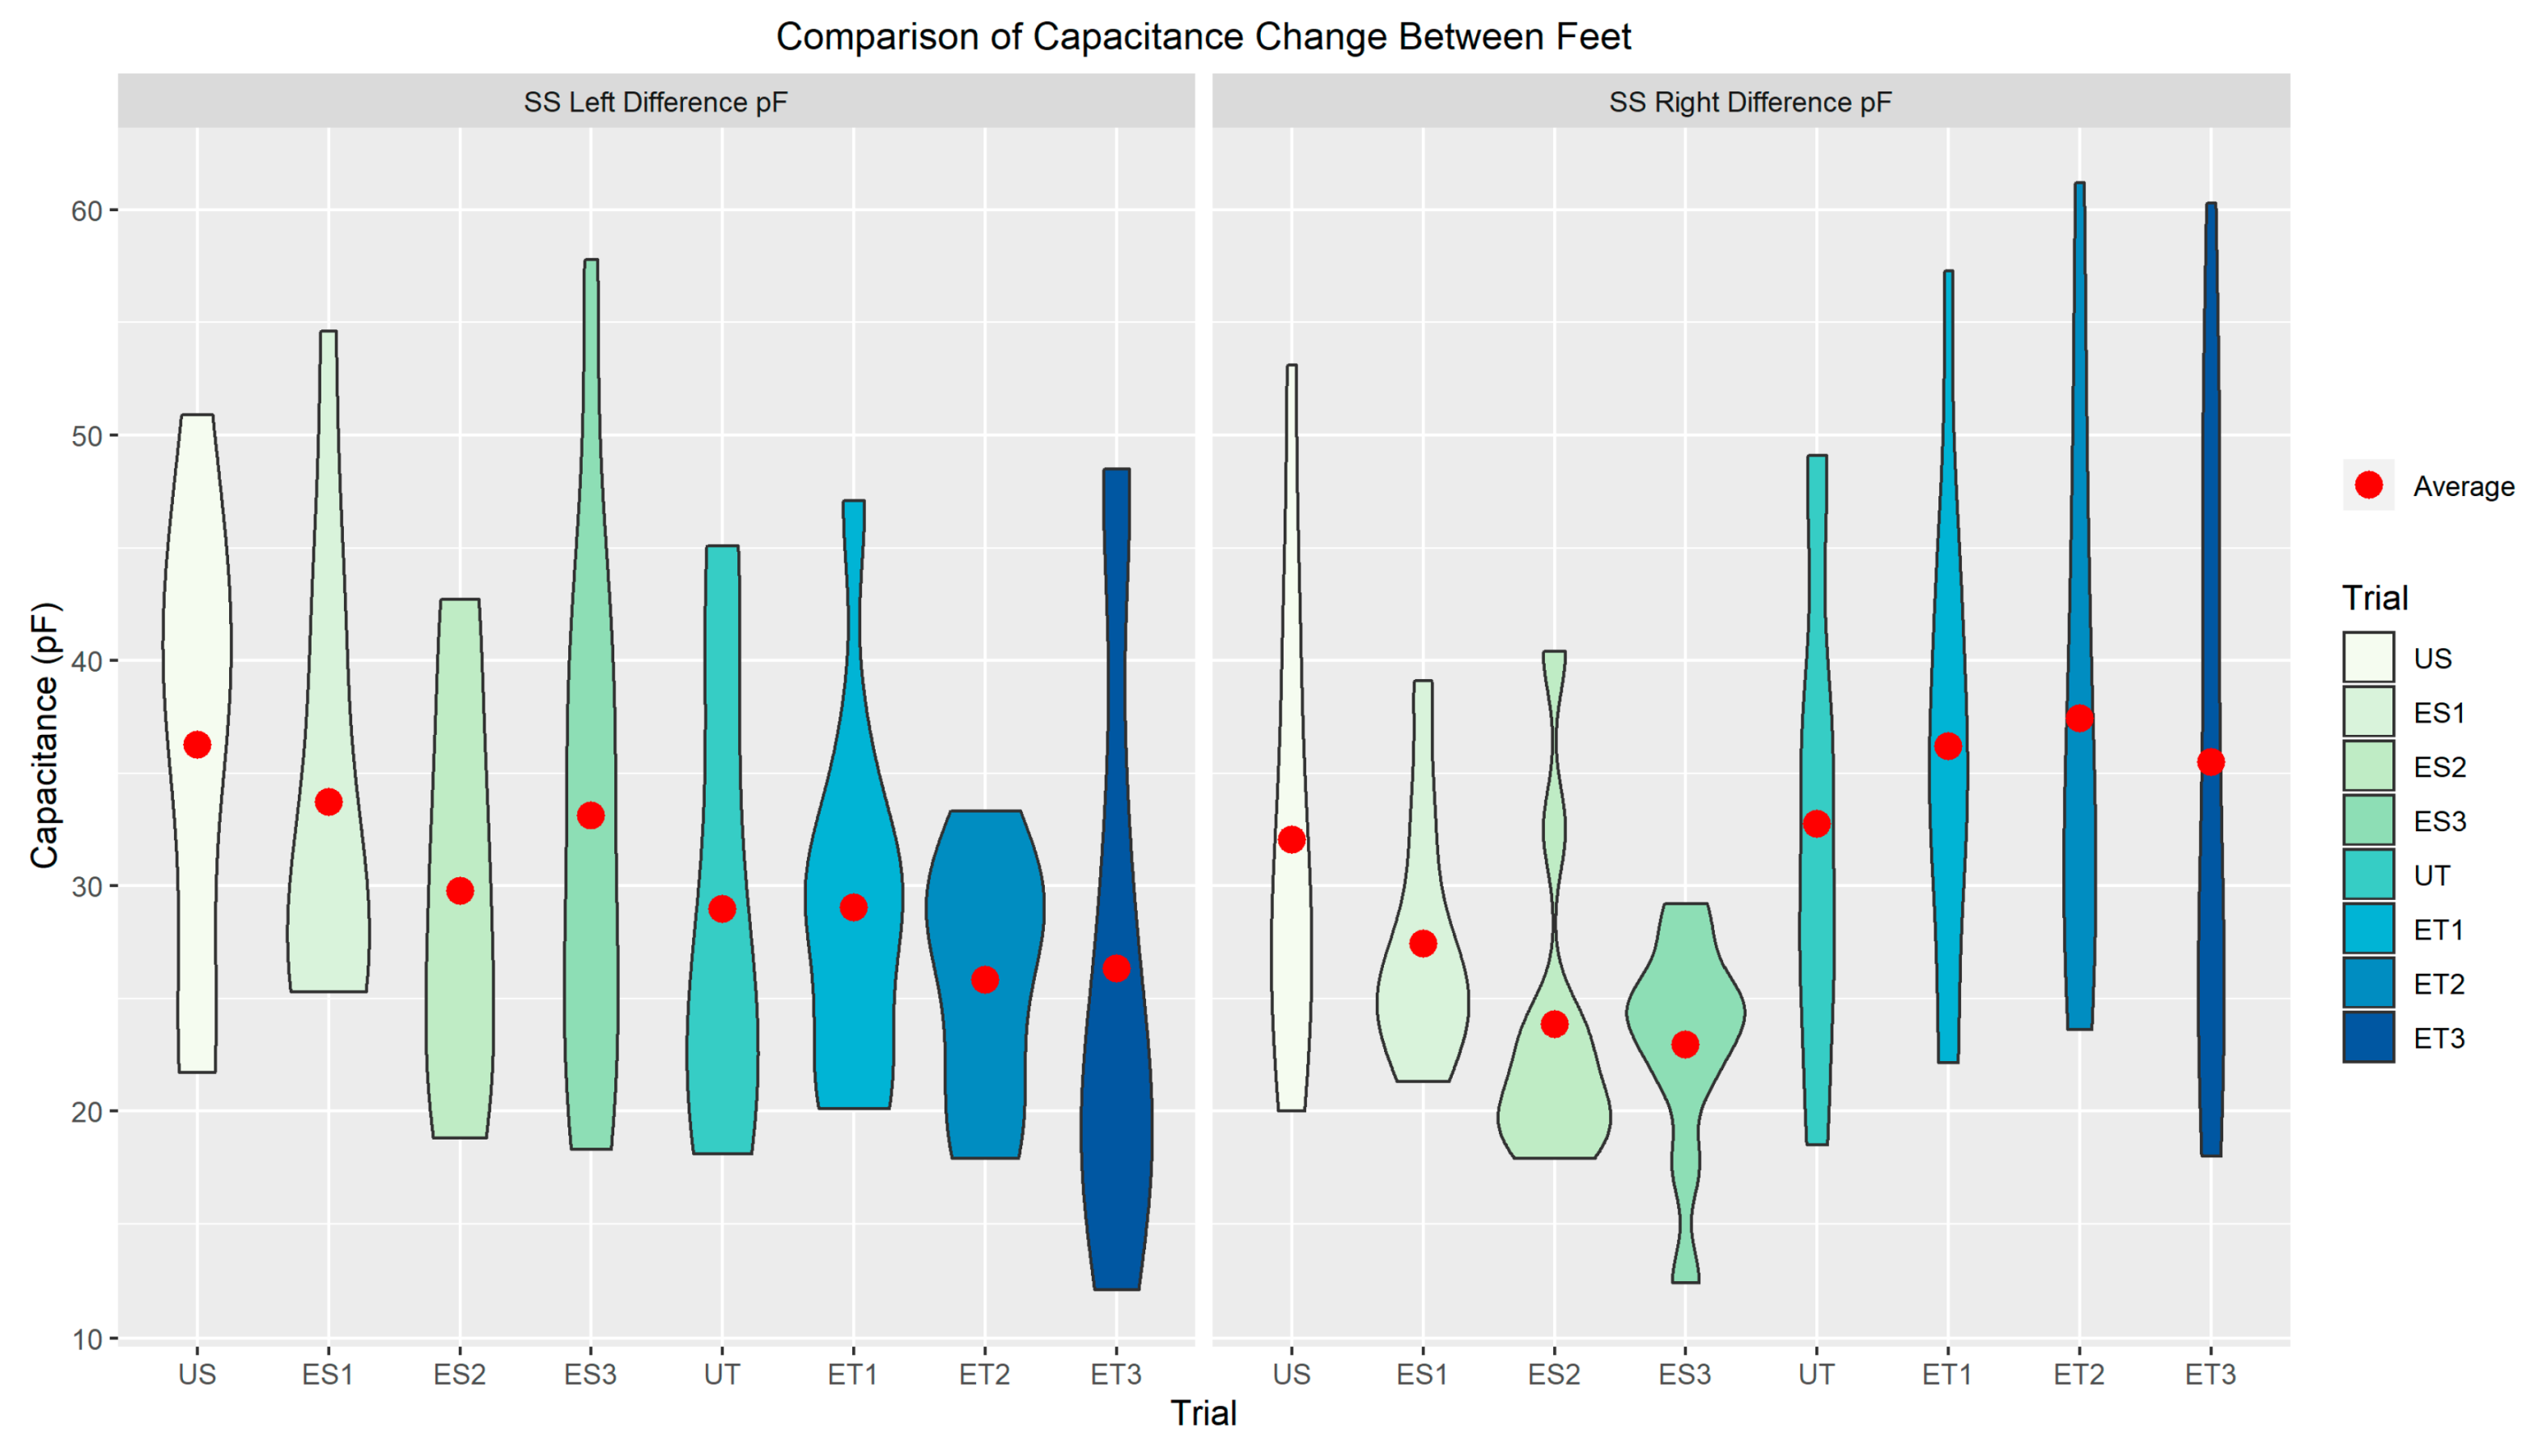
Figure 8, the average and spread of capacitance change for each foot across every slip and trip trial are presented, to demonstrate the sensor output data.
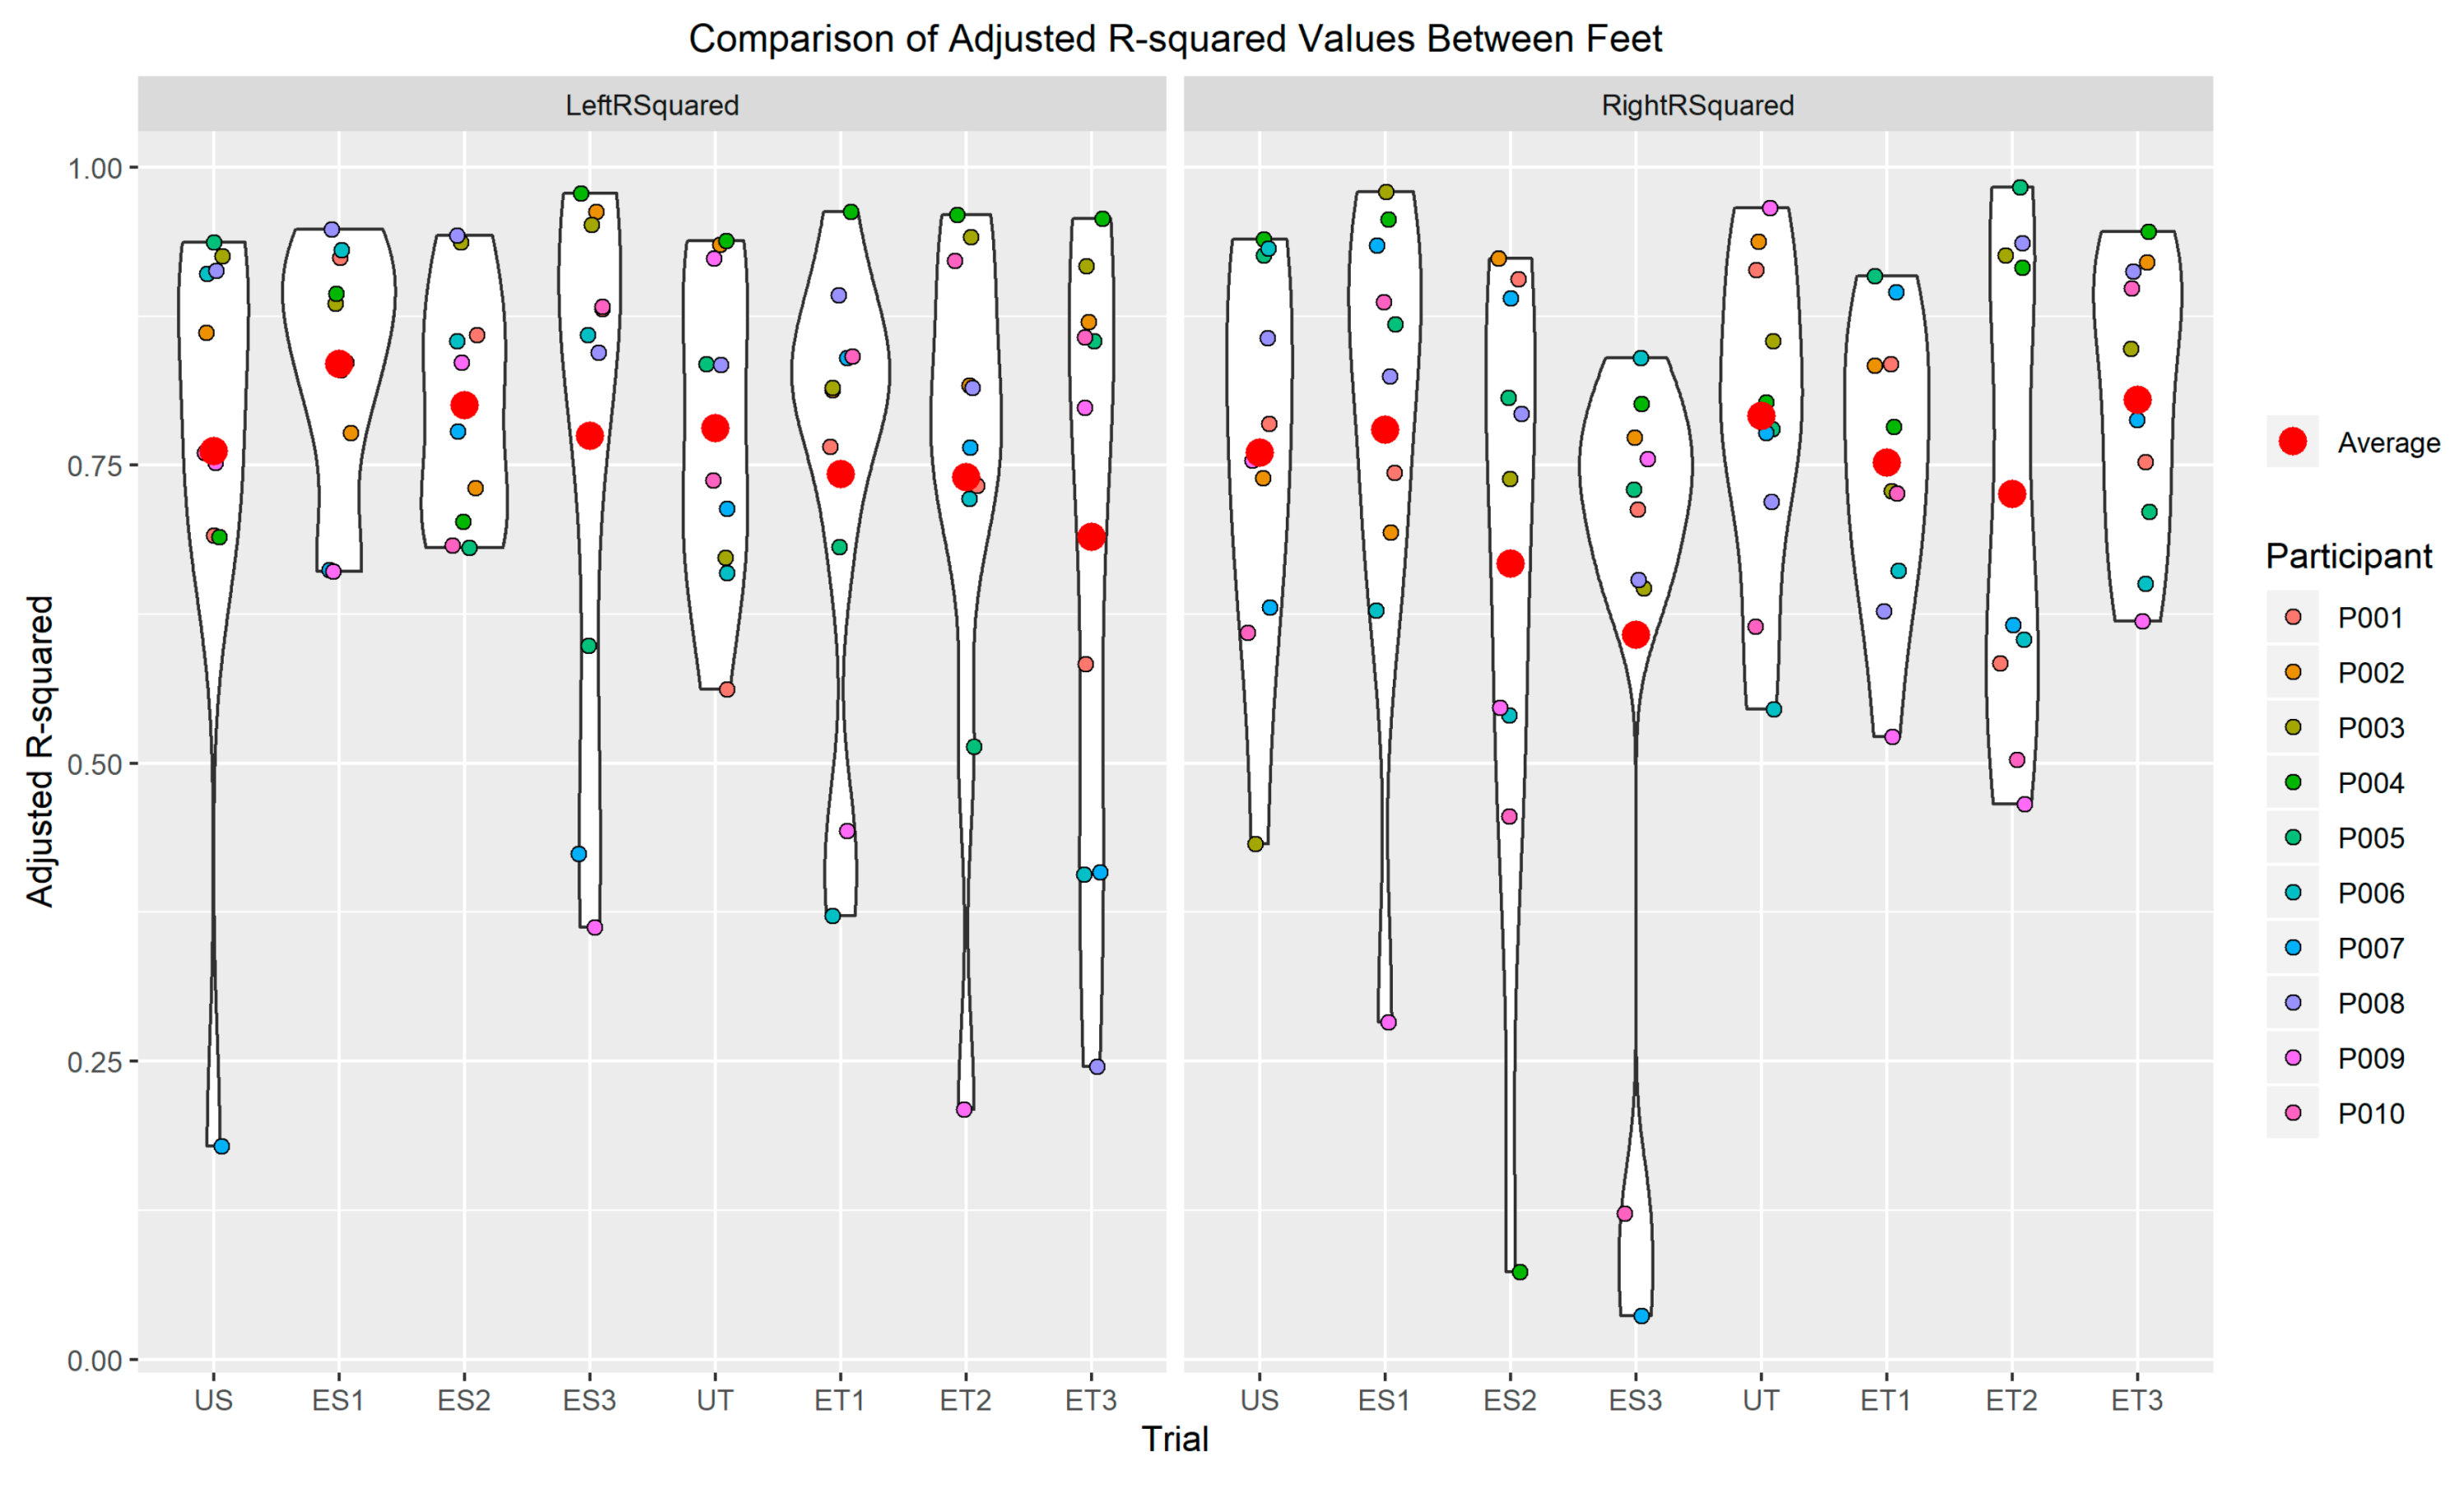
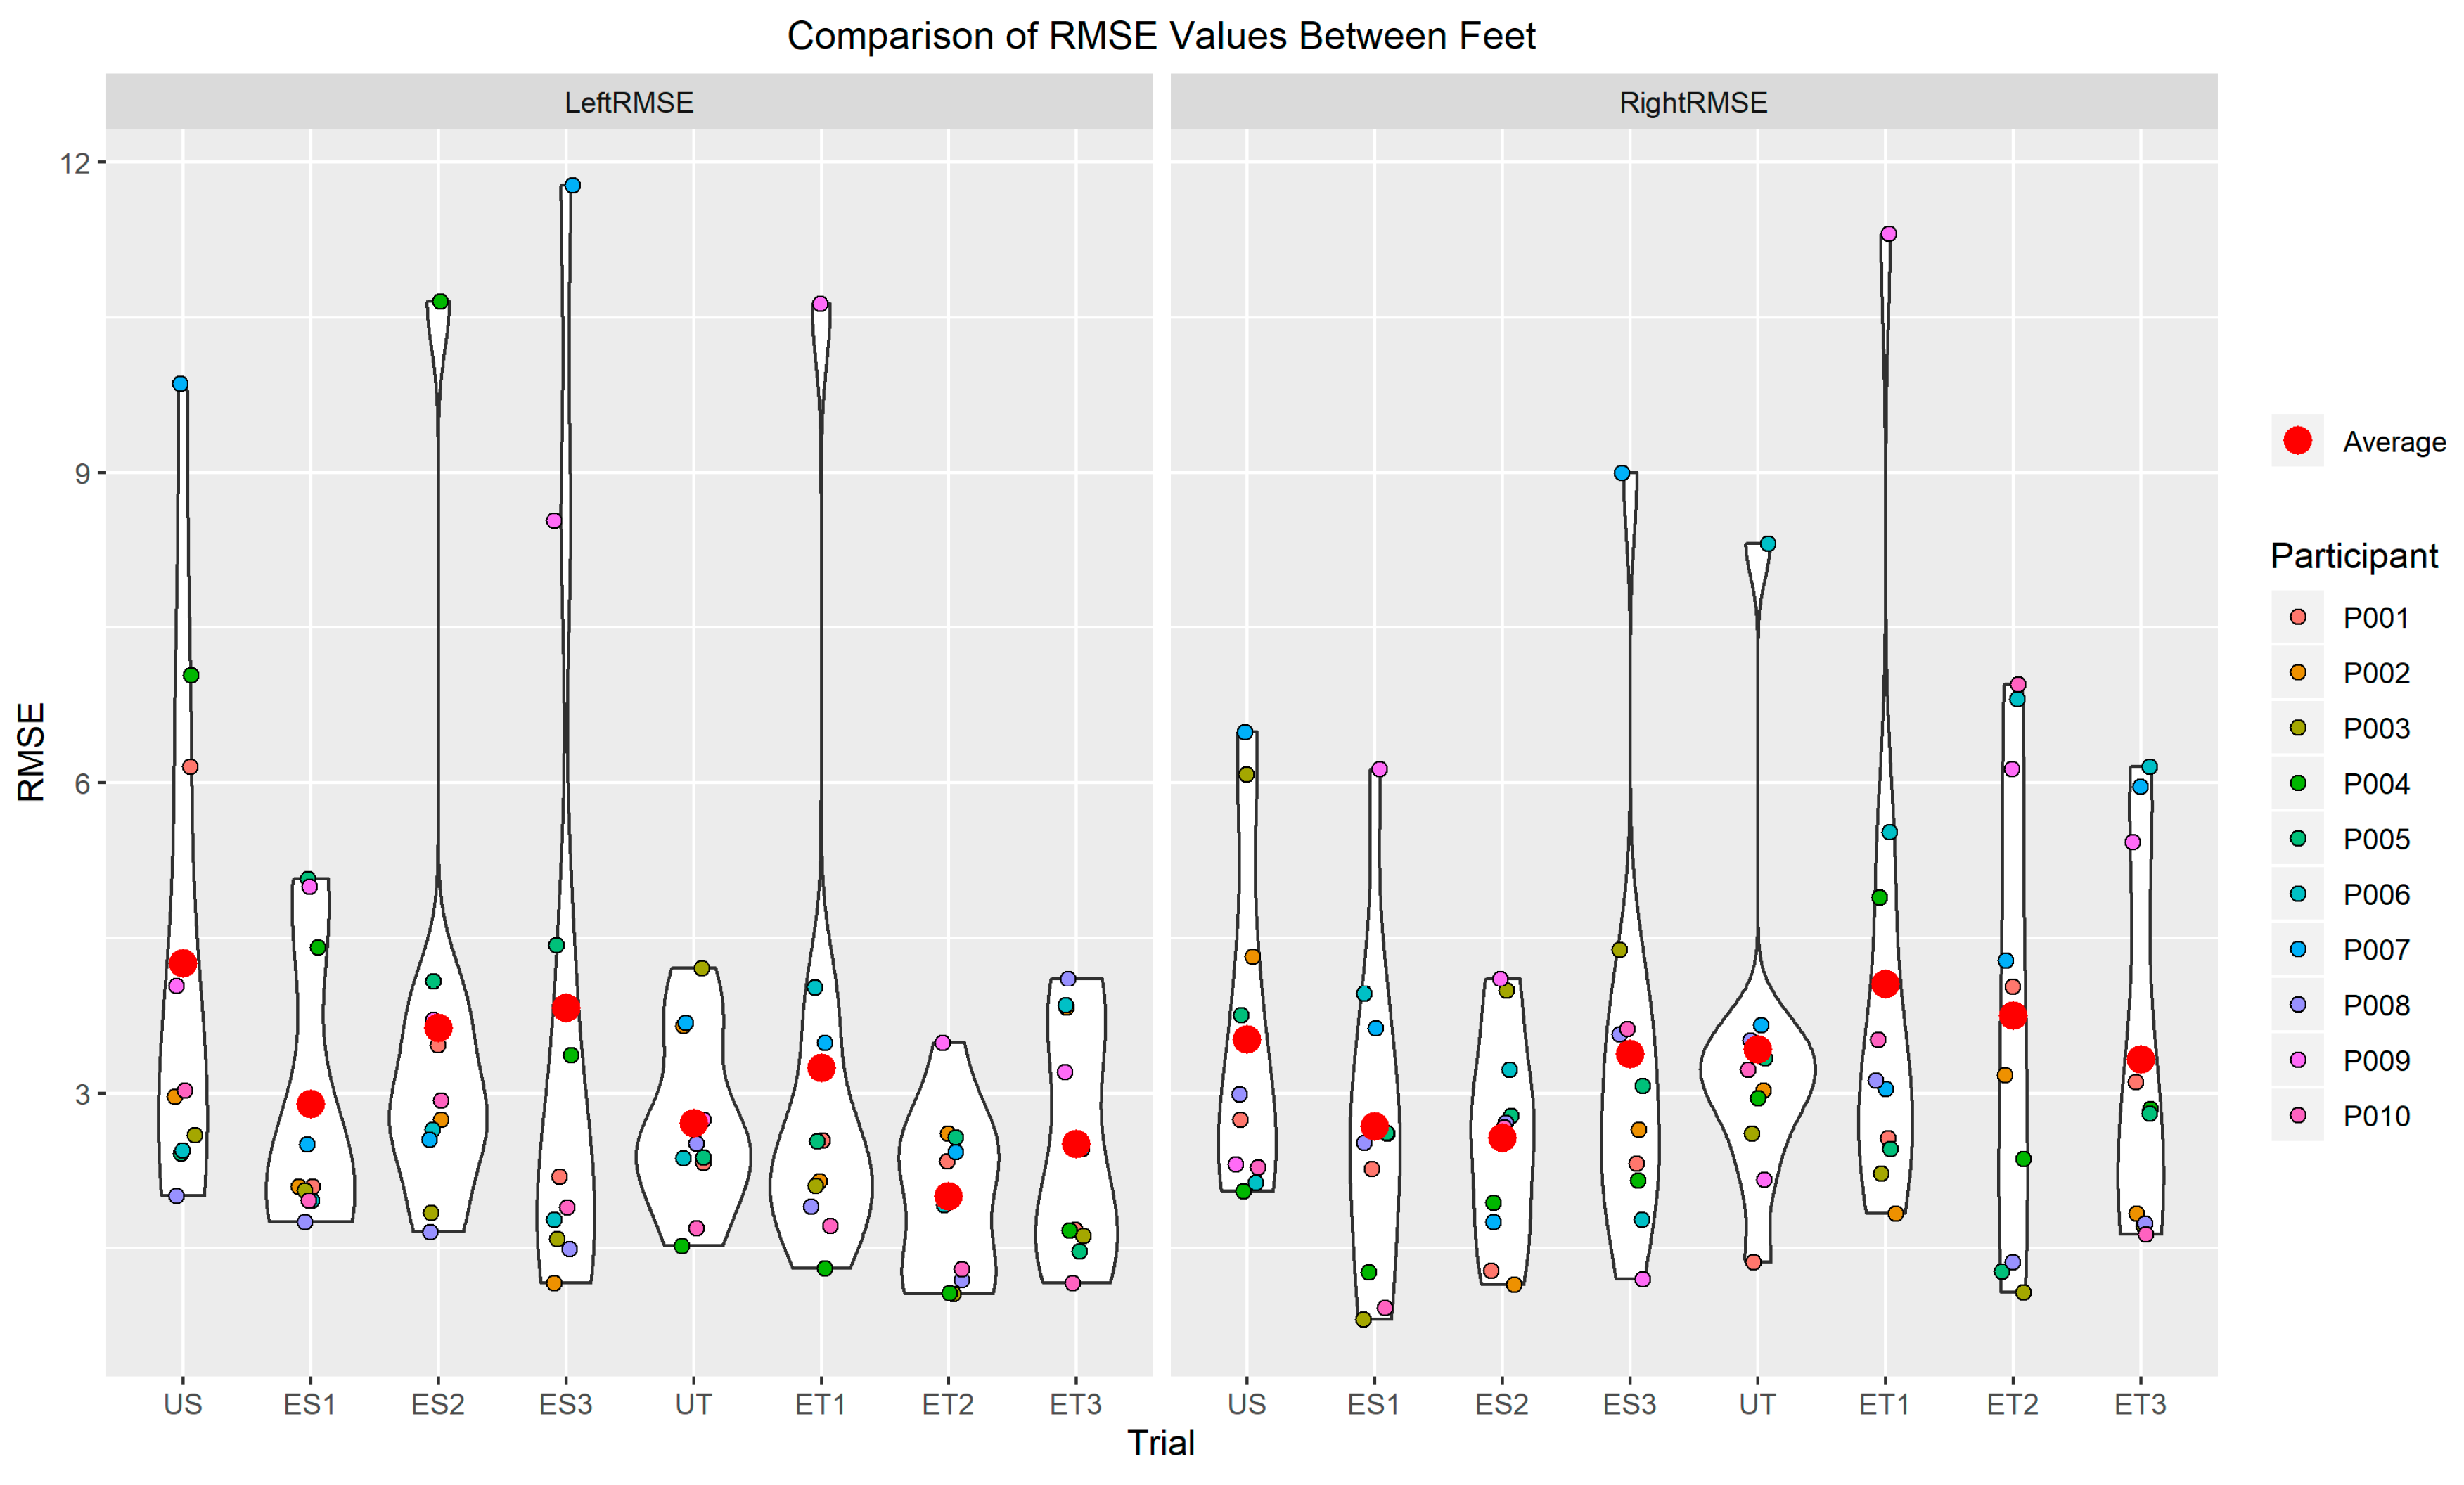
Results from the study are also presented in different pictorial representations indicating the performance of each trial based on adjusted R-squared and RMSE values (Figure 9; Figure 10). Average adjusted R-squared and average RMSE were identified for determining a relative and absolute goodness of fit of the model for the comparison of motion capture change in ankle angles versus the change in capacitance for all trials. On average, all trials had greater adjusted R-squared values and lower RMSE values in the linear model for the goodness of fit (Figure 9 and Figure 10). Based on the violin plots in Figure 9 and Figure 10, a greater portion of participants produced an R-squared value of more than 0.75 (moderate to high accuracy) and a greater portion of participants produced a RMSE value of lower than 4 (minimal errors). For the left foot–ankle kinematic detection, the highest adjusted R-squared value was 0.9781 (average = 0.7658) and the lowest RMSE was 1.0638 degrees (average = 3.1319 degrees). For the right foot–ankle kinematic detection, the highest adjusted R-squared value was 0.9832 (average = 0.7362) and the lowest RMSE was 0.8176 degrees (average = 0.9832 degrees). Results from the study demonstrated that 71.25% of the trials exhibited a minimal error of 4.0 degrees difference from the motion capture system and a greater than 0.60 R-squared value in the linear model, suggesting a moderate to high accuracy and minimal errors in comparing SRS with a motion capture system.

4. Discussion

The purpose of the study was to validate the use of SRS against a 3D motion capture system and to identify ankle joint kinematics during both unexpected and expected slip and trip perturbations for fall detection. SRS was hypothesized to be a valid tool for detecting ankle joint movements during both unexpected and expected postural slip and trip perturbations. Results from the current study indicated SRS as a viable product to detect ankle joint kinematics during unexpected and expected slips and trips and potentially serve as an early fall detection device. This was evident from the observed results, indicated by a high adjusted R-square value and low RMSE in the goodness of fit model between motion capture kinematics and SRS capacitance data during slip–trip trials.
During a slip perturbation, the ankle joint moves into a PF position as the center of mass (COM) of the human body is forced outside of the standing base of support (BOS) area in the posterior direction (leaning backward) [26,28,29]. During a trip perturbation, the ankle joint moves into DF position as the COM is forced outside the BOS in the anterior direction (leaning forward) [26,28,29]. Moreover, during such postural perturbations, not having the knowledge (unexpected/unanticipated) and having the knowledge (expected/anticipated) of the perturbation influences the biomechanics of fall recovery [31,32,33,34]. Unanticipated recoveries work using feedback postural control, whereas anticipated recoveries work using feedforward postural control. Results from the current study, as demonstrated in Figure 6 and Figure 7, support the behavior of the ankle joint during slip and trip postural perturbations. Comparison of ankle ROM change and peak, quantified by a motion capture system and capacitance change, measured by stretch sensors during these unexpected and expected slips and trips supported previous fall research conducted through motion capture technology [35,36]. Additionally, the results from the current study support previous literature regarding the feasibility of using wearable sensors for fall detection [22]. However, the primary purpose of the current study was to assess if stretch sensors could be used to identify ankle joint kinematics during such slip–trip perturbations to detect falls.
The current findings from this slip–trip study, presented here as Part III, are an extension of Part I and Part II papers from two previous studies from the current researchers on “closing the wearable gap” projects, in an attempt to develop feasible but accurate sensors using stretchable SRS for human movement monitoring from the ankle joint and above (from the ground up) [20,24]. The use of SRS was reported to produce a linear model for PF movement using a custom-built ankle joint device from Part I of “Closing the wearable gap” [20]. Additionally, testing the SRS on human participants to detect ankle joint movements compared with motion capture data was successful and reported to accurately detect ankle joint PF, DF, INV, and EVR movements using four stretch sensors from Part II of “Closing the wearable gap” [24]. The primary aim in Part II of the paper [24] was to test the soft robotic sensors for placement and orientation on the foot and ankle segment. Because the foot and ankle segment is a complex human joint (capable of triaxial movements), the orientation and placement/location of the sensors was crucial to get the accurate measurements of the movements possible. Hence, a total of 10 positions/locations and orientations were compared to identify the most desirable location for accurate movements. Additionally, due to the complexity of the foot and ankle movements, the following were the testing conditions: only isolated movements (one at a time) of ankle dorsiflexion, plantarflexion, inversion, and eversion; only in non-weight-bearing conditions, meaning not making contact with the ground, and only in one side of the foot (right side). However, in the current study, the previously developed sensors are being used for an entirely new application with fall prevention. There have been multiple studies reporting the efficacy of using postural perturbation in studying falls for fall detection. There have also been multiple studies that have used wearable sensors for fall detection. However, to the author’s knowledge, there has not been a previous study to validate the use of stretchable soft robotic sensors for fall detection (slips and trips). Additionally, the current project and paper addresses more real-life situations for falls that could be analyzed from a laboratory setting and is different from our Part II paper [24] in the following methods: combined movements of the foot and ankle movements with novel movement patterns of slipping and tripping; in weight-bearing conditions replicating slips and trips both without and with the knowledge of the individual; sensors on both sides of the feet to identify any asymmetries; validate the use of soft robotic sensors for fall detection that can be applied to all populations, ranging from geriatric to athletic and from clinical to occupational, all populations who are fall prone. Finally, the focus of this project and paper was to identify if these types of stretchable soft robotic sensors could be used for fall detection by measuring ankle range of motion, as these types of sensors have not been used for this purpose previously, at least to the author’s knowledge.
Subsequently, using these wearable SRS for detecting falls and potentially creating a wearable fall detection device is much needed. The current study tested the use of SRS during simulated real-life-type falls using backward (slip) and forward (trip) perturbations, both without (unexpected) and with (expected) the knowledge of the perturbation. Results from the current study supported the findings from Part I and Part II of the previous studies [20,24]. Based on the current findings, the use of SRS was found to have greater R-squared value and lower RMSE in the linear regression model, suggesting greater goodness of fit in comparing motion capture ankle joint kinematics with capacitance change from the SRS. The violin plots in Figure 9 and Figure 10 demonstrate that a greater portion of participants produced an R-squared value of more than 0.75 (moderate to high accuracy) and a greater portion of participants produced an RMSE value of lower than 4 (minimal errors). The higher R-squared values and low RMSE were also evident when comparing all unexpected and expected slip and trip trials and across both feet as well. Results from this study indicate that the stretch sensors could be used as a feasible option in detecting falls during slips and trips, even when they are unexpected or expected and across both left and right foot–ankle segments. Results from the study demonstrated that 71.25% of the trials exhibited a minimal error of less than 4.0 degrees difference from the motion capture system (lowest RMSE = 1.06 degrees and average RMSE = 3.13 degrees for the left foot and lowest RMSE = 0.81 and average RMSE = 3.33 degrees for the right foot) and a greater than 0.60 R-squared (highest R-squared value was 0.9781 and average R-squared = 0.7658 for the left foot and highest R-squared value was 0.9832 and average R-Squared = 0.7362 for the right foot) value in the linear model, suggesting a moderate to high accuracy and minimal errors in comparing SRS with a motion capture system. The R-squared values and RMSE were also evident when comparing all unexpected and expected slip and trip trials and across both feet as well, suggesting that SRS was a feasible option to detect bilateral ankle joint movements during slip–trip perturbations, using a total of four sensors.
While motion capture technology aids assessment of the joint ROM with gold-standard precision measures [18], it is still majorly confined within a laboratory setting, with limited implications to everyday tasks. Moreover, the financial cost and time consumed are also greater with the use of laboratory-based motion capture equipment. Therefore, there is a great demand for alternative solutions to precisely measure joint kinematics outside of a laboratory that have lower financial and time cost and can capture day-to-day, real-life scenarios. A wearable device that can measure changes in joint ROM and limit the negative aspects of motion capture while being precise appears as a promising solution [37]. The current study’s results offer unique findings in validating the use of wearable stretch sensors that can detect ankle joint ROM while minimizing limitations that exist with motion capture and other wearable devices for fall detection.
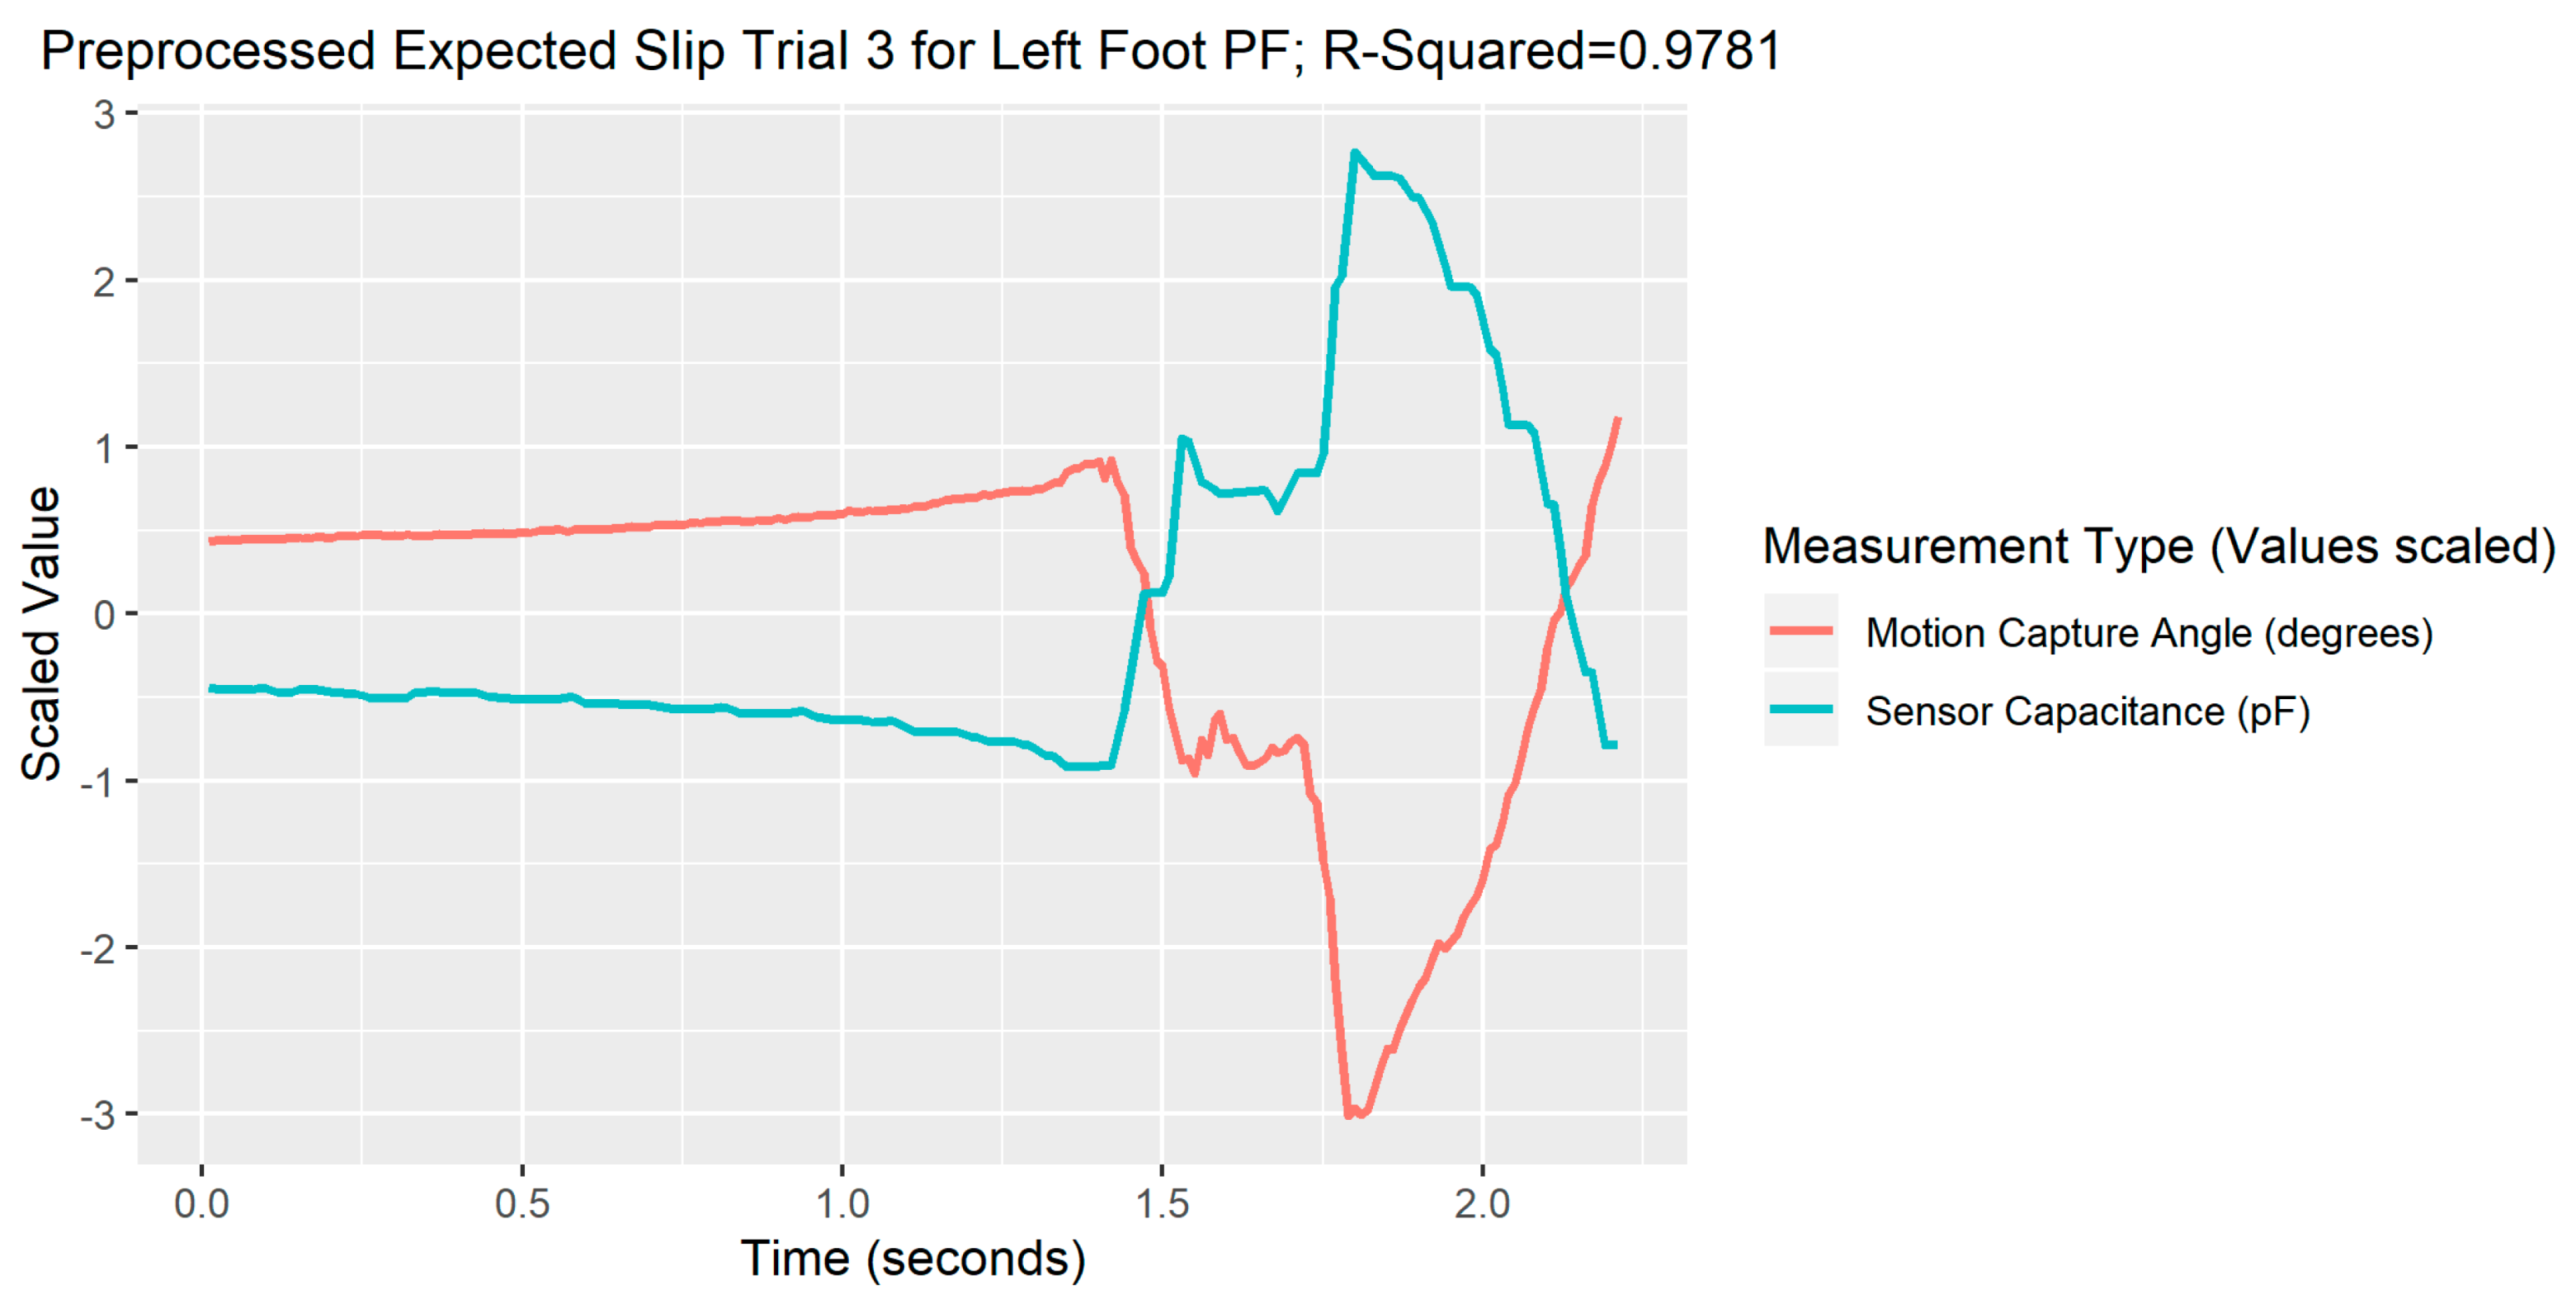
4.1. Limitations

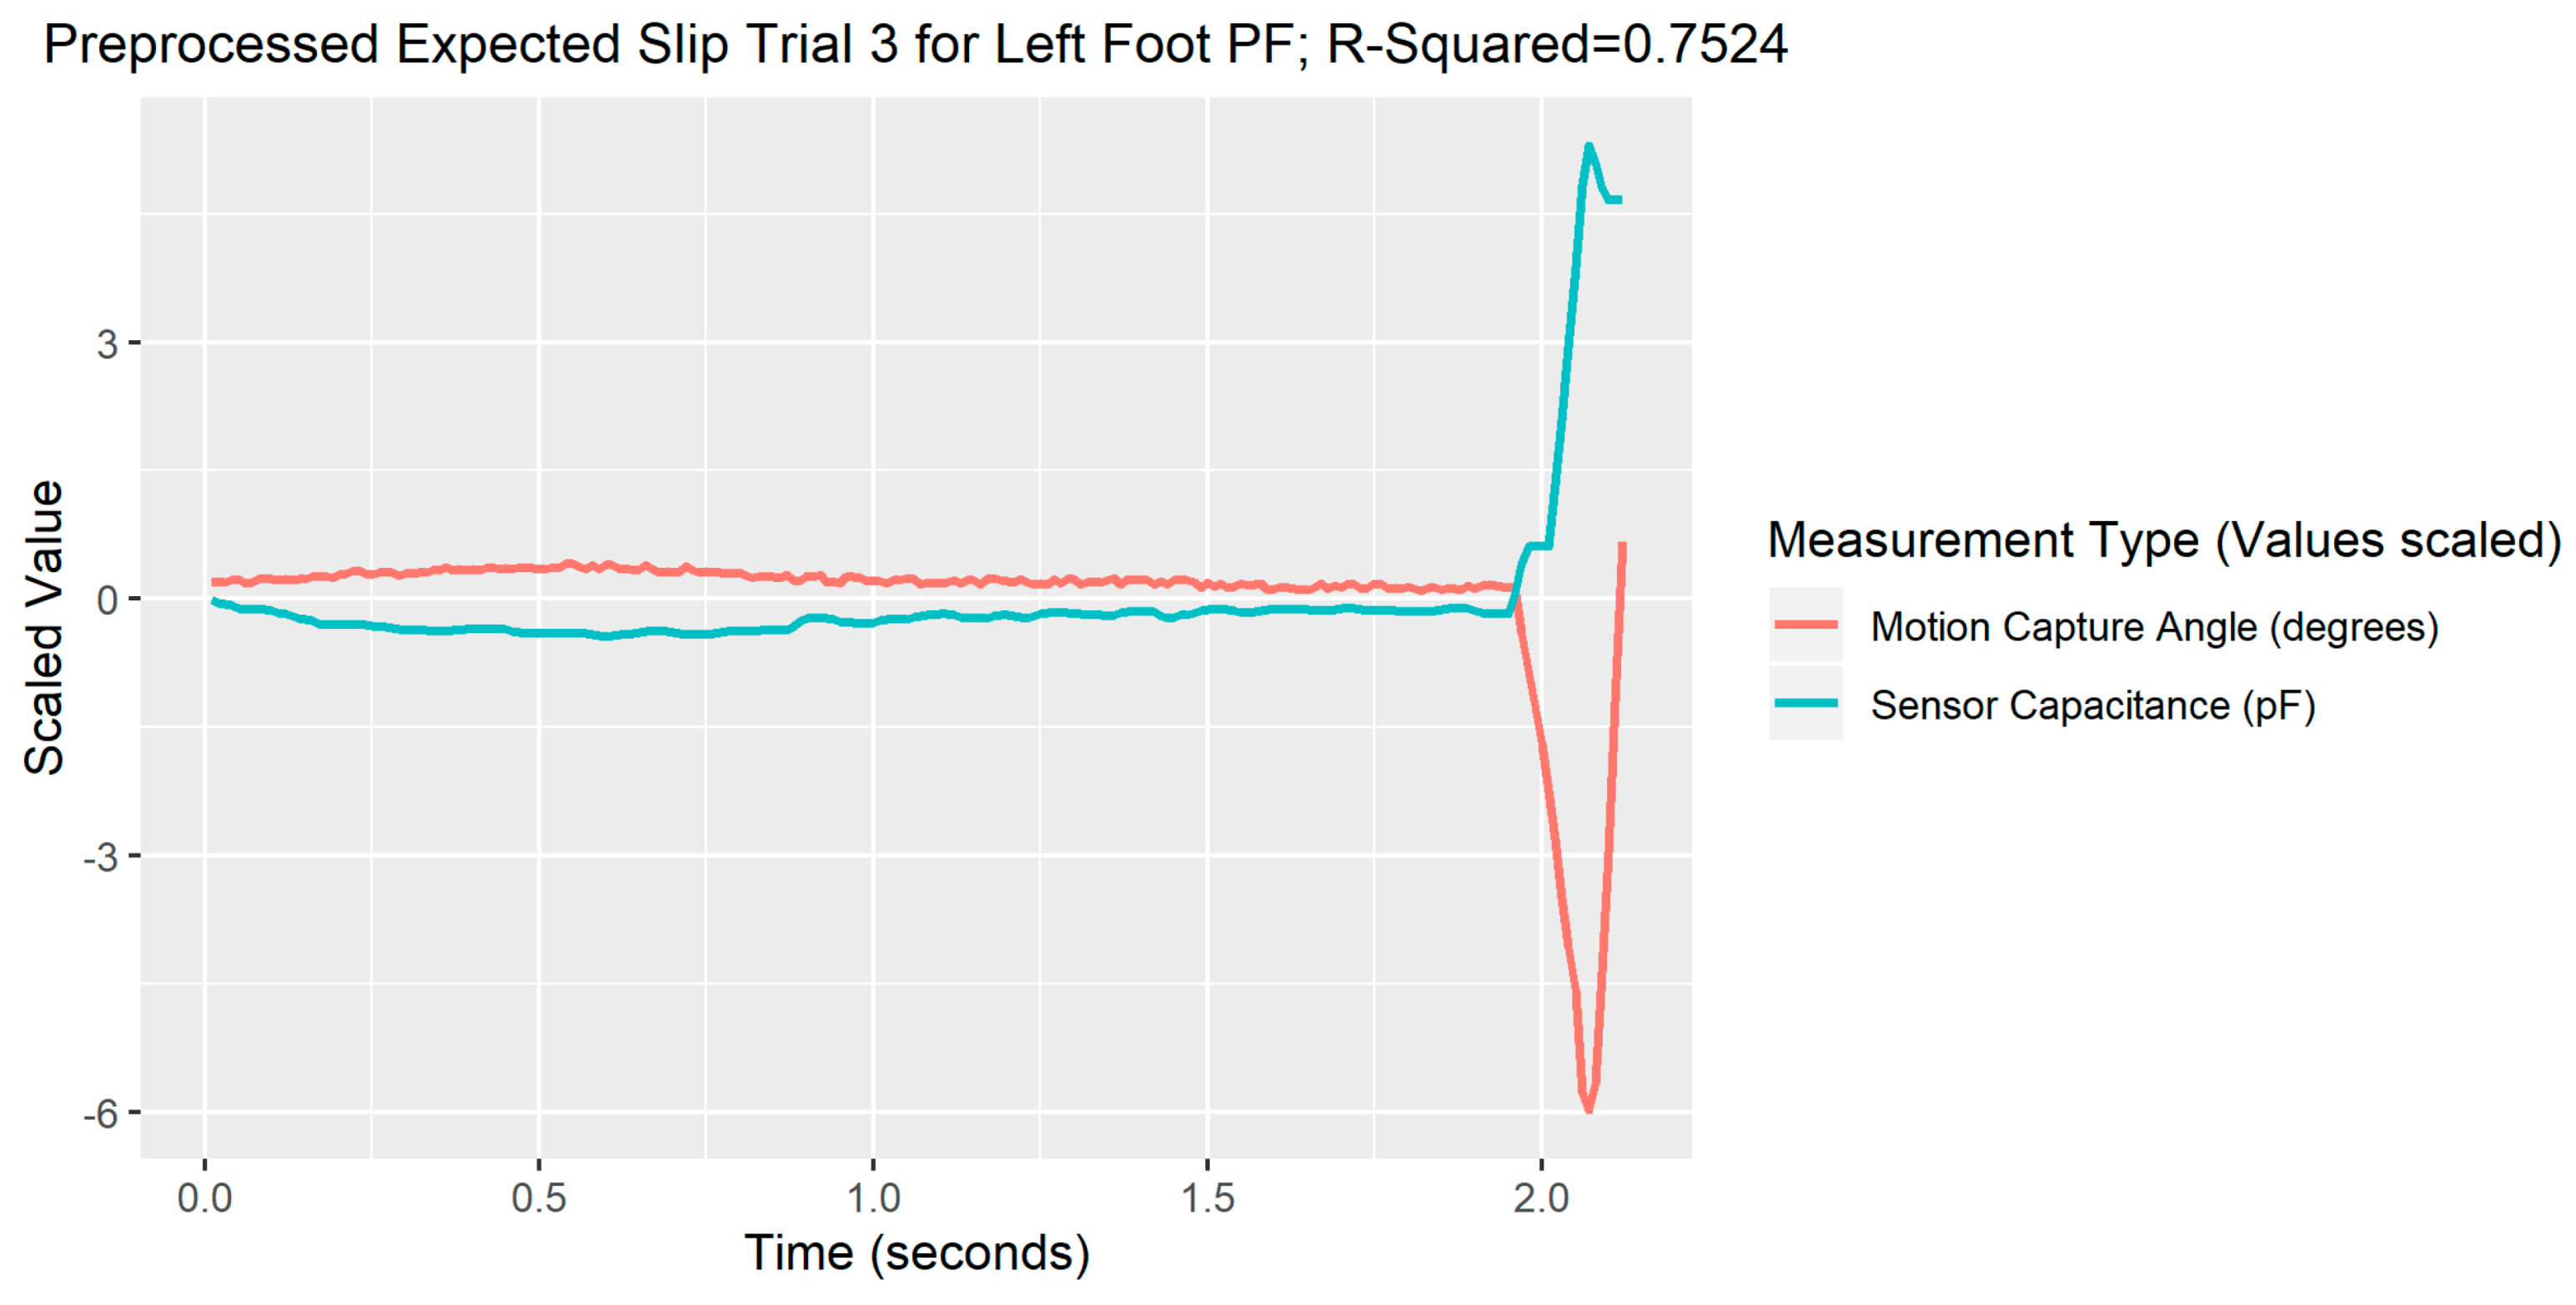
Limitations of the study’s experimental procedures included the exposure of slip and trip perturbations that are not similar to the real-world situation, as a manual trigger treadmill was used to induce perturbation from a stationary standing position and all participants were harnessed in a fall-arrest system to prevent undue falls during testing. However, every attempt was made to ensure that participants did not know the occurrence of the unexpected perturbations by providing the perturbations in a randomized time point and providing the same instructions to stand as still and erect as possible to the participants. Additionally, participants were also allowed one familiarization session to get acquainted with the harness system to generate a real-life fall recovery response. Limitations of the study’s data analysis were largely due to the low sampling rate of the StretchSense software, as indicated with examples in the results section of this paper, especially with an example each for a bad processing trial and a good processing trial. While the SRS was tested for ankle movements during slip and trip perturbations, the current study did not test ankle movements during other forms of activity such as walking, running, jumping, and so forth. Hence, the results observed in the study cannot be directly applied to other forms of human activity. The consumer acceptance level for using SRS for fall detection will depend on the population and the types of falls, and the results from the study should be used as preliminary findings. Finally, the material properties of the SRS have not yet been analyzed, which may further have more limitations. However, a previous study has reported “excellent linear trend with little noise” and no hysteresis [38]. Finally, the SRS device is still a prototype and would require further refining, ruggedization, testing (especially beyond a laboratory), and incorporating real-life falls and environments to test the effectiveness of the wearable SRS fall detection solution.

4.2. Future Work

Future work on fall detection devices can incorporate SRS for identifying joint kinematics. Moreover, wireless sensor networks, algorithms, and machine learning techniques have been used along with accelerometers and IMUs for fall detection [6,8,9,10,39] and in the future can also be implemented using SRS. However, adding electromyography (EMG) for fall detection in addition to joint kinematics detection can increase the accuracy of pre-impact fall detection, using both biomechanical and neuromuscular measures. The concept of pre-impact fall detection has been suggested earlier in attempts for early fall detection by using inertial sensors and fall-threshold-detecting algorithms [6,7,22,40]. Pre-impact fall detection research has been successful in detecting fall events at least 70 ms before the impact with the ground [7] and with an average lead time of 700 ms before the impact occurs, with no false alarms [40]. Using IMUs, pre-falls are usually detected due to abnormal or aberrant movement patterns of body segments that occur during falls but do not necessarily occur during regular activities of daily living [7,40]. More recently, a machine learning approach using EMG from the lower extremity has been successful in detecting pre-falls with a lead time of about 775 ms before the fall impact on the ground for forward, backward, and lateral falls [41]. However, as reported in Rucco et al. [22], the use of an accelerometer as a fall detection sensor has been more common due to its low cost and easy application compared with other sensor approaches such as EMG which require more complex sensor positioning, measurement, and analysis. Subsequently more research is warranted with more types of sensors to detect falls more precisely and efficiently. A combination of wearable stretch sensors, as discussed in this study, and EMG sensors with a machine learning approach can potentially be used for fall detection. The current research team is working on incorporating biomechanical and neuromuscular measures as a wearable solution for detecting falls. Finally, not much research has been conducted on the material properties of the SRS. Future work should also focus on testing the stress–strain properties and attempt to incorporate devices such as nanogenerators that can produce current with no requirements of external power supply that can be a safe and viable option for wearable applications.

5. Conclusions

With falls and fall-related injuries posing a significant threat to multiple populations, such as clinical, geriatric, athletic, occupational, and the healthy, accurate detection of ankle joint movements during postural perturbations using wearable solutions is crucial. Results from the study demonstrated that 71.25% of the trials exhibited a minimal error of less than 4.0 degrees difference from the motion capture system and a greater than 0.60 R-squared value in the linear model, suggesting a moderate to high accuracy and minimal errors in comparing SRS with a motion capture system. Findings indicate that the stretch sensors could be a feasible option in detecting ankle joint kinematics during slips and trips. Findings from this project will help in identifying wearable solutions in early detection of fall risk and prevent falls and fall-related injuries.

Author Contributions

Conceptualization: H.C.; methodology: H.C.; investigation: E.S. and D.S.; resources, R.F.B.V., J.E.B., B.K.S., A.C.K. and R.K.P.; data analysis: H.C., E.S., D.S., P.N. and T.L.; writing—original draft preparation: H.C.; writing—review and editing, R.F.B.V., J.E.B., B.K.S., A.C.K. and R.K.P.; visualization: D.S., P.N., T.L. and J.E.B.; supervision: H.C.; project administration: H.C.; funding acquisition: H.C. and E.S.

Funding

This project and publication was supported by Grant #2T42OH008436 from the National Institute of Occupational Safety and Health (NIOSH).

Acknowledgments

This project and publication was supported by Grant #2T42OH008436 from the National Institute of Occupational Safety and Health (NIOSH). Its contents are solely the responsibility of the authors and do not necessarily represent the official views of NIOSH. The research presented in this paper was partly funded by the National Science Foundation under NSF 18-511 - Partnerships for Innovation award number 1827652. The authors sincerely thank the anonymous reviewers for their valuable suggestions for improving the manuscript.

Conflicts of Interest

The authors declare no conflict of interest. The funders had no role in the design of the study; in the collection, analyses, or interpretation of data; in the writing of the manuscript, or in the decision to publish the results.

References

  1. Hamm, J.; Money, A.G.; Atwal, A.; Paraskevopoulos, I. Fall prevention intervention technologies: A conceptual framework and survey of the state of the art. J. Biomed. Inform. 2016, 59, 319–345. [Google Scholar] [CrossRef] [PubMed] [Green Version]
  2. Injuries, Illnesses, and Fatalities. Available online: https://www.bls.gov/iif/ (accessed on 9 August 2019).
  3. Chander, H.; Dabbs, N.C. Balance Performance and Training Among Female Athletes. Strength Cond. J. 2016, 38, 8. [Google Scholar] [CrossRef]
  4. Chaccour, K.; Darazi, R.; Hassani, A.H.E.; Andrès, E. From Fall Detection to Fall Prevention: A Generic Classification of Fall-Related Systems. IEEE Sens. J. 2017, 17, 812–822. [Google Scholar] [CrossRef]
  5. Mukhopadhyay, S.C. Wearable Sensors for Human Activity Monitoring: A Review. IEEE Sens. J. 2015, 15, 1321–1330. [Google Scholar] [CrossRef]
  6. Genovese, V.; Mannini, A.; Guaitolini, M.; Sabatini, A.M. Wearable Inertial Sensing for ICT Management of Fall Detection, Fall Prevention, and Assessment in Elderly. Technologies 2018, 6, 91. [Google Scholar] [CrossRef]
  7. Wu, G.; Xue, S. Portable Preimpact Fall Detector With Inertial Sensors. IEEE Trans. Neural Syst. Rehabil. Eng. 2008, 16, 178–183. [Google Scholar] [PubMed]
  8. Chen, J.; Kwong, K.; Chang, D.; Luk, J.; Bajcsy, R. Wearable Sensors for Reliable Fall Detection. In Proceedings of the 2005 IEEE Engineering in Medicine and Biology 27th Annual Conference, Shanghai, China, 1–4 September 2005; pp. 3551–3554. [Google Scholar]
  9. Srinivasan, S.; Han, J.; Lal, D.; Gacic, A. Towards automatic detection of falls using wireless sensors. In Proceedings of the 2007 29th Annual International Conference of the IEEE Engineering in Medicine and Biology Society, Lyon, France, 22–26 August 2007; pp. 1379–1382. [Google Scholar]
  10. Schwickert, L.; Becker, C.; Lindemann, U.; Maréchal, C.; Bourke, A.; Chiari, L.; Helbostad, J.L.; Zijlstra, W.; Aminian, K.; Todd, C.; et al. Fall detection with body-worn sensors. Z. Für Gerontol. Geriatr. 2013, 46, 706–719. [Google Scholar] [CrossRef] [PubMed]
  11. Ma, C.Z.-H.; Wong, D.W.-C.; Lam, W.K.; Wan, A.H.-P.; Lee, W.C.-C. Balance Improvement Effects of Biofeedback Systems with State-of-the-Art Wearable Sensors: A Systematic Review. Sensors 2016, 16, 434. [Google Scholar] [CrossRef] [PubMed]
  12. Shany, T.; Redmond, S.J.; Narayanan, M.R.; Lovell, N.H. Sensors-Based Wearable Systems for Monitoring of Human Movement and Falls. IEEE Sens. J. 2012, 12, 658–670. [Google Scholar] [CrossRef]
  13. Habib, M.A.; Mohktar, M.S.; Kamaruzzaman, S.B.; Lim, K.S.; Pin, T.M.; Ibrahim, F. Smartphone-Based Solutions for Fall Detection and Prevention: Challenges and Open Issues. Sensors 2014, 14, 7181–7208. [Google Scholar] [CrossRef] [PubMed] [Green Version]
  14. Delahoz, Y.S.; Labrador, M.A. Survey on Fall Detection and Fall Prevention Using Wearable and External Sensors. Sensors 2014, 14, 19806–19842. [Google Scholar] [CrossRef] [PubMed] [Green Version]
  15. Dai, J.; Bai, X.; Yang, Z.; Shen, Z.; Xuan, D. Mobile Phone-based Pervasive Fall Detection. Pers. Ubiquitous Comput 2010, 14, 633–643. [Google Scholar] [CrossRef]
  16. Sixsmith, A.; Johnson, N. A smart sensor to detect the falls of the elderly. IEEE Pervasive Comput. 2004, 3, 42–47. [Google Scholar] [CrossRef]
  17. Mellone, S.; Tacconi, C.; Schwickert, L.; Klenk, J.; Becker, C.; Chiari, L. Smartphone-based solutions for fall detection and prevention: the FARSEEING approach. Z. Für Gerontol. Geriatr. 2012, 45, 722–727. [Google Scholar] [CrossRef] [PubMed]
  18. Fong, D.T.-P.; Chan, Y.-Y. The Use of Wearable Inertial Motion Sensors in Human Lower Limb Biomechanics Studies: A Systematic Review. Sensors 2010, 10, 11556–11565. [Google Scholar] [CrossRef] [PubMed] [Green Version]
  19. Cooper, G.; Sheret, I.; McMillian, L.; Siliverdis, K.; Sha, N.; Hodgins, D.; Kenney, L.; Howard, D. Inertial sensor-based knee flexion/extension angle estimation. J. Biomech. 2009, 42, 2678–2685. [Google Scholar] [CrossRef] [PubMed] [Green Version]
  20. Luczak, T.; Saucier, D.; Burch, V.R.F.; Ball, J.E.; Chander, H.; Knight, A.; Wei, P.; Iftekhar, T. Closing the Wearable Gap: Mobile Systems for Kinematic Signal Monitoring of the Foot and Ankle. Electronics 2018, 7, 117. [Google Scholar] [CrossRef]
  21. Pang, I.; Okubo, Y.; Sturnieks, D.; Lord, S.R.; Brodie, M.A. Detection of Near Falls Using Wearable Devices: A Systematic Review. J. Geriatr. Phys. Ther. 2019, 42, 48. [Google Scholar] [CrossRef] [PubMed]
  22. Rucco, R.; Sorriso, A.; Liparoti, M.; Ferraioli, G.; Sorrentino, P.; Ambrosanio, M.; Baselice, F. Type and Location of Wearable Sensors for Monitoring Falls during Static and Dynamic Tasks in Healthy Elderly: A Review. Sensors 2018, 18, 1613. [Google Scholar] [CrossRef] [PubMed]
  23. Gordt, K.; Gerhardy, T.; Najafi, B.; Schwenk, M. Effects of Wearable Sensor-Based Balance and Gait Training on Balance, Gait, and Functional Performance in Healthy and Patient Populations: A Systematic Review and Meta-Analysis of Randomized Controlled Trials. Gerontology 2018, 64, 74–89. [Google Scholar] [CrossRef]
  24. Saucier, D.; Luczak, T.; Nguyen, P.; Davarzani, S.; Peranich, P.; Ball, J.E.; Burch, R.F.; Smith, B.K.; Chander, H.; Knight, A.; et al. Closing the Wearable Gap—Part II: Sensor Orientation and Placement for Foot and Ankle Joint Kinematic Measurements. Sensors 2019, 19, 3509. [Google Scholar] [CrossRef] [PubMed]
  25. Lindemann, U.; Hock, A.; Stuber, M.; Keck, W.; Becker, C. Evaluation of a fall detector based on accelerometers: A pilot study. Med. Biol. Eng. Comput. 2005, 43, 548–551. [Google Scholar] [CrossRef] [PubMed]
  26. Winter, D. Human balance and posture control during standing and walking. Gait Posture 1995, 3, 193–214. [Google Scholar] [CrossRef]
  27. Aziz, O.; Park, E.J.; Mori, G.; Robinovitch, S.N. Distinguishing the causes of falls in humans using an array of wearable tri-axial accelerometers. Gait Posture 2014, 39, 506–512. [Google Scholar] [CrossRef] [PubMed]
  28. Horak, F.B. Clinical Measurement of Postural Control in Adults. Phys. Ther. 1987, 67, 1881–1885. [Google Scholar] [CrossRef] [PubMed]
  29. Horak, F.B. Postural orientation and equilibrium: What do we need to know about neural control of balance to prevent falls? Age Ageing 2006, 35, ii7–ii11. [Google Scholar] [CrossRef] [PubMed]
  30. Gait Analysis Models. Available online: http://www.clinicalgaitanalysis.com/faq/sets/ (accessed on 19 August 2019).
  31. Chander, H.; Garner, J.C.; Wade, C. Heel contact dynamics in alternative footwear during slip events. Int. J. Ind. Ergon. 2015, 48, 158–166. [Google Scholar] [CrossRef]
  32. Chander, H.; Garner, J.C.; Wade, C. Slip outcomes in firefighters: A comparison of rubber and leather boots. Occup. Ergon. 2016, 13, 67–77. [Google Scholar] [CrossRef]
  33. Chander, H.; Wade, C.; Garner, J.C.; Knight, A.C. Slip initiation in alternative and slip-resistant footwear. Int. J. Occup. Saf. Ergon. 2017, 23, 558–569. [Google Scholar] [CrossRef]
  34. Chander, H.; Knight, A.C.; Garner, J.C.; Wade, C.; Carruth, D.W.; DeBusk, H.; Hill, C.M. Impact of military type footwear and workload on heel contact dynamics during slip events. Int. J. Ind. Ergon. 2018, 66, 18–25. [Google Scholar] [CrossRef]
  35. Chang, W.-R.; Leclercq, S.; Lockhart, T.E.; Haslam, R. State of science: Occupational slips, trips and falls on the same level. Ergonomics 2016, 59, 861–883. [Google Scholar] [CrossRef] [PubMed]
  36. Shiratori, T.; Coley, B.; Cham, R.; Hodgins, J.K. Simulating balance recovery responses to trips based on biomechanical principles. In Proceedings of the 2009 ACM SIGGRAPH/Eurographics Symposium on Computer Animation-SCA ’09, New Orleans, LA, USA, 1–2 August 2009; ACM Press: New Orleans, LA, USA, 2009; p. 37. [Google Scholar]
  37. Chan, M.; Estève, D.; Fourniols, J.-Y.; Escriba, C.; Campo, E. Smart wearable systems: Current status and future challenges. Artif. Intell. Med. 2012, 56, 137–156. [Google Scholar] [CrossRef] [PubMed]
  38. Litteken, D. Evaluation of Strain Measurement Devices for Inflatable Structures. In Proceedings of the 58th AIAA/ASCE/AHS/ASC Structures, Structural Dynamics, and Materials Conference, Grapevine, TX, USA, 9–13 January 2017; American Institute of Aeronautics and Astronautics: Grapevine, TX, USA, 2017. [Google Scholar] [Green Version]
  39. Hakim, A.; Huq, M.S.; Shanta, S.; Ibrahim, B.S.K.K. Smartphone Based Data Mining for Fall Detection: Analysis and Design. Procedia Comput. Sci. 2017, 105, 46–51. [Google Scholar] [CrossRef]
  40. Nyan, M.N.; Tay, F.E.H.; Murugasu, E. A wearable system for pre-impact fall detection. J. Biomech. 2008, 41, 3475–3481. [Google Scholar] [CrossRef] [PubMed]
  41. Rescio, G.; Leone, A.; Siciliano, P. Supervised machine learning scheme for electromyography-based pre-fall detection system. Expert Syst. Appl. 2018, 100, 95–105. [Google Scholar] [CrossRef]
Figure 1. Arrangement of SRS and motion capture marker setup to capture and assess sagittal plane ankle kinematics (PF and DF), positioned on a treadmill belt to provide external postural perturbation in the forward and backward direction. SRS: soft robotic sensor. PF: plantarflexion. DF: dorsiflexion.
Electronics 08 01083 g001
Figure 2. A sequence of an unexpected slip perturbation with wearable SRS and a motion capture marker system to assess fall detection.
Electronics 08 01083 g002
Figure 3. A sequence of an unexpected trip perturbation with wearable SRS and a motion capture marker system to assess fall detection.
Electronics 08 01083 g003
Figure 4. An example of a bad processing trial that produced bad/poor results.
Electronics 08 01083 g004
Figure 5. An example of a good processing trial that produced good/great result.
Electronics 08 01083 g005
Figure 6. Spread and average ankle range of motion change for each foot across every trial; note that positive and negative changes occur respective to the trial with negative values indicating movement of ankle into PF and positive values indicate movement of ankle into DF.
Electronics 08 01083 g006
Figure 7. Spread and averages peak angles for each foot across every trial; note that positive and negative changes occur respective to the trial with negative values indicating movement of ankle into PF and positive values indicate movement of ankle into DF.
Electronics 08 01083 g007
Figure 8. Spread and averages of capacitance change for each foot across every trial.
Electronics 08 01083 g008
Figure 9. Spread, average, and individual data points of R-squared values for each trial across feet.
Electronics 08 01083 g009
Figure 10. Spread, average, and individual data points of RMSE values for each trial across feet.
Electronics 08 01083 g010

