1. Introduction
Today’s increasing electricity consumption, together with the restructuring of power systems, causes new challenges in the operation, control, and monitoring of such networks. In this regard, the use of a supervisory control and data acquisition (SCADA) system is not sufficient to ensure the stability and security of the system. SCADA systems usually do not enable a synchronous data set [
1]. Also, the sampling rate is not high in such systems. Thus, the information of SCADA systems displays the system’s semi-stable status, and the operators in control centers do not have the right information about the system’s dynamic conditions [
2].
To enable reliable data measurement, the wide area measurement system (WAMS) has been developed to compensate for the disadvantages of the SCADA system [
3,
4]. The phasor measurement unit (PMU) is the main part of a WAMS. In fact, by measuring the voltage and current angles and increasing the sampling rate and simultaneous measurement capability, the previous disadvantages could be eliminated [
5].
In order to estimate the true state of a system, observability is a must [
6], meaning that if all the state variables of a network are determined, the network will be fully observable. PMU can measure the voltage phasor and related current phasors of a bus. Using this characteristic, the number of buses that need to be measured will be reduced [
7,
8]. However, owing to the high cost of PMU installation, determination of the minimum number of PMUs for observability of a system is an important issue that needs further attention [
9].
In recent research works, many methods have been presented to solve the optimal PMU placement (OPP) problem while considering the observability of the system [
10]. The main goal is to reduce the WAMS cost by minimizing the number of PMUs [
11]. The proposed methods for solving the OPP are divided into two groups: mathematical-based approaches and heuristic methods. One of the most applicable methods of the first type is integer linear programming (ILP) [
12]. Heuristic algorithms, such as genetic algorithm [
13], Tabu search [
14], and binary particle swarm [
15], are also used frequently for solving the OPP problem.
All of the aforementioned methods follow the aim of minimizing the number of PMUs that guarantee the full observability of the power system subject to several aspects such as contingency [
16], redundancy [
17], reliability assessment [
18], and so on. In the work of [
19], an integer linear programming model is proposed for the OPP. This research shows that the optimal solution of the OPP cannot be achieved without considering the zero-injection buses (ZIB). Also, with regard to multiple solutions of the OPP, two indices are defined for the ranking of solutions; the bus observability index (BOI) and system observability redundancy index (SORI). The same problem is addressed in the work of [
20], where the effect of ZIBs in contingency constrained OPP is investigated using an auxiliary variable.
Conventional measurement (CM) assets in a network such as injection measurement (IM), voltage measurement (VM), and power flow measurement (PFM) units also play an important role in the OPP problem, as pepper modeling of CMs and ZIBs can decrease the number of PMUs for the observability of WAMS. To this end, some studies have invested a great deal of effort into efficiently using CMs and ZIBs to reduce the required number of PMUs for full observability of a system. The effect of ZIBs and PFM on the OPP is considered in the work of [
21]. In the work of [
22], the effects of VM, IM, PFM, and ZIBs in the OPP are proposed using a modified bus merging method. A combination of SCADA and the WAMS measurements for the OPP problem with respect to the voltage magnitude estimation and voltage controllability is proposed in the work of [
23]. The objective of this paper is state estimation with the minimum number of measurement devices.
Individual placement of PMUs and communication infrastructures cannot provide a globally optimal solution to WAMS. Therefore, a bunch of research works has been dedicated to considering the optimal PMU and communication infrastructure placement, simultaneously. In the work of [
24], optimal PMU-communication link placement has been proposed and demonstrated that such co-placement could end in system-wide optimality. In the work of [
25], the optimal placement of the phasor data concentrator (PDC) has been added to the objective function, and a combined approach based on binary imperialistic competition algorithm and Dijkstra algorithms has been used to solve the optimization problem. Likewise, optimal PMU-communication link placement is done in the work of [
26], considering the bandwidth cost of the communication system. Data security in PMU communication system is considered in the work of [
27]. A microwave communication technology instead of the conventional fiber-based links is proposed in the work of [
28], where the objective is to minimize the propagation delay in the optimal placement of PMUs, PDC, and communication links. The authors in [
29] have implemented the optimal micro-PMU placement for distribution networks using the greedy algorithm. They showed that the proposed model could be effectively used for observability analysis at the distribution level.
In most of the reviewed literature, studies have assumed that the communication links are based on conventional optical fiber cables. The fiber-link communication needs a major infrastructure and a very high investment cost would be inevitable. As an alternative, wireless sensors can be effectively used to yield a low-cost communication system with a simple infrastructure.
Today, wireless sensors are extensively used in different applications such as medical care [
30], environment monitoring [
31], smart city [
32], various industries automation [
33], and smart homes [
34]. However, most conventional wireless sensors are driven by batteries with limited lifetimes, making the maintenance and replacement of battery-powered sensor nodes (BPSNs) a very difficult or even impossible task [
35]. Many types of research have been done to minimize the energy consumption of these sensors or to maximize battery lifetime [
36]. Energy harvesting sensor nodes can be used to solve the lifetime problem of battery-based sensors. EHSN can harvest energy from environmental sources and convert it into usable electrical energy for wireless sensors [
37]. Another group of wireless sensors is the plug-in powered sensor nodes (PPSNs) that can be energized from an external source.
In this paper, the optimal PMU and their communication links’ placement is done using a combination of PPSNs and EHSNs. The objective function includes the total cost minimization subject to power system observability and communication constraints. The cost of this system relates to PMU cost and communication system cost. The effect of ZIBs and SORI are also included in the model to get a more practical, yet optimal result. A binary-coded genetic algorithm is used for solving the proposed mixed-objective optimization problem. In this problem, there are two major constraints: communication constraint and observability constraints, both from the power system (PMUs) and communication network (WSNs) perspectives. As a whole, the main motivations and contributions of this study can be summarized as follows:
An efficient and low-cost communication infrastructure is proposed based on PPSNs and EHSNs to enable secure communications among PMUs and the control center,
The combination of PPSNs and EHSNs for setting up the communication infrastructure in the power system is analyzed in terms of economy and observability,
The impacts of ZIB and SORI are simultaneously investigated in designing a communication infrastructure.
The rest of this paper is organized as follows. A problem definition is presented in
Section 2. The problem formulation and the proposed optimization method are detailed in
Section 3. The numerical study and simulation results are presented in
Section 4, while conclusions are drawn in
Section 5.
2. WAMS Structure
Along with the SCADA system, WAMS has been developed to compensate for the shortcomings of the SCADA system. PMUs are the main component of the WAMS that can measure the voltage and current phasors with high precision (less than 0.1% error) and high speed (up to 60 samples per second). PMUs use the global positioning system (GPS) to synchronize measured data. If enough PMUs are installed in different buses, the system will be observable and the system operator can truly estimate the state of the system. Therefore, one of the important issues is finding the optimal number and location of the PMUs to have a fully observable system, while being economic and viable in practice.
Generally, there are three levels in WAMS: data acquisition, data transferring, and data processing. In the first step, the measured data are provided by the measuring devices such as PMU, IM, VM, and PFM. The second level is transferring and delivering data to the control center through communication infrastructure, which can vary according to the type of network. The last level is the energy management system (EMS). In this step, the provided data are processed and optimal actions in terms of state estimation (SE), optimal power flow (OPF), load flow (LF), and so on will be determined based on the required output.
In this paper, for the first level, the PMU is utilized. In order to model the power system, there are two node sets: the nodes with load or generation that is called a non-zero-injection bus, and the set of nodes without associated load or generation, so-called ZIBs. The existence of PMUs and considering the effect of ZIBs can decrease the number of measurement devices that are needed for full observability of the power system. These issues will be described in the next section.
In the second level, a combined wireless sensor structure is proposed for setting up communication infrastructure. The PPSNs and EHSNs are used for delivering data to the PDC. It is assumed that the location of the PDC is determined and fixed. In fact, unlike conventional communication networks such as optic fiber links, a combination of PPSNs and EHSNs is used for communication infrastructure.
The provided data by the measurement system and CI can be processed in the third level to fulfill the objectives of the system operator. In the next section, the formulation of the proposed method is presented.
3. Problem Formulation
In this paper, OPP and the related communication system using wireless sensors are studied. The minimization of measurement units and wireless sensor-based communication considering the system constraints is the objective. To this end, the OPP problem considering ZIBs and redundancy is initially defined and formulated. Then, the communication system requirements are discussed. In the next step, the observability aspects of the wireless sensor network are presented. Finally, the structure of the proposed solution method based on a binary-coded genetic algorithm is described.
3.1. Optimal PMU Placement
Because of the high price of PMUs, it is not economical to set up all system nodes with such devices. Thus, the right direction for optimizing the placement of PMUs in a power grid is to use the least number of measuring devices corresponding to the minimum cost and to establish full observability of the network with the mentioned measurements.
A power grid is fully observable if all of its buses can be observed. By definition, a node in the power system is observable if that node or any of its adjacent nodes (which are connected to the target node) is equipped with a PMU. In other words, the presence of a PMU in a bus is adequate for the observability of all adjacent buses. Accordingly, the OPP problem can be derived as follows [
19]:
where
n is the number of buses,
ωi is the cost of purchasing and installing PMUs, and
I is the set of buses.
fi is the observability function at the bus
I, which is defined as follows:
where
A is the connectivity matrix and
X is the PMU installation matrix. If the number of network buses is equal to
n, then the connectivity matrix of the system will be
n ×
n, which is formed as follows:
Moreover, the existence of a PMU in a bus can be represented mathematically as follows:
The
X vector contains all the
xi variables.
For full observability of the power system, all of the indices in Equation (2) should be 1 or greater than 1, meaning that each bus should be observable by at least one PMU.
3.2. Effect of Zero-Injection and Redundancy
In a ZIB, there is no generation and load. In fact, no current is injected in a ZIB. A ZIB and its adjacent buses are called a set of zero injection bus (SOZIB) [
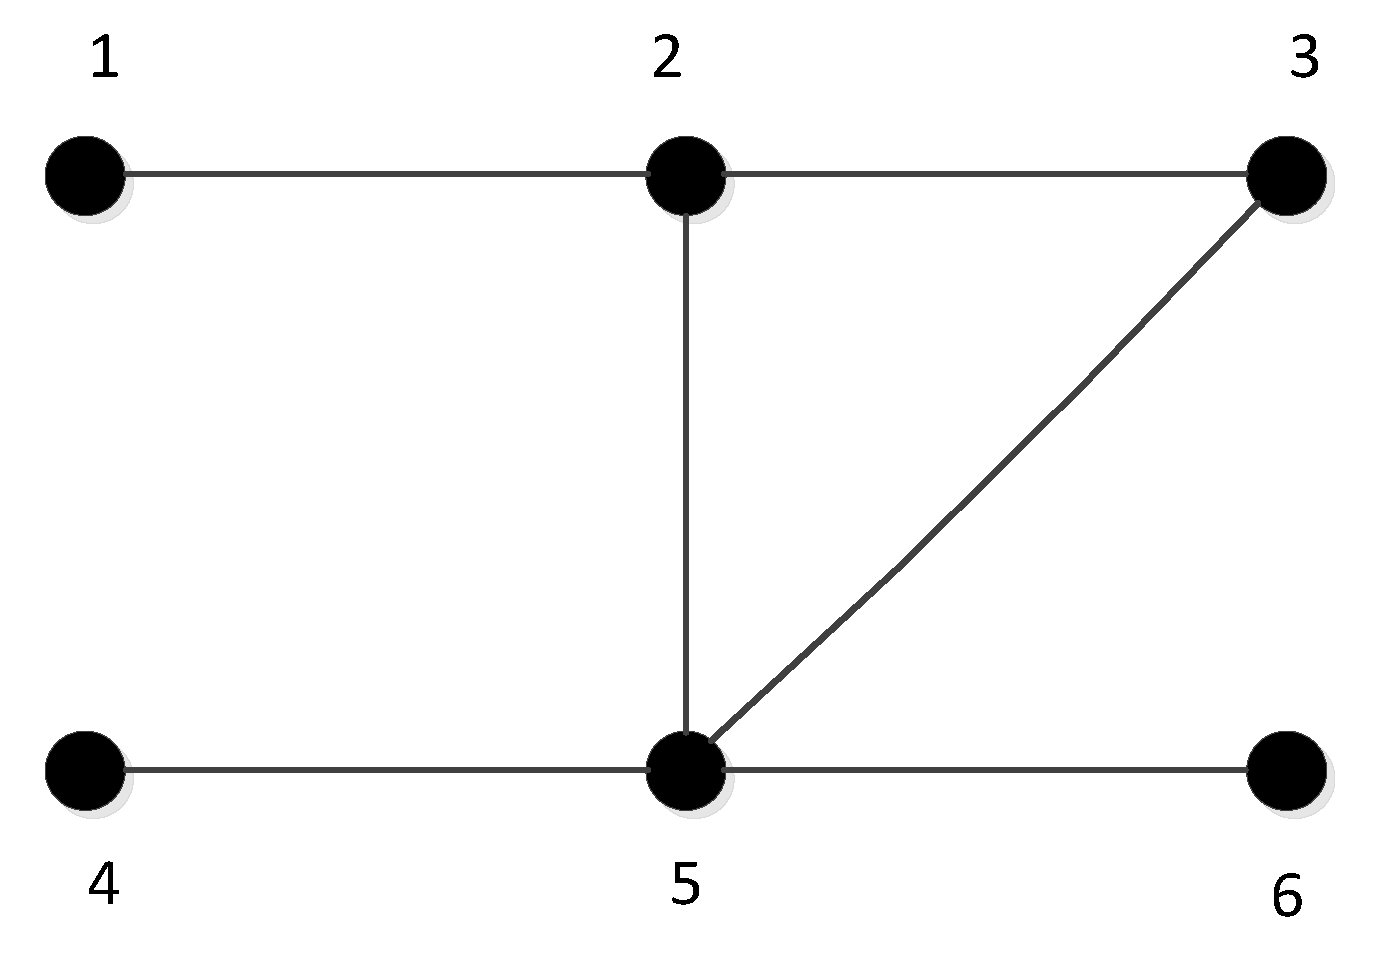
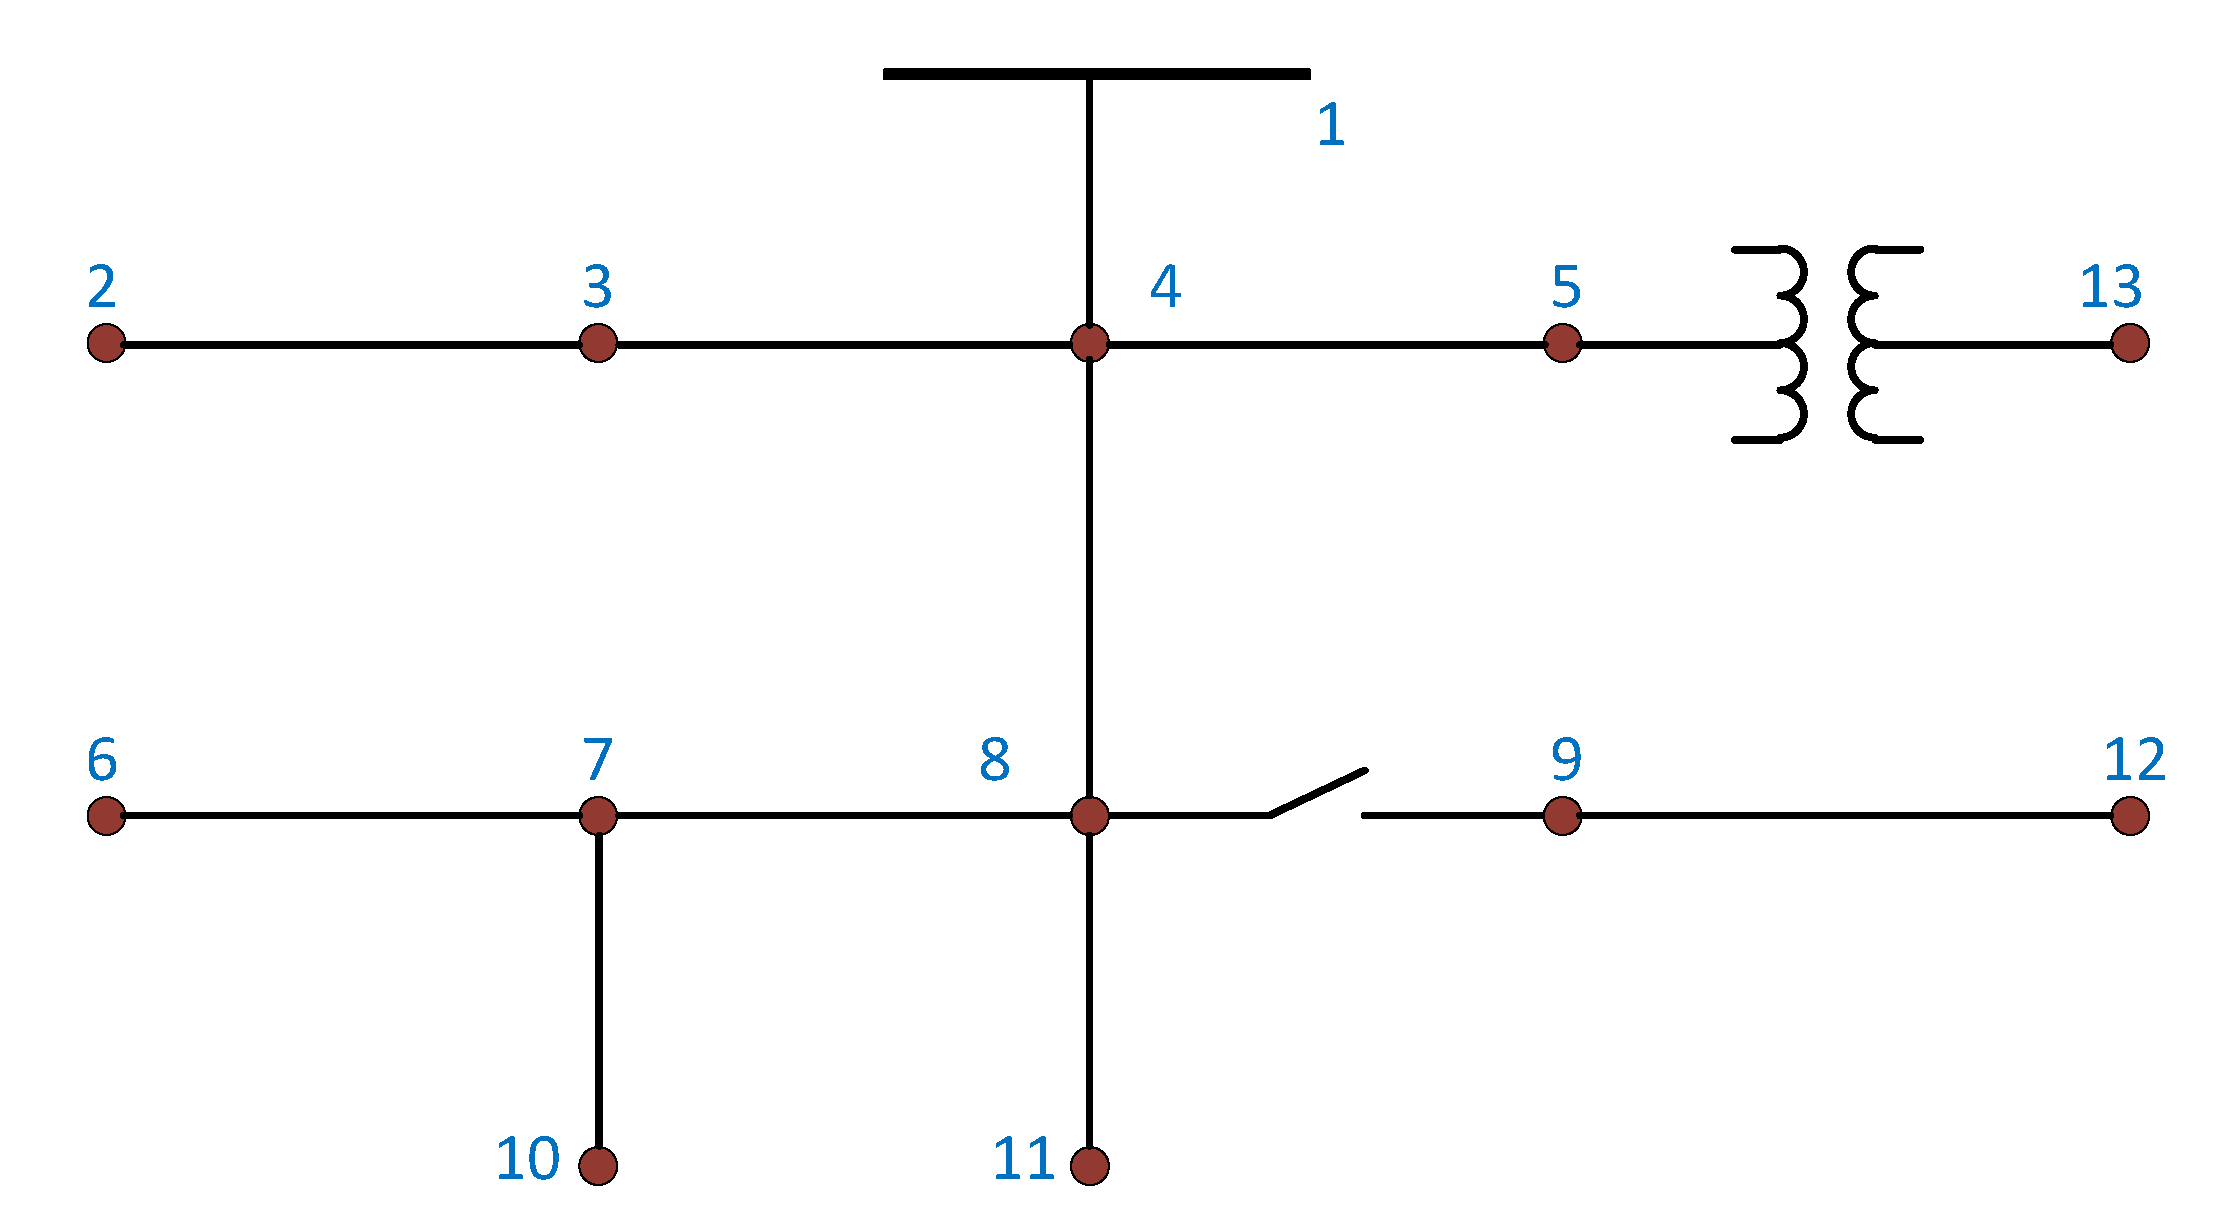
22]. Observability of N − 1 buses from SOZIB is adequate for full observability of a SOZIB. Therefore, the existence of a ZIB can decrease the number of PMUs that is needed for the observability of a system. For example, in
Figure 1, if none of the nodes are ZIBs, at least two PMUs are needed for full observability of the network. They can be placed, as an example, on node 1 and 5. However, if bus 2 is assumed to be a ZIB, then one PMU will be enough to make the system observable (i.e., one PMU at node 5) and SOZIB can be realized as follows:
In the case of modeling the ZIBs in the objective function, an integer linear programming model can be used, where a new variable
ui is defined for observability of node
i [
19] (i.e.,
ui = 1 if the node is observable, and
ui = 0 otherwise). In this regard, if N − 1 nodes of SOZIB are observable, then the entire nodes with the set are observable. Thus, an equation will be added to the model as follows:
where Z is the set of zero injection buses. Now, in
Figure 1, and supposing that node 2 is a ZIB, the additional constraint in the ILP formulation is as follows:
This equation means that out of the four nodes, 1, 2, 3, and 5, at least three nodes should be observable. Considering the effect of zero injection buses, the mathematical model in
Section 3.1 can be modified as below:
There are multiple solutions for OPP in a given power system. For example, without considering ZIBs in
Figure 1, we can place PMUs at node 2 and 5 or 1 and 5. For selecting a better result, a bus observability index (BOI) is defined [
19].
BOIi is the number of PMUs that can observe the
i-th bus. The sum of BOIs for all nodes of the network is called the system observability redundancy index (SORI). SORI can be defined as follows:
In the six-node test system described earlier, if the PMUs are located at nodes 2 and 5 (case a), the BOIs for nodes 1 to 6 are 1,2,2,1,2,1. But if the PMUs are located at nodes 1 and 5 (case b), the BOIs for nodes 1 to 6 are 1,2,1,1,1,1. Hence, SORIs for the two cases are equal to SORIa = 9 and SORIb = 7, respectively. From a technical perspective, the first case (i.e., case a with higher SORI value) is the best choice for PMU placement. In fact, maximizing this index relates to maximizing the remaining observable buses in case of missing a PMU. For example, missing the PMU installed at node 5 results in the unobservability of nodes 4 and 6 in case a. However, in case b, nodes 3, 4, 5, and 6 will be unobservable, as the mentioned PMU is lost. Thus, the redundancy of observability can be measured with SORI.
3.3. Communication System
In this study, wireless sensor networks are used as the communication system. There are some sensor nodes in this network. Each sensor has characteristics similar to the measurement of the required data and processing and sensing them to adjacent nodes [
38]. A given sensor node consists of five elements: sensor unit, processing unit, receiving and sending unit, energy management unit or power supply unit, and eventually accessory equipment. Moreover, each sensor could be used in the role of a router with sending the collected information by the sensor itself and the received information from the adjacent nodes to the sink node (i.e., control center).
Most conventional wireless sensors are battery-driven. Given the fact that switching or replacing these sensors is very difficult or almost impossible in some cases, their energy consumption is a fundamental issue. EHSN can be used to solve the lifetime problem of battery-based sensors. EHSN can harvest energy from available environmental sources such as vibration, solar energy, and wind. The harvested energy can be then converted into usable electrical energy for wireless sensors. Owing to new EHSNs technology, some types of these sensors benefit from a hybrid structure, having both battery-powered and energy-harvested features at the same time.
In this paper, the connection of PMUs is performed using a combination of PPSNs and EHSNs. To achieve this goal with the highest reliability, the network is divided into two categories: the nodes measured by PMU, and the router nodes. In the first group, PPSNs are used as the sensor can be fed directly by the PMUs. The second group benefits from the EHSNs to assure longer lifetimes. By doing so, the reliability of the system can be improved [
39].
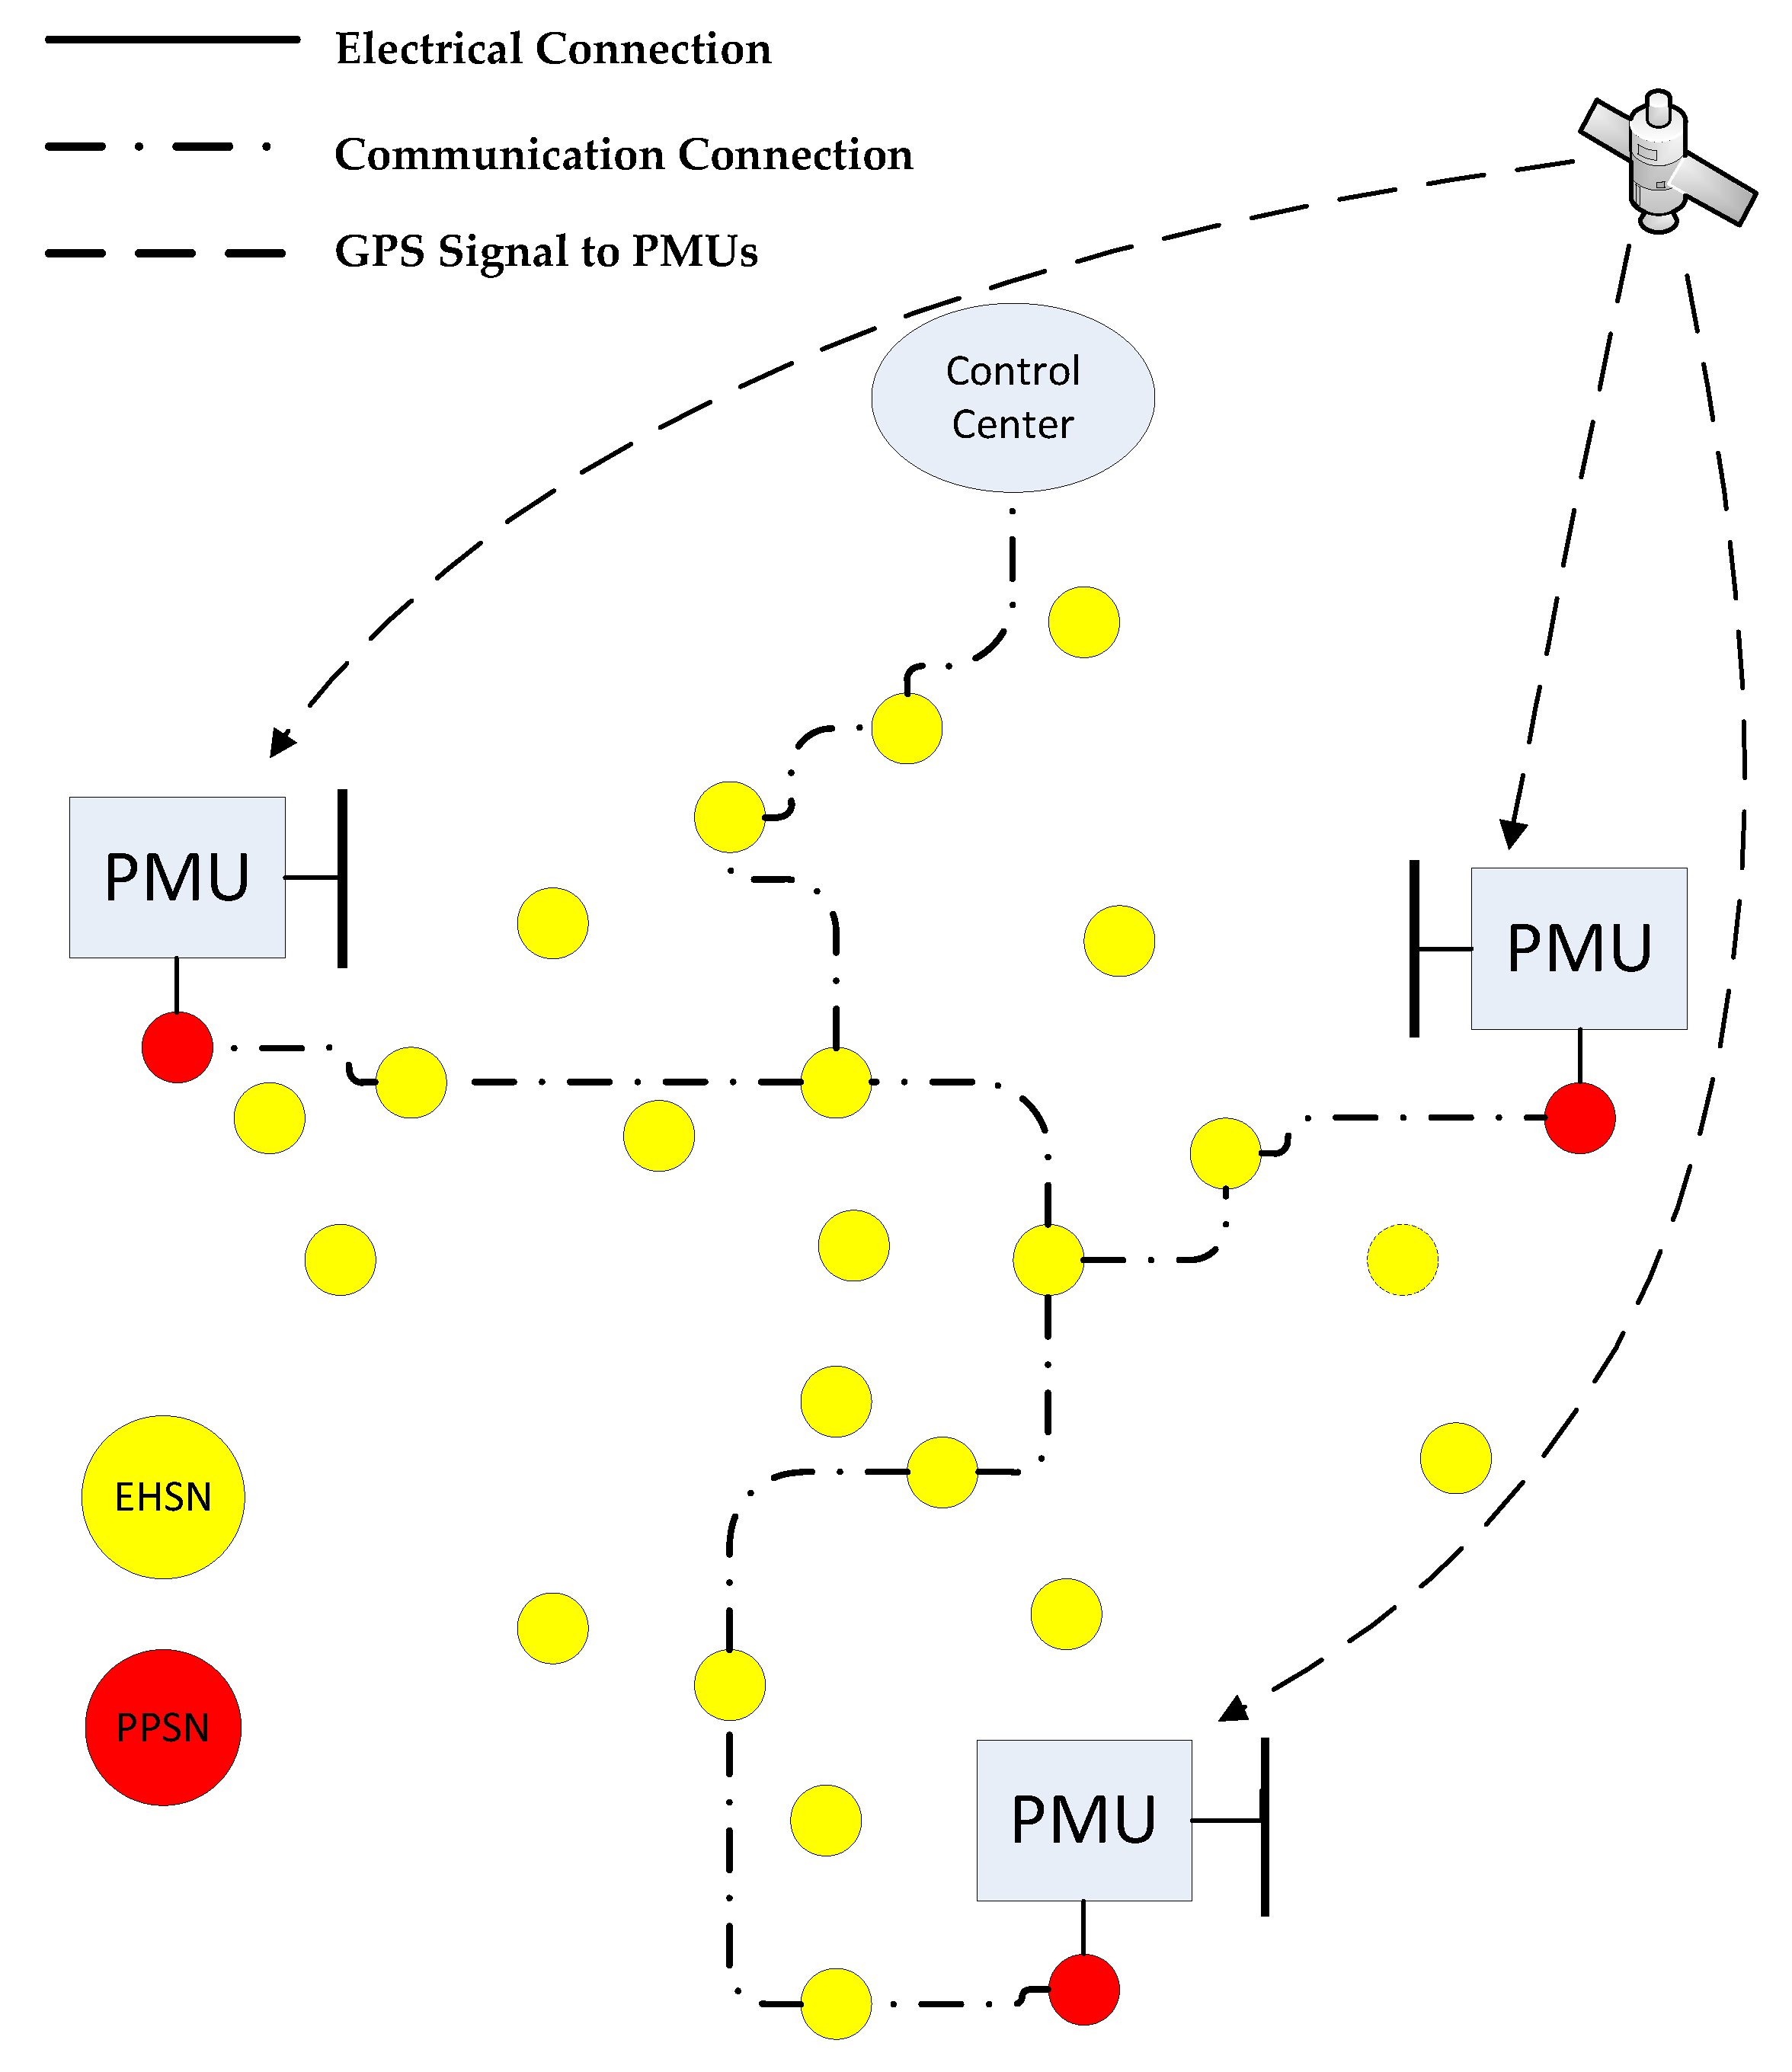
As illustrated in
Figure 2, the connection among PMUs should be made through EHSNs. The dashed-dotted lines between the yellow points represent the connection and the route between the EHSNs to send the PMU data to the control center. Thus, the minimum number of sensors to the control center must be found. Here, a number of assumptions are made. First, it is assumed that wireless sensors can transfer the PMUs data completely, that is, there is no packet loss in data transmission. Second, the bandwidth of wireless sensors is supposed to be sufficient for transferring PMUs’ measured data.
With the mentioned assumptions, the structure of the communication system can be well constructed. However, because the wireless sensors are used as the communication system, the observability analysis from the viewpoint of the communication system is necessary. This issue will be considered in the next section.
3.4. Communication System Observability
Transferring the measured data to the control center should be done after the OPP. In conventional systems based on optic fiber-cables, it is not necessary to analyze the observability, because the cables connect the entire nodes. However, in wireless communication systems, similar to the PMUs placement, the observability analysis has to be done to be sure that wireless sensors can communicate with each other and with the control center. A node in the communication system is observable if there is a connection between that node and the reference node. The reference node in this research is the control center. In other words, a wireless node is observable if it is not islanded [
39].
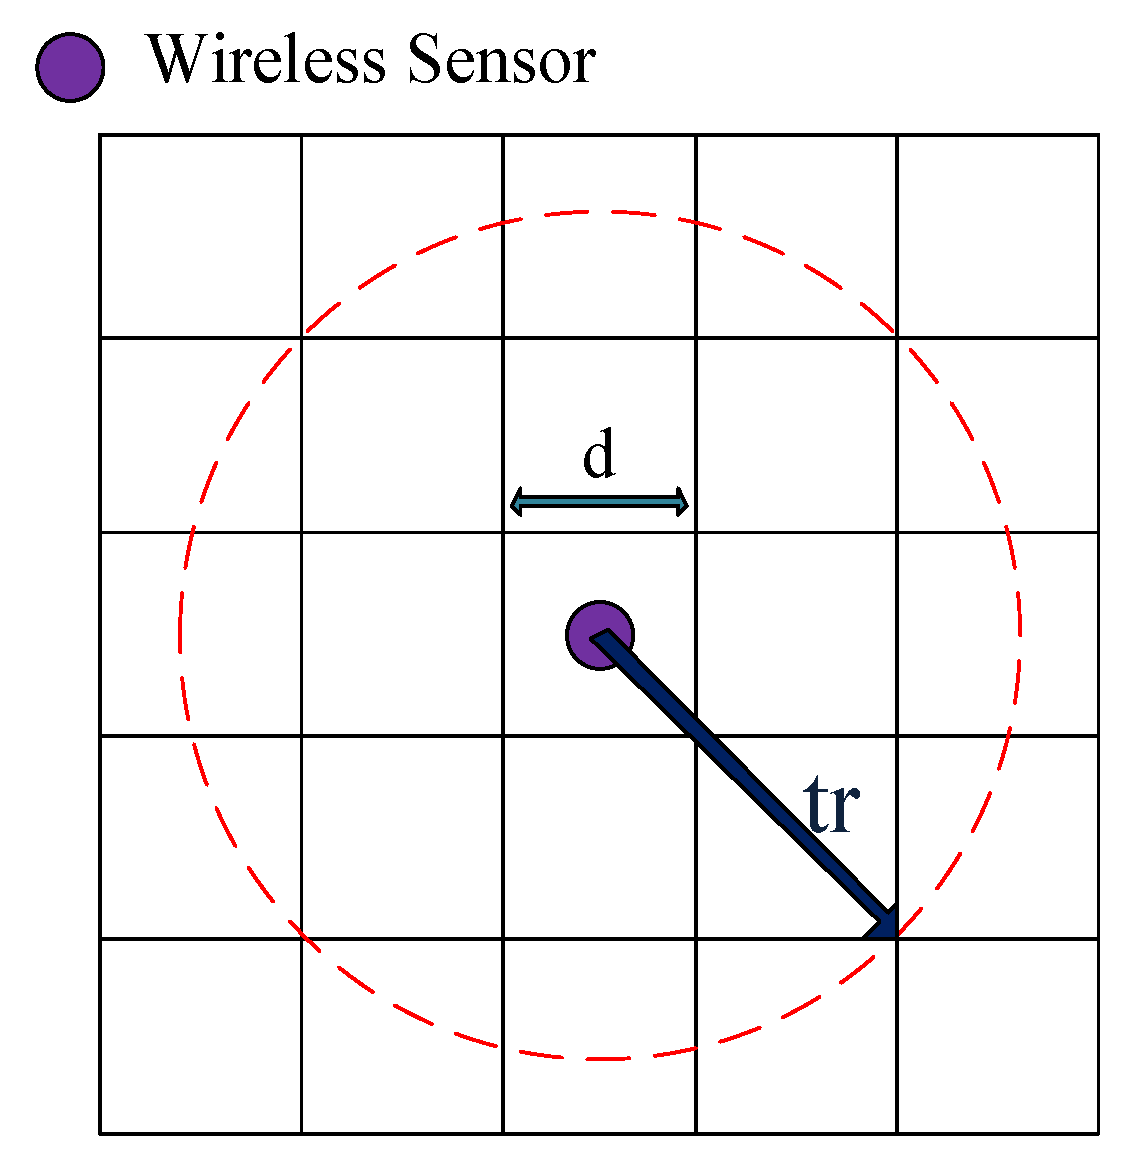
For analyzing the communication system observability, a mesh grid of the power network is initially created. The geographical area where the distribution network is located is divided into a set of equal sub-areas/meshes, as shown in
Figure 3. Wireless sensors can be placed in any mesh and the presence of a sensor in an area could cover the observability of the adjacent areas. According to
Figure 3, the relationship between the transmitting range (
tr) of the wireless sensors and the length of each mesh (d) is as follows:
So if the transmitting range of a wireless sensor is specific, the mesh size (i.e., length of each subarea (d)) is obtained.
If the length and width of a geographical area are equal to
W1 and
W2, respectively, the number of transverses (
n1) and longitudinal (
n2) sub-areas in the mesh grid could be obtained as follows:
So, the total number of meshes is equal to the following:
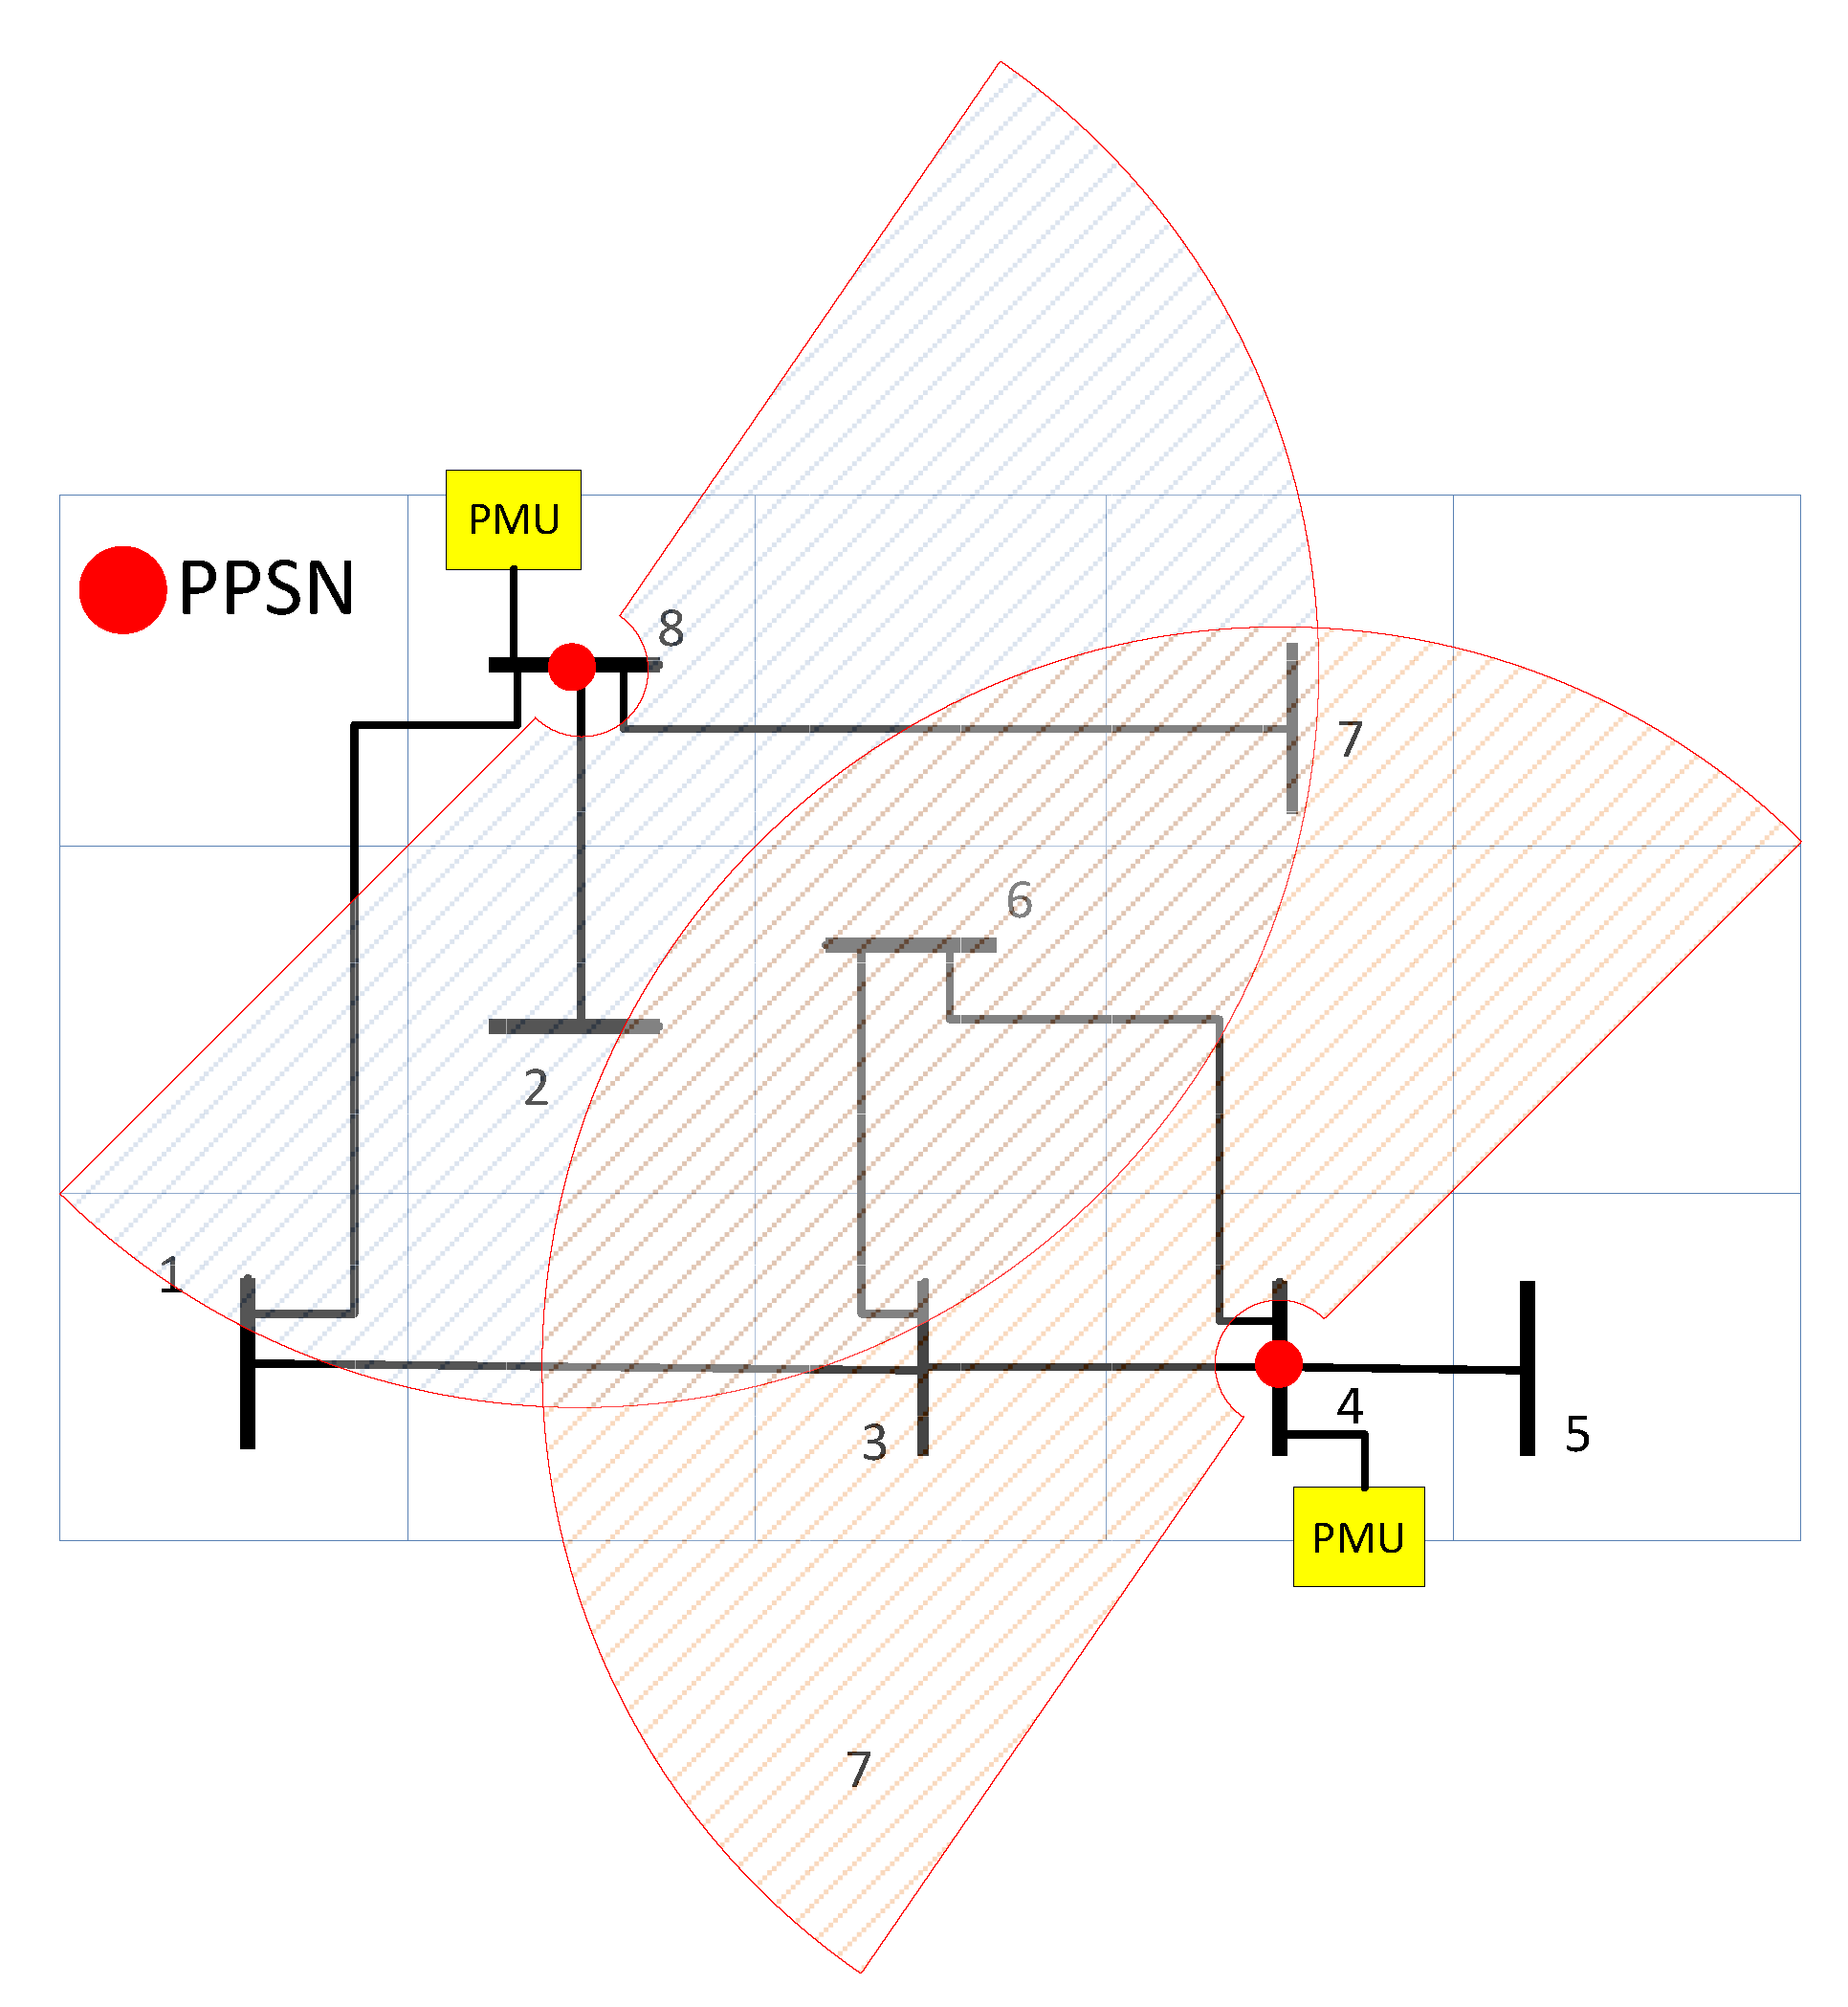
The difference between observability from the power system and communication network perspectives is shown in
Figure 4. As can be seen, the examined eight-bus power system could be observable through the placement of the two PMUs in buses 4 and 8. It is assumed that bus 8 is the control center. However, if the distance between buses 4 and 8 is greater than the transmission range (
tr) of PPSNs, the communication system is unable to transmit data to the center. Thus, it will not be observable.
The
n1 and
n2 can be calculated having the length and width of the geographical area, and the mesh grid is created. As can be seen, a router sensor is needed to complete the observation of the communication network. As can be seen in
Figure 4, bus 6 is located in the common transmission range of the two sensors, and thus can be selected as a router node. In the larger networks, however, an optimization problem has to be solved for optimal placement of wireless sensors with respect to observability constraint.
A binary genetic algorithm is used in this study for optimal placement of wireless sensors following the optimal placement of PMUs based on the power system observability constraint. The chromosome is coded in such a way to reflect the existence and position of the primary sensor units that are derived from the observability problem of the power system. It is supposed that in each node in which a PMU exists, a PPSN can also be placed. Thus, the number of elements in the chromosome (CR) is equal to the total number of meshes (
NT), while each could be assigned a binary value (1 having PPSN, and 0 otherwise):
For example, vector CR for
Figure 4 can be created as follows:
Having formed the initial population, the distance matrix has to be determined as follows:
where
Lij is the distance of area
i from area
j in the mesh grid. Two areas
i and
j are in connection with the two following conditions:
Both of them should have wireless sensors (tri ≠ 0 and trj ≠ 0);
The wireless node in one region is located in the coverage range of the wireless node of the other area (tri ≥ Li,j or trj ≥ Li,j).
In order to determine the connection between the areas, a matrix called the incident matrix (IM) is defined as follows:
The matrix size is
NT ×
NT. If the number of network buses is N, the communication observability matrix can be used for observability analysis of communication system [
40]. This matrix can be defined as follows:
Matrix CO shows the connectivity of the nodes to the control center. If the control center is in area S and the set of all communication nodes is
Z, for complete observability of communication system, relation (24) should be met.
To achieve the lowest cost, the least number of router sensors must be detected. This is done through an optimization process detailed in the next section.
3.5. Proposed Objective Function
In the previous sections, the model of the power system and communication network used in this paper was presented. The cost of communication infrastructure is as essential as PMU placement costs in the WAMS. So, in the proposed method, the communication infrastructure and PMU placement are simultaneously optimized. Cost function includes the minimization of PMU-communication links’ placement costs, as defined in (25), considering the communication and observability constraints.
where
CostPMU is the total cost of OPP in the network and
CostWSN is the cost of sensors placement that is necessary for complete data transferring. As there exist multiple solutions for OPP, the SORI index is defined for observability ranking and solution selection. This index is presented as a constraint in the optimization problem. Depending on how important the SORI is, the constraint could be tightened. Thus, the objective function can be written as below:
where
Ci: cost of PMU in bus I;
Xi: status of installing a PMU in bus I;
N: number of buses;
CP: cost of PPSN;
NP: number of PPSNs;
CE: cost of EHSN;
NE: number of EHSNs;
m: total number of wireless sensors;
Rmin: a coefficient that shows the impact of SORI.
Equation (27) represents the observability of the power system that is described in
Section 3.1. The effect of zero-injection buses is considered as a constraint in Equation (28) that is defined in
Section 3.2. As described before, for proper implementation of the wireless sensor, the observability analysis of these sensors should be done. Thus, Equation (29) describes the communication infrastructure observability that is defined in
Section 3.4. Equation (30) is the SORI constraint. The effectiveness of this constraint relates to the
Rmin coefficient. For example, if the SORI importance is very high, the coefficient is increased according to the operator’s requirement.
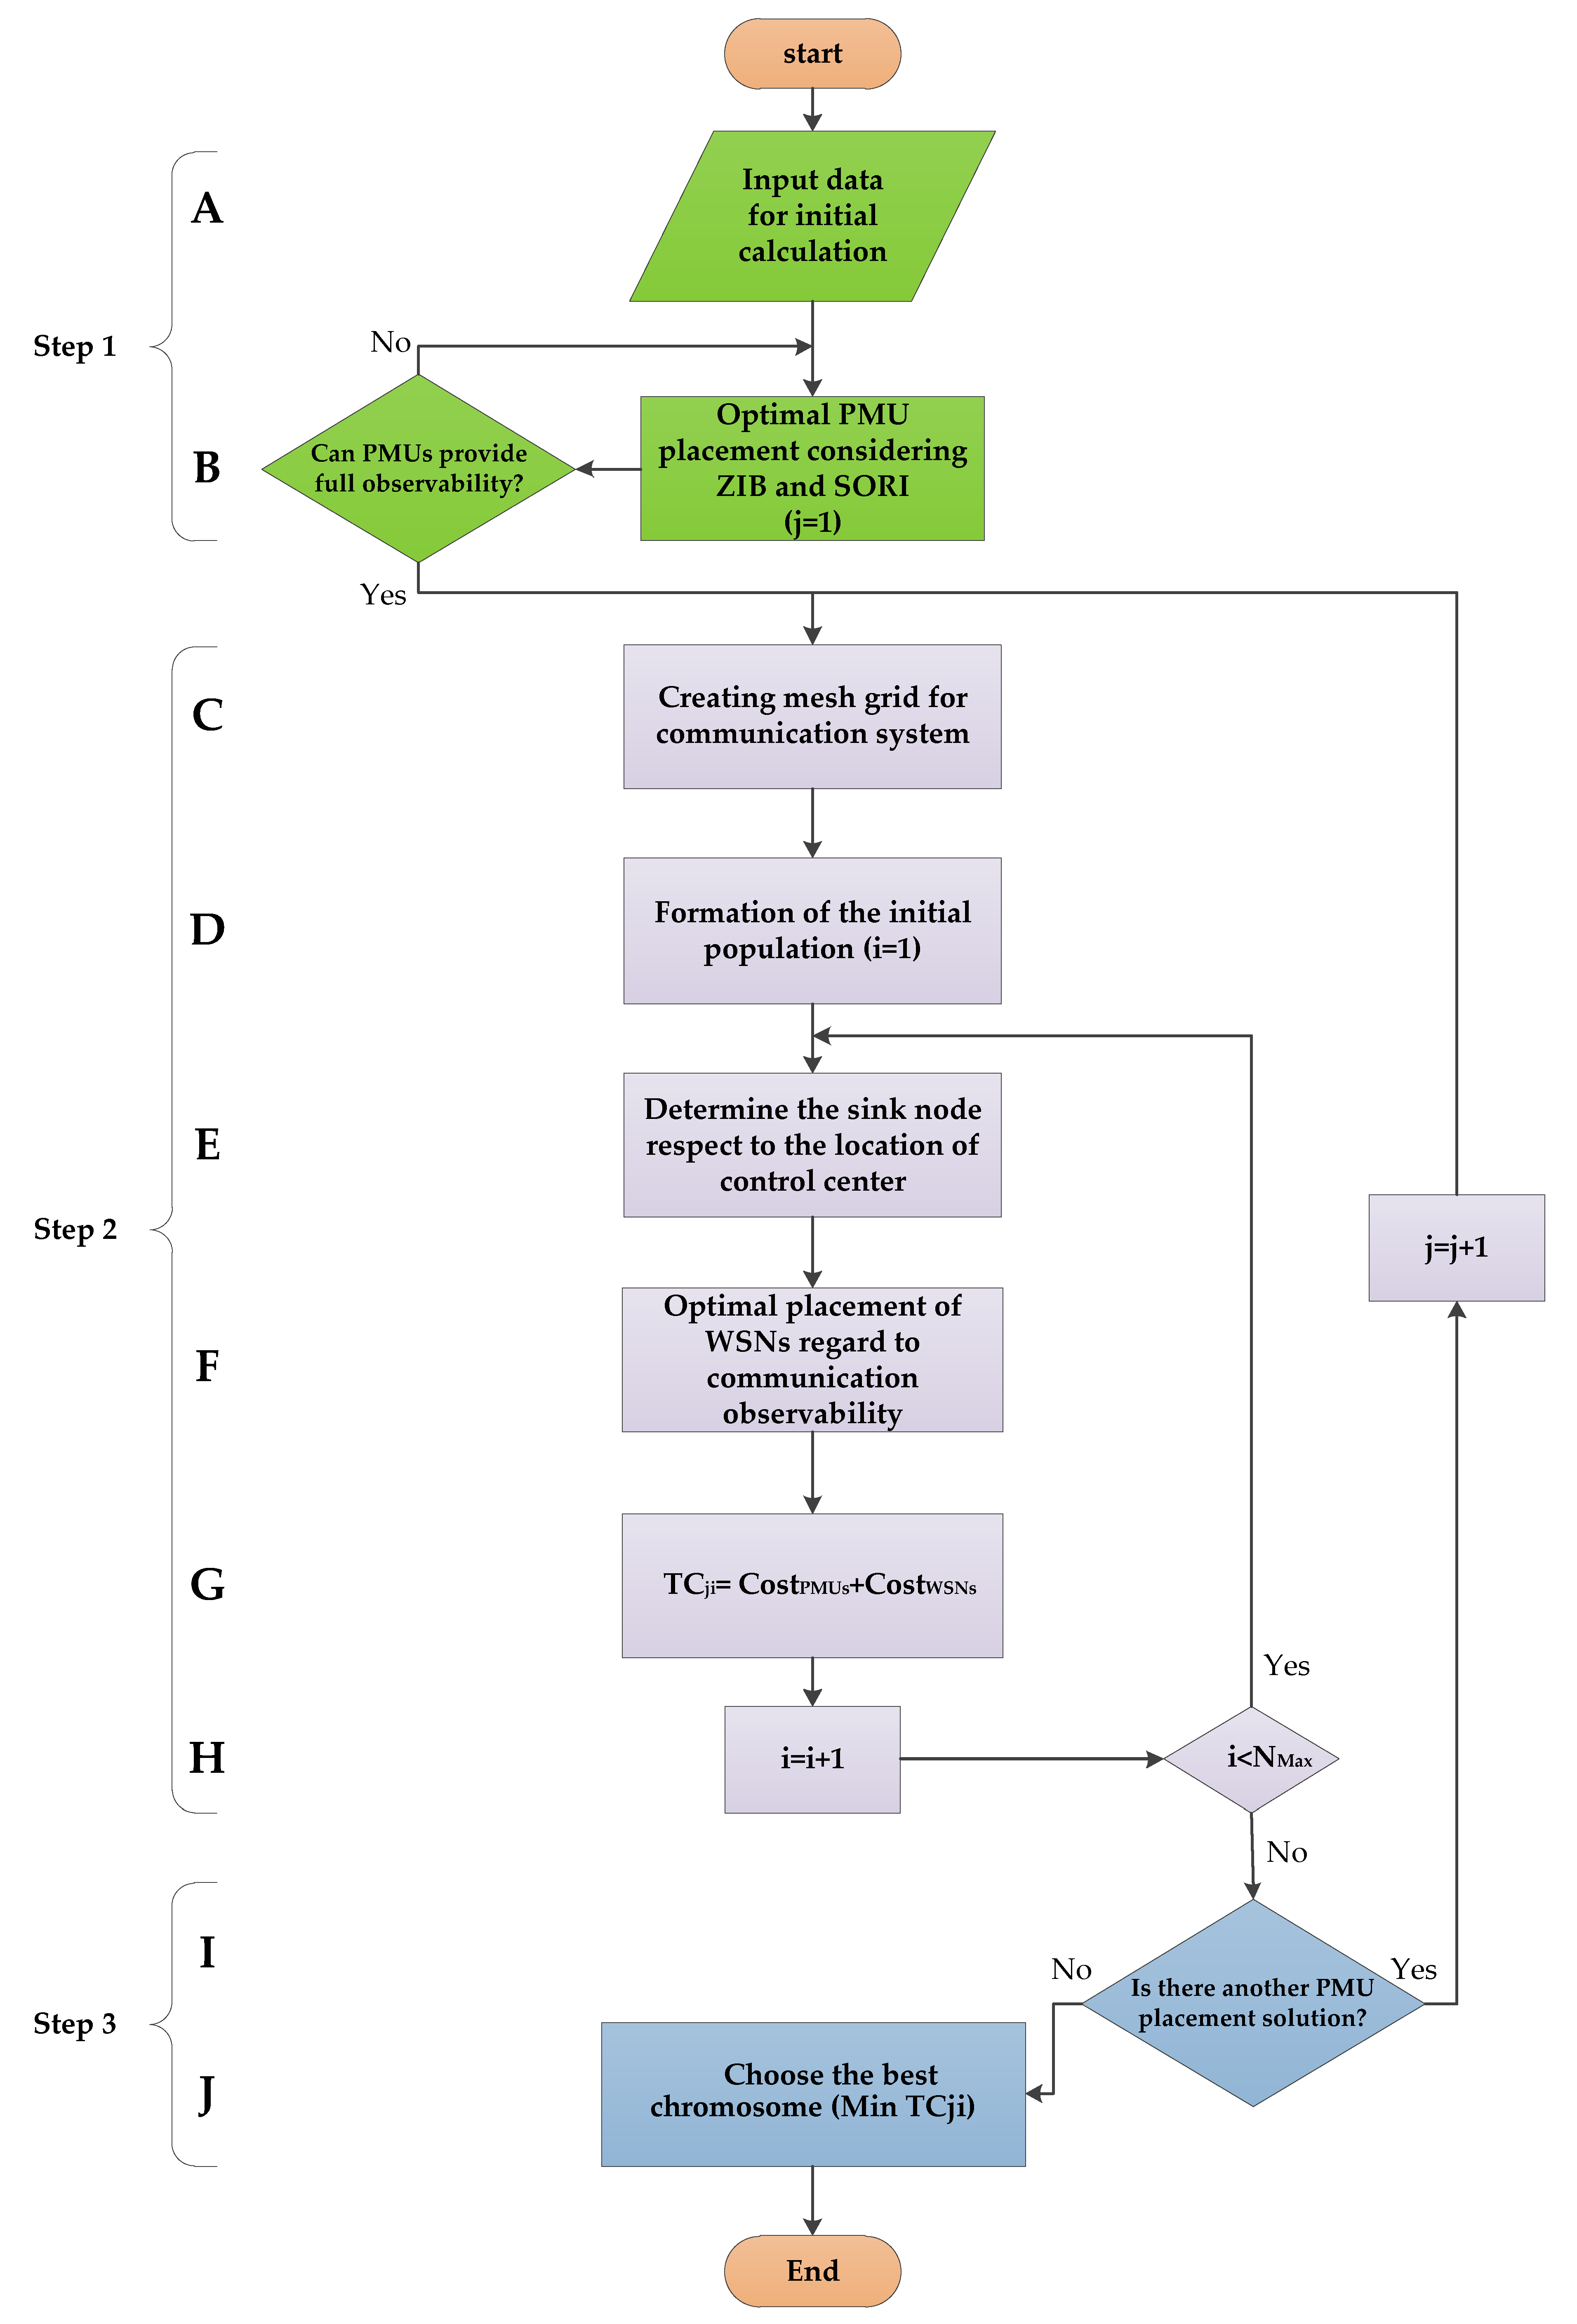
A flowchart of the proposed method is illustrated in
Figure 5, where three main steps are defined to reach a solution. At the first step, the optimal placement of PMUs is calculated with regard to the full observability, ZIBs, and SORI constraints.
In the second step, the optimal placement of wireless sensors (PPSNs and EHSNs) is determined with respect to the communication observability constraint. In the last step, all possible co-optimal placement solutions are evaluated to achieve the best one in terms of the minimum total cost. A detailed review of each step is given below.
Step 1: The algorithm is initialized in block A with a set of input data including the number of buses, distance, and connections. Optimal PMU placement is implemented in block B considering the observability constraint and ZIBs and SORI index using Equations (10)–(14). It is important to note that more than one optimal solution might be found at this stage. However, all the candidate solutions will be evaluated in block I to reach the best optimal one.
Step 2: In block C, the mesh grid for proper placement of the wireless sensors is formed according to Equations (15)–(17). On the basis of the OPP result, the initial population is formed according to Equations (18) and (19) in block D. To transfer the data to the control center, a wireless sensor as the sink node should be selected, which is done in block E. It is assumed that the location of the control center is predetermined and remains unchanged during the program iterations. In block F, minimization of the number of wireless sensors (Equation (26)) is done with respect to communication observability constraints (Equation (29)). The cost of each possible solution with respect to constraints is calculated in block G. It should be noted that block H represents the stop criterion (which is set to a maximum number of iterations) for the genetic algorithm.
Step 3: For achieving the best solution, all possible solutions stored in the repository should be evaluated. As noted before, PMU placement can usually be done in multiple ways, and each plan of action has a related communication cost. In the last step, after optimization of wireless sensor placement in all possible cases, the best solution in terms of the minimum total cost is reported. It should be noted that block I denotes the stop condition for exploring different OPP solutions.


