Healthy Climate and Energy Savings: Using Thermal Ceramic Panels and Solar Thermal Panels in Mediterranean Housing Blocks


Abstract
:1. Introduction
2. Method
3. Energy Savings Compared to Other Air Conditioning Systems
3.1. Water as a Means of Energy Transport
3.2. The Decrease in Thermal Load Peaks
3.3. Thermal Performance of the Installation
4. Solar Energy Use in the Installation. Absorption, Chemical Energy, and Adsorption Systems
4.1. Solar Energy Contributions to the System
4.2. Solar Energy: Absorption and Adsorption Systems
4.2.1. Refrigeration by Absorption
- Lithium bromide: water (refrigerant) and lithium bromide (absorbent).
- Ammonia: ammonia (refrigerant) and water (absorbent).
4.2.2. Refrigeration by Absorption. Chemical Energy
4.2.3. Refrigeration by Adsorption
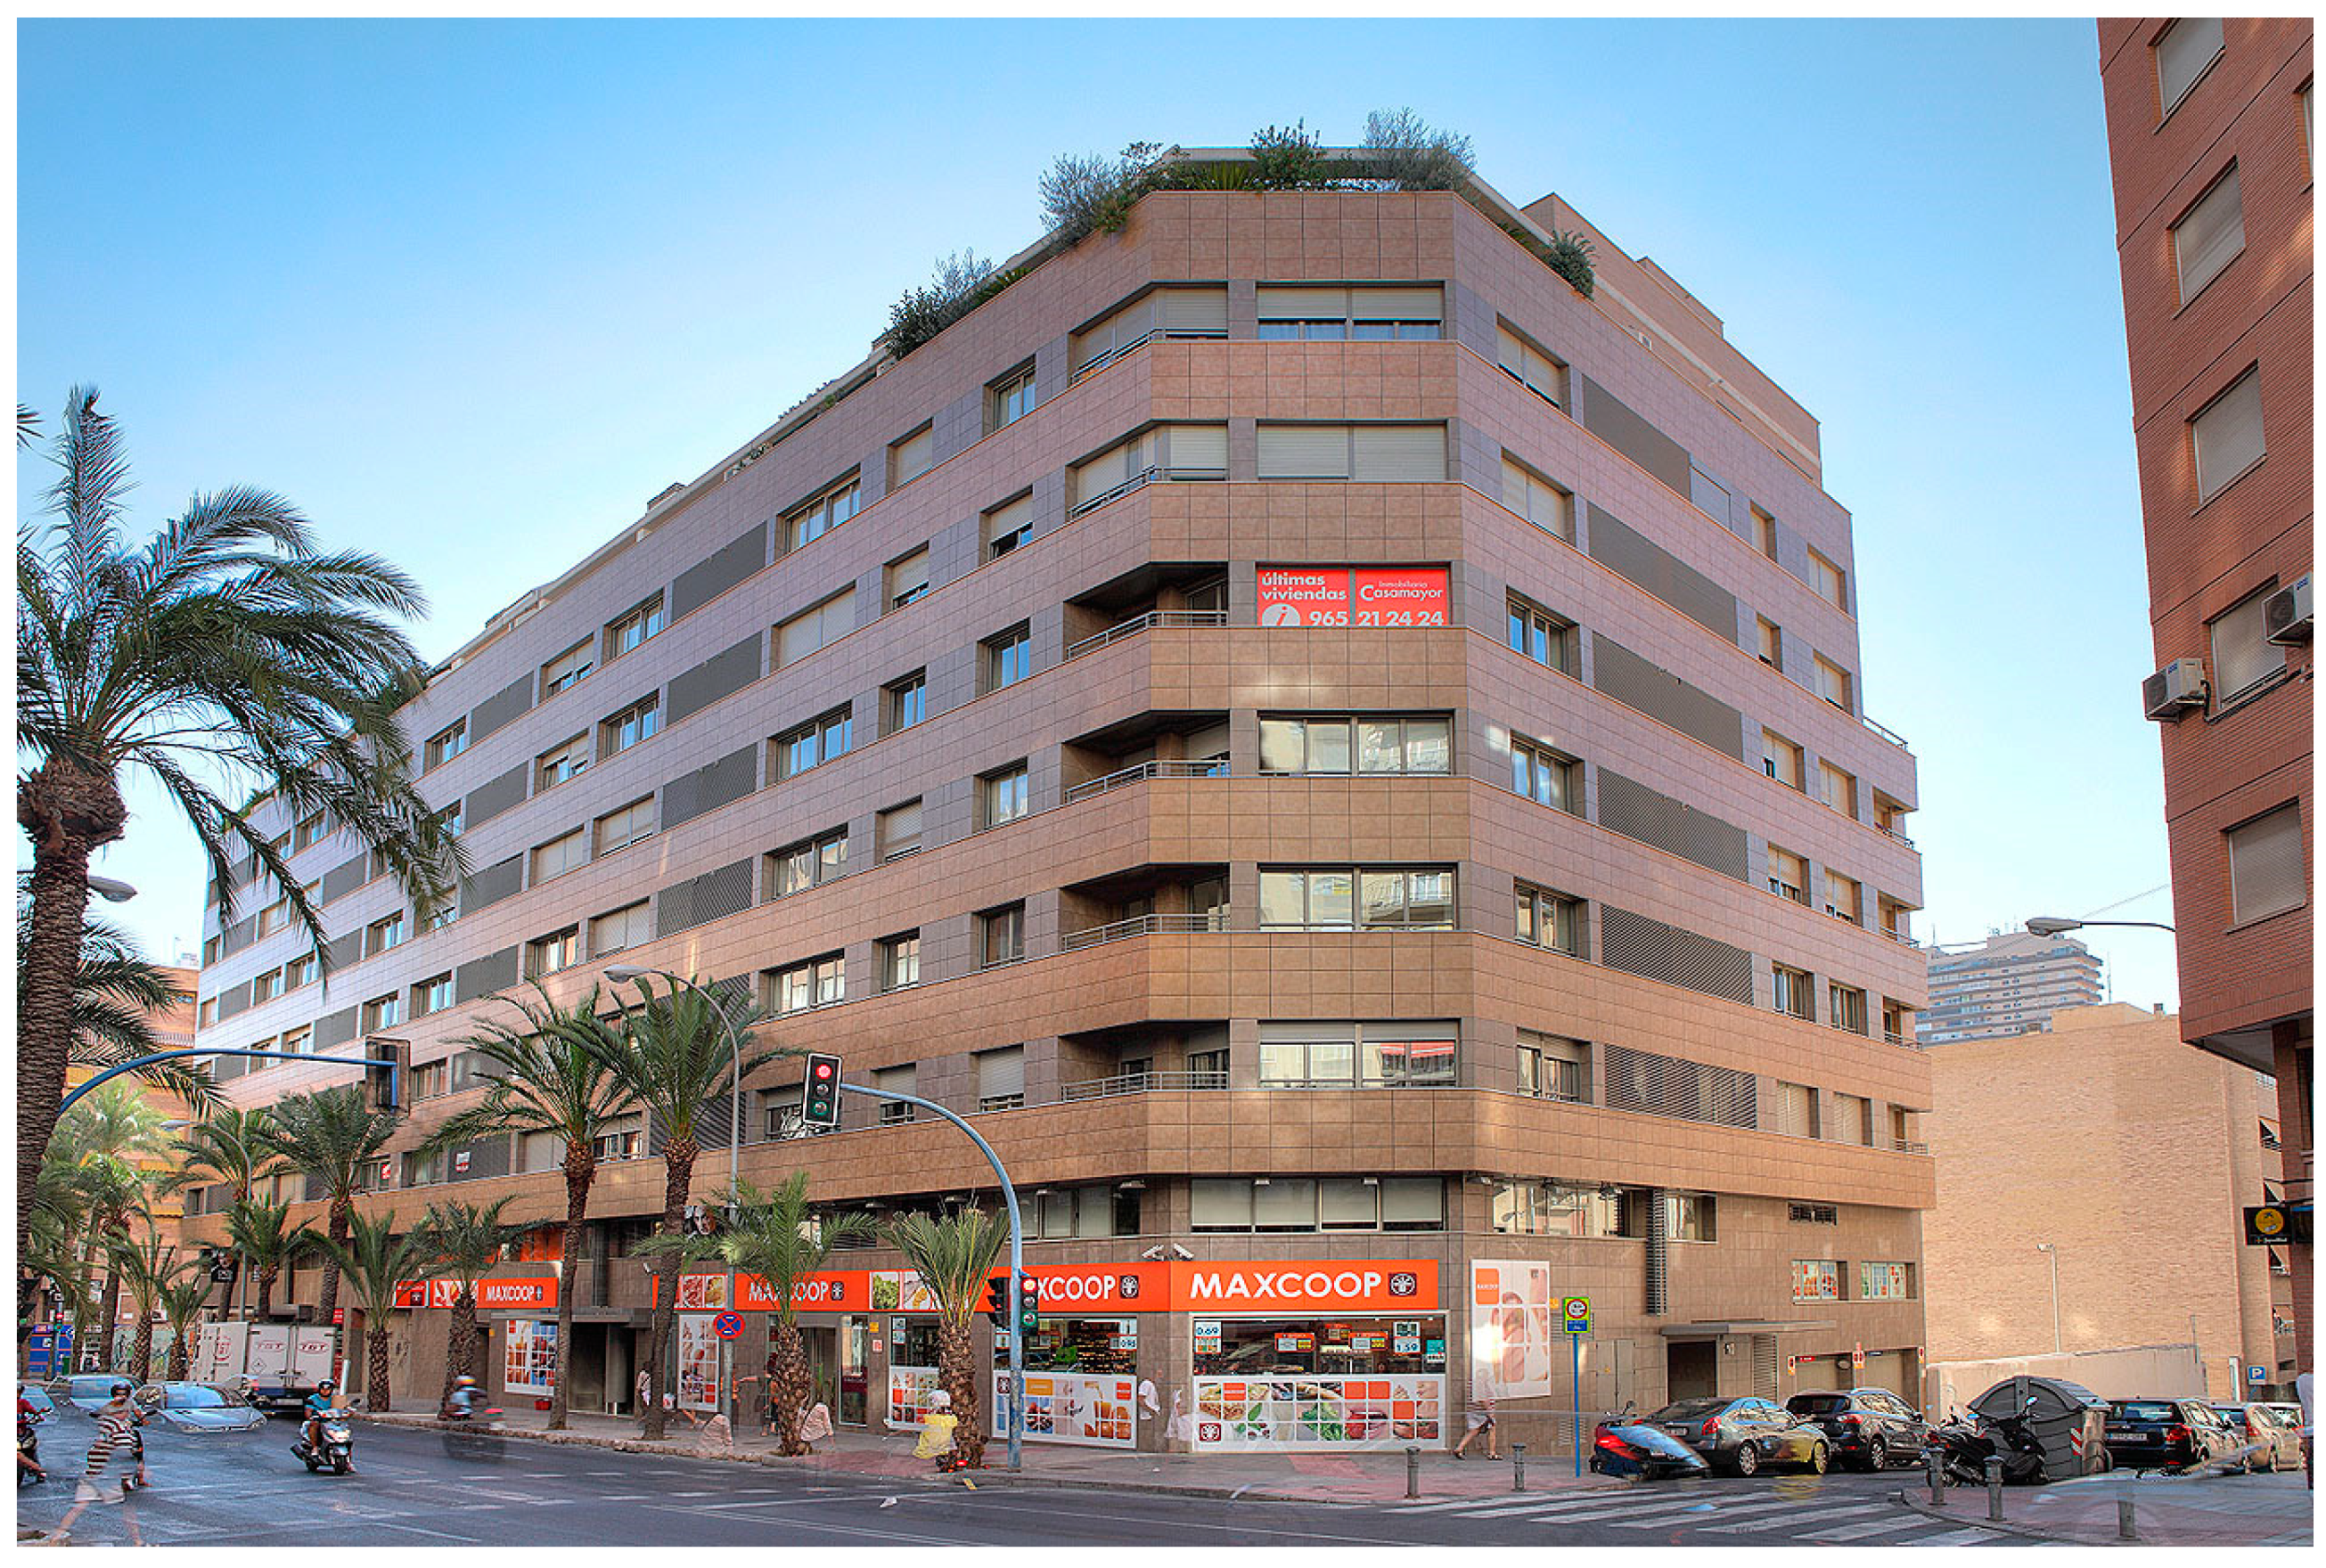
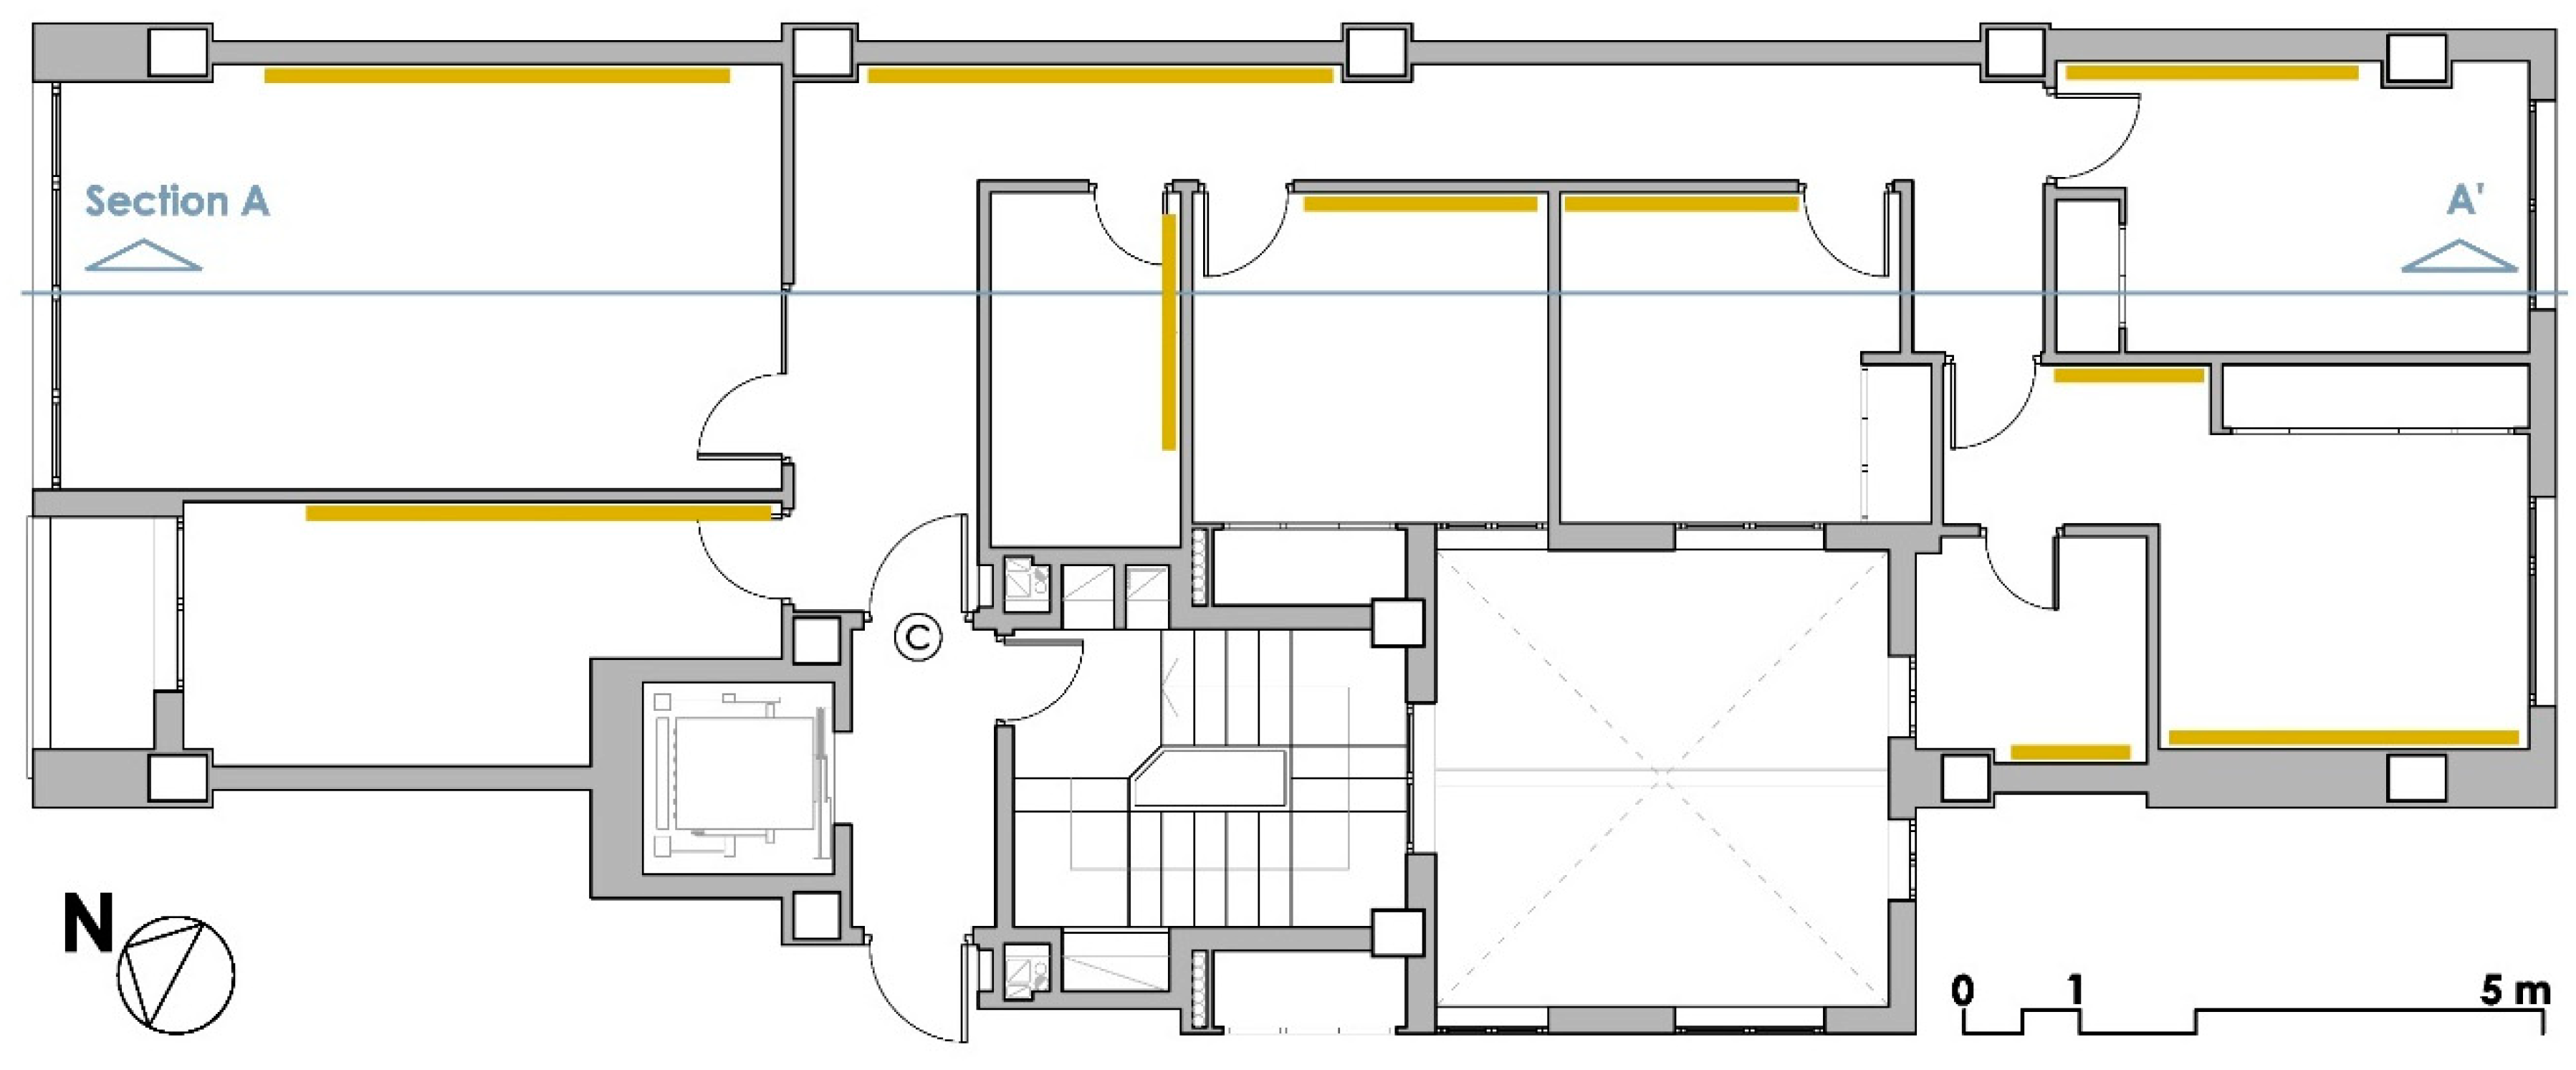
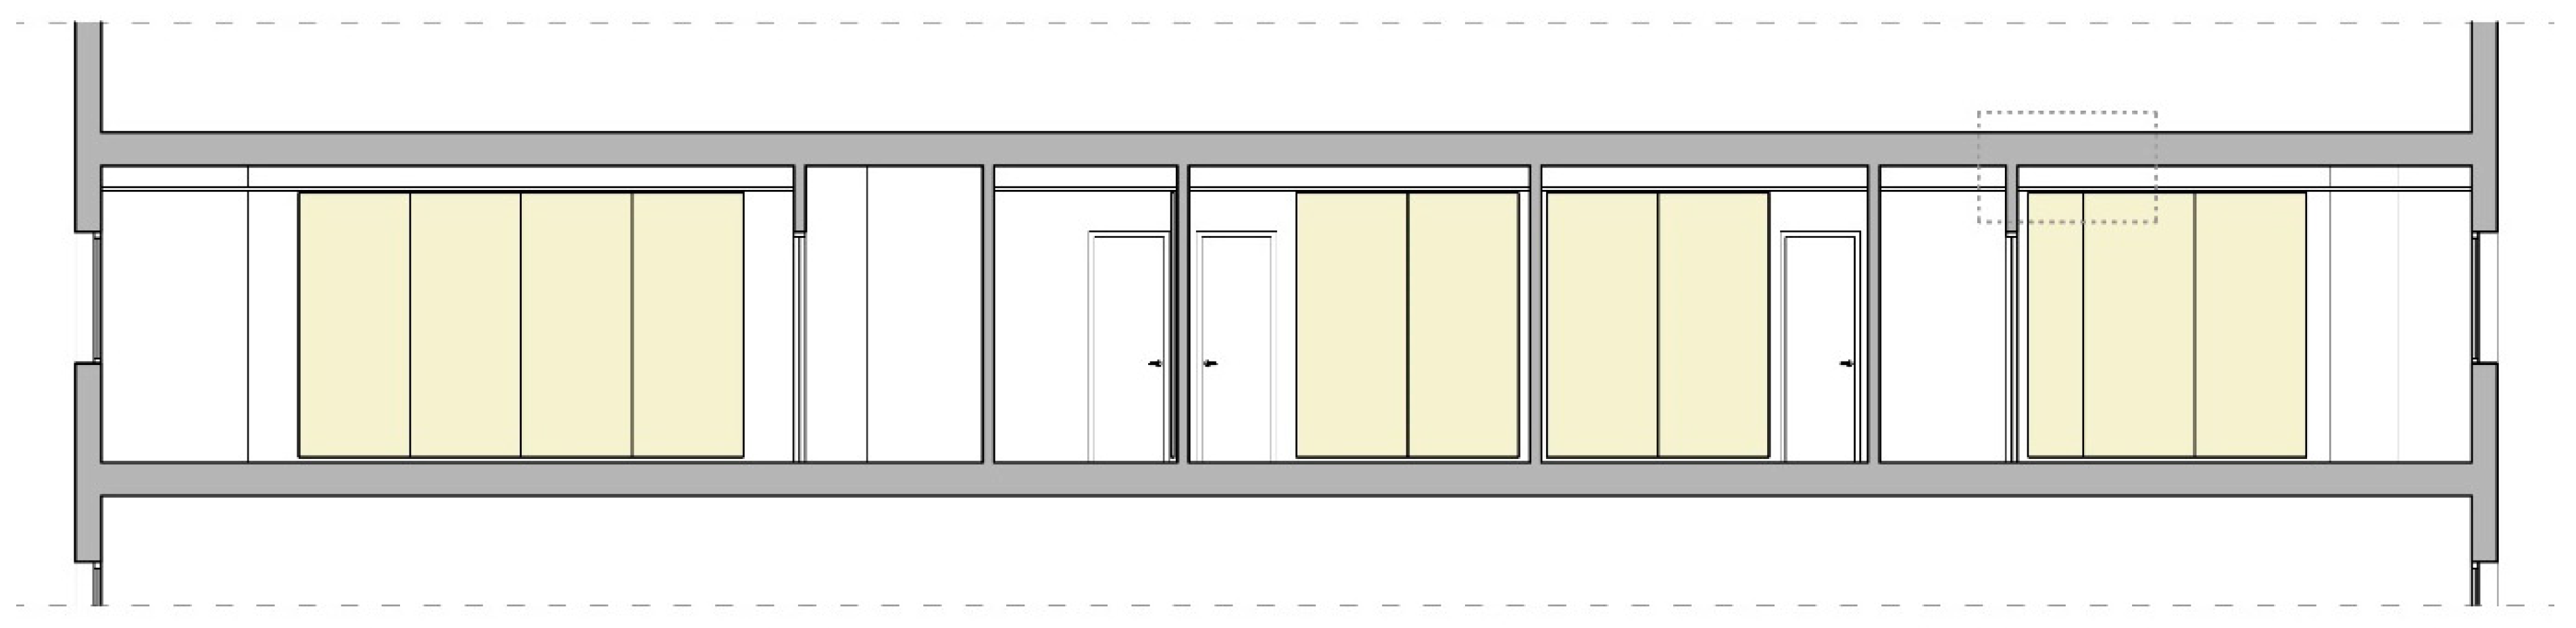
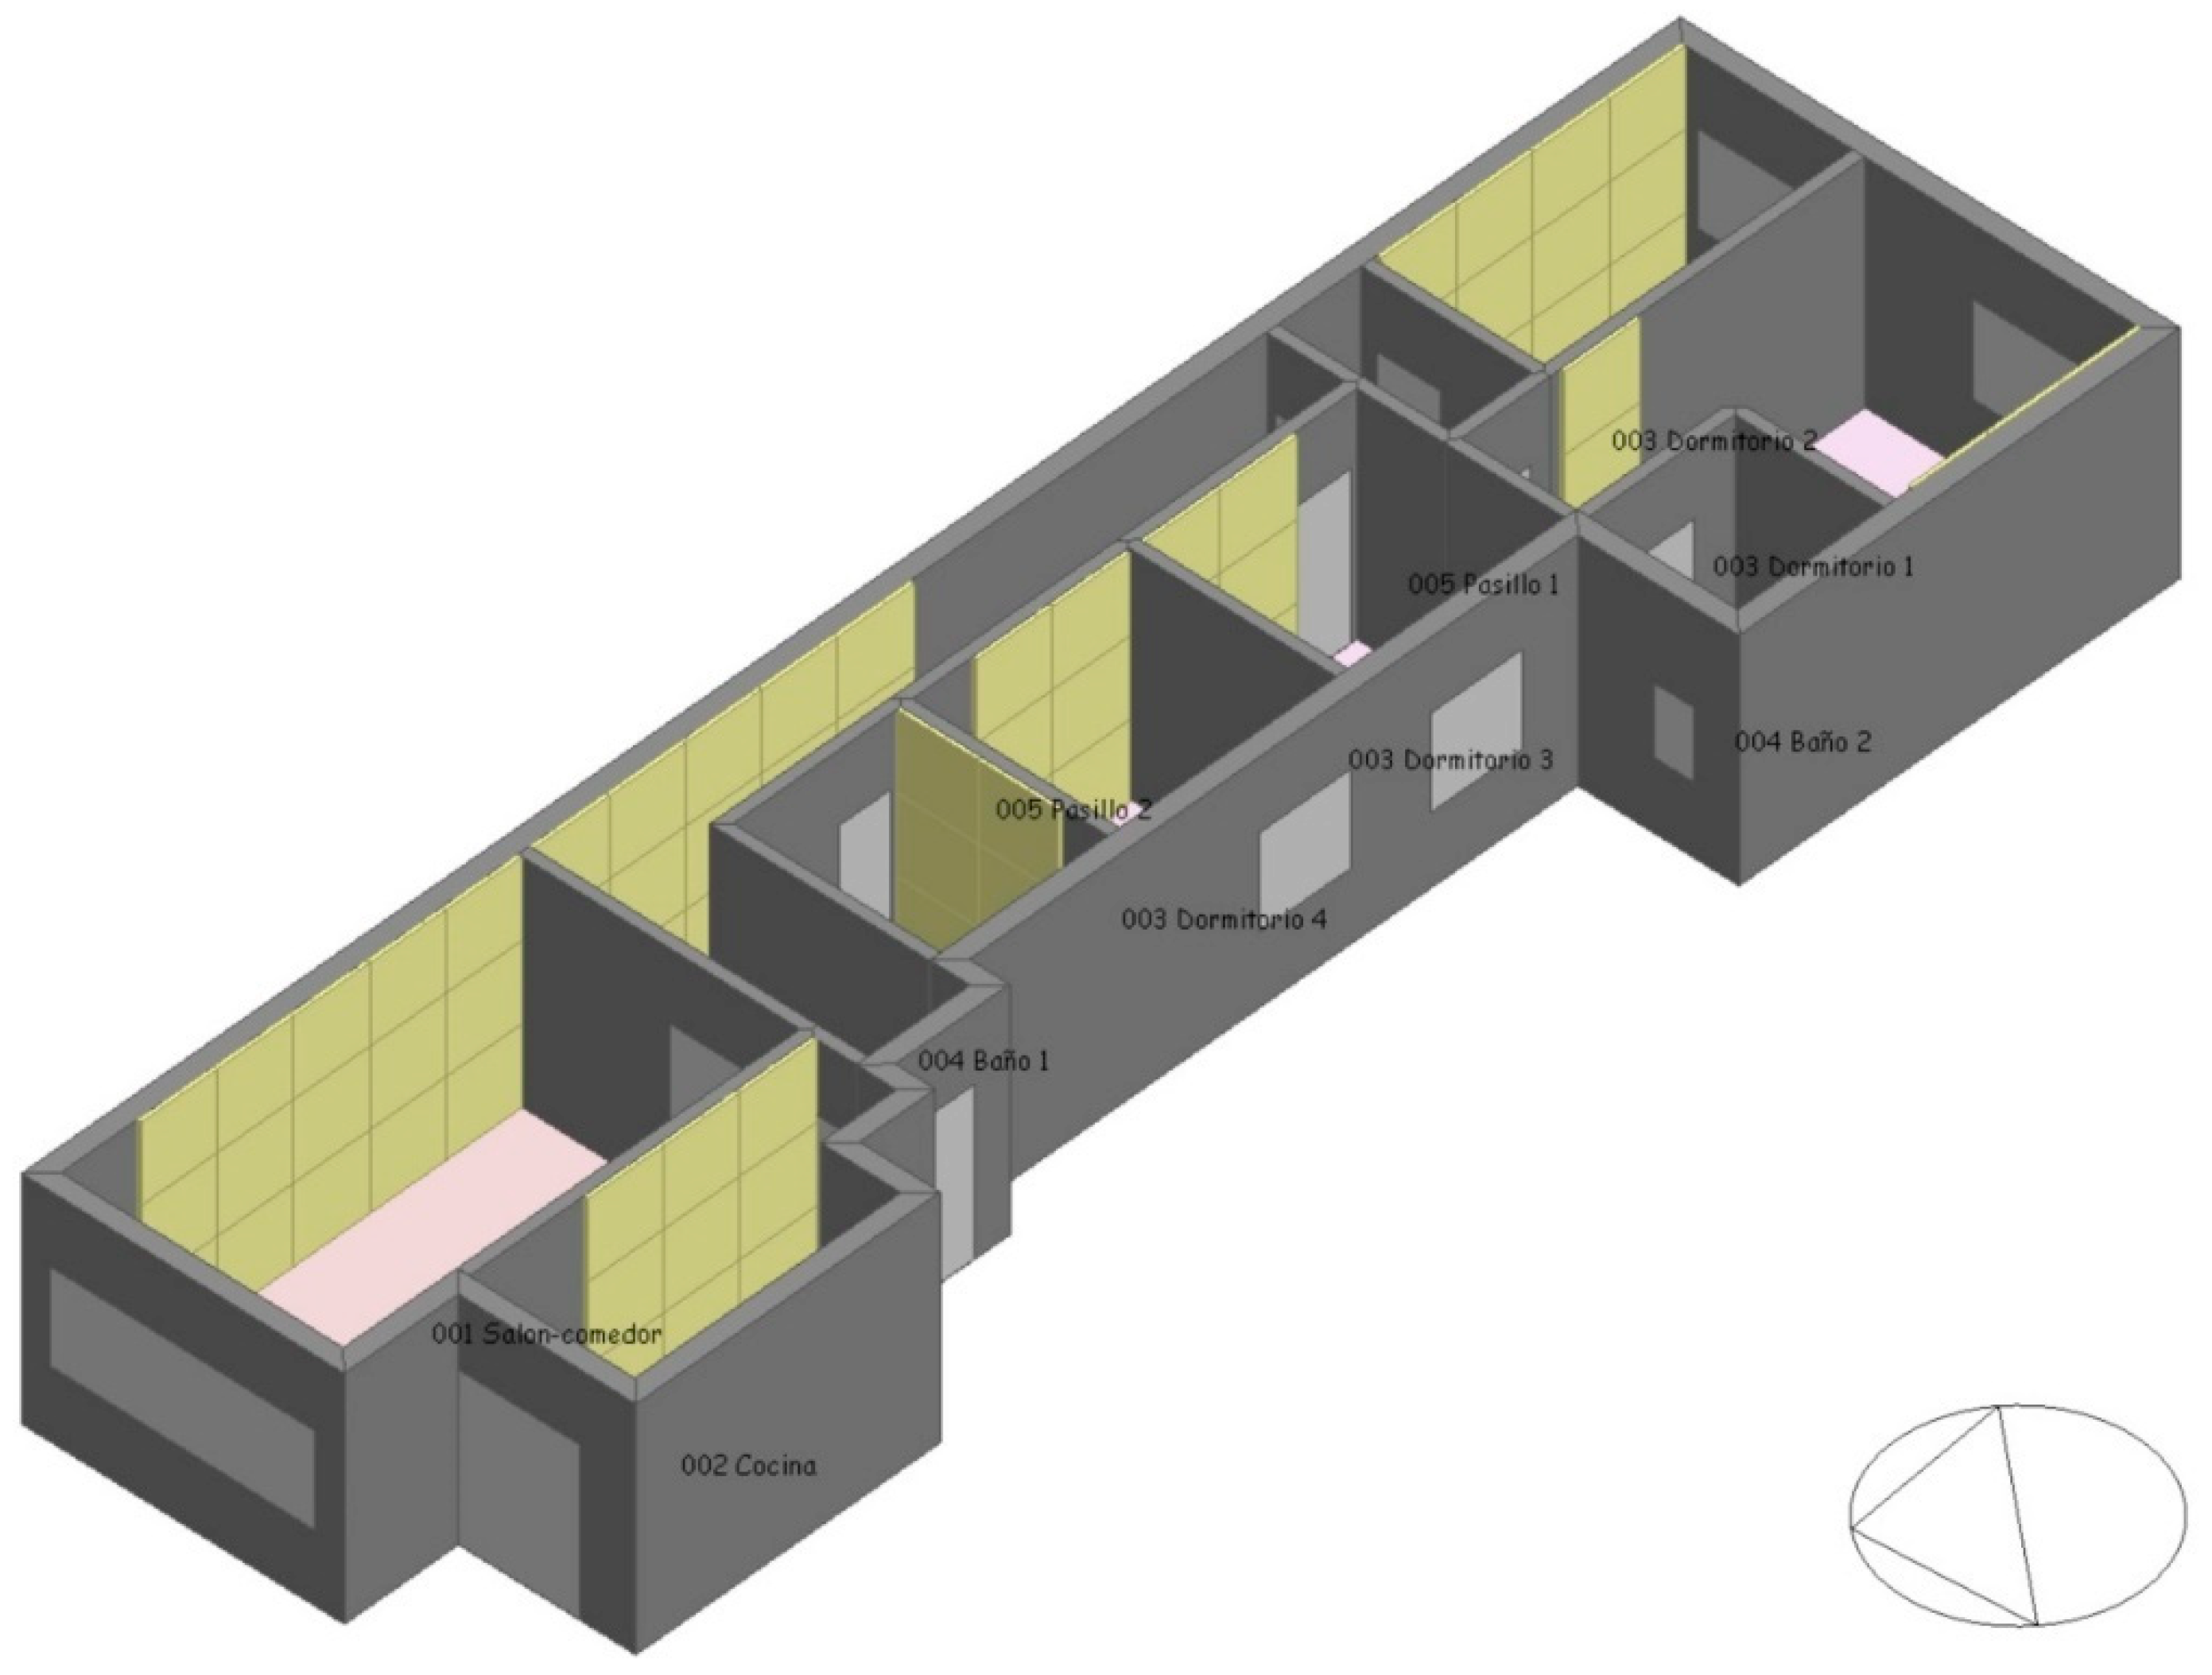
5. Case study. Description of the Home and Its Northeast Enclosure
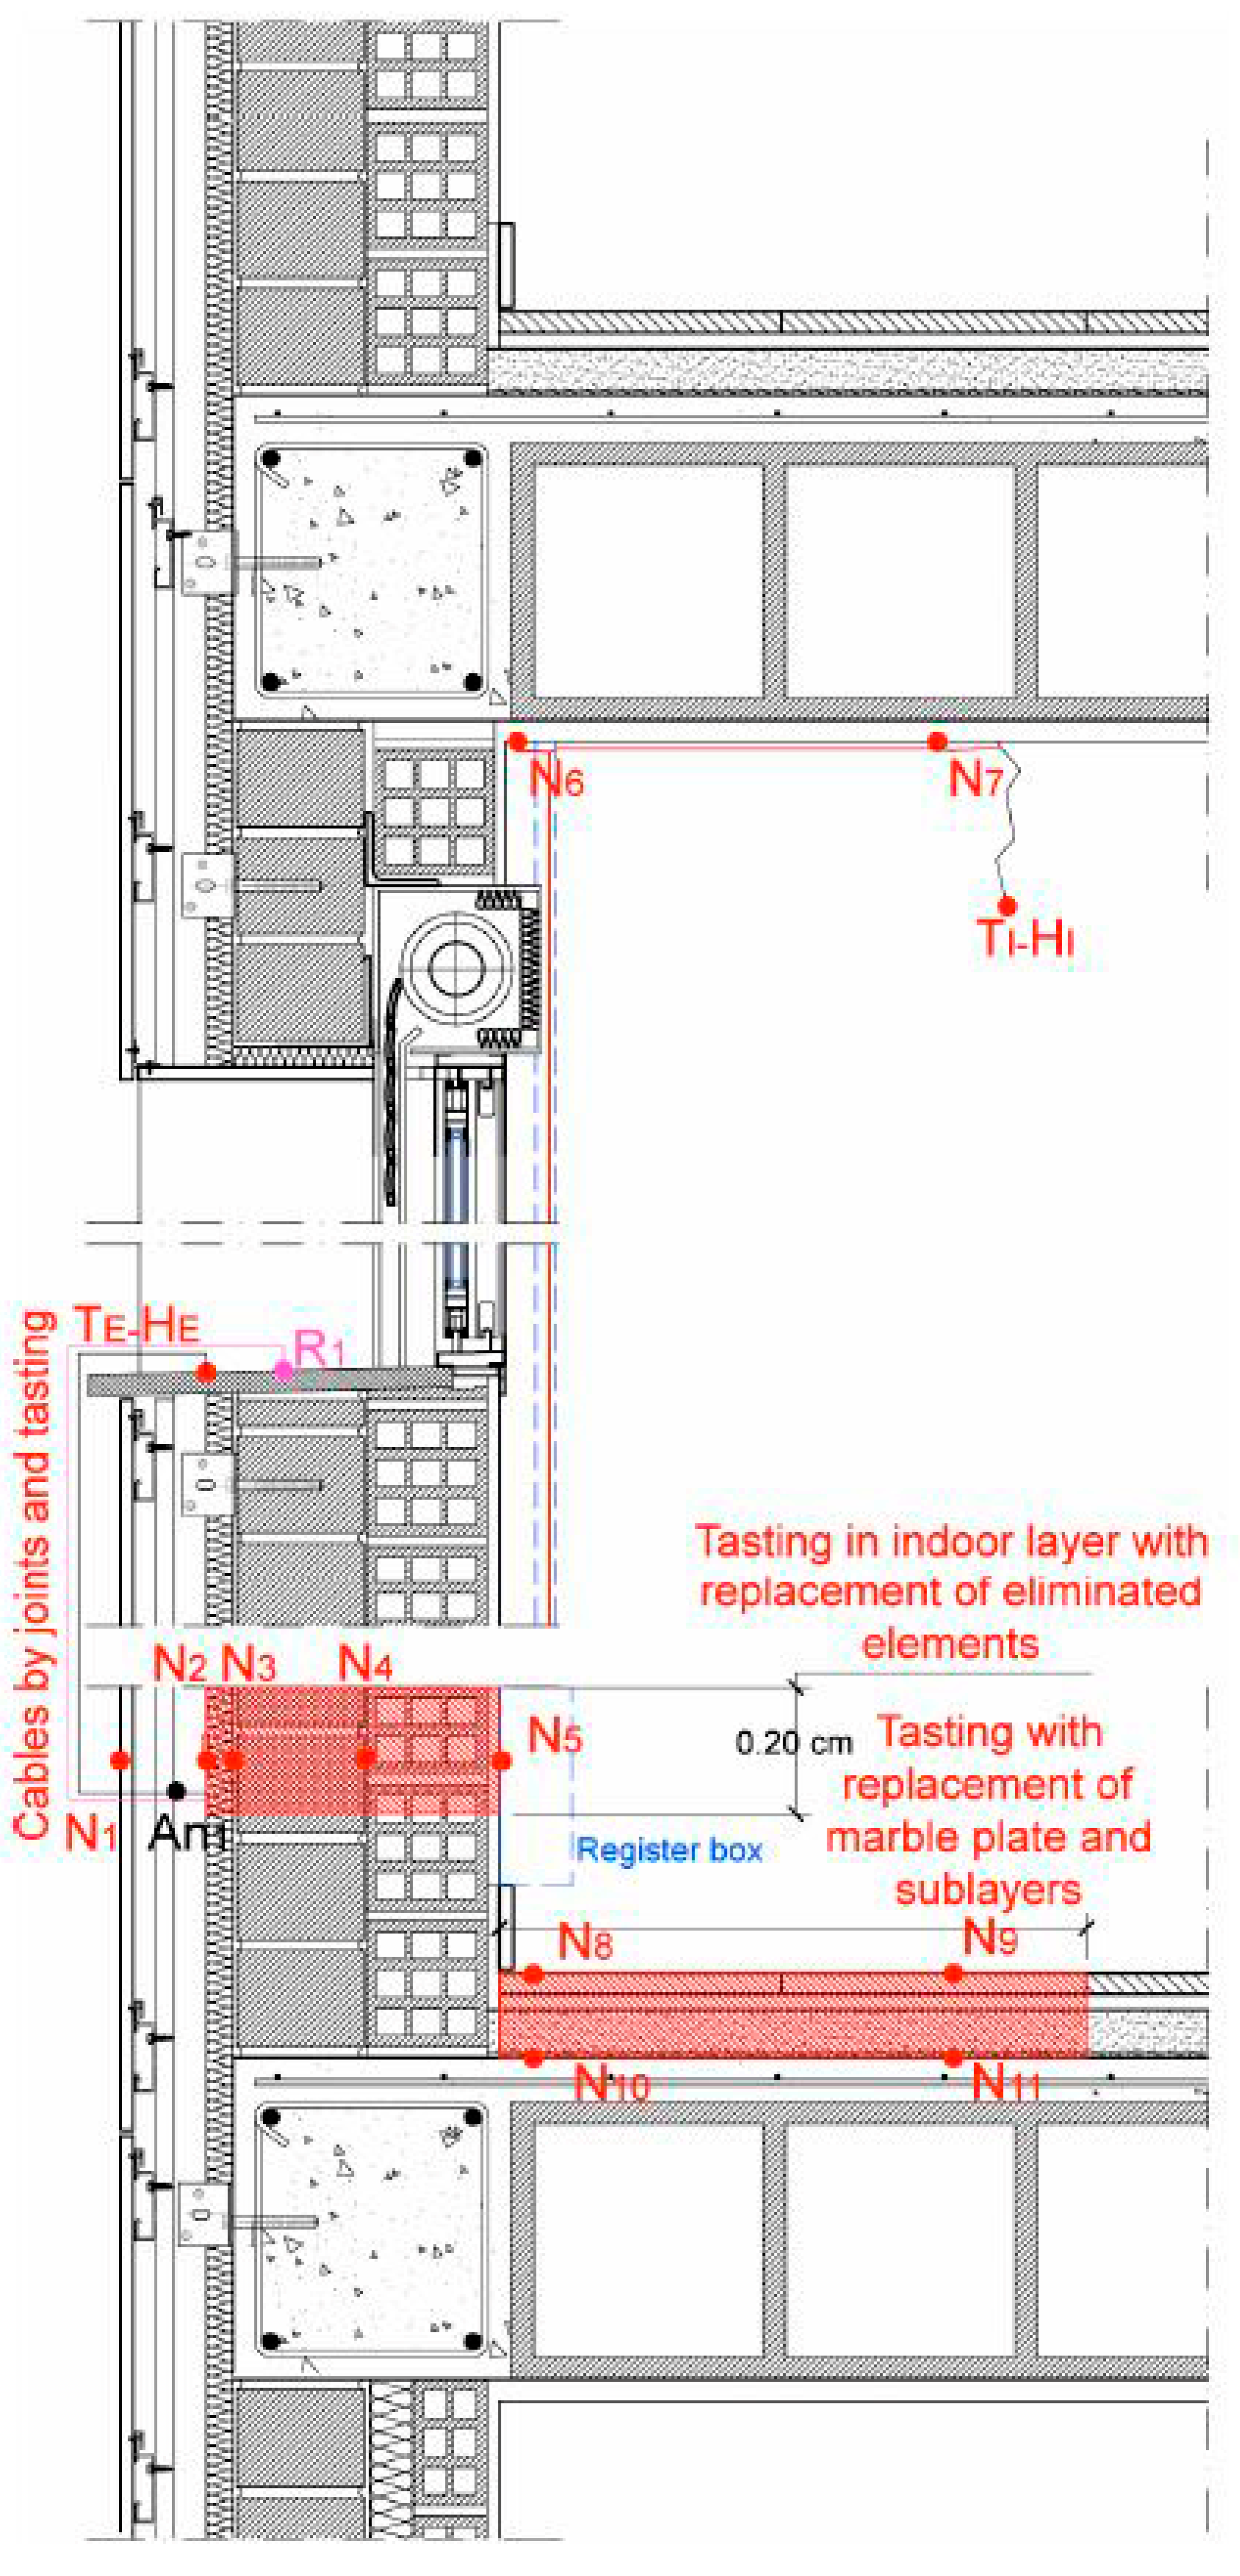
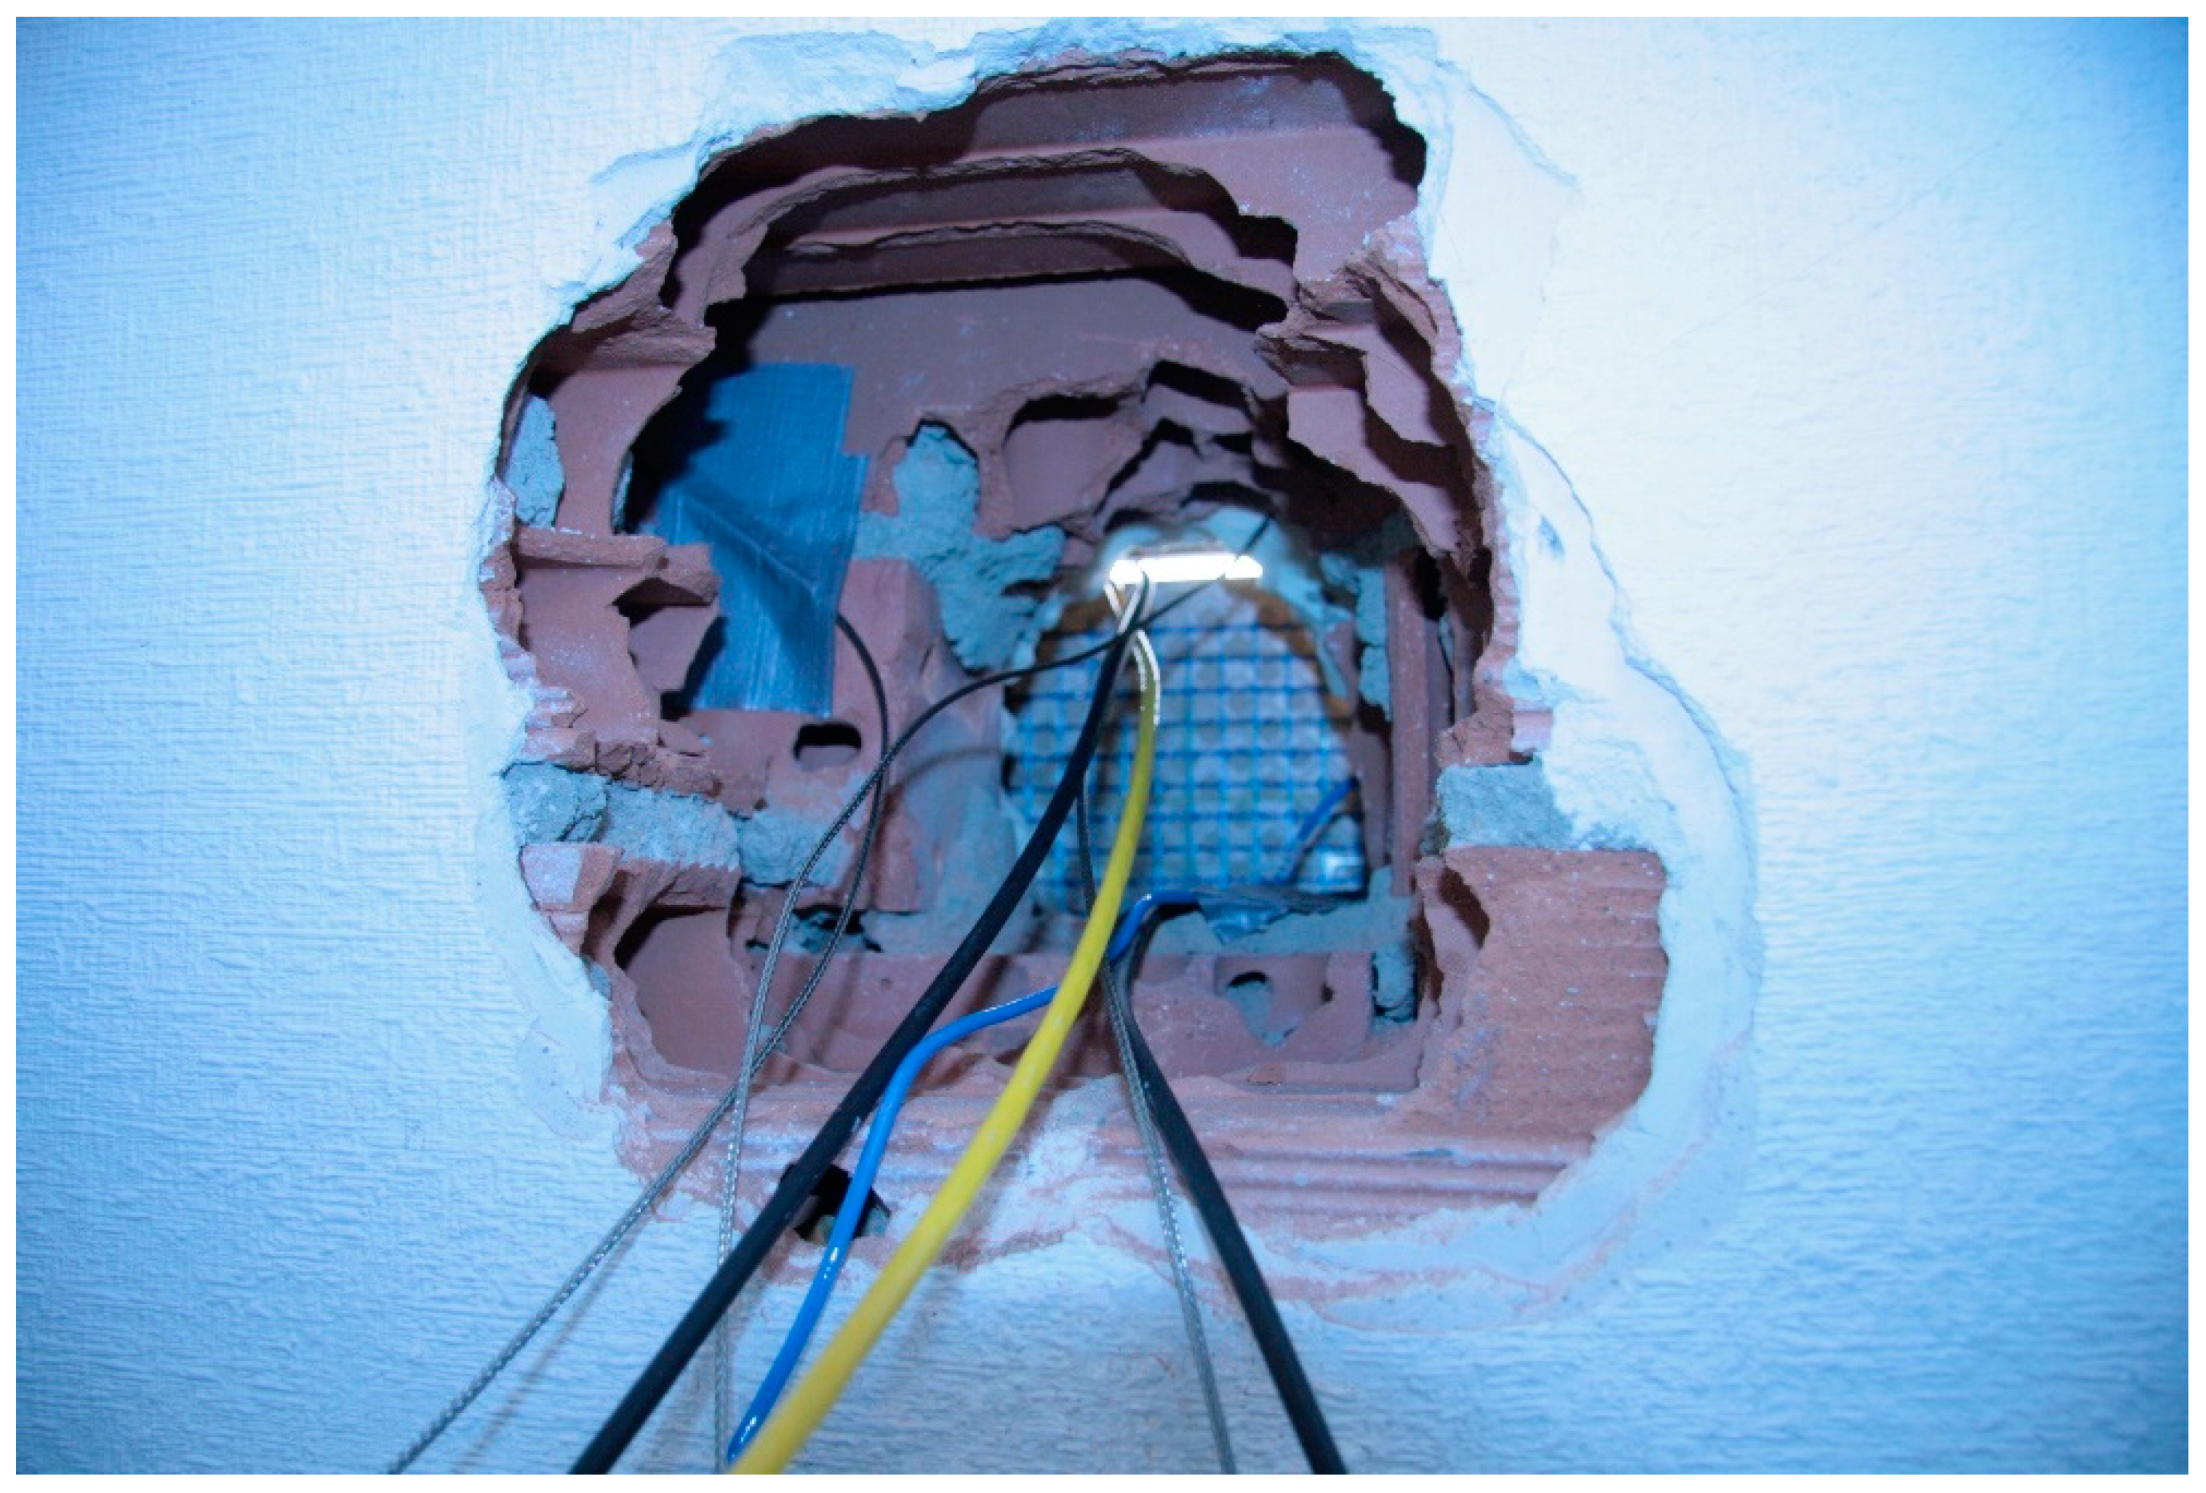
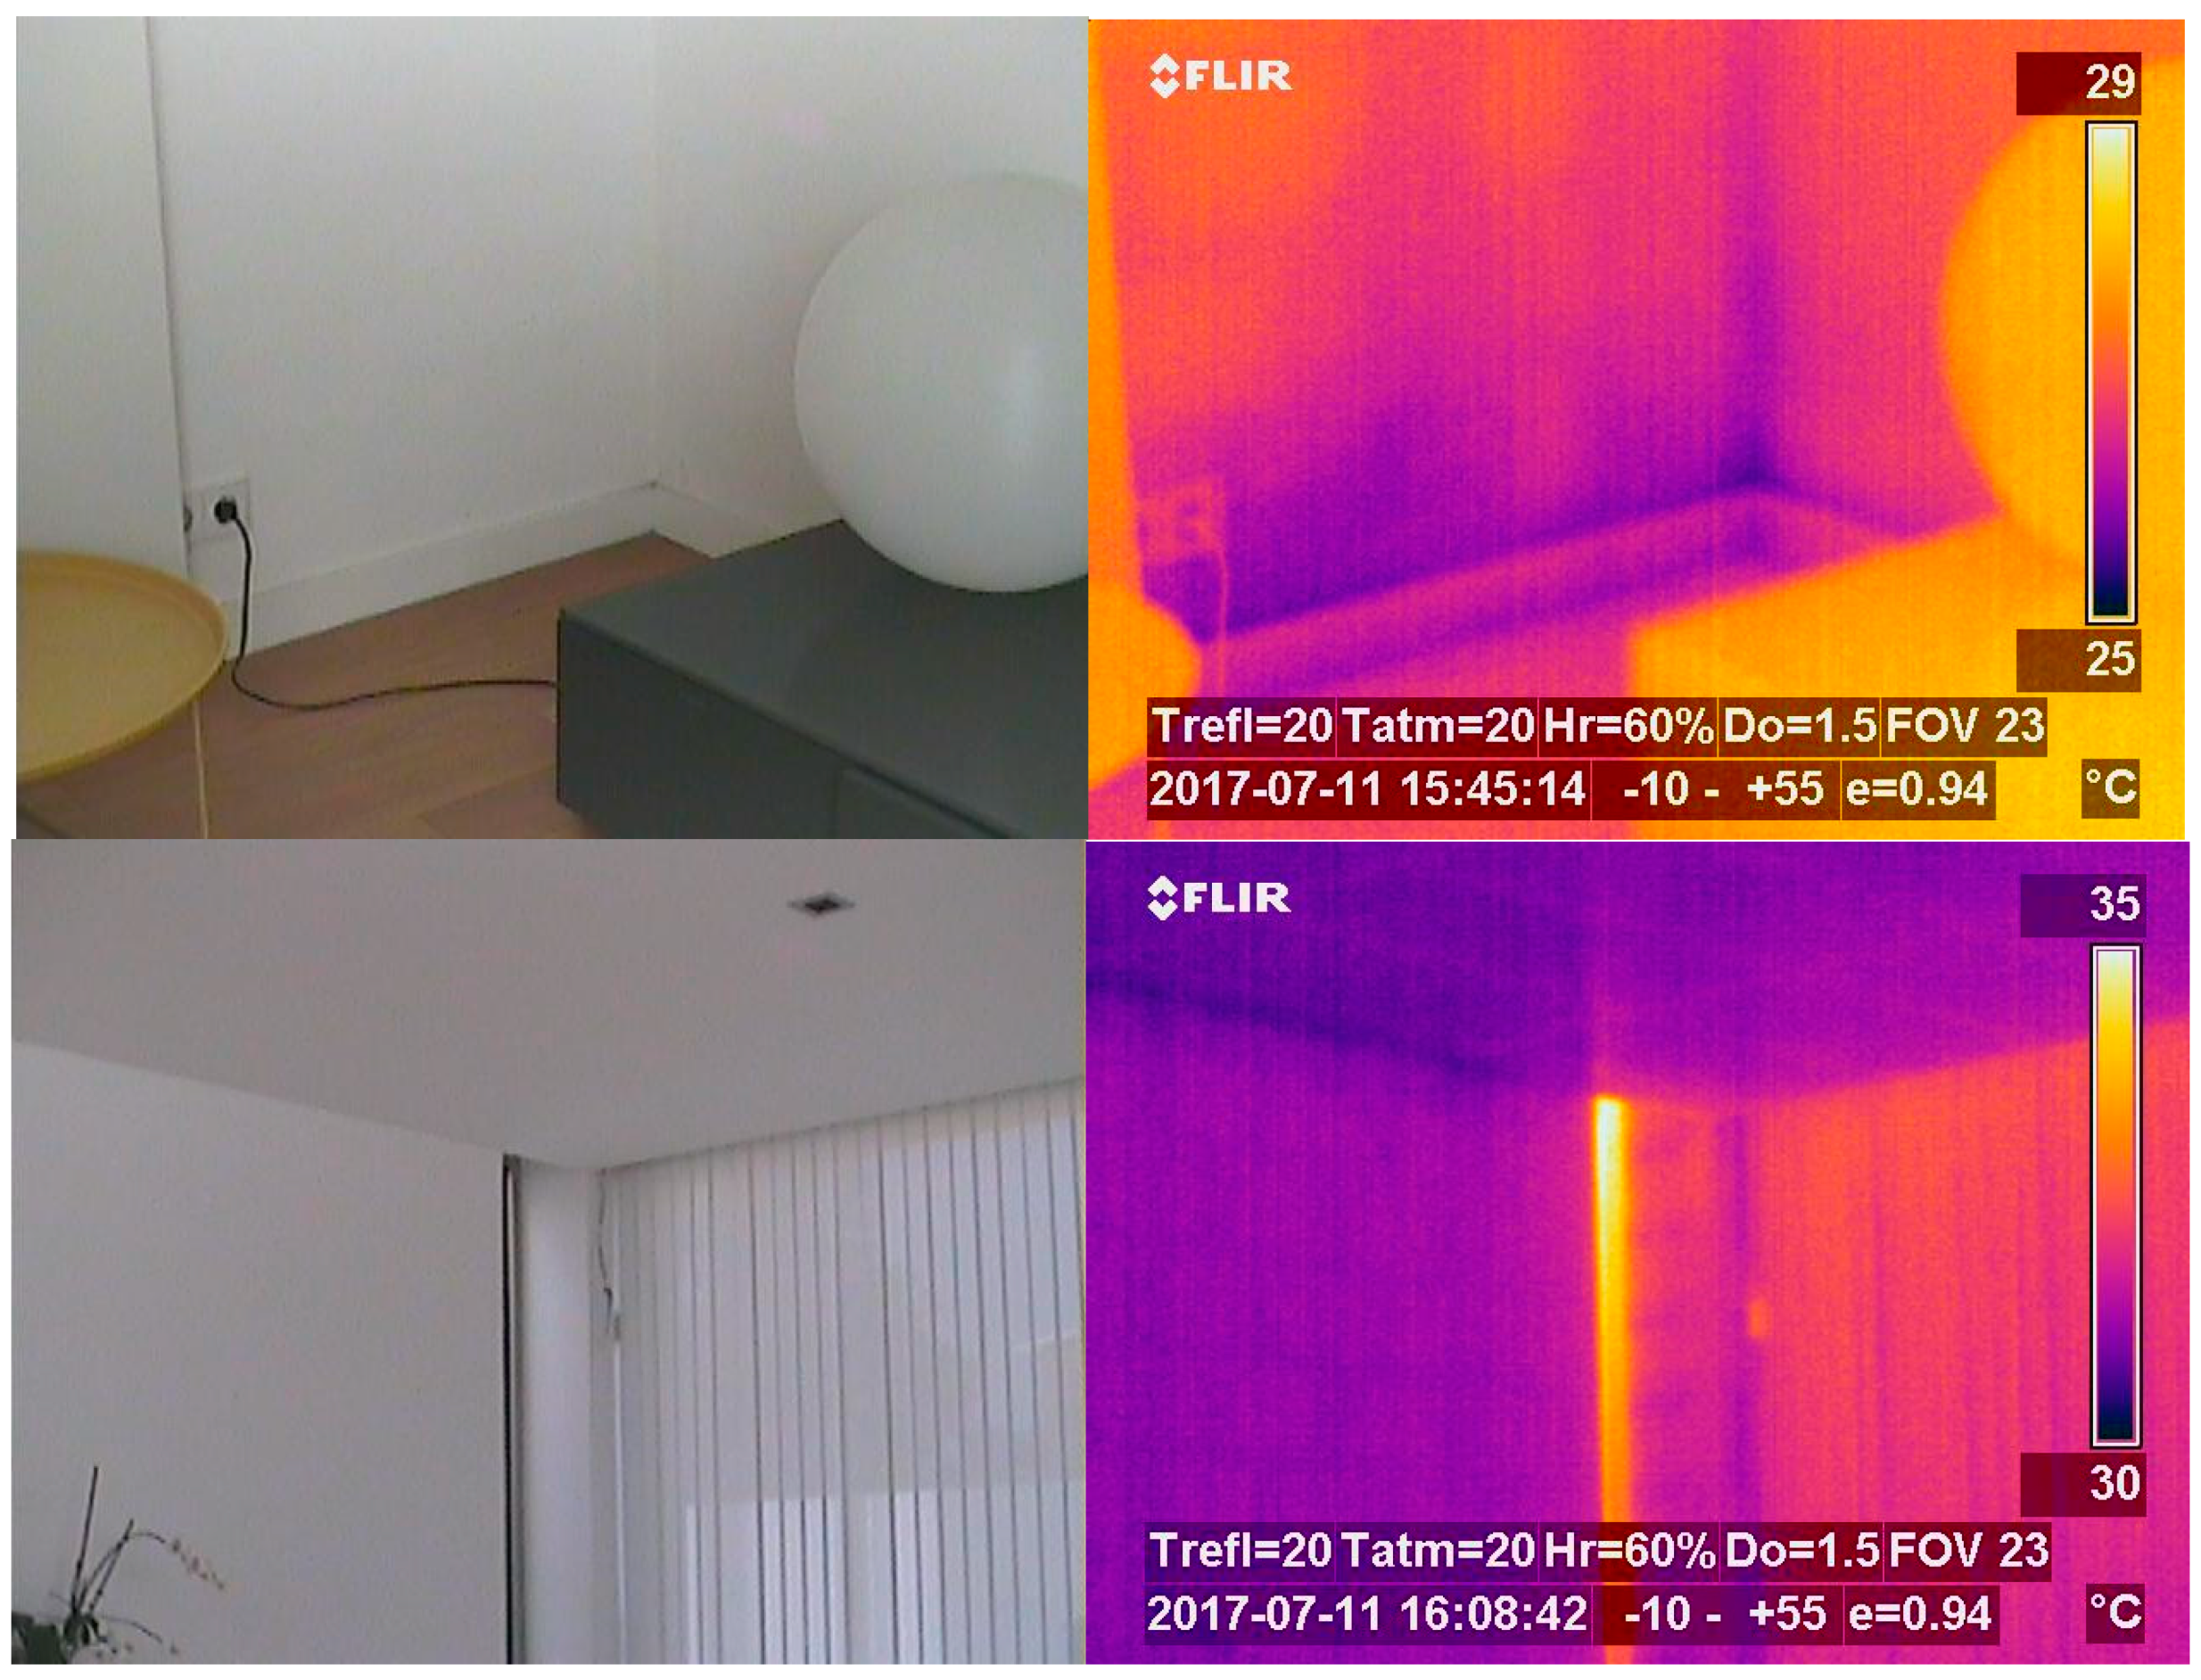
6. Monitoring of the Northeast and Southeast Façades
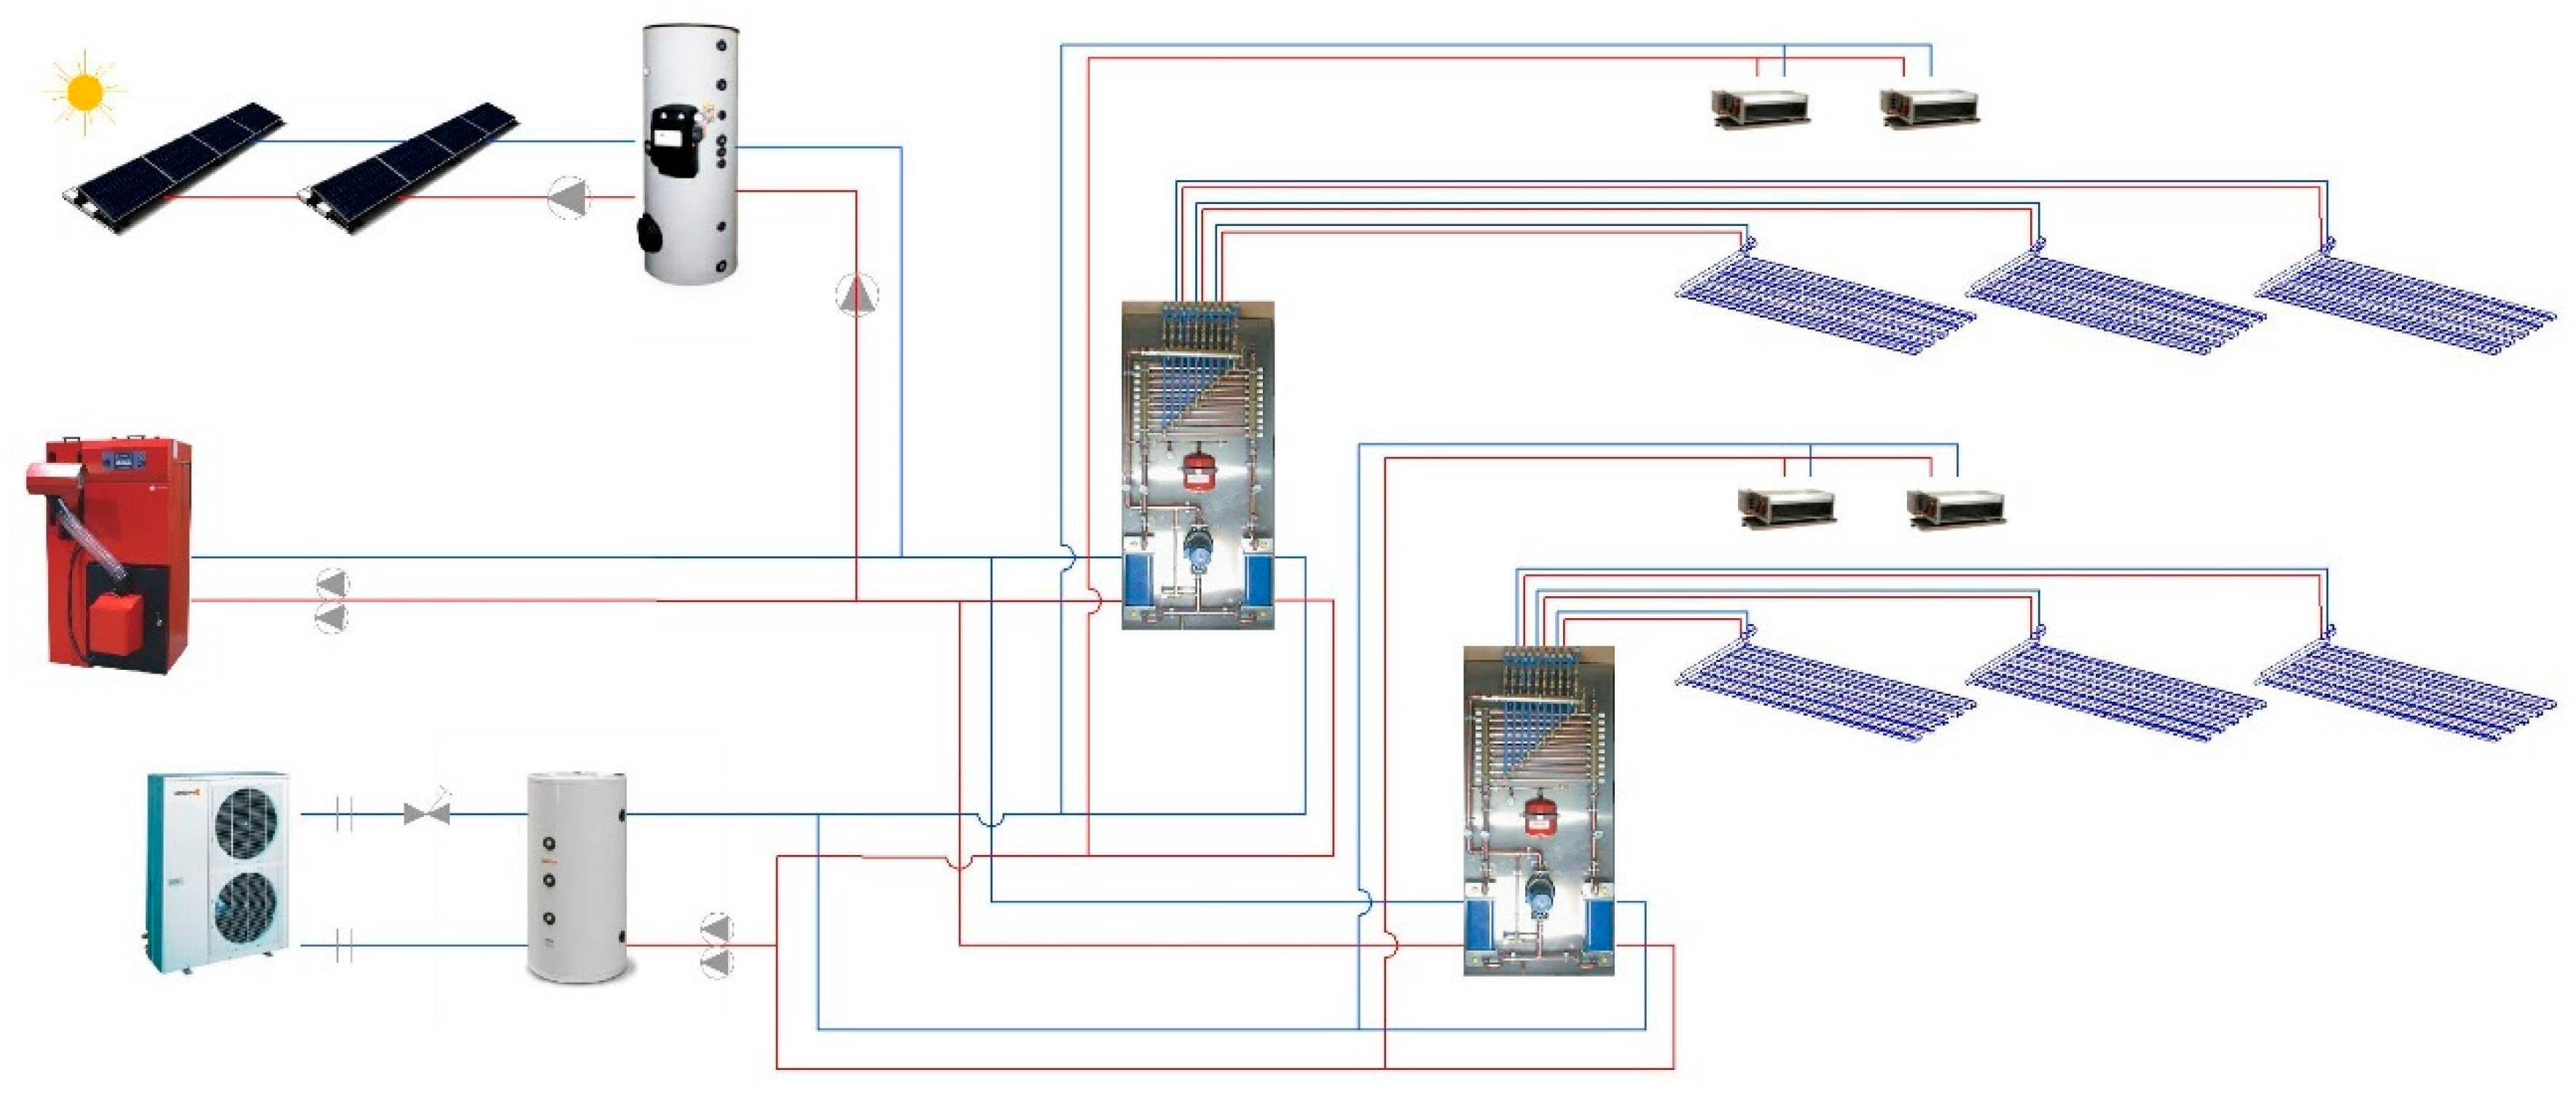
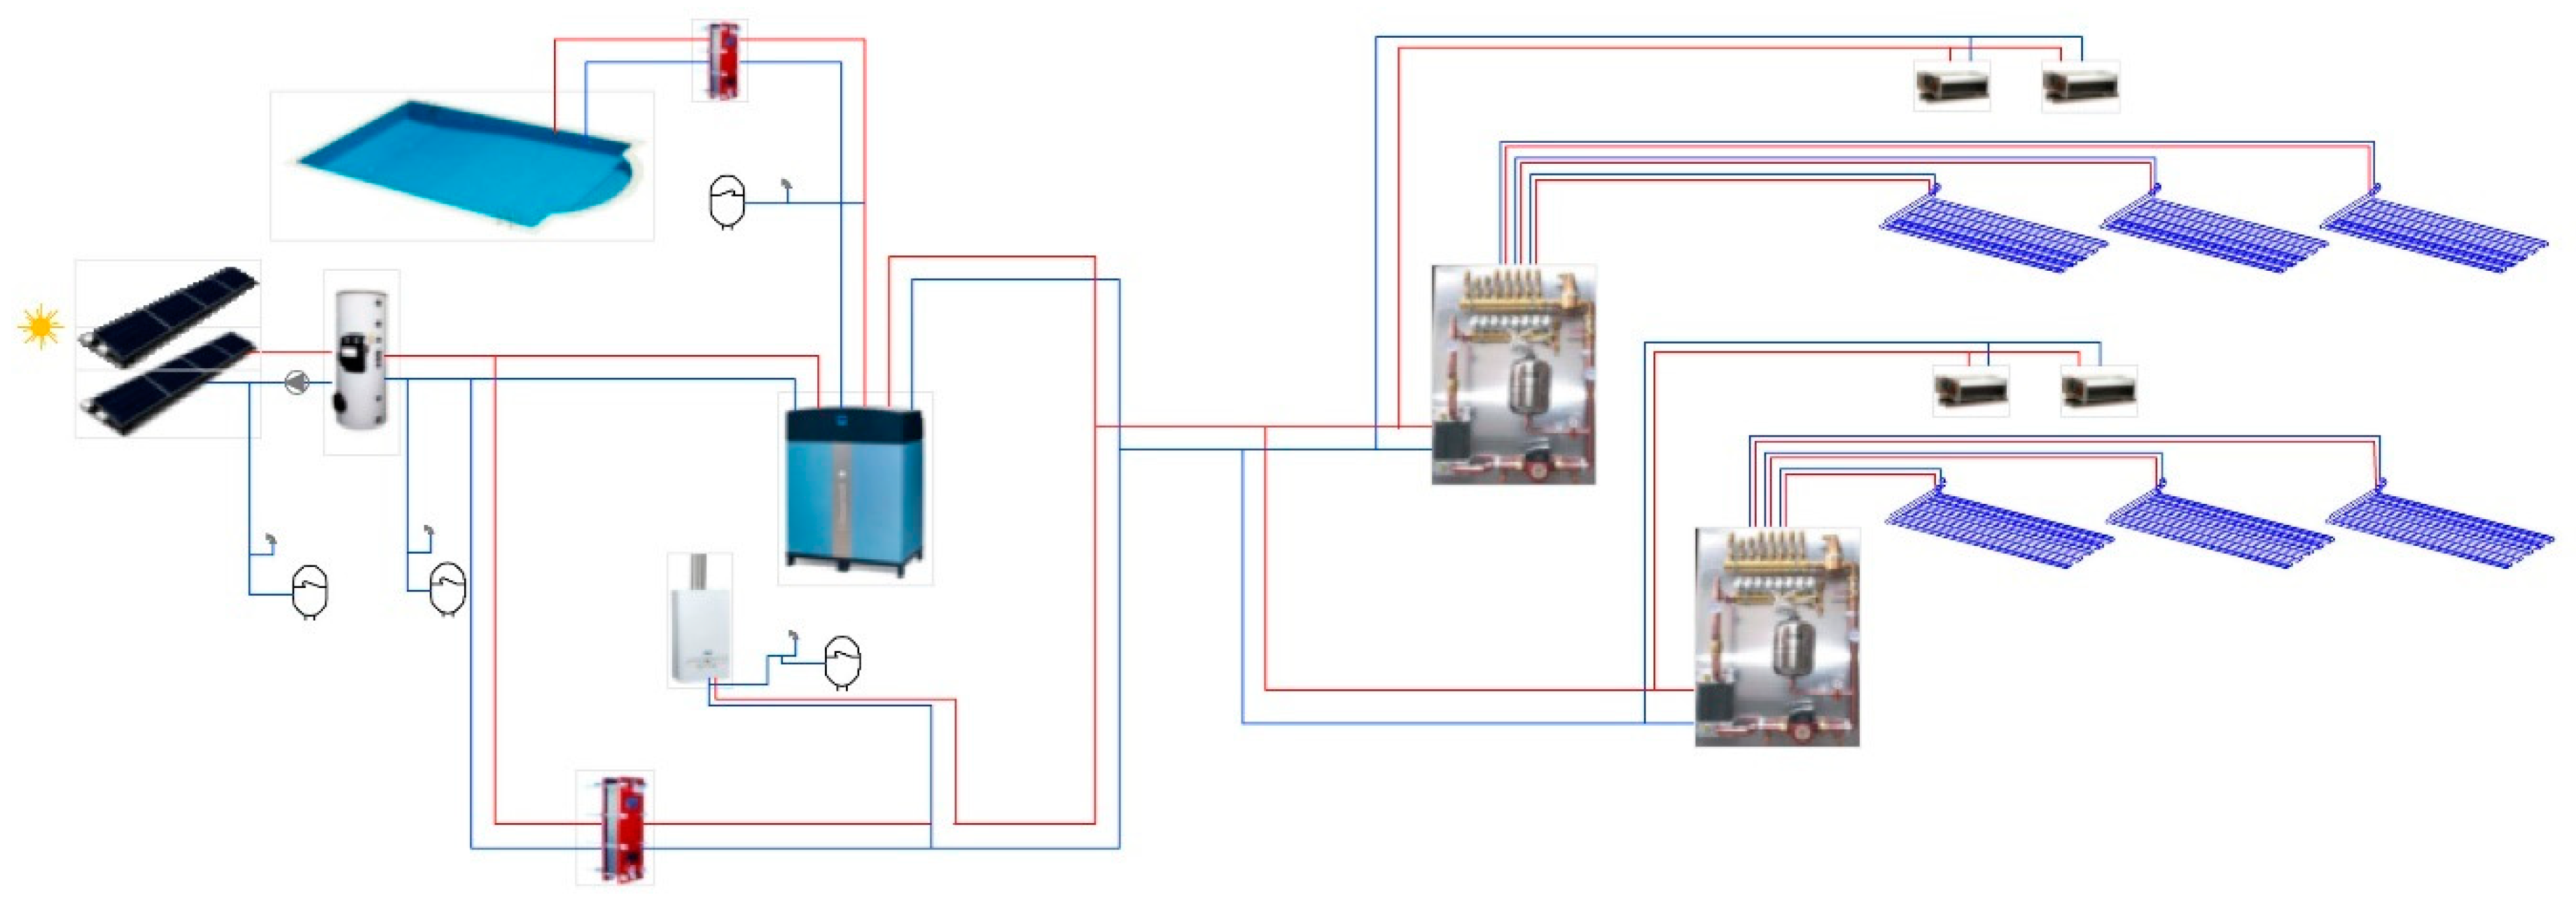
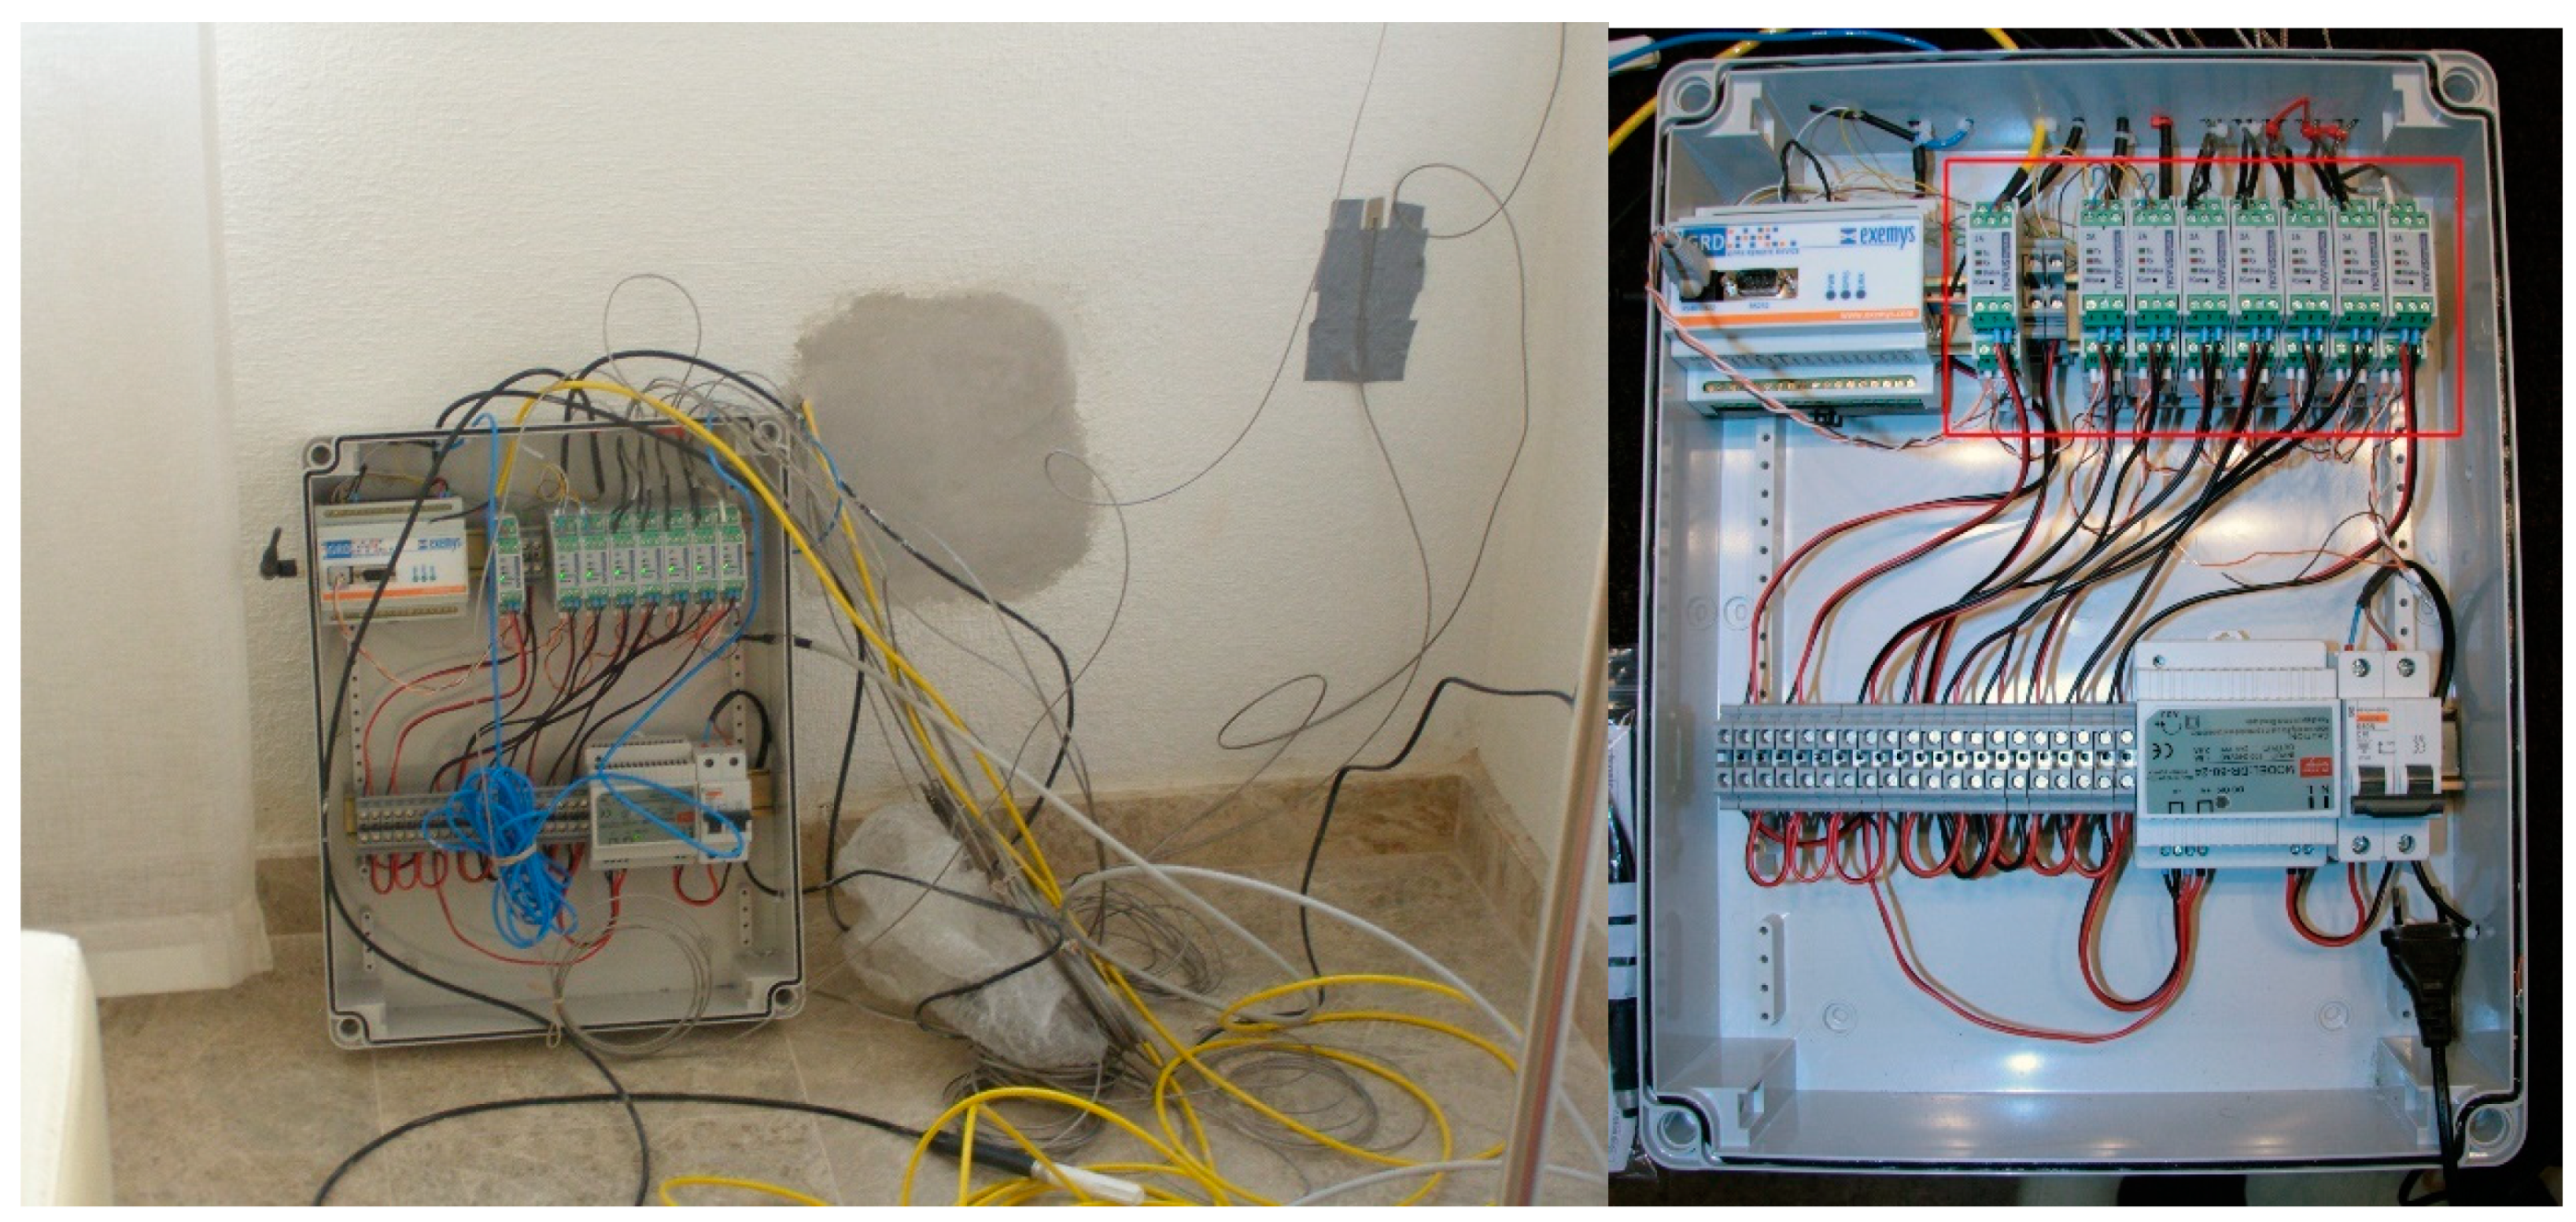
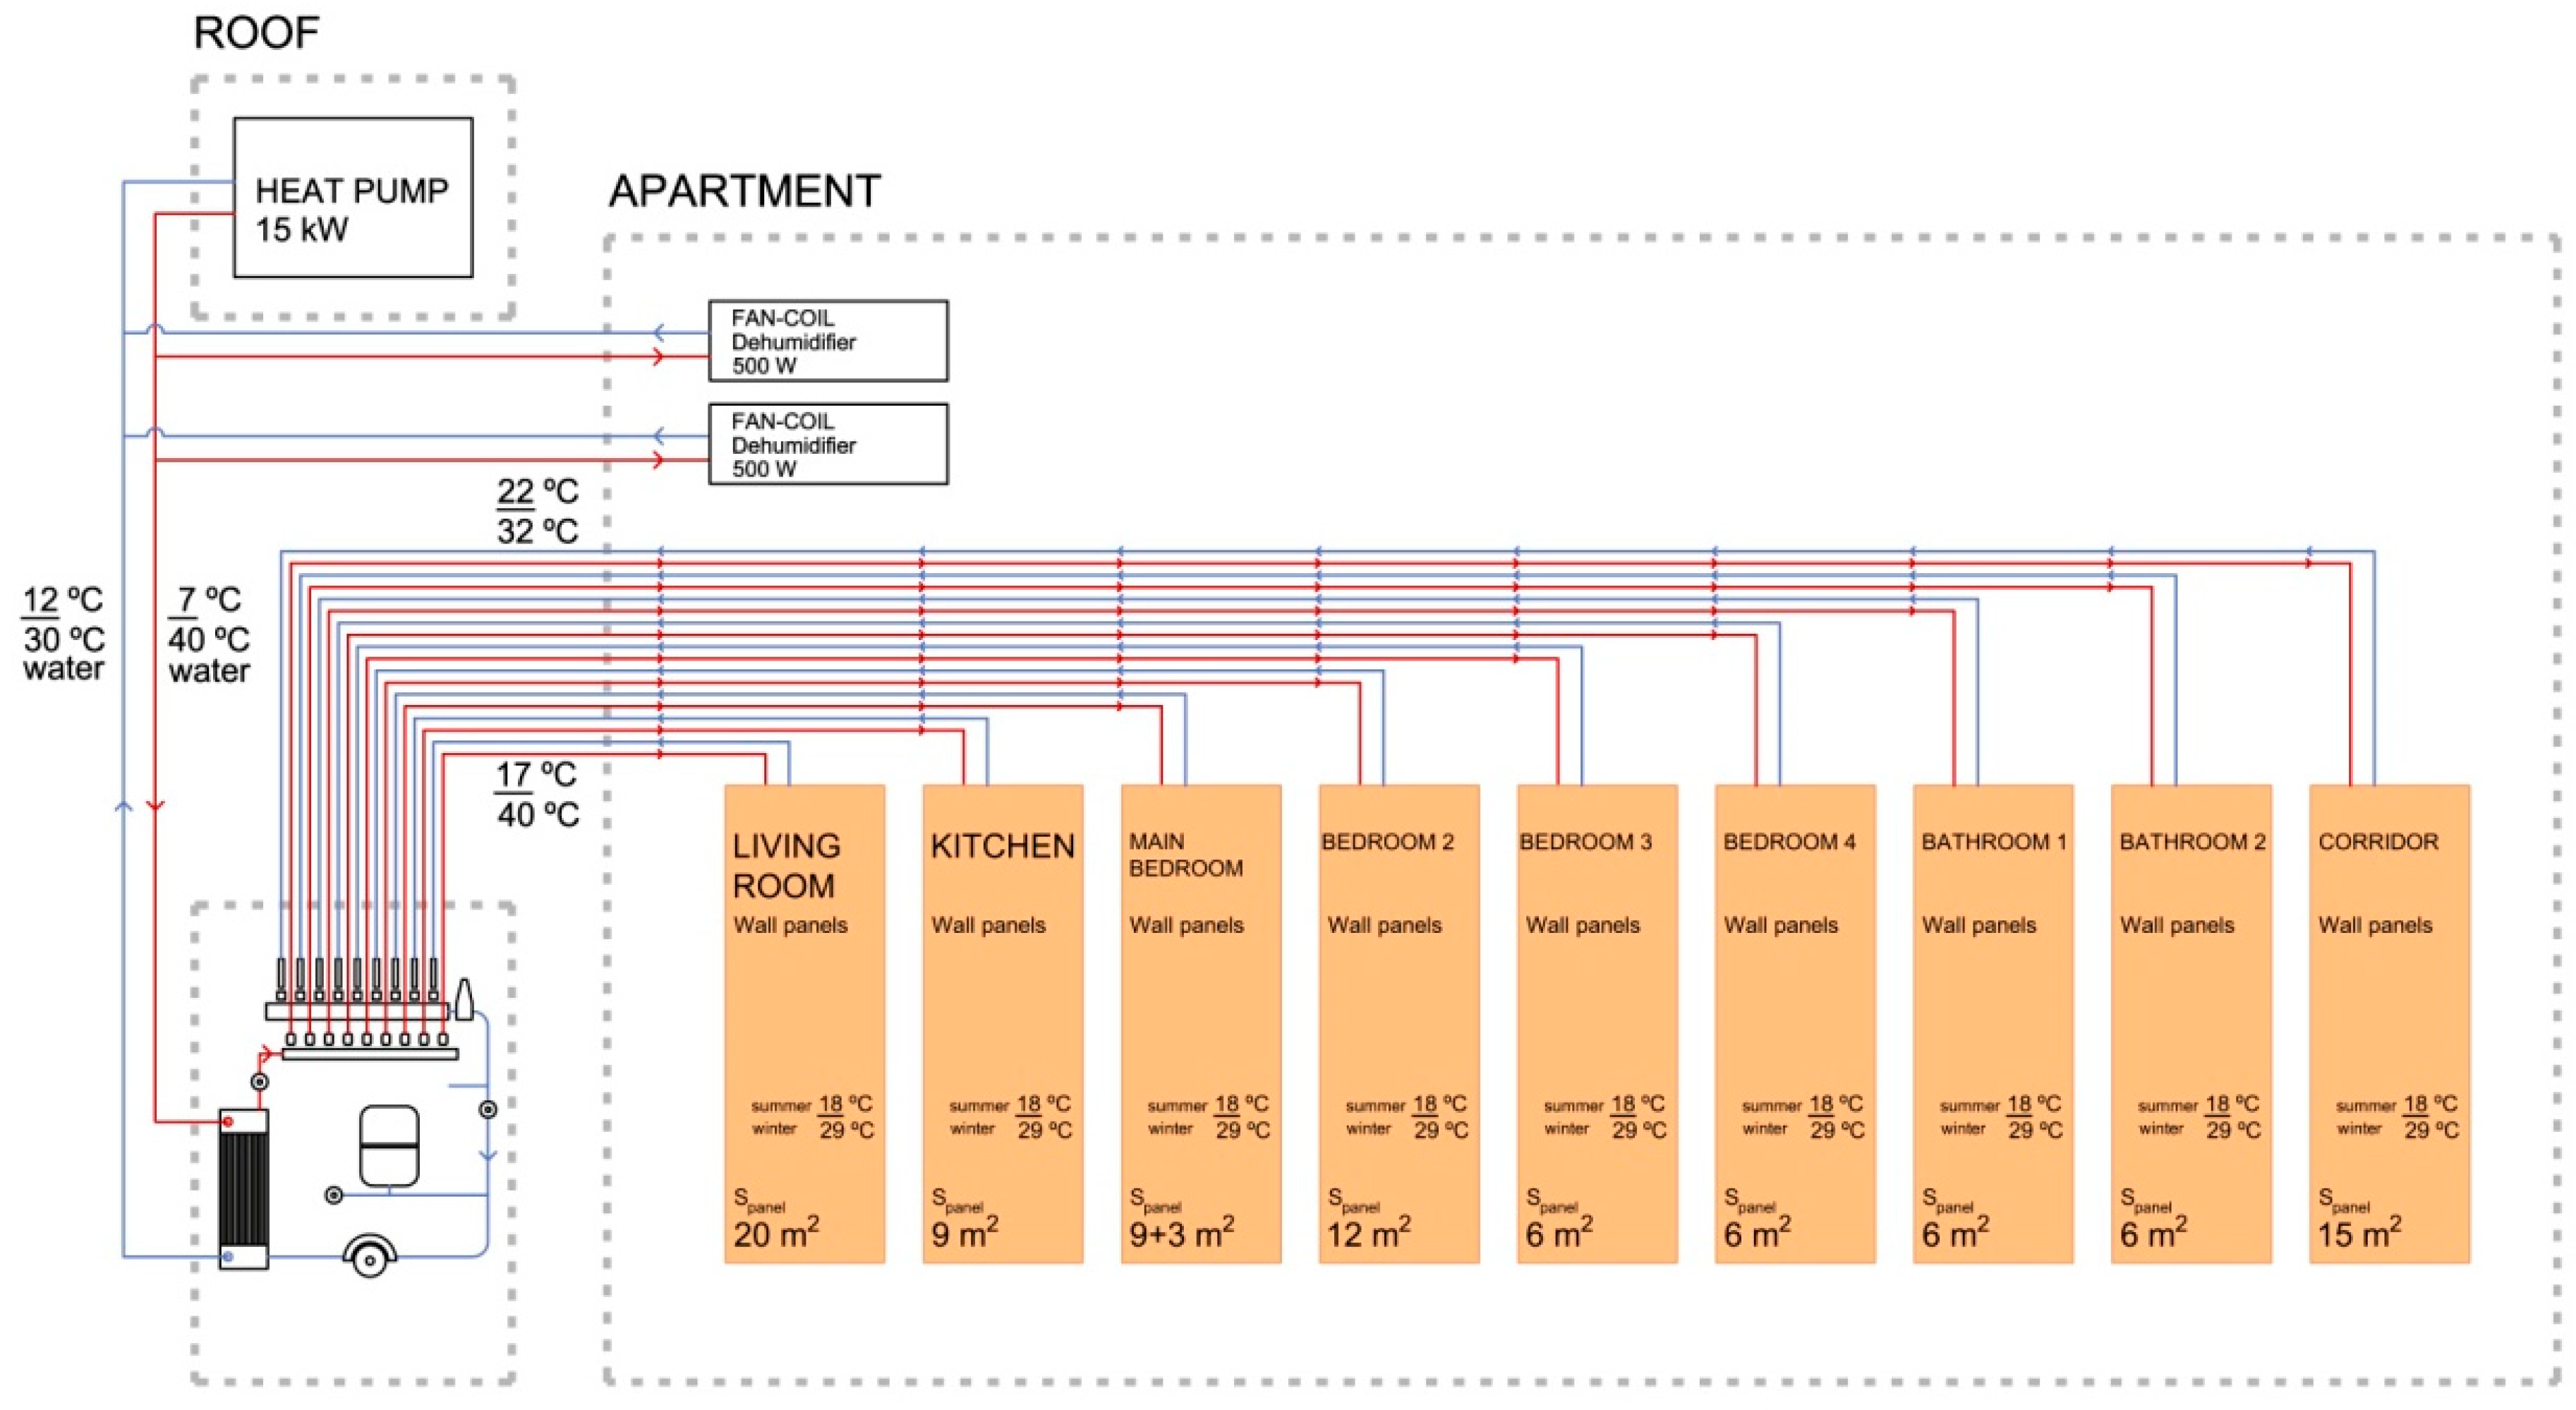
6.1. Description of the System Connection Flow Chart
6.1.1. Description of the Analyser
6.1.2. Description of the Sensors
6.2. Data Reception System
7. Calculation of Conditions of Comfort
8. Calculation of the Home’s Energy Demand
9. Conclusions
- The TCP panel systems were more efficient in terms of energy and more comfortable than OP 1. The annual energy demand was 31.48% lower in OP 2 and 69.47% lower in OP 3.
- User comfort, based on the To operating temperature and the ability to transfer energy to the environment, was 27.3% higher in OP 2 and OP 3 in the living room, and 19.7% higher in bedroom 1. In this scenario, although the indoor air temperature was around 2.1 °C higher in summer and 1.5 °C in winter, because the value of the average temperature radiant Trm for summer was 4.52 °C and 2.31 °C lower for winter, the resulting operating temperature To improved compared to the convective conditioning systems (OP 1).
- Investments in installing the capillary tube mat system using TCP panels could be amortized within a reasonable period of time compared to a convective VRV split system based on a heat pump, an evaporator in the bathroom, and distribution by ducts (OP 1). For the home under study, the extra cost of €11,497 could be amortized in 23.31 years, with a 3732 kWh/year drop in the energy demand and a €493 saving per year, with a cost of 0.123 €/kWh in the electric mix.
- If 18.5 m2 of solar thermal panels were also installed on the roof with water storage tanks for the triple absorption phase system by the accumulation of chemical energy with lithium chloride (LiCl) in summer, the energy savings would be considerable. These savings would be 77.48% compared to OP 1, and 31.47% compared to OP 2. The investment could be amortized in just over 15 years, generating an annual CO2 emission reduction of 2190 kg.
Author Contributions
Funding
Conflicts of Interest
References
- Directive 2002/91/EC of the European Parliament and of the Council of 16 December 2002 on the Energy Performance of Buildings. Available online: http://eur-lex.europa.eu/legal-content/EN/TXT/?uri=celex:32002L0091 (accessed on 10 November 2017).
- Directorate General for Energy (European Commission) European Union. Energy in Figures. Statistical Pocketbook. 2016. Available online: https://publications.europa.eu/en/publication-detail/-/publication/c3d179b2-9a82-11e6-9bca-01aa75ed71a1 (accessed on 6 November 2017).
- Commission of the European Communities Action Plan for Energy Efficiency: Realising the Potential. Available online: http://ec.europa.eu/smart-regulation/impact/ia_carried_out/docs/ia_2006/sec_2006_1174_en.pdf (accessed on 13 November 2017).
- Monge-Barrio, A.; Sánchez-Ostiz, A. Energy efficiency and thermal behaviour of attached sunspaces, in the residential architecture in Spain. Summer Conditions. Energy Build. 2015, 108, 244–256. [Google Scholar] [CrossRef]
- Domínguez Amarillo, S.; León Rodríguez, Á.L.; Bustamante Rojas, P.; Sendra, J.J. Energy Intervention in the residential sector in the south of Spain: Current challenges. Inf. Constr. 2013, 65, 457–464. [Google Scholar]
- Echarri, V.; Galiano, A.; Espinosa, A. Energy Rehabilitation of Ventilated Façades Using Phenolic Panelling at The University of Alicante Museum: Thermal Characterisation and Energy Demand. WIT Trans. Built Environ. 2017, 171, 3–15. [Google Scholar]
- American Society of Heating, Refrigerating, and Air-Conditioning Engineers. 2010 ASHRAE Handbook: Refrigeration; American Society of Heating, Refrigerating, and Air-Conditioning Engineers: Atlanta, GR, USA, 2010; ISBN 9781933742823. [Google Scholar]
- Fanger, O.P. Thermal Comfort. Analysis and Applications in Environmental Engineering; McGraw-Hill: Copenhagen, Denmark, 1970; ISBN 8757103410. [Google Scholar]
- De Dear, R.J.; Akimoto, T.; Arens, E.A.; Brager, G.; Candido, C.; Cheong, K.W.D.; Li, B.; Nishihara, N.; Sekhar, S.C.; Tanabe, S.; et al. Progress in thermal comfort research over the last twenty years. Indoor Air 2013, 23, 442–461. [Google Scholar] [CrossRef] [PubMed]
- Halawa, E.; van Hoof, J. The adaptive approach to thermal comfort: A critical overview. Energy Build. 2012, 51, 101–110. [Google Scholar] [CrossRef]
- Ministerio de Vivienda Real Decreto 314/2006, de 17 de Marzo, por el que se Aprueba el Código Técnico de la Edificación | Instituto Nacional de Seguridad e Higiene en el Trabajo (INSHT). Available online: http://www.boe.es/buscar/act.php?id=BOE-A-2006-5515 (accessed on 2 November 2017).
- Herramienta Unificada Lider-Calener (HULC). Available online: https://www.codigotecnico.org/index.php/menu-recursos/menu-aplicaciones/282-herramientaunificada-lider-calener.html (accessed on 9 September 2017).
- García-Romero, A.; Diarce, G. Phase Change Materials, PCMs, for thermal energy storage and their use in buildings. In Arquit. Ecoeficiente; Hernández, R., Irulegui, O., Aranjuelo, M., Eds.; Servicio Editorial de la UPV/ EHU: San Sebastián, Spain, 2012; Chapter 2; Volume I, pp. 129–146. ISBN 978-84-9860-688-1. [Google Scholar]
- Hispania, U. Estudio de Viabilidad de los Sistemas: Climatización Invisible Uponor y Sistema Convencional Mediante Fan Coils 2014. Available online: https://www.uponor.es/-/media/country-specific/spain/download-centre/case-study/informe-hotel_suelo-radiante.pdf (accessed on 9 August 2017).
- Climate WellTM 10 Design Guidelines. Available online: http://www.solarcombiplus.eu/docs/SolarCombi_ClimateWell_trainingmaterial5.pdf (accessed on 3 August 2018).
- Stetiu, C. Energy and peak power savings potential of radiant cooling systems in US commercial buildings. Energy Build. 1999, 30, 127–138. [Google Scholar] [CrossRef] [Green Version]
- Beka Technical Information G0; Beka Heiz-undKülmatten: Berlín, Germany, 2000.
- Bruelisauer, M.; Chen, K.W.; Iyengar, R.; Leibundgut, H.; Li, C.; Li, M.; Mast, M.; Meggers, F.; Miller, C.; Rossi, D.; et al. BubbleZERO—Design, Construction and Operation of a Transportable Research Laboratory for Low Exergy Building System Evaluation in the Tropics. Energies 2013, 6, 4551–4571. [Google Scholar] [CrossRef] [Green Version]
- Wang, Y.H. Experimental Study of Capillary Radiant Cooling System with Parameters Changing. Appl. Mech. Mater. 2013, 300–301, 1048–1053. [Google Scholar] [CrossRef]
- Jordan, S.; Hafner, J.; Kuhn, T.E.; Legat, A.; Zbašnik-Senegačnik, M. Evaluation of Various Retrofitting Concepts of Building Envelope for Offices Equipped with Large Radiant Ceiling Panels by Dynamic Simulations. Sustainability 2015, 7, 13169–13191. [Google Scholar] [CrossRef] [Green Version]
- Sala Lizarraga, J.M. Transmisión de calor en edificios. In Arquitectura Ecoeficiente; Servicio Editorial de la UPV/EHU: Valencia, Spain, 2012; Volume 1. [Google Scholar]
- Mikeska, T.; Svendsen, S. Dynamic behavior of radiant cooling system based on capillary tubes in walls made of high performance concrete. Energy Build. 2015, 108, 92–100. [Google Scholar] [CrossRef] [Green Version]
- Mikeska, T.; Fan, J.; Svendsen, S. Full scale measurements and CFD investigations of a wall radiant cooling system integrated in thin concrete walls. Energy Build. 2017, 139, 242–253. [Google Scholar] [CrossRef]
- Imanari, T.; Omori, T.; Bogaki, K. Thermal comfort and energy consumption of the radiant ceiling panel system.: Comparison with the conventional all-air system. Energy Build. 1999, 30, 167–175. [Google Scholar] [CrossRef]
- Rhee, K.-N.; Kim, K.W. A 50 year review of basic and applied research in radiant heating and cooling systems for the built environment. Build. Environ. 2015, 91, 166–190. [Google Scholar] [CrossRef]
- Tye-Gingras, M.; Gosselin, L. Comfort and energy consumption of hydronic heating radiant ceilings and walls based on CFD analysis. Build. Environ. 2012, 54, 1–13. [Google Scholar] [CrossRef]
- Corgnati, S.P.; Perino, M.; Fracastoro, G.V.; Nielsen, P.V. Experimental and numerical analysis of air and radiant cooling systems in offices. Build. Environ. 2009, 44, 801–806. [Google Scholar] [CrossRef]
- Xie, D.; Wang, Y.; Wang, H.; Mo, S.; Liao, M. Numerical analysis of temperature non-uniformity and cooling capacity for capillary ceiling radiant cooling panel. Renew. Energy 2016, 87, 1154–1161. [Google Scholar] [CrossRef]
- Seyam, S.; Huzayyin, A.; El-Batsh, H.; Nada, S. Experimental and numerical investigation of the radiant panel heating system using scale room model. Energy Build. 2014, 82, 130–141. [Google Scholar] [CrossRef]
- Echarri, V. Thermal Ceramic Panels and Passive Systems in Mediterranean Housing: Energy Savings and Environmental Impacts. Sustainability 2017, 9, 1613. [Google Scholar] [CrossRef]
- Echarri, V.; Galiano Garrigós, A.L.; González Avilés, Á.B. Ceramics and healthy heating and cooling systems: Thermal ceramic panels in buildings. Conditions of comfort and energy demand versus convective systems. Inf. Constr. 2016, 68, 1–14. [Google Scholar]
- Echarri, V.; Oviedo, E.; Lázaro, V. Panel de Acondicionamiento Térmico Cerámico. Patente de no Solicitud P201001626, 28 December 2010. [Google Scholar]
- Dynamobel Manual de Climatización Tranquila. Available online: www.dynamobel.com (accessed on 17 January 2016).
- Ortega, M.; Ortega, A. Calefacción y Refrescamiento por Superficies Radiantes; Ediciones Paraninfo, Thomson Learning: Madrid, Spain, 2001; ISBN 9788428327411. [Google Scholar]
- Echarri, V.; Espinosa, A.; Rizo, C. Thermal Transmission through Existing Building Enclosures: Destructive Monitoring in Intermediate Layers versus Non-Destructive Monitoring with Sensors on Surfaces. Sensors 2017, 17, 2848. [Google Scholar] [CrossRef] [PubMed]
- Echarri, V.; Espinosa Fernández, A.; Galiano Garrigós, A. Energy efficiency of flooded roofs: The University of Alicante Museum. WIT Trans. Eng. Sci. 2016, 106, 163–176. [Google Scholar]
- Si, Q.; Zhang, X. Experimental and Numerical Study of the Radiant Induction-Unit and the Induction Radiant Air-Conditioning System. Energies 2017, 10, 26. [Google Scholar] [CrossRef]
- Gosnell, J.; Minne, J.-P. Radiant Cooling Systems and Applications; The Demostration Component of the Joule-Thermie Programme; European Commission: Brussels, Belgium, 1998. [Google Scholar]
- Dodoo, A.; Gustavsson, L.; Sathre, R. Primary energy implications of ventilation heat recovery in residential buildings. Energy Build. 2011, 43, 1566–1572. [Google Scholar] [CrossRef]
- Peel, M.C.; Finlayson, B.L.; Mcmahon, T.A. Updated world map of the Koppen-Geiger climate classification. Hydrol. Earth Syst. Sci. 2007, 11, 1633–1644. [Google Scholar] [CrossRef]
- Zamora García, M. Empleo de bombas de calor acopladas a intercambiadores geotérmicos en áreas costeras mediterráneas. Proyecto Geocool. Montajes e instalaciones. Revista Técnica Sobre la Construcción e Ingeniería de las Instalaciones 2008, 38, 66–72. [Google Scholar]
- Haiwen, S.; Lin, D.; Xiangli, L.; Yingxin, Z. Quasi-dynamic energy-saving judgment of electric-driven seawater source heat pump district heating system over boiler house district heating system. Energy Build. 2010, 42, 889–895. [Google Scholar] [CrossRef]
- Zhang, L. Hu Songtao Research on the Heat Pump System Using Seawater as Heat Source or Sink. Build. Energy Environ. 2006, 25, 34–38. [Google Scholar]
- Kavanaugh, S.P.; Rafferty, K.D. Ground-Source Heat Pumps: Design of Geothermal Systems for Commercial and Institutional Buildings; ASHRAE American Society of Heating, Refrigerating and Air-Conditioning Engineers: Atlanta, GR, USA, 1997; ISBN 1883413524. [Google Scholar]
- Rosiek, S.; Batlles, F.J. Shallow geothermal energy applied to a solar-assisted air-conditioning system in southern Spain: Two-year experience. Appl. Energy 2012, 100, 267–276. [Google Scholar] [CrossRef]
- Moss, R.W.; Henshall, P.; Arya, F.; Shire, G.S.F.; Hyde, T.; Eames, P.C. Performance and operational effectiveness of evacuated flat plate solar collectors compared with conventional thermal, PVT and PV panels. Appl. Energy 2018, 216, 588–601. [Google Scholar] [CrossRef]
- Prieto, C.; Rodríguez, A.; Patiño, D.; Cabeza, L.F. Thermal energy storage evaluation in direct steam generation solar plants. Sol. Energy 2018, 159, 501–509. [Google Scholar] [CrossRef]
- Corona, B.; de la Rúa, C.; San Miguel, G. Socio-economic and environmental effects of concentrated solar power in Spain: A multiregional input output analysis. Sol. Energy Mater. Sol. Cells 2016, 156, 112–121. [Google Scholar] [CrossRef]
- Lamnatou, C.; Notton, G.; Chemisana, D.; Cristofari, C. The environmental performance of a building-integrated solar thermal collector, based on multiple approaches and life-cycle impact assessment methodologies. Build. Environ. 2015, 87, 45–58. [Google Scholar] [CrossRef]
- Bellos, E.; Tzivanidis, C. Optimization of a Solar-Driven Trigeneration System with Nanofluid-Based Parabolic Trough Collectors. Energies 2017, 10, 848. [Google Scholar] [CrossRef]
- Bellos, E.; Tzivanidis, C.; Bellos, E.; Tzivanidis, C. Enhancing the Performance of Evacuated and Non-Evacuated Parabolic trough Collectors Using Twisted Tape Inserts, Perforated Plate Inserts and Internally Finned Absorber. Energies 2018, 11, 1129. [Google Scholar] [CrossRef]
- Calise, F.; Figaj, R.; Vanoli, L.; Calise, F.; Figaj, R.D.; Vanoli, L. Energy and Economic Analysis of Energy Savings Measures in a Swimming Pool Centre by Means of Dynamic Simulations. Energies 2018, 11, 2182. [Google Scholar] [CrossRef]
- Choudhury, B.; Saha, B.B.; Chatterjee, P.K.; Sarkar, J.P. An overview of developments in adsorption refrigeration systems towards a sustainable way of cooling. Appl. Energy 2013, 104, 554–567. [Google Scholar] [CrossRef]
- Márquez, J.A.; Bohórquez, M.M.; Melgar, S.G. A New Metre for Cheap, Quick, Reliable and Simple Thermal Transmittance (U-Value) Measurements in Buildings. Sensors 2017, 17, 9. [Google Scholar]
- Deconinck, A.-H.; Roels, S. Comparison of characterisation methods determining the thermal resistance of building components from onsite measurements. Energy Build. 2016, 130, 309–320. [Google Scholar] [CrossRef] [Green Version]
- International Organization for Standardization ISO/TC 163/SC 1 Test and Measurement Methods ISO 9869–1:2014—Thermal Insulation—Building Elements—In-Situ Measurement of Thermal Resistance and Thermal Transmittance. Part 1: Heat Flow Meter Method. Available online: https://www.iso.org/standard/59697.html (accessed on 13 November 2017).
- Gaspar, K.; Casals, M.; Gangolells, M. A comparison of standardized calculation methods for in situ measurements of façades U-value. Energy Build. 2016, 130, 592–599. [Google Scholar] [CrossRef]
- Albatici, R.; Tonelli, A.; Michela, C. A comprehensive experimental approach for the validation of quantitative infrared thermography in the evaluation of building thermal transmittance. Appl. Energy 2015, 141, 218–228. [Google Scholar] [CrossRef]
- Tinti, A.; Tarzia, A.; Passaro, A.; Angiuli, R. Thermographic analysis of polyurethane foams integrated with phase change materials designed for dynamic thermal insulation in refrigerated transport. Appl. Therm. Eng. 2014, 70, 201–210. [Google Scholar] [CrossRef]
- Theodosiou, T.; Tsikaloudaki, K.; Kontoleon, K.; Bikas, D. Thermal bridging analysis on cladding systems for building facades. Energy Build. 2015, 109, 377–384. [Google Scholar] [CrossRef]
- Sarbu, I.; Sebarchievici, C. Review of solar refrigeration and cooling systems. Energy Build. 2013, 67, 286–297. [Google Scholar] [CrossRef]
- Arce, P.; Medrano, M.; Gil, A.; Oró, E.; Cabeza, L.F. Overview of thermal energy storage (TES) potential energy savings and climate change mitigation in Spain and Europe. Appl. Energy 2011, 88, 2764–2774. [Google Scholar] [CrossRef]
- Balghouthi, M.; Chahbani, M.H.; Guizani, A. Investigation of a solar cooling installation in Tunisia. Appl. Energy 2012, 98, 138–148. [Google Scholar] [CrossRef]
- Neila González, J.; Bedoya Frutos, C. Técnicas Arquitectónicas y Constructivas de Acondicionamiento Ambiental; Editorial Munilla-Lería: Madrid, Spain, 1997; ISBN 9788489150201. [Google Scholar]
- Norma UNE-EN ISO 13790:2011. Energy Performance of Buildings. Calculation of Energy Use for Space Heating and Cooling. Available online: https://www.une.org/encuentra-tu-norma/busca-tu-norma/norma/?c=N0048301 (accessed on 1 October 2018).
- Dong, M.; Zhong, M.; Mo, T.-Z.; Yang, J.-Y.; Leng, Y.F.; Yang, L. Quantitative analysis on the effect of thermal bridges on energy consumption of residential buildings in hot summer and cold winter region. J. Civ. Archit. Environ. Eng. 2007, 2008, 5–8. [Google Scholar]
- Echarri, V.; Galiano, A.; Pérez-Millán, M.I.; González-Avilés, A.B. Conditioning systems by radiant surfaces: Comparative analysis of thermal ceramic panels versus the conventional systems in a museum. WIT Trans. Eng. Sci. 2014, 83, 287–301. [Google Scholar]
- Tahat, M.A.; Al-Hinai, H.; Probert, S.D. Performance of a low-energy-consumption house experiencing a Mediterranean climate. Appl. Energy 2002, 71, 1–13. [Google Scholar] [CrossRef]
- Marrasso, E.; Roselli, C.; Sasso, M.; Tariello, F.; Marrasso, E.; Roselli, C.; Sasso, M.; Tariello, F. Analysis of a Hybrid Solar-Assisted Trigeneration System. Energies 2016, 9, 705. [Google Scholar] [CrossRef]
- Saint, R.; Garnier, C.; Pomponi, F.; Currie, J.; Saint, R.M.; Garnier, C.; Pomponi, F.; Currie, J. Thermal Performance through Heat Retention in Integrated Collector-Storage Solar Water Heaters: A Review. Energies 2018, 11, 1615. [Google Scholar] [CrossRef]
- Bataineh, K.; Taamneh, Y. Review and recent improvements of solar sorption cooling systems. Energy Build. 2016, 128, 22–37. [Google Scholar] [CrossRef]
- Sancho, J.; Riesco, J.; Jiménez, C. Atlas de Radiación Solar en España Utilizando datos del SAF de Clima de EUMETSAT. Madrid, 2005. Available online: http://www.aemet.es/documentos/es/serviciosclimaticos/datosclimatologicos/atlas_radiacion_solar/atlas_de_radiacion_24042012.pdf (accessed on 14 September 2018).
- Velasco, A.; Jiménez García, S.; Guardo, A.; Fontanals, A.; Egusquiza, M. Assessment of the Use of Venetian Blinds as Solar Thermal Collectors in Double Skin Facades in Mediterranean Climates. Energies 2017, 10, 1825. [Google Scholar] [CrossRef]
- Aroca-Delgado, R.; Pérez-Alonso, J.; Callejón-Ferre, Á.J.; Velázquez-Martí, B. Compatibility between Crops and Solar Panels: An Overview from Shading Systems. Sustainability 2018, 10, 743. [Google Scholar] [CrossRef]
- Valančius, R.; Jurelionis, A.; Jonynas, R.; Katinas, V.; Perednis, E.; Valančius, R.; Jurelionis, A.; Jonynas, R.; Katinas, V.; Perednis, E. Analysis of Medium-Scale Solar Thermal Systems and Their Potential in Lithuania. Energies 2015, 8, 5725–5737. [Google Scholar] [CrossRef] [Green Version]
- Erdenedavaa, P.; Rosato, A.; Adiyabat, A.; Akisawa, A.; Sibilio, S.; Ciervo, A. Model Analysis of Solar Thermal System with the Effect of Dust Deposition on the Collectors. Energies 2018, 11, 1795. [Google Scholar] [CrossRef]
- Budea, S. Solar Air Collectors for Space Heating and Ventilation Applications—Performance and Case Studies under Romanian Climatic Conditions. Energies 2014, 7, 3781–3792. [Google Scholar] [CrossRef] [Green Version]
- Oregi, X.; Hernandez, P.; Gazulla, C.; Isasa, M. Integrating Simplified and Full Life Cycle Approaches in Decision Making for Building Energy Refurbishment: Benefits and Barriers. Buildings 2015, 5, 354–380. [Google Scholar] [CrossRef] [Green Version]
- ELCD Database. Available online: www.eplca.jcr.ec.europa.eu/ELCD3/index.xhtml;jsession id=9FC03F3B6A0A5F8252F667E462DF467C (accessed on 27 August 2018).
- IDAE. Informe de Precios Energéticos Regulados. Julio 2017. Available online: http://www.idae.es/sites/default/files/estudios_informes_y_estadisticas/tarifas_reguladas_julio_2017.pdf (accessed on 3 September 2018).
- Mahmud, M.; Huda, N.; Farjana, S.; Lang, C.; Mahmud, M.A.P.; Huda, N.; Farjana, S.H.; Lang, C. Environmental Impacts of Solar-Photovoltaic and Solar-Thermal Systems with Life-Cycle Assessment. Energies 2018, 11, 2346. [Google Scholar] [CrossRef]


| PPR Capillary Tube Mats | Thick PER Tubes | |||
|---|---|---|---|---|
| Tube diameter, mm | 3.4 | 20 | ||
| Gap between tubes, mm | 10 | 150 | ||
| Thickness of tubes, mm | 0.55 | 2 | ||
| Water content, l/m2 | 0.39 | 1.70 | ||
| Mat length, m | 2 | 4 | 2 | 4 |
| Water flow ΔT = 3 °C | 40 | 80 | 40 | 80 |
| Load los, mH2O | 0.2 | 0.55 | 0.03 | 0.12 |
| Water speed, m/s | 0.27 | 0.53 | 0.06 | 0.13 |
| No. of Reynolds | 540 | 1080 | 910 | 1820 |
| Field Devices (Indoor and/or Outdoor) | Building (Alicante) |
|---|---|
| Temperature-humidity sensor for outdoor environment | 1 |
| Temperature-humidity sensor for indoor environment | 1 |
| Interstitial temperature-humidity sensor | 2 |
| Solar radiation sensor | 2 |
| Air velocity sensor | 1 |
| Temperature sensor | 23 |
| TOTAL | 30 |
| Key | Measure | Unit |
|---|---|---|
| N1 | Temperature | °C |
| N2 | Temperature and humidity | °C, % |
| N3 | Temperature | °C |
| N4 | Temperature | °C |
| N5 | Temperature | °C |
| TE-HE | Outdoor temperature and humidity | °C, % |
| Ti-Hi | Indoor temperature and humidity | °C, % |
| An | Airspeed | m/s |
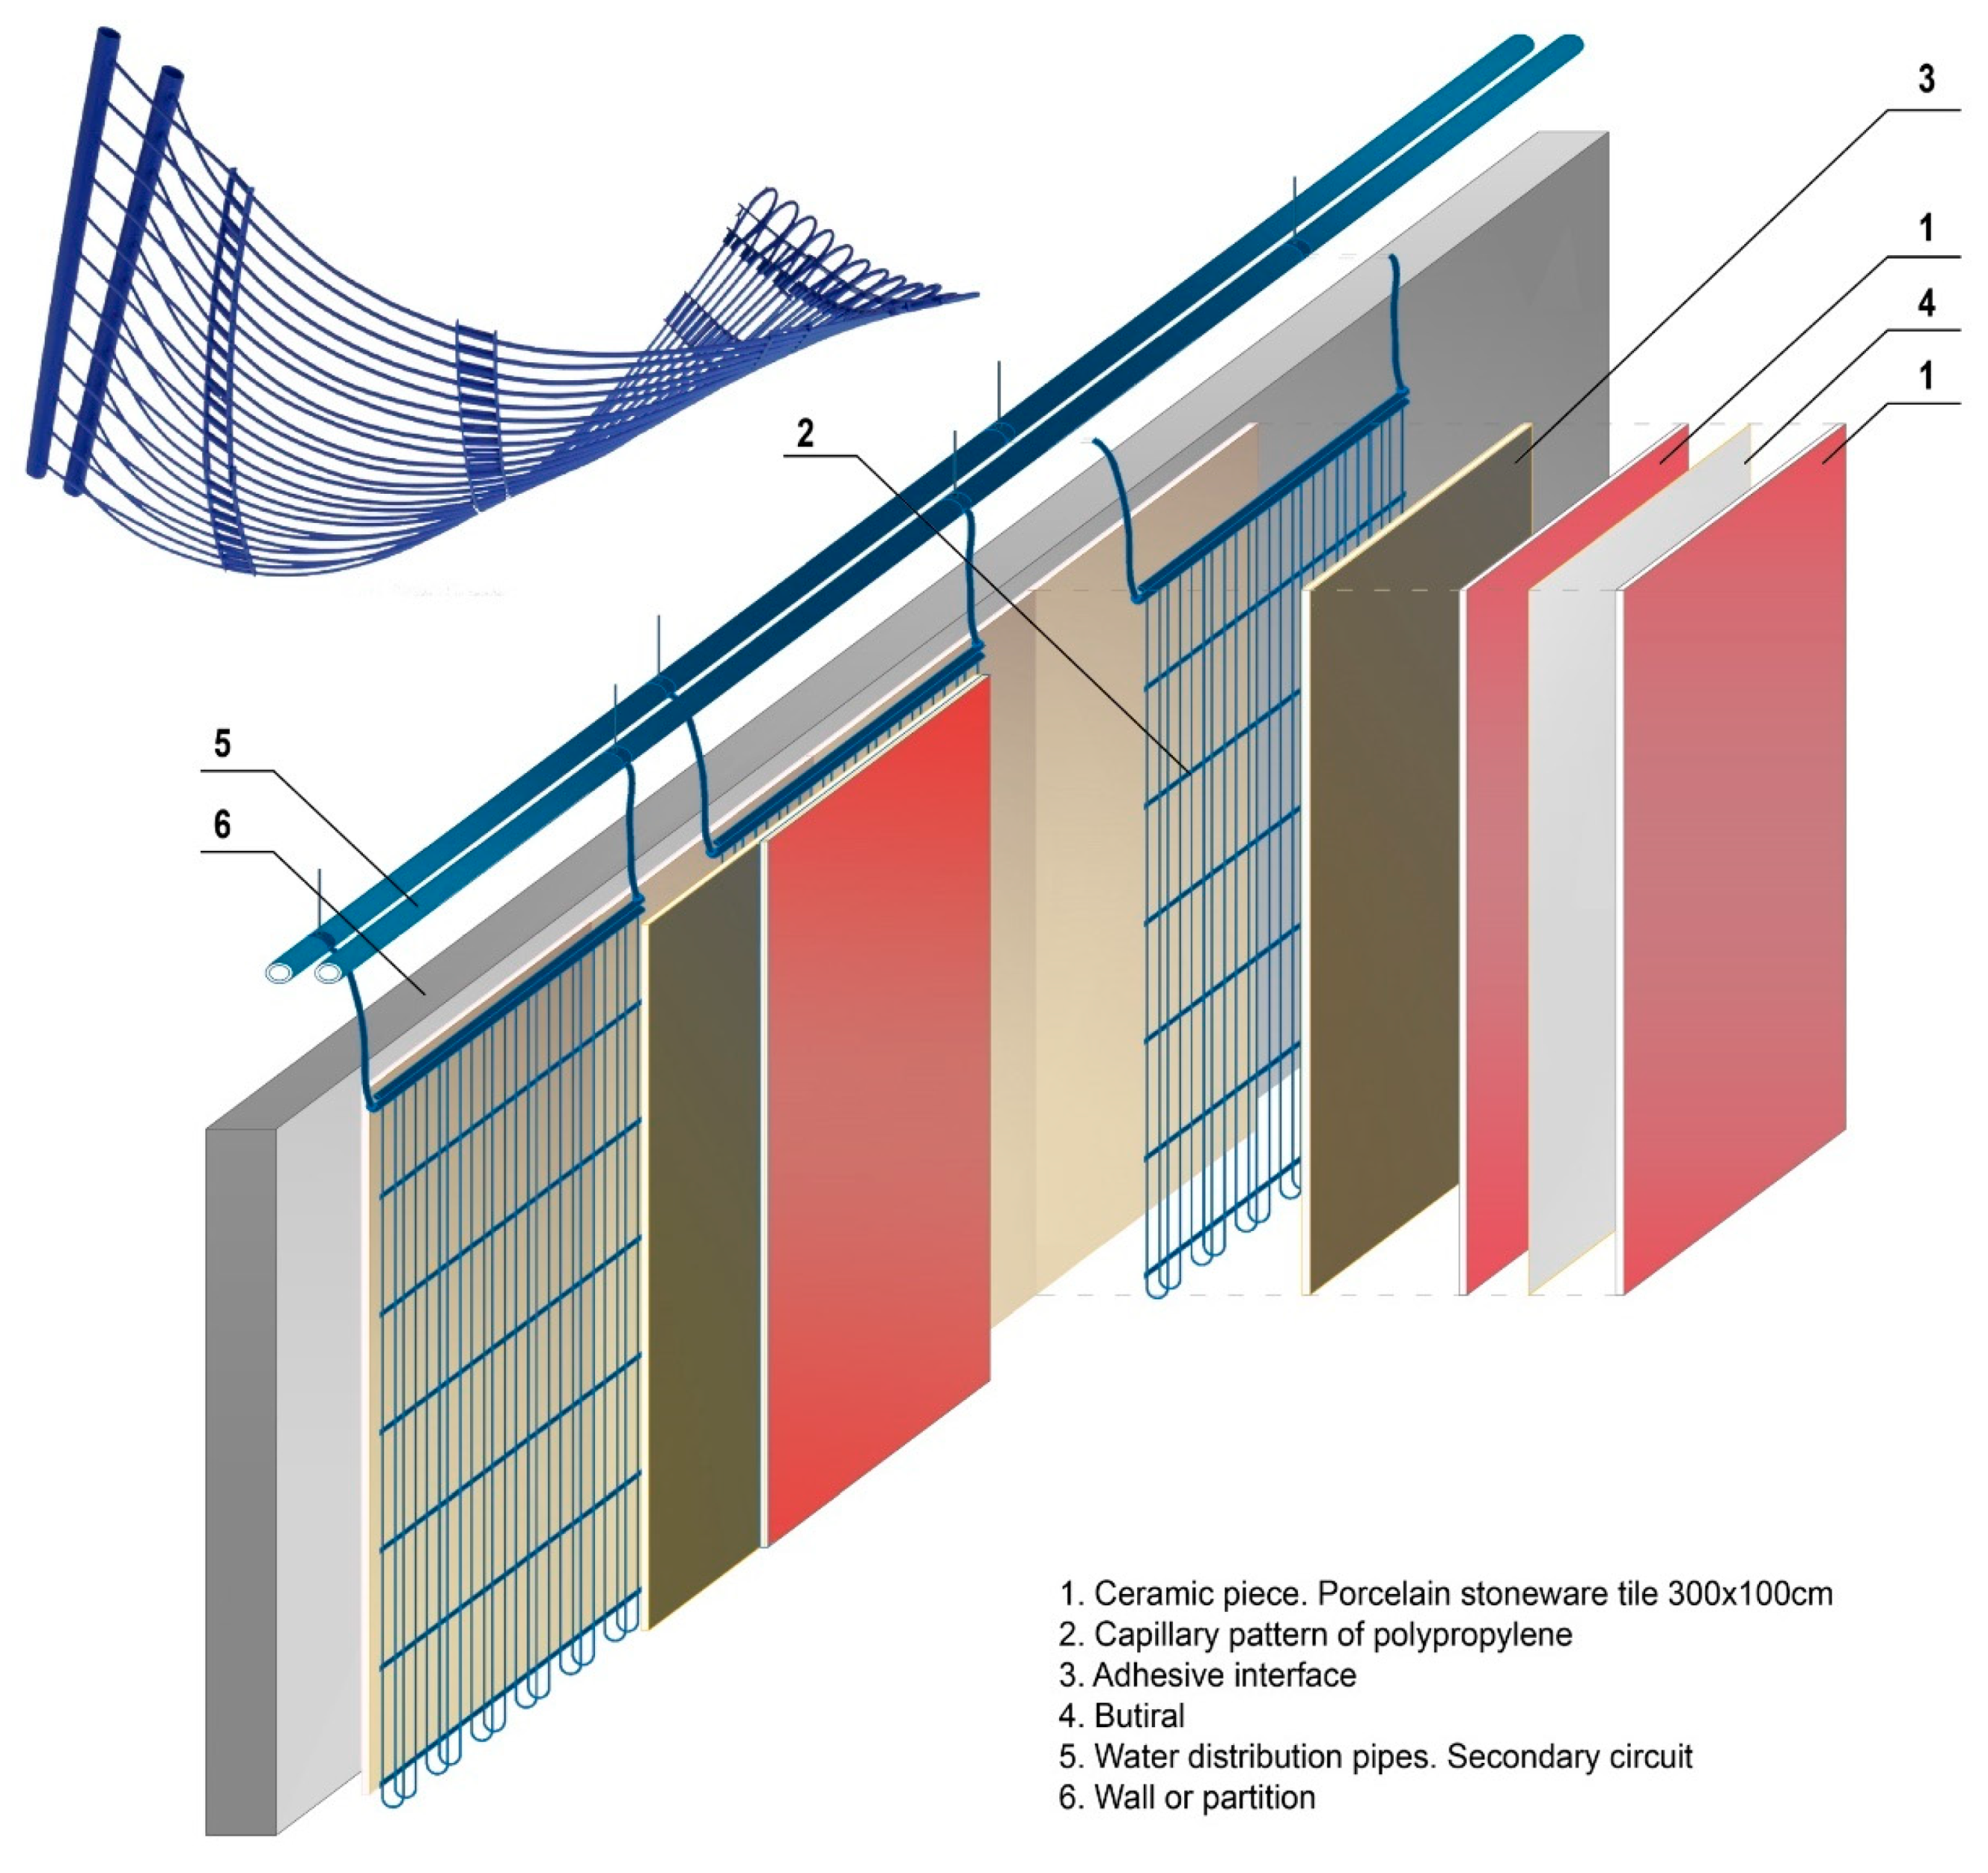
| No. | Materials | Thickness (cm) |
|---|---|---|
| 1 | Gypsum plaster | 1.0 |
| 2 | Hollow ceramic brick | 11.5 |
| 3 | Perforated ceramic brick | 11.5 |
| 4 | Polyutherane foam | 3.0 |
| 5 | Structural support. Metallic structure | 10.0 |
| 6 | Ventilated air chamber | 7.0 |
| 7 | Porcelain stoneware | 1.0 |
| 8 | Marble paving | 2.0 |
| 9 | Grip mortar | 2.0 |
| 10 | Base mortar layer | 4.0 |
| 11 | Anti-impact coating | 0.3 |
| 12 | Reinforced concrete slabs | 30.0 |
| 13 | Plaster coat | 1.5 |
| Fourier UNE | Fourier Mathis TCi | Monitoring C1 | Monitoring C2 | |
|---|---|---|---|---|
| U (W/m2°C) | 0.437 | 0.497 | 0.526 | 0.545 |
| v m/s | hc W/°C | Tp °C | Ta °C | hr W/m2°C | Trm °C | qcvi W | qrdi W | Total W | ||
|---|---|---|---|---|---|---|---|---|---|---|
| Summer | OP 1 | 0.160 | 9.081 | 30.00 | 23.37 | 4.70 | 24.70 | 60.20 | 24.91 | 85.11 |
| OP 2 | 0.050 | 6.875 | 30.00 | 25.48 | 4.70 | 20.18 | 31.08 | 51.54 | 82.53 | |
| Winter | OP 1 | 0.192 | 9.495 | 30.00 | 23.11 | 4.70 | 21.45 | 65.42 | 40.18 | 105.60 |
| OP 2 | 0.070 | 7.450 | 30.00 | 21.61 | 4.70 | 23.75 | 53.56 | 29.38 | 82.94 |
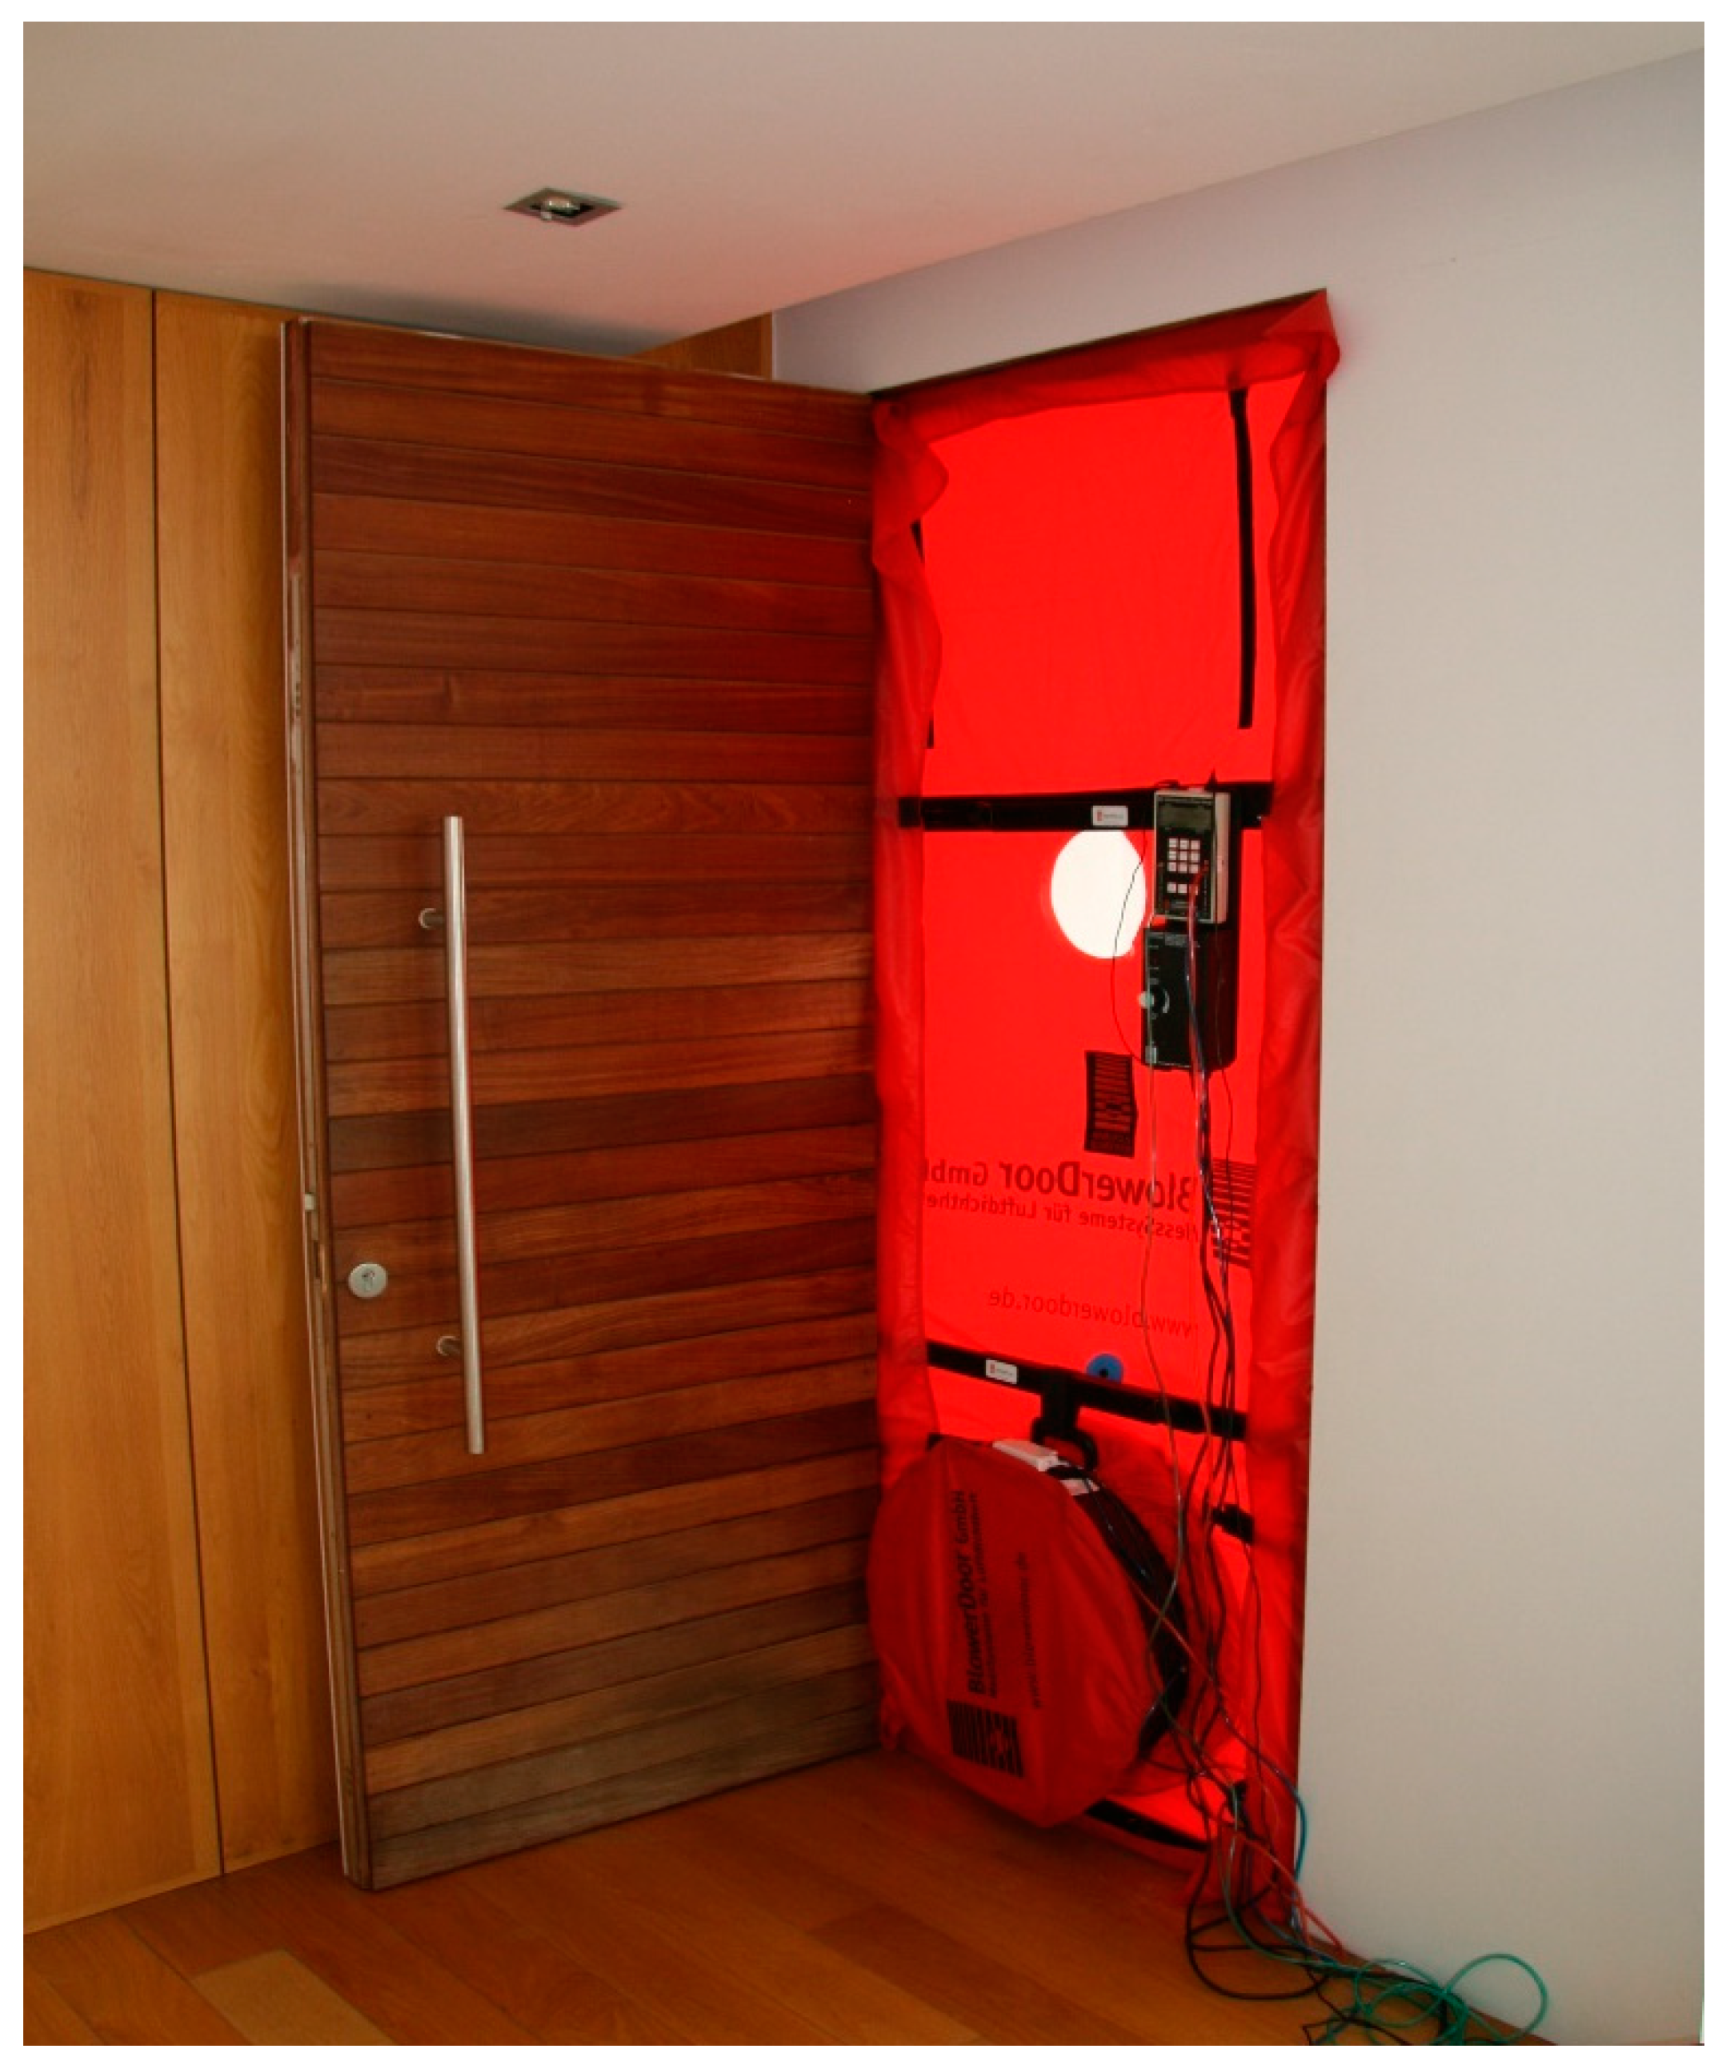
| n50 | Total | Only Enclosure | nwinter | nsummer | |
|---|---|---|---|---|---|
| Depressurization | 3.10 | 2.81 | |||
| Pressurization | 3.19 | 2.97 | |||
| Mean value | 2.88 acH | 3.15 | 2.88 | 0.314 acH | 0.314 acH |
| OP 1 | OP 2 | OP 3 | |
|---|---|---|---|
| Summer Energy Demand, kWh/m2 | 50.64 | 33.91 | 15.29 |
| Winter Energy Demand, kWh/m2 | 35.19 | 24.90 | 11.77 |
| Annual Energy Demand, kWh/m2 | 85.83 | 58.81 | 27.06 |
| Annual CO2 Emissions in Use Stage | 3198.96 kg | 2191.32 kg | 1008.18 kg |
| Percentage | 100.00% | 68.52% | 31.53% |
| Month | No. of Days | Direct Irradiance (kWh/m2 day) | Diffuse Irradiance (kWh/m2 day) | Direct Energy per Month (kWh/m2) | Diffuse Energy per Month (kWh/m2) | Total Energy per Month (kWh/m2) |
|---|---|---|---|---|---|---|
| January | 31 | 1.66 | 0.95 | 51.46 | 29.45 | 80.91 |
| February | 28 | 2.31 | 1.18 | 64.68 | 33.04 | 97.72 |
| March | 31 | 3.03 | 1.67 | 93.93 | 51.77 | 145.7 |
| April | 30 | 4.30 | 1.83 | 129 | 54.9 | 183.9 |
| May | 31 | 4.65 | 2.26 | 144.15 | 70.06 | 214.21 |
| June | 30 | 5.40 | 2.25 | 162 | 67.5 | 229.5 |
| July | 31 | 5.56 | 2.17 | 172.36 | 67.27 | 239.63 |
| August | 31 | 4.65 | 2.17 | 144.15 | 67.27 | 211.42 |
| September | 30 | 3.79 | 1.66 | 113.7 | 49.8 | 163.5 |
| October | 31 | 2.69 | 1.30 | 83.39 | 40.3 | 123.69 |
| November | 30 | 1.84 | 0.97 | 55.2 | 29.1 | 84.3 |
| December | 31 | 1.44 | 0.83 | 44.64 | 25.73 | 70.37 |
| Annual radiation | 1258.66 | 586.19 | 1844.85 |
| SUMMER from 1 May to 30 November WINTER from 1 December to 30 April Occupation: 4 PEOPLE | Unit | OP 1 All-Air System | OP 2 Walls TCP | OP 3 Walls TCP with Solar Panels | |
|---|---|---|---|---|---|
| 1 | Effective Area | m2 | 137.90 | 137.90 | 137.90 |
| 2 | Ceramic panels area | m2 | 72.5 | 72.5 | |
| 3 | Maximum thermal load | W/m2 | 80 | 75 | 75 |
| 4 | Minimum fresh air flow rate | m3/m2 h | 1.70 | 1.70 | 1.70 |
| 5 | Thermal jump of the water in summer | k | 6 | 3 | 3 |
| 6 | System running time | h/year | 2160 | 2160 | 2160 |
| Ventilation | |||||
| 7 | Supply air flow rate | m3/hm2 | 16.52 | 2.31 | 2.31 |
| 8 | Supply air volume | m3/h | 1.185 | 182 | 182 |
| 9 | Fan power | kW | 0.65 | 0.15 | 0.15 |
| 10 | Power consumption | MWh/year | 2.31 | 0.51 | 0.51 |
| Cooling pump | |||||
| 11 | Water flow rate | l/m2 h | 10.70 | 21.5 | 21.5 |
| 12 | Volume of water | l/h | 1475 | 2965 | 2965 |
| 13 | Power | kW | 0.10 | 0.25 | 0.25 |
| 14 | Power consumption | MWh/year | 0.22 | 0.43 | 0.43 |
| Fans and pumps | |||||
| 15 | Power consumption | MWh/year | 2.53 | 0.94 | 0.94 |
| 16 | Comparison | % | 100% | 37.3% | 37.3% |
| Fan-Coils Dehumidifiers | |||||
| 17 | Power | kW | 1.85 | 1.85 | |
| 18 | Power Consumption | MWh/year | 2.35 | 2.35 | |
| Cooling system | |||||
| 19 | Emission power | W/m2 | 85 | 69 | 69 |
| 20 | Power | kW | 8.87 | 6.34 | 6.34 |
| 21 | Summer power consumption | MWh/year | 3.83 | 2.09 | 2.09 |
| Heating system | |||||
| 22 | Power | kW | 8.07 | 6.75 | 6.75 |
| 23 | Winter power consumption | MWh/year | 2.90 | 1.81 | 1.81 |
| 24 | Solar energy supply | MWh/year | –4.642 | ||
| Circulators of water to the system | |||||
| 25 | Power | kW | 0.12 | ||
| 26 | Power consumption | MWh/year | 0.26 | ||
| 27 | Annual power consumption | MWh/year | 11.848 | 8.116 | 3.734 |
| Comparison | % | 100% | 68.53% | 22.52% |
| Investments and Pay-Back Periods | Unit | OP 1 | OP 2 | OP 3 |
|---|---|---|---|---|
| All-air installation with heat pump | € | 19,820 | ||
| Capillary tubing weft with TCP panels | € | 31,317 | 40,354 | |
| Annual energy consumption | kWh/year | 11,848 | 8116 | 3734 |
| Annual savings | € | 493 | 578 | |
| Amortization period | years | 23.31 | 15.67 |
© 2018 by the authors. Licensee MDPI, Basel, Switzerland. This article is an open access article distributed under the terms and conditions of the Creative Commons Attribution (CC BY) license (http://creativecommons.org/licenses/by/4.0/).
Share and Cite
Echarri-Iribarren, V.; Rizo-Maestre, C.; Echarri-Iribarren, F. Healthy Climate and Energy Savings: Using Thermal Ceramic Panels and Solar Thermal Panels in Mediterranean Housing Blocks. Energies 2018, 11, 2707. https://0-doi-org.brum.beds.ac.uk/10.3390/en11102707
Echarri-Iribarren V, Rizo-Maestre C, Echarri-Iribarren F. Healthy Climate and Energy Savings: Using Thermal Ceramic Panels and Solar Thermal Panels in Mediterranean Housing Blocks. Energies. 2018; 11(10):2707. https://0-doi-org.brum.beds.ac.uk/10.3390/en11102707
Chicago/Turabian StyleEcharri-Iribarren, Víctor, Carlos Rizo-Maestre, and Fernando Echarri-Iribarren. 2018. "Healthy Climate and Energy Savings: Using Thermal Ceramic Panels and Solar Thermal Panels in Mediterranean Housing Blocks" Energies 11, no. 10: 2707. https://0-doi-org.brum.beds.ac.uk/10.3390/en11102707