Analysis of the Electric Bus Autonomy Depending on the Atmospheric Conditions


Department of Automotive Engineering and Transports, Technical University of Cluj-Napoca, Cluj-Napoca 400001, Romania
*
Authors to whom correspondence should be addressed.
Energies 2019, 12(23), 4535; https://0-doi-org.brum.beds.ac.uk/10.3390/en12234535
Submission received: 4 November 2019
/
Revised: 24 November 2019
/
Accepted: 27 November 2019
/
Published: 28 November 2019
(This article belongs to the Special Issue Energy Storage Systems for Electric Vehicles)
Abstract
:The public-transport sector represents, on a global level, a major ecological and economic concern. Improving air quality and reducing greenhouse gas (GHG) production in the urban environment can be achieved by using electric buses instead of those operating with internal combustion engines (ICE). In this paper, the energy consumption for a fleet of electric buses Solaris Urbino 12e type is analyzed, based on the experimental data taken from a number of 22 buses, which operate on a number of eight urban lines, on a route of approximately 100 km from the city of Cluj-Napoca, Romania; consumption was monitored for 12 consecutive months (July 2018–June 2019). The energy efficiency of the model for the studied electric buses depends largely on the management of the energy stored on the electric bus battery system, in relation to the characteristics of the route traveled, respectively to the atmospheric conditions during the monitored period. Based on the collected experimental data and on the technical characteristics of the electric buses, the influence of the atmospheric conditions on their energy balance was highlighted, considering the interdependence relations between the considered atmospheric conditions.
1. Introduction
Urban public transport plays a very important role in society, as it is the current means of transport serving a significant number of people every day. The sustainable tendency of urban mobility is to transport as many people daily as possible, with ecological, nonpolluting means of transport, which will have a direct effect not only on the reduction of the greenhouse gases (GHG), but also on the reduction of the environmental noise, traffic congestion, and the infrastructure vibration due to the vehicles equipped with internal combustion engines (ICE).
Most electric vehicles adopt AC motors due to their higher reliability and longer service life. Various electric motors and batteries used in electric vehicles are still subject to research, and innovative strategies are explored to compete with thermal-engine technology [1].
Due to the tendency of the big cities agglomeration, there is a need to increase the number of buses in the public transport fleets, and if the bus fleet is not renewed with environmentally friendly, nonpolluting means of public transport, it will result an increase of the environmental pollution (chemical and acoustic) that would affect the health of the population. Also, by renewing the bus fleet park of the public transport companies, the aim is to encourage the use of the environmentally friendly, nonpolluting means of transport, to the detriment of using personal cars in urban traffic.
In [2], Grijalva et al. noted that a bus used at the nominal occupancy level could replace up to 40 personal cars from urban traffic.
Regarding the problems mentioned above, the main solution for eliminating them is to replace the classic buses equipped with ICE with silent and nonpolluting electric buses.
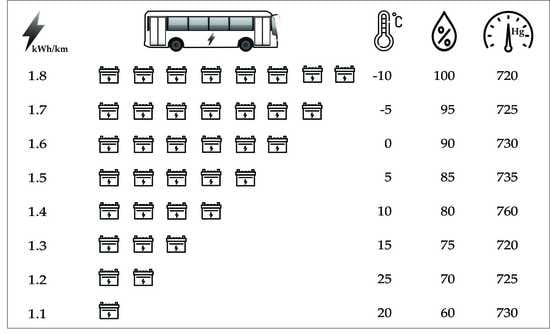
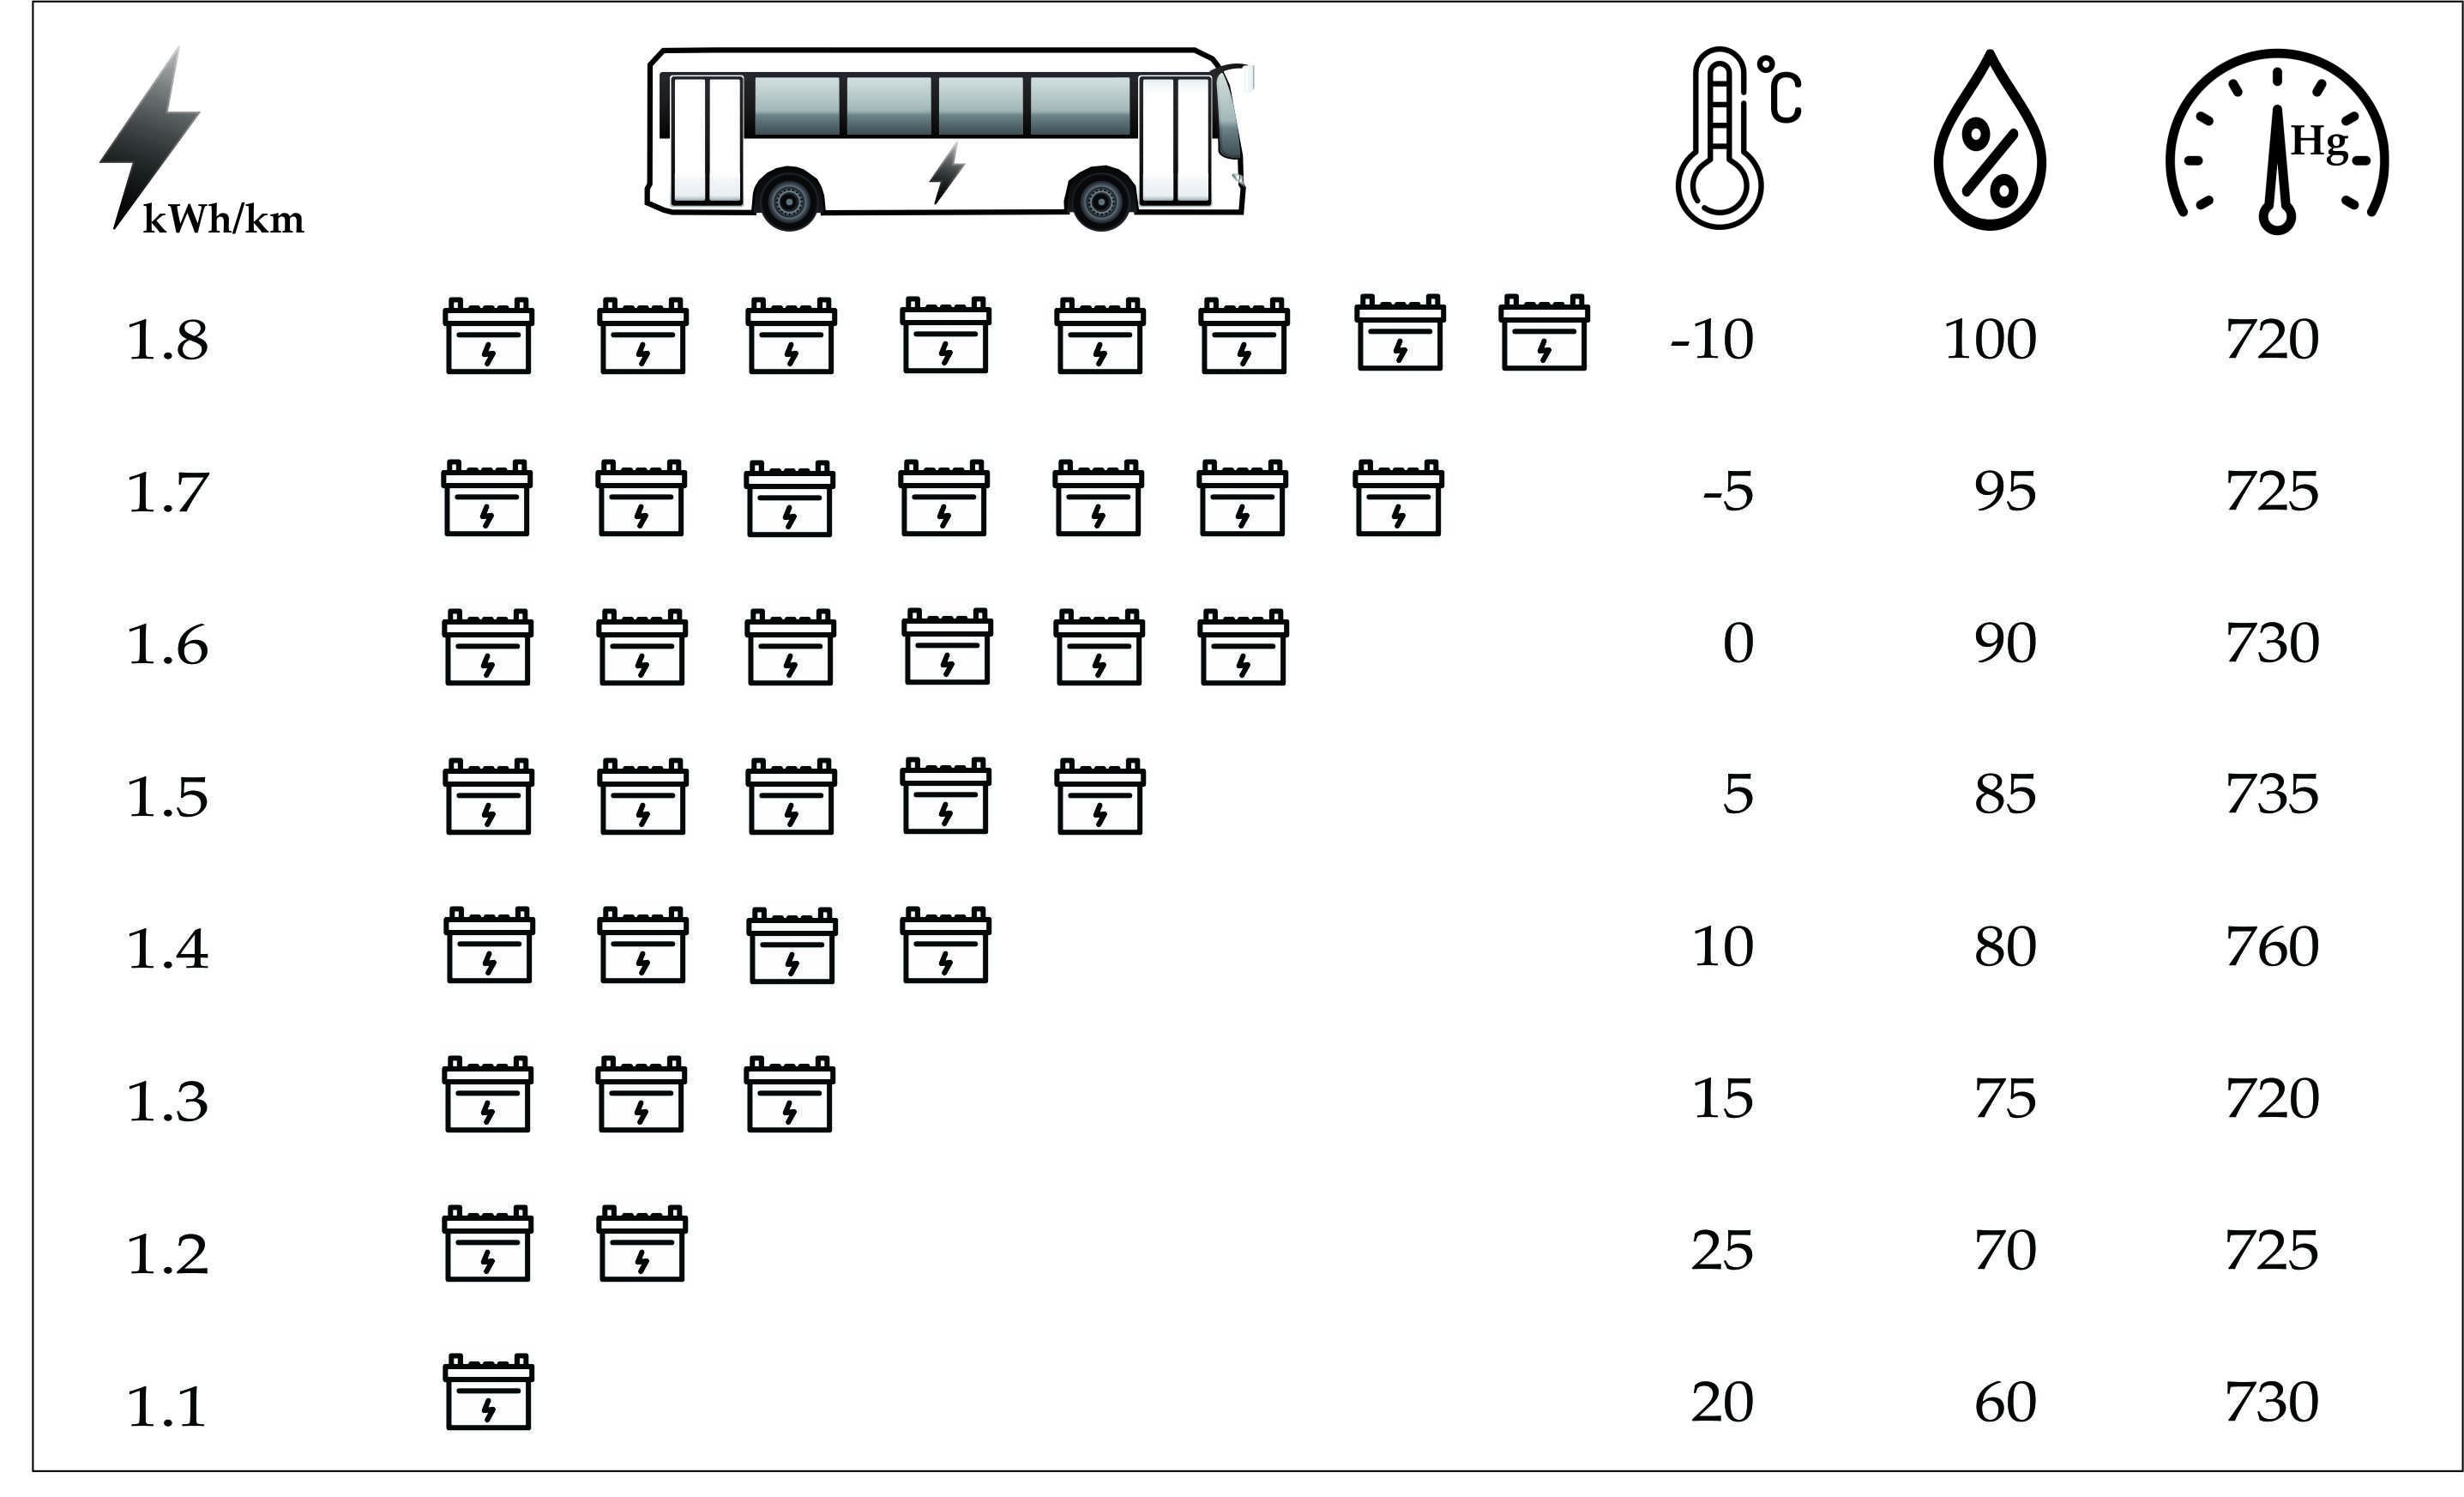
However, this solution has two major drawbacks: the high purchase price of an electric bus (which can be double compared to a classic bus with the same capacity [3], but which can be compensated by accessing European non-reimbursable funds [4]), respectively the autonomy of the electric bus, which depends on the capacity of the batteries that equip this bus and on the charging strategy (fast charging between buses route, respectively slow charging overnight) [5]. Because the batteries are the most expensive elements of an electric bus [6,7] and also have a considerable mass (between 1500 and 3000 kg) [8,9], the energy store in them must to be used to the maximum. The energy consumption for the electric bus varies according to a large number of parameters (the technology used in the construction of the electric bus, the experience of the driver, the traffic conditions, atmospheric conditions, the altitude profile of the route, the degree of the boarded passengers, etc.) between 1.0 and 3.5 kWh/km [10,11,12,13,14].
The batteries of the electric buses are recyclable, and their major advantage is the operational costs with electricity that is much cheaper than conventional fuels [3], respectively the maintenance costs that practically do not exist for a period of up to 10 years [15]. The most important feature of a battery pack is to store a maximum amount of energy in a volume and at a minimum mass, in order to ensure the maximum autonomy [16].
In [17], Demircali et al. studied a virtual model for a battery of an electric vehicle, directly dependent on the ambient temperature, showing that, with the increase or decrease of this temperature, the energy stored in the battery is changed.
The energy consumption for the electric vehicles is influenced by the atmospheric conditions, not only from the point of view of the direct influence on the storage capacity of the batteries, but also from the point of view of the increase of the energy consumption due to the supply of the auxiliary systems (heating, ventilation, and air-conditioning in the vehicle), as demonstrated by Iora et al., in [18].
In [5], Vepsäläinen et al. showed that the optimal energy consumption of an electric bus takes place at an ambient temperature of 20 °C. However, the studies of Qian et al. [19] showed that ambient temperature plays an important role in the battery life of an electric vehicle and, therefore, implicitly on the energy storage capacity. Thus, the increase or decrease in ambient temperature above certain thresholds lead to the more frequent use of cooling or heating, resulting in premature aging of the battery and the reduction of its storage capacity.
In different climatic zones, the ambient temperature can directly influence the efficiency of an electric vehicle, having the effect of increasing the energy consumption due to the use of air-conditioning systems for cooling or heating [10,20,21,22,23,24,25]. In [24], Yuksel et al. showed, by analyzing the energy consumption according to the ambient temperature during more than 7000 trips in six regions of the US, that the energy consumption for extreme values of the ambient temperature can be doubled (–30 °C to +40 °C), but it is kept at optimum values for a thermal regime between +17 and +27 °C.
Zhu et al. [26] showed that, under extreme temperature conditions (–30 °C to +40 °C), the energy efficiency of the electric bus batteries is low and, at the same time, the degradation of the battery characteristics is accelerated. These authors demonstrate the importance of the thermal management of the batteries which, regardless of the atmospheric conditions, must ensure an optimum temperature on the surface of the batteries around +30 °C.
The studies conducted by Jardin et al. in [27] showed that the optimum operating temperature for an electric bus based on energy consumption (kWh/km) is in the range between +20 and +25 °C, the maximum consumption being at low ambient temperatures.
The main objective of this work is to highlight the energy consumption and, respectively, the energy recovered for a fleet of 22 electric buses, Solaris Urbino 12e type, which operate on eight urban lines, on a route about 100 km from the city Cluj-Napoca, Romania. The consumption was monitored for 12 consecutive months (July 2018–June 2019). The temperate climate that characterizes most of the cities located in the continental area of Europe implies the existence of four seasons with extreme differences of environment temperatures (from –30 °C in the winter months and up to +40 °C in the summer months) [28,29,30], differences that can have a significant impact on the electric buses autonomy.
2. Materials and Methods
2.1. Electric Bus Model
2.1.1. Electric Bus Model Data
Electric buses use electric propulsion based on an electric motor powered by rechargeable batteries via a voltage inverter. The battery-charging strategy involves the use of slow-charging stations (overnight), with a power of 40 kW and a full battery life between 4 and 6 hours, respectively, fast-charging stations (between races) with a power of 230 kW, and a charging time to ensure the autonomy required for a 10 to 20 minute ride [13].
2.1.2. Battery Pack Data
The battery pack acts as a chemical storage unit for the electricity required to operate the motors that provide the bus propulsion. At the same time, the energy from the batteries must supply the auxiliary systems (cooling, heating, ventilation, lights, multimedia, telematics, etc.) under extreme ambient temperature values, ranging from –30 °C to +40 °C.
The basic unit of the battery pack is the cell. A number of “n” cells arranged in a series-parallel grouping form a module [32,33]. In the present case, for the studied Solaris Urbino 12e buses, the standard battery pack consists of eight modules interconnected in parallel that provide the nominal voltage of 690 Vcc at the terminals of the battery pack and which is applied as the input voltage to the system of the voltage inverter. The inverter converts the direct current (DC) voltage into a three-phase alternating current (AC) voltage (3 × 380 Vac) which supplies the electric propulsion motors. To increase the autonomy, the electric buses are powered by a system of 3 to 6 battery packs, connected in parallel, to increase the value of the current and thus of the stored energy [34].
The Li4Ti5O12 (LTO) batteries that equip the electric buses (Figure 2) are batteries with superior thermal stability, high energy storage capacity in cells, and a high lifespan (expressed through charge–discharge cycles) [9,35]. LTO batteries have the following advantages: operating safety, longevity, performance, and power density, but have a low energy density and are expensive [36].
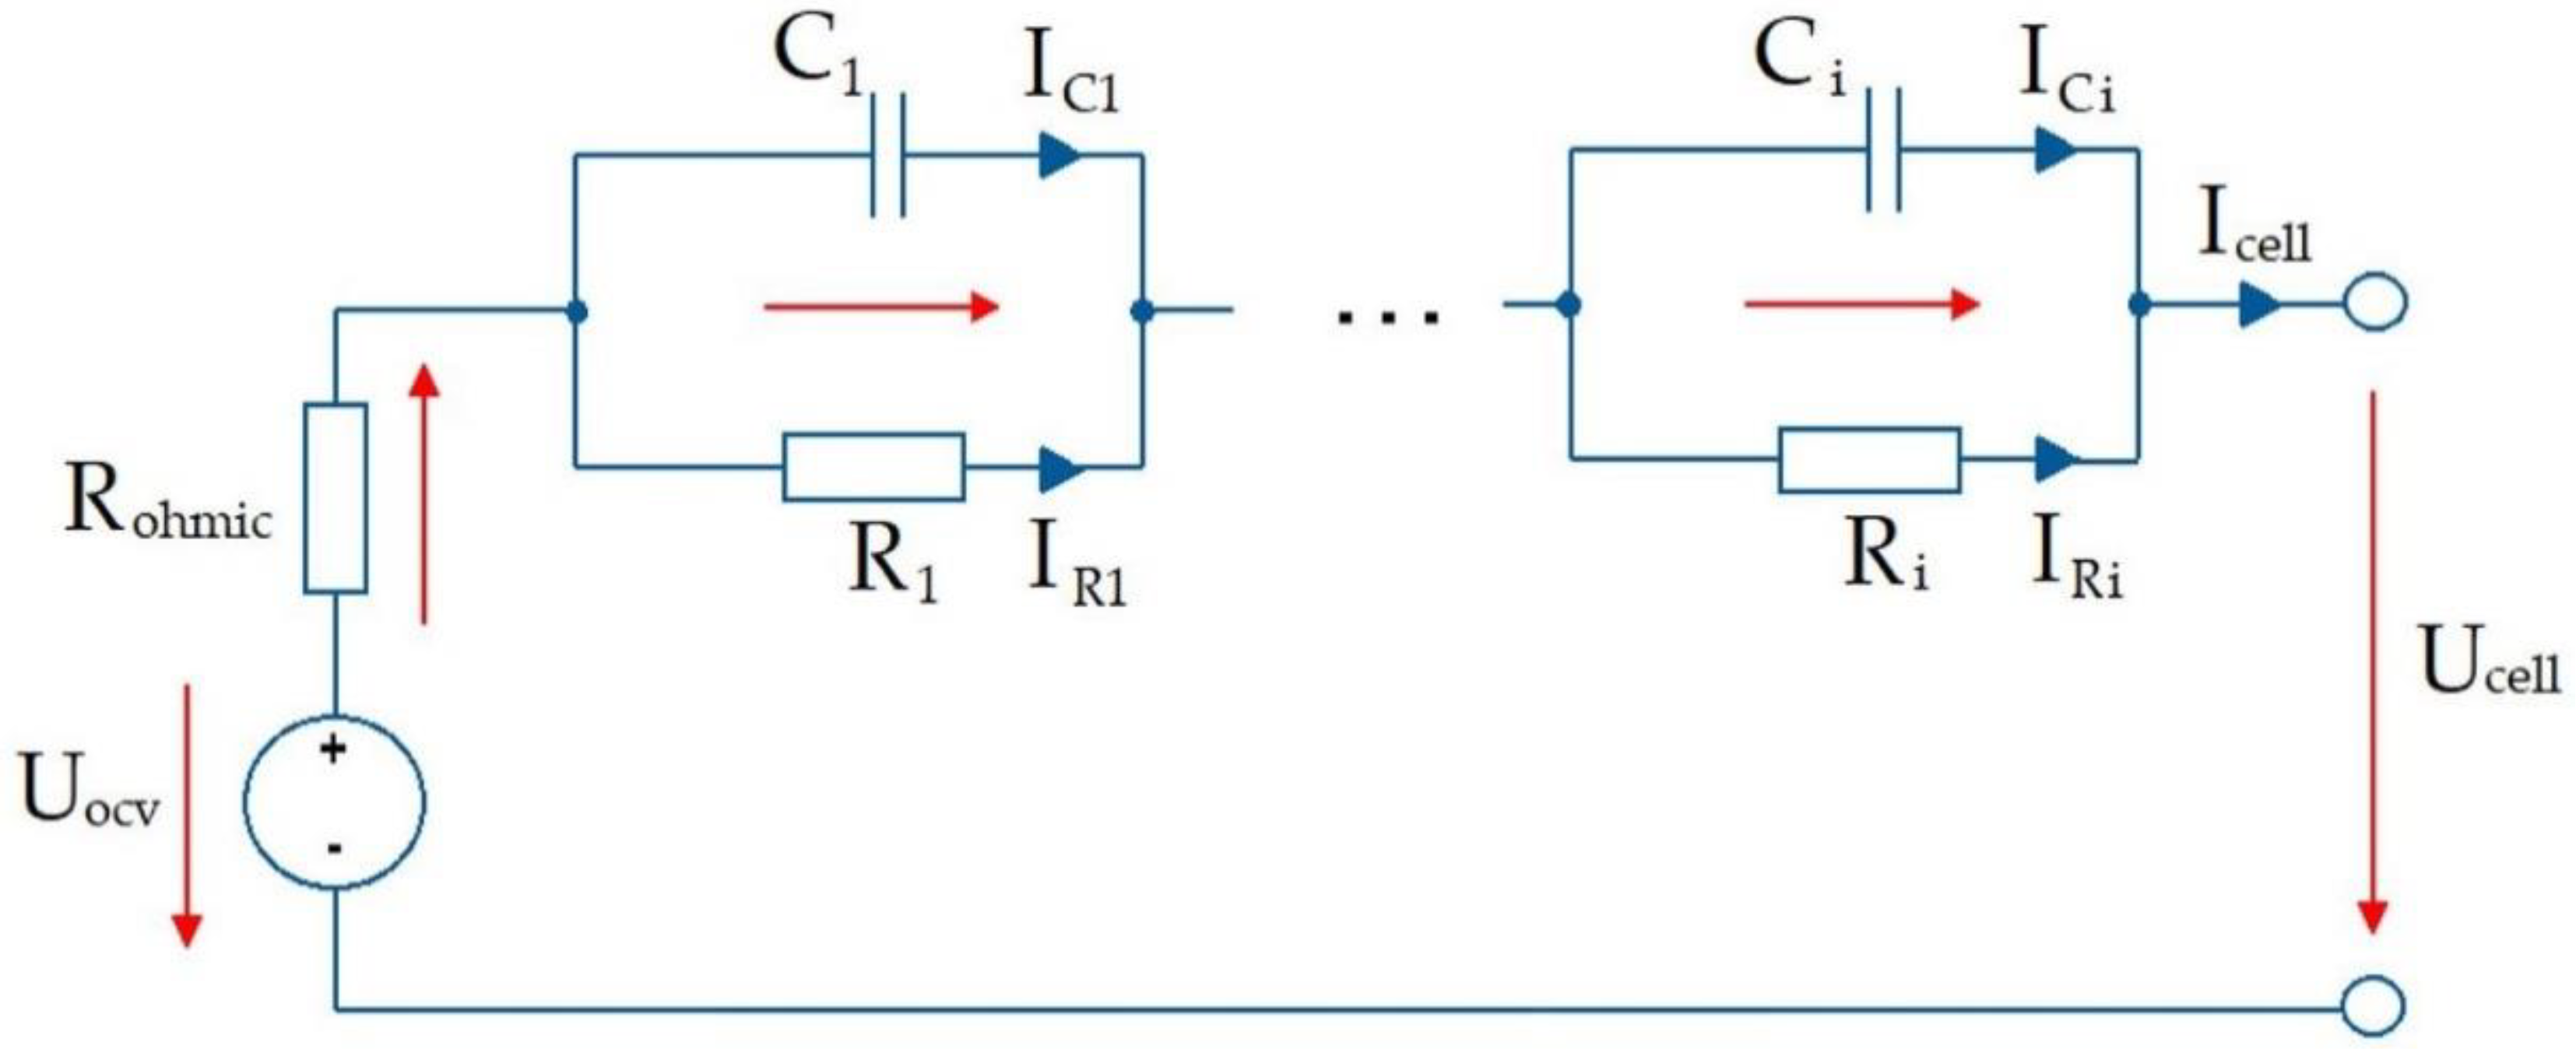
The virtual model for the basic cell of the battery pack is shown in Figure 3, and, based on this model, the electrical equations that describe the characteristics of cells, modules, and of the battery packs were formulated [34,37,38,39,40,41,42].
The voltage at the terminals of a cell (Ucell) is calculated with the following equation [38]:
where Uocv (V) is the voltage of the open circuit of the open-circuit voltage cell (OCV), Icell (A) is the current at the cell terminals, Rohmic (Ω) is the internal resistance of the cell, Qi (W) is the load capacity of the cell, and Ci (F) is the capacity of the cell capacitor.
The load capacity of the cell is expressed by the following equation [38]:
where ICi (A) is the current through the cell capacitor, and Ri (Ω) is the resistance of each resistor–capacitor (RC) element of the cell.
The electrical voltage at the terminals of a battery module (Umodule) is calculated according to the number of cells connected in series (nseries), using the following relation:
The electric current at the terminals of a battery module (Imodule) is calculated according to the number of cells connected in parallel (nparallel), using the following relation:
The state of charge (SOC) of a battery module Qmodule (%) is calculated based on the number of cells and on the charge level of each cell Qcell (%), respectively, on the number of cells connected in parallel (nparallel), using the following relation [38]:
where Qmax (%) is the maximum loading degree of each RC element of the cell.
The power of a battery module Pmodule (W) is calculated according to the number of cells and to the power of each cell Pcell (W), respectively, according to the number of cells connected in series (nseries), using the following relationship:
The lost power of a battery module (Ploss, module (W)) is calculated using the following relation:
Instant charge of the battery is given by the following relation, based on the Coulomb-Counting algorithm [43]:
where Q0 is the initial battery charging status, and Ibatt (A) is the current at the battery.
Similarly, depth of discharge (DOD) of the battery is expressed as a percentage of total capacity consumed [43]:
2.1.3. Electric Machine
Electric buses are powered by an electric motor, asynchronous motor (ASM) type, which operates in electric-motor mode, consuming battery power, or in generator mode, recovering the energy when descending slopes or in particular braking situations. The operating characteristic of the electric propulsion system is described by the motor torque diagram vs. speed, for all the possible traction regimes (Figure 5) [38,46,47].
The torque of the electric motor is maximum from the start and remains constant until it reaches a constant speed corresponding to the cruise speed. The power of the electric motor increases linearly until maximum, and then it descends simultaneously with the decrease of the motor torque (Figure 6) [48,49].
Regenerative braking involves the partial recovery of the kinetic energy and the storage of this energy in the battery to increase the range of the electric buses. During the regenerative braking, the electric motor turns into a generator and charges the batteries. The kinetic energy of the electric buses depends on their mass and speed, but only half of this energy, at most, can be recovered, and this depends on the generator’s ability to produce electricity, respectively, on the battery’s charging capacity [50,51].
2.2. Environment Model
2.2.1. Ambient Temperature
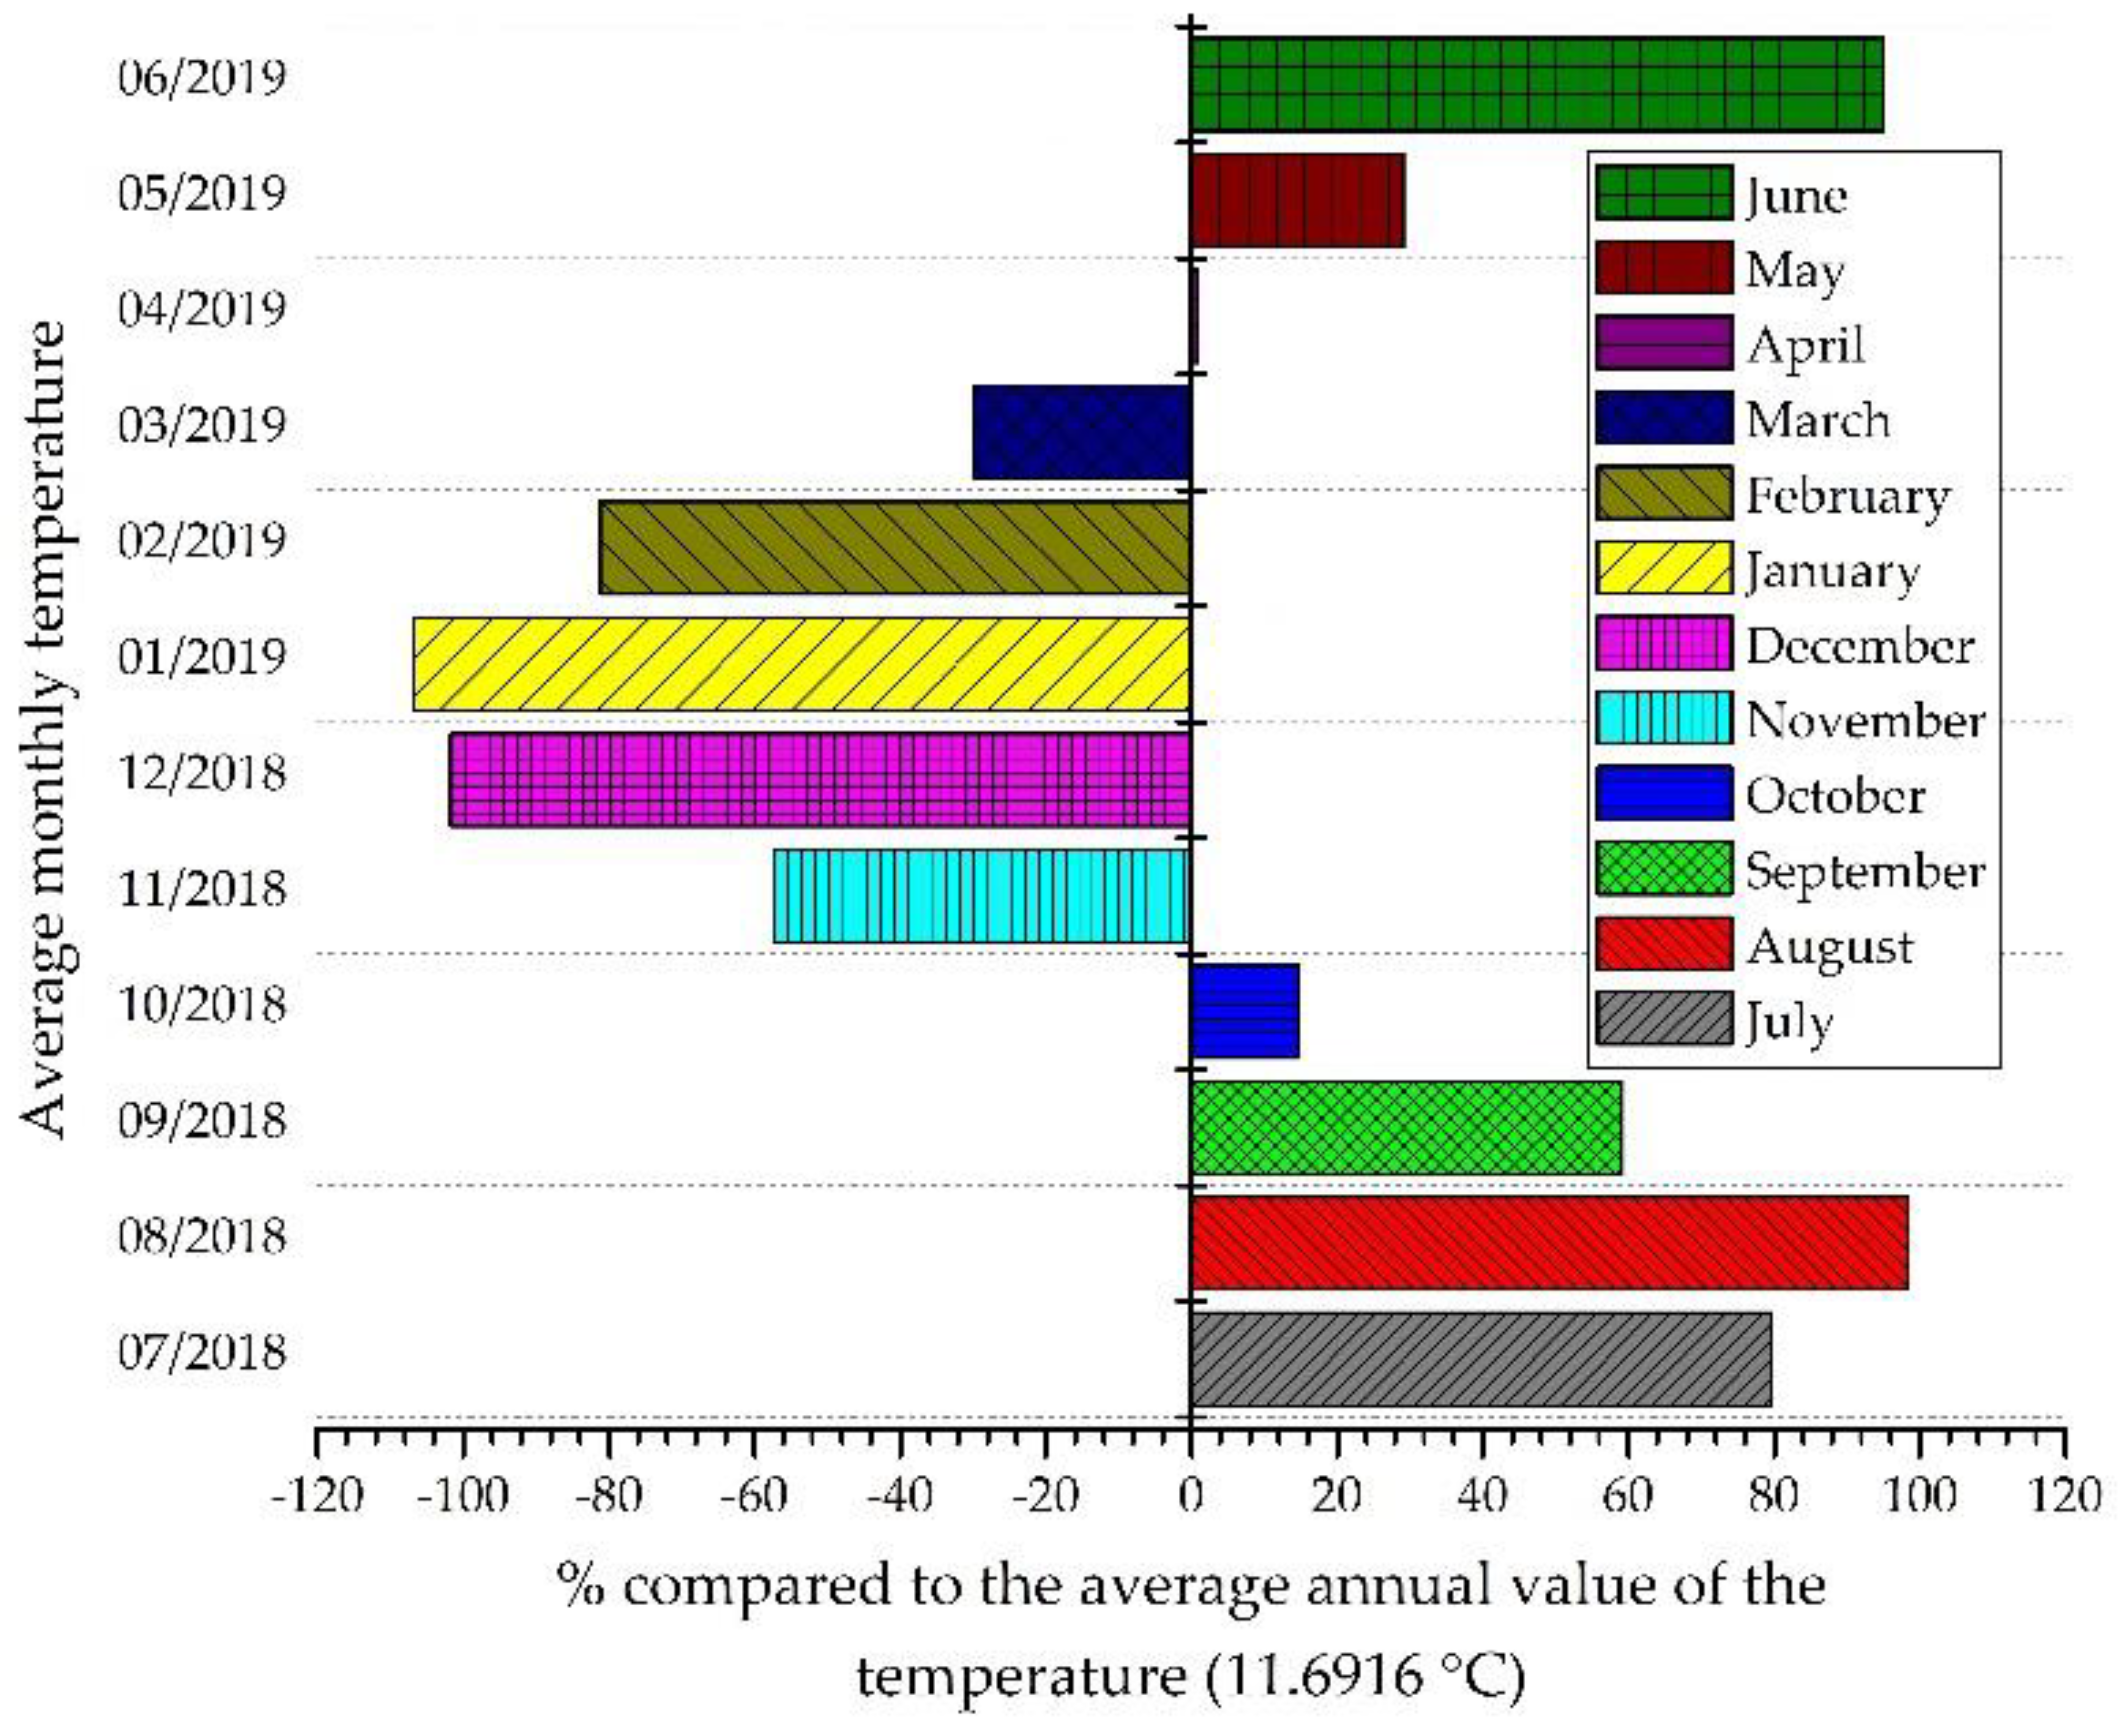
The meteorological data regarding the temperature history for Cluj-Napoca, related to the monitored period (July 2018–June 2019), were taken from the archive of the weather station rp5.ru [52]. The average daily values for temperature were calculated as the average values for the electric buses operating at hourly intervals, from the beginning of the program (5:00 a.m.) to the end of the program (11:00 p.m.), based on daily records of variations in temperature values, obtaining the results that are presented in Figure 7.
2.2.2. Ambient Humidity
Similar to the temperature history (See Section 2.2.1), compared to the monitored period (July 2018–June 2019), data were taken regarding the values for the atmospheric humidity [52]. The average values for the atmospheric humidity were calculated as the average values for the electric buses operating at hourly intervals, based on daily records of the variations for the atmospheric humidity values, obtaining the results that are presented in Figure 8.
2.2.3. Pressure and Air Density
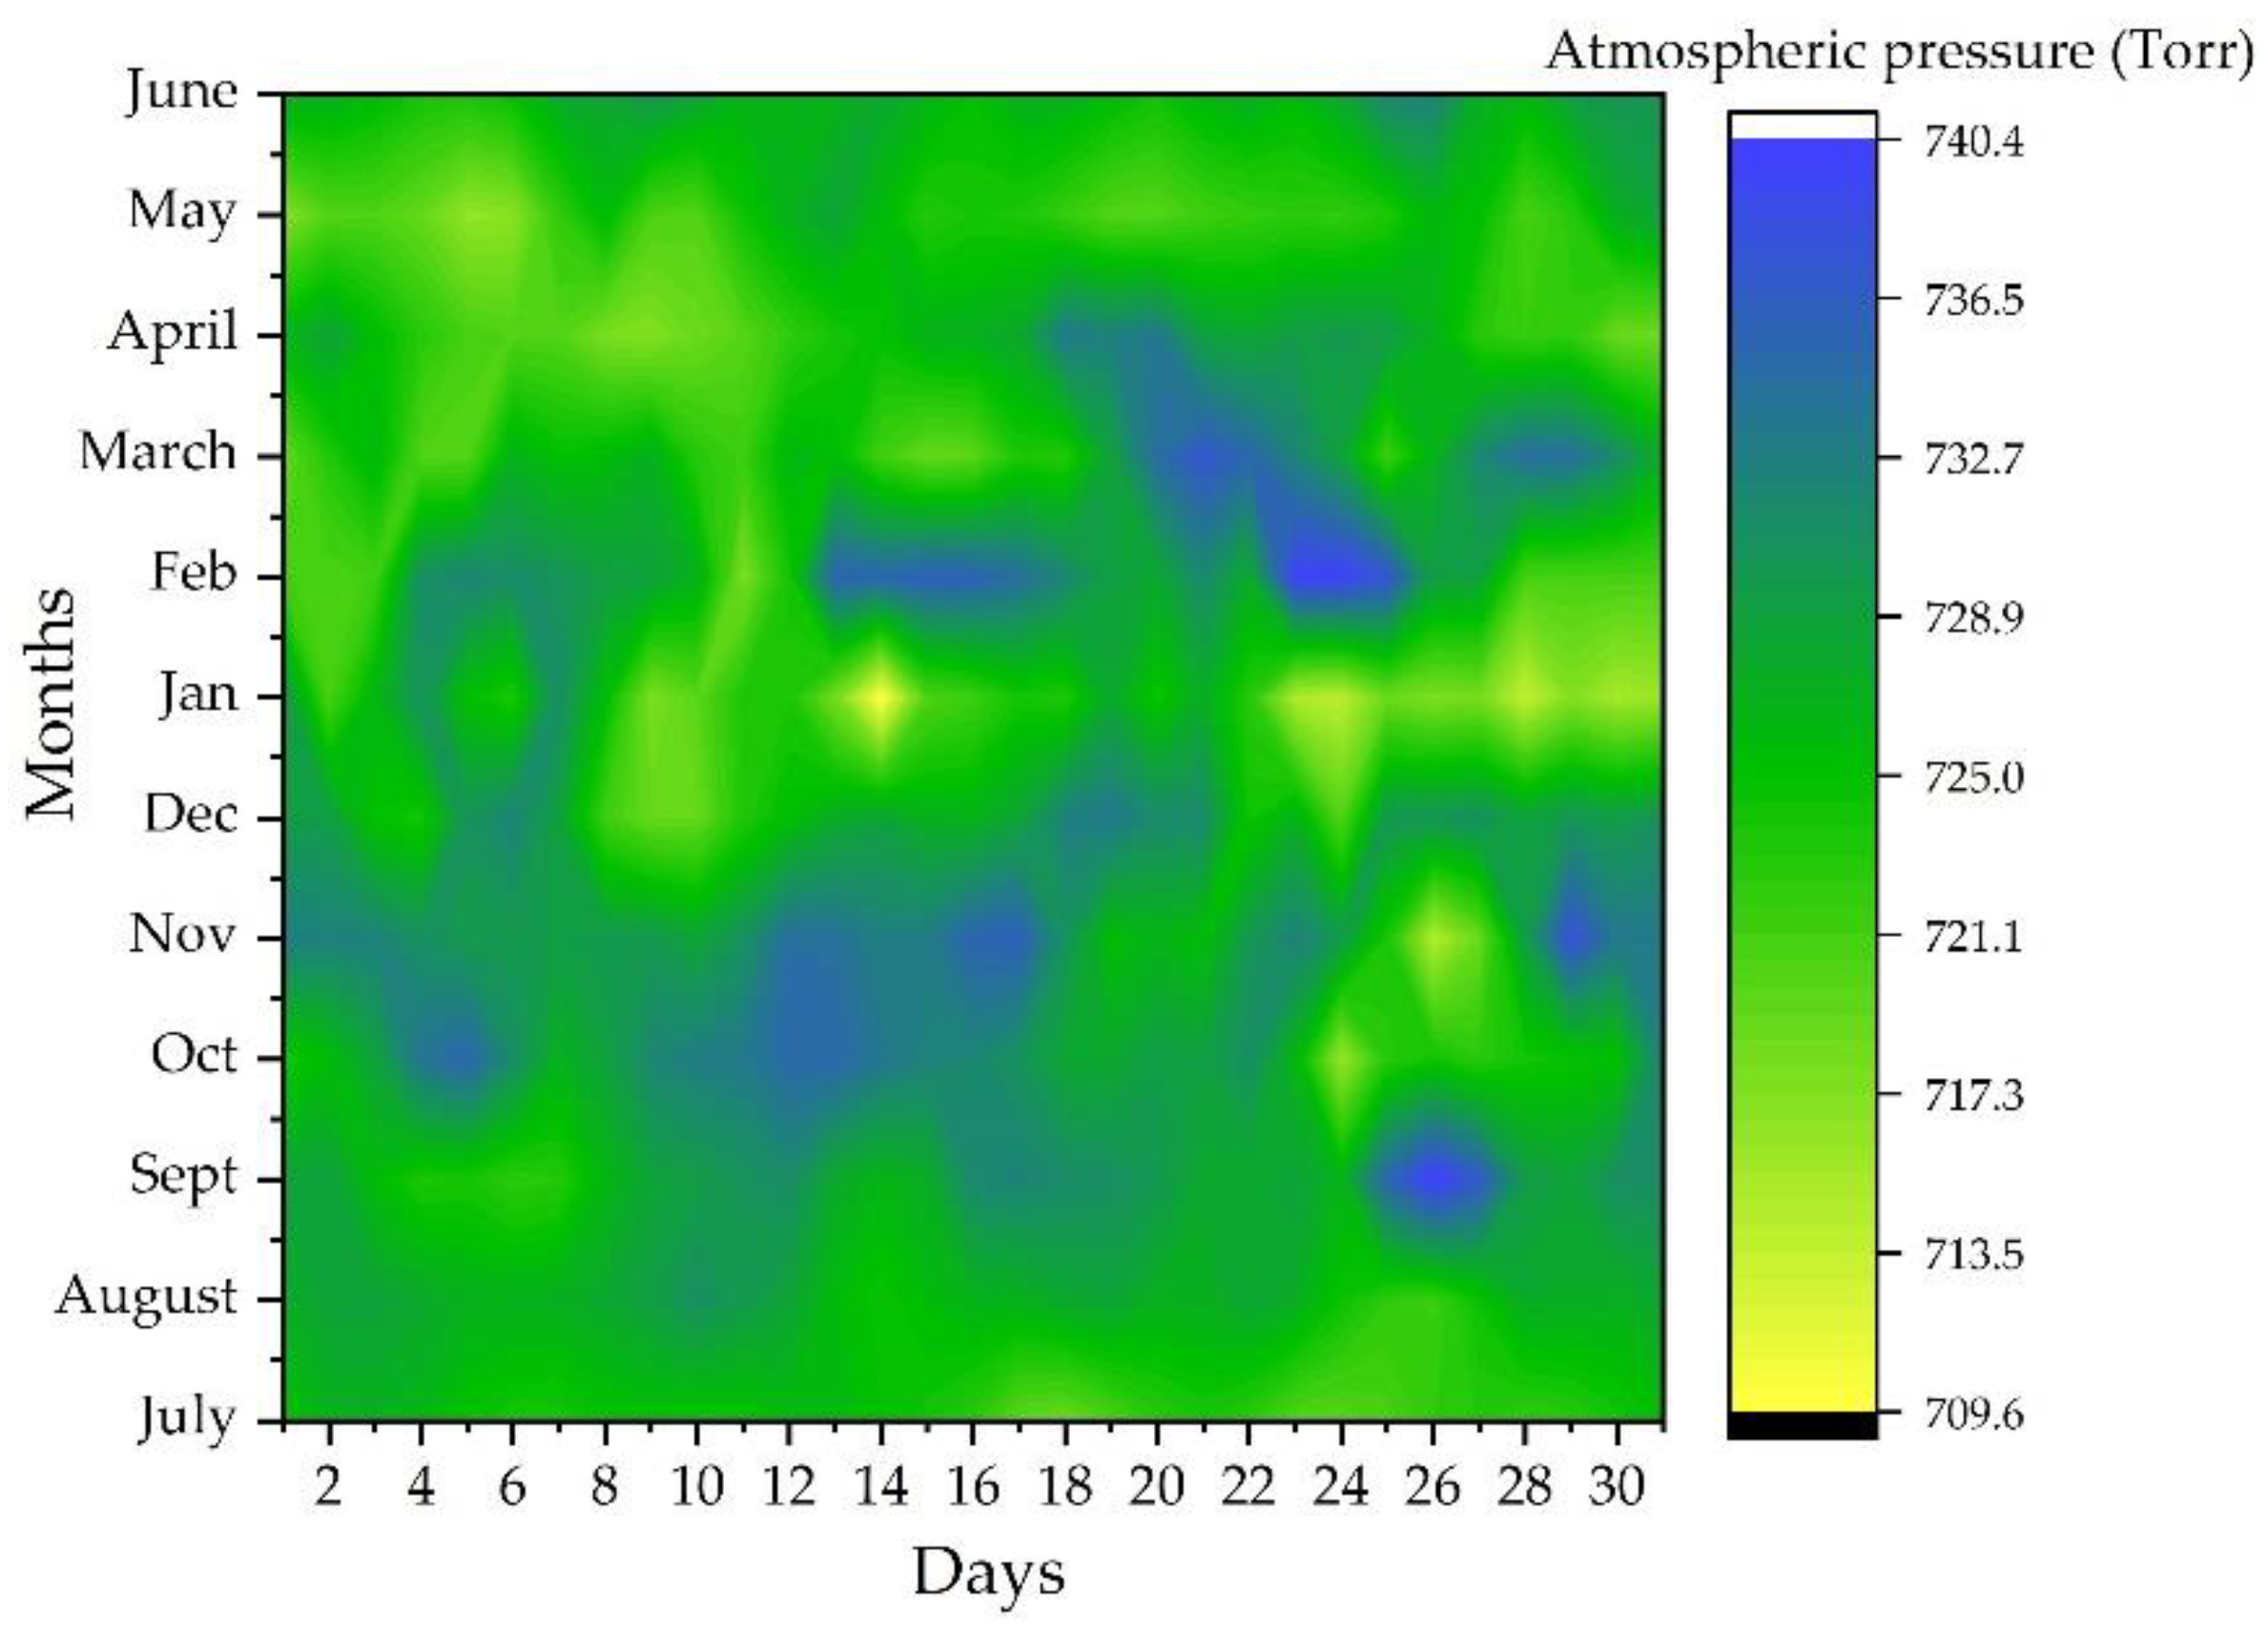
Similar to the temperature history (see Section 2.2.1), compared to the monitored period (July 2018–June 2019), data were taken regarding the atmospheric pressure values [52]. The average values for the atmospheric pressure were calculated as the average values for the electric buses operating at hourly intervals, based on the daily records of the atmospheric pressure values’ variations, obtaining the results that are presented in Figure 9.
The average daily air-density value (Figure 10) was calculated based on the average daily recordings of the thermal values, using the following relation [53]:
where ρair is the average daily air density (kg/m3), p is the average daily atmospheric pressure (Pa), u is the average daily relative humidity (-), ps is the saturation pressure (Pa), and T is the absolute temperature (K) relative to the average daily ambient temperature (T (K) = t (°C) + 273.15).
The saturation pressure was calculated using the following relation [54]:
2.3. Energy Balance
2.3.1. Energy Consumption
The energy consumption of the electric buses is influenced by a number of factors, such as: increasing the total mass of buses by loading the passengers, the consumption generated by the auxiliary systems that cause a significant increase in the amount of energy consumed by the batteries (air conditioner equipment, multimedia equipment, lighting equipment, telematics equipment, auxiliary equipment), some of these factors being not dependent on the distance traveled by the electric buses [55,56,57]. At the same time, the altitude profile of the route can influence the energy consumption. This increases during periods of acceleration or ascent of the ramps and decreases when descending the slopes or when the bus decelerates, reaching negative values (the energy is transferred from the electric motor that works in generator mode, to the battery). The data collected for the monitored period (July 2018–June 2019) showed an average daily distance traveled between 100 km (one driver/electric bus) and 200 km (two drivers/one electric bus).
In addition to these factors, there are climatic parameters (ambient temperature, atmospheric humidity, air pressure, and density) that have a major influence on the energy consumption of the electric buses. The experimental data recorded during the monitored period include the atmospheric conditions characteristic for all seasons with extreme values during a calendar year (ambient temperatures between –15 °C in January 2019 and +32 °C in August 2018, respectively humidity values between 14% in November 2018 and 100% in most months of the year).
Yuan et al. in [58], consider that it is difficult to obtain real traffic data on the energy consumption for electric buses, and standards for defining this consumption and registration procedures are used to evaluate the energy consumption (ISO 8714-2002 Electric road vehicles—Reference energy consumption and range—Test procedures for passenger cars and light commercial vehicles [59], respectively, GB 18386-2017 Electric vehicles—Energy consumption and range—Test procedures [60]).
In this paper, the data on the energy consumption were recorded by real-time monitoring of bus operation in the city of Cluj-Napoca, which is achieved through the system of tracking and monitoring the traffic Thoreb [61], a system that allows the observation of buses in real-time by monitoring on a digital map based on the signals generated by the Global Positioning System (GPS) modules installed on the buses and transmitted to the dispatchers using the General Packet Radio Service (GPRS) technology. At the same time, from the bus controller area network (CAN), data regarding the technical status of the buses, the distance traveled, the energy consumption, the number of passengers transported, etc. are collected and sent to the dispatchers [13].
2.3.2. Regenerative Braking Energy
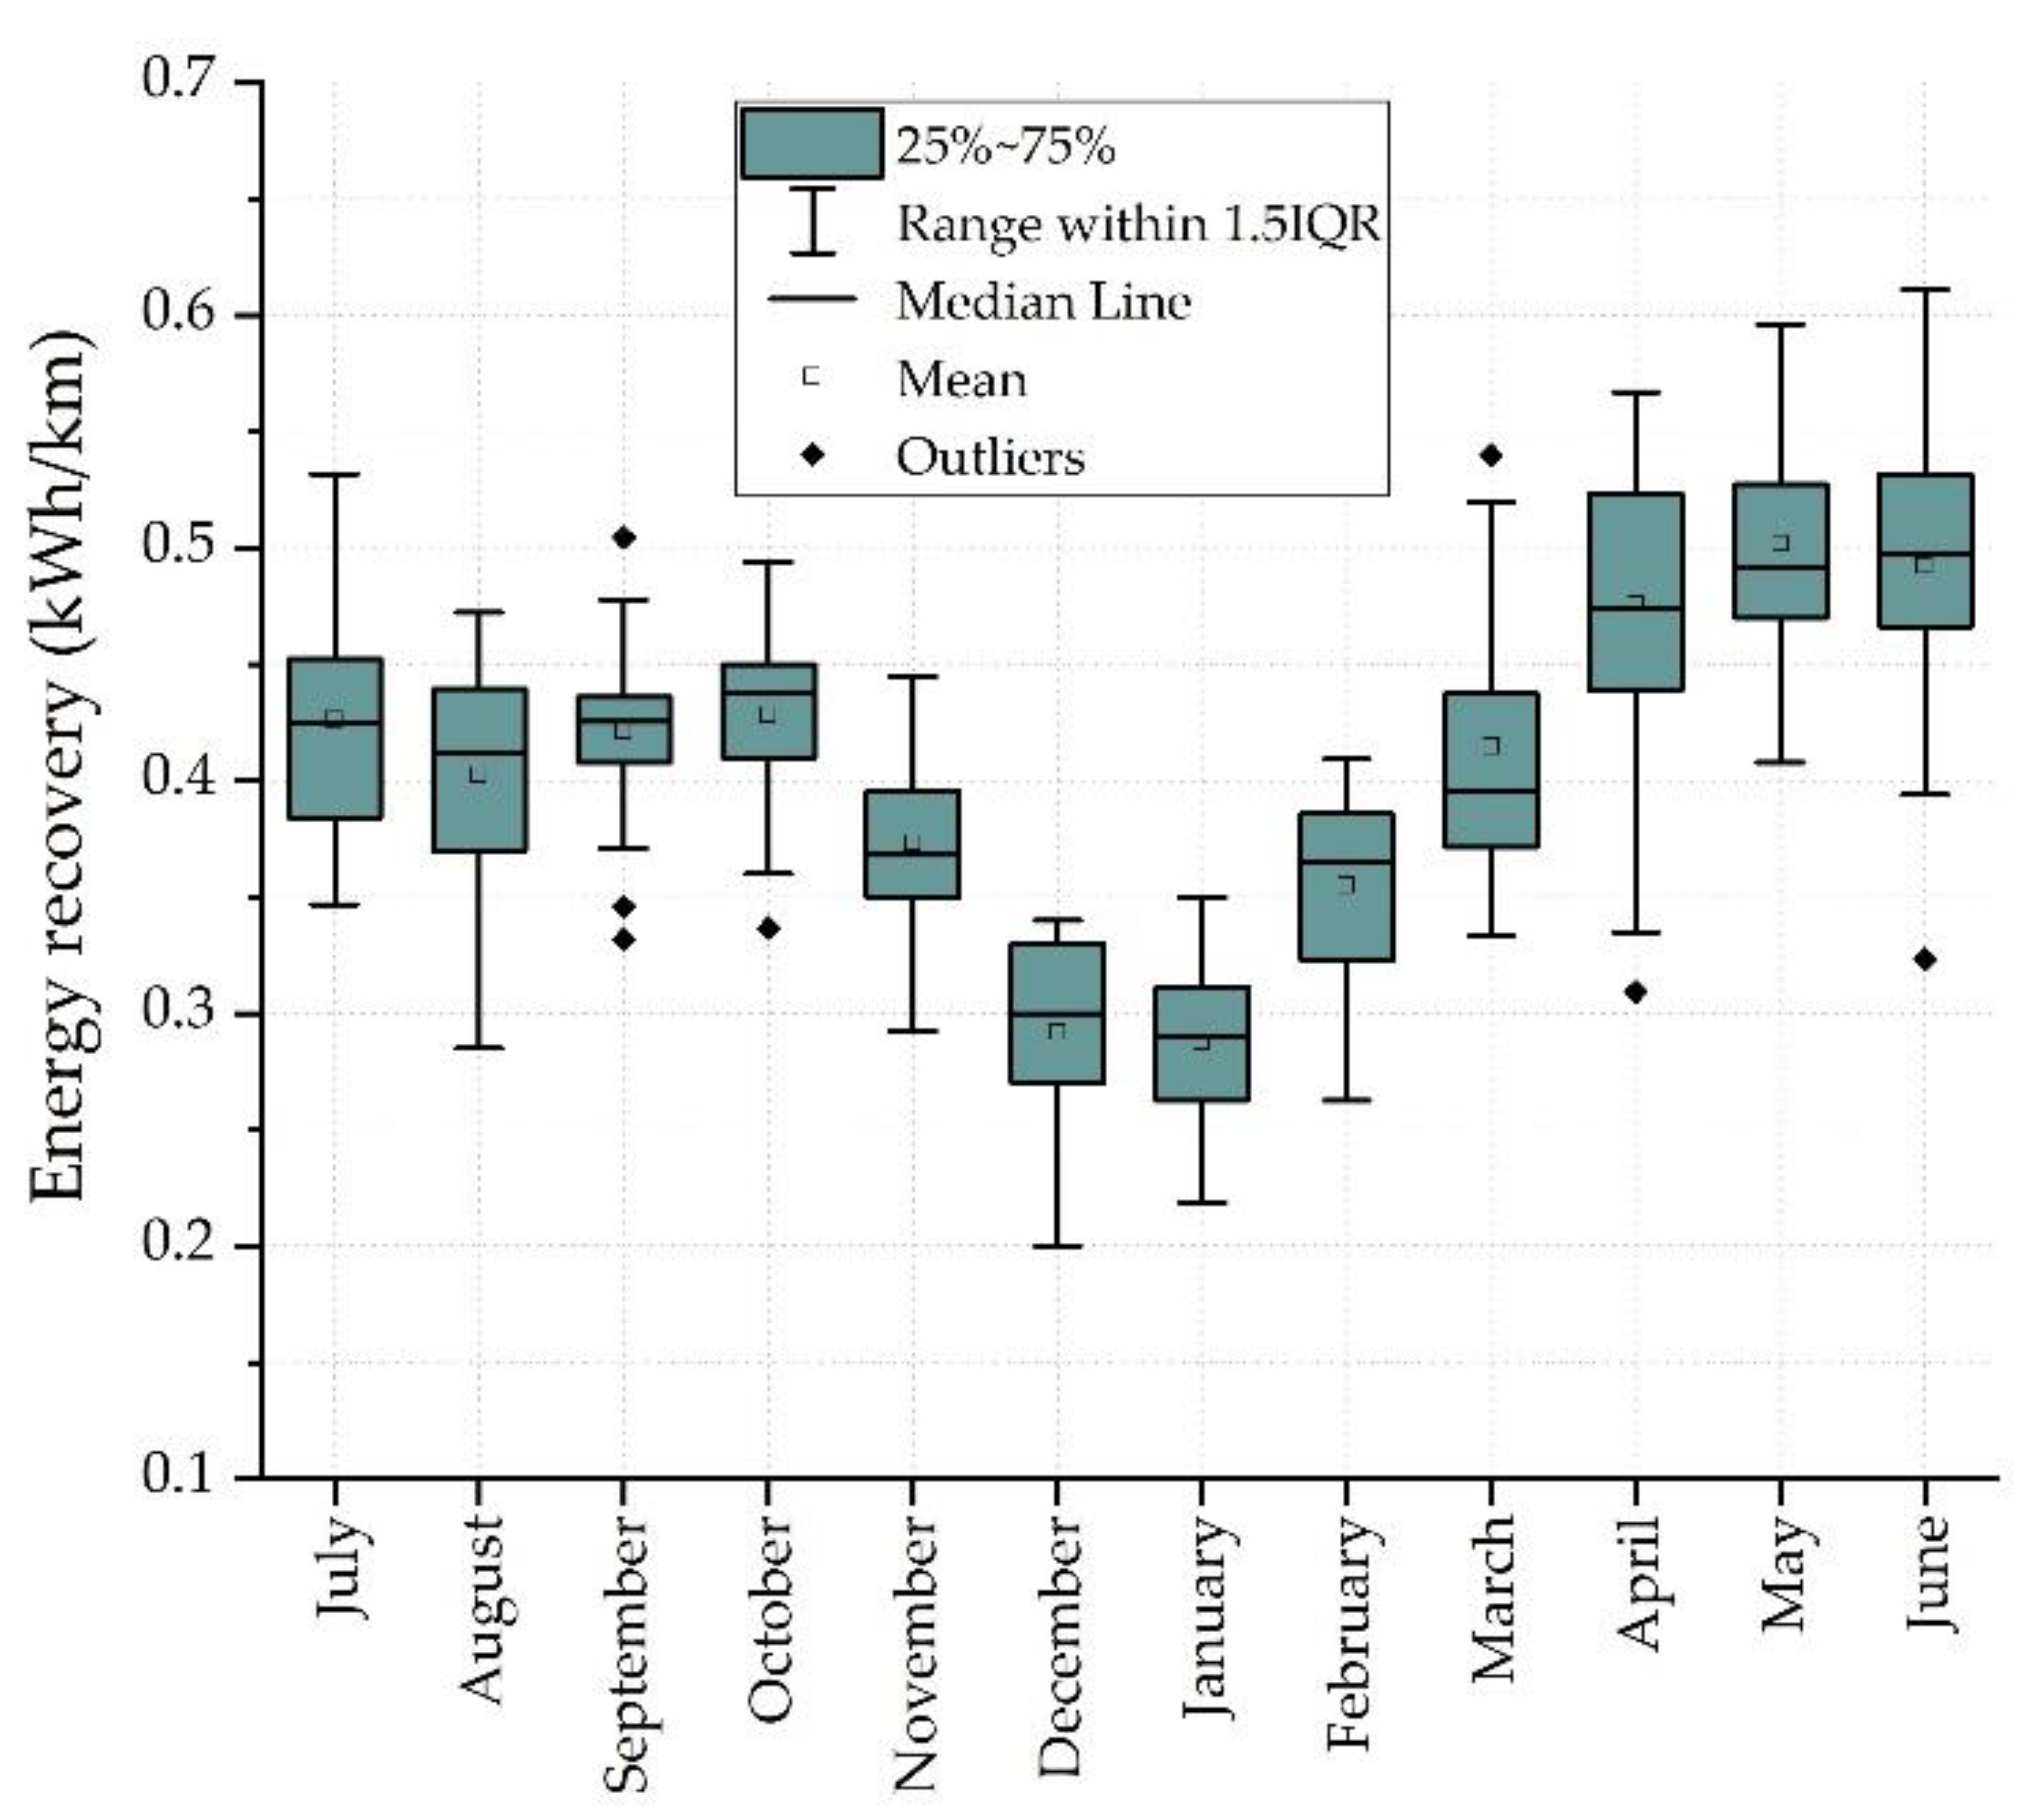
Similar to the energy consumption of the electric buses, the energy recovered through the regenerative braking was recorded for the monitored period (July 2018–June 2019).
2.3.3. Total Energy Balance
3. Results
As the costs associated with the integration into the urban transport system of the electric buses are high, it is necessary to carry out studies and research in order to provide the best solution in relation to their optimal use, taking into account the particularities imposed by the zoning characteristics (length and the gradient of routes, the flow of the transported passengers, the loading infrastructure, the volume of traffic, the characteristics of the environment, etc.).
The study of the energy performances for the 22 electric buses during the monitored period (July 2018–June 2019) highlighted their behavior at different values of the climatic parameters (temperature, humidity, atmospheric pressure, and air density).
The climatic parameters were monitored during a calendar year and give a clear picture regarding the atmospheric conditions and their influence on the energy consumption, respectively, on the energy recovery during the operation of the electric buses.
The parameters resulting from the behavior of the driver are invariable, difficult to estimate and impossible to generalize because they are psychological factors specific to each individual. However, taking into account the data on variations in atmospheric pressure and air density, there is the possibility to correlate human behavior with these variations, so that in the situation of increasing these values, the behavior of drivers becomes more active, and in the situation of decreasing these values, behavior becomes more passive.
From the results captured in Table 5 and in Figure 13, the average annual values of the climatic parameters can be obtained, as follows: the average annual temperature, 11.6916 °C; the average annual humidity, 75.3083%; the average annual atmospheric pressure, 726.6333 Torr; average annual energy consumption of 1.3716 kWh/km; average annual energy recovery, of 0.4016 kWh/km. Taking these into account, in Figure 14, Figure 15, Figure 16, Figure 17 and Figure 18 the variations of the respective parameters are presented, as monthly average values obtained, compared with their annual average values.
A summary of the obtained results, as the interdependence between them and the influence parameters on them, is captured in Figure 19. Thus, for each considered month from the monitored period (July 2018–June 2019), the influence of the atmospheric conditions on the energy efficiency of the studied electric buses was highlighted. Also, for each considered month, the reciprocal link between temperature, humidity, atmospheric pressure, and air density is captured in Figure 19. Thus, it was found that with the increase of the temperature, there is a reduction in air density, a slight decrease in atmospheric pressure, and the recorded humidity showed a reduce tendency. The recorded values of the humidity show that, with its increase, the air density increases, and the atmospheric pressure is reduced. It also notes that the increase in pressure indicates an increase in air density.
Regarding the energy consumption of the electric buses, it can be seen that it increases with decreasing the temperature and the atmospheric pressure, but the same tendency exists in the situation of increasing the air humidity and the air density (Table 6 and Figure 19). The energy recovered by the regenerative braking of the electric buses increases with the increase of the temperature and decreases with the increase of the air humidity, air density, and atmospheric pressure. Also, it can be seen that energy recovery largely compensates for the energy consumption of the electric buses.
4. Discussion
In the summer months (July 2018, August 2018, and June 2019), it resulted in high energy consumption compared to the average monthly values, due to the use of the air-conditioning system, when the ambient temperature exceeded 30 °C. This temperature threshold was imposed from the construction of the electric buses and results in the automatic operation of the air-conditioning until the ambient temperature in the passenger compartment drops below 25 °C. Regarding the recovered energy, an increase of it with the increase of the ambient temperature was noticed, under the conditions of maintaining low values of the atmospheric humidity, which facilitates the braking capacities of the electric buses on a dry road, respectively the increase of the electrical resistance of the braking system, preventing the energy losses through braking rheostats. In the summer months, characterized by the average monthly temperature values (see Table 5) higher than the annual average, with 79.61% in July 2018, 79.61% in August 2018, and 98.43% in June 2019 (see Figure 14), the atmospheric humidity is higher than the annual average by 0.25% in July 2018, lower by 9.57% in August 2018, and with 9.31% in June 2019 (see Figure 15), and the atmospheric pressure is lower than the annual average by 0.39% in July 2018, higher by 0.09% in August 2018, and with 0.04% in June 2019 (see Figure 16), resulting in lower energy consumption compared to the average annual consumption, by 17.62% in July 2018, 15.43% in August 2018, and 3.04% in June 2019 (see Figure 17), and a higher amount of energy recovered compared to its annual average, with 7.05% in July 2018, 21.99% in June 2019, and lower by 0.41% in August 2018 (see Figure 18).
From the recorded results, it can be seen that the autumn months (September 2018 and October 2018) are the months with low energy consumption, mainly due to the thermal conditions, with values of temperature of approx. 20 °C, but also with low values of the atmospheric humidity, being generally dry weather, which facilitates the movement of the electric buses with a minimum of energy consumed and a maximum recovered energy. During these months, the monthly average temperatures (see Table 5) were higher than the annual average, with 59.09% in September 2018 and with 14.61% in October 2018 (see Figure 14), with lower atmospheric humidity compared to that annual average with 11.69% in September 2018 and with 7.58% in October 2018 (see Figure 15), and the atmospheric pressure higher than the annual average, with 0.28% in September 2018 and with 0.33% in October 2018 (see Figure 16), resulted in a lower energy consumption than the average annual consumption, with 21.99% in September 2018 and with 5.43% in October 2018 (see Figure 17), and a higher amount of energy recovered compared to its annual average, with 4.56% in September 2018 and with 7.05% in October 2018 (see Figure 18).
Since November 2018, the cold season has started, which, due to the decrease of the ambient temperature, especially in the time periods from the beginning of the work program (from 5:00 a.m. to 8:00 a.m.), respectively in the periods after the end of the work program (from 8:00 p.m. to 11:00 p.m.), resulted in an accelerated increase of the average energy consumption. Due to the increase of the atmospheric humidity and the reduction of the grip due to the wet road, the value of the recovered energy decreased. November 2018 was characterized by monthly average values of the temperature lower than the annual average value with 57.23% (see Figure 14), the atmospheric humidity higher than the annual average with 12.47% (see Figure 15), and the atmospheric pressure compared to the annual average by 0.50% higher (see Figure 16), resulted a higher energy consumption than the average annual consumption, by 5.71% (see Figure 17), and a lower amount of recovered energy compared to its annual average, with 5.39% (see Figure 18).
The winter months (December 2018 and January 2019) were the months with the lowest temperatures in the entire monitored period. In addition to the negative temperatures of the day, the start of the working program for the electric buses took place below the freezing threshold. Electric buses, which are connected overnight to the external slow-charging stations, and the batteries are heated by the thermal management system, consume, on the cold winter days (with temperatures below −10 °C) up to 10% of the energy from the batteries, for heating the interior passenger compartment, only in the interval of preparation for the buses’ departure on the route. Thus, combined with the increased of the daily consumption and the wet road conditions, it is reached that, during the cold season, the consumption increase by 2 to 2.5 times compared to the periods with the lowest values of consumption, and the energy values recovered will near zero. During these months, the monthly average temperatures (see Table 5) were lower than the annual average by 101.71% in December 2018 and by 106.84% in January 2019 (see Figure 14), the humidity was higher than the annual average with 27.34% in December 2018 and with 25.75% in January 2019 (see Figure 15), and the atmospheric pressure was higher than the annual average, with 0.28% in December 2018 and lower, with 0.71% in January 2019 (see Figure 16). The result was a higher energy consumption than the average annual consumption, with 29.77% in December 2018 and 38.52% in January 2019 (see Figure 17), and a reduced amount of energy recovery compared to its annual average, by 27.80% in December 2018 and by 25.31% in January 2019 (see Figure 18).
The transition from extremely low winter temperatures to thermal relaxation took place in February 2019, which started with low temperatures, especially in the early morning, but also with a slight increase in temperatures in the second half of the day, which have to lead to a reduction in energy consumption. Due to low values of the atmospheric humidity and the lack of precipitation, respectively, on a dry road, the amount of energy recovered during this period also increased. February 2019 was characterized by monthly average values of the temperature lower than the annual average value by 81.18% (see Figure 14), the atmospheric humidity higher than the annual average by 6.76% (see Figure 15), and the atmospheric pressure compared to the annual average higher with 0.44% (see Figure 16). In February it resulted in higher energy consumption than the average annual consumption, with 16.65% (see Figure 17), and a reduced of the energy recovery compared to its annual average, with 25.31% (see Figure 18).
The spring months (March 2019 and April 2019) began with accelerated warming of the weather, with the reduction of the atmospheric humidity, environmental aspects that led to the gradual reduction of the energy consumption to normal values and to the increased of the energy recovery. Even though, during the two months, the mornings were colder, with temperatures around 0 °C, the thermal regime did not influence the electric bus batteries when the buses started on the route. During these months, the monthly average temperatures (see Table 5) were lower than the annual average by 29.86% in March 2019 and higher by 0.93% in April 2019 (see Figure 14), with lower atmospheric humidity compared to the annual average, with 17.41% in March 2019 and with 20.99% in April 2019 (see Figure 15), and the atmospheric pressure was lower than the annual average, with 0.06% in March 2019 and with 0.20% in April 2019 (see Figure 16), and it resulted in lower energy consumption compared to the average annual consumption, with 5.22% in each of the two months (see Figure 17), and a reduced amount of energy compared to its annual average by 0.41% in March 2019 and by 19.50% higher in April 2019 (see Figure 18).
The transition to the hot season at summer temperatures began in May 2019, a month characterized by positive thermal values throughout the operating range of the electric buses, respectively by the average values of the atmospheric humidity. These climatic factors allowed us to achieve average energy consumption within the normal limits specified by the manufacturer, cumulating with maximum energy recovery for the entire monitored interval. May 2019 was characterized by monthly average values of the temperature higher than the annual average value, with 29.15% (see Figure 14), the atmospheric humidity higher than the annual average by 3.97% (see Figure 15), and the atmospheric pressure lower than the annual average by 0.61% (see Figure 16). In May, it resulted in lower energy consumption than the average annual consumption, by 6.68% (see Figure 17), and an amount of recovered energy higher than its annual average, with 24.48% (see Figure 18).
5. Conclusions
The energy efficiency of the electric buses was evaluated for 12 consecutive months (July 2018–June 2019), based on the weather conditions in Cluj-Napoca city, Romania, conditions that are specific to the vast majority of continental Europe, taking into account other area features, such as the loading infrastructure, traffic conditions, altitude profile of the traveled routes, the degree of loading with passengers, and the traffic management.
Based on our findings, the following conclusions can be drawn:
- The climatic parameters influence the consumption and energy recovery for the electric buses;
- The energy consumption of the electric buses increases with the decreasing of the temperature and the atmospheric pressure, but the same tendency exists even if the humidity and density of the air increase;
- The energy recovered by the regenerative braking of the electric buses increases with the increase of the temperature and decreases with the increase of the air humidity, its density, and the atmospheric pressure;
- Energy recovery largely compensates the energy consumption of the electric buses;
- The variations of the monitored parameters, obtained as monthly average values, compared with their annual average values, highlight the interdependence of these quantities;
- Average energy consumption, within the normal limits specified by the manufacturer and maximum energy recoveries, was obtained on the transition to the warm season;
- The energy consumption of the electric buses increases when the buses accelerate or when the buses climb the ramps, and it decreases when the buses decelerate or descend from the ramp.
The authors intend to develop various models to describe other influences on the energy balance of the electric buses, to use them in their modeling, simulation, and exploitation. In addition, based on the collected experimental data and on the technical characteristics of the real model of the electric buses, the authors have already highlighted, with promising results, the influence of the atmospheric conditions on their energy balance, taking into account the interdependence of the climatic parameters (ambient temperature, atmospheric humidity, air pressure, and air density).
Author Contributions
The authors have contributed equally to this article.
Funding
This research received no external funding.
Acknowledgments
The authors wish to thank CTP Cluj-Napoca SA for providing the data from the Opportunity Studies.
Conflicts of Interest
The authors declare no conflict of interest.
References
- Jayakumar, A.; Chamber, A.; Lie, T.T. Review of prospects for adoption of fuel cell electric vehicles in New Zealand. IET Electr. Syst. Transp. 2017, 7, 259–266. [Google Scholar] [CrossRef]
- Grijalva, E.R.; López Martínez, J.M. Analysis of the Reduction of CO2 Emissions in Urban Environments by Replacing Conventional City Buses by Electric Bus Fleets: Spain Case Study. Energies 2019, 12, 525. [Google Scholar] [CrossRef]
- Varga, B.O.; Iclodean, C.; Mariașiu, F. Electric and Hybrid Buses for Urban Transport Energy Efficiency Strategies, 1st ed.; Springer International Publishing: Cham, Switzerland, 2016; pp. 85–103. [Google Scholar]
- Official Journal of the European Union. Directive (EU) 2018/2001 of the European Parliament and of the Council of 11 December 2018 on the Promotion of the Use of Energy from Renewable Sources (Recast). 2018. Available online: https://eur-lex.europa.eu/legal-content/EN/TXT/PDF/?uri=CELEX:32018L2001&from=ro (accessed on 14 October 2019).
- Vepsäläinen, J.; Ritari, A.; Lajunen, A.; Kivekäs, K.; Tammi, K. Energy Uncertainty Analysis of Electric Buses. Energies 2018, 11, 3267. [Google Scholar] [CrossRef]
- Bak, D.B.; Bak, J.S.; Kim, S.Y. Strategies for Implementing Public Service Electric Bus Lines by Charging Type in Daegu Metropolitan City, South Korea. Sustainability 2018, 10, 3386. [Google Scholar] [CrossRef]
- Topal, O.; Nakir, I. Total Cost of Ownership Based Economic Analysis of Diesel, CNG and Electric Bus Concepts for the Public Transport in Istanbul City. Energies 2018, 11, 2369. [Google Scholar] [CrossRef]
- Bagotsky, V.S.; Skundin, A.M.; Volfkovich, Y.M. Electrochemical Power Sources: Batteries, Fuel Cells, and Supercapacitors; John Wiley & Sons, Inc.: Hoboken, NJ, USA, 2015; pp. 91–103. [Google Scholar]
- Electric Buses: Everything is Changing, Solaris Bus & Coach. Available online: http://www.oradea.ro/fisiere/module_fisiere/26259/1)%20RO_Solaris_Electric_2017_RO-1.pdf (accessed on 14 October 2019).
- Li, W.; Stanula, P.; Egede, P.; Kara, S.; Herrmann, C. Determining the main factors influencing the energy consumption of electric vehicles in the usage phase. Procedia CIRP 2016, 48, 352–357. [Google Scholar] [CrossRef]
- Kivekäs, K.; Lajunen, A.; Vepsäläinen, J.; Tammi, K. City Bus Powertrain Comparison: Driving Cycle Variation and Passenger Load Sensitivity Analysis. Energies 2018, 11, 1755. [Google Scholar] [CrossRef]
- Raab, A.F.; Lauth, E.; Strunz, K.; Göhlich, D. Implementation Schemes for Electric Bus Fleets at Depots with Optimized Energy Procurements in Virtual Power Plant Operations. World Electr. Veh. J. 2019, 10, 5. [Google Scholar] [CrossRef]
- Studiu Oportunitate 2018. Primăria și Consiliul Local Cluj-Napoca. Study of Opportunity 2018. Available online: https://storage.primariaclujnapoca.ro/userfiles/files/studiu-oportunitate-autobuze-final.pdf (accessed on 9 April 2019). (In Romanian).
- Vellucci, F.; Pede, G. Fast-Charge Life Cycle Test on a Lithium-Ion Battery Module. World Electr. Veh. J. 2018, 9, 13. [Google Scholar] [CrossRef]
- Cho, J.; Jeong, S.; Kim, Y. Commercial and research battery technologies for electrical energy storage applications. Prog. Energy Combust. Sci. 2015, 48, 84–101. [Google Scholar] [CrossRef]
- Broussely, M.; Pistoia, G. Industrial Applications of Batteries: From Cars to Aerospace and Energy Storage, 1st ed.; Elsevier Science: Amsterdam, The Netherlands, 2007; pp. 203–271. [Google Scholar]
- Demircali, A.; Sergeant, P.; Koroglu, S.; Kesler, S.; Oztürk, E.; Tumbek, M. Influence of the temperature on energy management in battery-ultracapacitor electric vehicles. J. Clean. Prod. 2018, 176, 716–725. [Google Scholar] [CrossRef]
- Iora, P.; Tribioli, L. Effect of Ambient Temperature on Electric Vehicles’ Energy Consumption and Range: Model Definition and Sensitivity Analysis Based on Nissan Leaf Data. World Electr. Veh. J. 2019, 10, 2. [Google Scholar] [CrossRef]
- Qian, K.; Zhou, C.; Yuan, V.; Allan, M. Temperature Effect on Electric Vehicle Battery Cycle Life in Vehicle-to-Grid Applications. In Proceedings of the CICED 2010 China International Conference on Electricity Distribution, Nanjing, China, 13–16 September 2010. [Google Scholar]
- Transit Cooperative Research Program. Battery Electric Buses—State of the Practice; The National Academies Press: Washington, DC, USA, 2018; Available online: https://www.nap.edu/catalog/25061/battery-electric-buses-state-of-the-practice (accessed on 1 October 2019).
- Lindgren, J.; Lund, P.D. Effect of extreme temperatures on battery charging and performance of electric vehicles. J. Power Sources 2016, 328, 37–45. [Google Scholar] [CrossRef]
- Waldmann, T.; Wilka, M.; Kasper, M.; Fleischhammer, M.; Wohlfahrt-Mehrens, M. Temperature dependent ageing mechanisms in Lithium-ion batteries—A Post-Mortem study. J. Power Sources 2014, 262, 129–135. [Google Scholar] [CrossRef]
- Yi, Z.; Smart, J.; Shirk, M. Energy impact evaluation for eco-routing and charging of autonomous electric vehicle fleet: Ambient temperature consideration. Transp. Res. Part C Emerg. Technol. 2018, 89, 344–363. [Google Scholar] [CrossRef]
- Yuksel, T.; Michalek, J.J. Effects of Regional Temperature on Electric Vehicle Efficiency, Range, and Emissions in the United States. Environ. Sci. Technol. 2015, 49, 3974–3980. [Google Scholar] [CrossRef] [PubMed]
- Zhang, Z.; Li, W.; Zhang, C.; Chen, J. Climate control loads prediction of electric vehicles. Appl. Therm. Eng. 2017, 110, 1183–1188. [Google Scholar] [CrossRef]
- Zhu, T.; Min, H.; Yu, Y.; Zhao, Z.; Xu, T.; Chen, Y.; Li, X.; Zhang, C. An Optimized Energy Management Strategy for Preheating Vehicle-Mounted Li-ion Batteries at Subzero Temperatures. Energies 2017, 10, 243. [Google Scholar] [CrossRef]
- Jardin, P.; Esser, A.; Givone, S.; Eichenlaub, T.; Schleiffer, J.E.; Rinderknecht, S. The Sensitivity in Consumption of Different Vehicle Drivetrain Concepts Under Varying Operating Conditions: A Simulative Data Driven Approach. Vehicles 2019, 1, 69–87. [Google Scholar] [CrossRef]
- Hu, X.; Huang, B.; Cherubini, F. Impacts of idealized land cover changes on climate extremes in Europe. Ecol. Indic. 2019, 104, 626–635. [Google Scholar] [CrossRef]
- Reckiena, D.; Salvia, M.; Pietrapertosa, F.; Simoes, S.G.; Olazabal, M.; De Gregorio Hurtado, S.; Geneletti, D.; Krkoška Lorencová, E.; D’Alonzo, V.; Krook-Riekkola, A.; et al. Dedicated versus mainstreaming approaches in local climate plans in Europe. Renew. Sustain. Energy Rev. 2019, 112, 948–959. [Google Scholar] [CrossRef]
- Soares, M.B.; Alexander, M.; Dessai, S. Sectoral use of climate information in Europe: A synoptic overview. Clim. Serv. 2018, 9, 5–20. [Google Scholar] [CrossRef]
- Rymarz, J.; Niewczas, A.; Stoklosa, J. Reliability Evaluation of the City Transport Buses Under Actual Conditions. Transp. Telecommun. 2015, 16, 259–266. [Google Scholar] [CrossRef]
- Briec, E.; Müller, B. (Eds.) Electric Vehicle Batteries: Moving from Research towards Innovation, Reports of the PPP European Green Vehicles Initiative; Springer International Publishing: Cham, Switzerland; Berlin, Germany, 2015. [Google Scholar]
- Qin, N.; Brooker, R.P.; Raissi, A. Electric Bus Systems. EVTC Report Number: FSEC-CR-2060-17. 2017. Available online: http://www.fsec.ucf.edu/en/publications/pdf/FSEC-CR-2060-17.pdf (accessed on 2 October 2019).
- Linden, D.; Reddy, T.B. (Eds.) Handbook of Batteries, 3rd ed.; McGraw-Hill: New York, NY, USA, 2002. [Google Scholar]
- Nitta, N.; Wu, F.; Lee, J.T.; Yushin, G. Li-ion battery materials: Present and future. Mater. Today 2015, 18, 252–264. [Google Scholar] [CrossRef]
- Łebkowski, A. Studies of Energy Consumption by a City Bus Powered by a Hybrid Energy Storage System in Variable Road Conditions. Energies 2019, 12, 951. [Google Scholar] [CrossRef]
- Andreev, A.A.; Vozmilov, A.G.; Kalmakov, V.A. Simulation of lithium battery operation under severe temperature conditions. J.Proeng 2015, 129, 201–206. [Google Scholar] [CrossRef]
- AVL CRUISE, Users Guide; VERSION 2011, Document No. 04.0104.2011, Edition 06/2011; AVL LIST GmbH: Graz, Austria, 2011.
- Solaris Electric Buses experience and Further Development, Electrické Autobusy pro Mĕsto II. Available online: http://www.proelektrotechniky.cz/pdf/SeminarEbusyII/Figaszewski_Solaris_Ebus.pdf (accessed on 3 October 2019).
- Liu, H.; Wang, C.; Zhao, X.; Guo, C. An Adaptive-Equivalent Consumption Minimum Strategy for an Extended-Range Electric Bus Based on Target Driving Cycle Generation. Energies 2018, 11, 1805. [Google Scholar] [CrossRef]
- Soltani, M.; Ronsmans, J.; Kakihara, S.; Jaguemont, J.; Van den Bossche, P.; Van Mierlo, J.; Omar, N. Hybrid Battery/Lithium-Ion Capacitor Energy Storage System for a Pure Electric Bus for an Urban Transportation Application. Appl. Sci. 2018, 8, 1176. [Google Scholar] [CrossRef]
- Yildiz, M.; Karakoc, H.; Dincer, I. Modeling and validation of temperature changes in a pouch lithium-ion battery at various discharge rates. Int. Commun. Heat Mass Transf. 2016, 75, 311–314. [Google Scholar] [CrossRef]
- Mallon, K.R.; Assadian, F.; Fu, B. Analysis of On-Board Photovoltaics for a Battery Electric Bus and Their Impact on Battery Lifespan. Energies 2017, 10, 943. [Google Scholar] [CrossRef]
- Wu, X.; Lv, S.; Chen, J. Determination of the Optimum Heat Transfer Coefficient and Temperature Rise Analysis for a Lithium-Ion Battery under the Conditions of Harbin City Bus Driving Cycles. Energies 2017, 10, 1723. [Google Scholar] [CrossRef] [Green Version]
- Bloomberg New Energy Finance, Electric Buses in Cities—Driving Towards Cleaner Air and Lower CO2. 29 March 2018. Available online: https://data.bloomberglp.com/professional/sites/24/2018/05/Electric-Buses-in-Cities-Report-BNEF-C40-Citi.pdf (accessed on 10 October 2019).
- Du, Y.; Zhao, Y.; Wang, Q.; Zhang, Y.; Xi, H. Trip-oriented stochastic optimal energy management strategy for plug-in hybrid electric bus. Energy 2016, 115, 1259–1271. [Google Scholar] [CrossRef]
- Emadi, A. (Ed.) Advanced Electric Drive Vehicles (Energy, Power Electronics, and Machines); CRC Press, Taylor & Francis Group, LLC: Boca Raton, FL, USA, 2015; pp. 491–517. [Google Scholar]
- Kumar, L.; Jain, S. Electric propulsion system for electric vehicular technology: A review. Renew. Sustain. Energy Rev. 2014, 29, 924–940. [Google Scholar] [CrossRef]
- Varga, B.O.; Mariașiu, F.; Moldovanu, D.; Iclodean, C. Electric and Plug-In Hybrid Vehicles, Advanced Simulation Methodologies; Springer International Publishing: Cham, Switzerland, 2015; pp. 116–137. [Google Scholar]
- Luin, B.; Petelin, S.; Al-Mansour, F. Microsimulation of electric vehicle energy consumption. Energy 2019, 174, 24–32. [Google Scholar] [CrossRef]
- Li, L.; Zhang, Y.; Yang, C.; Yan, B.; Martinez, C.M. Model predictive control-based efficient energy recovery control strategy for regenerative braking system of hybrid electric bus. Energy Convers. Manag. 2016, 111, 299–314. [Google Scholar] [CrossRef]
- Arriva Meteo în Cluj-Napoca. Available online: https://rp5.ru/Arhiva_meteo_%C3%AEn_Cluj-Napoca (accessed on 1 October 2019).
- Air Density Calculator: Altitude, Temperature, Humidity and Barometric Pressure of Weather Systems and Their Impact on Local Atmospheric Air Density. Available online: https://barani.biz/apps/air-density/ (accessed on 10 October 2019).
- The Engineering ToolBox, Air Psychrometrics. Available online: https://www.engineeringtoolbox.com/air-psychrometrics-properties-t_8.html (accessed on 10 October 2019).
- Delos Reyes, J.R.M.; Parsons, R.V.; Hoemsen, R. Winter Happens: The Effect of Ambient Temperature on the Travel Range of Electric Vehicles. IEEE Trans. Veh. Technol. 2016, 65, 4016–4022. [Google Scholar] [CrossRef]
- Panchal, S.; Dincer, I.; Agelin-Chaab, M.; Fraser, R.; Fowler, M. Thermal modeling and validation of temperature distributions in a prismatic lithium-ion battery at different discharge rates and varying boundary conditions. Appl. Eng. 2016, 96, 190–199. [Google Scholar] [CrossRef]
- Scarinci, R.; Zanarini, A.; Bierlaire, M. Electrification of urban mobility: The case of catenary-free buses. Transp. Policy 2019, 80, 39–48. [Google Scholar] [CrossRef] [Green Version]
- Yuan, X.; Zhang, C.; Hong, G.; Huang, X.; Li, L. Method for evaluating the real-world driving energy consumptions of electric vehicles. Energy 2017, 141, 1955–1968. [Google Scholar] [CrossRef]
- ISO 8714-2002, Electric Road Vehicles—Reference Energy Consumption and Range—Test Procedures for Passenger Cars and Light Commercial Vehicles. Available online: https://www.iso.org/standard/34087.html (accessed on 1 October 2019).
- GB/T 18386-2017, Electric Vehicles—Energy Consumption and Range—Test Procedures. Available online: http://www.gbstandards.org/GB_standards/GB-T%2018386-2017.html (accessed on 1 October 2019).
- Thoreb, CTP Cluj-Napoca. Available online: http://www.thoreb.com/index.php/ro/referinte/31-europe/70-ctp-cluj-napoca (accessed on 1 October 2019).
Figure 1.
Solaris Urbino 12e electric bus fleet (author photo).

Figure 2.
LTO batteries that equip the Solaris Urbino 12e electric buses (author photo).

Figure 3.
Equivalent circuit models (ECM) of the battery cell.

Figure 4.
Battery characteristics.

Figure 5.
Motor speed-torque diagram (traction modes).

Figure 6.
Motor speed-torque/power characteristic.

Figure 7.
The average daily temperature values recorded for the monitored period.

Figure 8.
The average daily atmospheric humidity values recorded for the monitored period.

Figure 9.
The average daily atmospheric pressure values recorded for the monitored period.

Figure 10.
The calculated average daily air density values for the monitored period.

Figure 11.
Boxplot analysis of energy consumption (kWh/km).

Figure 12.
Amount of the energy recovered by regenerative braking (kWh/km).

Figure 13.
The energy balance of the Solaris Urbino 12e electric bus.

Figure 14.
Monthly average temperature variation vs. average annual temperature.

Figure 15.
Monthly average humidity variation vs. average annual humidity.

Figure 16.
Monthly average atmospheric pressure variation vs. average annual atmospheric pressure.

Figure 17.
Variation of average monthly energy consumption vs. average annual energy consumption.

Figure 18.
Variation of average monthly energy recovery vs. annual average energy recovery.

Figure 19.
Matrix scatter plot.


Table 1.
Technical characteristics of the electric buses.
| Parameters | Unit | Value |
|---|---|---|
| Length/Width/Height | m | 12.00/2.55/3.25 |
| Distance from hitch to front axle | m | 9.30 |
| Wheelbase | m | 5.90 |
| Nominal/Loaded Weight | kg | 13,800/18,000 |
| Number of passenger’s seats/total | - | 23/70 |
| Motor (type) | - | Electric asynchronous |
| Maximum engine power | kW | 160 |
| Maximum engine torque | Nm | 1450 |
| Inverter input voltage | Vcc | 687 |
| Inverter output voltage | Vca | 3 × 380 |
| Batteries (type) | - | Li4Ti5O12 (LTO) |
| Battery capacity | kWh | 210 |
| Battery voltage | Vcc | 687 |
| Energy consumption summer/winter | kWh/km | 1.00/2.00 |
| Autonomy (producer) | km | 105 |
| Autonomy (real) | km | 75–150 |
Table 2.
Technical characteristics of the electric batteries.
| Parameters | Unit | Value | |
|---|---|---|---|
| Cells | Nominal cells capacity | Ah | 26 |
| Nominal cells voltage | V | 3.7 | |
| Nominal cells energy | kWh | 0.0962 | |
| Modules | Nominal modules energy | kWh | 6.25 |
| Number of modules | - | 8 | |
| Mass of module | kg | 42 | |
| Pack | Nominal packs capacity | Ah | 58.8 |
| Nominal packs voltage | V | 687 | |
| Nominal packs energy | kWh | 41.22 | |
| Number of modules | - | 3–6 | |
| Mass of pack | kg | 485 |
Table 3.
Boxplot analysis of energy consumption (kWh/km).
| Month | µ | SD | Min | Q1 | Med | Q3 | Max |
|---|---|---|---|---|---|---|---|
| July 2018 | 1.13 | 0.07 | 0.98 | 1.09 | 1.13 | 1.18 | 1.27 |
| August 2018 | 1.16 | 0.08 | 1.04 | 1.10 | 1.16 | 1.22 | 1.39 |
| September 2018 | 1.08 | 0.08 | 0.97 | 1.00 | 1.08 | 1.12 | 1.29 |
| October 2018 | 1.16 | 0.11 | 0.94 | 1.07 | 1.16 | 1.23 | 1.42 |
| November 2018 | 1.48 | 0.25 | 1.02 | 1.34 | 1.48 | 1.60 | 1.93 |
| December 2018 | 1.82 | 0.17 | 1.52 | 1.69 | 1.82 | 1.92 | 2.20 |
| January 2019 | 1.91 | 0.19 | 1.56 | 1.76 | 1.89 | 2.02 | 2.26 |
| February 2019 | 1.59 | 0.17 | 1.33 | 1.44 | 1.59 | 1.77 | 1.90 |
| March 2019 | 1.35 | 0.18 | 1.10 | 1.20 | 1.33 | 1.45 | 1.67 |
| April 2019 | 1.34 | 0.10 | 1.16 | 1.27 | 1.34 | 1.41 | 1.47 |
| May 2019 | 1.31 | 0.07 | 1.14 | 1.24 | 1.31 | 1.35 | 1.43 |
| June 2019 | 1.31 | 0.06 | 1.19 | 1.26 | 1.31 | 1.35 | 1.43 |
Table 4.
Amount of the energy recovered by regenerative braking (kWh/km).
| Month | µ | SD | Min | Q1 | Med | Q3 | Max |
|---|---|---|---|---|---|---|---|
| July 2018 | 0.43 | 0.05 | 0.35 | 0.38 | 0.42 | 0.46 | 0.53 |
| August 2018 | 0.40 | 0.05 | 0.29 | 0.37 | 0.41 | 0.44 | 0.47 |
| September 2018 | 0.42 | 0.02 | 0.39 | 0.41 | 0.43 | 0.44 | 0.46 |
| October 2018 | 0.43 | 0.03 | 0.36 | 0.41 | 0.44 | 0.45 | 0.49 |
| November 2018 | 0.37 | 0.04 | 0.29 | 0.35 | 0.37 | 0.40 | 0.45 |
| December 2018 | 0.29 | 0.04 | 0.20 | 0.27 | 0.30 | 0.33 | 0.34 |
| January 2019 | 0.29 | 0.03 | 0.22 | 0.26 | 0.29 | 0.31 | 0.35 |
| February 2019 | 0.35 | 0.04 | 0.26 | 0.32 | 0.37 | 0.39 | 0.41 |
| March 2019 | 0.41 | 0.05 | 0.33 | 0.37 | 0.39 | 0.44 | 0.52 |
| April 2019 | 0.48 | 0.05 | 0.34 | 0.44 | 0.48 | 0.53 | 0.57 |
| May 2019 | 0.50 | 0.05 | 0.41 | 0.47 | 0.49 | 0.53 | 0.60 |
| June 2019 | 0.50 | 0.05 | 0.39 | 0.47 | 0.50 | 0.53 | 0.61 |
Table 5.
The energy balance of the Solaris Urbino 12e electric bus.
| Value | 2018 | 2019 | |||||||||||
|---|---|---|---|---|---|---|---|---|---|---|---|---|---|
| July | August | September | October | November | December | January | February | March | April | May | June | ||
| Temperature (°C) | Daily minim | 9.6 | 11.6 | 0.6 | 1.0 | –10.0 | –12.5 | –15.0 | –9 | –4.8 | –0.7 | 2.3 | 11.1 |
| Monthly minim | 15.2 | 19.8 | 8.0 | 5.9 | –7.0 | –7.2 | –10.4 | –4.4 | 3.0 | 7.6 | 4.7 | 16.3 | |
| Average | 21.0 | 23.2 | 18.6 | 13.4 | 5.0 | -0.2 | –8 | 2.2 | 8.2 | 11.8 | 15.1 | 22.8 | |
| Monthly maxim | 24.4 | 25.5 | 23.7 | 19.1 | 17.6 | 3.6 | 2.7 | 8.0 | 12.4 | 18.8 | 20.3 | 26.3 | |
| Daily maxim | 29.7 | 31.9 | 31.2 | 25.2 | 23.6 | 6.0 | 5.5 | 15.5 | 20.4 | 26.3 | 26.6 | 32.0 | |
| Humidity(%) | Daily minim | 35.0 | 31.0 | 27.0 | 25.0 | 14.0 | 62.0 | 59.0 | 34.0 | 27.0 | 21.0 | 34.0 | 28.0 |
| Monthly minim | 55.5 | 55.1 | 54.7 | 52.0 | 47.7 | 78.4 | 71.8 | 58.1 | 46.3 | 37.1 | 61.5 | 51.8 | |
| Average | 75.5 | 68.1 | 66.5 | 69.6 | 84.7 | 95.9 | 94.7 | 80.4 | 62.2 | 59.5 | 78.3 | 68.3 | |
| Monthly maxim | 97.4 | 85.3 | 91.4 | 97.9 | 100.0 | 100.0 | 100.0 | 97.8 | 95.8 | 93.5 | 97.3 | 87.7 | |
| Daily maxim | 100.0 | 100.0 | 100.0 | 100.0 | 100.0 | 100.0 | 100.0 | 100.0 | 100.0 | 100.0 | 100.0 | 100.0 | |
| Atmospheric Pressure (Torr) | Daily minim | 718.3 | 720.6 | 721.0 | 713.8 | 713.5 | 715.6 | 707.2 | 716.5 | 715.8 | 716.5 | 714.8 | 722.8 |
| Monthly minim | 718.8 | 721.6 | 722.5 | 716.0 | 714.4 | 719.1 | 709.6 | 717.8 | 719.0 | 717.3 | 716.3 | 723.7 | |
| Average | 723.8 | 727.3 | 728.7 | 729.0 | 730.3 | 728.7 | 721.5 | 729.8 | 726.2 | 725.2 | 722.2 | 726.9 | |
| Monthly maxim | 726.9 | 731.0 | 740.4 | 735.6 | 738.1 | 733.5 | 731.2 | 739.9 | 737.3 | 733.6 | 728.7 | 732.5 | |
| Daily maxim | 727.7 | 731.8 | 746.5 | 736.8 | 738.9 | 734.4 | 733.9 | 741.4 | 738.4 | 734.8 | 729.5 | 733.7 | |
| Consumption (kWh/km) | Daily minim | 0.87 | 0.88 | 0.83 | 0.80 | 0.88 | 0.91 | 1.20 | 1.00 | 0.90 | 0.79 | 0.83 | 0.95 |
| Monthly minim | 0.87 | 0.88 | 0.83 | 0.80 | 0.88 | 0.91 | 1.20 | 1.00 | 0.90 | 0.79 | 0.83 | 0.95 | |
| Average | 1.13 | 1.16 | 1.07 | 1.16 | 1.45 | 1.78 | 1.90 | 1.60 | 1.30 | 1.30 | 1.28 | 1.33 | |
| Monthly maxim | 1.58 | 1.54 | 1.67 | 1.71 | 2.22 | 2.49 | 2.90 | 2.30 | 2.30 | 2.63 | 2.09 | 1.78 | |
| Daily maxim | 1.58 | 1.54 | 1.67 | 1.71 | 2.22 | 2.49 | 2.90 | 2.30 | 2.30 | 2.63 | 2.09 | 1.78 | |
| Recover (kWh/km) | Daily minim | 0.21 | 0.16 | 0.10 | 0.19 | 0.13 | 0.09 | 0.10 | 0.20 | 0.20 | 0.00 | 0.00 | 0.12 |
| Monthly minim | 0.21 | 0.16 | 0.10 | 0.19 | 0.13 | 0.09 | 0.10 | 0.20 | 0.20 | 0.00 | 0.00 | 0.12 | |
| Average | 0.43 | 0.40 | 0.42 | 0.43 | 0.38 | 0.29 | 0.30 | 0.30 | 0.40 | 0.48 | 0.50 | 0.49 | |
| Monthly maxim | 0.69 | 0.72 | 0.96 | 0.77 | 0.70 | 0.56 | 0.60 | 0.60 | 0.70 | 1.22 | 0.99 | 0.89 | |
| Daily maxim | 0.69 | 0.72 | 0.96 | 0.77 | 0.70 | 0.56 | 0.60 | 0.60 | 0.70 | 1.29 | 0.99 | 0.89 | |
Table 6.
Data for energy consumption and energy recovery vs. atmospheric conditions.
| Energy Consumption (kWh) | Energy Recovery (kWh) | Temperature (°C) | Humidity (%) | Atmospheric Pressure (Torr) | Air Density (kg/m3) |
|---|---|---|---|---|---|
| 1.1384 | 0.4293 | 20.8806 | 74.7451 | 723.4645 | 1.1346 |
| 1.1582 | 0.4024 | 22.9064 | 68.6548 | 727.0193 | 1.1321 |
| 1.0859 | 0.4233 | 17.0466 | 68.9433 | 729.0666 | 1.1620 |
| 1.1645 | 0.4288 | 13.1774 | 70.6838 | 728.8581 | 1.1775 |
| 1.4642 | 0.3844 | 5.9866 | 82.6733 | 730.0066 | 1.2136 |
| 1.7943 | 0.2959 | –0.4645 | 93.0290 | 727.6258 | 1.2367 |
| 1.9076 | 0.2877 | –1.9354 | 93.4451 | 721.3612 | 1.2331 |
| 1.5870 | 0.3532 | 2.2250 | 80.7000 | 729.9035 | 1.2246 |
| 1.3475 | 0.4098 | 7.8096 | 62.1258 | 726.4741 | 1.1979 |
| 1.3383 | 0.4758 | 12.2600 | 61.7166 | 724.9633 | 1.1755 |
| 1.3061 | 0.5018 | 14.6064 | 80.0064 | 722.5193 | 1.1602 |
| 1.2719 | 0.4924 | 22.2733 | 69.4200 | 727.0833 | 1.1351 |
© 2019 by the authors. Licensee MDPI, Basel, Switzerland. This article is an open access article distributed under the terms and conditions of the Creative Commons Attribution (CC BY) license (http://creativecommons.org/licenses/by/4.0/).
Share and Cite
MDPI and ACS Style
Iclodean, C.; Cordoș, N.; Todoruț, A. Analysis of the Electric Bus Autonomy Depending on the Atmospheric Conditions. Energies 2019, 12, 4535. https://0-doi-org.brum.beds.ac.uk/10.3390/en12234535
AMA Style
Iclodean C, Cordoș N, Todoruț A. Analysis of the Electric Bus Autonomy Depending on the Atmospheric Conditions. Energies. 2019; 12(23):4535. https://0-doi-org.brum.beds.ac.uk/10.3390/en12234535
Chicago/Turabian StyleIclodean, Călin, Nicolae Cordoș, and Adrian Todoruț. 2019. "Analysis of the Electric Bus Autonomy Depending on the Atmospheric Conditions" Energies 12, no. 23: 4535. https://0-doi-org.brum.beds.ac.uk/10.3390/en12234535
Note that from the first issue of 2016, this journal uses article numbers instead of page numbers. See further details here.