Techno-Economic Assessment of Mobilized Thermal Energy Storage System Using Geothermal Source in Polish Conditions


1
Department of Energy and Fuels, AGH University of Science and Technology, 30 Mickiewicza Ave., 30-059 Cracow, Poland
2
Mineral and Energy Economy Research Institute, Polish Academy of Sciences, 7A Wybickiego St., 31-261 Cracow, Poland
*
Author to whom correspondence should be addressed.
Energies 2020, 13(13), 3404; https://0-doi-org.brum.beds.ac.uk/10.3390/en13133404
Submission received: 21 May 2020
/
Revised: 18 June 2020
/
Accepted: 28 June 2020
/
Published: 2 July 2020
(This article belongs to the Special Issue Geothermal Energy Utilization and Technologies 2020)
Abstract
:The paper considers technical and economic possibilities to provide geothermal heat to individual recipients using a mobile thermal storage system (M-TES) in Polish conditions. The heat availability, temperature and heat cost influence the choice of location—Bańska Niżna, near Zakopane in the southern part of the Poland. The indirect contact energy storage container was selected with phase change material characterized by a melting temperature of 70 °C and a heat storage capacity of 250 kJ/kg, in the amount of 800 kg. The economic profitability of the M-TES system (with a price per warehouse of 6000 EUR, i.e., a total of 12,000 EUR—two containers are needed) can be achieved for a heat demand of 5000 kWh/year with the price of a replaced heat source at the level of 0.21 EUR/kWh and a distance between the charging station and building (heat recipient) of 0.5 km. For the heat demand of 15,000 kWh/year, the price for the replaced heat reached EUR 0.11/kWh, and the same distance. In turn, for a demand of 25,000 kWh/year, the price of the replaced heat source reached 0.085 EUR/kWh. The distance significantly affected the economic profitability of the M-TES system—for the analyzed case, a distance around 3–4 km from the heat source should be considered.
1. Introduction
For several years, a global energy transformation due to the growing awareness of greenhouse gas (GHG) emissions and fossil fuel depletion has been observed. In this context, the use of renewable energy sources, including geothermal energy, became one of the main strategies of this transformation. Geothermal energy is produced mainly as a result of the decay of potassium, uranium and thorium radioisotopes [1] in the planetary interior as thermal energy [2]. Compared with other renewable energy sources, it has many advantages, among others, large reserves of geothermal sources, wide distribution and scope of applications, good stability, and high utilization efficiency of use. Additionally, once stabilized, they can be used for a long period of time [3,4]. In addition, geothermal sources are the only renewable energy source that is not affected by solar radiation and gravitational attraction between the sun and the moon [5]. However, the main problem with geothermal resources is that the speed of geothermal reservoir exploitations can be faster than heat replacement, and nowadays this is considered as the challenge connected with geothermal heat utilization. It largely depends on such factors as geological time scale, geothermal applications and used-heat reinjection methods [6].
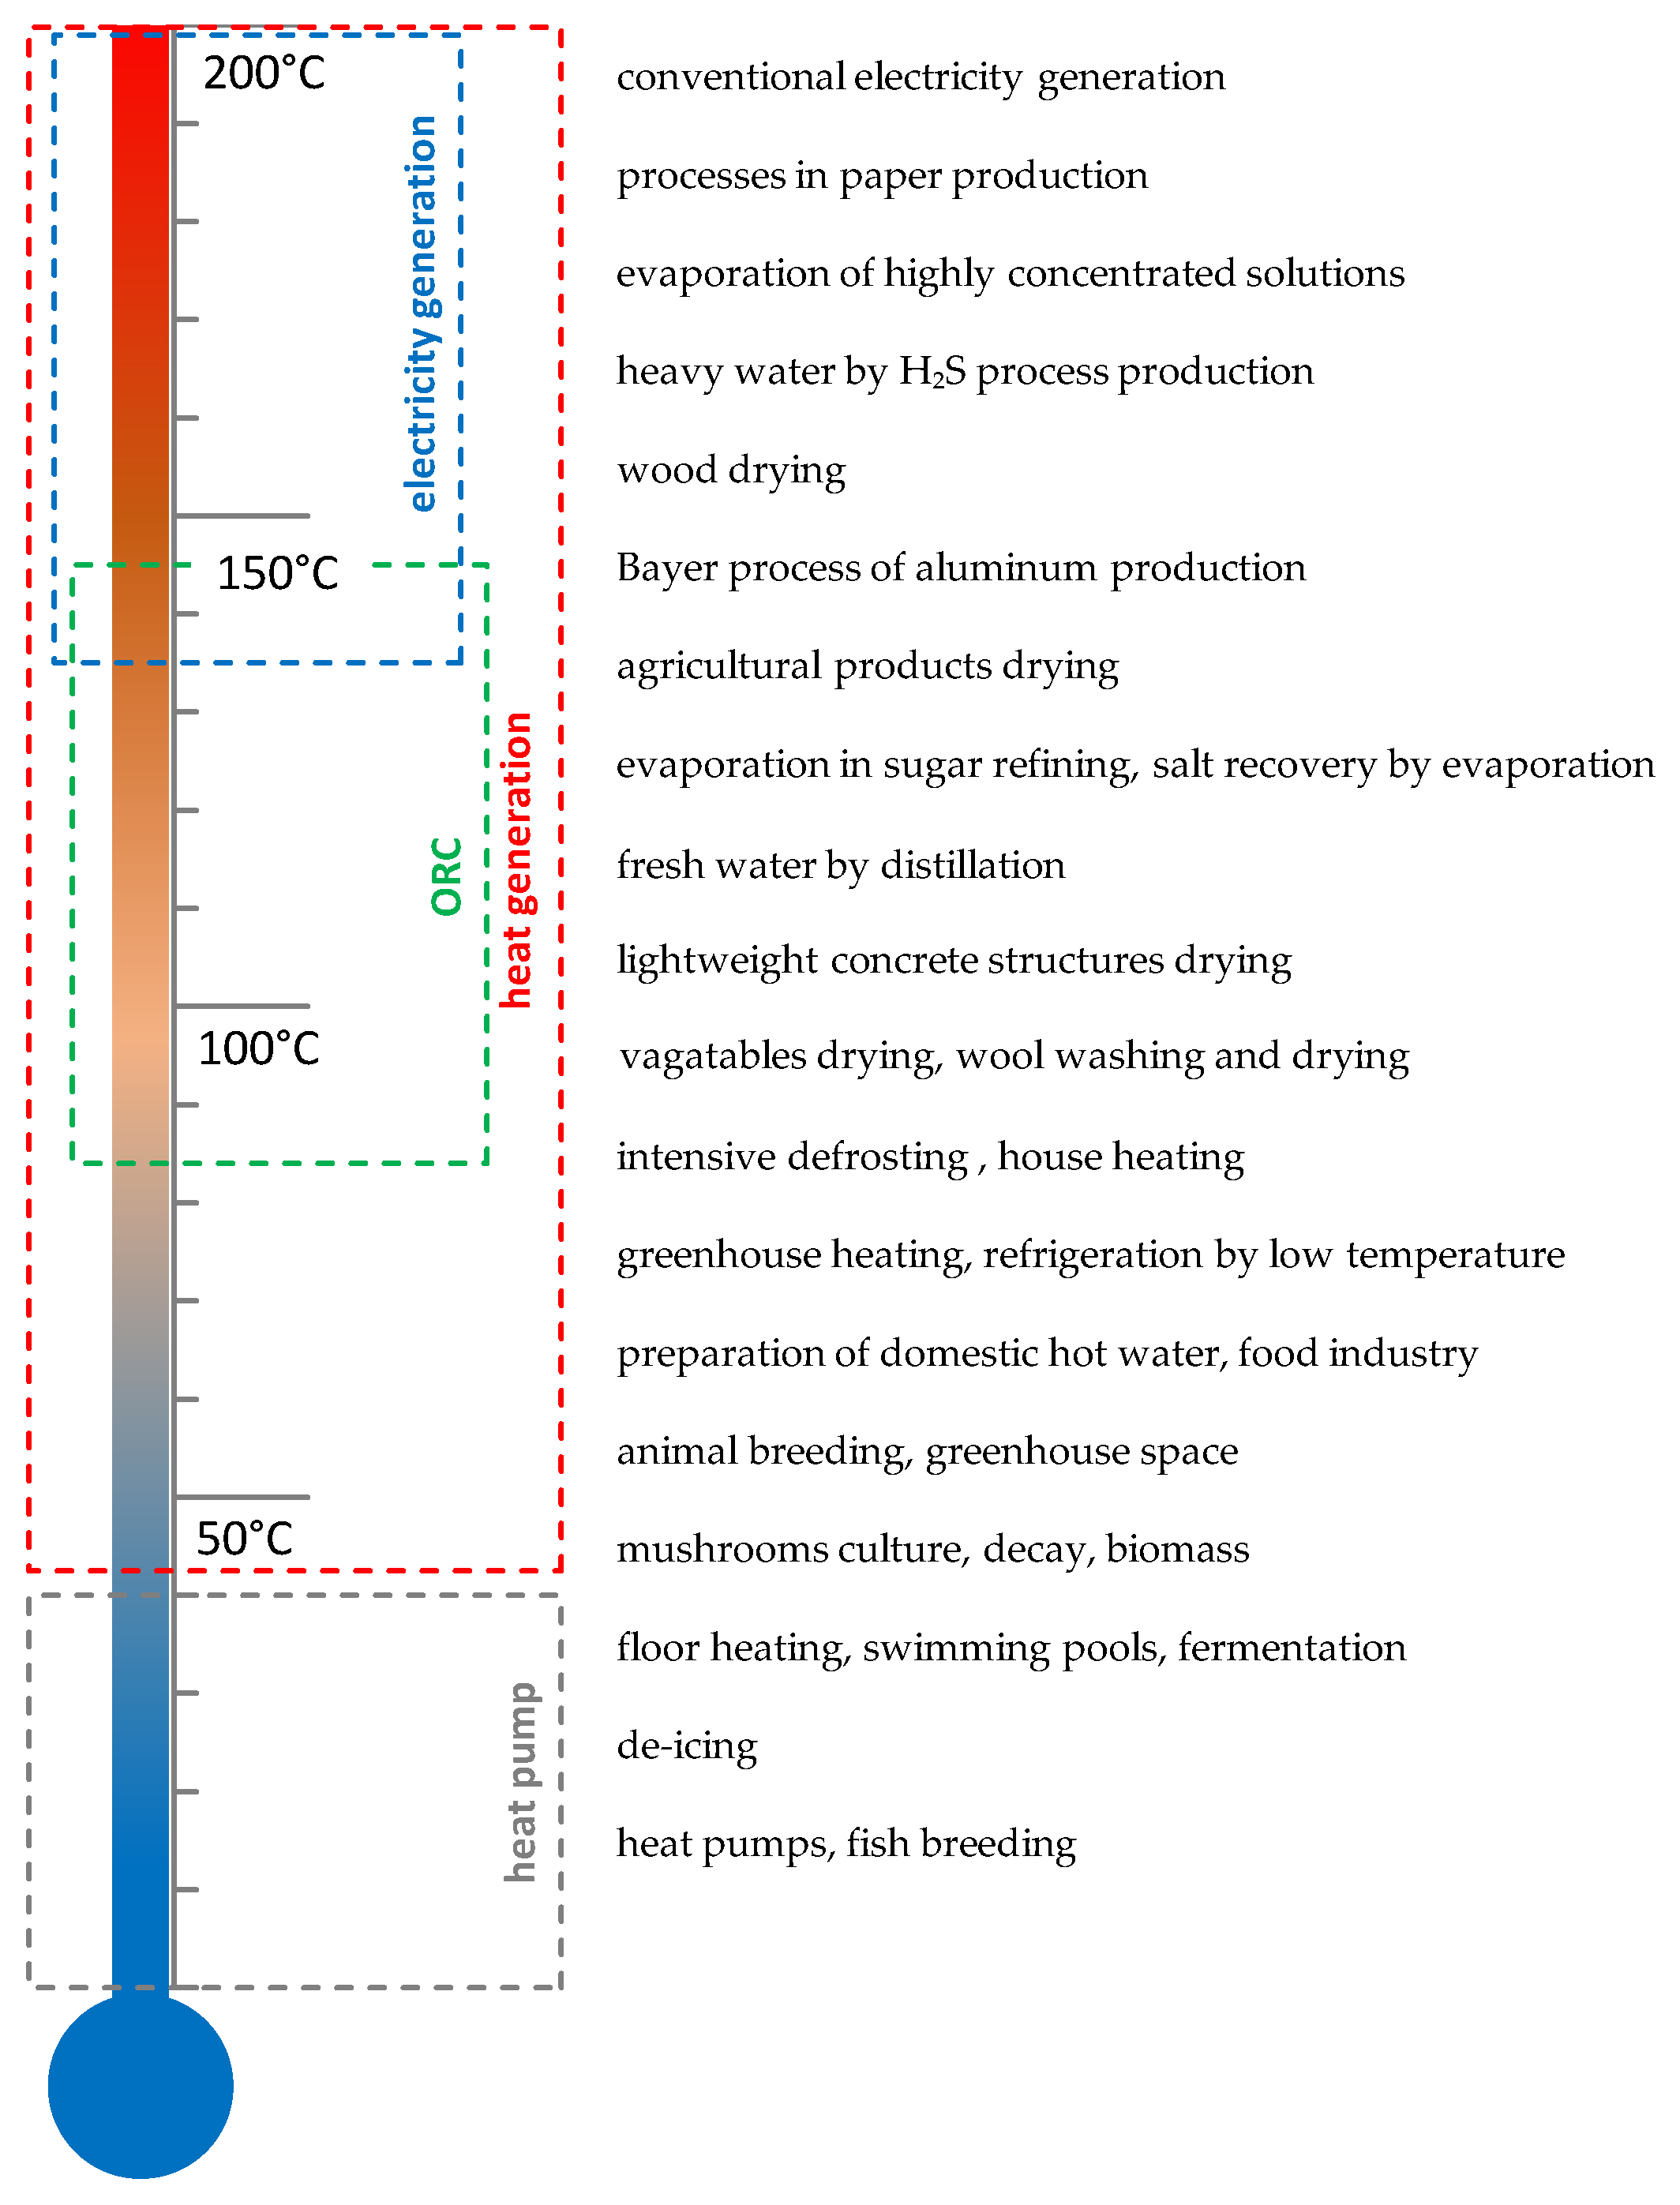
The great potential of geothermal resources used for electric power generation has lately been recognized more and more [7]. However, geothermal heat has been widely used directly for centuries by humans and animals, and can be found in various regions of the world [8]. Heat appears on the earth’s surface in various forms that affect the way it is used. The wide spectrum of geofluid temperature determines the way it is used, and the range of applications as a temperature function is shown in Figure 1, which is based on the Lindal diagram [9,10]. Currently, geothermal heat can be utilized in two forms: direct use of hot springs for bathing, aquaculture, geothermal heating and indirect in electric power generation [11,12]. Global geothermal power capacity by the end of 2019 totaled 13.93 GW, with annual electricity generation reaching 85.98 TWh in 2017 (most recent data) [13]. Geothermal power plants can be categorized by the technologies exploiting geothermal resources, according to power plant configuration: dry steam plant (23%), single flash (41%), double flash (19%), binary (14%) and advanced geothermal energy conversion systems such as tripe flash, hybrid flash-binary systems, hybrid fossil-geothermal systems, hybrid back pressure system (3%) [14,15]. A two-group classification (binary cycles for lower well enthalpies and steam cycles for higher enthalpies) has been suggested by Valdimarsson [16].
The geothermal heat can be used directly in many applications depending on a temperature range (mostly used reservoirs with temperature between 20 °C and 150 °C) [17,18]. In 2018, the direct utilization of geothermal energy was identified and reported for 82 countries with an estimated global installed thermal capacity at 70.33 GWth (with 0.265 capacity factor and a growth rate 7.7% annually) [19,20]. Lund and Boyd [21] show that heat energy utilization reaches 163,287 GWh and identify nine utilization categories: geothermal heat pump (90,297 GWh), bathing and swimming (33,147 GWh), space heating (24,493 GWh), greenhouse heating (7347 GWh), aquaculture pond heating (3266 GWh), industrial uses (2939 GWh), cooling and snow melting (653 GWh), agricultural drying (653 GWh) and others (490 GWh). As it can be seen from these categories, the most popular are geothermal heat pumps, which can be used in many applications under different conditions [22,23]. Figure 1 shows that the direct use (DU) of geothermal energy varies in range from high-temperature industrial applications to very low-temperature aquaculture. Additionally, in some ranges, the geothermal heat utilized in DU can not only meet thermal requirements for some applications, but also can be used in combined heat and power configurations (CHP) [24]. Matuszewska and Olczak [25] show the modified binary system to provide heat and electricity simultaneously from low-enthalpy geothermal reservoirs (normally used for providing district heating in Polish conditions). Carotenuto et al. [26] analyze novel solar–geothermal low-temperature district heating and cooling and domestic hot water systems. The case study has been developed for the district area of Monterusciello in Southern Italy, where the geothermal source obtains 55 °C. Hepbasli and Canakci [27] show, in the example of geothermal district heating in Izmir-Balcova, that geothermal energy is cheaper than other energy resources in Turkey (including fossil fuels) and thus it can make a contribution in GHG emissions. Sander’s [28] study challenges opportunities of geothermal district heating systems based on the analysis of China, Germany, Iceland, and the U.S. country assessments.
One of the ways to deliver geothermal heat to the recipient in a less conventional way than with the help of standard heat pipelines is to use a mobile heat storage, which will be the subject of the following analysis.
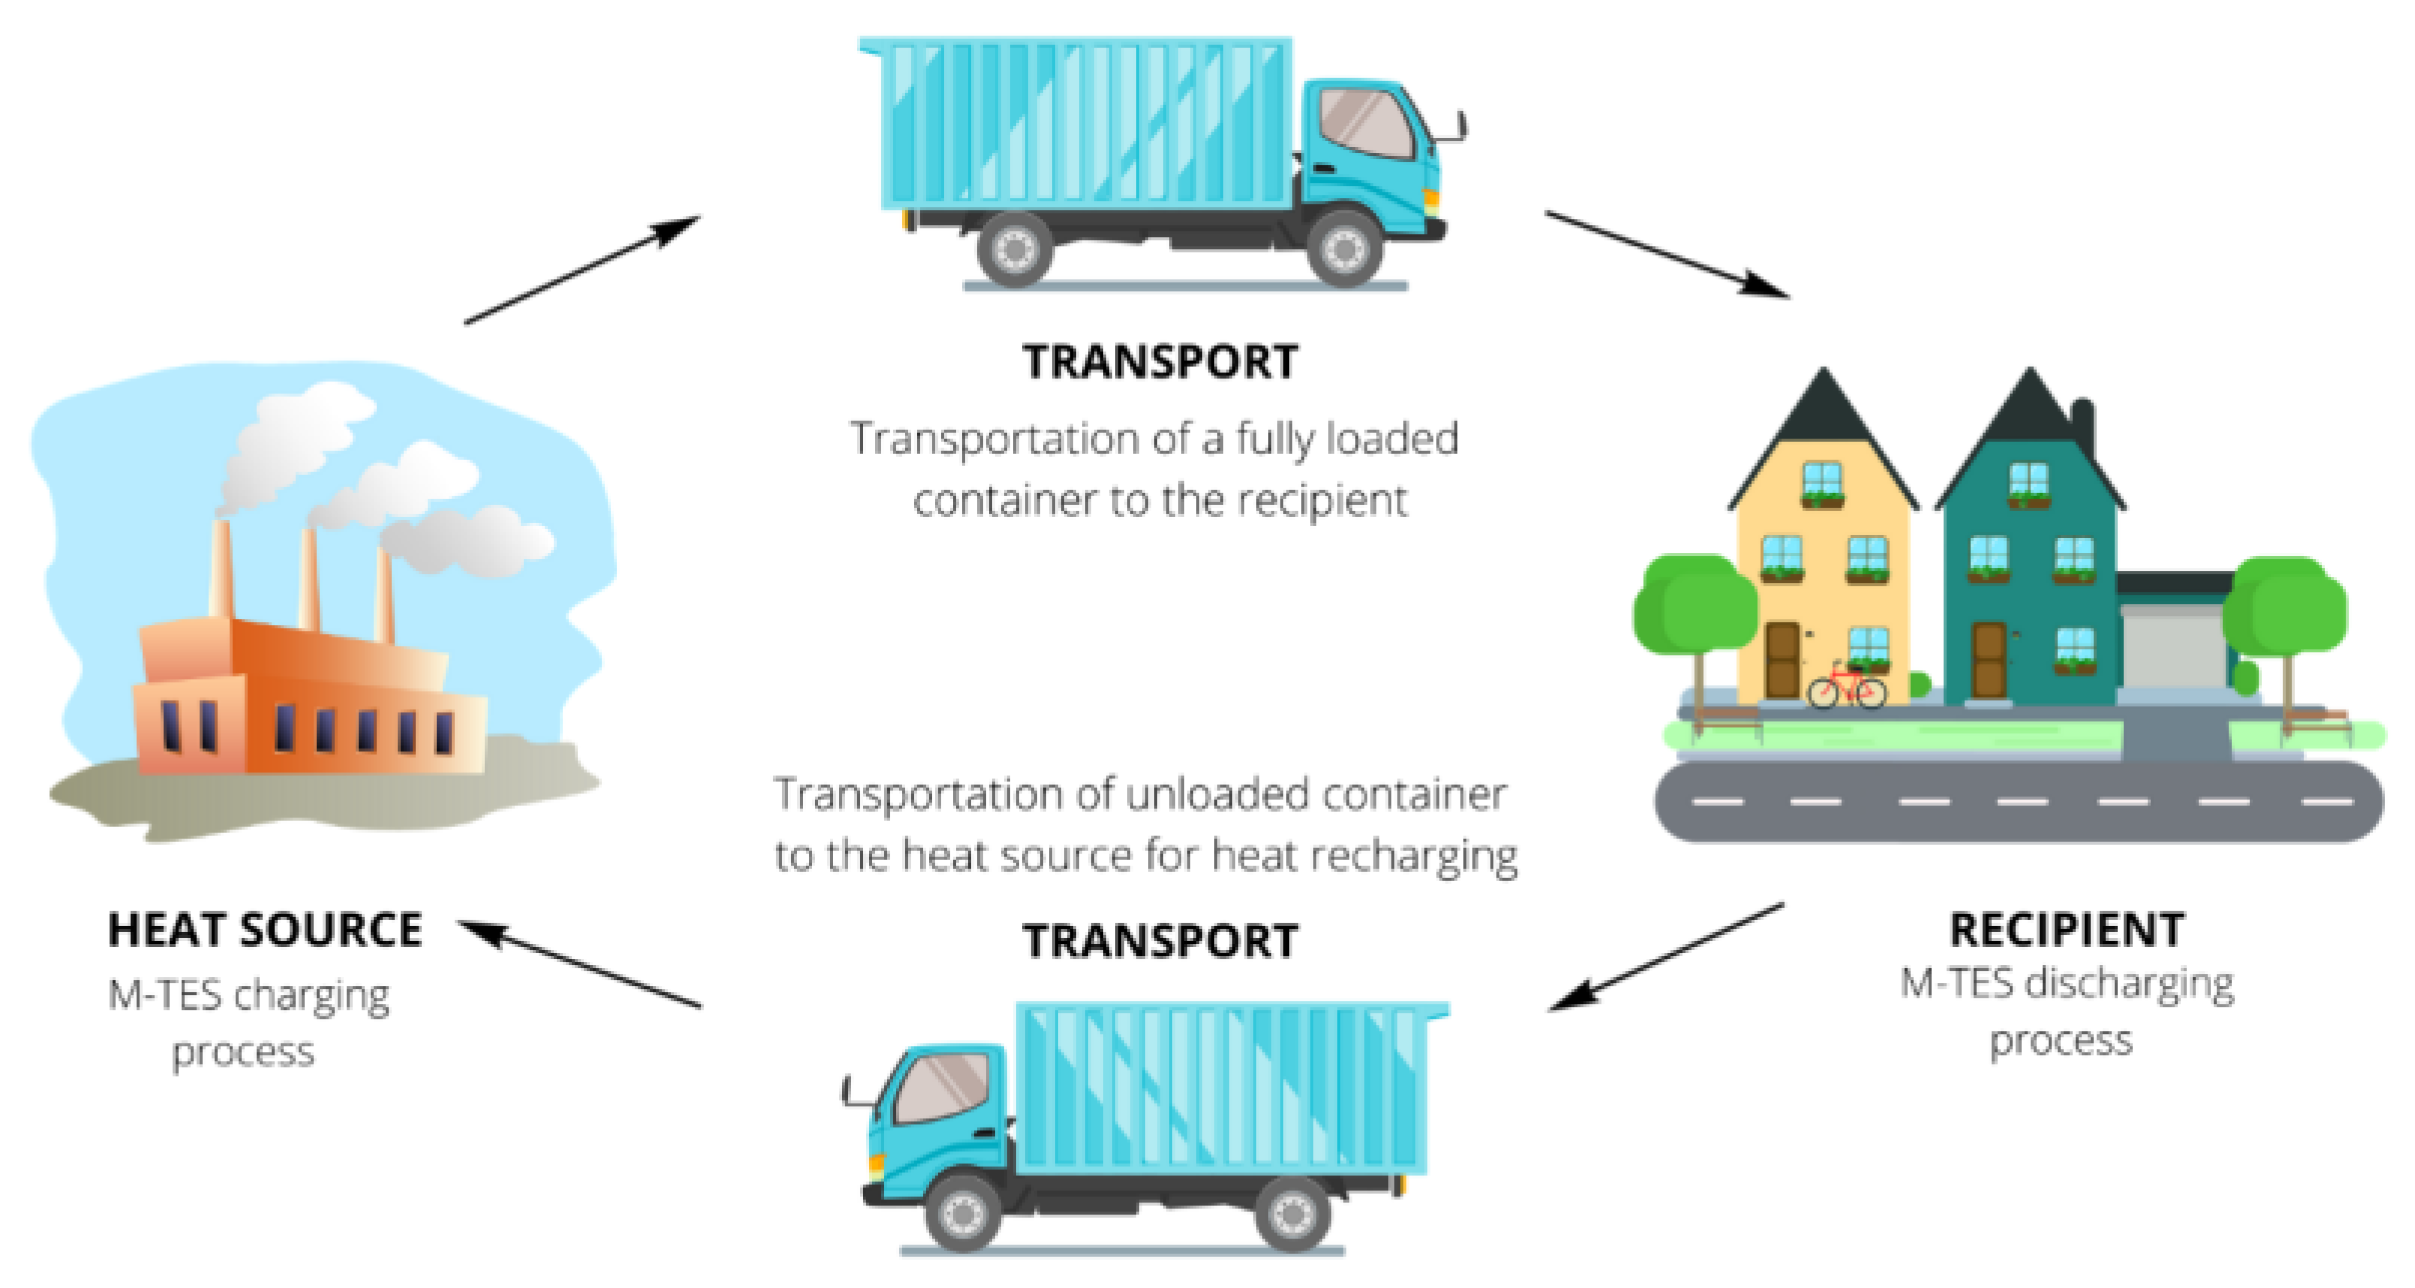
Mobilized thermal energy storage systems are based on the use of heat in a place other than its generation, collection, and storage. The basic assumption is storing waste heat, excess heat or heat produced from renewable energy sources in an amount larger than local demand. Heat transported using mobile heat containers can be stored using phase change materials based on the use of latent heat or using zeolites that use thermochemical transformations. The article cites examples of both possibilities; however, the analysis focuses on mobile thermal energy storage (M-TES) based on phase change materials.
The stored heat can be transported by road, rail, water, or a combination of these. Due to the greatest universality, road transport is the most popular. It can take place using trucks (with large sizes of the container) or cars equipped with a trailer (with smaller container sizes). The heat is transported to recipients, where the M-TES is discharged.
Potential heat sources can be selected from: renewable heat sources, including geothermal heat, industrial plants and biogas plants producing large amounts of waste heat. A number of requirements are set for heat sources: the possibility of effective heat collection and transfer to the phase change material (PCM)-container, an appropriate heat temperature enabling material full phase transformation, constant heat availability, an adequate amount of available heat, high thermal efficiency. Additionally, the heat transportation process from heat source to the recipient location must meet the relevant requirements; the distance cannot be too large. Distance depends on the parameters of the PCM-container and the heat demand at the recipient. The literature shows that it is not advisable for the distance to be more than 30 km [29]. The M-TES needs to be thermally protected to minimize heat losses in transport and during unloading. The M-TES system assumes the use of two heat containers working in parallel and enabling constant access to heat. When the first one is unloaded at the recipient location, the second one is loaded and waits for the delivery to the user.
The place of heat reception should be characterized by heat demand in the right range, suitable heat parameters and operating mode. Potential recipients can be buildings like single and multi-family houses, public buildings, and industry (transport within the same industrial plant).
The mobile thermal energy storage system’s work cycle is presented in Figure 2.
Due to the fact that the M-TES parameters can be flexibly adapted to the parameters of the heat source and the recipient, it is possible to select the appropriate PCM filling the heat container, where parameters will be adapted to the temperature of the heat source, and at the same time, will also be adapted to the needs of the recipients. At the stage of M-TES system design, parameters such as the frequency of deliveries or the size of the container dedicated to a given solution should be considered. These parameters are connected to the size and seasonality of the heat demand. The heat demand (at every hour) is effected by a number of parameters, such as: building size and its condition (statistical [30] and methodical approach [31]), number of residents [31], building usage hours and characteristics [32], and requirements for maintaining the temperature at a certain level, related to weather conditions [33].
In recent years, projects dedicated to mobile heat transport technology have been conducted, as well as the first projects completed with commercial implementations. Selected examples of such solutions are presented below.
Yan Wang et al. [34] designed and tested an M-TES system dedicated to renewable energy and recovered industrial waste heat. The storage unit contained a heat exchanger in the form of compact storage tubes filled with PCM. The system uses 215 kg sodium acetate trihydrate (CH3COONa ·3H2O), which is characterized by: melting temperature: 331 K, density 1330 kg/m3, specific heat 3200 J/(kg·K), thermal conductivity 0.8 W/(m·°C) and enthalpy 260 kJ/kg. The tests showed that 1200 s would be enough to melt 215 kg of PCM filling 80 tubes. The tested system has been able to store 125,576 kJ of heat.
Weilong Wang et al. [35] built and tested lab-scale direct and indirect thermal energy storage containers filled with the phase change material erythritol, which is characterized by melting temperature 118 °C and heat density 330 kJ/kg. The system has been dedicated for the supply of heat recovered from the industry. Two options of M-TES were compared: direct- and indirect-contact containers, and it was concluded that the direct-contact M-TES can be charged and discharged faster than the indirect-contact container (for tested systems).
Marco Deckert et al. [36] optimized and tested an M-TES system based on the system commercially available. The system consists of two 20-foot-long tanks filled with sodium acetate trihydrate, which melts at 58 °C. The heat exchanger is built of 24 tubes. To enhance the charging and discharging process, tubes in one part of the storage were extended with graphite structures. The tested M-TES has been able to store up to 2 MWh of the heat, including 1.3 MWh of latent heat. The authors concluded that the technical and economic feasibility depends on the M-TES storage capacity but also on heat demand of the recipients. The tests indicated areas of improvement and demonstrated the possibility of commercial use for M-TES.
Xuelai Zhang et al. [37] proposed an M-TES system in the form of container with dimensions: 4.1 m × 2 m × 1.25 m (inner tank: 3.6 m × 1.8 m × 1.1 m). The container was filled with stainless steel balls (radius of 60 mm, 80 mm and 100 mm) with new phase change material consisting of 0.4% nanocopper + 99.6% erythritol, which is characterized by phase change temperature 118 °C and latent heat 362.2 kJ/kg. The authors concluded that the biggest impact on the results had the temperature of the oil bath (higher speed obtained in lower initial temperature) and the size of the balls (easier melting for smaller diameter, but heat dissipation is faster for larger sizes).
Andreas Krönauer et al. [38] present the results of one-year long tests where the M-TES was charged to 130 °C, using extraction steam from a waste incineration plant. The heat was transported to the recipient located 7 km from the heat source and used in the drying processes. The tank was filled with 14 tons of Zeolite and had a storage capacity of 2.3 MWh. The authors conducted analysis and identified areas for improvement to increase CO2 reduction and improve efficiency.
This paper focuses on the economical assessment of M-TES using geothermal heat in Polish conditions. There is a lack of information about the profitability of using M-TES for geothermal reservoir utilizations. Additionally, most research focuses on determination of the operating conditions of the geothermal reservoir, and on the amount of energy that can be extracted, but they do not consider the problems with large dispersion of recipients (which may cause an increase in the costs of building a heating network), as well as topography unfavorable for this type of solution. Considering this, the application of M-TES for geothermal heat is justified primarily in places where it is impossible or unprofitable to build a heating network.
In Poland, the temperature of geothermal water does not exceed 100 °C, and most reservoirs have a depth of 3000 m [39]. The most promising and interesting areas from a geothermal point of view are in the southern part of the country, the Podhale Basin. It has sufficient operation conditions for district heating, recreation, balneotherapy and other applications. Additionally, the heating system located there and operated by PEC Geotermia Podhalańska S.A. is currently the largest geothermal installation in Poland with a geothermal heating system capacity ca. 40.8 MWth (the total installed capacity of the heating plant is 80.5 MWth) [40]. The analyzed geothermal heating system is among the largest in Europe and is steadily upgraded [41].
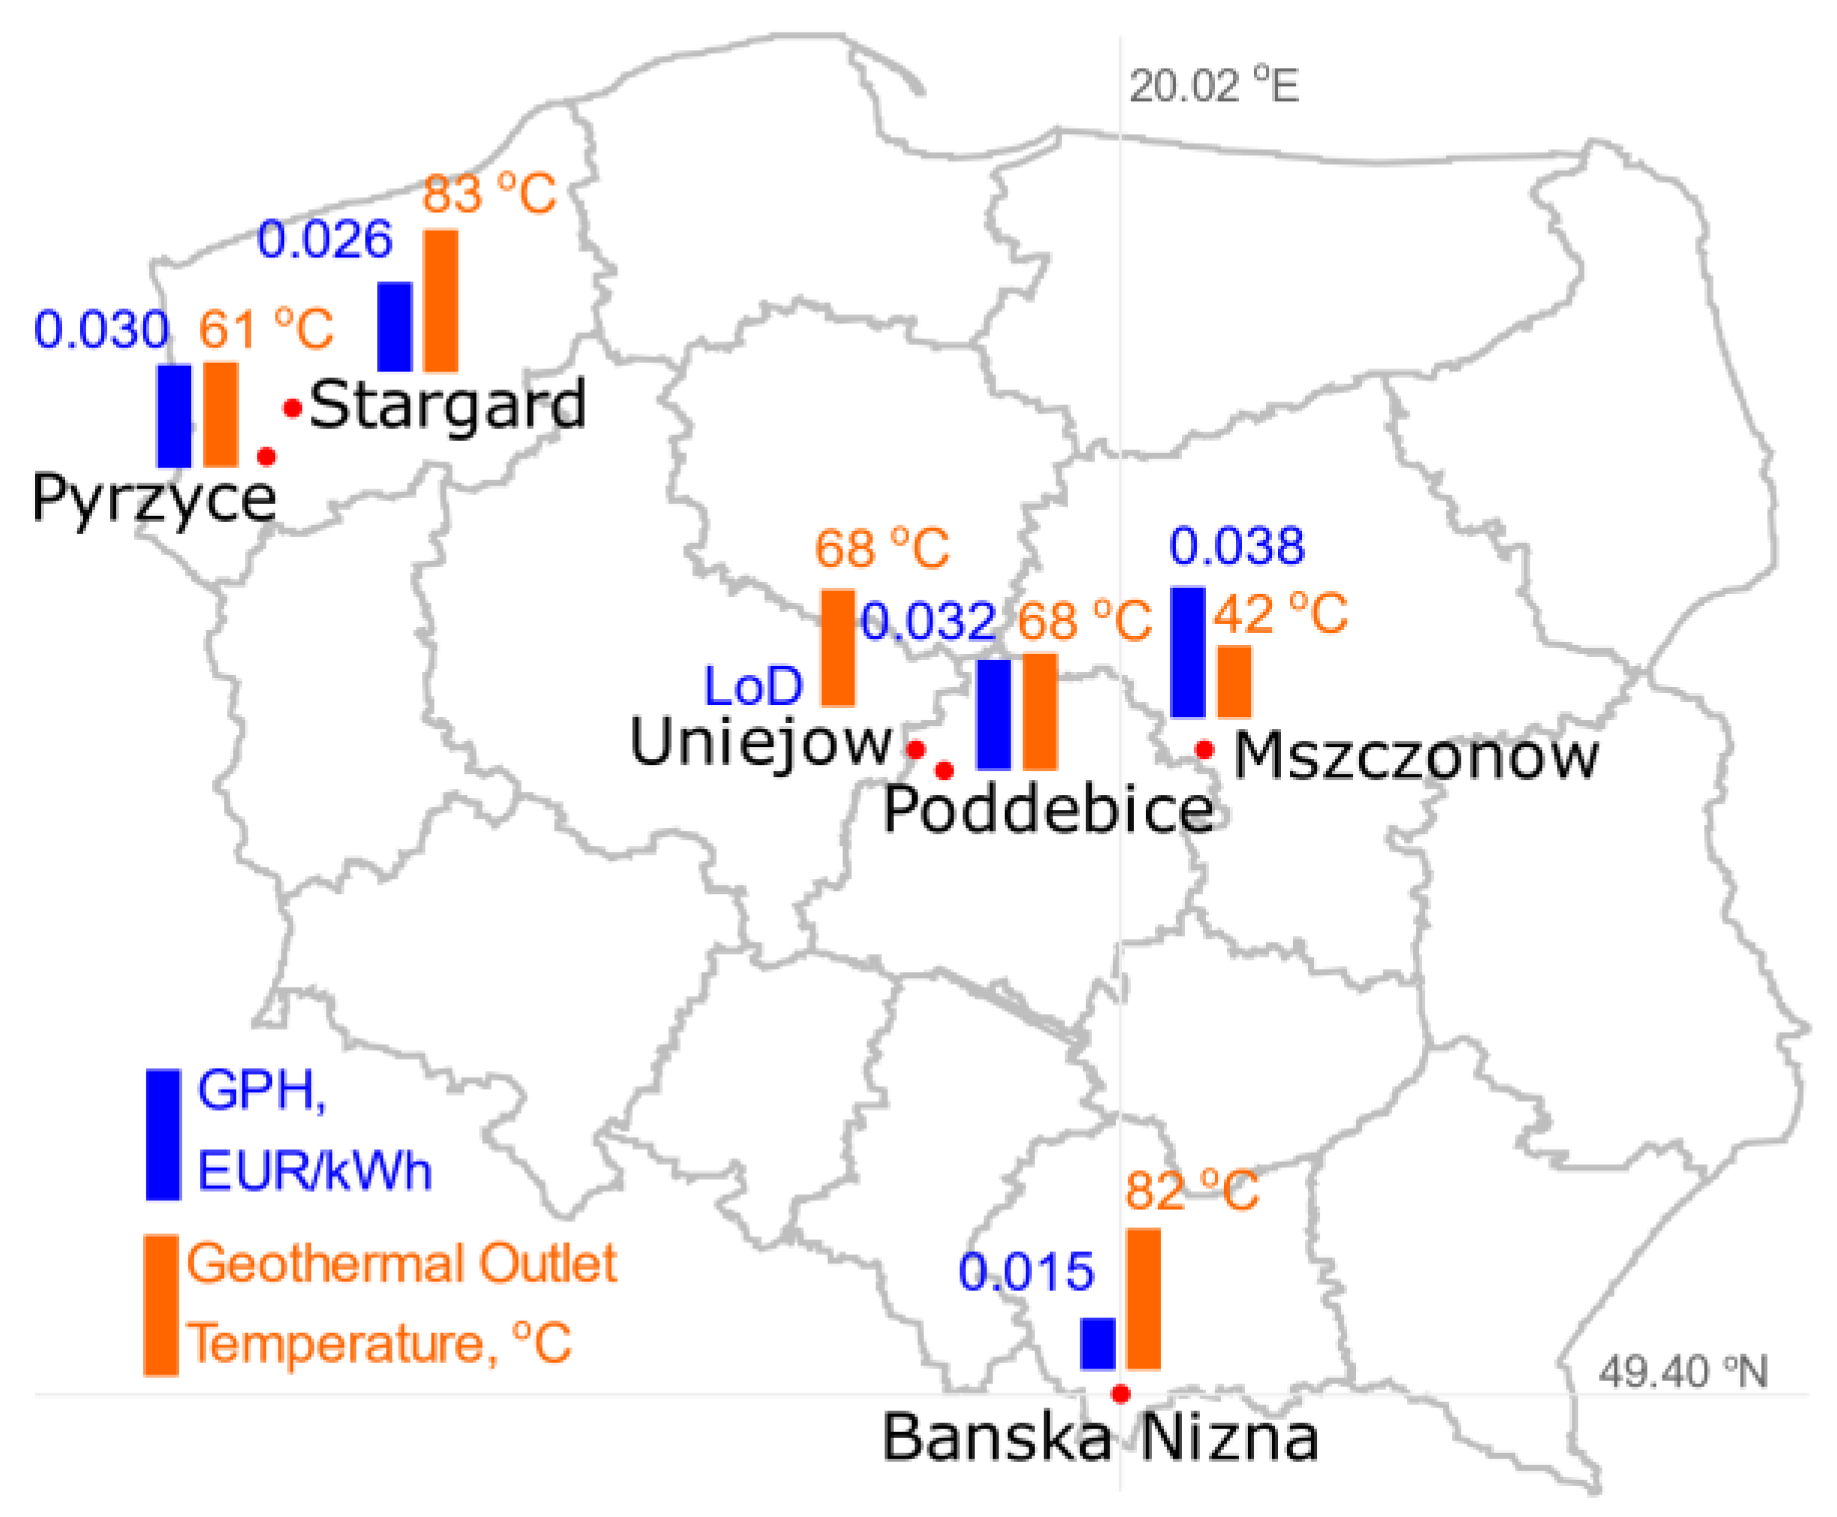
The example of PEC Geotermia Podhalańska S.A. was considered in further analysis due to the location in a mountainous area, which may prevent the extension of a heating network, or significantly increase construction costs. In addition, the price of heat generation using geothermal sources is competitive in relation to other sources and amounts to approx. 0.0322 EUR/kWh, at the same time, the cost of building a heating network is high. Due to the large dispersion of recipients, as well as the landform, the price of heat from geothermal energy, after inclusion of the heat network cost, is high. PEC Geotermia Podhalańska S.A. currently has a heating network with a length of over 100 km, in order to connect new customers not located on the existing network, it is necessary to consider the expansion of the network in terms of the economics of the solution. Due to the high dispersion and differences in the foundation height of buildings, the heating network development costs are high. Therefore, based on global examples, it seems worthwhile to consider the use of M-TES. Figure 3 presents that the price for heat from geothermal energy is lowest compared with other geothermal district heating systems in Poland. This means that, if for PEC Geotermia Podhalańska S.A. the solution is economically justified, it can be further considered for facilities with a higher price for geothermal heat.
Based on the references above, the M-TES for the use of geothermal heat form Bańska Niżna well was analyzed. The economic assessment of these problem was conducted. PEC Geotermia Podhalańska S.A. was selected due to the lowest geothermal heat prices (with no additional fee) and highest geothermal temperature from the production well. There are enough studies about M-TES for geothermal heat utilization, especially in Polish conditions. The novelty of this paper is in analyzing the economical profitability of applying such solutions in mentioned conditions. The paper is structured as follows: Section 2 presents used methods and assumptions; in Section 3, the results are presented; and finally, conclusions are provided in Section 4.
2. Methods and Assumptions
The main purpose of this analysis is to determine the economic profitability of the solution focused on replacing the current heat source in the building with geothermal heat transported by a M-TES. The analysis began by determining the relationship between the M-TES heat capacity and total building heat demand (THD). The next step was to determine the impact of various parameters on Economical Profitability. Finally, the impact of using M-TES transport systems on the reduction of carbon dioxide emission was estimated.
The calculations presented in this article were carried out for M-TES, which uses 800 kg of phase change material for heat storage (maximum amount of PCM that can be safely transported by car with a trailer with a permissible total weight of 3.5 Mg). The material that could potentially be used in this application was selected, taking into account the parameters of the heat source, requirements resulting from the characteristics of the place of heat reception and the phase change materials requirements typical for this type of applications (e.g., appropriate phase transition temperature, high value of heat storage capacity, the highest possible value of the thermal conductivity coefficient, stability of properties after many working cycles, nontoxic, non-harmful for human or environment, nonflammable).
Materials suitable for use in this application include: PureTemp 68 (melting temperature: 68 °C, heat storage capacity: 213 kJ/kg, thermal conductivity liquid/solid: 0.15/0.25 W/(m·°C) [44]; ATP 70 (melting temperature: 70 °C, heat storage capacity: 250 kJ/kg, thermal conductivity 0.2 W/(m·°C) [45]; GAIA HS PCM78 (melting temperature: 78 °C, heat storage capacity: 260 kJ/kg, thermal conductivity liquid/solid: 0.5/0.98 W/(m·°C) [46]; RT 70 HC (melting temperature: 70 °C, heat storage capacity: 260 kJ/kg, thermal conductivity 0.2 W/(m·°C) [47]. For calculation purposes it has been selected PCM characterized by following properties: temperature: 70 °C, heat storage capacity: 250 kJ/kg. The amount of PCM as well as the weight of the entire M-TES was selected in a way which it could be transported by car with a trailer with a permissible total weight of 3.5 Mg. The use of this type of solution was adapted to various transport requirements related to the landform around the heat source (Bańska Nizna).
2.1. Total Heat Demand
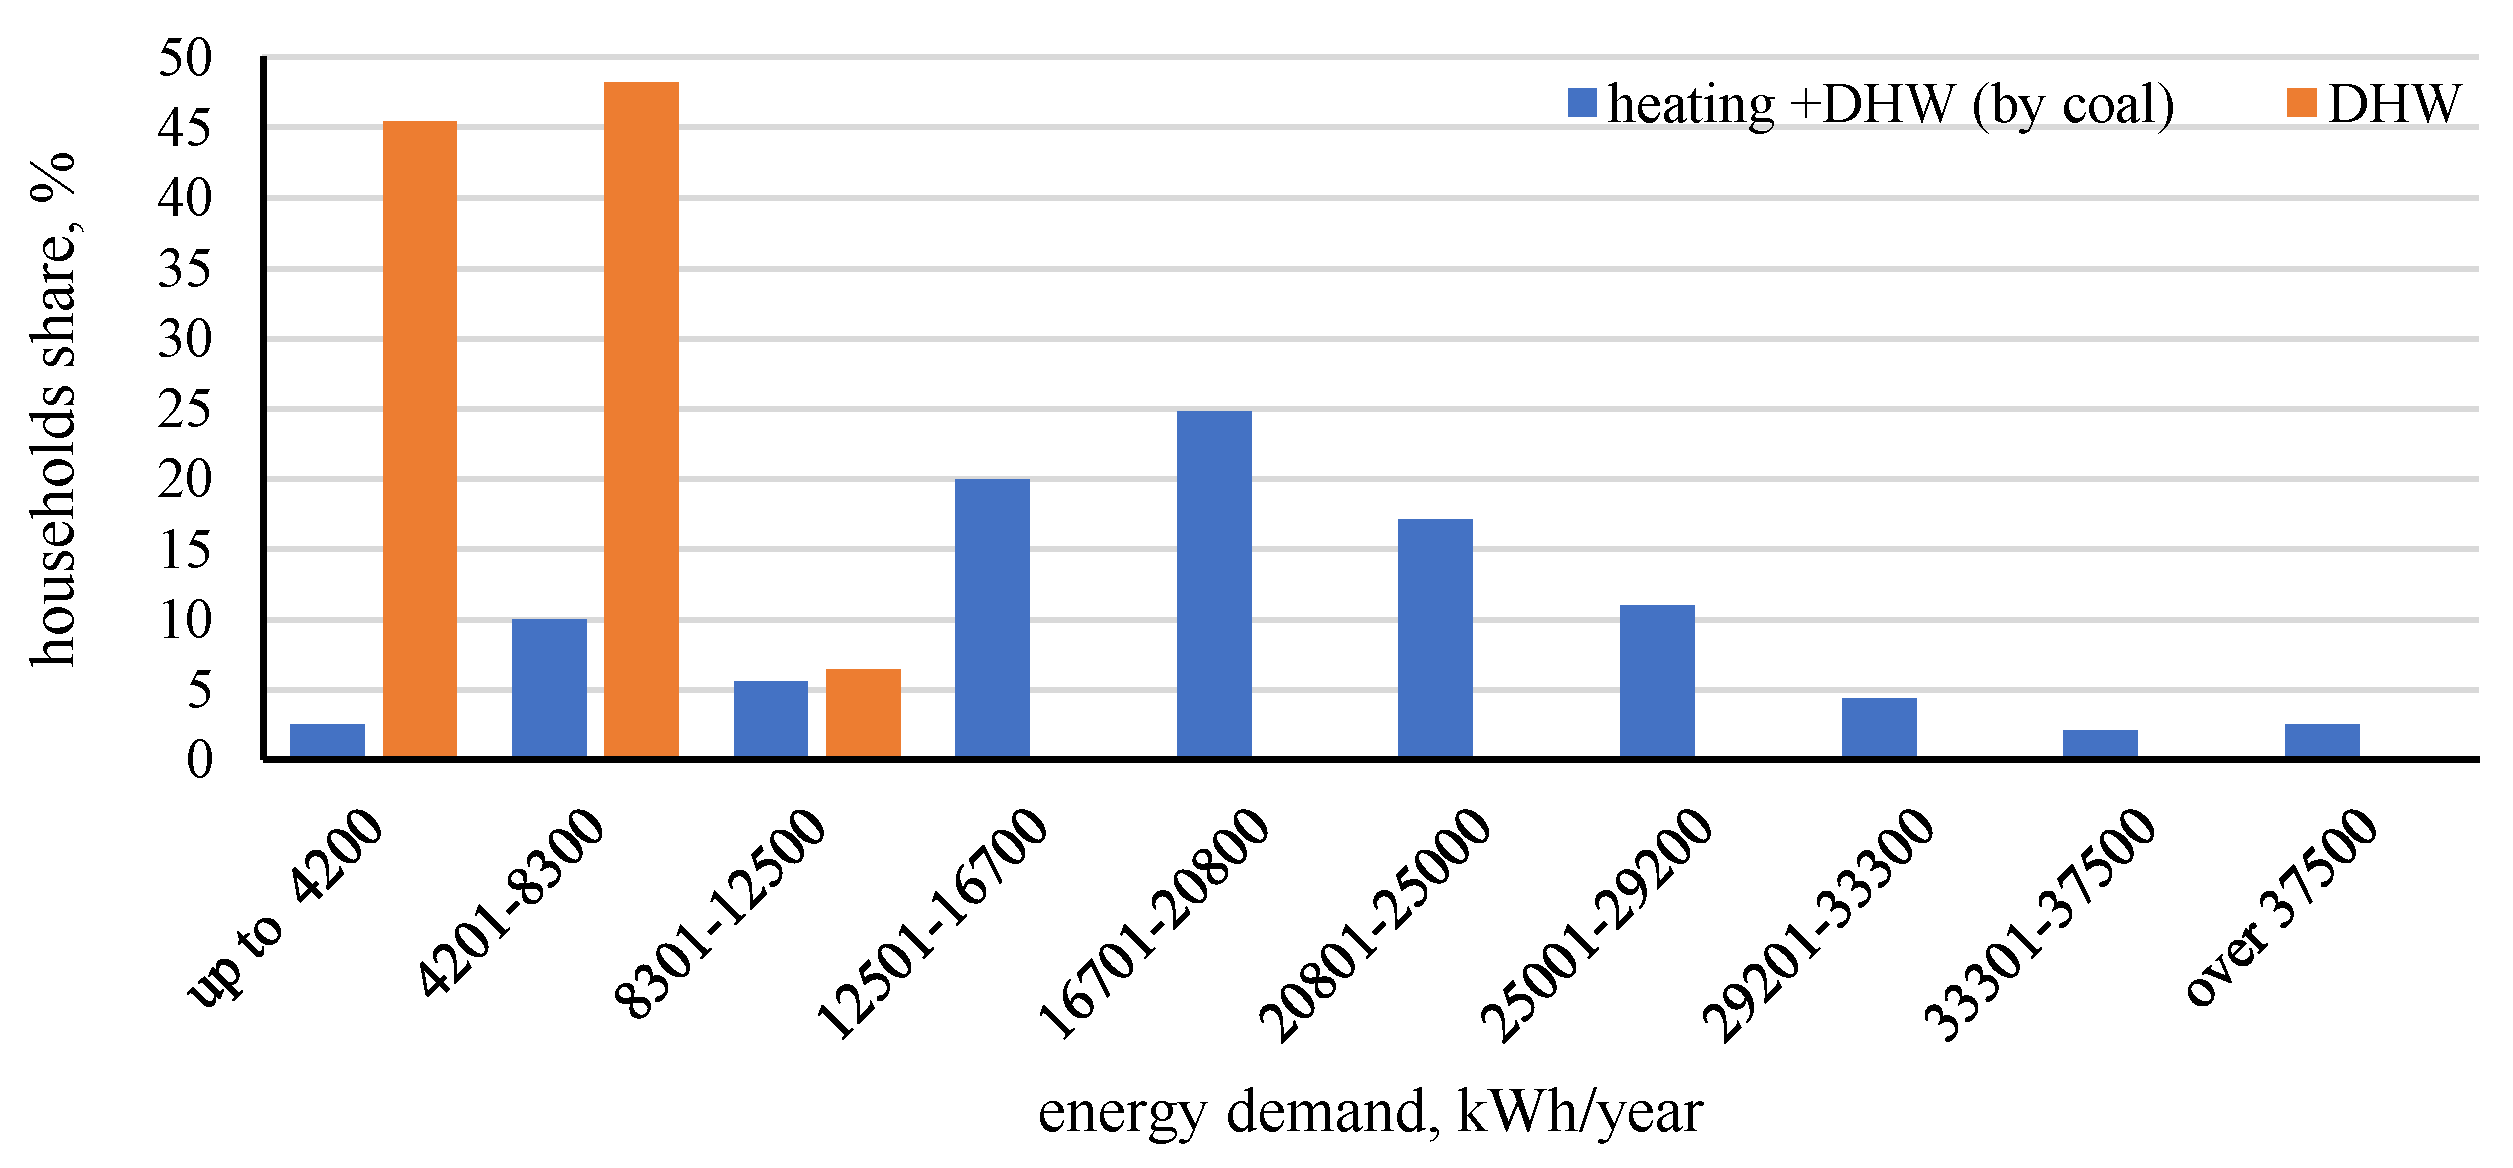
The total heat demand (THD) in the range of 5000–25,000 kWh was adopted for the analysis. The limiting values for the above-mentioned range has been determined on the basis of:
- Heat demand for households using coal-based heat sources. In the first place, these sources should be replaced by renewable energy, due to carbon dioxide and pollution emission to the air [48]. For coal-based heat sources, the average heat demand per m2 of usable floor space is 222 kWh/(m2·year) for insulated buildings and 253 kWh/(m2·year) for non-insulated buildings [30]. The average usable floor space of households (in rural areas) is 108.3 m2 and the total energy demand is 216 kWh/(m2·year) [48]. At the same time, the area up to several km from Bańska Niżna is characterized by a large diversity of buildings (from small traditional one- and two-room houses to multi-story residential houses) as well as their energy efficiency. DHW demand was determined on the basis of average consumption of DHW per person 35 dm3/(person·day) [31] and the number of households in Lesser Poland Voivodeship [49], as well as on the basis of efficiency of heat production and transport for coal sources. The results are shown in Figure 4.
- The ratio of heat loss to THD (lower limit of THD range)—discussed in detail later in the article.
- Possibilities for the number of M.TES exchanges during the day—also discussed in detail later in the article.
This value applies to heat for central heating (CH) and domestic hot water (DHW). Lower demand values (from 5000 kWh/year) were not taken into account due to the high share of heat losses (calculated according to formula no. 1) [51] from M-TES which is HL(M-TES, year) = 2300 kWh/year to the total amount of heat delivered to the building from M-TES (5000 kWh/year). It was assumed that M-TES thermal insulation will provide a two-time lower heat loss stream than in heat storage solutions typically used inside buildings.
where:
HL(M-TES,τ)—heat losses from M-TES at the hour τ, kWh
T(M-TES,τ)—M-TES temperature at the hour τ, °C
Ta(τ)—outside temperature, °C
ni—number of M-TES for each house: 2 (one close to house, second for loading)
chl—coefficient for heat losses. It has been assumed from (as ½ of value from [51]: 0.08), W/(K·dm3/2)
V(M-TES)—volume of M-TES, dm3
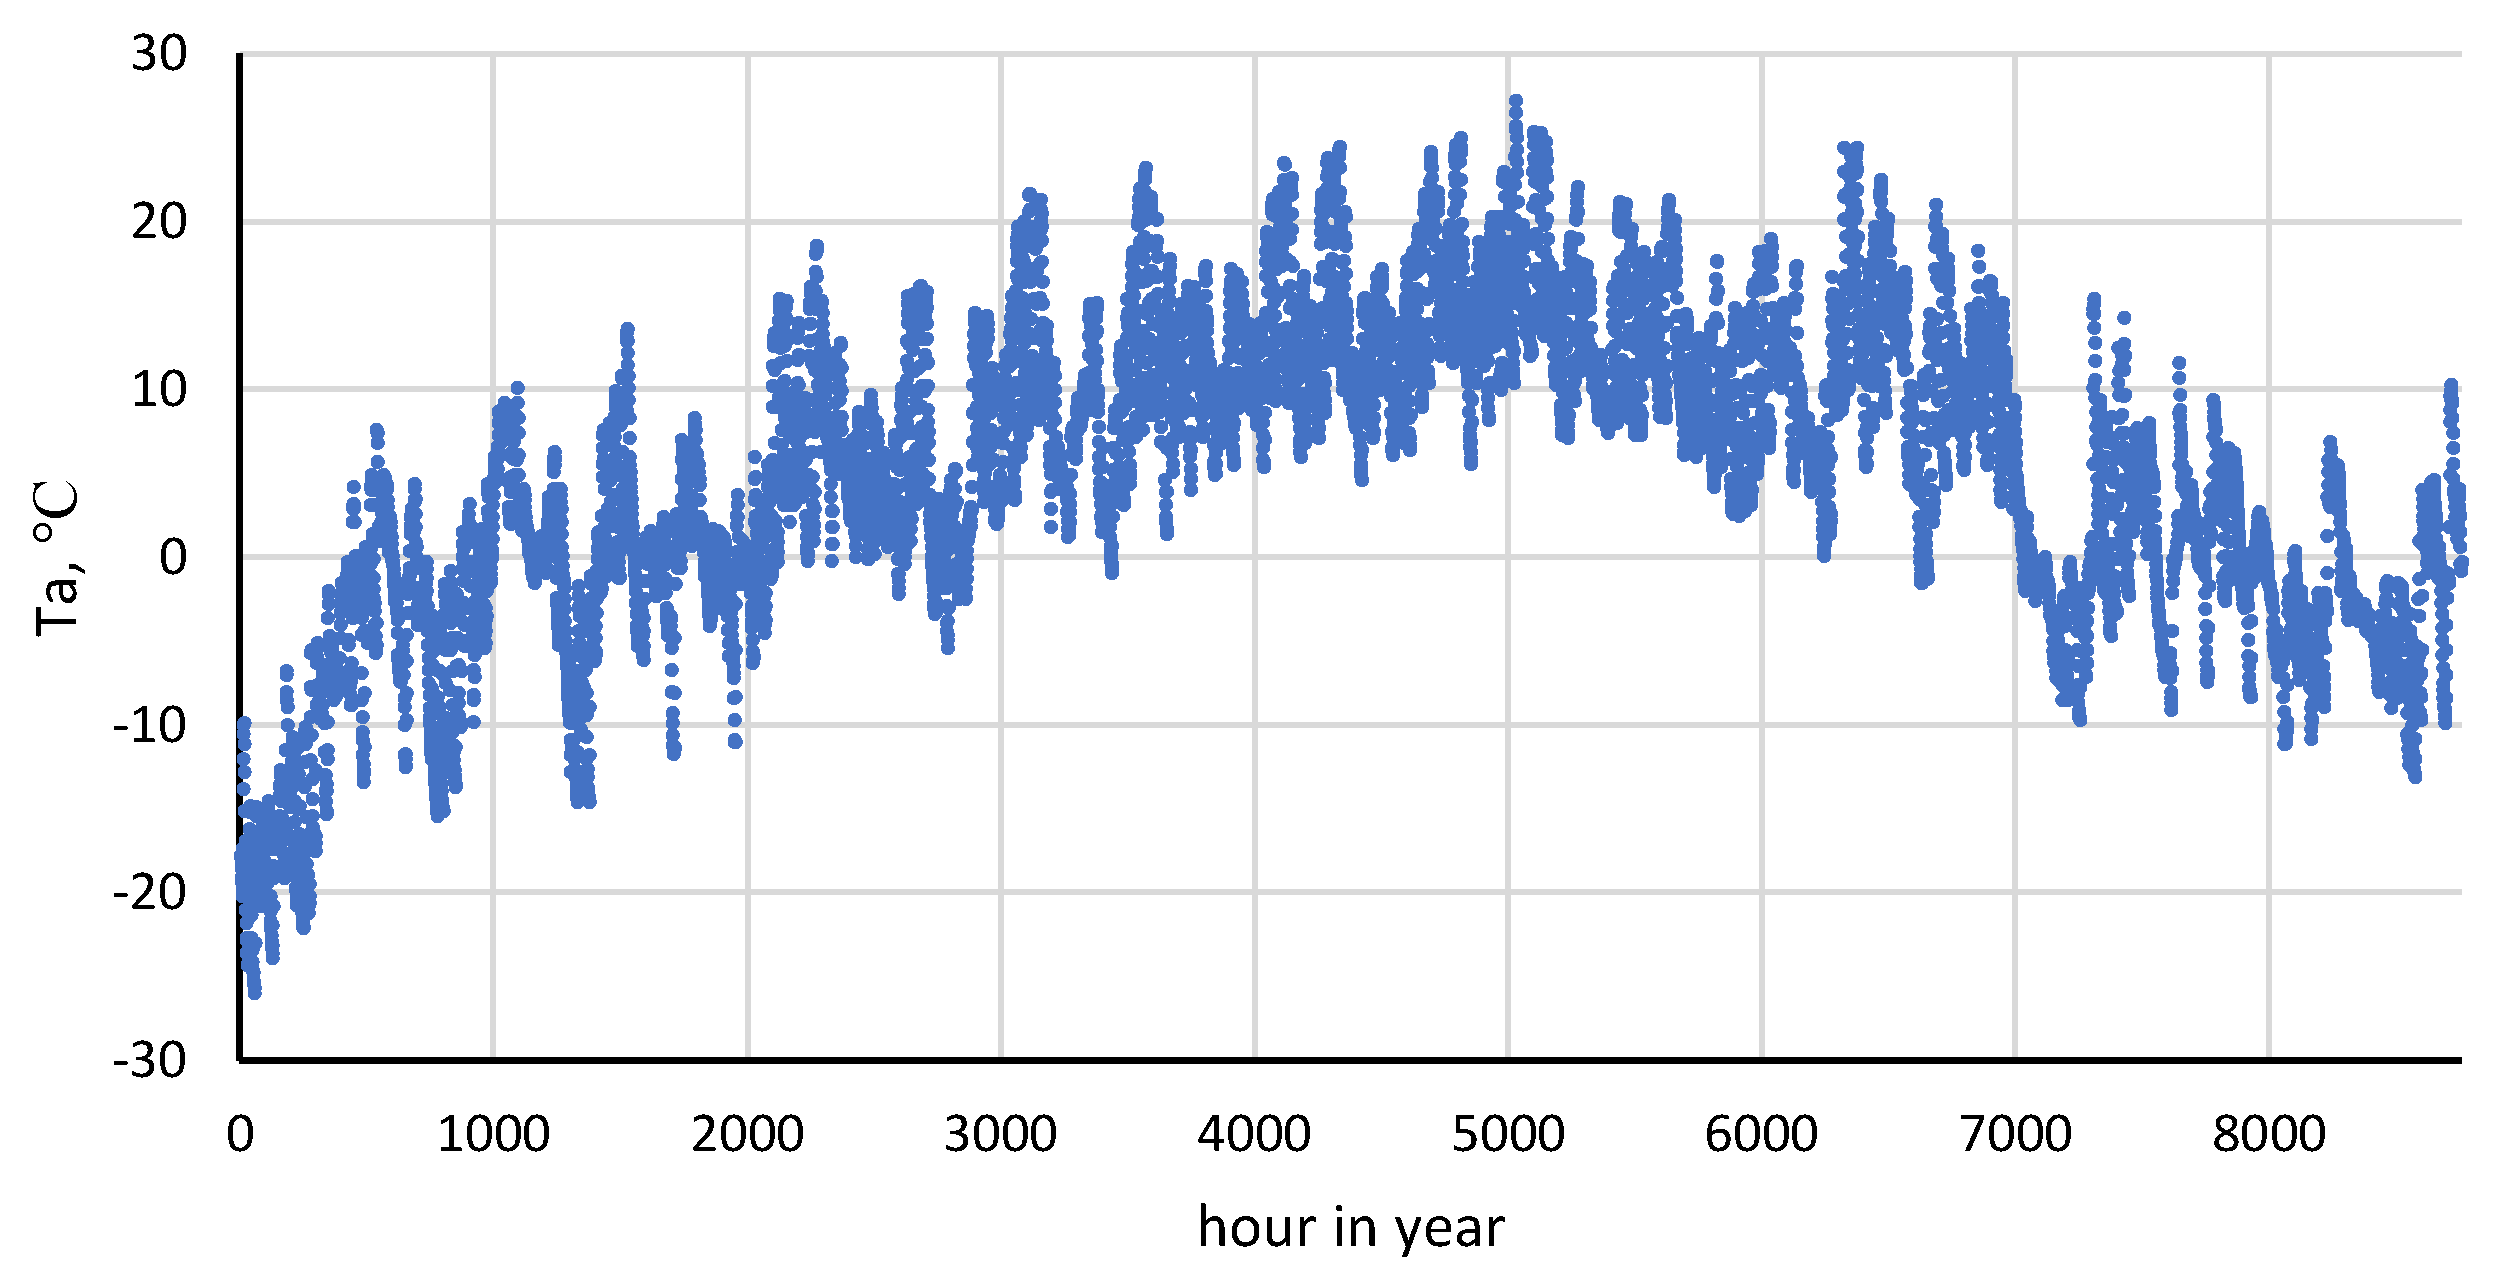
The calculations assume T(M-TES,τ) at the level of 70 °C. For the determination of outside temperature (Ta), data from the Typical Reference Year (Figure 3) [52] were used. On this basis, the annual sum of heat losses was calculated—Equation (2).
The 25,000 is a defined upper safe limit for the use of two heat stores due to the rate of heat distribution at the recipient and its charging at the base station, e.g., in Geotermia Podhalańska.
The distribution of total heat demand THD for heating Q(CH) and for domestic hot water preparation Q(DHW) was assumed in a 3:2 ratio [30]. This ratio matters regarding the frequency of M-TES exchange (winter/summer relationship) and for heat losses during the transportation: a greater share of DHW means that, in warmer months, there are more trips (and exchanges) than in the case of a smaller share. However, the analysis does not include heat losses during transport, due to the fact that its time is a maximum of several minutes. In summary, it was considered that the ratio Q(CH)/Q(DHW) according to specific THDs was separated, and has no significant impact on further calculations.
The heat demand for heating, taken from the range of 3000–15,000 kWh, was divided into individual hours of the year according to the hourly temperature data from the Typical Reference Year for Zakopane (10 km from Bańska Niżna) (Figure 5).
Data on the heat demand for the preparation of domestic hot water were divided according to hours based on data from work [53].
The change in the amount of heat accumulated in M-TES in each hour was determined from the formula:
where:
Q(M-TES,τ)—heat accumulated inside the M-TES at the hour: τ, kWh
Q(M-TES,τ − 1)—heat accumulated inside M-TES at the hour: τ − 1, kWh
HL(M-TES,τ)—heat losses from M-TES at the hour: τ, kWh
Q(CH,τ)—heat needed for the central heating purposes at the hour: τ, kWh
Q(DHW,τ)—heat needed for the domestic hot water purposes at the hour: τ, kWh
τ—hour (time)
When Q(M-TES, τ) would reach zero in a given hour of computing simulation, it is considered in the calculations that the M-TES was replaced with a fully charged one. In this case, Q(M-TES, τ—1) is replaced by a value equal to the heat capacity M-TES, which is 55 kWh.
2.2. Economical Profitability and NPV
The following assumptions were made in the analysis:
- Euro exchange rate 1 EUR = 4.5 PLN,
- The total costs of the driver’s work (and also the person servicing the M-TES exchange in the heat source location and at the buildings) for the employer, TWC = 5 Euro/hour,
- The total cost of transportation by the car with a trailer with a total permissible weight up to 3.5 Mg, TTC: 0.2 EUR/km. This cost includes the purchase of the fuel, service costs, inspections, and depreciation of the car,
- Unit transport time, UTT: 2 min/km,
- Container exchanging time at the heat source and at the recipient, together with time for changing magazines, TfCMs: 12 min,
- Geothermal heat price without distribution, GHP: 0.0322 EUR/kWh [42],
Fixed prices were assumed in the analysis due to the assumed proportional increase in the prices of heat (geothermal and other), transport costs (including labor costs).
Economical profitability (EP) M-TES solutions were calculated in comparison to other technologies for heat production in buildings on the basis of estimating the costs of their use over 20 years. EP values were presented as the difference between the cost of the current solution (e.g., coal boiler) and planned installation, which is M-TES. This difference was calculated for a 20-year perspective and referred to one year of use—Equation (4). Due to the fact that in both cases (base and M-TES), investment costs refer to the total heat demand, and often the service costs are not linearly dependent on the amount of heat demand, the presentation of the comparison results in a unitary way was considered as too high a simplification.
where:
EP—economical profitability, EUR/year
dist.—distance between building and Geothermal Base Station, km
THD—total heat demand for building, kWh/year
LCOH.OS—Levelized Cost of Heating (for 20 years) for other than Geothermal source, equation 10 (based on [54]), EUR/kWh
LCOH.G—Levelized Cost of Heating (for 20 years) for Geothermal source, Equation (5), EUR/kWh
MTES.P—M-TES price, EUR
where:
LCOH.G—Levelized Cost of Heating (for n years) for Geothermal source, EUR/kWh
n—lifetime of M-TES, year
CGH—Cost of Geothermal Heat (calculated by Equation (6)), EUR/year
TC—transport and work cost (calculated by Equation (7)), EUR/year
ni—number of M-TES for each house: 2 (one close to house, second for loading in base station)
M-TES.P—M-TES price, EUR
THD—Total heat demand for the building, kWh/year
dist.—distance between building and Geothermal Base Station, km
where:
CGH—Cost of Geothermal Heat, EUR/year
THD—Total heat demand for the building, kWh/year
HL(M-TES, year)—heat losses from M-TES in whole year, kWh/year
GHP—unit geothermal heat price, EUR/kWh
where:
TC—transport and work cost, EUR/year
M-TES.EX—number of M-TES exchanging per year
TWC—total work cost, EUR/h
TfCMs—time for M-TES exchanging, min
UTT—unit transport time, min/km
TTC—total transport cost, EUR/km
dist.—distance between building and Geothermal Base Station, km
THD—Total heat demand for the building, kWh/year
To use geothermal heat with the use of M-TES, every household needs to have two heat containers; while one of them is used to supply heat to the building, the other one is charged at the charging station in Geotermia Podhalańska S.A. (in the Geothermal Base Station). The cost of a single container is determined from the following relationship:
LCOH.OS in the calculations was adopted in the interval from 0.05 to 0.25 EUR/kWh. LCOH.OS was not clearly defined because it can differ for every building. Theoretically, the upper limit of LCOH.OS should be slightly higher than the price of electricity in Poland, which is currently around 0.15 EUR/kWh for domestic consumers [30]. However, the adopted range (up to 0.25 EUR/kWh) also considers the possible scenario of an increase in energy prices or the possibility of scaling the proposed solution outside the Poland. An example of the LCOH.OS calculation for a building (THD = 10,000 kWh/year) heated with a coal boiler was made using Equation (9).
where:
LCOH.OS—Levelized Cost of Heating (for n years) for other than Geothermal source, EUR/kWh
n—lifetime of M-TES, year
FC.OS—total cost of fuel for other than Geothermal heat source, EUR/year
THD—Total heat demand for the building, kWh/year
WC—work cost, EUR/year
nl—correction coefficient of lifetime for other source = n/lifetime of other source
OS.P—other source price, EUR
The analysis of the example also includes: the cost of fuel 200 EUR/Mg of coal with a calorific value of 24 MJ/kg, efficiency 80% [31]. It displays the cost of 0.0375 EUR/kWh. FC.OS = 375 EUR/year. The cost of service was associated with the working time, and it was estimated as about ½ hours per day in the heating season. In total, it is about 100 h/year for the town of Bańska Niżna. The cost of service, due to the work mainly being the owners (no additional costs), was valued as ½ TWC. The total work cost was obtained: WC = 100 h × ½ × 5 EUR/h = 250 EUR. For a 10,000 kWh/year demand, a unit cost of 0.025 EUR/kWh is implied. The cost of the heat source, i.e., in this case, a coal boiler, was estimated at EUR 1500 (OS.P). Assuming a lifetime of 10 years and THD = 10,000 kWh/year, the unit investment cost is 0.015 EUR/kWh. The cost of auxiliary energy (consumed in the building) was not included in the analysis since it is needed in virtually every solution, including the application of the M-TES system. The total for the above example with a coal boiler in the conditions of Bańska Niżna, Zakopane and the surrounding area of LCOH.OS is 0.0775 EUR/kWh.
In addition, Net Present Value (NPV) was calculated, according to Formula No. 10, for the following assumptions:
- lifetime of M-TES, n = 20 years
- discount rate (r) from 0% to 6% [55]
- M-TES.P = 6000 EUR
- initial investment cost IO = 2·M-TES.P
CFt is the cash flow in the year t, EUR
t—year of the analysis
n—lifetime of M-TES, year
I0 = ni·M-TES.P initial investment value, EUR
r—discount rate, %
where:
CFt is the cash flow in the year t, EUR
CGH—Cost of Geothermal Heat, EUR/year
THD—Total heat demand for the building, kWh/year
TC—transport and work cost, EUR/year
dist.—distance between building and Geothermal Base Station, km
LCOH.OS—Levelized Cost of Heating (for n = 20 years) for other than Geothermal source, EUR/kWh
2.3. Carbon Dioxide Emission
The following specific emission values were assumed for the calculations:
- Transportation of the M-TES storage by car, on the trailer, EM.CO2.KM = 0.240 kg CO2/km [56]
- emission related to the current heat source (EM.CO2.OS) [57]:
- associated with auxiliary energy for the service of pumps and devices in a geothermal heating plant (1% of THD + HL(M-TES)) in a geothermal source (EM.CO2.G): 0.0078 kg CO2/kWh (it is about kWh of energy produced from a geothermal source) [60].
The reduction of CO2 emissions caused by replacing the current heat source with a geothermal source was calculated according to Formula No. 12:
where:
RE.CO2—reduction of CO2 emissions, kgCO2/year
THD—Total heat demand for the building, kWh/year
dist.—distance between building and Geothermal Base Station, km
EM.CO2.OS—emission from other than Geothermal source, kg CO2/kWh
EM.CO2.G—Emission connected with Geothermal source, kg CO2/kWh
EM.CO2.T—annual CO2 emissions related to the M-TES transportation, determined from the formula no. 13, kg CO2/year
M-TES.EX—Mobile Thermal Energy Storage exchanged
where:
EM.CO2.T—annual CO2 emissions related to the M-TES transportation, kg CO2/year
M-TES.EX—Mobile Thermal Energy Storage exchanged
THD—Total heat demand for the building, kWh/year
dist.—distance between building and Geothermal Base Station, km
EM.CO2.OS—emission from other than Geothermal source, kg CO2/kWh
EM.CO2.KM—emission from car per km, kg CO2/km
Emissions associated with transport are linearly dependent on the distance. For example, for a distance of 5 km between Geothermal Base Station and Building and M-TES.EX = 200/year, transport related emissions would 480 kg CO2/year. A total of 2000 km would be driven.
3. Results
3.1. Analysis of M-TES System Operation in Relation to the Total Heat Demand Size for the Building
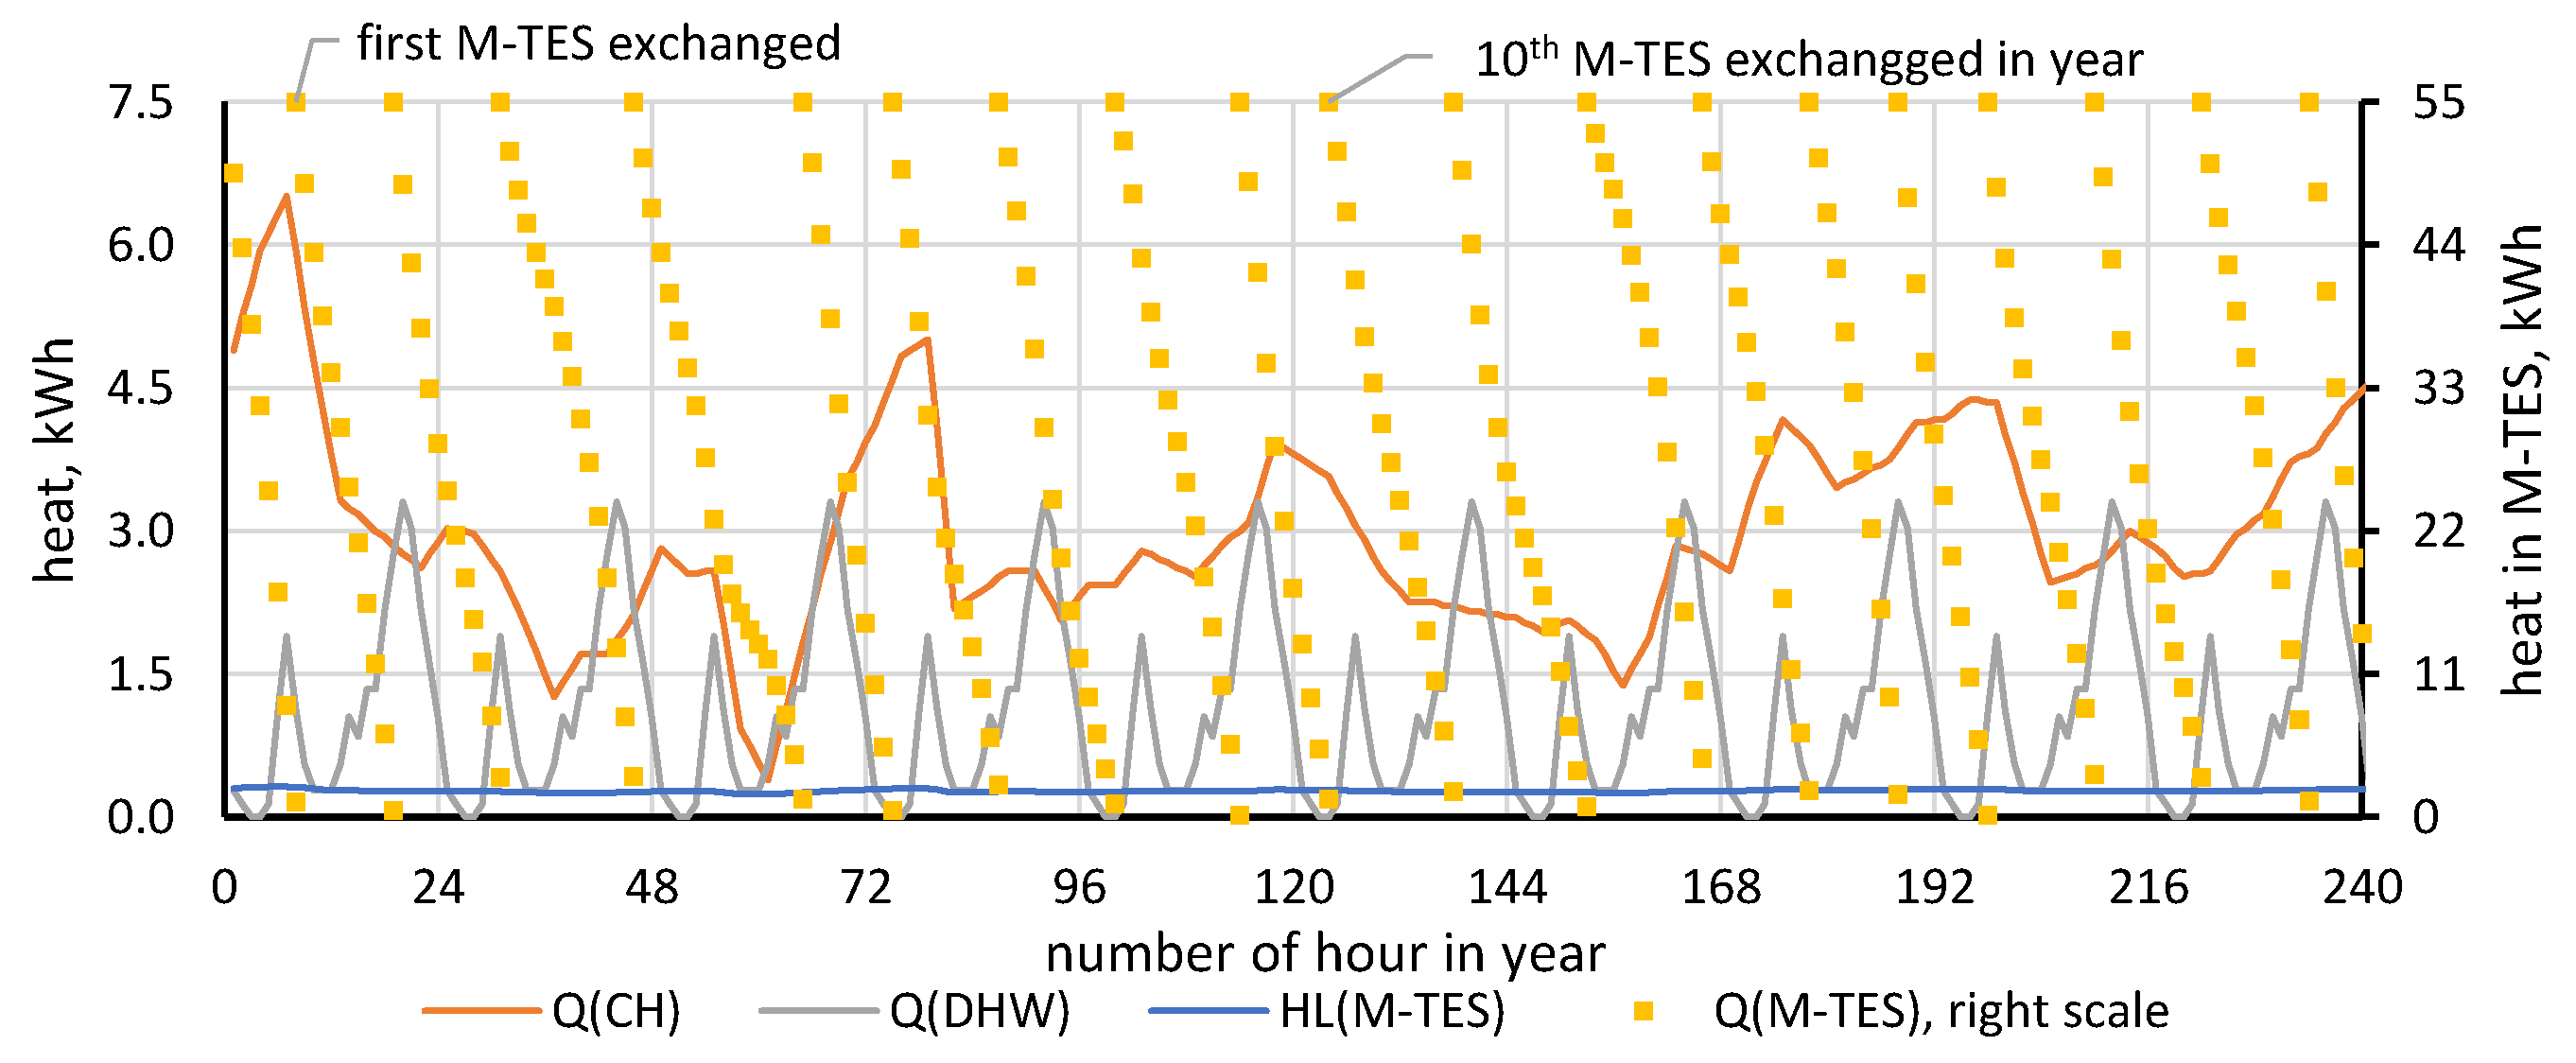
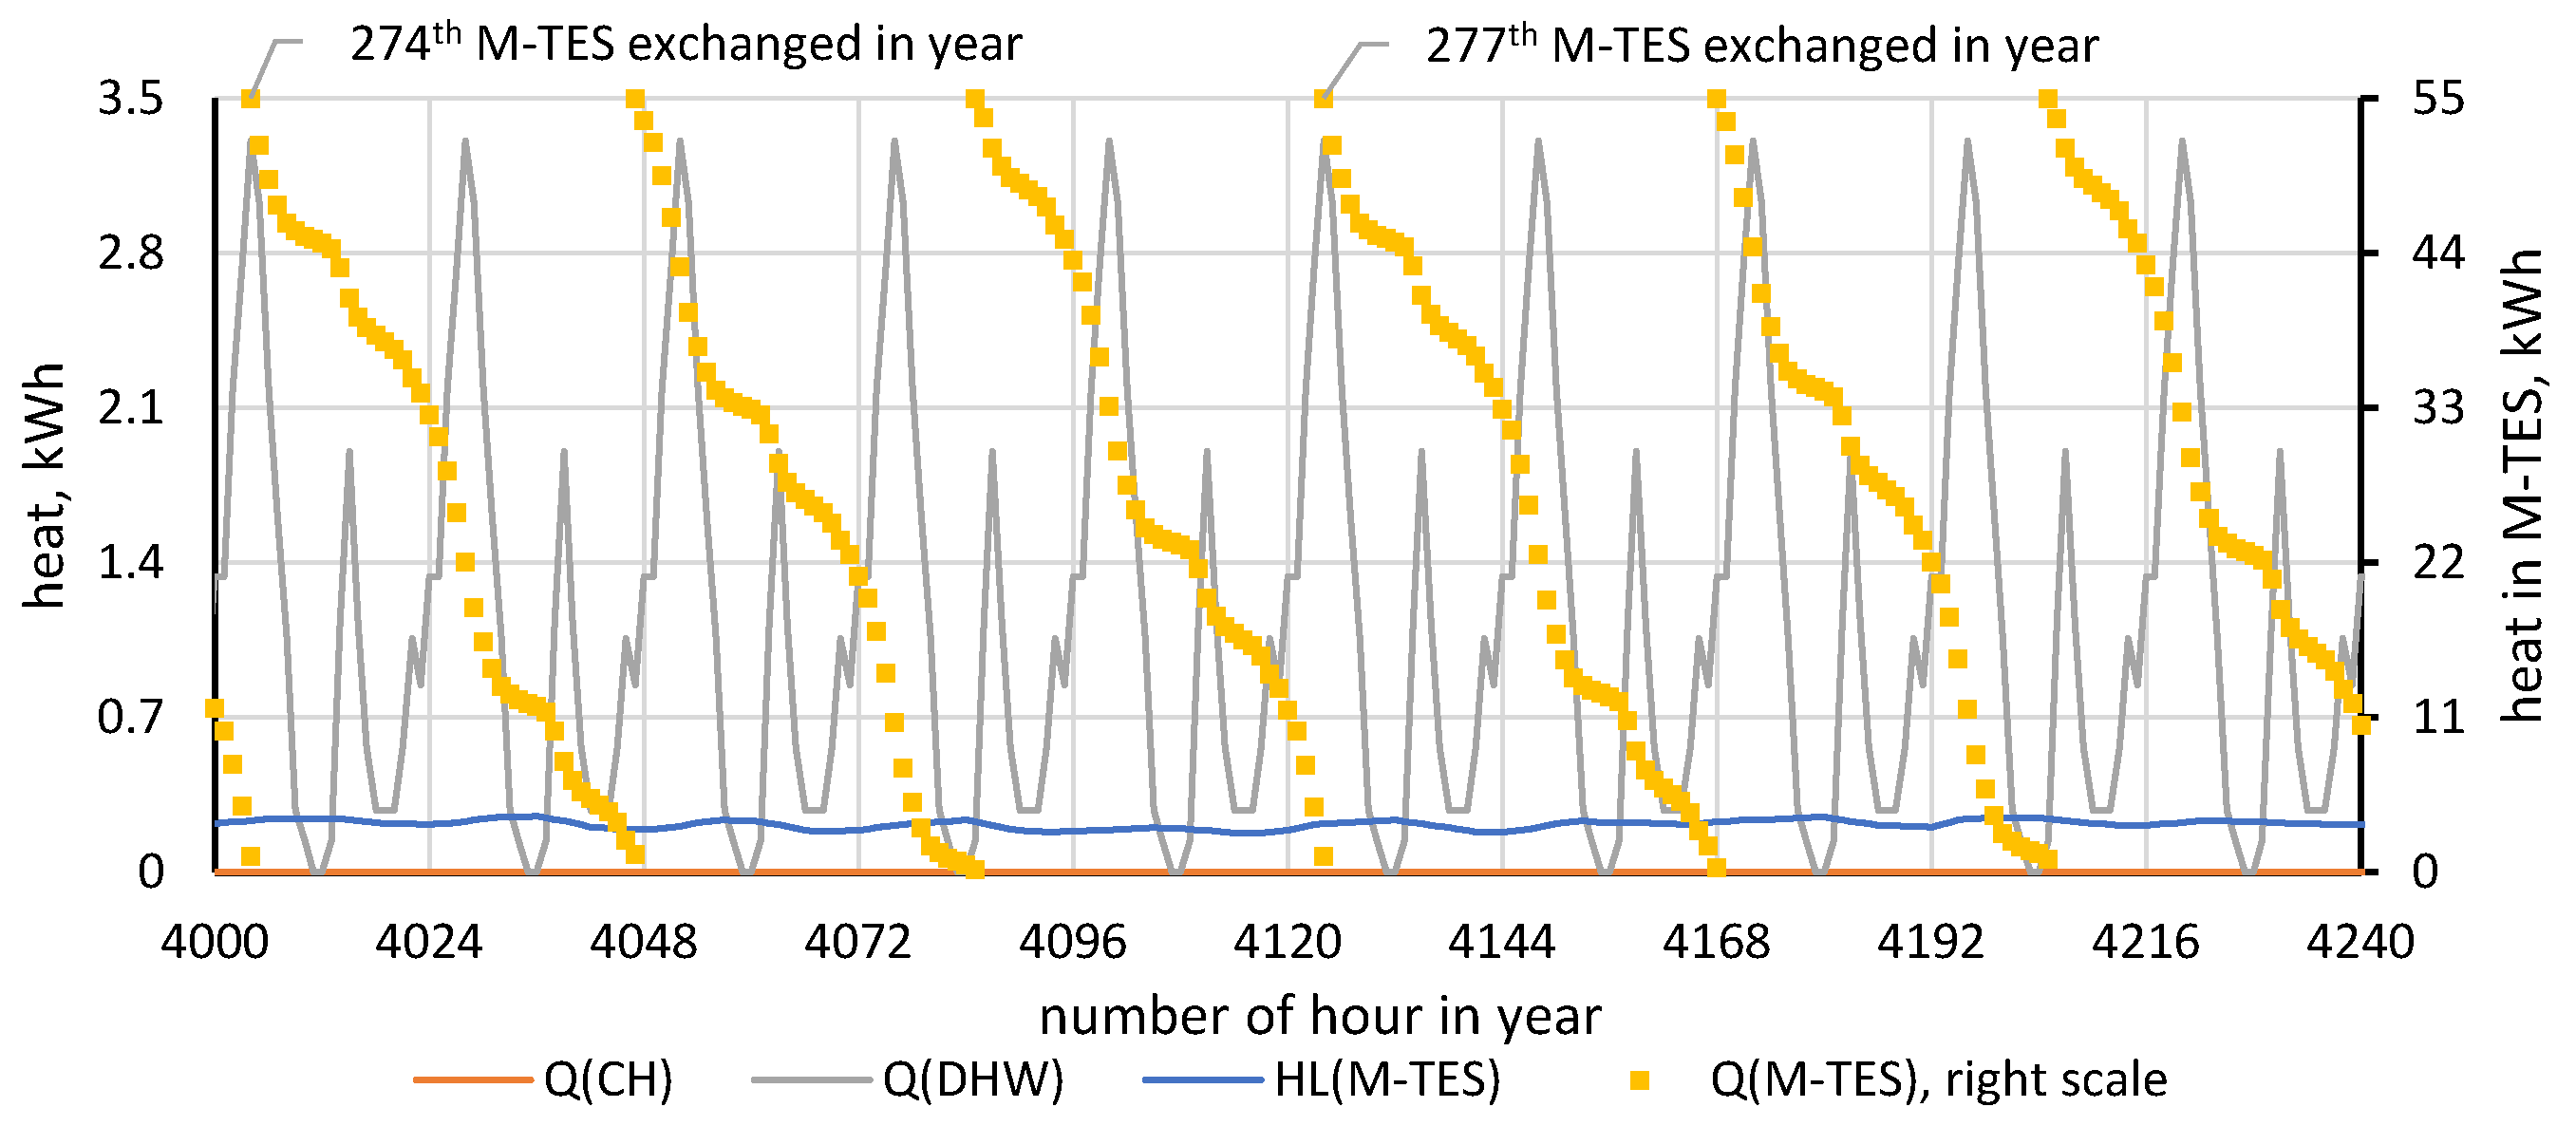
For different levels of total heat demand for the building (THD), the hourly heat demand (Q(CH) and Q(DHW)) as well as heat losses were calculated. The results for THD = 25,000 kWh/year in the winter period are shown in Figure 6, and in the summer period in Figure 7. The M-TES charge level (initial Q(M-TES)) 55 kWh in a given hour means that M-TES exchanged occurred in this hour.
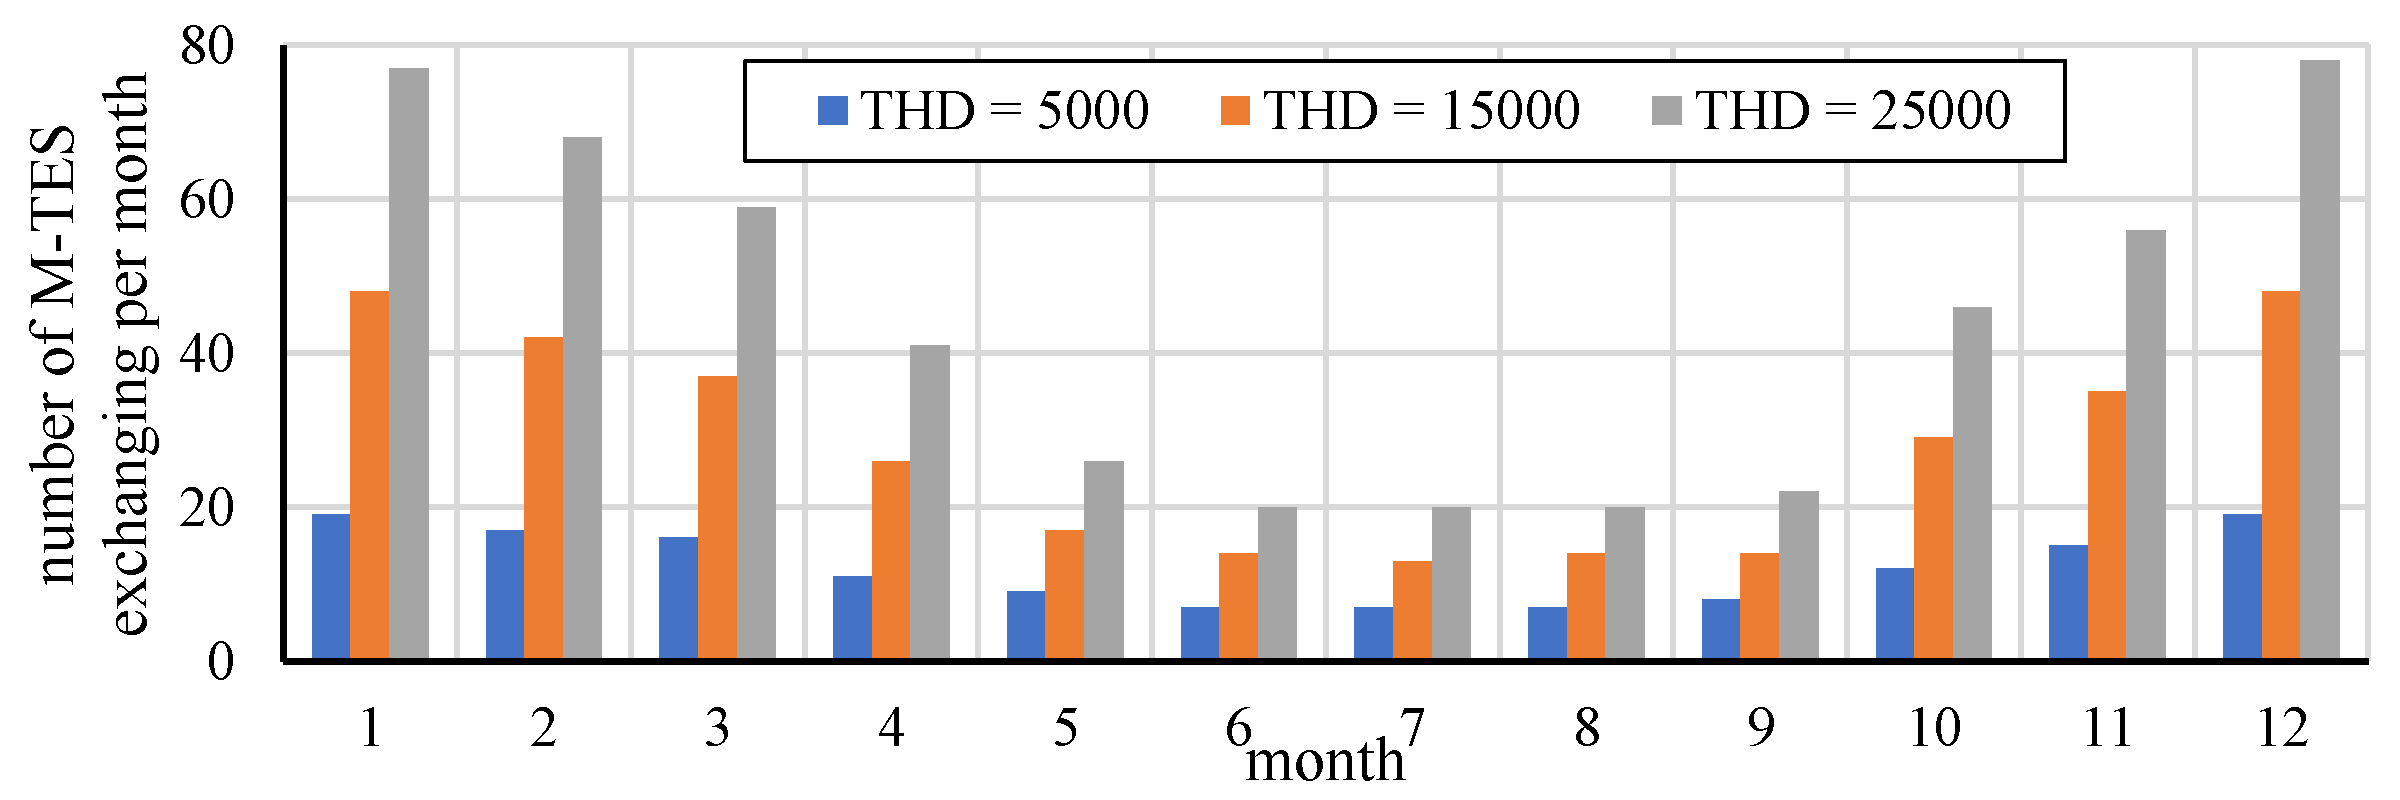
As can be seen in Figure 6, on the second day of the year, M-TES should be changed twice (for THD = 25,000 kWh/year). In turn, during the warmer period (June), i.e., between 4000–4240 h of the year, the tank should be replaced much less frequently (six times in 10 days; in the example for the winter, the sum was 10), and the heat losses are also lower. On aggregate for months, the number of M-TES exchanges is shown in Figure 8.
For THD = 5000 kWh/year, the maximum number of exchanges per month is 19, for THD = 15,000 it is 48, and for 25,000 it amounts to 78 (December). A feasibility analysis of the M-TES replacement in the context of various types of restrictions was carried out. The results presented below show the example, based on the calculations for the last value (78). The first of the analyzed restrictions is the M-TES charging and discharging rate: 78 exchanges mean almost three exchanges per day—the average charging power is approx. 7 kW. The maximum estimated charging power of 14 kW is realized with a flow temperature of 86 °C and a return temperature of 72 °C. Under these conditions, the flow rate would be 0.25 dm3/s. For THD = 25,000, the simulation received nine days with four M-TES exchanges per day (this means the average charging power of 9 kW). A similar situation is found for the M-TES discharging process. Further research includes work related to the irregularity of the M-TES maximum charging/discharging rate.
In total, the number of exchanges in the year M-TES (M-TES.EX) is 147, 337 and 533, respectively. The number of exchanges needed to ensure the demand of THD = 15,000 kWh/year is 2.3 times higher than for THD = 5000 kWh/year, while the ratio of demand is three times higher. The reason for this phenomenon is the practically constant level of heat losses (HL (M-TES)) independent of the THD value in the adopted range.
The second possible restriction affecting the number of exchanges is the level of transport complexity in the mountainous area and—resulting from this—the transport time of one of the two M-TES dedicated for the building using this system. The longer the transportation time, the more time should be deducted for the M-TES charging process. The fully charged M-TES is transported to households and replaced with the empty M-TES (Q(M-TES) ≈ 0). Therefore, the discharging process is interrupted only during the M-TES replacements. The remaining time is spent on the M-TES charging process, excluding the transport to Geothermal Base Station and connection to the charging spot.
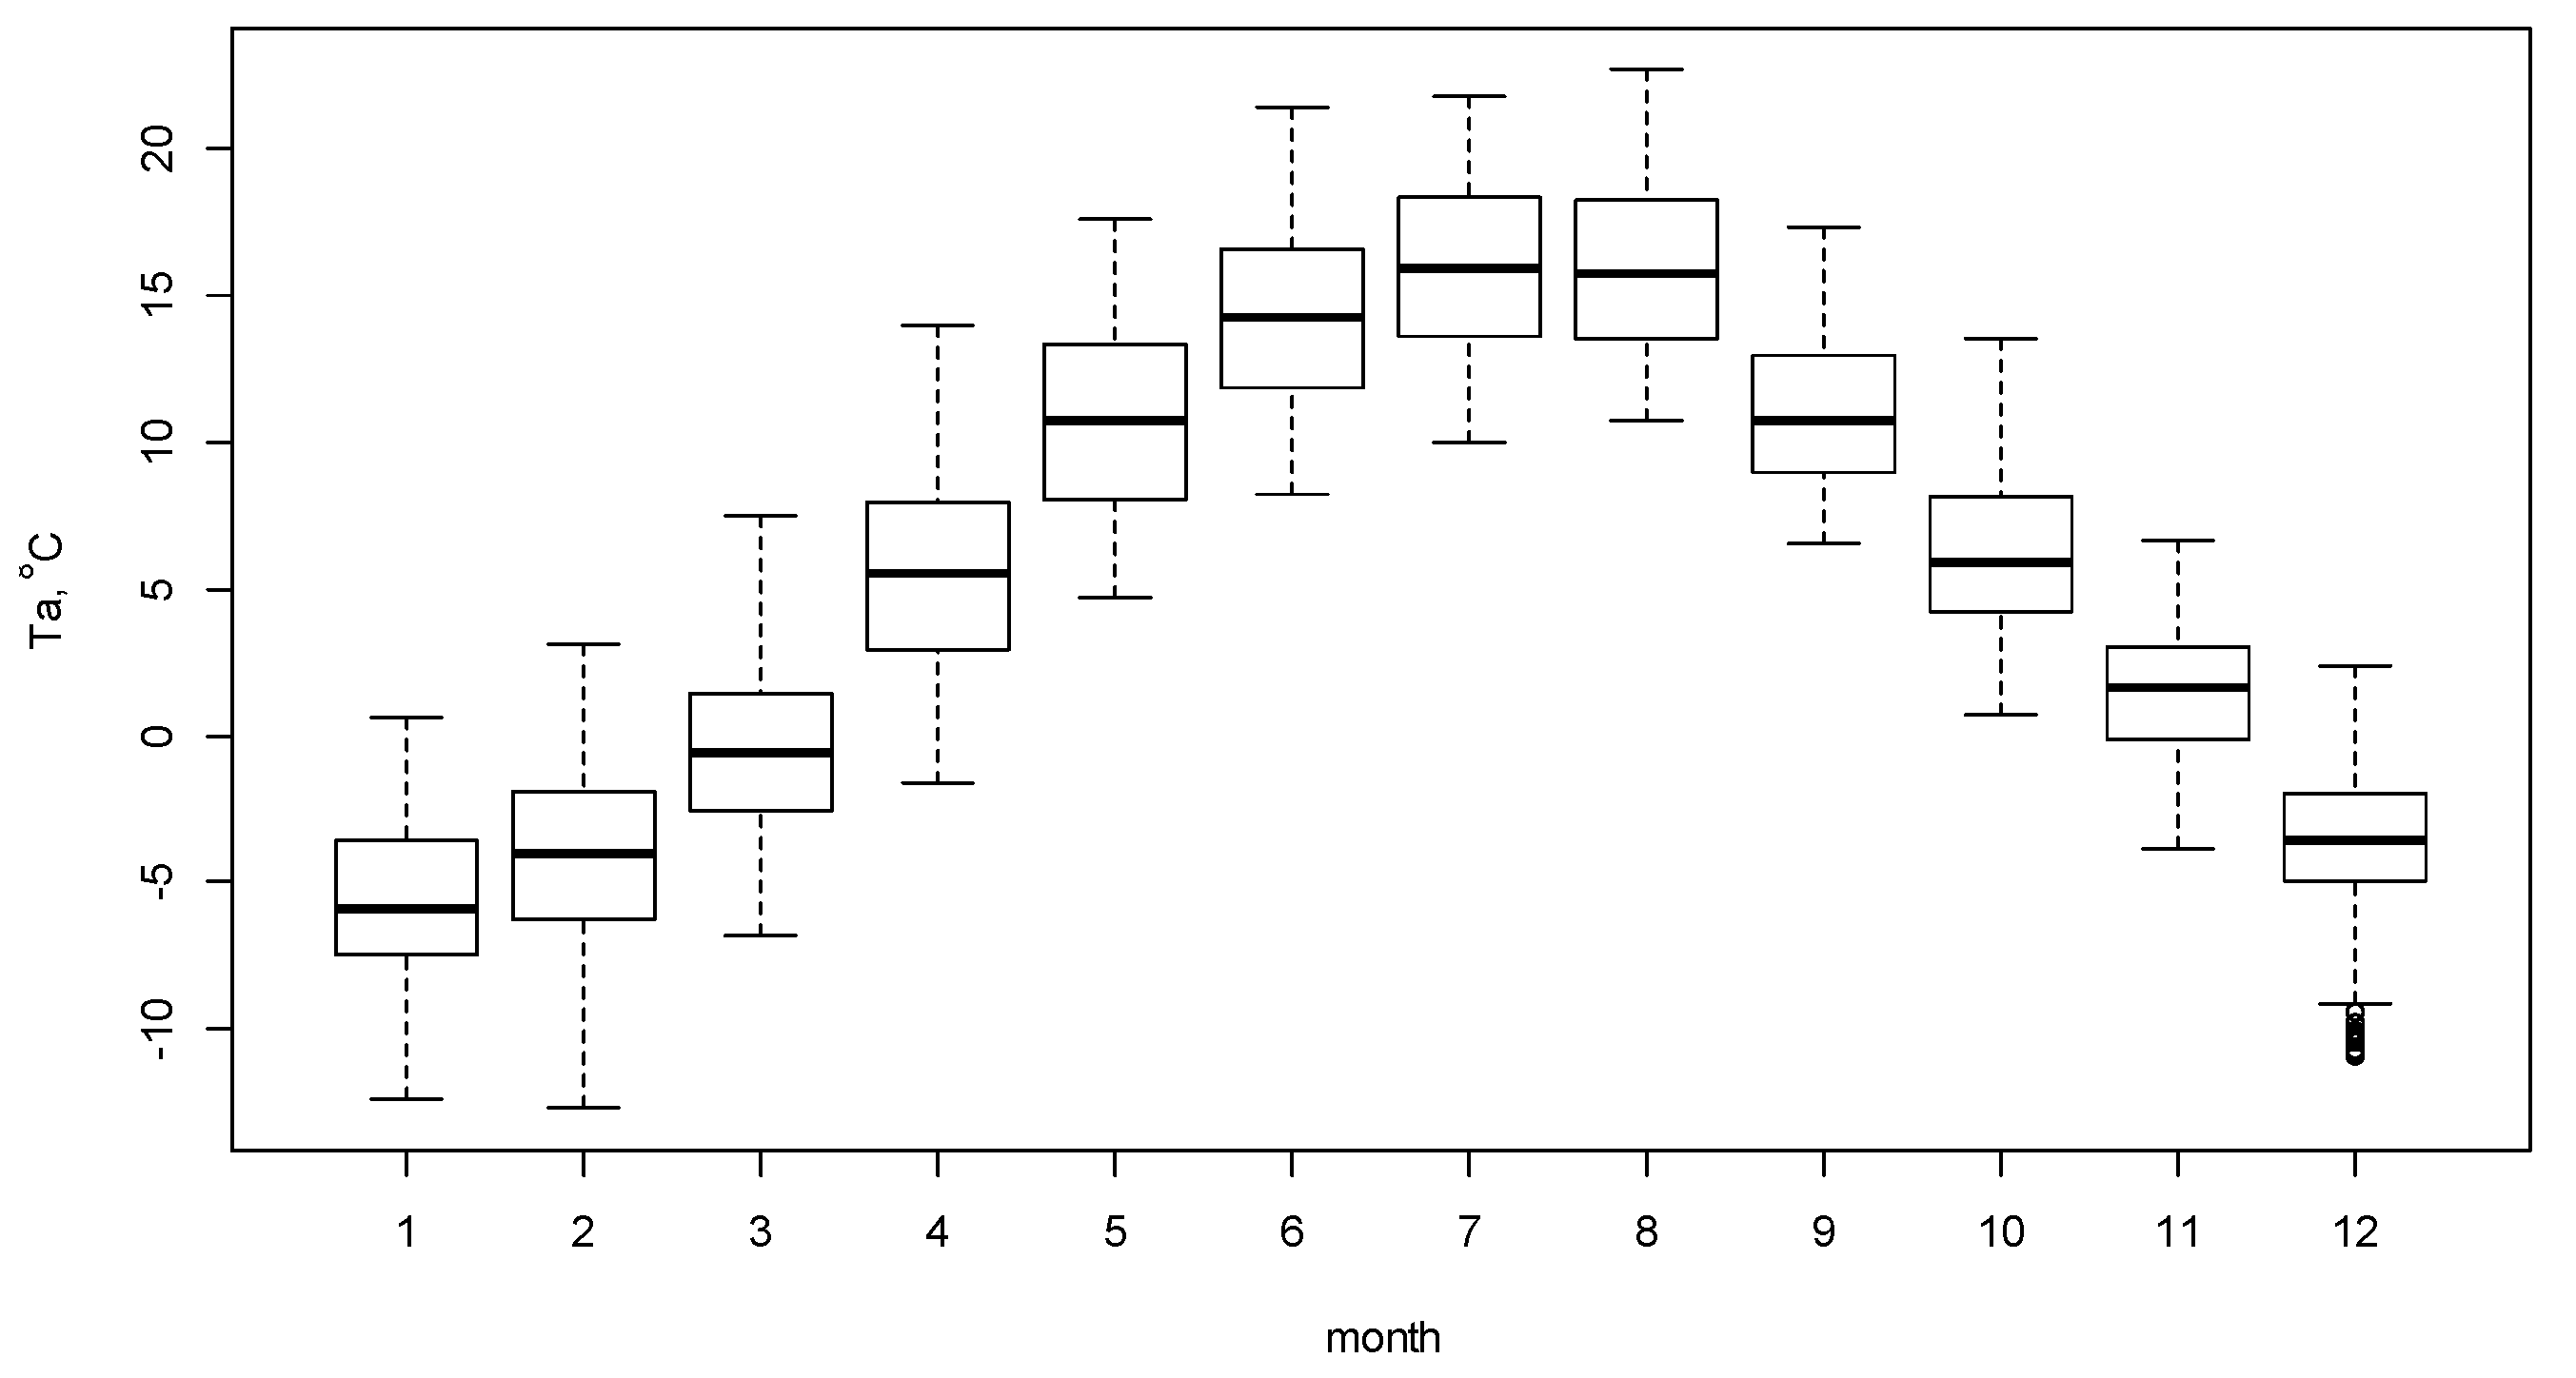
The use of the proposed M-TES system (with a heat capacity of 55 kWh) for a greater heat demand (more than THD = 25,000 kWh/year) may result in the M-TES dual storage system being insufficient due to the speed of heat use (recipient) or M-TES charging. Therefore, the maximum heat demand assumed for the building was checked. For this purpose, weather data from the last 20 years 2000–2019 were used (Figure 9). ERA5-Land data were analyzed for the location of Bańska Niżna (Figure 3.) [61,62].
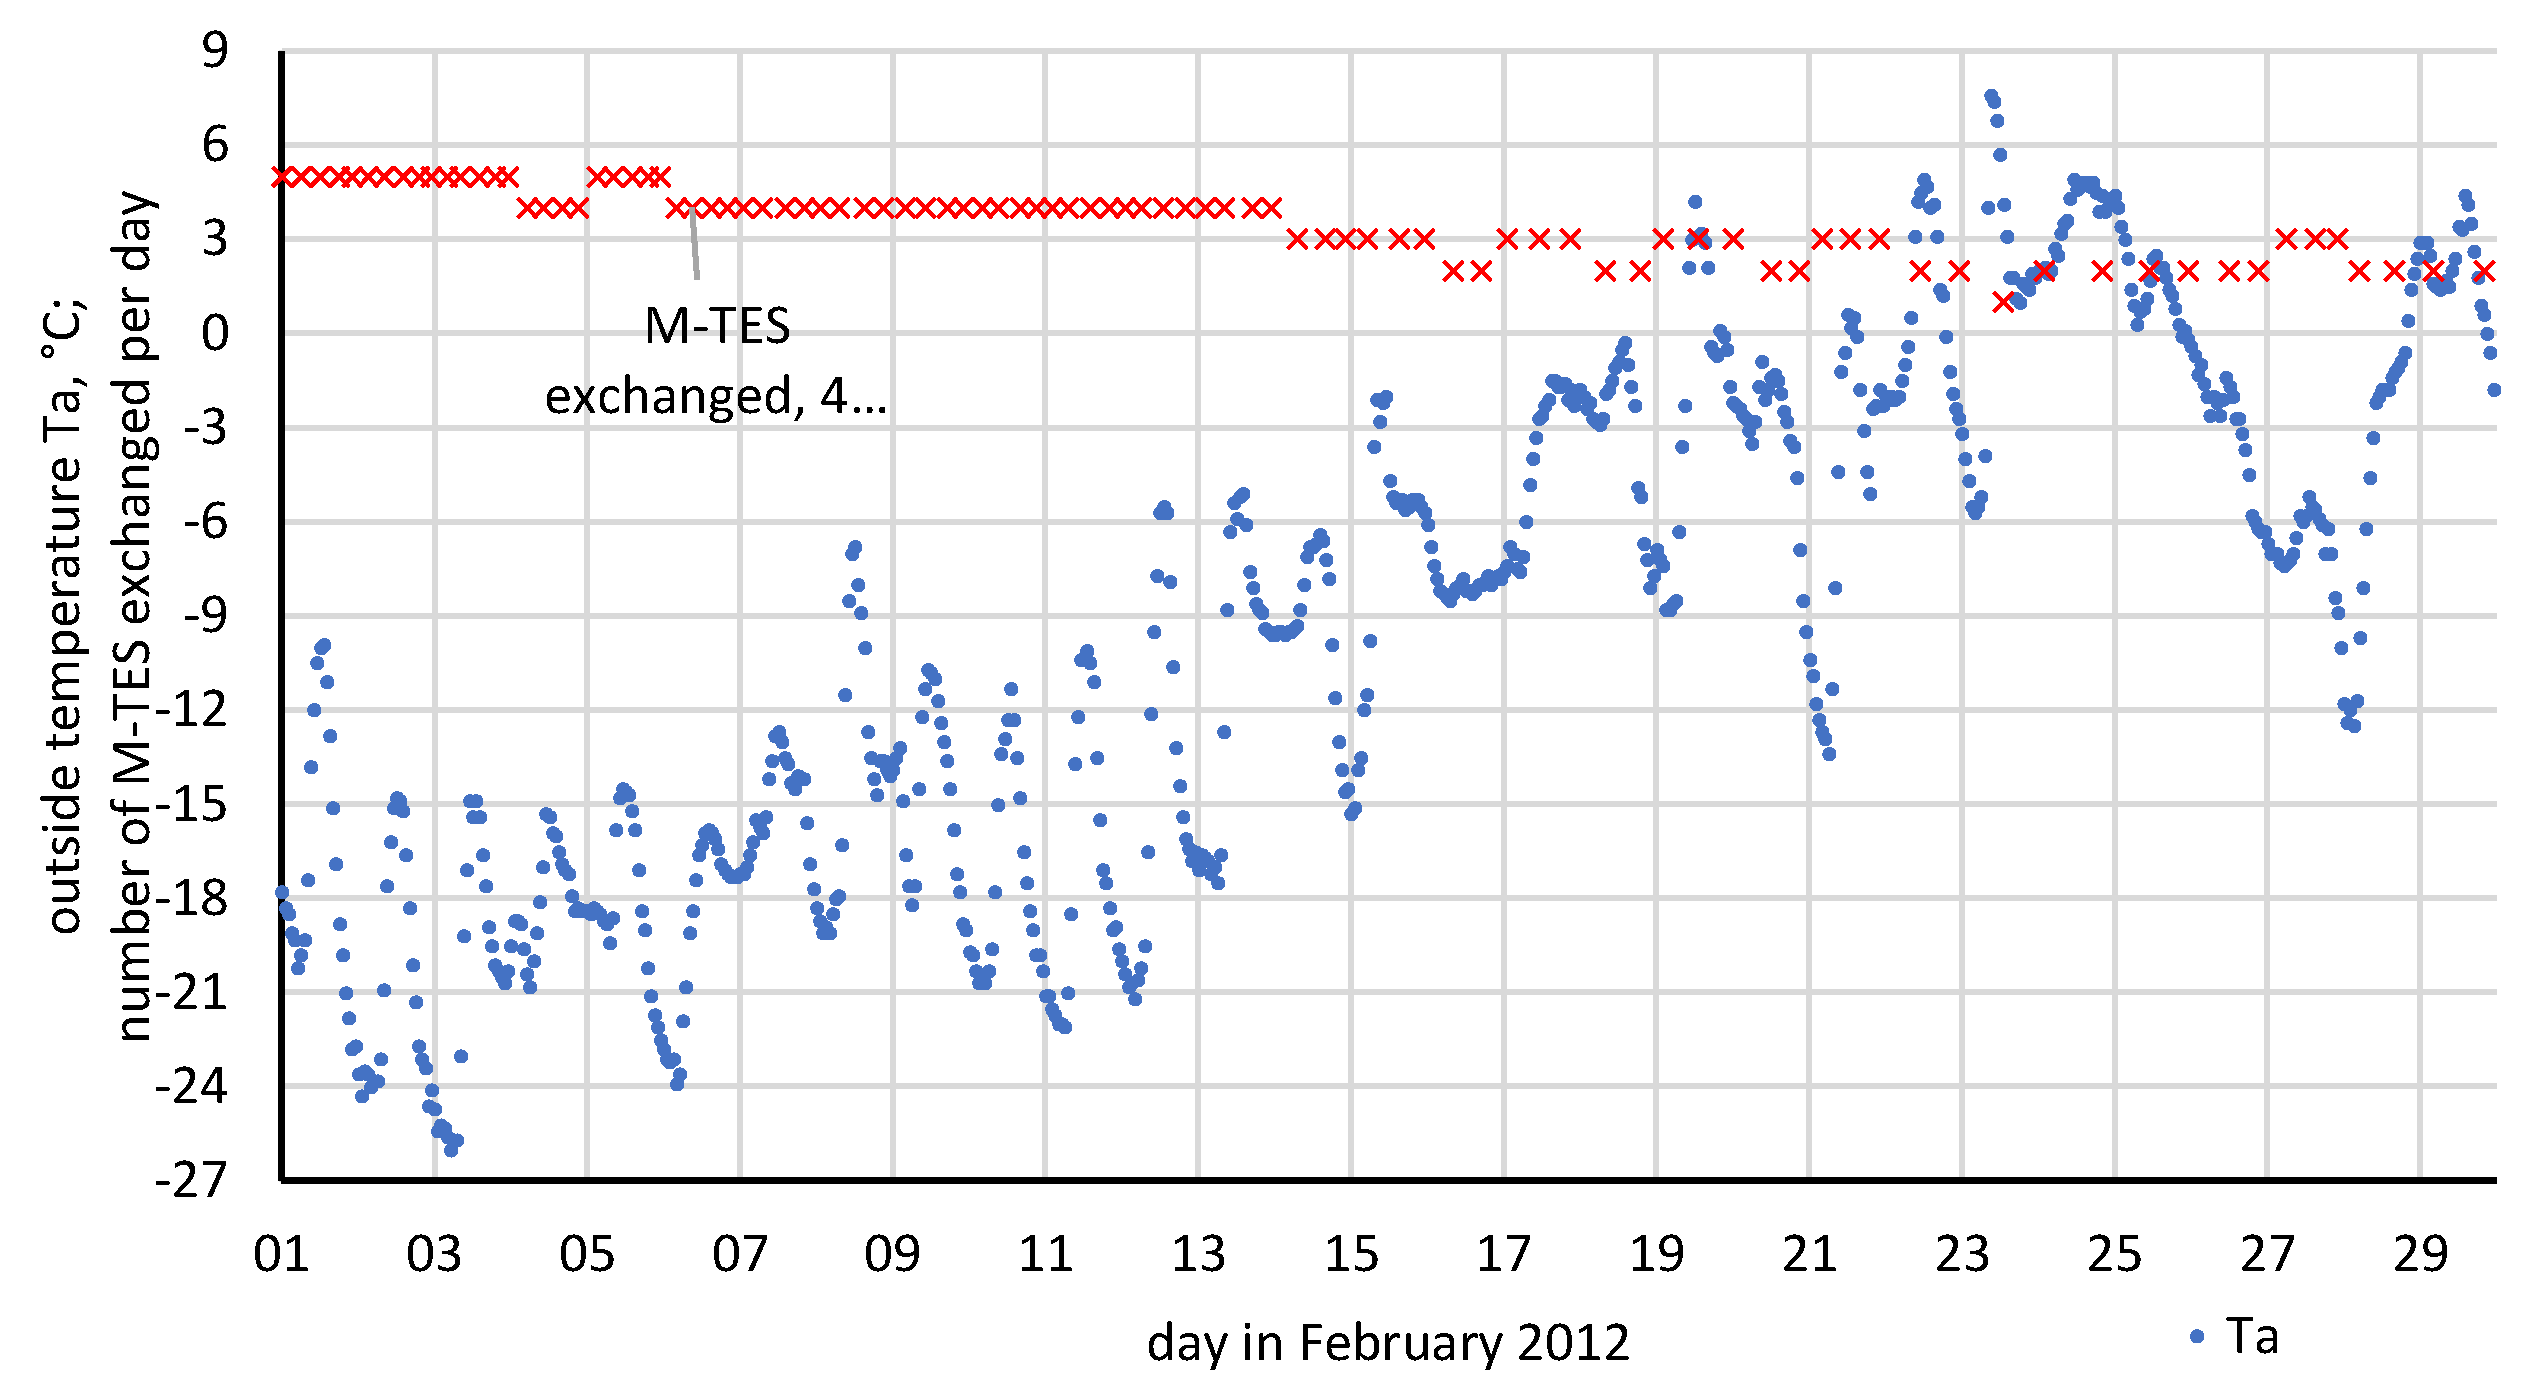
The lowest average monthly temperature in the period 2000–2019 was recorded in February 2012. For this month, detailed weather data were obtained from ogimet.com. Then, the number of M-TES exchanges during the following days was determined. The highest accepted value of THD = 25,000 was taken into account. The points of exchanges are shown in Figure 10 in combination with the outside temperature. For the first three days of February 2012, the estimated number of M-TES exchanges would be five per day. This number of exchanges means a minimum charging or discharging time of four hours, which means a necessary charging power of 14 kW.
3.2. Economical Profiltability
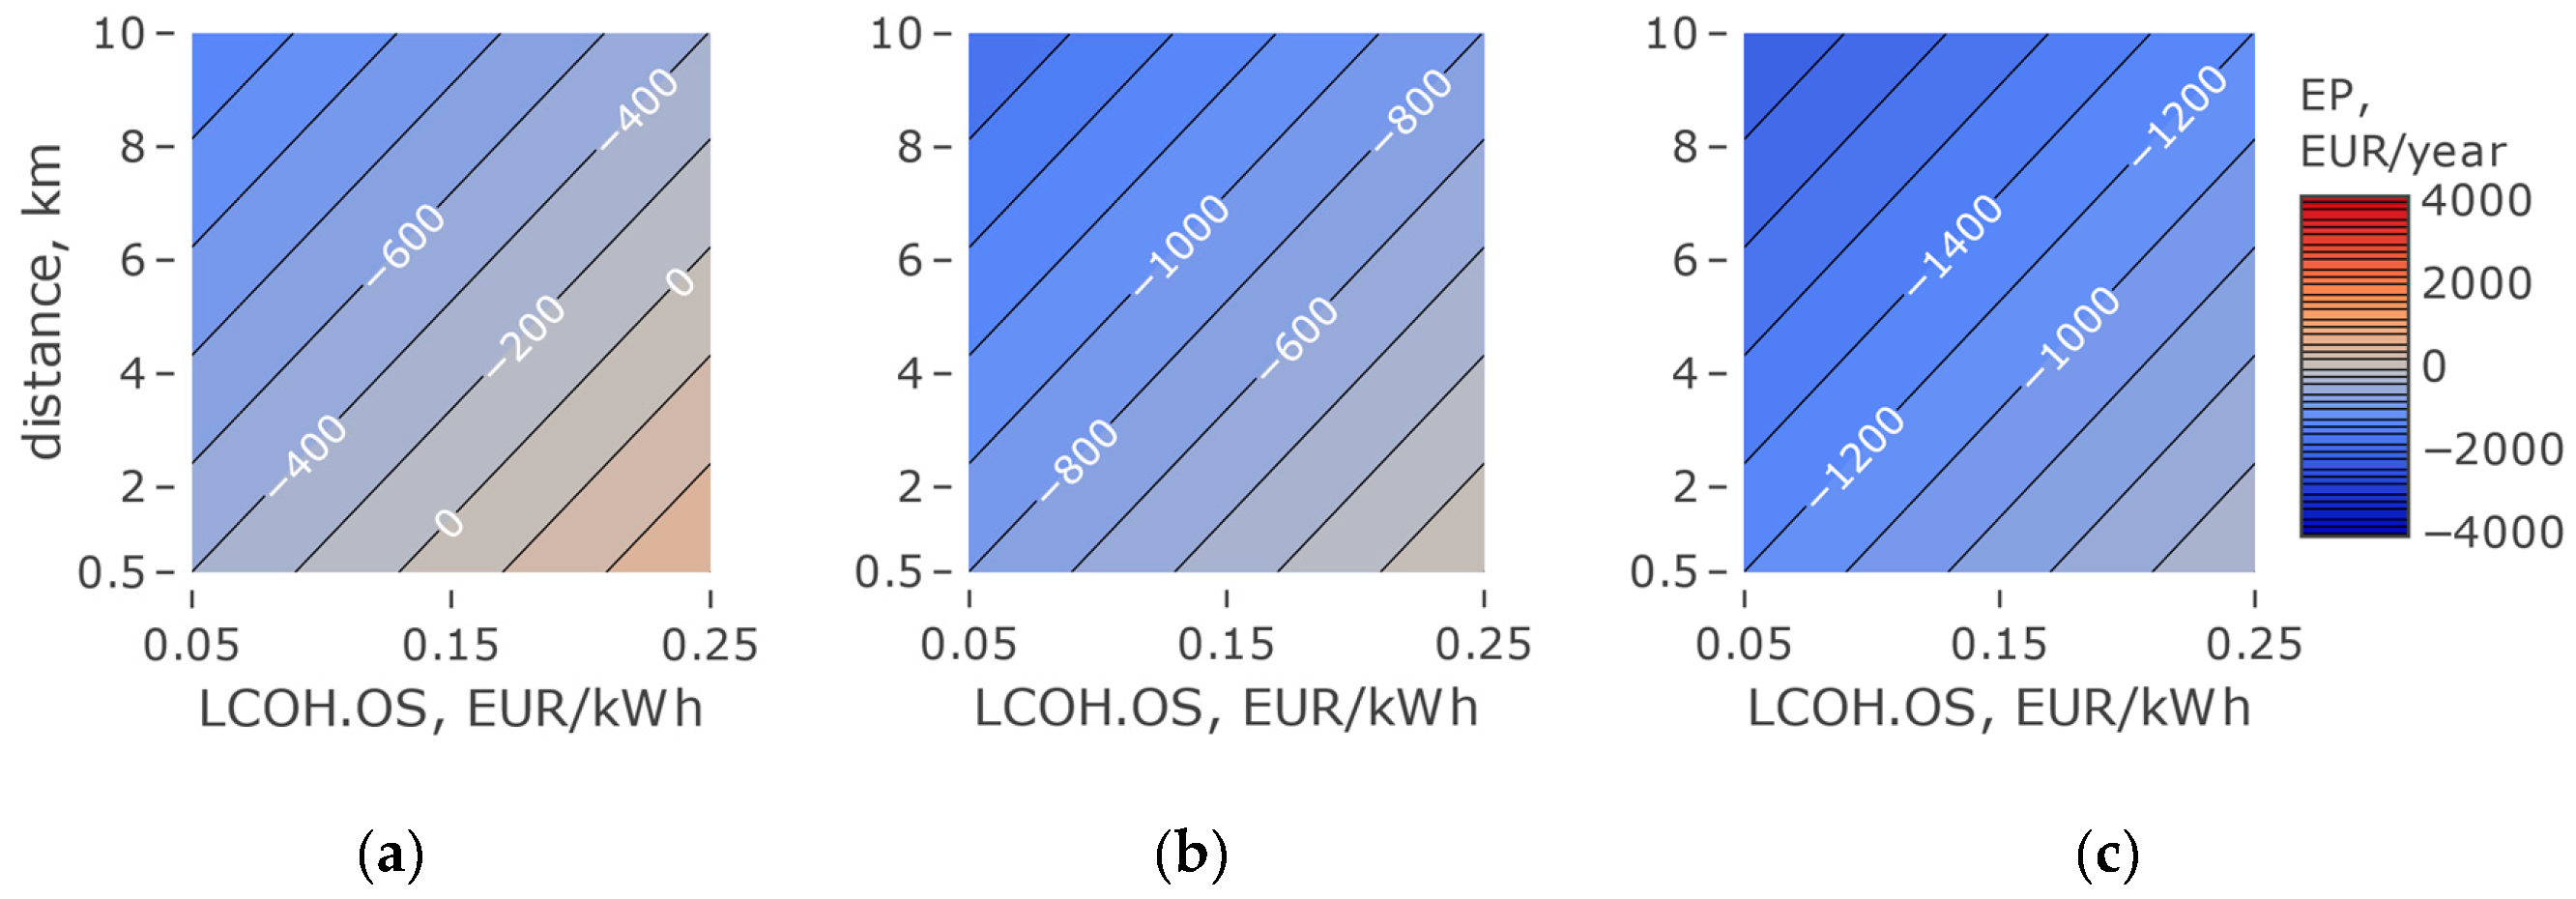
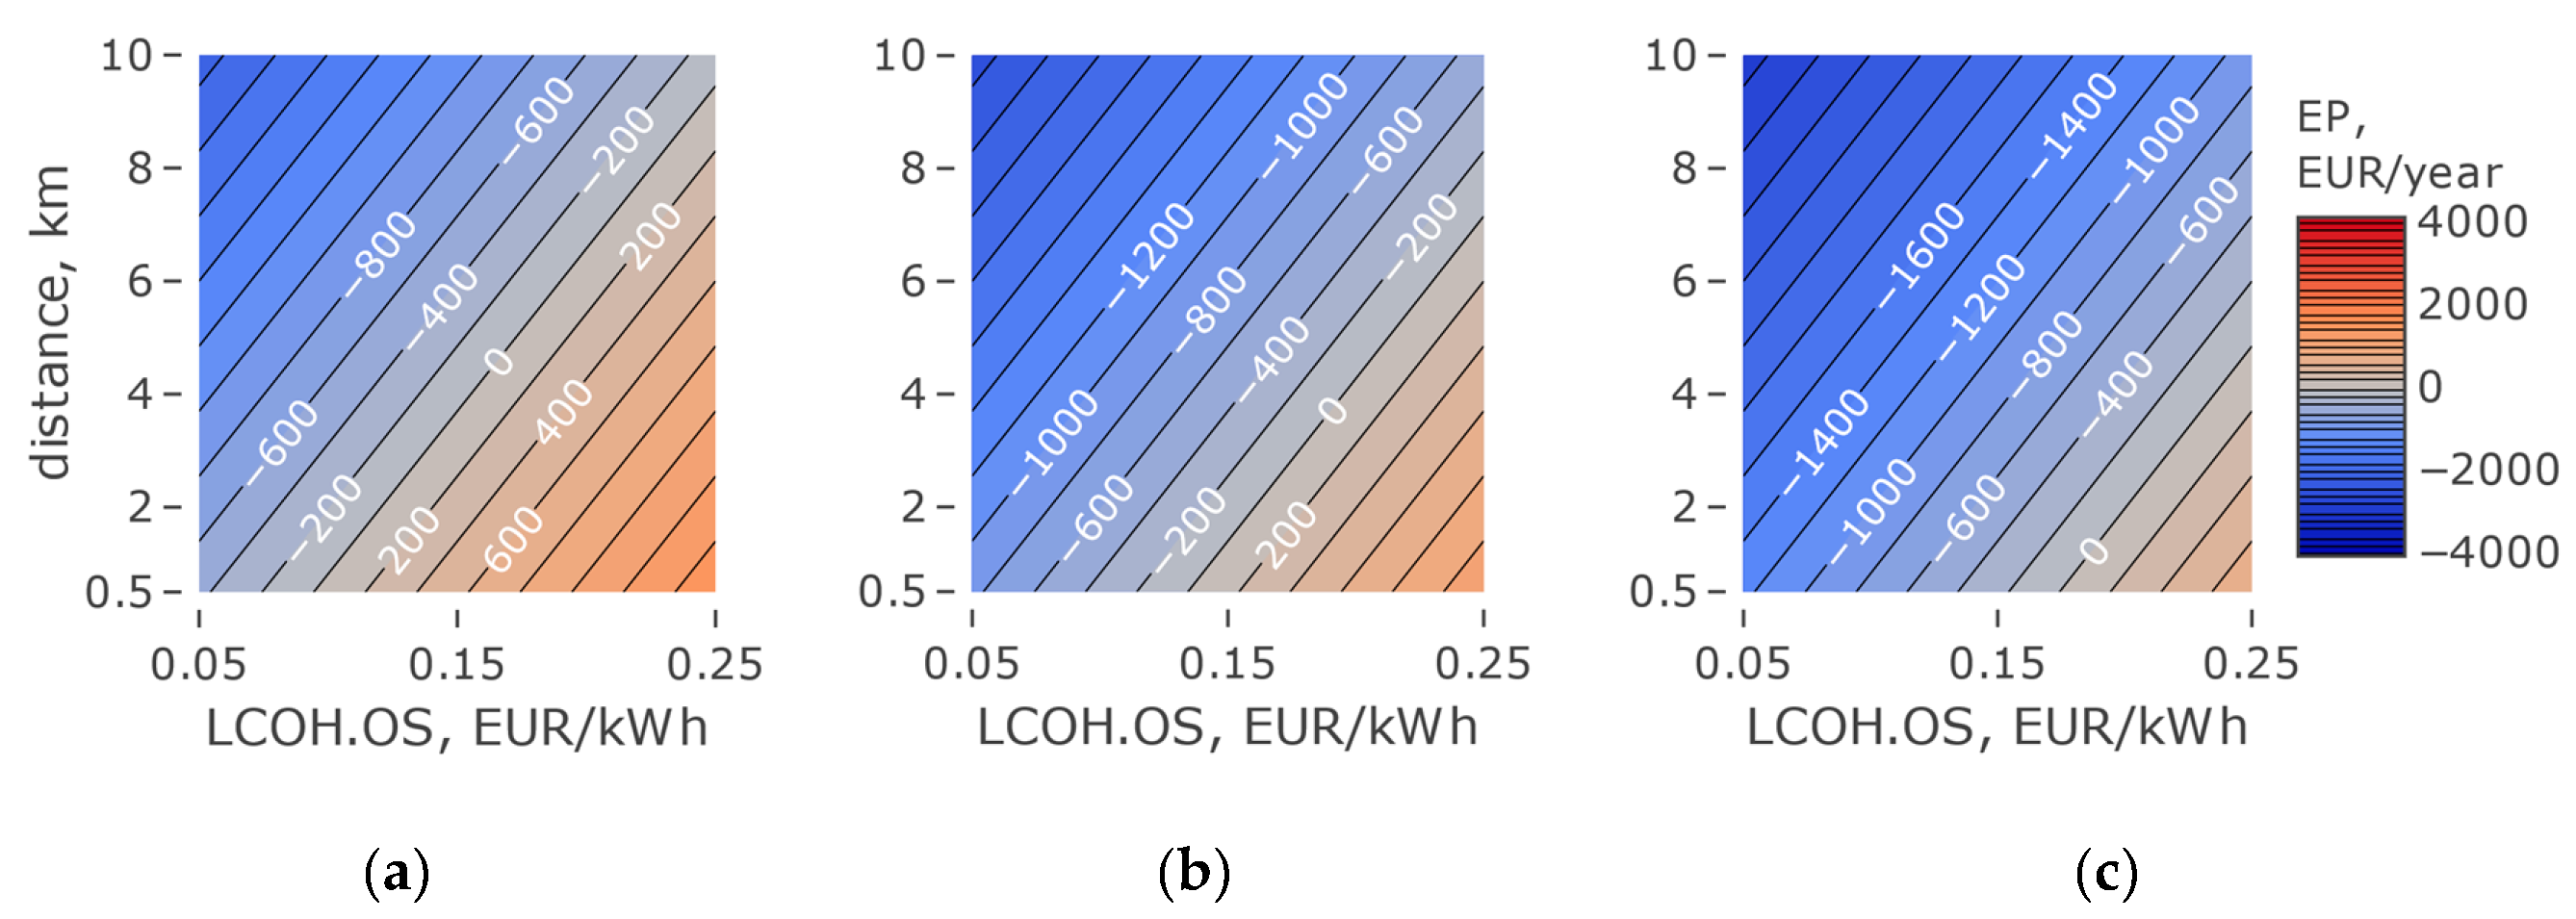
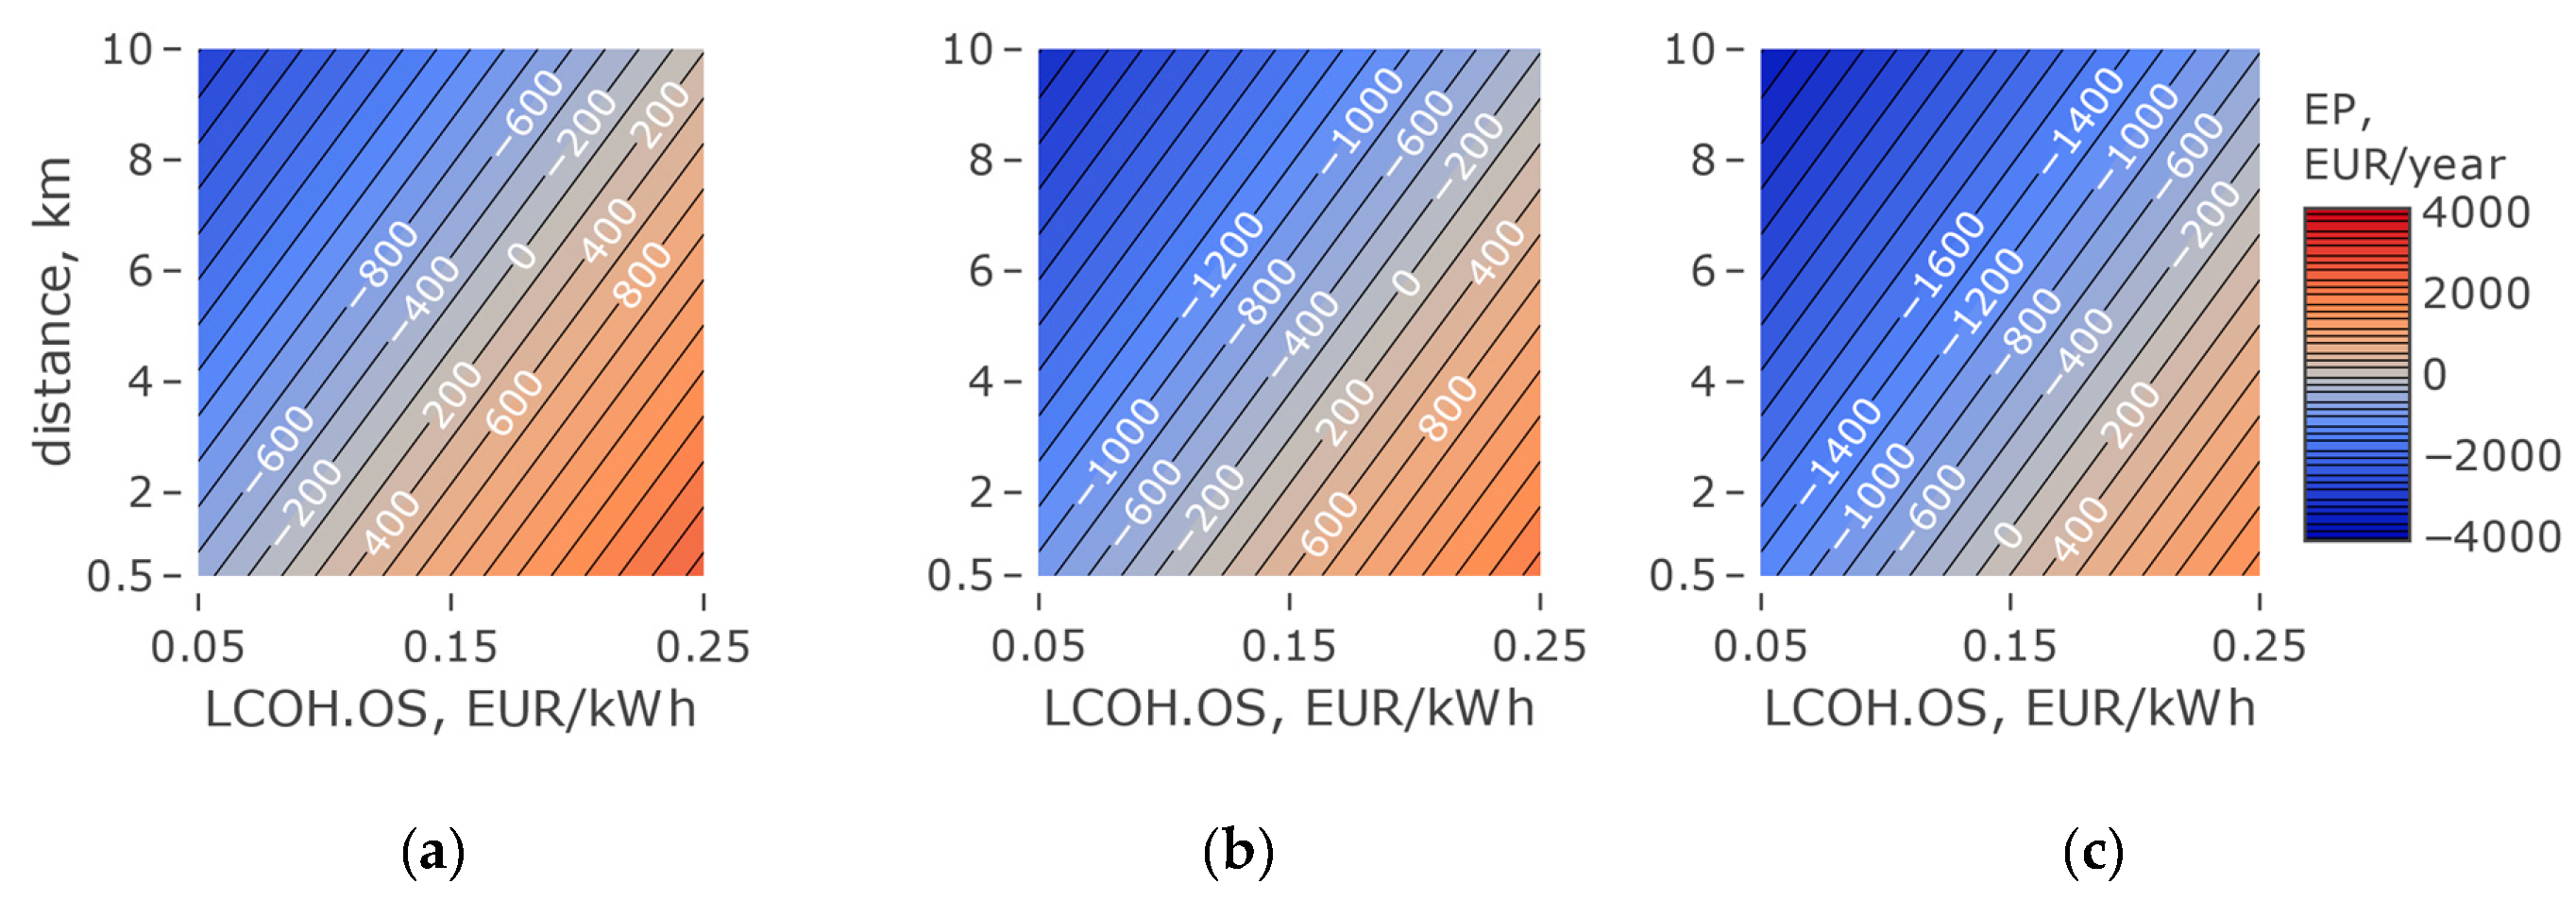
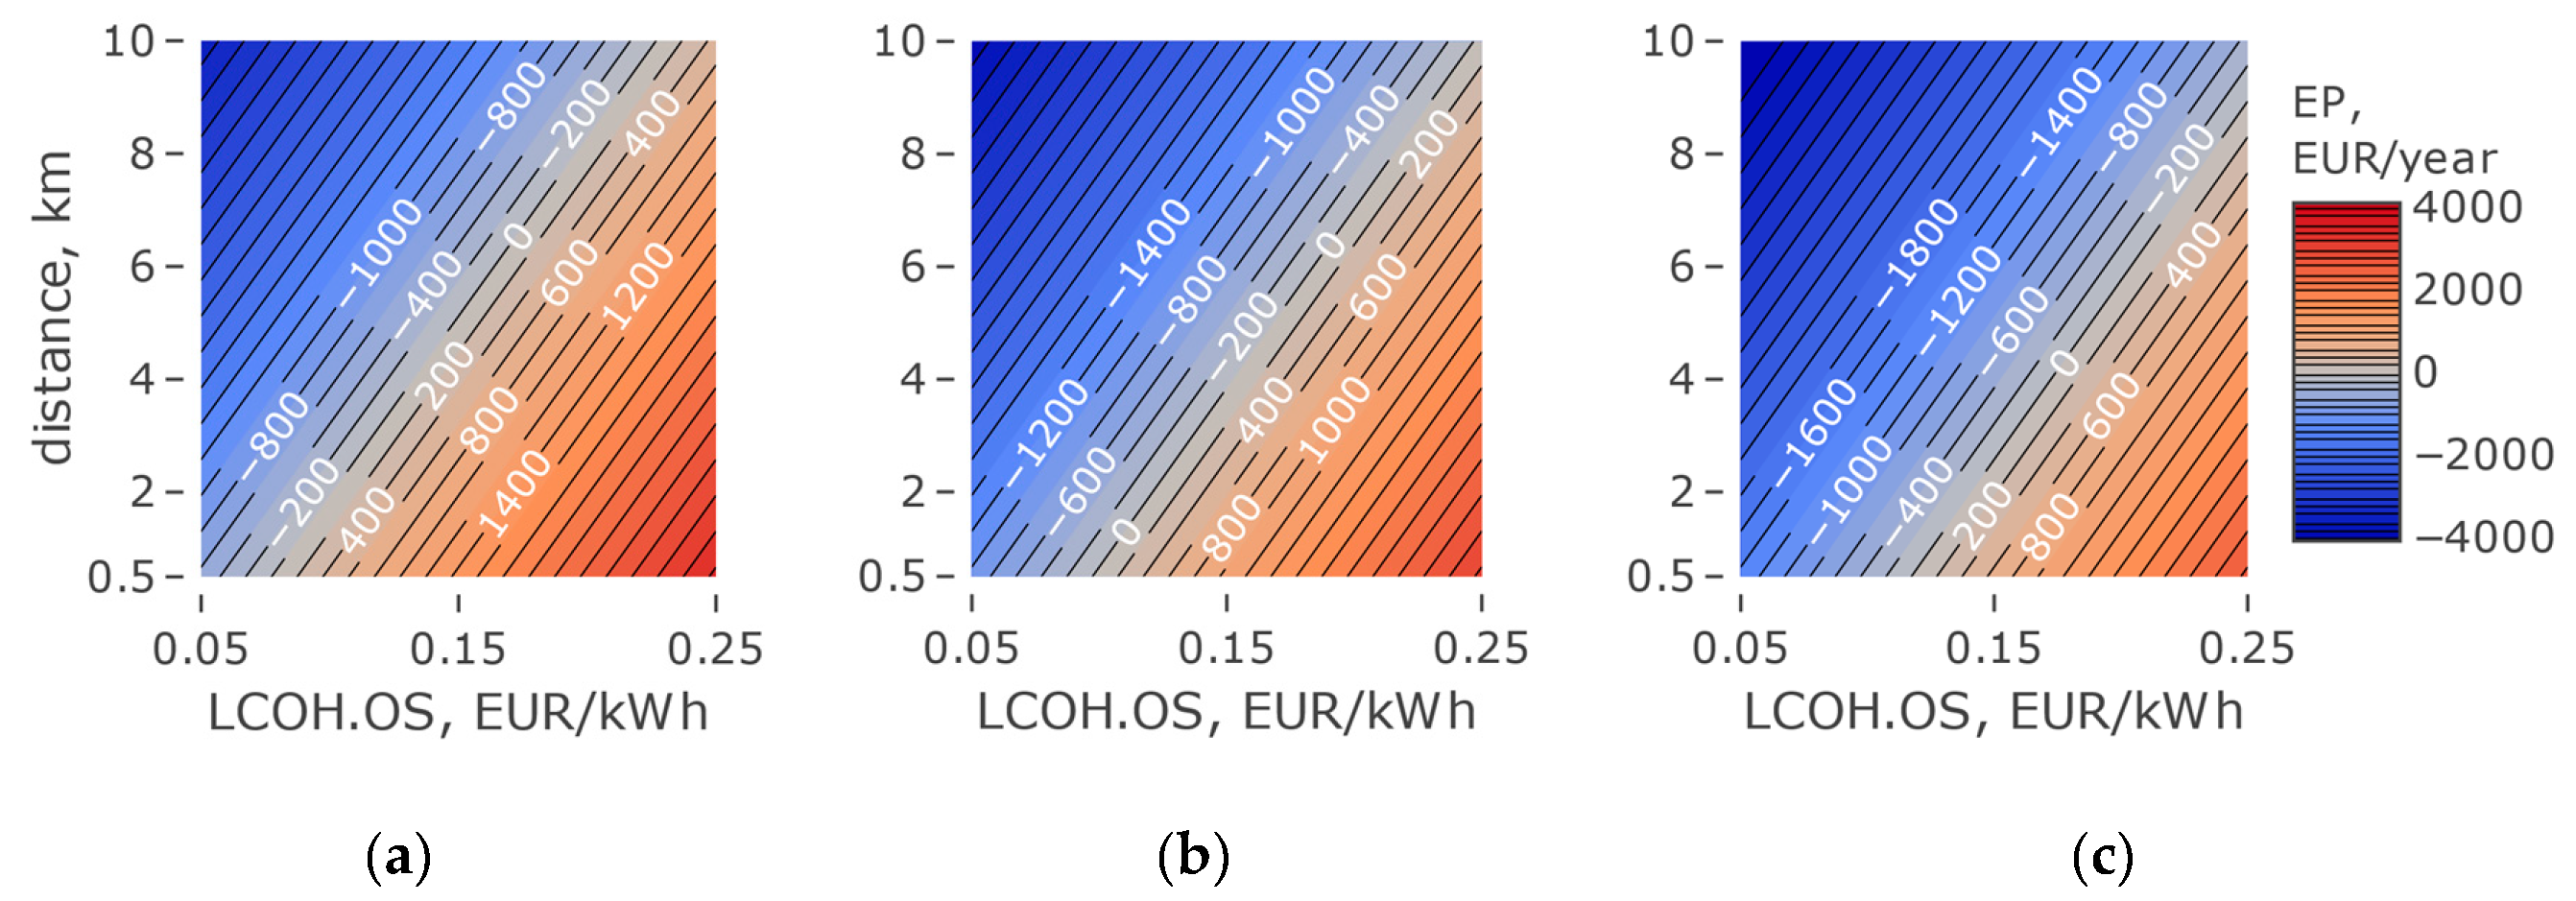
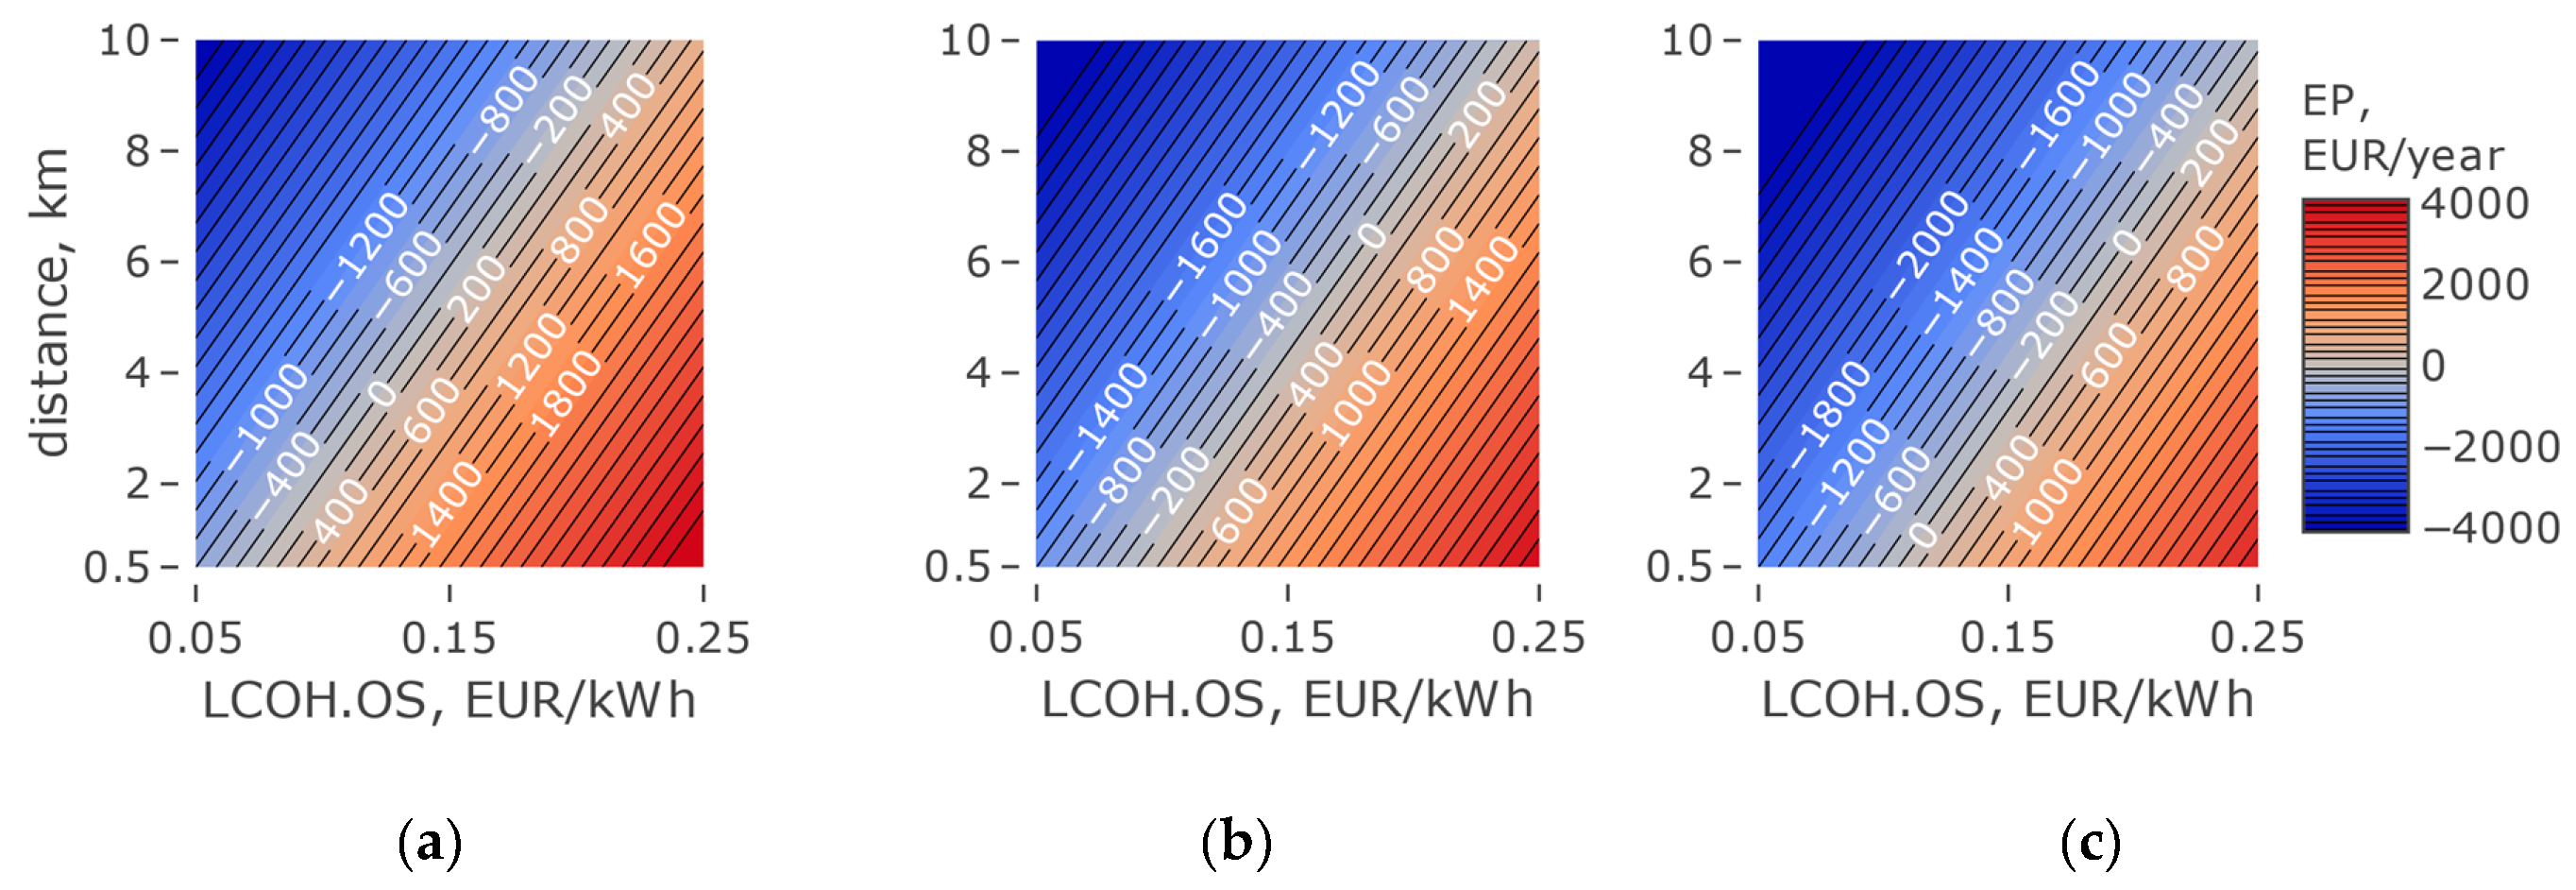
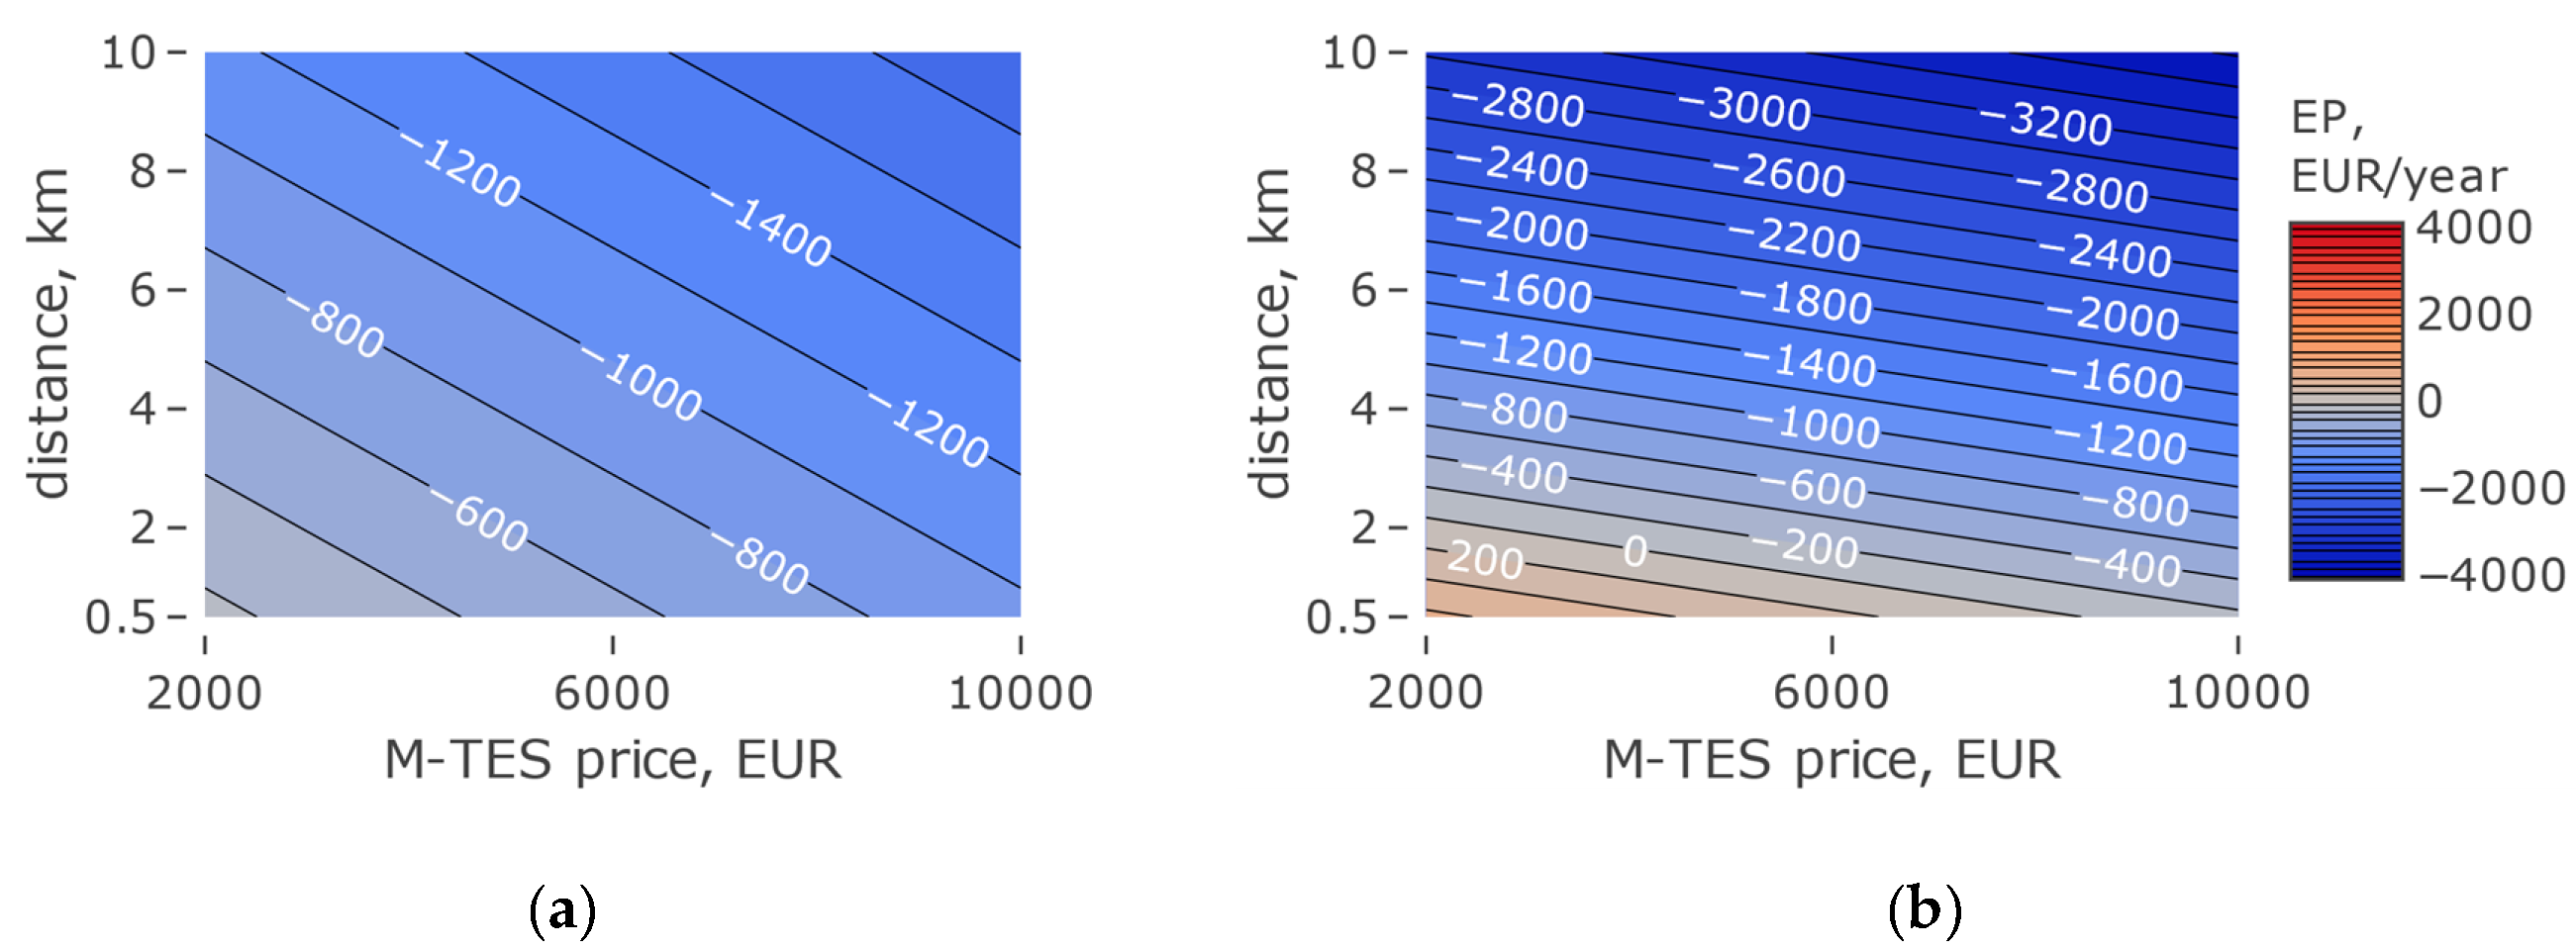
The results in the form of Economical Profitability for THD = 5000, 10,000, 15,000, 20,000 and 25,000 kWh/year are presented in the distance, along with the Levelized Cost of Heating (LCOH) function of the current heat source (LCOH.OS): Figure 11, Figure 12, Figure 13, Figure 14 and Figure 15: (a) for M-TES price = EUR 2000, (b) for M-TES price = EUR 6000 (c) for M-TES price = EUR 10,000.
A profitability of at least zero will be achieved at M-TES price = 6000 EUR for the total heat demand (THD):
- 5000 kWh/year; at the price LCOH.OS = 0.21 EUR/kWh and distance = 0.5 km;
- 10,000 kWh/year; at the price LCOH.OS = 0.135 EUR/kWh and distance = 0.5 km; at the price 0.235 EUR/kWh and distance = 6 km;
- 15,000 kWh/year; at the price LCOH.OS = 0.11 EUR/kWh and distance = 0.5 km; at the price 0.205 EUR/kWh and distance = 6 km;
- 20,000 kWh/year; at the price LCOH.OS = 0.095 EUR/kWh and distance = 0.5 km; at the price 0.19 EUR/kWh and distance = 6 km;
- 25,000 kWh/year; at the price LCOH.OS = 0.085 EUR/kWh and distance = 0.5 km; at the price 0.18 EUR/kWh and distance = 6 km.
At higher demand values (THD) from the analyzed range, the results in the form of EP assume higher values, because the unit cost of M-TES decreases. This relationship is also influenced by the fact that M-TES price is usually higher than half of the cost of another heat source converted into 20 years of lifetime (½·nl·OS.P). In addition, the above-mentioned dependence (EP on M-TES.P) is affected by the HL (M-TES)/THD ratio, which is lower at higher THD values, because the HL (M-TES) value is practically constant. HL (M-TES) depends, among other things, on temperature in M-TES and the outside temperature.
An example of the impact of THD on EP is illustrated by a comparison of Figure 11b and Figure 15b (for M-TES.P = EUR 6000). For the same LCOH.OS price equal to 0.15 EUR/kWh, five times more heat demand is added to the increase of EP from −300 EUR/ear to 1500 EUR/year, at distance = 0.5 km. When LCOH.OS is 0.1 EUR/kWh, EP achieves a result of −550 EUR/ear and 200 EUR/year respectively. Additionally, in Figure 15b, there is a higher slope of the isoline compared to Figure 11b. This demonstrates the relatively smaller impact of distance on EP compared to the effect of LCOH.OS on EP. A similar comparison (THD = 5000 and 25,000 kWh/year) was made for LCOH.OS equal to 0.1 EUR/kWh and variable M-TES.P—Figure 16. The impact of M-TES price clearly becomes smaller with higher heat demand. In turn, a greater impact on EP is identified for distance.
3.3. NPV Analysis
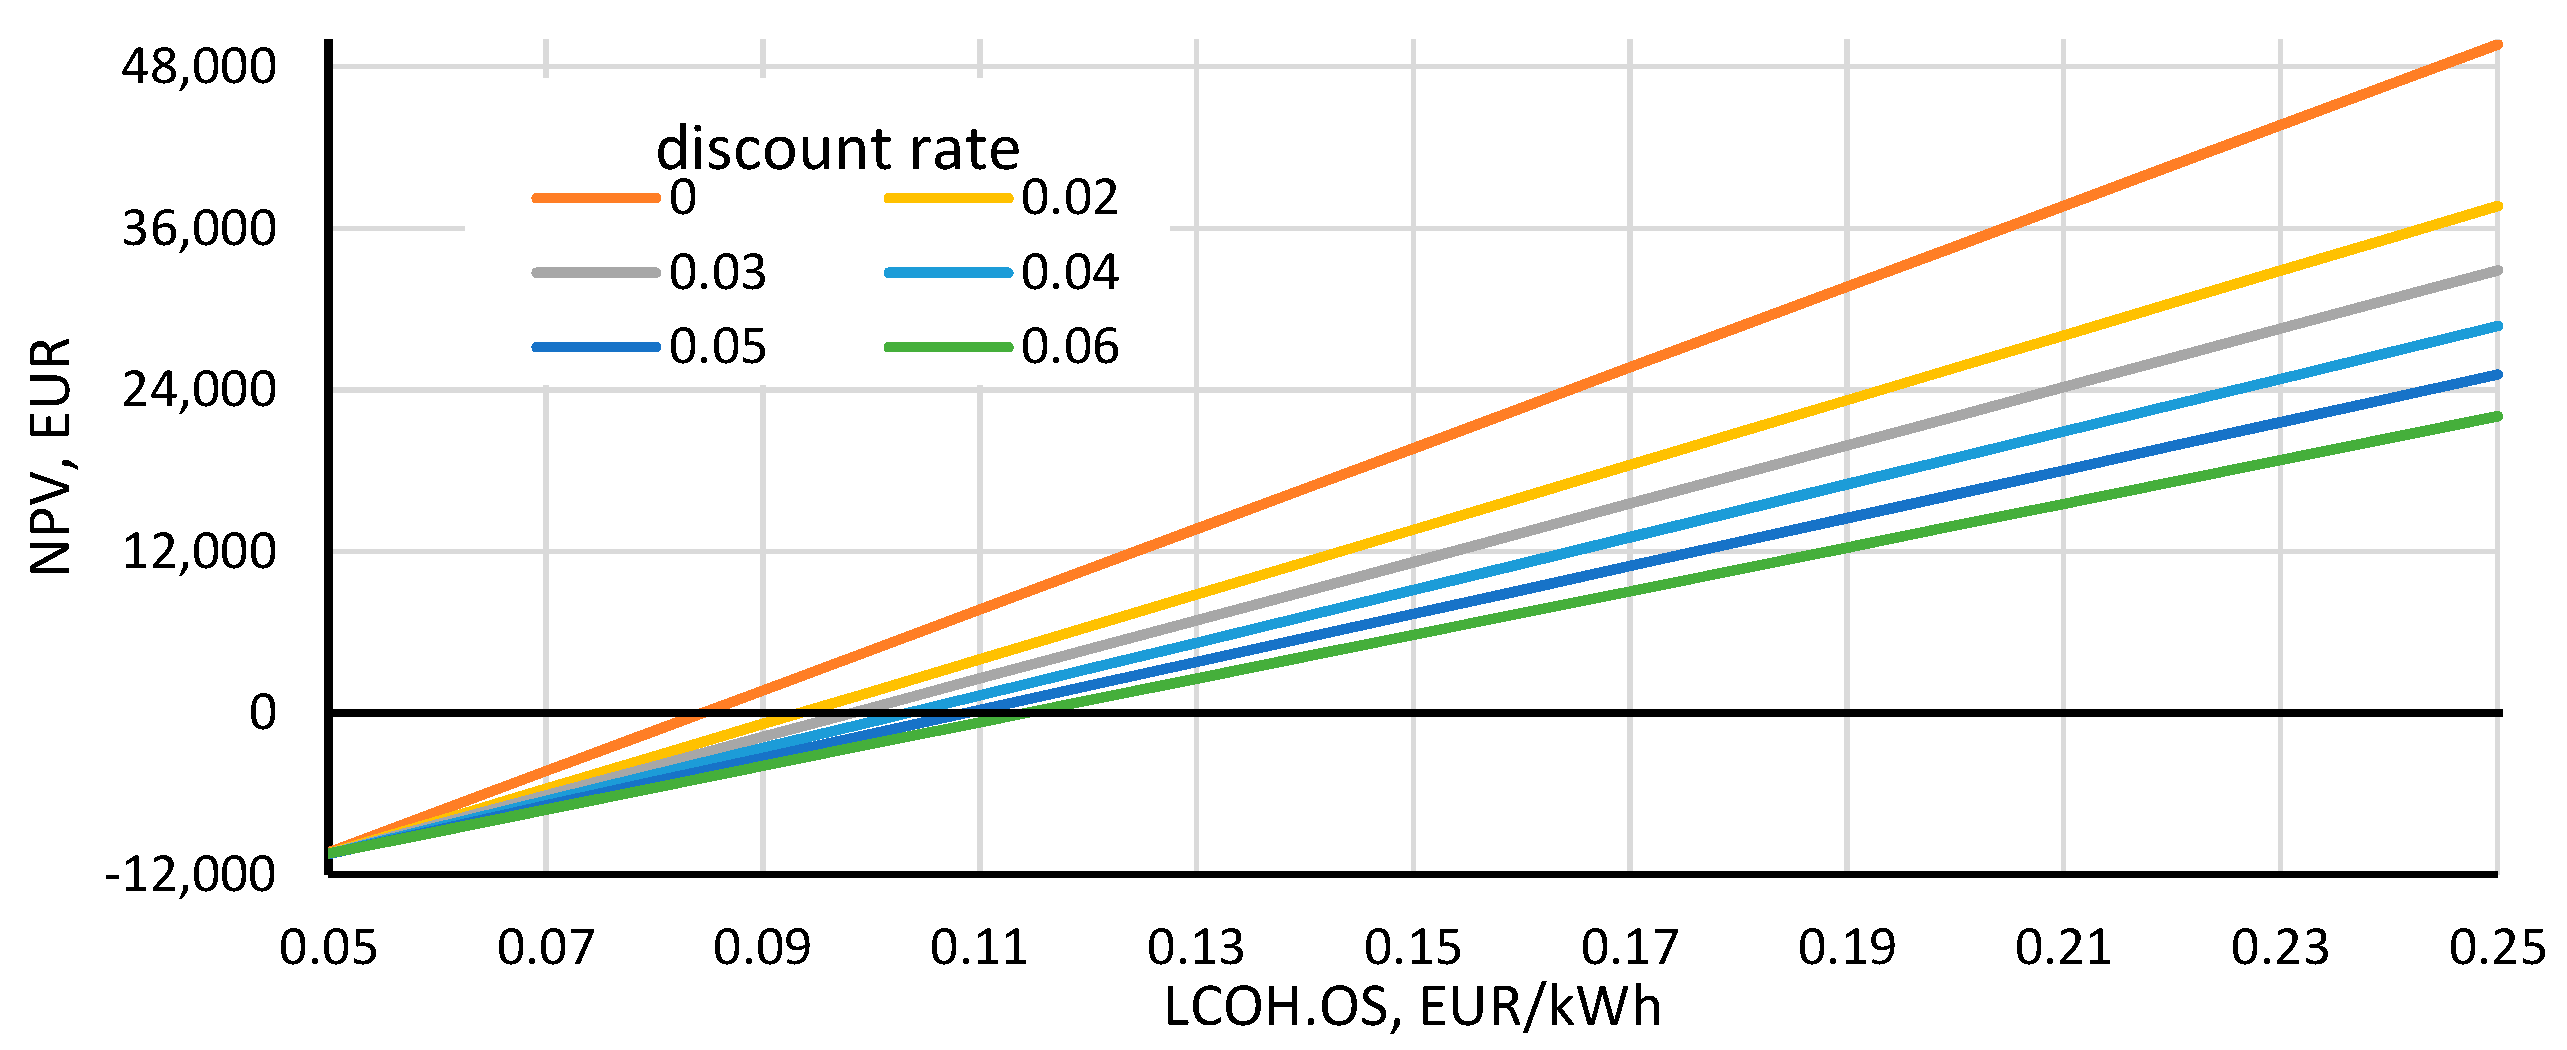
The Net Present Value (NPV) was calculated (for 20 years and distance = 0.5 km) for M-TES.P = 6000 EUR and THD = 15,000 EUR/year (LCOH.G without M-TES.P = 0.045 EUR/kWh). The results for various discount rates are shown in Figure 17. At a discount rate of 6%, NPV reaches zero for LCOH.OS = 0.115 EUR/kWh, and for a discount rate of 0% at 0.082 EUR/kWh.
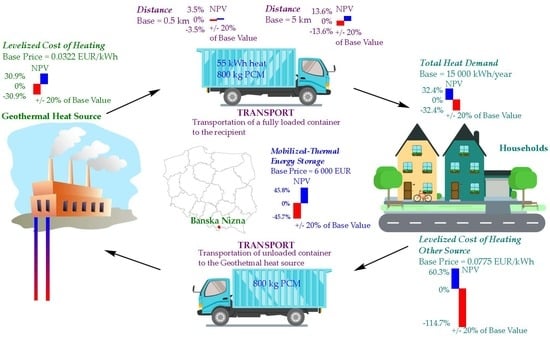
To verify the impact of changing the value of selected parameters (+/−20%) on the NPV change, a sensitivity analysis was performed—Table 1. The results of the analysis were sorted from the largest to the smallest impact, but this is related to the base level of the parameters—a different base level would have a different impact on NPV (example distance 0.5 km and 5 km—Table 1). Significantly, the ratio of heat demand for heating and domestic hot water preparation (with the same THD) does not play any role in the NPV value, but only as shown in Section 2 for different frequencies of M-TES replacement in individual months. At the same time, the authors are aware that the results of the sensitivity analysis are affected by the adopted baseline values, e.g., as shown in Table 1, the assumed baseline distance will have a different impact on NPV change.
3.4. Carbon Dioxide Emission Reduction
The results in the form of quantitative CO2 emissions related to M-TES transport are presented in Table 2. The results in the form of a quantitative reduction of CO2 emissions in the event of the replacement of a coal or gas source by a geothermal source by a mobile heat storage are presented in Table 2. The results presented in Table 2 and Table 3 were estimated for the assumptions presented in Section 2.3.
Journeys related to transportation M-TES for a year to cover the heat demand for a building THD = 5000 kWh/year for a distance of 0.5 km are associated with CO2 emissions from the car at the level of 38 kg CO2/year, a distance of 10 km will result in 20x greater emissions. At THD = 25,000 kWh/year carbon dioxide emission is about 3.6 higher than in THD = 5000 kWh/year.
For a building with THD = 25,000 kWh/year and a distance of 0.5 km from the M-TES charging station, the use of geothermal source will bring:
- A total of 9 Mg CO2 emission reduction when replacing a coal-fueled heat source,
- A total of 4.8 Mg CO2 emission reduction when replacing a natural gas heat source. For a distance of 10 km and THD = 5000 kWh/year, and when replacing a source powered by natural gas, the reduction will be only 0.2 Mg CO2/year.
4. Conclusions
This article considered, for Polish conditions, the technical and economic possibilities of providing geothermal heat to individual recipients using an M-TES system. For this purpose, heat storage, PCM and the best location regarding geothermal heat availability (temperature and the cost) were selected. The chosen location is Bańska Niżna near Zakopane (southern part of the Poland). An indirect contact energy storage container filled with PCM characterized by melting temperature 70 °C and heat storage capacity 250 kJ/kg was selected, in the amount of 800 kg. The total M-TES heat capacity is 55 kWh.
The discussed PCM-container is satisfactory to supply a building with a total heat demand (central heating and domestic hot water) up to 25,000 kWh/year. This was established based on the data for the month with the lowest average temperature of the last 20 years (February 2012). Above this demand value, consideration should be given to the use of M-TES with larger heat capacity. The economic profitability of the M-TES system (with a price per warehouse of 6,000 EUR, i.e., a total of 12,000 EUR—two containers are needed) can be achieved for a heat demand of 5000 kWh/year with the price of a replaced heat source at the level of 0.21 EUR/kWh and distance between charging station and building (heat recipient) 0.5 km. For the heat demand of 15,000 kWh/year, the price for replaced heat reached EUR 0.11/kWh, and the same distance. In turn, for a demand of 25,000 kWh/year, the price of the replaced heat source reached 0.085 EUR/kWh.
The NPV value for the M-TES system was also determined. With a heat demand of 15,000 kWh/year, the NPV was calculated for 20 years of operation and a 6% discount rate that reached zero for a levelized cost of heating 0.115 EUR/kWh, and for a discount rate of 0% at 0.082 EUR/kWh. The levelized cost of heating in the case of geothermal energy without M-TES costs (2 × 6000 EUR) amounted to 0.045 EUR/kWh.
The economic profitability is significantly affected by the distance. For the adopted assumptions and at current prices, there are no arguments for transporting geothermal heat over distances bigger than 3–4 km away from the heat source, even in the case of the replaced heat price at the level of the current electricity price in Poland. This also concerns heat losses during the transportation, and ecological aspects. Considering the building with 25,000 kWh/year of total heat demand, which is located 0.5 km from the M-TES charging station, the use of a geothermal source can bring 9 Mg CO2 emission reduction in the case of replacing a coal-fueled heat source or 4.8 Mg CO2 emission reduction in the case of replacing a natural gas heat source. By increasing the distance to 10 km, a decrease in emission reduction of up to 6.4 Mg CO2 and 2.2 Mg CO2, respectively, can be observed.
Author Contributions
All the authors have contributed toward developing and implementing the ideas and concepts presented in the paper. All the authors have collaborated to obtain the results and have been involved in preparing the manuscript. All authors have read and agreed to the published version of the manuscript.
Funding
This work was supported by AGH—University of Science and Technology number 16.16.210.476.
Conflicts of Interest
The authors declare no conflict of interest.
Abbreviations
| CGH | Cost of Geothermal Heat, EUR/year |
| chl | coefficient for heat losses, W/(K·dm3/2) |
| CF | Cash Flow, EUR |
| CH | Central heating |
| DHW | Domestic hot water |
| dist. | distance between building and Geothermal Base Station, km |
| DU | direct use |
| EM.CO2.G | Emission connected with Geothermal source, kg CO2/kWh |
| EM.CO2.KM | Emission from car per km, kg CO2/km |
| EM.CO2.OS | Emission from other than Geothermal source, kg CO2/kWh |
| EP | Economical profitability, EUR/year |
| EUR | Euro |
| FC.OS | total cost of fuel for other than Geothermal heat source, EUR/year |
| GHG | greenhouse gases |
| GHP | unit geothermal heat price, EUR/kWh |
| HL | Heat loss, kWh |
| IO | initial investment value, EUR |
| LCOH | Levelized Cost of Heating, EUR/kWh |
| LCOH.G | Levelized Cost of Heating (for n years) for Geothermal source |
| LCOH.OS | Levelized Cost of Heating (for n years) for other than Geothermal source |
| M-TES | Mobile Thermal Energy Storage |
| M-TES.EX | Mobile Thermal Energy Storage exchanged |
| M-TES.P | M-TES price, EUR |
| n | lifetime of M-TES, year |
| ni | number of M-TES for each house |
| nl | correction coefficient of lifetime for other source |
| NPV | Net present value, EUR |
| OS.P | other source price, EUR |
| Q | heat, kWh |
| r | discount rate, % |
| RE.CO2 | reduction of CO2 emissions, kgCO2/year |
| T | Temperature, °C |
| t | subsequent year |
| Ta | Outside temperature, °C |
| TC | Transport and work cost, EUR/kWh |
| TfCMs | Time for M-TES exchanging, min |
| th | thermal |
| THD | Total heat demand for the building, kWh/year |
| TPEH_GEO | Total price of energy for heating—geothermal source, EUR/kWh |
| TPEH_OS | Total price of energy for heating—other source (not geothermal), EUR/kWh |
| TTC | Total transport cost, EUR/km |
| TWC | Total work cost, EUR/h |
| V | volume, dm3 |
| UTT | unit transport time, min/km |
| WC | work cost, EUR/year |
| τ | time |
References
- McCay, A.T.; Harley, T.L.; Younger, P.L.; Sanderson, D.C.W.; Cresswell, A.J. Gamma-ray spectrometry in geothermal exploration: State of the art techniques. Energies 2014, 7, 4757–4780. [Google Scholar] [CrossRef] [Green Version]
- Stober, I.; Bucher, K. Geothermal energy: From theoretical models to exploration and development. In Geothermal Energy: From Theoretical Models to Exploration and Development; Springer: Berlin/Heidelberg, Germany, 2013; ISBN 9783642133527. [Google Scholar]
- Li, K.; Bian, H.; Liu, C.; Zhang, D.; Yang, Y. Comparison of geothermal with solar and wind power generation systems. Renew. Sustain. Energy Rev. 2015, 42, 1464–1474. [Google Scholar] [CrossRef]
- Zhu, J.; Hu, K.; Lu, X.; Huang, X.; Liu, K.; Wu, X. A review of geothermal energy resources, development, and applications in China: Current status and prospects. Energy 2015, 93, 466–483. [Google Scholar] [CrossRef]
- Younger, P.L. Energy: All That Matters Paperback; Hodder and Stoughton/John Murray: London, UK, 2014. [Google Scholar]
- Moya, D.; Aldás, C.; Kaparaju, P. Geothermal energy: Power plant technology and direct heat applications. Renew. Sustain. Energy Rev. 2018, 94, 889–901. [Google Scholar] [CrossRef]
- Xia, L.; Zhang, Y. An overview of world geothermal power generation and a case study on China—The resource and market perspective. Renew. Sustain. Energy Rev. 2019, 112, 411–423. [Google Scholar] [CrossRef]
- Redko, A.; Redko, O.; DiPippo, R. Heating with geothermal systems. In Low-Temperature Energy Systems with Applications of Renewable Energy; Academic Press: London, UK, 2020; pp. 177–224. [Google Scholar]
- Gudmundsson, J.S.; Freeston, D.H.; Lienau, P.J. Lindal diagram. Trans. Geotherm. Resour. Counc. 1985, 9, 15–17. [Google Scholar]
- Kaczmarczyk, M.; Tomaszewska, B.; Operacz, A. Sustainable utilization of low enthalpy geothermal resources to electricity generation through a cascade system. Energies 2020, 13, 2495. [Google Scholar] [CrossRef]
- Dickson, M.H.; Fanelli, M. Geothermal Energy: Utilization and Technology; Earthscan: London, UK, 2013; ISBN 9781315065786. [Google Scholar]
- Younger, P.L. Geothermal energy: Delivering on the global potential. Energies 2015, 8, 11737–11754. [Google Scholar] [CrossRef] [Green Version]
- IRENA Geothermal Energy. Available online: https://www.irena.org/geothermal (accessed on 15 May 2020).
- Bertani, R. Geothermal power generation in the world 2010–2014 update report. Geothermics 2016, 60, 31–43. [Google Scholar] [CrossRef]
- DiPippo, R. Geothermal Power Plants: Principles, Applications, Case Studies and Environmental Impact, 3rd ed.; Butterworth-Heinemann: London, UK, 2012; ISBN 978-0-08-098206-9. [Google Scholar]
- Valdimarsson, P. Geothermal power plants and main components. In Proceedings of the Short Course on Geothermal Drilling, Resource Development and Power Plants, Santa Tecla, El Salvador, 16–22 January 2011. [Google Scholar]
- Anderson, D.N.; Lund, J.W. Direct Utilization of Geothermal Energy: A Technical Handbook; Geothermal Resources Council: Davis, CA, USA, 1979. [Google Scholar]
- Glassley, W.E. Geothermal Energy—Renewable Energy and the Environment, 2nd ed.; CRC Press/Taylor&Francis: Boca Raton, FL, USA, 2014; ISBN 9780429161988. [Google Scholar]
- Lund, J.W.; Freeston, D.H.; Boyd, T.L. Direct application of geothermal energy: 2005 Worldwide review. Geothermics 2005, 34, 691–727. [Google Scholar] [CrossRef]
- Lund, J.W.; Freeston, D.H.; Boyd, T.L. Direct utilization of geothermal energy 2010 worldwide review. Geothermics 2011, 40, 159–180. [Google Scholar] [CrossRef]
- Lund, J.W.; Boyd, T.L. Direct utilization of geothermal energy 2015 worldwide review. Geothermics 2016, 60, 66–93. [Google Scholar] [CrossRef]
- Marrasso, E.; Roselli, C.; Sasso, M.; Tariello, F. Global and local environmental and energy advantages of a geothermal heat pump interacting with a low temperature thermal micro grid. Energy Convers. Manag. 2018, 172, 540–553. [Google Scholar] [CrossRef]
- Alkhwildi, A.; Elhashmi, R.; Chiasson, A. Parametric modeling and simulation of low temperature energy storage for cold-climate multi-family residences using a geothermal heat pump system with integrated phase change material storage tank. Geothermics 2020, 86, 101864. [Google Scholar] [CrossRef]
- Mangi, P. Geothermal direct use application: A case of geothermal Spa and demonstration centre at olkaria geothermal project, Kenya. In Proceedings of the Short Course IX on Exploration for Geothermal Resources, Naivasha, Kenya, 2–23 November 2014. [Google Scholar]
- Matuszewska, D.; Olczak, P. Evaluation of using gas turbine to increase efficiency of the Organic Rankine Cycle (ORC). Energies 2020, 13, 1499. [Google Scholar] [CrossRef] [Green Version]
- Carotenuto, A.; Figaj, R.D.; Vanoli, L. A novel solar-geothermal district heating, cooling and domestic hot water system: Dynamic simulation and energy-economic analysis. Energy 2017, 141, 2652–2669. [Google Scholar] [CrossRef]
- Hepbasli, A.; Canakci, C. Geothermal district heating applications in Turkey: A case study of Izmir-Balcova. Energy Convers. Manag. 2003, 44, 1285–1301. [Google Scholar] [CrossRef]
- Sander, M. Geothermal district heating systems: Country case studies from China, Germany, Iceland, and United States of america, and schemes to overcome the gaps. Trans. Geotherm. Resour. Counc. 2016, 40, 769–776. [Google Scholar]
- Miró, L.; Gasia, J.; Cabeza, L.F. Thermal energy storage (TES) for industrial waste heat (IWH) recovery: A review. Appl. Energy 2016, 179, 284–301. [Google Scholar] [CrossRef] [Green Version]
- CSO. Energy Consumption in Households in 2018; CSO: Warsaw, Poland, 2019. [Google Scholar]
- Ministry of Development Regulation of the Minister of Infrastructure and Development of 27 February 2015 on the Methodology for Determining the Energy Performance of a Building or Part of a Building, and Energy Performance Certificates. Available online: http://prawo.sejm.gov.pl/isap.nsf/download.xsp/WDU20150000376/O/D20150376.pdf (accessed on 22 March 2020).
- Kryzia, D.; Kuta, M.; Matuszewska, D.; Olczak, P. Analysis of the potential for gas micro-cogeneration development in Poland using the Monte Carlo method. Energies 2020, 13, 3140. [Google Scholar] [CrossRef]
- Specjał, A.; Lipczynska, A.; Hurnik, M.; Król, M.; Palmowska, A.; Popiołek, Z. Case study of thermal diagnostics of single-family house in temperate climate. Energies 2019, 12, 4549. [Google Scholar] [CrossRef] [Green Version]
- Wang, Y.; Yu, K.; Ling, X. Experimental study on thermal performance of a mobilized thermal energy storage system: A case study of hydrated salt latent heat storage. Energy Build. 2020, 210, 109744. [Google Scholar] [CrossRef]
- Wang, W.; Guo, S.; Li, H.; Yan, J.; Zhao, J.; Li, X.; Ding, J. Experimental study on the direct/indirect contact energy storage container in mobilized thermal energy system (M-TES). Appl. Energy 2014, 119, 181–189. [Google Scholar] [CrossRef]
- Deckert, M.; Scholz, R.; Binder, S.; Hornung, A. Economic efficiency of mobile latent heat storages. Energy Procedia 2014, 46, 171–177. [Google Scholar] [CrossRef]
- Zhang, X.; Chen, X.; Han, Z.; Xu, W. Study on phase change interface for erythritol with nano-copper in spherical container during heat transport. Int. J. Heat Mass Transf. 2016, 92, 490–496. [Google Scholar] [CrossRef]
- Krönauer, A.; Lävemann, E.; Brückner, S.; Hauer, A. Mobile sorption heat storage in industrial waste heat recovery. Energy Procedia 2015, 73, 272–280. [Google Scholar] [CrossRef] [Green Version]
- Igliński, B.; Buczkowski, R.; Kujawski, W.; Cichosz, M.; Piechota, G. Geoenergy in Poland. Renew. Sustain. Energy Rev. 2012, 16, 2545–2557. [Google Scholar] [CrossRef]
- Bujakowski, W.; Tomaszewska, B.; Miecznik, M. The Podhale geothermal reservoir simulation for long-term sustainable production. Renew. Energy 2016, 99, 420–430. [Google Scholar] [CrossRef]
- Tomaszewska, B.; Pająk, L. Cooled and desalinated thermal water utilization in the Podhale heating system. Miner. Resour. Manag. 2013, 29, 127–139. (In Polish) [Google Scholar] [CrossRef] [Green Version]
- URE Tariffs Published in 2019. (In Polish). Available online: https://bip.ure.gov.pl/bip/taryfy-i-inne-decyzje-b/cieplo/3784,Taryfy-opublikowane-w-2019-r.html (accessed on 22 April 2020).
- Kępińska, B. A review of geothermal energy uses in Poland in 2016−2018. Tech. Pozyskiwań Geol. Geoterm. Zrównoważony Rozw. 2018, 1, 11–27. [Google Scholar]
- Puretemp Global Authority on Phase Change Material. Available online: http://www.puretemp.com/ (accessed on 8 April 2020).
- Axiotherm Axiotherm PCM. Available online: www.axiotherm.de/en/produkte/axiotherm-pcm/ (accessed on 10 April 2020).
- GlobalESystem Phase Change Materials. Available online: www.global-e-systems.com/en/phase-change-materials/ (accessed on 9 April 2020).
- Rubitherm PCM RT Line. Available online: www.rubitherm.eu/en/index.php/productcategory/organische-pcm-rt (accessed on 10 April 2020).
- Kaczmarczyk, M.; Sowizdzał, A.; Tomaszewska, B. Energetic and environmental aspects of individual heat generation for sustainable development at a local scale—A case study from Poland. Energies 2020, 13, 454. [Google Scholar] [CrossRef] [Green Version]
- CSO. National Census; Central Statistical Office: Warsaw, Poland, 2014. [Google Scholar]
- CSO. Household Forecast for 2016–2050. Available online: https://stat.gov.pl/obszary-tematyczne/ludnosc/prognoza-ludnosci/prognoza-gospodarstw-domowych-na-lata-2016-2050,9,4.html (accessed on 19 April 2020).
- En, B.S. Heating systems in buildings—Method for calculation of system energy requirements and system efficiencies. Management 2007. [Google Scholar] [CrossRef]
- Ministry of Development Typical Reference Year. Available online: https://www.gov.pl/web/fundusze-regiony/dane-do-obliczen-energetycznych-budynkow (accessed on 18 December 2019).
- Olczak, P.; Zabagło, J.; Kandefer, S.; Dziedzic, J. Influence of solar installation with flat-plate collectors in a detached house on pollutants emission and waste stream. In Between Evolution and Revolution—In Search of an energy Strategy; WAT: Poznań, Poland, 2015; pp. 739–752. [Google Scholar]
- Doračić, B.; Novosel, T.; Pukšec, T.; Duić, N. Evaluation of excess heat utilization in district heating systems by implementing levelized cost of excess heat. Energies 2018, 11, 575. [Google Scholar] [CrossRef] [Green Version]
- Kryzia, D.; Kopacz, M.; Kryzia, K. The valuation of the operational flexibility of the energy investment project based on a gas-fired power plant. Energies 2020, 13, 1567. [Google Scholar] [CrossRef] [Green Version]
- Kryzia, D.; Kopacz, M.; Orzechowska, M. Estimation of carbon dioxide emissions and diesel consumption in passenger cars. Bull. Miner. Energy Econ. Res. Inst. Polish Acad. Sci. 2015, 90, 79–92. [Google Scholar]
- Pająk, L.; Tomaszewska, B.; Bujakowski, W.; Bielec, B.; Dendys, M. Review of the low-enthalpy lower cretaceous geothermal energy resources in Poland as an environmentally friendly source of heat for urban district heating systems. Energies 2020, 13, 1302. [Google Scholar] [CrossRef] [Green Version]
- IoEP-NRI. Inventory of Greenhouse Gases in Poland for 1988–2017; The National Centre for Emissions Management: Warsaw, Poland, 2019. [Google Scholar]
- Olczak, P.; Olek, M.; Kryzia, D. The ecological impact of using photothermal and photovoltaic installations for DHW preparation. Polityka Energ. Energy Policy J. 2020, 23, 65–74. [Google Scholar] [CrossRef]
- WSKAŹNIKI EMISYJNOŚCI CO2, SO2, NOx, CO i pyłu całkowitego DLA ENERGII ELEKTRYCZNEJ. Available online: https://www.kobize.pl/uploads/materialy/materialy_do_pobrania/wskazniki_emisyjnosci/Wskazniki_emisyjnosci_grudzien_2019.pdf (accessed on 7 April 2020).
- Copernicus Climate Change Service (C3S). ERA5: Fifth Generation of ECMWF Atmospheric Reanalyses of the Global Climate. Copernicus Climate Change Service Climate Data Store (CDS). Available online: https://climate.copernicus.eu/climate-data-store (accessed on 24 March 2020).
- European Centre for Medium-Range Weather Forecasts (ECMWF) ERA5. Available online: https://cds.climate.copernicus.eu/cdsapp#!/dataset/reanalysis-era5-land-monthly-means?tab=form (accessed on 24 March 2020).
- Ogimet Synop Based Summary by States form 2019. Available online: http://ogimet.com/resynops.phtml.en (accessed on 24 April 2020).

Figure 2.
Work cycle of the mobile thermal energy storage system.

Figure 3.
Map of Poland with geothermal sources and heat price (without distribution and charge for power). Source: own study based on [42,43].

Figure 4.
Demand for thermal energy in households in Poland. Data limited to coal sources. Source: own study, based on [30,31,50].

Figure 5.
Outside temperature in Zakopane according to Typical Reference Year. Source: own study, based on [52].
Figure 5.
Outside temperature in Zakopane according to Typical Reference Year. Source: own study, based on [52].

Figure 6.
Heat demand and heat losses and heat accumulated in mobile thermal storage system (M-TES) for each hour in the 1–240-h period of the year (January).
Figure 6.
Heat demand and heat losses and heat accumulated in mobile thermal storage system (M-TES) for each hour in the 1–240-h period of the year (January).

Figure 7.
Heat demand and heat losses and heat accumulated in M-TES for each hour in the 4000–4240-h period of the year (June).
Figure 7.
Heat demand and heat losses and heat accumulated in M-TES for each hour in the 4000–4240-h period of the year (June).

Figure 8.
Number of M-TES exchanges (M-TES.EX) during each month of the year for different value of total heat demand (THD): 5000, 15,000 and 25,000 kWh/year.
Figure 8.
Number of M-TES exchanges (M-TES.EX) during each month of the year for different value of total heat demand (THD): 5000, 15,000 and 25,000 kWh/year.

Figure 9.
Outside temperature (Ta) in Banska Nizna: average temperature in each day hour in each month in 2000–2019.
Figure 9.
Outside temperature (Ta) in Banska Nizna: average temperature in each day hour in each month in 2000–2019.

Figure 10.
Outside temperature (Ta) in Zakopane and number of M-TES exchanges (×) calculated for February 2012. Source: own study, based on [63].
Figure 10.
Outside temperature (Ta) in Zakopane and number of M-TES exchanges (×) calculated for February 2012. Source: own study, based on [63].

Figure 11.
The Yearly Economical Profitable as a function of Levelized Cost of Heating from non-geothermal source (LCOH.OS) and distance between Geothermal Base Station and House, for Total Heat Demand (THD) = 5000 kWh/year and for: (a) M-TES price = 2000 EUR; (b) M-TES price = 6000 EUR; (c) M-TES price = 10,000 EUR.

Figure 12.
The Yearly Economical Profitable as a function of Levelized Cost of Heating from non-geothermal source (LCOH.OS) and distance between Geothermal Base Station and House, for Total Heat Demand (THD) = 10,000 kWh/year and for: (a) M-TES price = 2000 EUR; (b) M-TES price = 6000 EUR; (c) M-TES price = 10,000 EUR.

Figure 13.
The Yearly Economical Profitable as a function of Levelized Cost of Heating from non-geothermal source (LCOH.OS) and distance between Geothermal Base Station and House, for Total Heat Demand (THD) = 15,000 kWh/year and for: (a) M-TES price = 2000 EUR; (b) M-TES price = 6000 EUR; (c) M-TES price = 10,000 EUR.

Figure 14.
The Yearly Economical Profitable as a function of Levelized Cost of Heating from non-geothermal source (LCOH.OS) and distance between Geothermal Base Station and House, for Total Heat Demand (THD) = 20,000 kWh/year and for: (a) M-TES price = 2000 EUR; (b) M-TES price = 6000 EUR; (c) M-TES price = 10,000 EUR.

Figure 15.
The Yearly Economical Profitable as a function of Levelized Cost of Heating from non-geothermal source (LCOH.OS) and distance between Geothermal Base Station and House, for Total Heat Demand (THD) = 25,000 kWh/year and for: (a) M-TES price = 2000 EUR; (b) M-TES price = 6000 EUR; (c) M-TES price = 10,000 EUR.

Figure 16.
The Yearly Economical Profitable as a function of M-TES price and distance between Geothermal Base Station and Building, for LCOH.OS = 0.1 EUR/kWh and for: (a) Total Heat Demand (THD) = 5000 kWh/year; (b) THD = 25,000 kWh/year.
Figure 16.
The Yearly Economical Profitable as a function of M-TES price and distance between Geothermal Base Station and Building, for LCOH.OS = 0.1 EUR/kWh and for: (a) Total Heat Demand (THD) = 5000 kWh/year; (b) THD = 25,000 kWh/year.

Figure 17.
Net Present Value (NPV) as a function of LCOH.OS for different discount rate value, for distance = 0.5 km.
Figure 17.
Net Present Value (NPV) as a function of LCOH.OS for different discount rate value, for distance = 0.5 km.


Table 1.
NPV sensitivity analysis.
| Parameter | Base Value | Unit | Change of Parameter Base Value | |
|---|---|---|---|---|
| −20% | 20% | |||
| NPV Change | ||||
| LCOH.OS | 0.0775 | EUR/kWh | −114.7% | 60.3% |
| M.TES.P | 6000 | EUR | 45.8% | −45.7% |
| THD | 15000 | kWh/year | −32.4% | 32.4% |
| LCOH.G | 0.0322 | EUR/kWh | 30.9% | −30.9% |
| distance* | 5 | km | 13.6% | −13.6% |
| distance | 0.5 | km | 3.5% | −3.5% |
| r | 4 | % | 8.9% | −7.8% |
| Q(H)/Q(DHW) | 1.5 | - | 0.0% | 0.0% |
distance*—only this example is calculated for base value 5 km, others for 0.5 km.
Table 2.
Carbon dioxide emission of M-TES transport as a function of distance between building and M-TES load base, and THD. Source: own study.
Table 2.
Carbon dioxide emission of M-TES transport as a function of distance between building and M-TES load base, and THD. Source: own study.
| Distance, km | Carbon Dioxide Emission of M-TES Transport, kg/year for THD: | ||
|---|---|---|---|
| 5000 | 15,000 | 25,000 | |
| 0.5 | 38 | 87 | 137 |
| 1 | 76 | 174 | 275 |
| 2 | 152 | 347 | 550 |
| 3 | 227 | 521 | 824 |
| 4 | 303 | 695 | 1099 |
| 5 | 379 | 869 | 1374 |
| 6 | 455 | 1042 | 1649 |
| 7 | 531 | 1216 | 1924 |
| 8 | 606 | 1390 | 2198 |
| 9 | 682 | 1564 | 2473 |
| 10 | 758 | 1737 | 2748 |
Table 3.
Carbon dioxide emission reduction as a function of distance, THD and replacement heat source. Source: own study.
Table 3.
Carbon dioxide emission reduction as a function of distance, THD and replacement heat source. Source: own study.
| Distance, km | Reduction of Carbon Dioxide Emission, kg/year | |||||
|---|---|---|---|---|---|---|
| for Replacement of Coal Source, for THD: | for Replacement of Natural Gas Source, for THD: | |||||
| 5000 | 15,000 | 25,000 | 5000 | 15,000 | 25,000 | |
| 0.5 | 1774 | 5394 | 9009 | 928 | 2854 | 4777 |
| 1 | 1736 | 5307 | 8872 | 890 | 2767 | 4639 |
| 2 | 1660 | 5133 | 8597 | 814 | 2594 | 4365 |
| 3 | 1585 | 4959 | 8322 | 738 | 2420 | 4090 |
| 4 | 1509 | 4785 | 8047 | 662 | 2246 | 3815 |
| 5 | 1433 | 4612 | 7772 | 587 | 2072 | 3540 |
| 6 | 1357 | 4438 | 7498 | 511 | 1899 | 3265 |
| 7 | 1281 | 4264 | 7223 | 435 | 1725 | 2991 |
| 8 | 1206 | 4090 | 6948 | 359 | 1551 | 2716 |
| 9 | 1130 | 3917 | 6673 | 283 | 1377 | 2441 |
| 10 | 1054 | 3743 | 6398 | 208 | 1204 | 2166 |
© 2020 by the authors. Licensee MDPI, Basel, Switzerland. This article is an open access article distributed under the terms and conditions of the Creative Commons Attribution (CC BY) license (http://creativecommons.org/licenses/by/4.0/).
Share and Cite
MDPI and ACS Style
Matuszewska, D.; Kuta, M.; Olczak, P. Techno-Economic Assessment of Mobilized Thermal Energy Storage System Using Geothermal Source in Polish Conditions. Energies 2020, 13, 3404. https://0-doi-org.brum.beds.ac.uk/10.3390/en13133404
AMA Style
Matuszewska D, Kuta M, Olczak P. Techno-Economic Assessment of Mobilized Thermal Energy Storage System Using Geothermal Source in Polish Conditions. Energies. 2020; 13(13):3404. https://0-doi-org.brum.beds.ac.uk/10.3390/en13133404
Chicago/Turabian StyleMatuszewska, Dominika, Marta Kuta, and Piotr Olczak. 2020. "Techno-Economic Assessment of Mobilized Thermal Energy Storage System Using Geothermal Source in Polish Conditions" Energies 13, no. 13: 3404. https://0-doi-org.brum.beds.ac.uk/10.3390/en13133404
Note that from the first issue of 2016, this journal uses article numbers instead of page numbers. See further details here.