Method for Determining the Probability of a Lack of Water Supply to Consumers


Department of Water Supply and Sewerage Systems, Faculty of Civil, Environmental Engineering and Architecture, Rzeszow University of Technology, Al. Powstancow Warszawy 6, 35-959 Rzeszow, Poland
Energies 2020, 13(20), 5361; https://0-doi-org.brum.beds.ac.uk/10.3390/en13205361
Submission received: 17 September 2020
/
Revised: 6 October 2020
/
Accepted: 12 October 2020
/
Published: 14 October 2020
(This article belongs to the Special Issue A New Water-Energy Nexus: The Transition to Sustainable Energy)
Abstract
:The water distribution subsystem is the most failing subsystem included in the water supply system. One of the main consequences of water supply failures is the lack of water supply to consumers, which is always very onerous. The paper presents a method of determining the conditional probability that a break in the supply of water to consumers of a certain duration will be caused by a specific type of failure. The result of the work was to identify water supply network failures that result in the longest water supply suspension time. The method was presented on a real water supply system. In order to reduce the incidence of long-term interruptions in water supply, water supply companies should mainly continue replacing gray cast iron pipes with thermoplastic materials. Actions taken to increase the safety of drinking water supply meet the current standards for the safety of drinking water, developed by the World Health Organization and the European Union.
1. Introduction
1.1. The Current Standards for the Safety of Drinking Water
The water supply system (WSS) is a key system for the functioning of society and the state [1,2,3]. Its improper functioning may pose a threat to human health or life [4]. Therefore, it must be characterized by a high level of reliability and security. The need to constantly improve the level of safety of water consumers was recognized by the World Health Organization (WHO) as early as in the 1950s. The fourth edition of the Guidelines for Drinking Water Quality, from 2011, is currently in force [5]. One of the achievements of the Guidelines [5] is the introduction of the concept and assumptions for Water Safety Plans (WSPs). The main goal of WSPs is to ensure safe access to drinking water [2,6]. Currently, in many European countries, there is no obligation to implement the WSP (including Central and Eastern European countries), which is why most water supply companies from those countries did not implement WSPs and did not introduce a risk analysis obligation in their WSS, probably in anticipation of appropriate legal conditions and underestimating the opportunities offered by the implementation of WSPs [7]. Although the implementation of even a very good WSP does not fully protect against the occurrence of a crisis (there can always be an event that no one could have foreseen), WSPs are now considered to be the best way to provide consumers with access to safe water. A WSP approach based on hazard prevention significantly reduces the probability of an undesirable event and allows the preparation of a water supply company for an appropriate response [8,9]. This is reflected in the so-called Drinking Water Directive [10], one of whose main objectives is to introduce a risk-based approach to water monitoring and update certain provisions of Directive 98/83/EC [11]. In the next few years, WSPs will be compulsory for European Union countries.
1.2. The Concept of Reliability and Safety in the Context of Water Supply Management
Many undesirable events that may occur at any stage of water production and distribution pose a threat to the safety of water consumers. The impact of these events on consumer health varies, from harmless deterioration of organoleptic parameters to loss of health, which should be reflected in the risk analysis [12,13,14]. It should take into account all potential undesirable events, from the intake to the consumer (catchment, intake, treatment, storage, and distribution of water), which is justified and even necessary, especially in terms of increasing the health protection of water consumers. The frequency and consequences of undesirable events indicate the technical condition of the WSS. It should be remembered that the actions taken to improve the safety of water consumers are often associated with the need to incur investment costs (e.g., modernization of the water supply network and expansion of the water quality monitoring system) and an increase in operating costs related to, among others, increased workload. Therefore, individual actions should be undertaken in accordance with the ALARP principle (As Low As Reasonably Practicable) and should be preceded by a detailed analysis [15].
The following definitions are related to this topic: reliability and safety. Reliability is the ability of a system to perform its required functions under stated conditions for a specified period of time. With regard to WSS, it is the probability that water will be delivered to consumers in the necessary quantity, quality, pressure, and at an acceptable price at any time. Reliability analysis should include all events that cause problems that disturb the proper functioning of the system under the given operating conditions. Safety is the system’s ability to protect its overriding functional properties against internal and external threats. In relation to WSS, it is the protection of consumers against the consumption of water of inadequate quality or lack of water supply at present and in the future as a result of an escalation of undesirable events (domino effect). A measure of the loss of safety of drinking water consumers is the risk associated with the possibility of drinking water of inadequate quality or lack of water. The safety analysis should concern only events posing a threat to the safety of human life. The World Health Organization recommends, among others, using a two-parameter risk matrix that presents risk as the product of the probability of occurrence of undesirable events and losses resulting from their occurrence. This definition is a starting point and can be extended with additional parameters, primarily taking into account the degree of protection of water consumers against the consequences of undesirable events [16,17]. Fundamentals of crisis management and information about risk management and risk evaluation are included in ref. [18]. It should be noted that individual subsystems included in the WSS are very diverse (e.g., water intake and water supply network); therefore, the used methods should take into account their specificity. The water supply system is a part of the critical infrastructure [19]. It is a key system for the functioning of society and the state. It must therefore be characterized by the required level of safety and reliability of the system, especially in aspects such as physical protection of critical infrastructure, monitoring, the prevention of security threats, having developed solutions in the event of sabotage, securing the entrance area, protection of networked systems and cooperation between the entities responsible for their protection.
1.3. The Main Causes and Consequences of Water Supply Failures
The described method applies to one of the key subsystems in WSS, i.e., water supply network. Due to the extensiveness and complexity, the water supply network is the most emergency element of the entire WSS. Improper technical condition of the pipes and adverse hydraulic conditions may cause the formation of a biofilm, which is a sanitary threat to water consumers, intensifies microbiological corrosion, and creates operational problems [14,20]. Water supply network failures often result in a reduced or suspended water supply to consumers. The main causes of water supply network failure include [21,22]:
- Errors resulting from human activities—design and implementation errors, lack of adequate knowledge and experience of employees, lack of due diligence in performing works, improper work management, and mechanical damage to pipes.
- Material causes—improper selection or assembly of material, material defects, defective sealing of socket joints, aging processes, and corrosion.
- Environmental causes—unfavorable ground or meteorological conditions and landslides.
- Causes resulting from the functioning of the water supply network—too high pressure in the water supply network, variable hydraulic conditions in the network, hydraulic impact, lack of an appropriate monitoring system, and random events.
Failure of the main pipe of the water supply network may deprive water to a significant part of the population. Water deficits are very burdensome for residents. They generate significant costs for both water consumers, the need to purchase bottled water, and for water supply companies, the cost of repairing damaged objects, the value of water losses, the cost of flushing the network, or the need to pay compensation to water consumers [22]. The proper functioning of the repair teams is essential for the quick removal of failures. To optimize the operations of the repair teams, you can use, for example, the queue model [23]. For this reason, water companies should consider the loss of water supply from a crisis perspective based on guidelines in this area. Guideline values for minimum water provision standards in case of a disaster were presented in ref. [24]. The very extensive analysis presented in the paper [25] has shown that scientists, risk practitioners, and policymakers are increasingly concerned about the resilience of critical infrastructure in the context of natural hazards and disasters. Techniques for developing contingency plans for a variety of emergencies from natural disasters to human-caused crises were presented in ref. [26].
1.4. The Methods for Assessing the Water Supply Network Reliability
In order to assess the reliability of the water supply network, the occurring failures should be associated with parameters describing the functioning of the system, such as the type of pipe material, pressure, or corrosion [27]. It is also important to link water supply failures to their consequences concerning leakages, etc. [28]. Research carried out so far has taken into account the impact of pressure on the failure frequency of pipes [29], type, diameter, and material of pipes [30,31,32,33], the impact of climatic conditions [34]. Taking into account the appropriate number of variables allows you to properly determine the relationship between the causes and effects of failure. The logical tree methods were also used to analyze reliability [35]. The reliability of a WSS is also based on the global resilience analysis of water distribution systems [36]. The article focused on the probability of the time of lack of water supply to consumers in relation to the type of water supply failure. The result of the work identified water supply network failures that result in the longest water supply suspension time. The method was presented on a real water supply system. The study did not quantify the extent of failures, and among others, the amount of population and institutions affected by a certain failure. Detailed determination of the extent of failure without the use of a geographic information system (GIS) is very difficult. The effects of water failures usually concern a single street. The method is based on the probability of a lack of water supply to consumers that can be used in a company’s risk management. The necessary conditions for increasing the reliability of the water supply network requires a detailed cause and effect analysis because the process of water supply network failure formation is often the result of long-term cause and effect relationships. The failure rate of water pipes is influenced by a number of factors, including ground corrosivity, traffic load, or the pressure level in the water supply system. Both the human factor and the forces of nature are important. The consequences of water pipeline failures also vary, ranging from lack of water supply to consumers to financial losses for water supply companies. Bayes’ theorem can be used in situations where the occurrence of an event strictly depends on another event. It is necessary to define the variables, define connections between the variables, such as determination of the conditional and “a priori” probability and, in result, determination of “a posteriori” probability. Such an analysis is essential to improve the level of water supply safety by identifying key factors for long interruptions in the water supply. Bayesian inference is one of the main methods of knowledge discovery. Bayesian methods have been developed over the years by various authors, including in ref. [37]. The Bayes’ theorem can be used to analyze the reliability of a water supply system by determining the conditional probability of a specific undesirable event. The issue of using Bayesian methods in the aspect of analyzing the functioning of water supply systems appears in world literature in very different ways. Z. Poulakis and others developed a method of detecting leaks in a water supply network [38]. A. Pagano and others developed a method for assessing the effects of failures in a water supply network [39]. W. Dawsey and others presented a methodology for estimating the parameters of the state of the water distribution subsystem using the dynamic Bayes network [40]. Research has also been undertaken to develop a Bayesian network that can be used to analyze the reliability of the water supply network [41,42].
The main purpose of this research was to develop a method for determining the probability of lack of water supply to consumers in relation to the type of water supply failure. The novelty is developing a methodology for the cause and effect analysis and assessment of the reliability of the water supply network in terms of ensuring the required level of safety of the water supply to consumers. The proposed method makes it possible to determine the cause and effect relationship between a given type of failure and a key parameter from the consumers’ point of view, i.e., the time of lack of water supply. The used method allows determining which type of failure has the greatest consequences for water consumers. The method can be applied when it is necessary for long-term planning to replace pipes. This issue has been presented and discussed in many scientific articles [43,44]. Factors grouped into four main categories may affect the risk of water pipe failure, i.e., environmental, physical, operational, and post-failure. Some authors model and incorporate the hydraulic simulation method for leakage in their studies [45]. In order to define the reliability index of pipes made of steel, numerical methods can be used [46]. Such approaches require a large database and a lot of work and time, which are not always available for small water companies with fewer resources. In practice, the main reasons for the replacement of water pipes are the age of the pipes, leaks, insufficient water pressure, and poor water quality. There are a number of tools for searching for leaks [47]. To consider the effect of water losses when solving the hydraulic problem in water pressurized networks, some commercial software has been developed [48]. One of the solutions to allow for minimizing water losses is pressure reduction in a water supply network [49]. Stringent monitoring of the water distribution network reduces water losses considerably [50]. Water losses can also be reduced through a management decision model [51]. The multi-criteria analysis dominates in this approach; for example, the paper [52] presents a strategic planning tool for water loss management. It is believed that the development of the water balance is vital for the reduction of water leaks [53]. It must be said that many scientific developments have been carried out, seeking to solve the water losses problems. This method allows making decisions about the modernization of water pipes based on the cause-and-effect failure analysis, which is a new approach to water loss problems. This approach leads to make the right decisions related to the operation of water supply networks, which in turn will cause an increase in the satisfaction level among customers. All replacement decisions should be made in order to reduce the lack of water supply, replacement of old pipes, solutions to the problem of secondary contamination, and improving area delivery. Modern management of the water supply network is based on an analysis of the condition of water supply infrastructure and the replacement of water distribution pipes in a specific area of the city. The developed method complements and extends the current approach to reliability and risk analysis in water supply systems. It allows one to present the relationship between the cause and effect of a water network failure and select pipes need to be replaced depending on the material from which they are made without the need for detailed knowledge of, inter alia, the age, the number of breaks, and the level of corrosion. This work focuses on the quantitative aspect of the supply of drinking water, omitting its quality, in relation to which specific requirements are regulated by law.
2. Materials and Methods
2.1. Characteristics of the Research Object
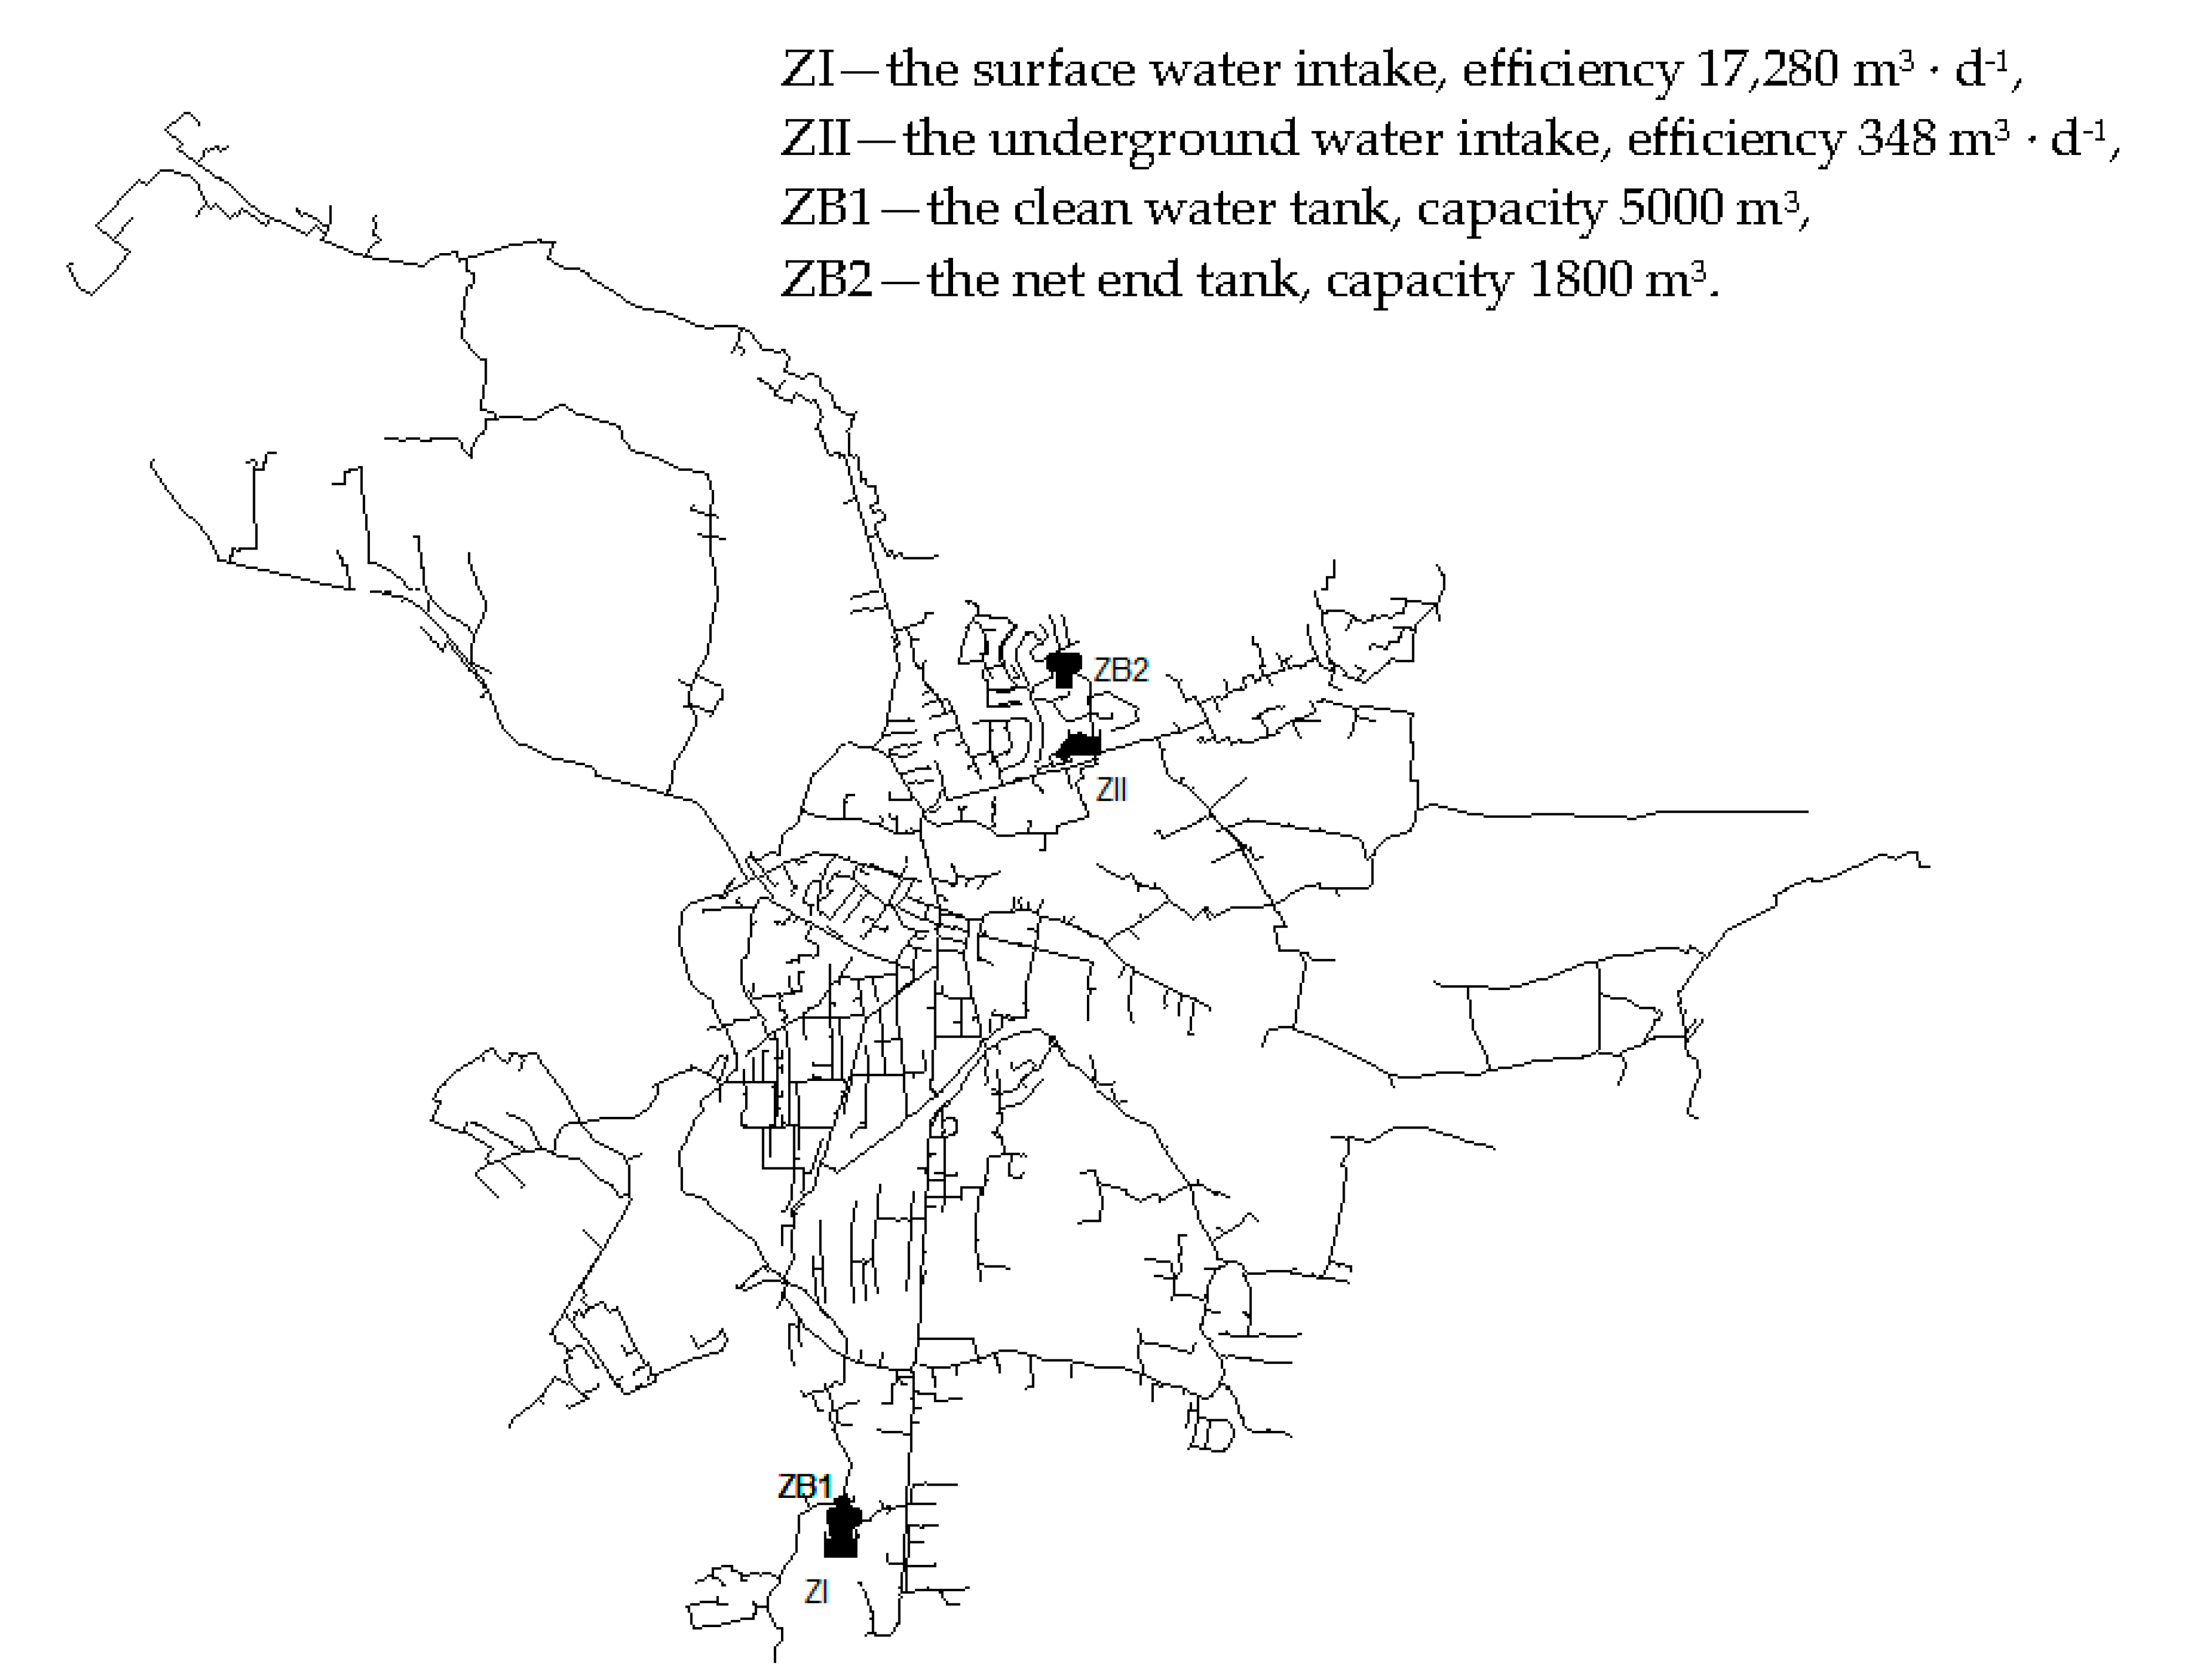
The analyzed WSS was located in south-eastern Poland. It is supplied with water by means of a shore-conduit intake with a capacity of 17,280 m3/d and an underground intake with a capacity of 348 m3/d. The average daily demand for water in the city was about 5500 m3/d. The taken water was treated based on the Actiflo system and a set of nine open sand and gravel fast filters. Treated water after adding chlorine gas was moved to the initial tanks with a capacity of 5000 m3 [54]. In case of high turbidity in raw water or the occurrence of any emergency situation, these tanks can provide water supply for about 22 h (when completely filled). The initial tanks can also provide the necessary water contact time with chlorine. Water taken from the clean water tanks by means of a set of pumps was then pumped into the network. The pumps were controlled by a constant discharge pressure algorithm using a frequency converter. During normal operation, one pump runs in the exchange system every 24 h; the rest are in reserve. The daily unevenness of the water distribution was leveled by the final network tank with a capacity of 1800 m3.
The analyzed water supply system supplied water to about 34,500 inhabitants, which is about 94% of the total number of inhabitants of the city. The system of the analyzed water supply network was mixed and annular-branching. The length of the distribution pipes in 2015 was 152.1 km, while the length of household connections was 60.0 km. In the years 2010–2015, the failure rate index ranged from 0.22 (failure·km−1·year−1) in 2014 to 0.36 (failure·km−1·year−1) in 2015 for distribution pipes and from 0.23 (failure·km−1·year−1) in 2014 to 0.50 (failure·km−1·year−1) in 2012 for household connections. According to commonly used criteria, the technical condition of the water supply network was assessed as good. The scheme of the water supply network has been shown in Figure 1 [55].
The water supply network of the analyzed city was built from approximately 84% plastics, i.e., polyethylene (PE) and polyvinyl chloride (PVC). The gray cast iron pipes are being gradually replaced. They are replaced with steel pipes and pipes made of PVC and PE. Changes in the material structure of the city’s water coincide with the global trend of using thermoplastics and ductile iron as a material for constructing water-supply networks, as they are characterized by a significantly lower failure rate in relation to gray iron. This is reflected in the age of the water pipes. There was a decrease in the length of pipes with a service life of over 25 years and a significant increase in the length of pipes up to 10 years old (increase by 14% in 2011, increase by 16% in 2013), related to the development of the network [55]. The water supply network was not divided into District Metered Areas, which would bring considerable benefits, particularly with regard to leakage detection through water balances, control and optimization of pressure, implementation of monitoring, warning, and emergency acting systems against water contamination [56,57].
The analysis of the probability of suspending water supply to consumers was based on the failure book provided by the water supply company. The present work focuses on the time of lack of water supply caused by water supply failures. The background leakages are not considered. The failure book contained, among others, such information as date and time of the notification, location of the failure, date and time of beginning the removal of failure and completion of work, the extent of the failure, causes and effects of the failure, diameter and material of pipes, as well as materials used to remove the failure. Reliable keeping of such a failure book has enabled us to gain extensive knowledge about the failures of the water supply network.
2.2. The Concept of Using Bayesian Inference for the Needs of Water Supply Safety Analysis
Cause and effect relationships between failures and their results are difficult to quantify. From a diagnostic point of view, it is important to determine the conditional probability of the failure effect (e.g., lack of water supply), if it is known that the failure has occurred. If on the basis of currently available data, it is possible to determine the probability of failure, then it should be possible to determine the conditional probability of failure effects using Bayes’s theorem. The Bayesian theory gives the opportunity to update and correct strong beliefs based on scientific evidence, in the light of new evidence [37].
where:
- P(A)—“a priori” probability of the occurrence of event A,
- P(B)—“a priori” probability of the occurrence of event B,
- P(A|B)—the conditional probability of the occurrence of event A under the condition of the occurrence of event B (it is also called “a posteriori” probability because it comes from or depends on the value of event B),
- P(B|A)—the conditional probability of the occurrence of event B, provided the occurrence of event A.
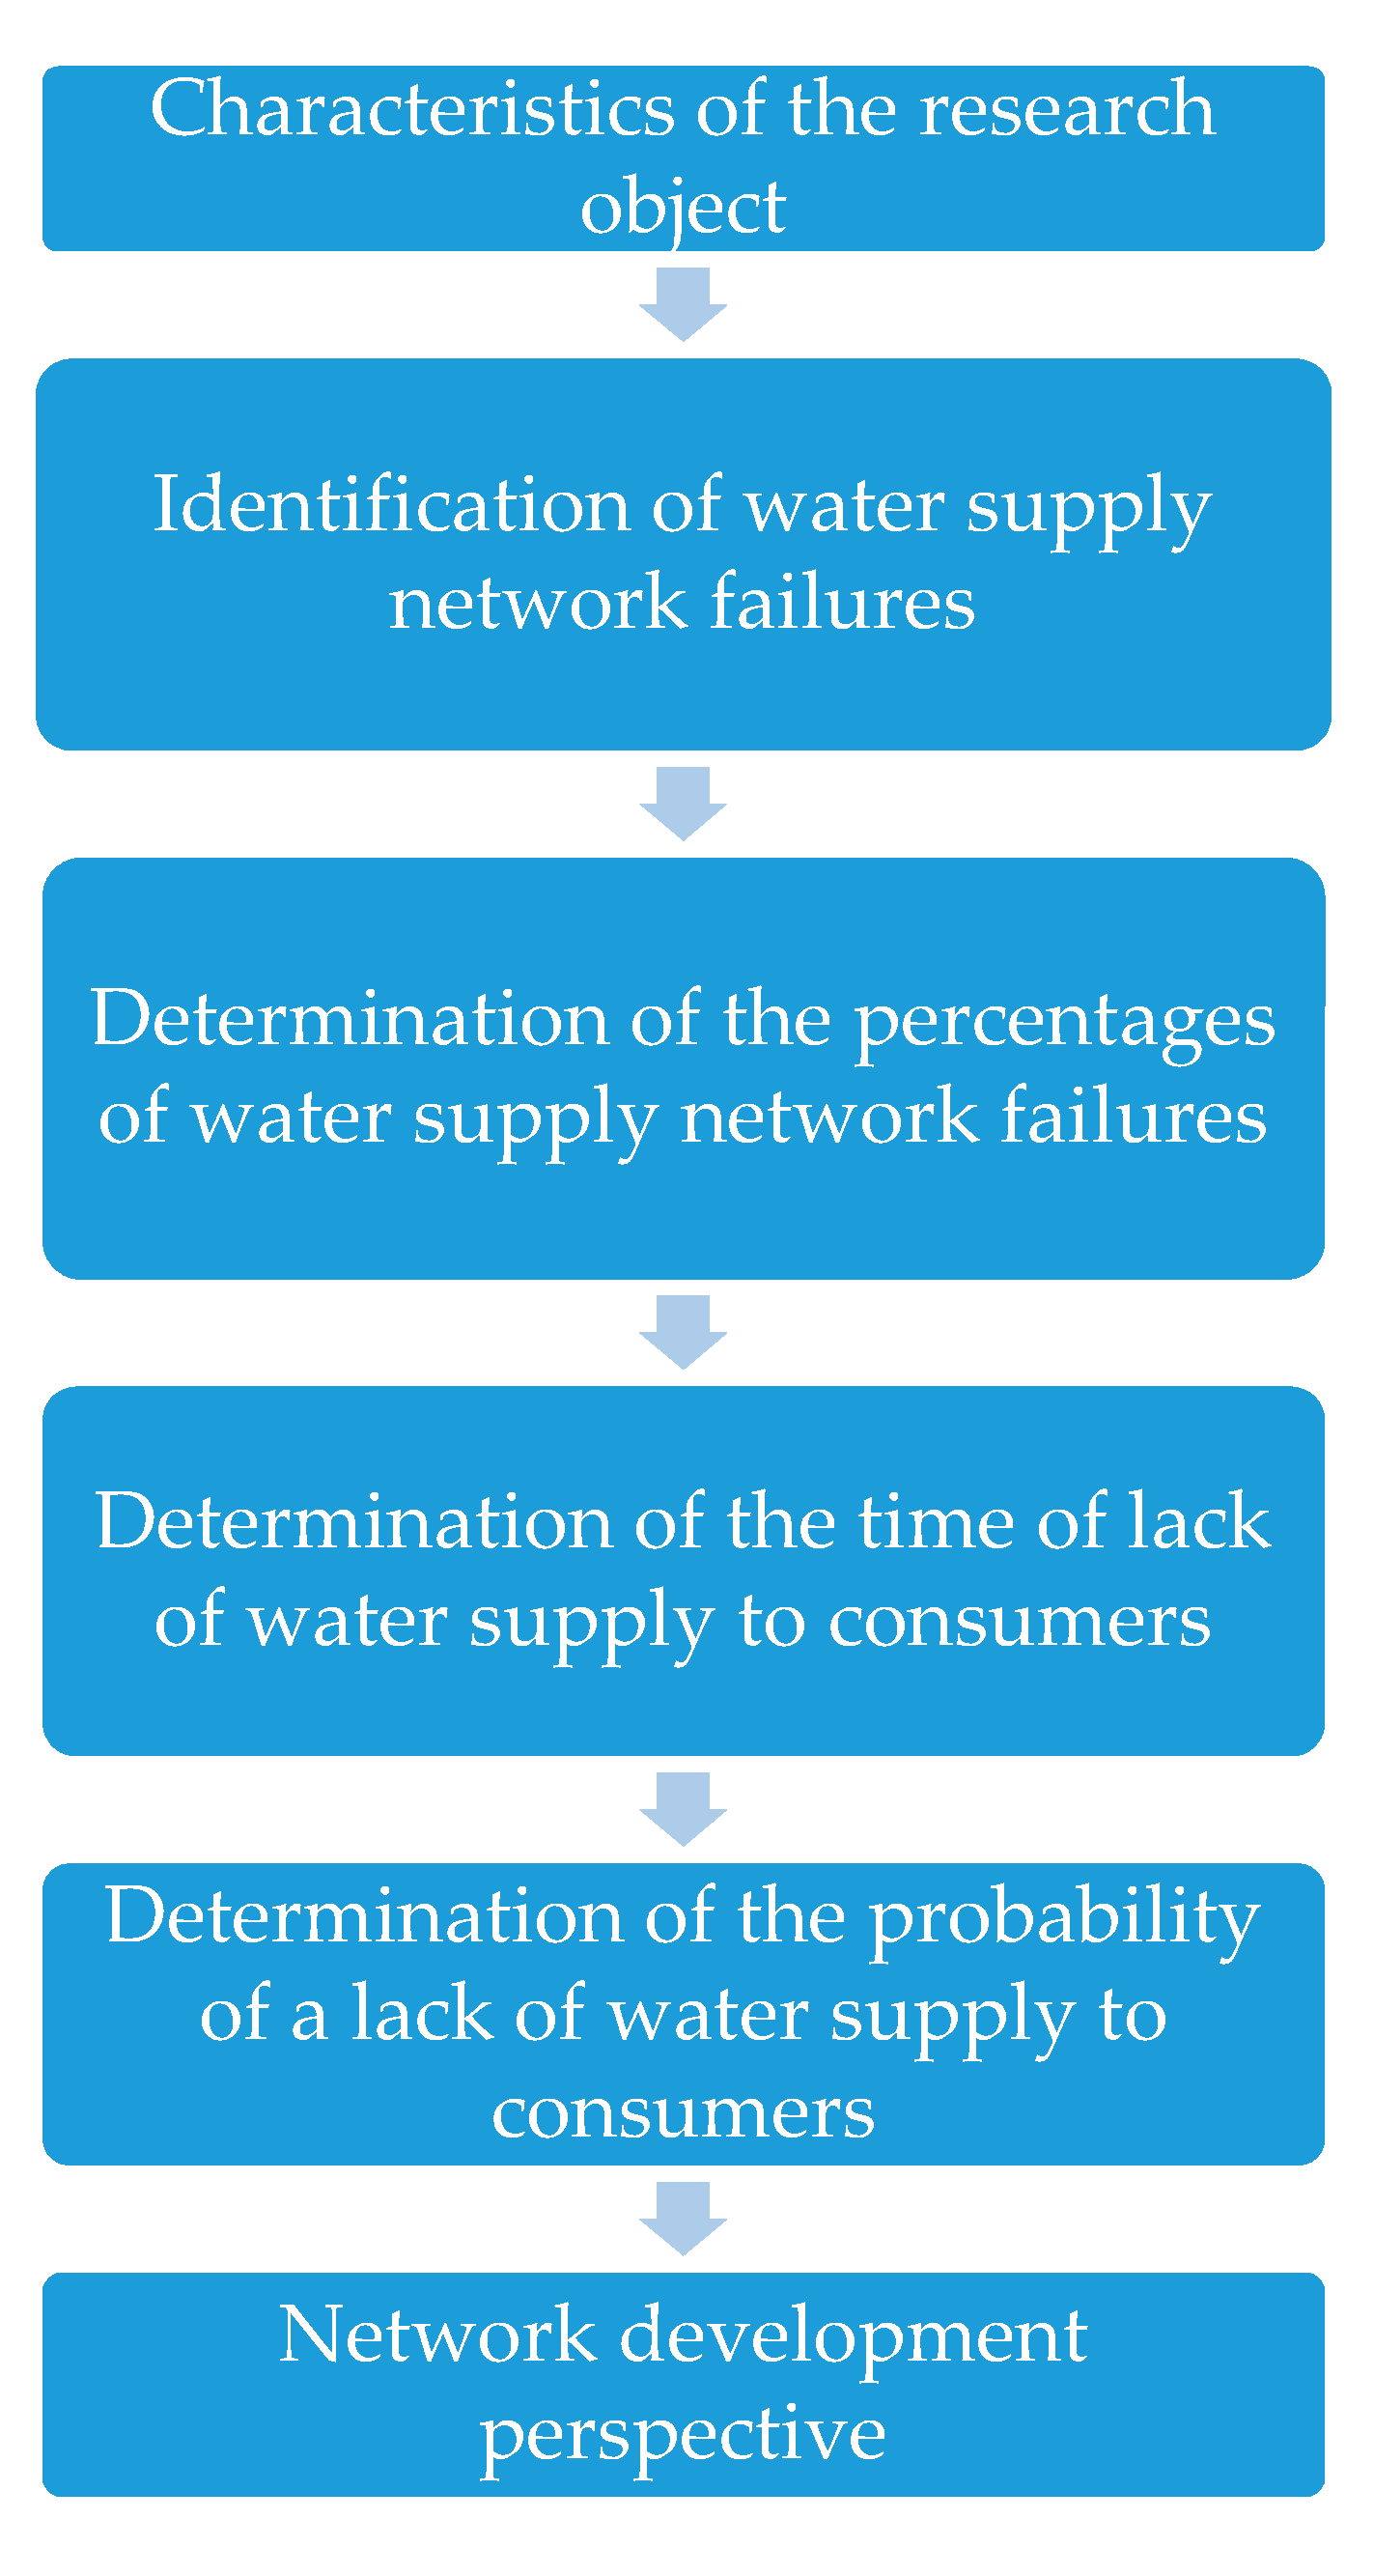
The method is based on a cause and effect analysis of undesirable events in the water supply network based on the Bayes theorem. A generic assessment framework is schematically described in Figure 2. The method consists of five main steps:
- -
- Identification of water supply network failures in 2010–2015; nine main types of failures were identified: leakage at the pipe connections, damage to the water fittings (hydrant, valve, water meter, pressure reducer), corrosion of pipes, crack of pipes, leak on the band, crack of T-fitting, mechanical damage to pipes, mechanical damage to the water fittings, and thawing pipes.
- -
- Determination of the percentages of water supply network failures (the quotient obtained from dividing the number of specific failures over the total number of failures).
- -
- Determination of the time of lack of water supply to consumers for each type of failure based on the book of water supply failure reports and the assignment to one of the five-time intervals for the lack of water.
- -
- Determination of the “A priori” probability of a certain water supply interruption and the total probability that a given type of failure will occur.
- -
- Linking the time of lack of water supply to consumers (consequence) to the type of failure (cause) based on “A posteriori” probability.
“A priori” probability can be understood as the initial probability value before obtaining additional information derived from experience. “A posteriori” probability is the probability value that was obtained after using additional information obtained later from experience.
The consequences for consumers are presented based on the time of lack of water supply. The five-time intervals for the lack of water were proposed depending on the consequences [54]:
- Y1 (0 h)—no interruption of water supply; consumers do not feel any inconvenience related to the failure.
- Y2 (0 h–3 h)—there are no significant impediments water consumers functioning; it can be assumed that 3 h is a break between meals.
- Y3 (3 h–12 h)—there is a need to buy bottled water for consumption and to prepare meals or use of water vats (about 0.0075 m3·person−1·day−1).
- Y4 (12 h–24 h)—there is a need to buy bottled water to maintain personal hygiene and for household needs (among others, washing dishes) or to use the water vats (about 0.015 m3·person−1·day−1).
- Y5 (>24 h)—there is a need to buy bottled water to maintain personal hygiene and for household needs (among others, for cleaning) or to use the water vats (about 0.030 m3·person−1·day−1).
The time of lack of water supply is understood as the period of time during which the group of consumers has no access to drinking water, i.e., from the moment of failure until the repair has been completed and water supply has been resumed. The longer the water supply interruption, the greater the discomfort for water consumers. It was assumed that a break in water supply lasting more than 3 h results in the necessity to obtain it from other sources (e.g., purchase of water, water carts). Such a situation, apart from obvious inconvenience, can also be a source of danger in certain cases (e.g., in an epidemiological emergency). The developed criteria were adopted on the basis of the author’s own research and analysis of the literature, and they can be adapted to the specifics of a given water supply system.
Modern management of water supply systems is based on a monitoring system covering such aspects as the analysis of water partitions, pressure, and flow, which allows quick detection of areas where leakage probably occurred [58]. A number of benefits also comes with the use of a GIS, which allows data to be presented in a spatial reference to the Earth’s surface [59]. Even the most advanced monitoring does not guarantee the detection of all leaks; moreover, the occurrence of water supply failures is a random process. Despite this, they can be described, including causes, course, and consequences of failure. Analysis of the reliability of the water supply network based on indicators developed for water pipes allows for the assessment of their technical condition and indication of the most emergency pipes.
Analysis of the current state of knowledge allows for the thesis that traditional methods of analyzing the safety of water supply can be supplemented with Bayes’ theorem, which will allow for conducting a cause-and-effect analysis in WSS and obtaining accurate results of the analysis in conditions of uncertainty. There is no information about the technical condition of the pipes under real conditions (e.g., degree of corrosion, tightness of pipes connections). The use of Bayes’ theorem can be particularly important for analyzing the reliability of a water supply network whose failures have a very different origin. The method allows one to answer the question of what causes a lack of water supply. The novelty of the study was to identify water supply network failures that result in the longest water supply suspension time. This approach allows the identification of failures that pose the greatest threat to the safety of water supply to consumers. The surveys show that the time of lack of water supply is one of the most important parameters for water consumers [60]. Detailed knowledge on the causes of the water network failures can be used to plan replacement or renewal of pipes. The conditional probability of suspending water supply to consumers was determined, with previously determined values of the probability of failure and a priori probability of a water supply interruption. Water pipe failure can be the cumulative effect of several events, e.g., unfavorable ground conditions, corrosion, and finally, cracking of pipes. The developed method does not take this fact into account and is clearly based on the cause indicated by the repair team. This results from the fact that in water company practice, only one reason is recorded in the book of water supply failure reports.
3. Application Example
3.1. Analysis of the Causes of Water Pipes Failure
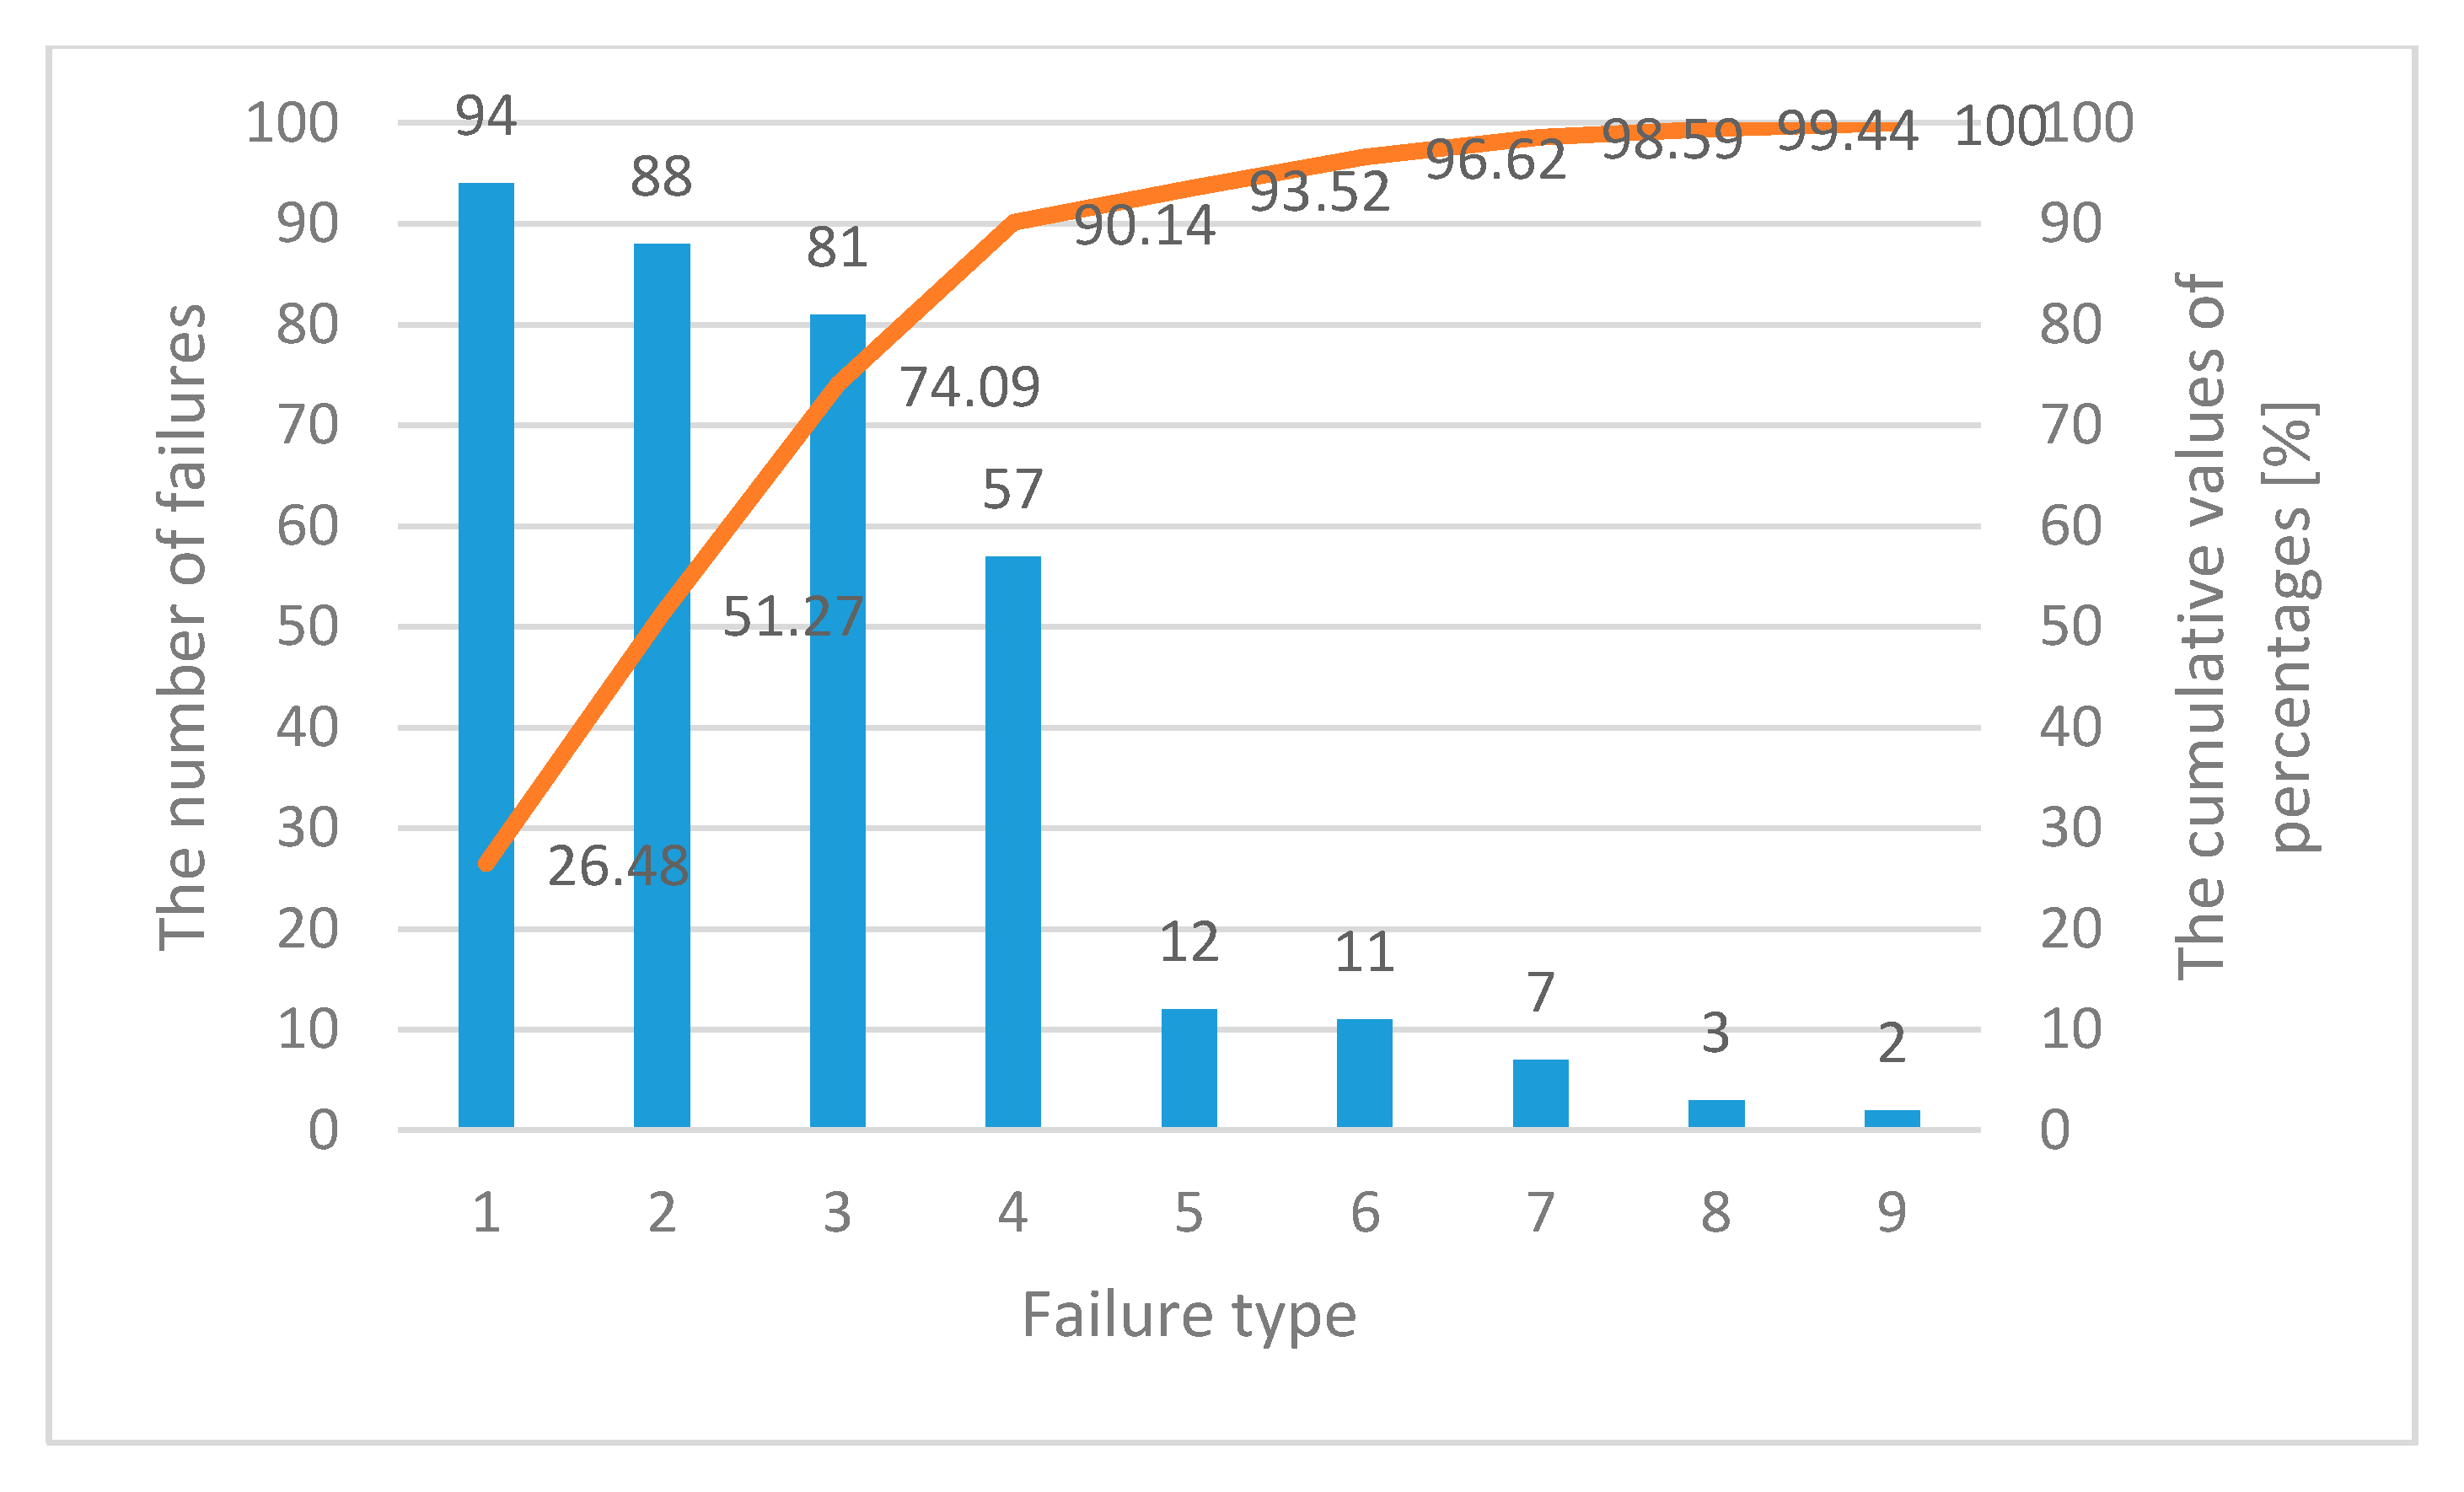
The analysis was based on operating data obtained from a water supply company. Based on the book of water supply failure reports provided by the water supply company, the main causes of a water supply network failure in the analyzed city in 2010–2015 were selected (Figure 3). This allowed the indication of the types of failures occurring most often and to indicate the pipes characterized by the highest failure frequency. Pipes that should be particularly monitored were indicated, and, if necessary, the water supply company should renew or replace them.
The most common cause of damage to water pipes was leakage at the connection of pipes, mainly flare joints of pipes made of gray cast iron. The fittings were also often damaged, which was usually associated with a faulty gate valve (e.g., damaged stem) or a hydrant. Corrosion, in most cases, concerned older house connections that were made of steel. The cracks concerned both pipes made of gray cast iron and thermoplastics. It is noteworthy that the four main causes of damage to water pipes are responsible for more than 90% of all damages, and one of the purposes of water supply network operation should be to reduce their incidence.
Acquired knowledge about specific causes of failure was associated with the time of lack of water supply to consumers. Water supply network failures often result in reduced or no water supply to consumers. The analysis focused on the key parameter from the consumer point of view, i.e., the time of lack of water supply. The water supply failure report book made available by the company contained information on the date and time of lack of water supply and resumption of water supply for each reported failure. Based on this information, the value of the time of lack of water supply was determined, which has a significant impact on the sense of safety of water consumers and significantly affects the perception of the reliability and credibility of the water supply company.
3.2. Analysis of the Probability of Lack of Water Supply to Consumers in Relation to the Type of Water Supply Failure
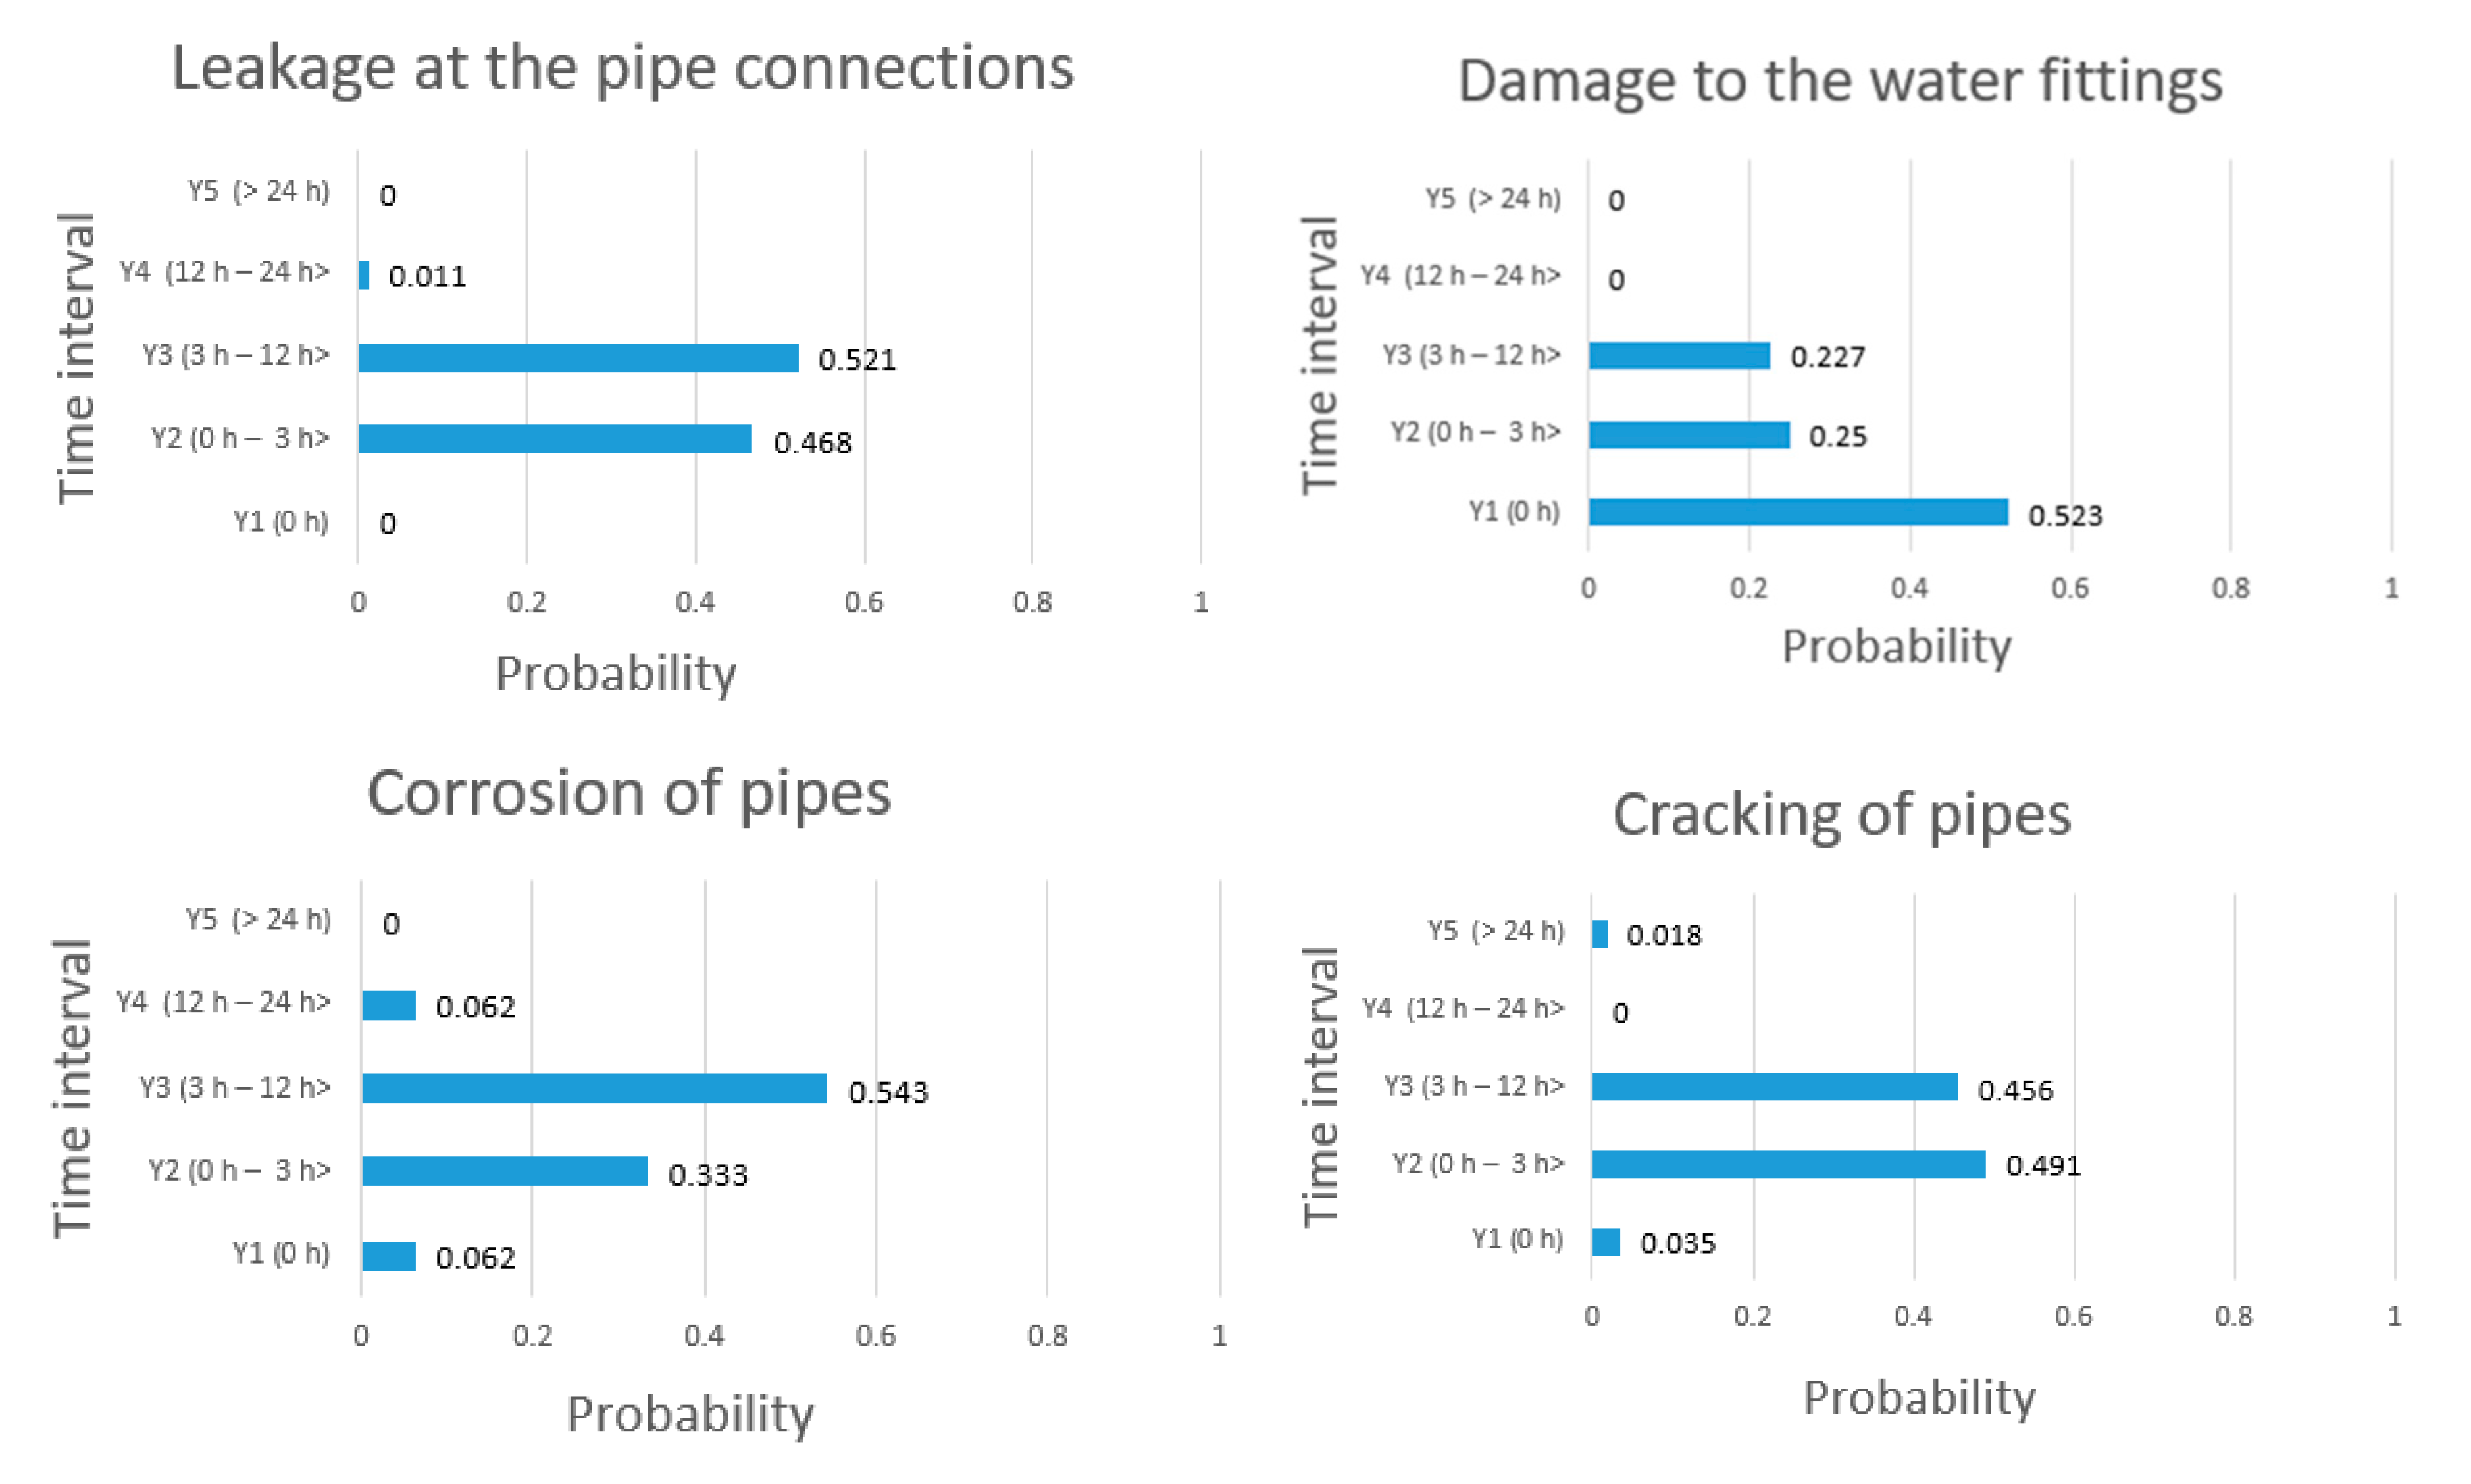
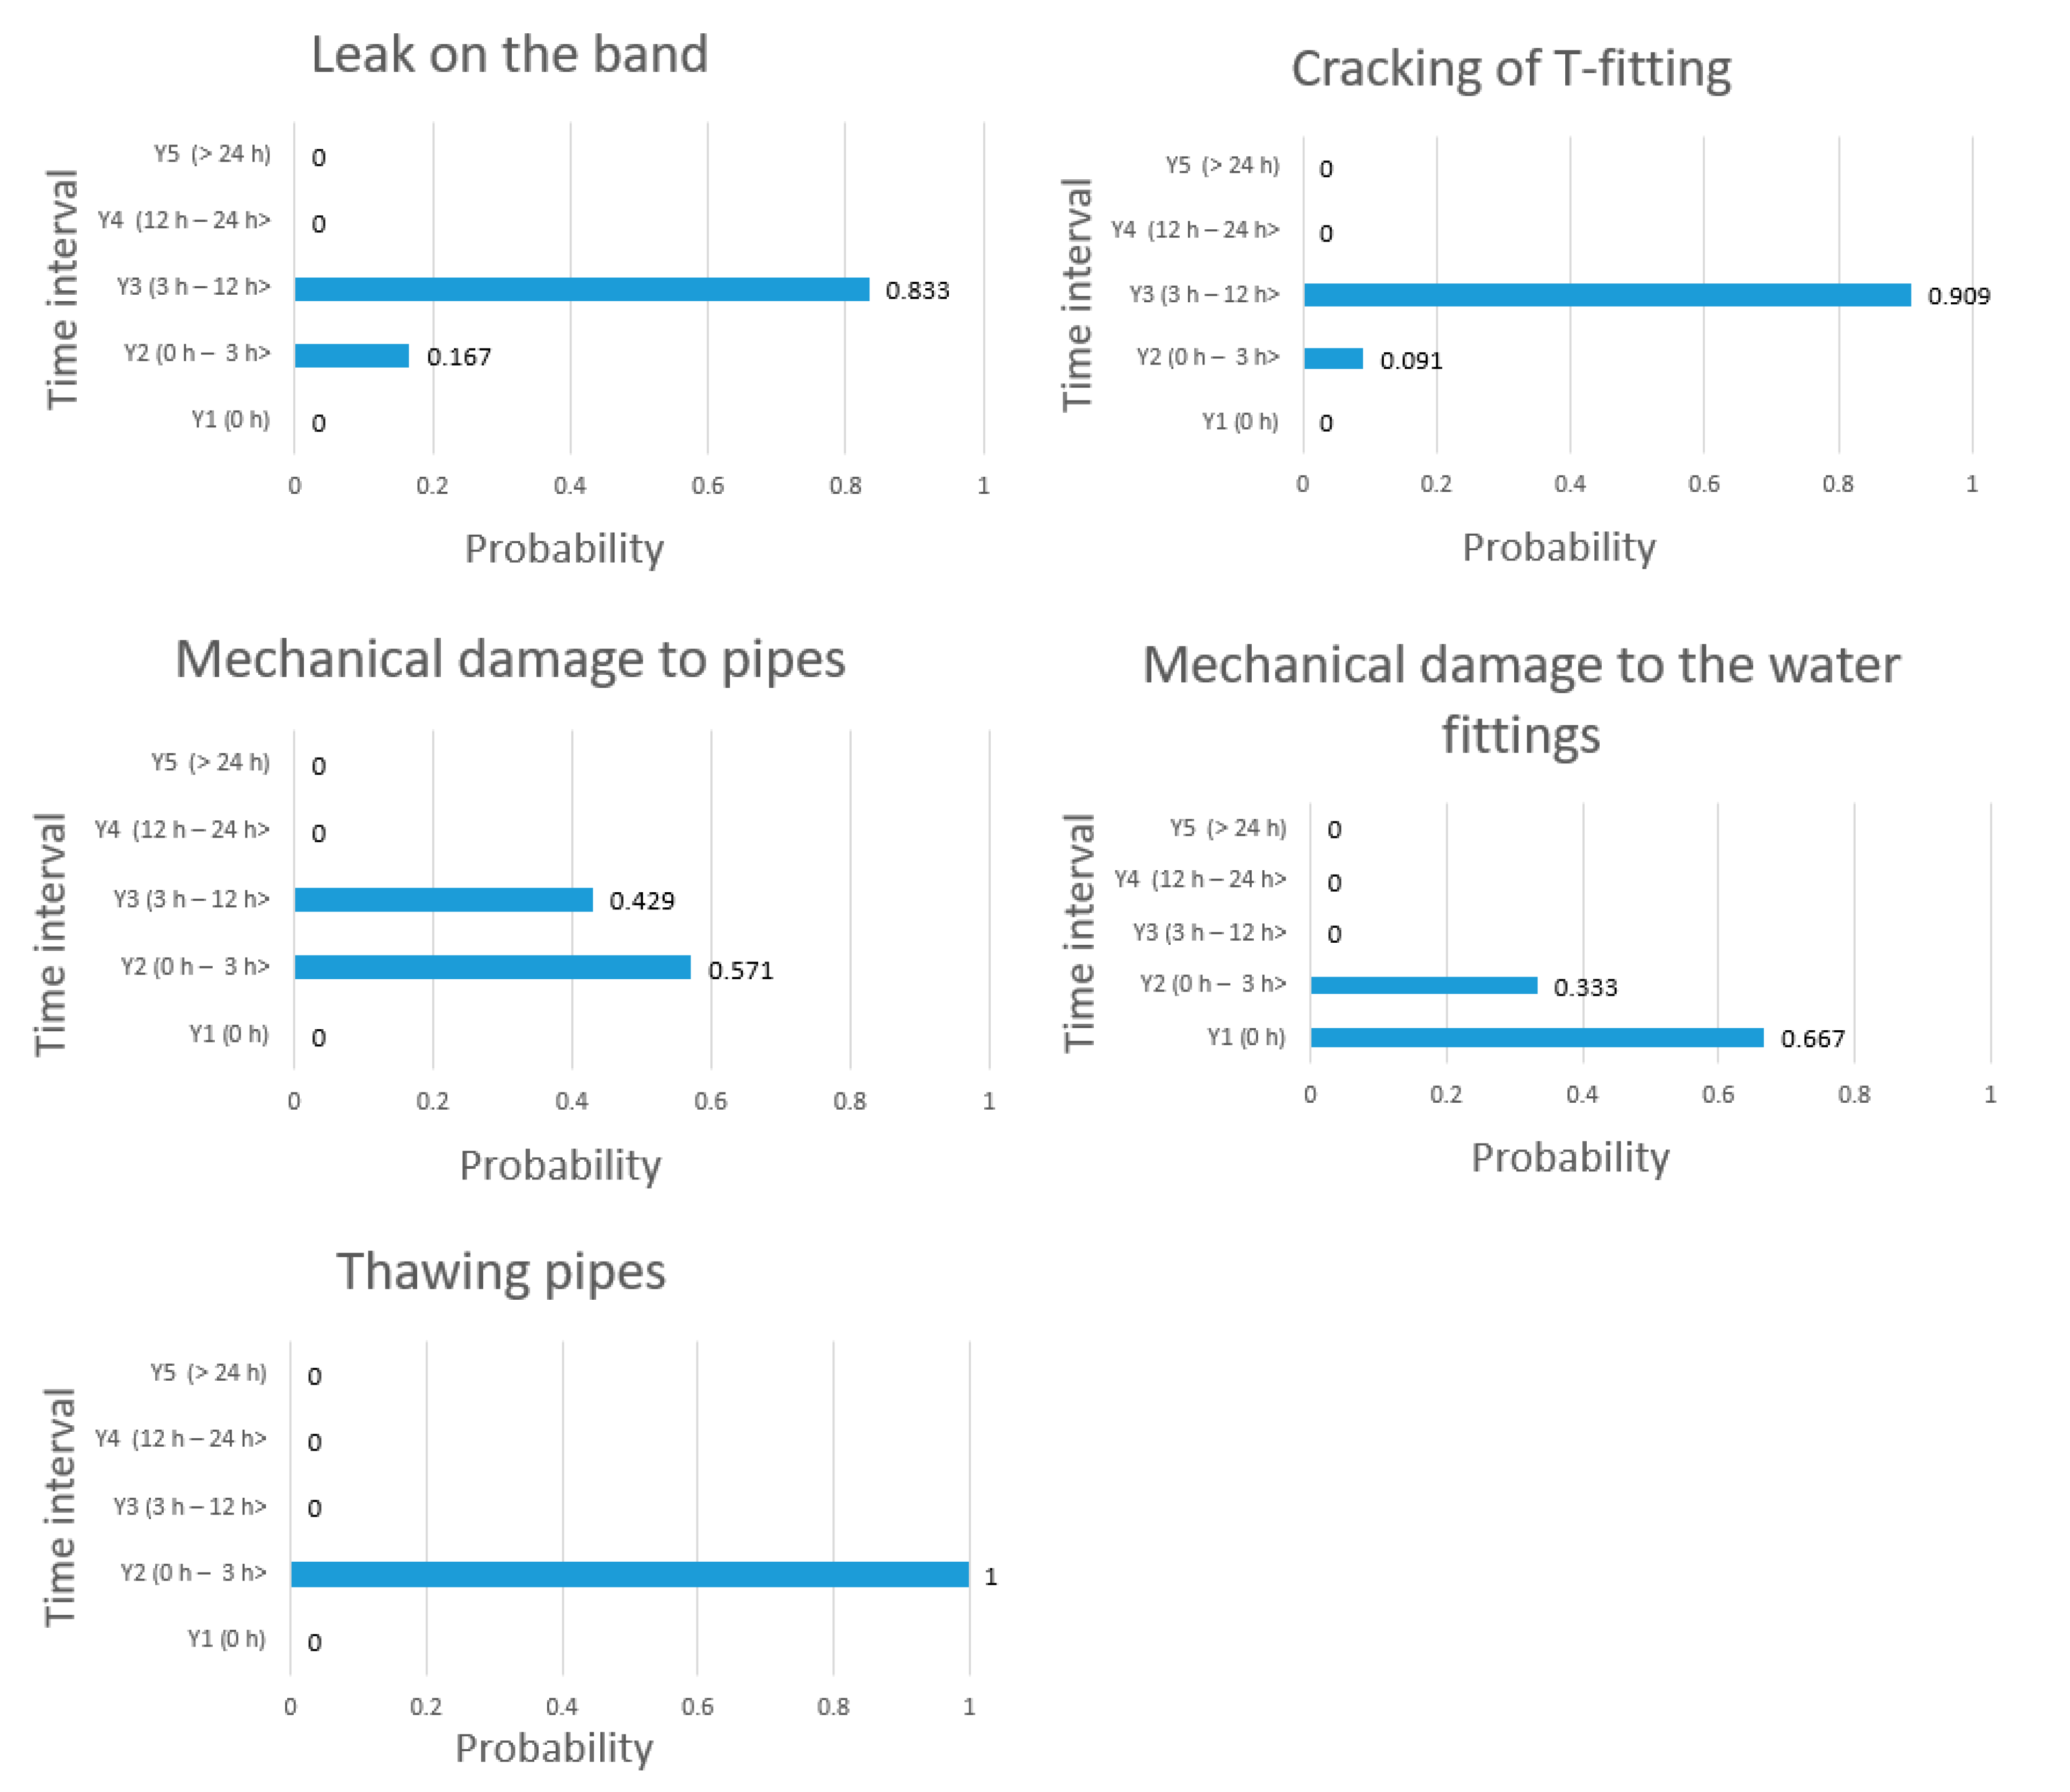
For individual causes of water supply network failure, the time of lack of water was determined, the failure has been assigned to a specific time period, and the probability of a specific break in water supply P (Yj|Xi) was determined, is shown in Figure 4. The results obtained indicate what percentage of failures caused specific interruptions in the water supply. The next stage of the analysis was to determine the total probability that a certain type of failure will occur.
The leakage at the pipe connections was the most often cause of lack of water supply to consumers for (3 h–12 h), damage of water fittings in about 52% did not stop the water supply to consumers, corrosion of water pipes was the most frequent reason of suspension of water supply to consumers for (3 h–12 h) (about 54% of cases), cracking of pipes was the most frequent reason of suspension of water supply to consumers for (0 h–3 h) (about 49% of cases), about 83% of failures caused by the leakage on the band were the reason of lack of water supply to consumers for (3 h–12 h), about 91% of failures caused by the cracking of T-fitting were the reason of lack of water supply to consumers for (3 h–12 h), mechanical damage to water pipes was most often reason of lack of water supply to consumers for (0 h–3 h) (about 57% of cases), mechanical damage to the water fittings in about 67% of cases did not stop the water supply to consumers, and thawing pipes in the analysed time was always the reason of lack of water supply to consumers for (0 h–3 h). In the event of a failure of the water supply network, water supply companies are obliged to supply the water if the time of the lack of water supply is more than 12 h. Based on the analysis, it is concluded that the probability of occurrence is low.
The total probability that a failure will occur, which will not stop the water supply to consumers:
The total probability that a failure will occur, which will stop the water supply to consumers for 0 to 3 h:
The total probability that a failure will occur, which will stop the water supply to consumers for 3 to 12 h:
The total probability that a failure will occur, which will stop the water supply to consumers for 12 to 24 h:
The total probability that a failure will occur, which will stop water supply to consumers for more than 24 h:
Based on the presented analysis, it was found that after the failure of a water pipe, it is most likely that the water supply will be suspended for 3 to 12 h and 0 to 3 h. Based on Formula (1), “a posteriori” probability was determined for a particular interruption in the water supply to consumers will be caused by the given type of failure. The results of the calculations are presented in Table 1. The calculations were carried out according to the following example:
Based on the analysis, the following conclusions were made:
- The highest probability that there will be no lack of water supply to consumers was obtained in case of damage to the water fittings (hydrant, gate valve, vent, drainage, water meter, pressure reducer), .
- The highest probability that there will be a lack of water supply to consumers for a period (0 h–3 h) was determined for:
- ○
- Leakage at the pipe connection, .
- ○
- Cracking of pipes, .
- ○
- Corrosion of pipes, .
- ○
- Damage to the water fittings, .
- The highest probability that there will be a lack of water supply to consumers for a period (3 h–12 h) was determined for:
- ○
- Leakage at the pipe connection, .
- ○
- Corrosion of pipes, .
- ○
- Cracking of pipes, .
- ○
- Damage to the water fittings, .
- The highest probability that there will be a lack of water supply to consumers for a period (12 h–24 h) was obtained in case of corrosion of pipes, .
- The lack of water supply to consumers of a duration (>24 h) during the considered period was caused by one reason: cracking of the pipes, .
The obtained values can be used as information that would help in making strategic decisions regarding the modernization of the water supply network without the need for detailed knowledge of, inter alia, the age, the number of breaks, and also the level of corrosion. The method is universal and based on cause-effect relationships. Grouping of the events concerns the determination of the type of failure and the time of lack of water supply, which is very important because of a lack of pipe information in the realistic field. The obtained results indicate that a long-term lack of water supply to consumers is primarily associated with corrosion (steel) and leakage at the pipe connections (gray cast iron, PVC). The cracking of pipes resulting in the lack of water supply over 24 h was of incidental nature, where it was the cracking of one of the main pipes in the city (diameter 600 mm, gray cast iron)—approximately 2150 m3 of water leaked as a result of the failure. The water company did not supply water through the pipe for 110 h.
4. Conclusions and Perspectives
The proposed method of determining the probability of lack of water supply to consumers in relation to the type of water supply network failure using Bayes’ theorem should be used in the analysis of network operational safety. It makes it possible to determine the cause-and-effect relationship between a given type of failure and a key parameter from the consumer point of view, i.e., the time of lack of water supply. The method is useful for a better understanding of the functioning of the WSS and supporting decision-making processes. The proposed method is general in nature and can be easily adapted to the specifics of the different WSS. However, it requires a complete book of water supply failure reports because the method is based on historical data.
This method allows the determination of cause-and-effect relationships and assesses the probability of potential losses in the water supply network. Based on the results of the work, it is possible to develop strategies to prevent water pipeline failures that cause long interruptions in the water supply. The longest time of lack of water supply to consumers in the analyzed system was related to the corrosion of pipes and leakage at the pipe connections. In order to reduce the incidence of long-term interruptions in water supply, water supply companies should continue replacing gray cast iron pipes with thermoplastic materials. The decision to choose a pipe renovation method should be preceded by an analysis of its alternatives and expenses. New house connections are currently made of PE, which in the future should result in a decrease in the number of failures caused by corrosion of steel home connections, which often cause long-term interruptions in the supply of water. In addition, the results demonstrate that common failures do not have to be a major inconvenience for water consumers. Damage to the fittings does not cause long interruptions in the water supply. For the analyzed city, there was no lack of water for more than 12 h due to other causes, i.e., cracking of pipes, leak on the band, cracking of T-fittings, mechanical damage to pipes, mechanical damage to the water fittings, and thawing pipes. These failures do not pose a risk to the continuity of the urban drinking water supply. It can be concluded that the developed method allows determining the types of failures which have serious consequences and adopting a water network modernization strategy. The developed method can be used in the different water supply systems which do not have appropriate IT tools. In such cases, the use of a stochastic method that relates the type of failure to the water supply cut is very useful. Approach to WSS managing based on the prevention of threats to water consumers reduces the probability of lack of water supply or supply of water of inadequate quality and allows water companies to prepare appropriate reactions.
This research focused on the quantitative aspect of the supply of drinking water. It does not entirely address the impact of economic, environmental, and social objectives. The decision-making process concerning the modernization of water pipes should be the result of not only the reliability analysis but also the assessment of a company’s finances, and nuisance for the environment and water consumers. For this purpose, cooperation with public administrations should be undertaken.
Funding
This research was funded by the Faculty of Civil and Environmental Engineering and Architecture, Rzeszow University of Technology, 35-959 Rzeszow, Poland.
Acknowledgments
I thank the reviewers for their feedback, which helped to improve the manuscript quality.
Conflicts of Interest
The author declares no conflict of interest.
References and Notes
- United Nations Children’s Fund (UNICEF); World Health Organization (WHO). Progress on Drinking Water, Sanitation and Hygiene: 2017 Update and SDG Baselines; United Nations Children’s Fund (UNICEF): New York, NY, USA; World Health Organization (WHO): Geneva, Switzerland, 2017. [Google Scholar]
- The United Nations General Assembly. Resolution 70/1, Transforming our World: The 2030 Agenda for Sustainable Development on 25th September 2015; The United Nations General Assembly: New York, NY, USA, 2015. [Google Scholar]
- Conker, A.; Hussein, H. Hydraulic Mission at Home, Hydraulic Mission abroad? Examining Turkey’s Regional ‘Pax-Aquarum’ and Its Limits. Sustainability 2019, 11, 228. [Google Scholar] [CrossRef] [Green Version]
- Conker, A. The Power Struggle in the Layer of Transnational Hydropolitics: The Case of the Ilisu Dam Project. Eurasian J. Soc. Sci. 2016, 4, 14–34. [Google Scholar] [CrossRef]
- World Health Organization. Guidelines for Drinking-Water Quality, 4th ed.; WHO: Geneva, Switzerland, 2011. [Google Scholar]
- World Health Organization. Water Safety Plan Manual: Step-By-Step Risk Management for Drinking-Water Suppliers; WHO: Geneva, Switzerland, 2009. [Google Scholar]
- Szpak, D.; Tchórzewska-Cieślak, B. The Use of Grey Systems Theory to Analyze the Water Supply Systems Safety. Water Resour. Manag. 2019, 33, 4141–4155. [Google Scholar] [CrossRef] [Green Version]
- Gunnarsdottir, M.J.; Gardarsson, S.M.; Elliott, M.; Sigmundsdottir, G.; Bartram, J. Benefits of Water Safety Plans: Microbiology, Compliance, and Public Health. Environ. Sci. Technol. 2012, 46, 7782–7789. [Google Scholar] [CrossRef] [PubMed]
- Roeger, A.; Tavares, A.F. Do Governance Arrangements Affect the Voluntary Adoption of Water Safety Plans? An Empirical Study of Water Utilities in Portugal. Water Resour. Manag. 2020, 34, 1757–1772. [Google Scholar] [CrossRef]
- Proposal for a Directive of the European Parliament and of the Council on the Quality of Water Intended for Human Consumption (Recast); 1.2.2018, COM(2017) 753 final, 2017/0332(COD). + ADD 1; European Commision: Brussels, Belgium, 2017.
- Zingraff-Hamed, A.; Schröter, B.; Schaub, S.; Lepenies, R.; Stein, U.; Hüesker, F.; Meyer, C.; Schleyer, C.; Schmeier, S.; Pusch, M.T. Perception of bottlenecks in the implementation of the European Water Framework Directive. Water Altern. 2020, 13, 458–483. [Google Scholar]
- Papciak, D.; Tchórzewska-Cieślak, B.; Pietrzyk, A.D.; Wojtuś, A.; Żywiec, J.; Konkol, J. The Impact of the Quality of Tap Water and the Properties of Installation Materials on the Formation of Biofilms. Water 2019, 11, 1903. [Google Scholar] [CrossRef] [Green Version]
- Pietrucha-Urbanik, K.; Studziński, A. Qualitative analysis of the failure risk of water pipes in terms of water supply safety. Eng. Fail. Anal. 2019, 95, 371–378. [Google Scholar] [CrossRef]
- Romano, E.; Guyennon, N.; Duro, A.; Giordano, R.; Petrangeli, A.B.; Portoghese, I.; Salerno, F. A Stakeholder Oriented Modelling Framework for the Early Detection of Shortage in Water Supply Systems. Water 2018, 10, 762. [Google Scholar] [CrossRef] [Green Version]
- Kordana, S.; Słyś, D. Decision Criteria for the Development of Stormwater Management Systems in Poland. Resources 2020, 9, 20. [Google Scholar] [CrossRef] [Green Version]
- Boryczko, K.; Bartoszek, L.; Koszelnik, P.; Rak, J. A new concept for risk analysis relating to the degradation of water reservoirs. Environ. Sci. Pollut. Res. 2018, 25, 25591–25599. [Google Scholar] [CrossRef] [PubMed] [Green Version]
- Rak, J.; Pietrucha-Urbanik, K. An Approach to Determine Risk Indices for Drinking Water–Study Investigation. Sustainability 2019, 11, 3189. [Google Scholar] [CrossRef] [Green Version]
- Security of drinking water supply. Guidelines for Risk and Crisis Management. Risk management; BS EN 15975-2:2013. European Standard. Publication Date: 30 September 2013.
- Council Directive 2008/114/EC of 8 December 2008 on the identification and designation of European critical infrastructures and the assessment of the need to improve their protection. Official Journal of EU L. 375/75.
- Hallam, N.; West, J.; Forster, C.; Simms, J. The potential for biofilm growth in water distribution systems. Water Res. 2001, 35, 4063–4071. [Google Scholar] [CrossRef]
- Pozos-Estrada, O.; Sánchez-Huerta, A.; Breña-Naranjo, J.A.; Pedrozo-Acuña, A. Failure Analysis of a Water Supply Pumping Pipeline System. Water 2016, 8, 395. [Google Scholar] [CrossRef]
- Rak, J.R. Safety of Water Supply System; Polish Academy of Science: Warsaw, Poland, 2009. [Google Scholar]
- Piegdoń, I.; Tchórzewska-Cieślak, B.; Eid, M. Managing the risk of failure of the water supply network using the mass service system. Ekspolatacja Niezawodn. Maint. Reliab. 2018, 20, 284–291. [Google Scholar] [CrossRef]
- Bross, L.; Krause, S.; Wannewitz, M.; Stock, E.; Sandholz, S.; Wienand, I. Insecure Security: Emergency Water Supply and Minimum Standards in Countries with a High Supply Reliability. Water 2019, 11, 732. [Google Scholar] [CrossRef] [Green Version]
- Gay, S.D.; American Water Works Association; Borman, S.D. M19 Emergency Planning for Water and Wastewater Utilities, 5th ed.; American Water Works Association: Denver, CO, USA, 2018; ISBN 978-1-62576-279-5. [Google Scholar]
- Garschagen, M.; Sandholz, S. The role of minimum supply and social vulnerability assessment for governing critical infrastructure failure: Current gaps and future agenda. Nat. Hazards Earth Syst. Sci. 2018, 18, 1233–1246. [Google Scholar] [CrossRef] [Green Version]
- Tabesh, M.; Soltani, J.; Farmani, R.; Savic, D. Assessing pipe failure rate and mechanical reliability of water distribution networks using data-driven modeling. J. Hydroinform. 2009, 11, 1–17. [Google Scholar] [CrossRef]
- Hussein, H. Yarmouk, Jordan, and Disi basins: Examining the impact of the discourse of water scarcity in Jordan on transboundary water governance. Mediterr. Politi 2018, 24, 269–289. [Google Scholar] [CrossRef] [Green Version]
- Rezaei, H.; Ryan, B.; Stoianov, I. Pipe Failure Analysis and Impact of Dynamic Hydraulic Conditions in Water Supply Networks. Procedia Eng. 2015, 119, 253–262. [Google Scholar] [CrossRef] [Green Version]
- Kutyłowska, M. Prediction of Failure Frequency of Water-Pipe Network in the Selected City. Period. Polytech. Civ. Eng. 2017, 61, 548–553. [Google Scholar] [CrossRef] [Green Version]
- Kettler, A.J.; Goulter, I.C. An analysis of pipe breakage in urban water distribution networks. Can. J. Civ. Eng. 1985, 12, 286–293. [Google Scholar] [CrossRef]
- Boryczko, K.; Pasierb, A. Method for forecasting the failure rate index of water pipelines. Environ. Eng. V 2016, V, 15–23. [Google Scholar] [CrossRef]
- Arai, Y.; Koizumi, A.; Inakazu, T.; Watanabe, H.; Fujiwara, M. Study on failure rate analysis for water distribution pipelines. J. Water Supply Res. Technol. 2010, 59, 429–435. [Google Scholar] [CrossRef]
- Wols, B.A.; Van Thienen, P. Impact of climate on pipe failure: Predictions of failures for drinking water distribution systems. Eur. J. Transp. Infrastruct. Res. 2016, 16, 240–253. [Google Scholar]
- Sadiq, R.; Saint-Martin, E.; Kleiner, Y. Predicting risk of water quality failures in distribution networks under uncertainties using fault-tree analysis. Urban Water J. 2008, 5, 287–304. [Google Scholar] [CrossRef] [Green Version]
- Diao, K.; Sweetapple, C.; Farmani, R.; Fu, G.; Ward, S.; Butler, D. Global resilience analysis of water distribution systems. Water Res. 2016, 106, 383–393. [Google Scholar] [CrossRef] [Green Version]
- Bernardo, J.M.; Smith, A.F.M. Bayesian Theory; Wiley: Chichester, UK, 1993. [Google Scholar]
- Poulakis, Z.; Valougeorgis, D.; Papadimitriou, C. Leakage detection in water pipe networks using a Bayesian probabilistic framework. Probab. Eng. Mech. 2003, 18, 315–327. [Google Scholar] [CrossRef] [Green Version]
- Pagano, A.; Giordano, R.; Portoghese, I.; Fratino, U.; Vurro, M. A Bayesian vulnerability assessment tool for drinking water mains under extreme events. Nat. Hazards 2014, 74, 2193–2227. [Google Scholar] [CrossRef]
- Dawsey, W.J.; Minsker, B.S.; Amir, E. Real Time Assessment of Drinking Water Systems Using a Dynamic Bayesian Network. World Environ. Water Resour. Congr. 2007 2007, 1–6. [Google Scholar] [CrossRef] [Green Version]
- Tang, K.; Parsons, D.J.; Jude, S. Comparison of automatic and guided learning for Bayesian networks to analyse pipe failures in the water distribution system. Reliab. Eng. Syst. Saf. 2019, 186, 24–36. [Google Scholar] [CrossRef]
- Kabir, G.; Tesfamariam, S.; Francisque, A.; Sadiq, R. Evaluating risk of water mains failure using a Bayesian belief network model. Eur. J. Oper. Res. 2015, 240, 220–234. [Google Scholar] [CrossRef]
- Shamir, U.; Howard, C.D. An Analytic Approach to Scheduling Pipe Replacement. J. Am. Water Work. Assoc. 1979, 71, 248–258. [Google Scholar] [CrossRef]
- Berardi, L.; Giustolisi, O.; Kapelan, Z.; Savic, D. Development of pipe deterioration models for water distribution systems using EPR. J. Hydroinform. 2008, 10, 113–126. [Google Scholar] [CrossRef] [Green Version]
- Fares, H.; Zayed, T. Hierarchical Fuzzy Expert System for Risk of Failure of Water Mains. J. Pipeline Syst. Eng. Pract. 2010, 1, 53–62. [Google Scholar] [CrossRef]
- Nahal, M.; Khelif, R. Failure Probability Assessment for Pipelines under the Corrosion Effect. Am. J. Mech. Eng. 2014, 2, 15–20. [Google Scholar] [CrossRef] [Green Version]
- Al Qahtani, T.; Yaakob, M.S.; Yidris, N.; Sulaiman, S.; Ahmad, K.A. A Review on Water Leakage Detection Method in the Water Distribution Network. J. Adv. Res. Fluid Mech. Therm. Sci. 2020, 68, 152–163. [Google Scholar] [CrossRef]
- Pardo, M.; Riquelme, A. A software for considering leakage in water pressurized networks. Comput. Appl. Eng. Educ. 2019, 27, 708–720. [Google Scholar] [CrossRef]
- Saldarriaga, J.; Salcedo, C. Determination of Optimal Location and Settings of Pressure Reducing Valves in Water Distribution Networks for Minimizing Water Losses. Procedia Eng. 2015, 119, 973–983. [Google Scholar] [CrossRef] [Green Version]
- Hoțupan, A.; Mare, R.; Hădărean, A. Water Loss Reduction in Water Distribution Networks. Case Study. J. Appl. Eng. Sci. 2019, 9, 73–80. [Google Scholar] [CrossRef] [Green Version]
- Trojan, F.; Morais, D.C. Maintenance Management Decision Model for Reduction of Losses in Water Distribution Networks. Water Resour. Manag. 2015, 29, 3459–3479. [Google Scholar] [CrossRef]
- Mutikanga, H.E.; Sharma, S.K.; Vairavamoorthy, K. Multi-criteria Decision Analysis: A Strategic Planning Tool for Water Loss Management. Water Resour. Manag. 2011, 25, 3947–3969. [Google Scholar] [CrossRef]
- Al-Washali, T.; Sharma, S.; Lupoja, R.; Al-Nozaily, F.; Haidera, M.; Kennedy, M. Assessment of water losses in distribution networks: Methods, applications, uncertainties, and implications in intermittent supply. Resour. Conserv. Recycl. 2020, 152, 104515. [Google Scholar] [CrossRef]
- Szpak, D.; Piegdoń, I. Identification of Failure Causes in the Water Supply Network. J. Konbin 2019, 49, 283–300. [Google Scholar] [CrossRef] [Green Version]
- Szpak, D.; Tchórzewska-Cieślak, B. Assessment of the failure rate of water supply system in terms of safety of critical infrastructure. Chemik 2014, 68, 862–867. [Google Scholar]
- Ciaponi, C.; Murari, E.; Todeschini, S. Modularity-Based Procedure for Partitioning Water Distribution Systems into Independent Districts. Water Resour. Manag. 2016, 30, 2021–2036. [Google Scholar] [CrossRef]
- Grayman, W.; Murray, R.; Savic, D. Effects of Redesign of Water Systems for Security and Water Quality Factors. World Environ. Water Resour. Congr. 2009 2009, 504–514. [Google Scholar] [CrossRef]
- Kowalski, D.; Kowalska, B.; Kwietniewski, M. Monitoring of water distribution system effectiveness using fractal geometry. Bull. Pol. Acad. Sci. Tech. Sci. 2015, 63, 155–161. [Google Scholar] [CrossRef] [Green Version]
- Piegdon, I.; Tchórzewska-Cieślak, B. Methods of Visualizing the Risk of Lack of Water Supply; Informa UK Limited: London, UK, 2014; pp. 497–505. [Google Scholar]
- Pietrucha-Urbanik, K.; Rak, J. Consumers’ Perceptions of the Supply of Tap Water in Crisis Situations. Energies 2020, 13, 3617. [Google Scholar] [CrossRef]
Publisher’s Note: MDPI stays neutral with regard to jurisdictional claims in published maps and institutional affiliations. |
Figure 1.
The scheme of the water supply network.

Figure 2.
The scheme summarizing the methodological approach.

Figure 3.
The number of water supply network failures. Markings for Figure 3: 1—leakage at the pipe connections, 2—damage to the water fittings (hydrant, valve, water meter, pressure reducer), 3—corrosion of pipes, 4—cracking of pipes, 5—leak on the band, 6—cracking of T-fitting, 7—mechanical damage to pipes, 8 — mechanical damage to the water fittings, and 9—thawing pipes.

Figure 4.
The probability of a certain water supply interruption.


Table 1.
“A posteriori” probability that a specific interruption in the water supply to consumers will be caused by a given type of failure.
Table 1.
“A posteriori” probability that a specific interruption in the water supply to consumers will be caused by a given type of failure.
| Designation | “A posteriori” Probability that a Specific Interruption in the Water Supply to Consumers will be Caused by a Given Type of Failure P(Xi|Yj) | ||||
|---|---|---|---|---|---|
| Y1 (0 h) | Y2 (0 h–3 h) | Y3 (3 h–12 h) | Y4 (12 h–24 h) | Y5 (>24 h) | |
| X1 (leakage at the pipe connections) | 0 | 0.336 | 0.303 | 0.171 | 0 |
| X2 (damage to the water fittings) | 0.837 | 0.168 | 0.123 | 0 | 0 |
| X3 (corrosion of pipes) | 0.091 | 0.206 | 0.271 | 0.829 | 0 |
| X4 (crack of pipes) | 0.036 | 0.213 | 0.160 | 0 | 1 |
| X5 (leak on the band) | 0 | 0.015 | 0.062 | 0 | 0 |
| X6 (crack of T-fitting) | 0 | 0.008 | 0.062 | 0 | 0 |
| X7 (mechanical damage to pipes) | 0 | 0.031 | 0.019 | 0 | 0 |
| X8 (mechanical damage to the water fittings) | 0.036 | 0.007 | 0 | 0 | 0 |
| X9 (thawing pipes) | 0 | 0.016 | 0 | 0 | 0 |
© 2020 by the author. Licensee MDPI, Basel, Switzerland. This article is an open access article distributed under the terms and conditions of the Creative Commons Attribution (CC BY) license (http://creativecommons.org/licenses/by/4.0/).
Share and Cite
MDPI and ACS Style
Szpak, D. Method for Determining the Probability of a Lack of Water Supply to Consumers. Energies 2020, 13, 5361. https://0-doi-org.brum.beds.ac.uk/10.3390/en13205361
AMA Style
Szpak D. Method for Determining the Probability of a Lack of Water Supply to Consumers. Energies. 2020; 13(20):5361. https://0-doi-org.brum.beds.ac.uk/10.3390/en13205361
Chicago/Turabian StyleSzpak, Dawid. 2020. "Method for Determining the Probability of a Lack of Water Supply to Consumers" Energies 13, no. 20: 5361. https://0-doi-org.brum.beds.ac.uk/10.3390/en13205361
Note that from the first issue of 2016, this journal uses article numbers instead of page numbers. See further details here.