Technological Effectiveness of Sugar-Industry Effluent Methane Fermentation in a Fluidized Active Filling Reactor (FAF-R)


Department of Environment Engineering, Faculty of Geoengineering, University of Warmia and Mazury in Olsztyn, 10-719 Olsztyn, Poland
*
Author to whom correspondence should be addressed.
Energies 2020, 13(24), 6626; https://0-doi-org.brum.beds.ac.uk/10.3390/en13246626
Submission received: 27 November 2020
/
Revised: 12 December 2020
/
Accepted: 15 December 2020
/
Published: 15 December 2020
(This article belongs to the Special Issue Wastewater Treatment and Biogas Production)
Abstract
:Technological solutions allowing the increase of the technological efficiency of anaerobic methods of wastewater treatment are still under investigation. The weaknesses of these solutions can be limited by the use of active fillings. The aim of the present study was to determine the impact of fluidized active filling on the effectiveness of anaerobic treatment of sugar-industry effluent, the production efficiency and the qualitative composition of the biogas produced. High, comparable (p = 0.05) effluent treatment results were observed at tested organic load rates between 4.0 and 6.0 kg COD (Chemical Oxygen Demand)/m3·d. The COD removal rate reached over 74%, biogas yields ranged from 356 ± 25 to 427 ± 14 dm3/kg CODremoved and the average methane contents were approximately 70%. A significant decrease in effluent treatment efficiency and methane fermentation was observed after increasing the organic load rate to 8.0 kg COD/m3·d, which correlated with decreased pH and FOS/TAC (volatile organic acid and buffer capacity ratio) increased to 0.44 ± 0.2. The use of fluidized active filling led to phosphorus removal with an efficiency ranged from 64.4 ± 2.4 to 81.2 ± 8.2% depending on the stage. Low concentration of total suspended solids in the treated effluent was also observed.

1. Introduction
Sugar-industry effluent is characterized by a high load of suspended solids and nutrients and by a high COD (Chemical Oxygen Demand) mainly due to the presences of carbohydrates [1,2,3]. Discharge of such effluent into the environment has a negative impact on aquatic ecosystems [4]. As of recent years, fermentation reactors have been the preferred method for treating sugar-industry effluent, encompassing technologies such as anaerobic fixed bed (UAFB) [5], upflow anaerobic sludge blanket (UASB) [6], anaerobic downflow stationary fixed film (DSFF) [7], aerated fixed film (AFF) [8] and anaerobic batch reactors [9].
Advantages of fermentation reactors include low operating costs [10,11], small size of the bioreactors not requiring large investment plots [12], low excess sludge, which can usually be used as a nitrogen- and phosphorus-rich fertilizer [13,14] provided high soil enzymes activity and greater stability in crop production [15], their capacity to treat highly-polluted wastewater and operating at high organic load rates (OLRs) [16]. Anaerobic bioreactors are hermetically closed, limiting the spread of odors and aerosols [17,18,19]. CH4-rich biogas is an important product of anaerobic biodegradation of organic compounds [20].
Despite the indisputable advantages of the anaerobic treatment technologies, there are also clear limitations as well, preventing widespread take-up [21,22]. One disadvantage of fermentation methods is that the removal of nutrients (nitrogen and phosphorus) is a function of biomass growth in the anaerobic process and occurs with low efficiency [23,24]. Limited pollutant removal performance precludes anaerobic reactors from being used to produce final discharge-ready water. This necessitates the use of additional processing, such as an aerobic pass or chemical precipitation to remove phosphorus [25,26]. While effective, these methods add to the operating costs and increase the technological complexity of the system [27,28]. Difficulties with separating treated effluent from the fermentation microflora are also encountered in anaerobic reactors with full mixing, potentially leading to bacterial biomass wash-out from the reactor [29].
As such, it is necessary to identify solutions to improve the efficiency and versatility of anaerobic technologies. An alternative to the currently used solutions is to use fillings, which support sorption, precipitation and binding of nutrients, while also improving the efficiency of biogas production. Effective phosphorus removal under anaerobic conditions has been shown to be achievable through the introduction of metal ions produced by corrosion of metal elements [30]. Laboratory and semi-industrial studies have shown that the use of the metal dissolution leads to complete removal of orthophosphates and 90% reduction in total organic phosphorus [31]. It has been shown that the addition of zero valent iron improves the stability of methane fermentation and increases the production of methane even at a non-optimal pH [32]. The use of constant magnetic field can also directly improve the final processing outcomes of methane fermentation [33].
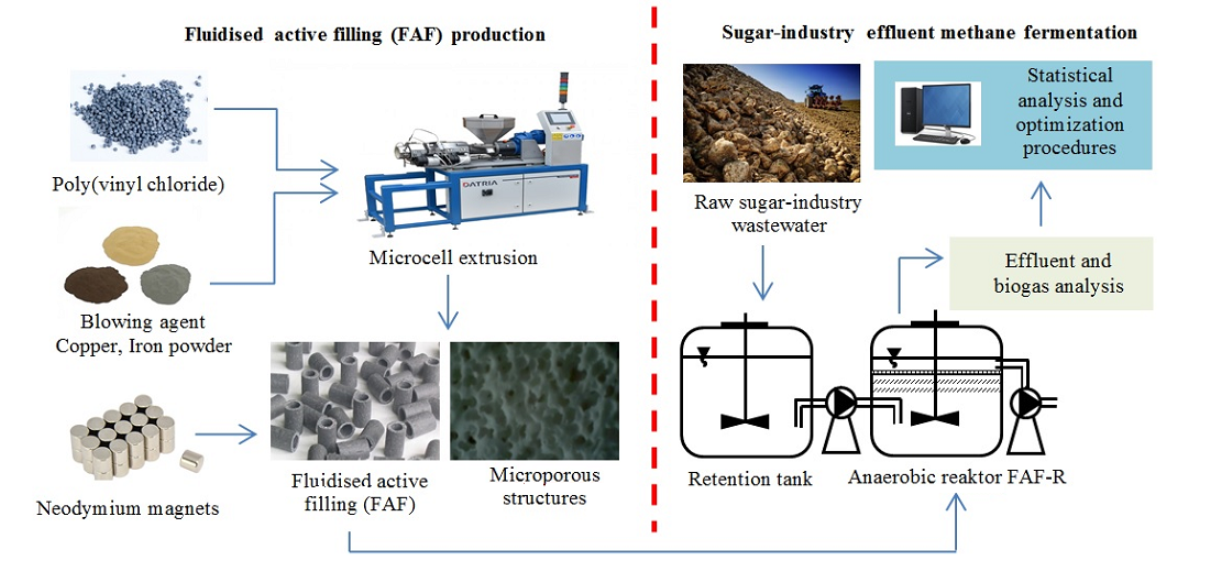
The fluidized active filling (FAF) method presented in this paper is an innovative solution not previously used to treat sugar-industry effluent. The use of a microcellular extrusion process to create microspheres can increase the active surface area available for anaerobic sludge microorganisms, which limits the wash-out of biomass from reactors and increases the microflora-effluent contact surface [34]. Sewage treatment processes may be further supported by enriching filling components with metal additives and magnetic fluid activators, which has been shown, for example, to reduce the surface tension of effluent, promote biogas removal [35] and facilitate the hydrogen sulphide fixation by iron ions [36]. The structural properties of the pipe fittings and the additional action of active factors lead to significant increases in effluent treatment efficiency and the production of gaseous anaerobic bacteria metabolites, when compared to the currently used fillings [37].
The effects of using FAF in anaerobic reactors have so far been confirmed only in the treatment of dairy waste. In order to obtain a reliable assessment and determine the universality of this innovative solution, it is necessary to conduct further verification tests. The most desirable are operational tests carried out on a fractional-technical and pilot scale, in which the obtained results will not be sensitive to the scale-up effect. The aim of the present study was to determine the impact of fluidized active filling (FAF) on the effectiveness of anaerobic treatment of sugar-industry effluent, the production efficiency and the qualitative composition of the biogas produced.
2. Materials and Methods
2.1. General Study Design
The study was conducted on a semi-industrial scale and in three stages. The stages were differentiated by the organic load rate (OLR) in the anaerobic chamber. The experiment was concluded upon the successful achievement of the target process results related to effluent treatment efficiency and biogas and methane production efficiency. The OLR range for the study was from 4.0 kg COD/m3·d to 8.0 kg COD/m3·d. Prior to the start of the exact study, the anaerobic sludge was adapted to the process conditions by running a fluidized active filling reactor (FAF-R) at an OLR of 1.0 kg COD/m3·d for 40 days.
2.2. Materials
2.2.1. Sugar-Industry Effluent
The experiments used an effluent sourced from the sugar industrial plant during the August–November beet production campaign. Before being fed to the FAF-R, the effluent was stored in a retention/equalizing tank. The primary indicators of pollution in the examined effluent in the three experimental stages differing in OLR are presented in Table 1.
To achieve the intended levels of COD in the effluent, the raw effluent was mixed with tap water (Table 2).
2.2.2. Anaerobic Sludge
The FAF-R (Fluidized Active Filling-Reactor) was inoculated with anaerobic sludge sourced from the anaerobic digesters of the “Łyna” Municipal Water Treatment Plant in Olsztyn, Poland. The enclosed digesters are used for anaerobic stabilization of anaerobic sludge produced during municipal wastewater treatment. The system runs at 35 °C, at loads ranging from 2.0 kg VS/m3·d to 2.5 kg VS/m3·d. The hydraulic retention time in the digester is 20 days. The properties of the anaerobic sludge are presented in Table 3.
2.2.3. Fluidized Active Filling (FAF)
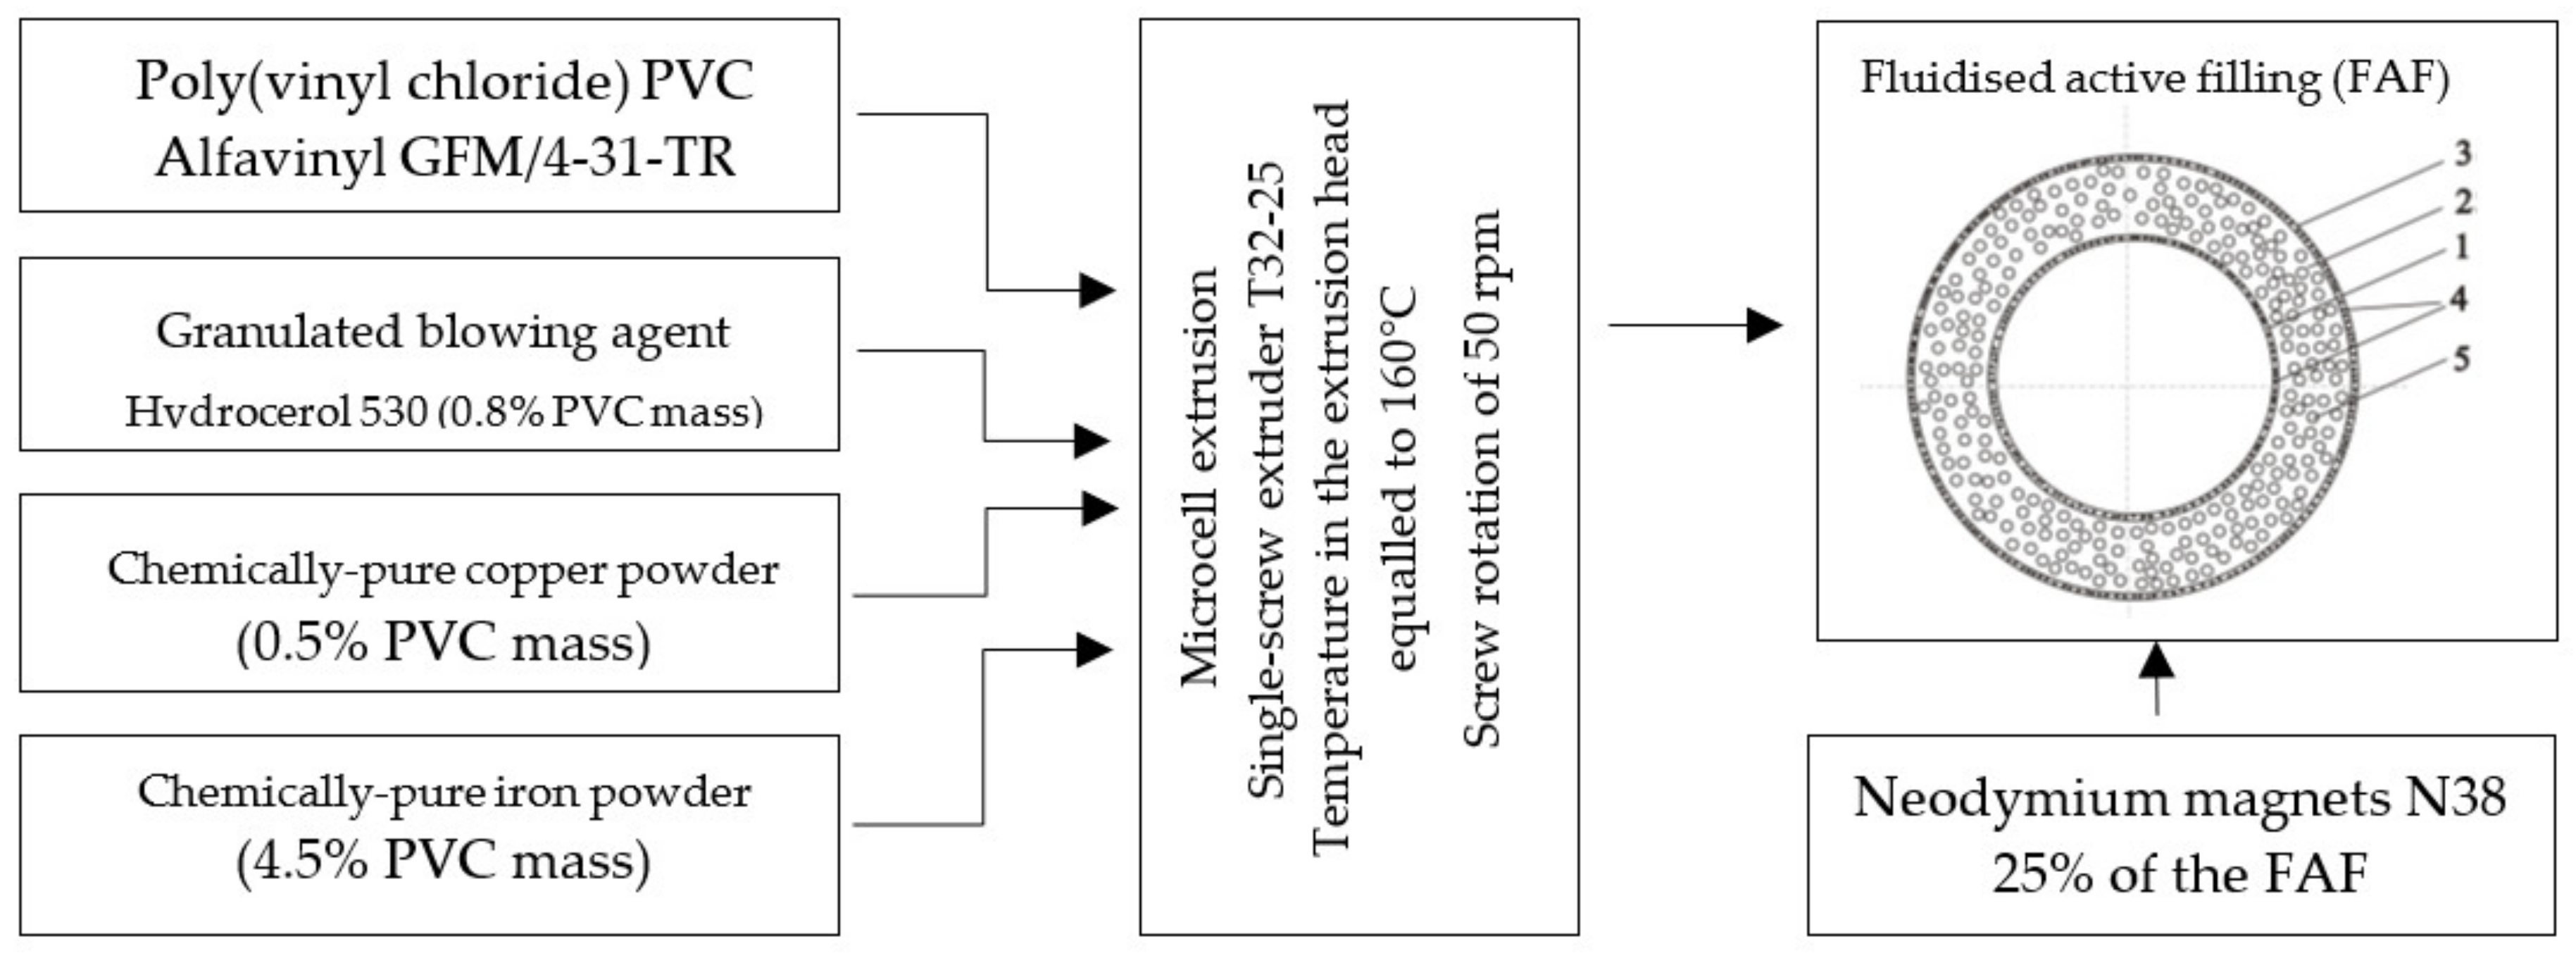
The FAF used in the research was produced using the technology of microcell extrusion of transparent, granulated plasticized poly(vinyl chloride) (Alfavinyl GFM/4-31-TR, Alfa sp. z o.o., Warsaw, Poland). The material was chosen due to its common use. The basic properties of the poly(vinyl chloride) are listed in Table 4.
The PVC used for the FAF-R components was modified by adding a Hydrocerol 530 granulated blowing agent in the proportion of 0.8% weight (manufactured by Clariant Masterbatch). Chemically-pure copper and iron powders manufactured by Cometox (Cometox S.R.L, San Giacomo, Italy) were also mixed in with the PVC. The metal additives weighed 5.0% of the mass of the PVC used in the pipe fittings. The Cu/Fe weight ratio was 1Cu/9Fe, as determined based on prior research by the authors [38]. Specifications of the build components used for the active filling during the experiments are presented in Table 5.
Based on the previous research, it was determined that the optimum magnetic properties in the operated reactor were achieved after magnets were installed in 25% of the reactor pipe fittings [39]. The specifications of the neodymium magnets used in experiments are as follows: diameter 10 ± 0.1 mm, height 5 ± 0.1 mm, magnetic flux ~3952·× 10−3 mWb, magnetic moment ~450.528·× 10−6 mWb·m, magnetic flux at the geometric center of the magnetic pole surface at a distance of 0.7 mm ~0.368 T, magnetic flux at the edge of the magnetic pole surface at a distance of 0.7 mm ~0.384 T, maximum working load ~0.85 kg. The scheme of FAF production is presented in Figure 1.
2.3. Design and Operation of the Process System
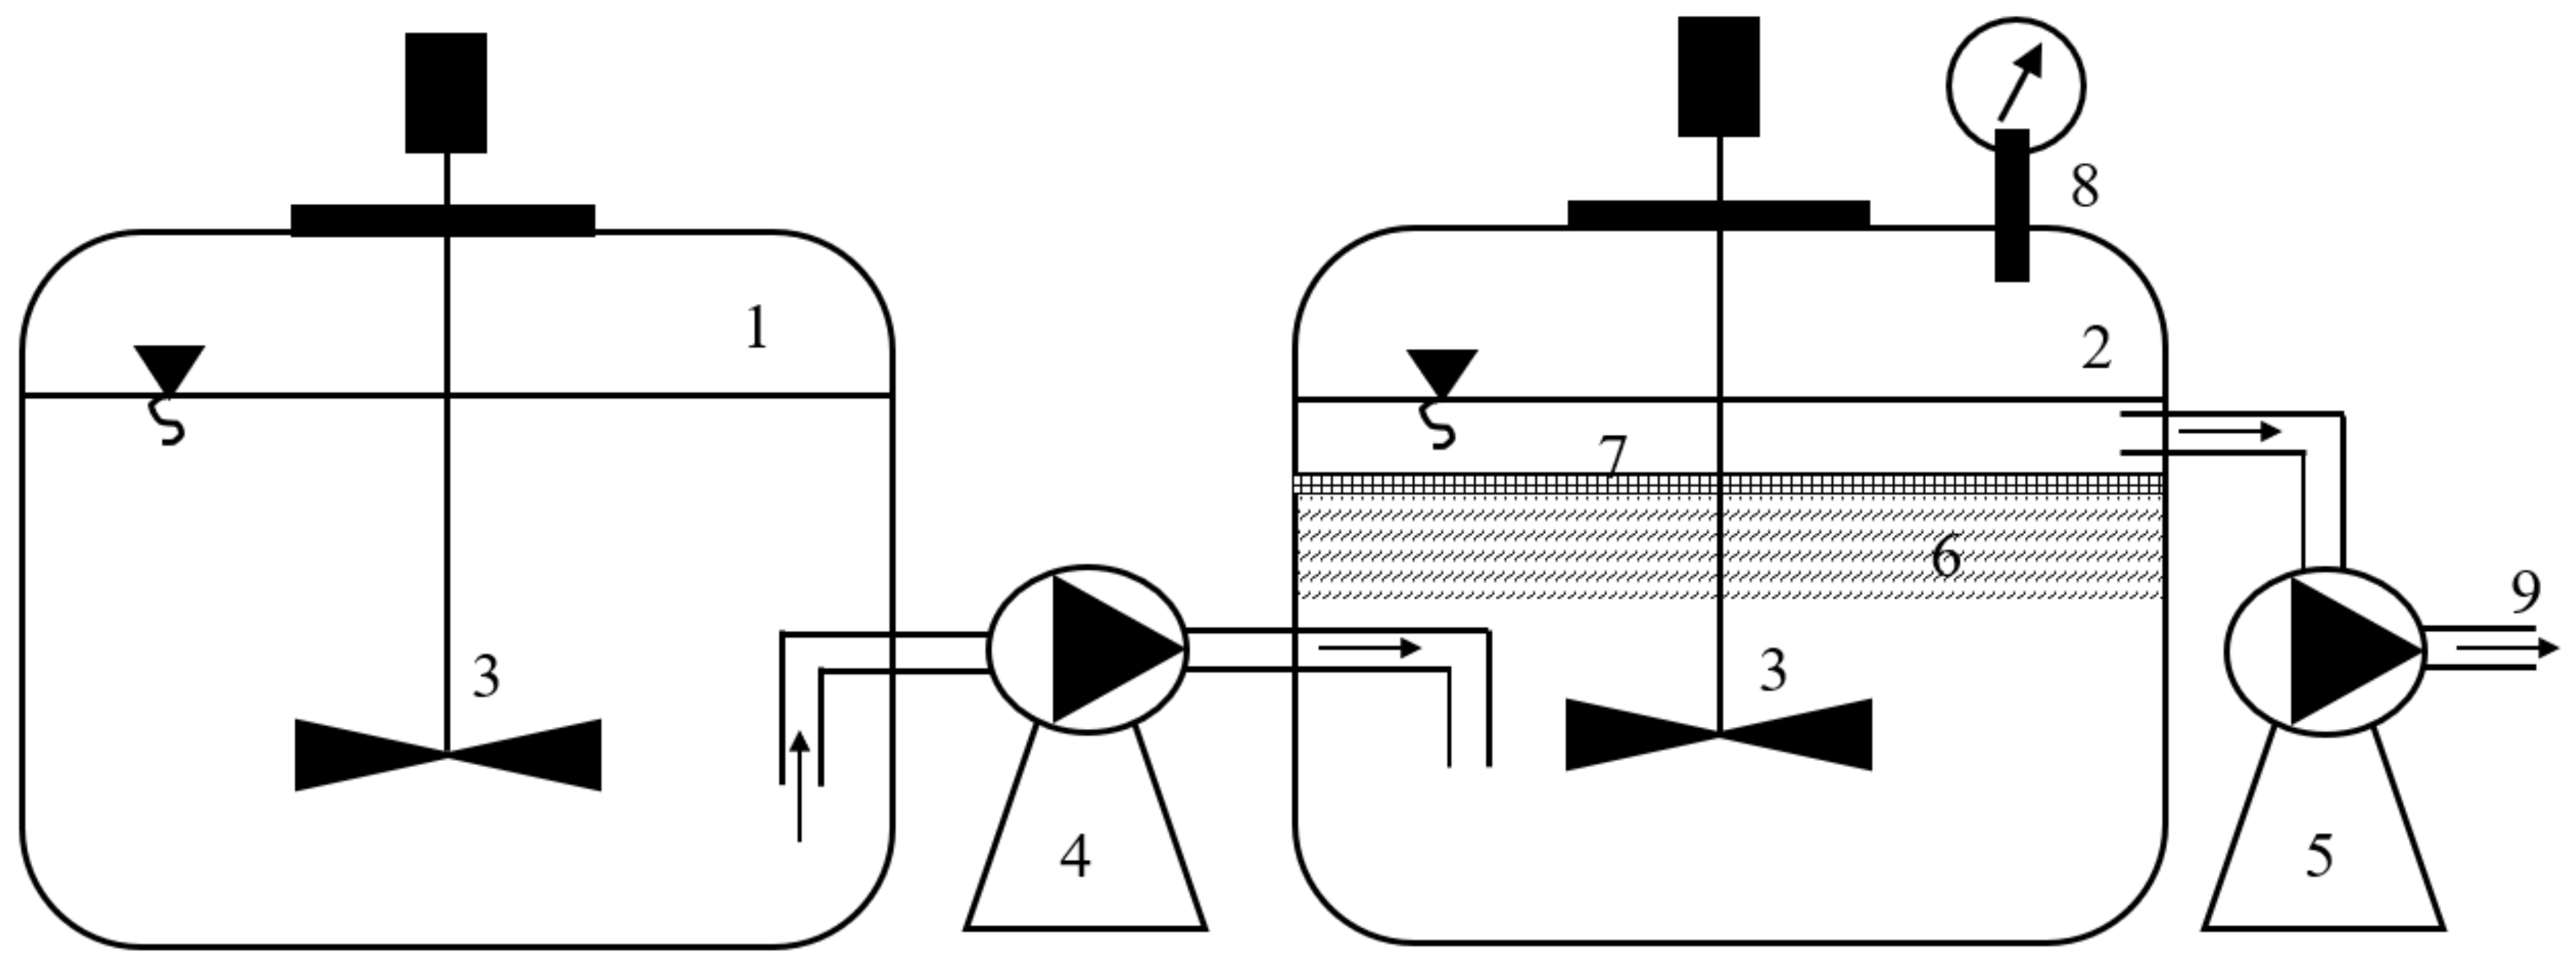
The semi-industrial-scale process system for treating sugar-industry effluent comprised a retention tank and the FAF-R. A diagram of the system is presented in Figure 2.
The retention tank consisted of a pallet container with a total volume of 1000 dm3 and an active volume of 600 dm3. The reactor was fitted with a vertical agitator rotating at 30 rpm. Raw sugar wastewater was delivered every 24 h and stored in a retention tank. The effluent from the retention tank was fed to the FAF-R in 24 doses per day, for 10 min per dose, through a rotary lobe pump with a capacity of 150 dm3/h. The FAF-R was constructed upon a pallet container with a total volume of 1000 dm3 and an active volume of 600 dm3. As with the hydrolysis tank, the reactor was fitted with a vertical agitator rotating at 60 rpm and working on a 30 min on/30 min off operating scheme. Due to the density of the tested FAF, which was lower than the reactor contents (an anaerobic sludge and effluent mixture), the tank acted as a contact reactor with a fluidized filling during the mixing-on periods. The volume of FAF fed into the reactor was 200 dm3. During the mixing intervals, FAF flotation occurred and a filtration layer formed at the top of the tank.
The processing method applied enabled the active filling to interact with biomass throughout the FAF-R during mixing. During the intervals, flotation occurred, filtration layers formed (10 min) and the outflowing treated effluent was filtered (10 min), which reduced anaerobic sludge wash-out from the FAF-R and pollutant load in the outflow. The treated effluent was discharged from the FAF-R through a spigot fitted underneath the liquid surface by means of a peristaltic pump with a capacity of 150 m3/h. The discharge of the treated effluent from the FAF-R was followed by the introduction of raw effluent. Raw effluent from the retention tank was fed into the bottom part of the FAF-R in 24 doses per day, for 10 min per dose. The one-hour repeated working cycle of the FAF-R is as follows: mixing 30 min, settling 30 min included 10 min—FAF flotation and filtration layer formation at the top of the FAF-R, 10 min—the outflow of treated effluent through the FAF filtration layer, 10 min—feeding raw effluent into the bottom part of the FAF-R).
The heating time in the FAF-R was a function of temperature. The heating coils were activated by the thermal controller, which reacted directly to the readings from the temperature sensors within the reactors. The heating systems were activated whenever the temperature dropped below the target value of 35 °C. When the temperature sensor detected that the temperature in the reactor conformed to the target value, the power supply to the heating coils was automatically cut off. The assumed hysteresis was ±1 °C.
2.4. Analytical Methods
The chemical oxygen demand (COD), total nitrogen (TN), ammonia nitrogen (AN), total phosphorus (TP) and orthophosphates (P-PO4) in the wastewater and effluent were analyzed once every 24 h using a DR 5000 spectrophotometer (Hach, Germany). The content of total solids (TS) was determined according to the gravimetric method. Determination of the amount of biomass immobilized on the surface of magneto-active packing media was based on the gravimetric method. Before/after biomass immobilization, the mass of pure/immobilized packing media was determined. To this end, 30 weight measurements of the 10 randomly selected packing media were used. In the case of the immobilized biomass determination, the packing media was dried at 105 °C to evaporate water before weight measurement. TS of the immobilized biomass was determined by the difference between the average weight of the immobilized packing media and the average weight of the pure packing media. The titration method (Tritlab AT 1000, Hach, Germany) was used to determine the FOS/TAC ratio (volatile organic acid and buffer capacity ratio). Biogas flow rate was measured continuously using a digital gas flow meter XFM17S (Aalborg Instruments & Controls, Inc., Orangeburg, NY, USA). The biogas composition was analyzed once every 24 h using a GMF 430 m (GasData, England) and a gas chromatograph (GC, 7890A Agilent, USA) equipped with a thermal conductivity detector (TCD). The GC was fitted with two Hayesep Q columns (80/100 mesh), two molecular sieve columns (60/80 mesh) and a Porapak Q column (80/100) operating at a temperature of 70 °C. The temperature of the injection and detector ports were 150 °C and 250 °C, respectively. Helium and argon were used as the carrier gases at a flow rate of 15 mL/min.
2.5. Statistical Analysis and Optimisation Procedures
The statistical analysis of results was carried out using the Statistica 13.1 PL software package. The hypothesis of the distribution of each analyzed variable was verified using the W Shapiro-Wilk test. One-way analysis of variance (ANOVA) was used to determine the significance of differences between variables. The homogeneity of variance in the groups was analyzed using the Levene test. The HSD (Honest Significant Difference) Tukey test was used to determine the significance of differences between the analyzed variables. The statistical significance was adopted at p = 0.05.
Empirical equations were elaborated using stepwise regression with multiple regression. They allowed estimating the amount of biogas and methane depending on the characteristics of the raw sugar-industry effluent. Predictors having a significant impact on the changes in the parameters estimated in model systems were determined. Also, accuracy of models fit to empirical data was estimated via the coefficient of determination. Significance of multiple regression models was verified by the F-test. Lack-of-fit Test was conducted to evaluate whether the proposed models are sufficiently detailed. This test consisted in comparing the proposed models with full models (having other part of explanatory variables, omitted in the proposed models). The developed models were subjected to estimation. Next, their fit to the results obtained was evaluated by the analysis of residuals. The assumption of normality of residuals decomposition was verified and models’ accuracy was evaluated by deleting residual values with respect to predicted values (Statistica 13.1 PL).
3. Results and Discussion
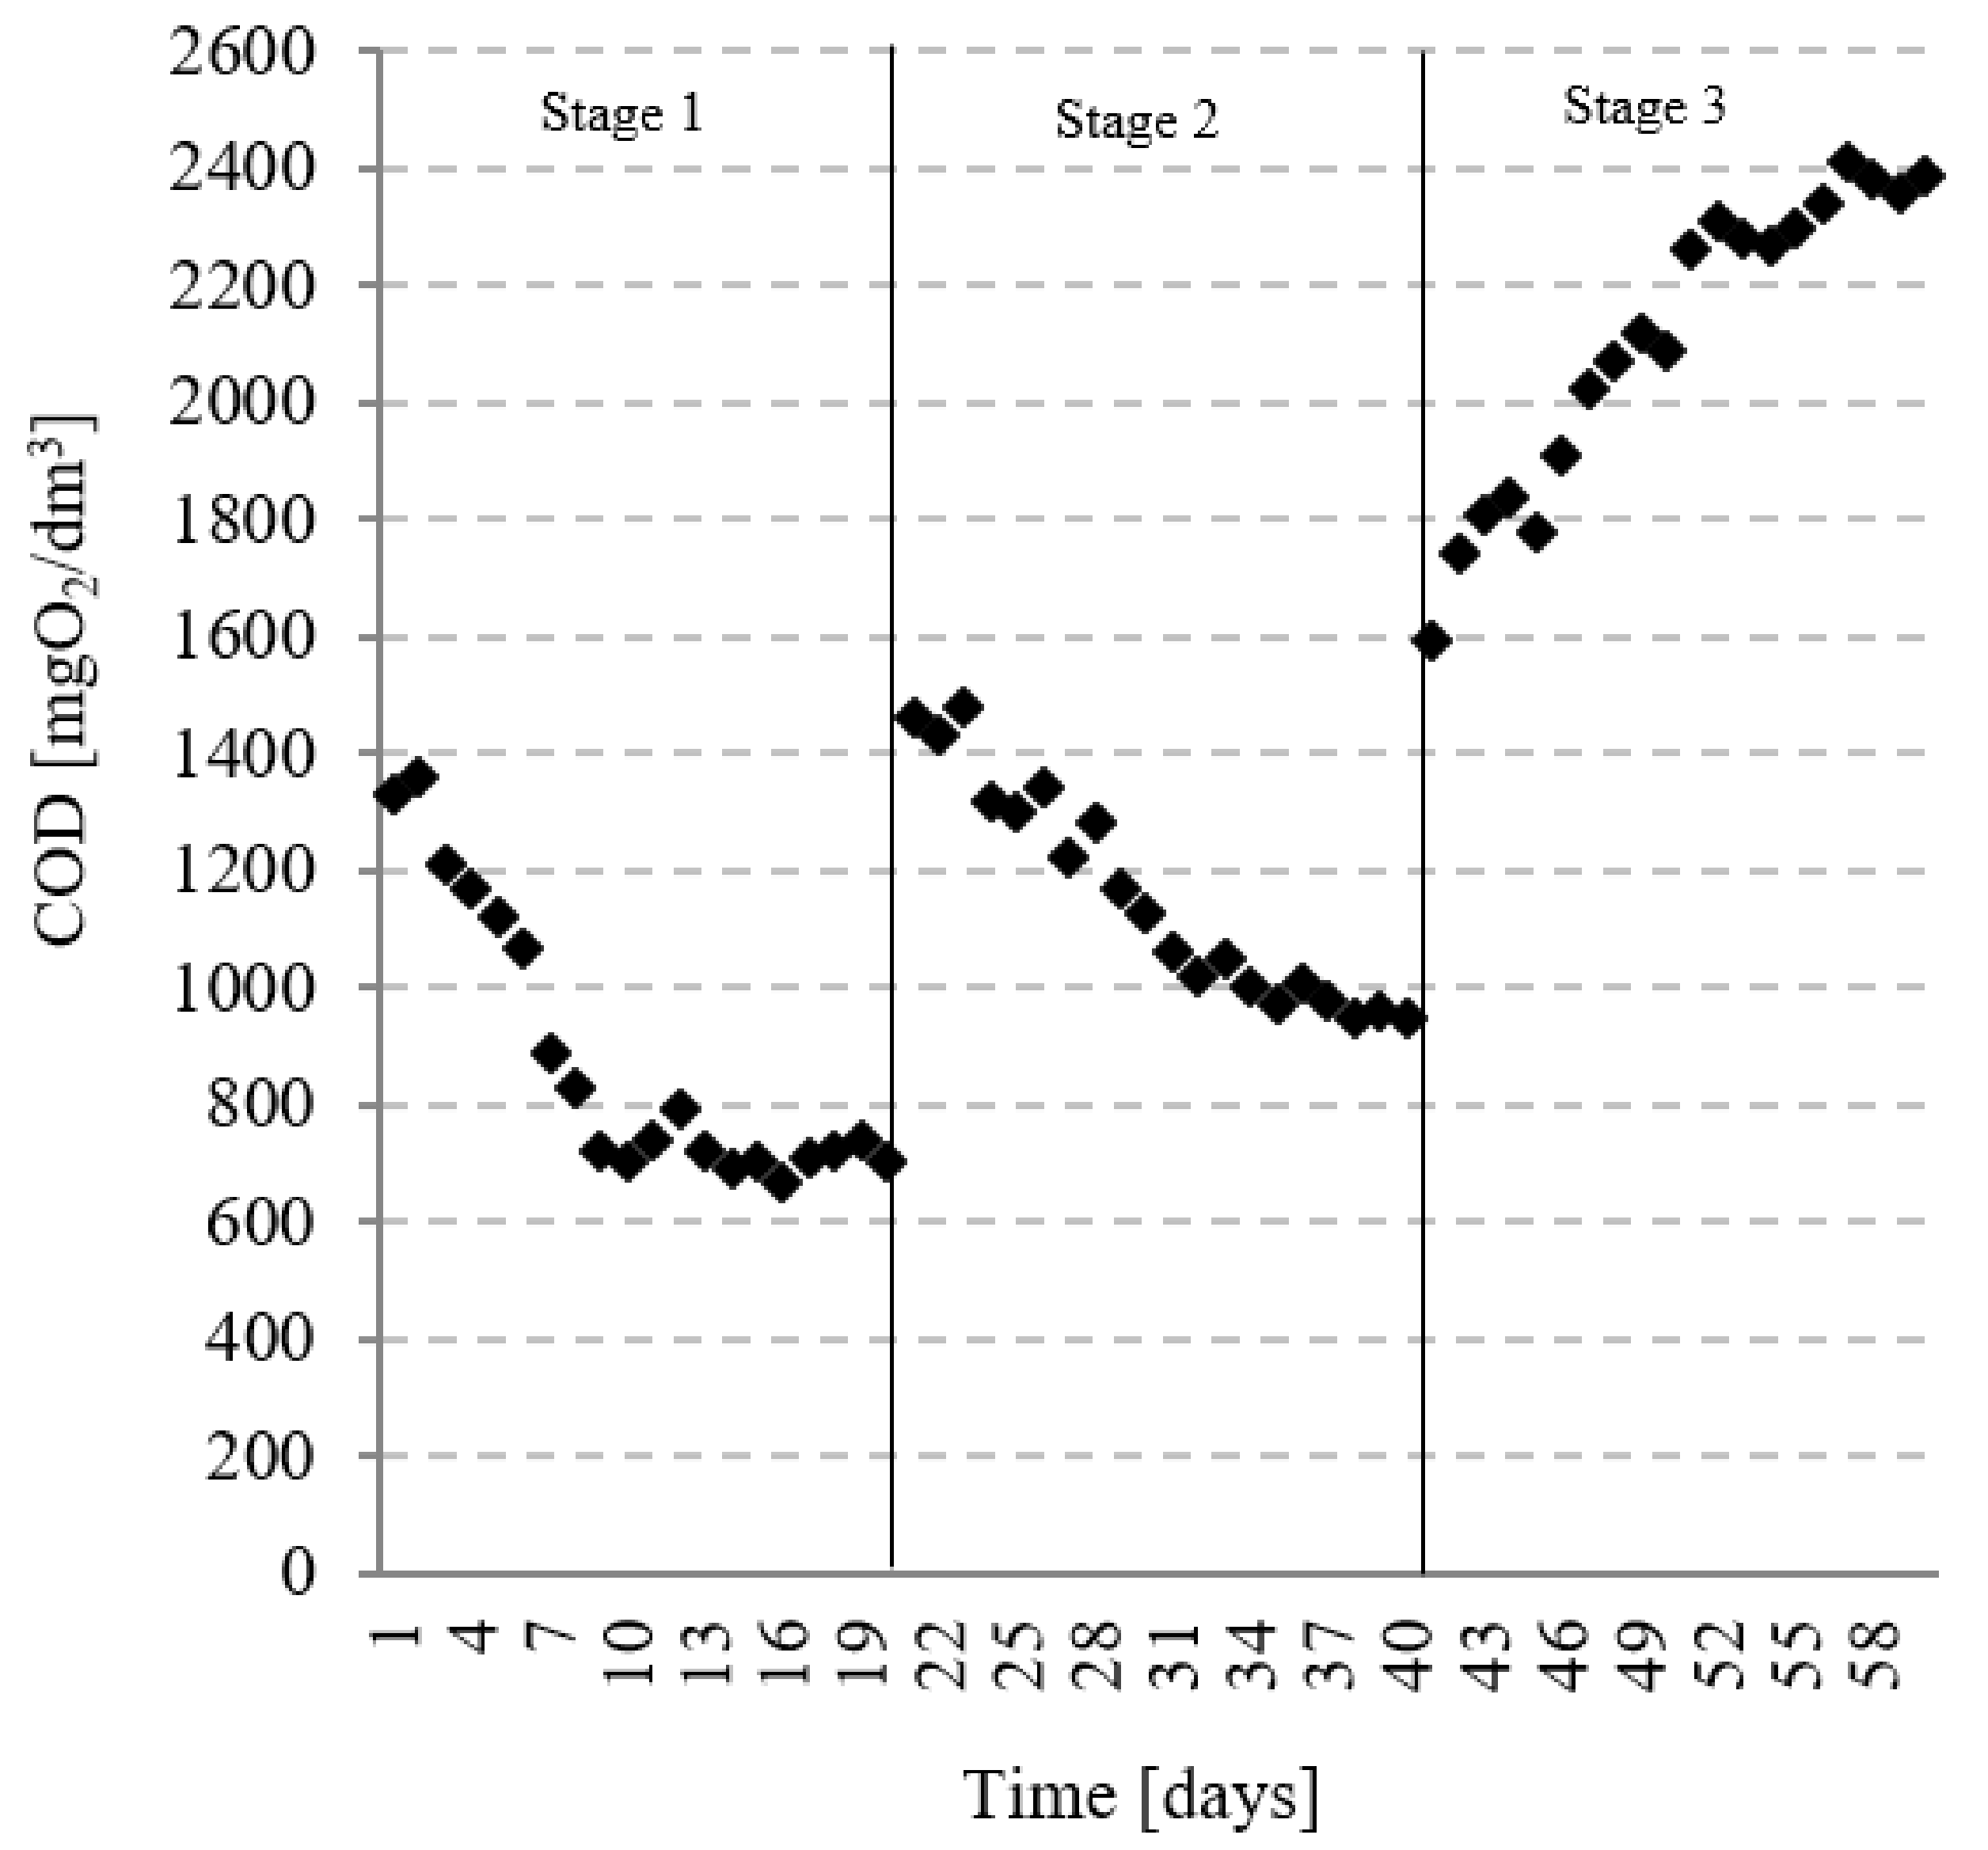
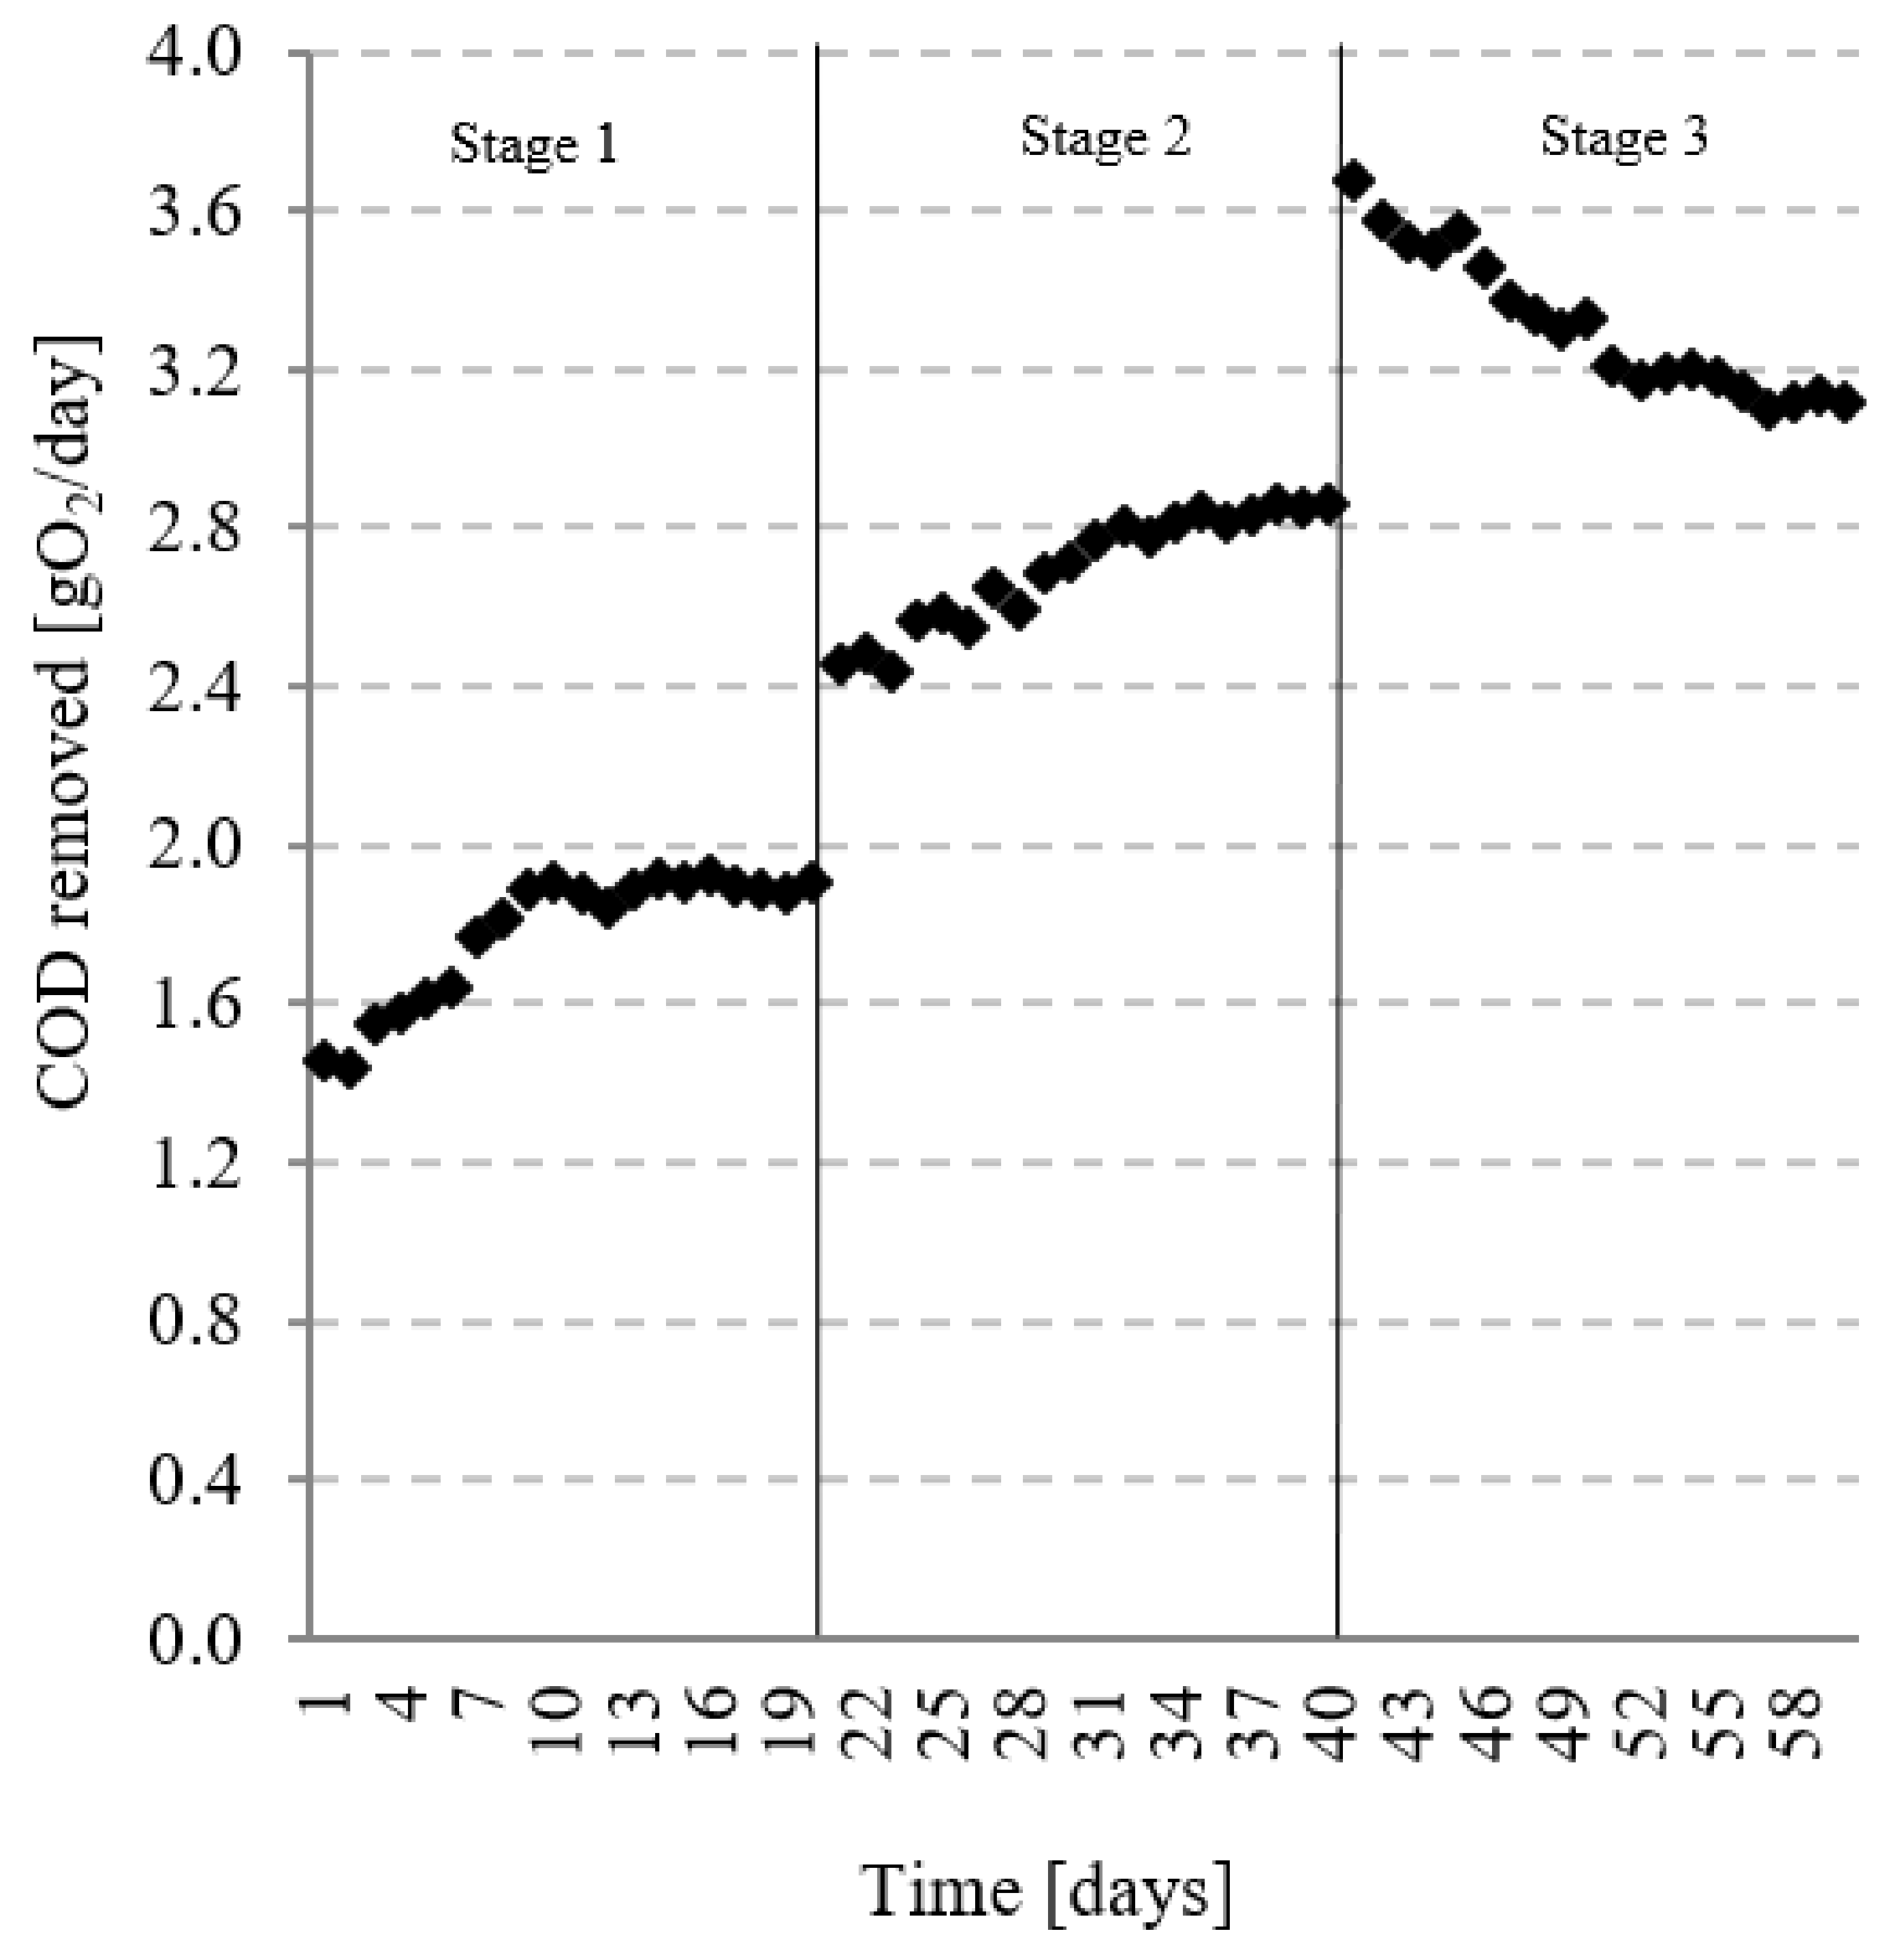
After 20 days of FAF-R operation at a load of 4.0 kg COD/m3·d, the COD at the outflow averaged 879 ± 235 mg O2/dm3 (Figure 3). The COD removal rate fluctuated around 74.1 ± 7% (Table 6) and 1.78 ± 0.17 kg COD/d of the pollution load was removed (Figure 4). The OLR increase to 6.0 kg COD/m3·d led to similar COD (p = 0.05) levels in the outflow, averaging 1141 ± 206 mg O2/dm3, with an observed removal rate of 74.9 ± 4.0% (Figure 3, Table 6). The increased OLR caused a significant (p = 0.05) spike of COD in the treated effluent. In stage 3 (6.0 kg COD/m3·d), the COD at the outflow averaged 2113 ± 255 mg O2/dm3 at a removal rate of 68.9 ± 4% (Figure 3, Table 6). The COD load removed at this stage approximated 3.30 ± 0.18 kg COD/d g (Figure 4).
The reported results regarding the sugar-industry effluent treatment through methane digestion indicate significantly higher efficiency of the technological systems currently in-use. Nacheva et al., (2009) achieved a 90% COD removal rate in a UASB reactor, with OLRs ranging from 4 to 16 kg COD/m3∙d [40]. Similarly, Hampannavar and Shivayogimath, (2010) using UASB at OLRs of 0.5–16 kg COD/m3∙d achieved a COD removal rate of 89.4% [41]. A very high OLR of 54.0 kg COD/m3∙d was used in a study by Zhang et al., (2019). The COD in the treated sugar-industry effluent was around 18,000 mg O2/dm3. In this case, the UASB reactor worked at an average efficiency of 69.2%. However, methane production halted due to a decrease in pH to 5.0 [42]. Barrera et al., (2019) presented a strategy for the start-up of UASB reactors treating sugar cane vinasse. The inflow COD ranged from 4320 to 12,690 mg O2/dm3. ORLs used in the experiment were: 3.03, 5.66, 7.34 and 10.01 kg COD/m3∙d. The COD removal rate was 72.8%, 88.8%, 80.0% and 78.0%, respectively [43]. It should be stressed, however, that all of the cited research works used UASB reactors, in which the presence of granulated sludge is a typical feature. Such reactors, apart from their many clear advantages, also have many flaws and limitations, such as the need to pre-treat wastewater and remove suspensions, fatty compounds and minerals by means of filtration, flotation, coagulation and sedimentation [44]. These processes entail operational difficulties and technological complications and limit the economic efficiency of the UASB reactors. Nacheva et al., (2009) also achieved a COD concentration sufficient for the final discharge of the effluent at OLRs not higher than 4 kg COD/m3∙d [40]. Another problem associated with UASB reactors is their incapability for effective nitrogen and phosphorus removal.
A study by Fito et al., (2018) showed a maximum COD removal rate of 65.1% at OLR as low as 1.0 kg COD/m3∙d. The experiments were carried out in a biphasic high-rate reactor, which was fed with sugar-industry effluent mixed with distillery effluent. The process failed to produce target pollutant removal levels [45]. In turn, Farhadian et al., (2007) used a Wxed upXow (UAFB) anaerobic source on a pilot scale. The inflow COD ranged from 2000 to 8000 mg/dm3. At these conditions, the maximum organic content reduction rate ranged from 75% to 93% [5].
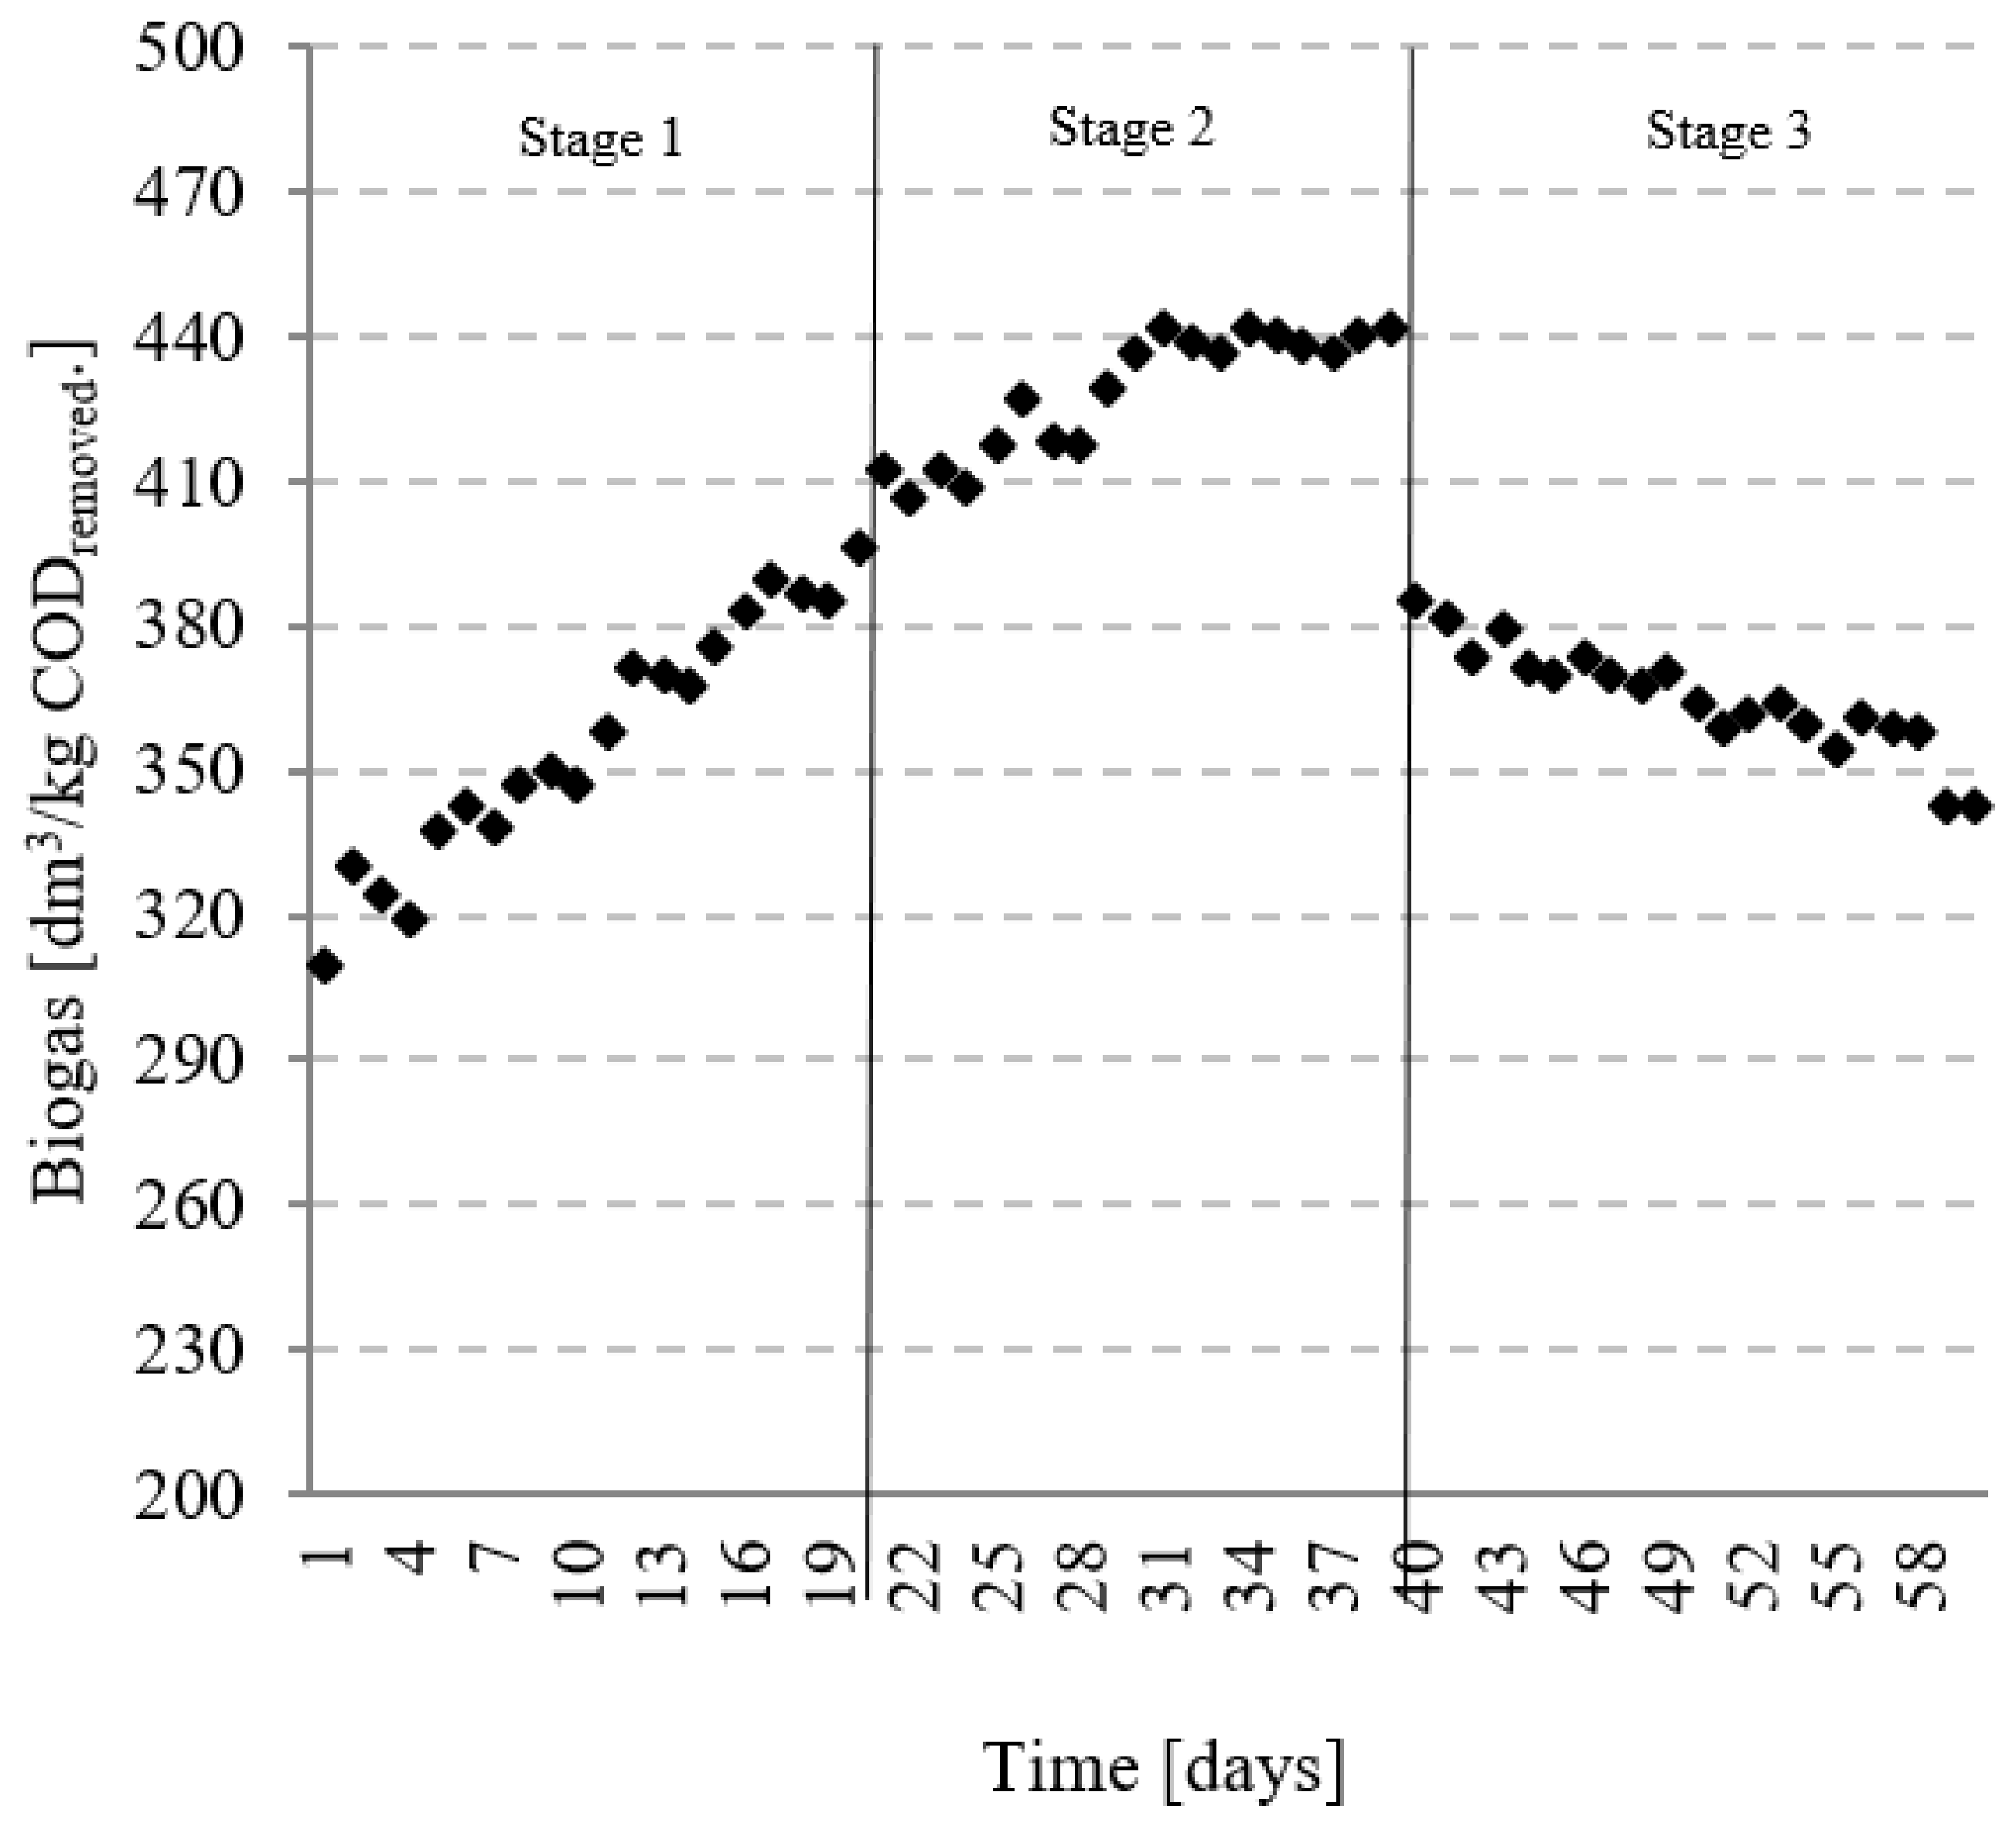
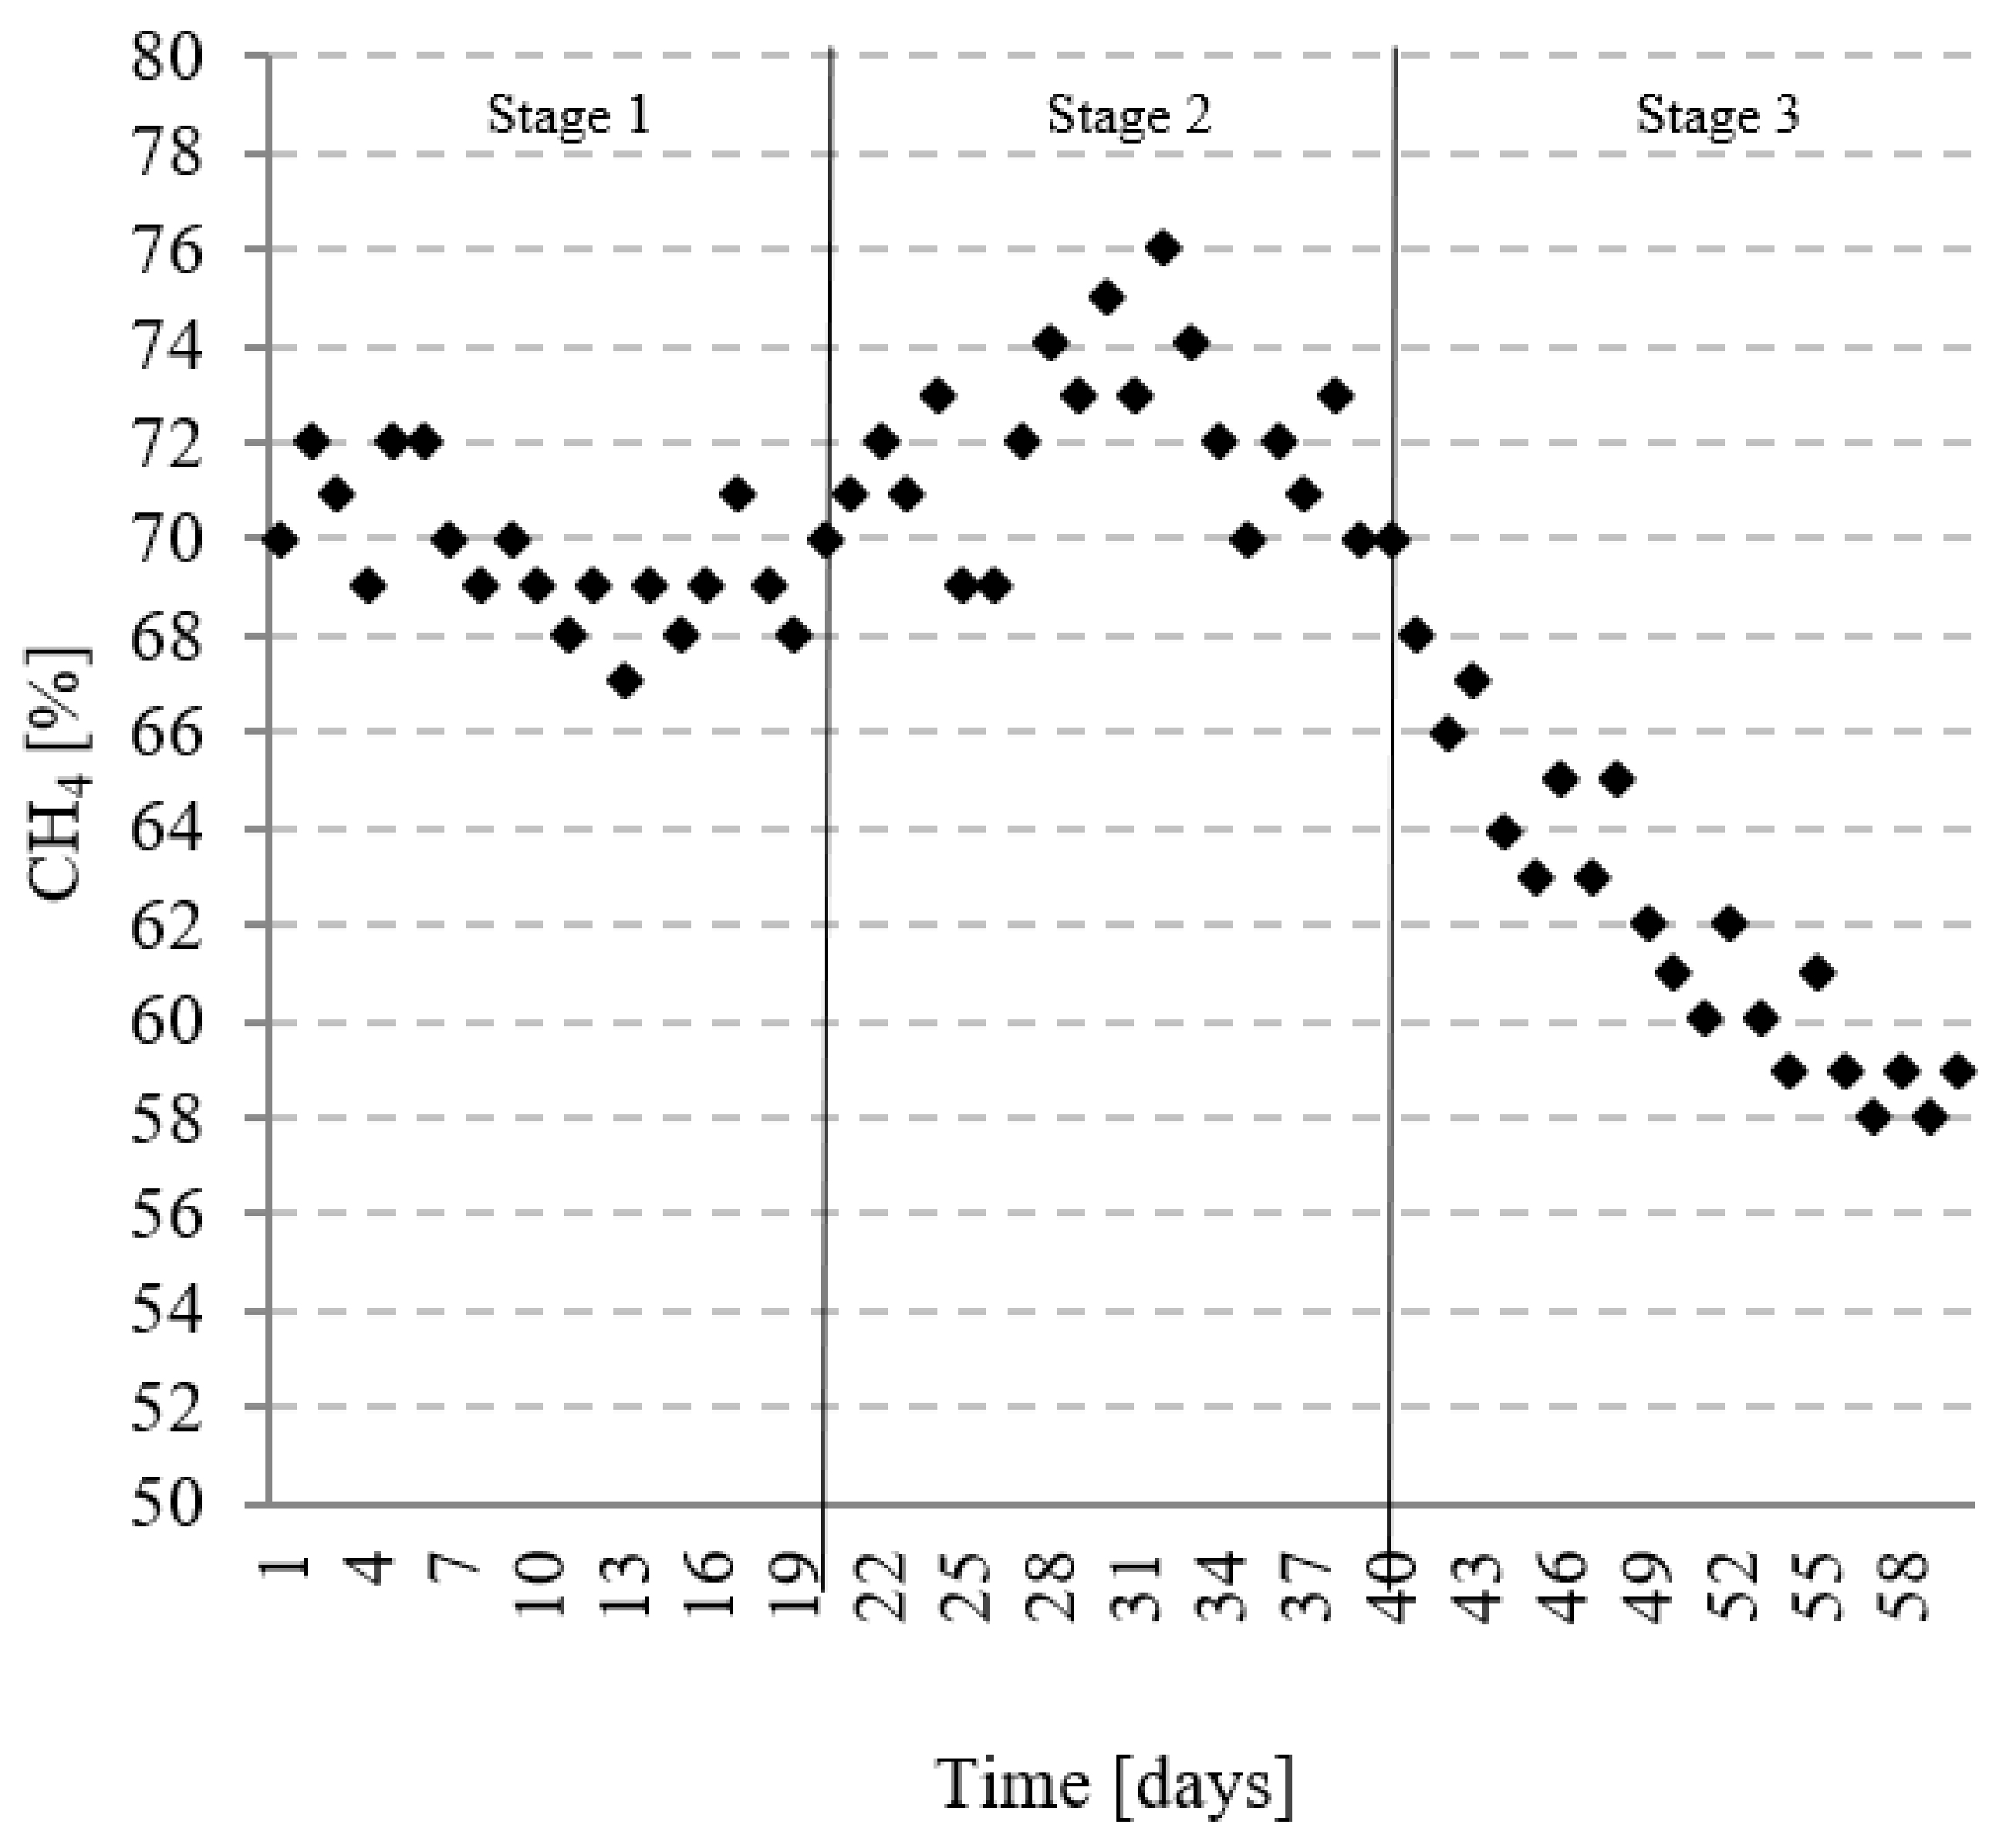
The biogas yield at stage 1 was 638 ± 98 dm3/d and 356 ± 25 dm3/kg CODremoved (Figure 5) with CH4 content at 69.6 ± 1.4% (Table 6, Figure 6). Increasing OLR to 6.0 kg COD/dm3·d led to a sharp spike in biogas yields, reaching 1134 ± 127 dm3/d and 427 ± 14 dm3/kg CODremoved (Table 6, Figure 5). The process parameter change did not influence (p = 0.05) the methane level, which reached 72.0 ± 1.9% (Table 6). At an OLR of 8.0 kg COD/m3·d, the methane level decreased to 61.9 ± 3.1%, as did the one-time biogas yields, with 364 ± 11 dm3/kg CODremoved (Figure 5).
Biogas yields and methane contents obtained in the FAF-R were higher than the literature data. Nacheva et al., (2009) achieved biogas yields ranging from 294 to 416 dm3/kg CODremoved, with methane contents of 61.1% to 65.3% [40]. The most successful process of the ones examined by Hampannavar and Shivayogimath, (2010) yielded 325 dm3/kg CODremoved. The methane content in the biogas ranged from 73% to 82% [41]. In another study, Barrera et al., (2019) achieved 331.4 dm3 CH4/kg CODremoved at an OLR of 7.34 kg COD/m3∙d [43]. The higher biogas and methane yields, in comparison to those presented in the literature, may be explained by the use of the innovative active filling (FAF) with neodymium magnets and metal additives. Studies to date have shown that a steady magnetic field (SMF) promotes the metabolic activity of microorganisms. Ji et al., (2010) examined the effect of SMF on biological effluent treatment [46]. As the magnetic field intensity increased within the range of 0 to 20 mT, so did the activity of the activated sludge microbiota. The optimal effluent temperature and pH ranges were 20.0–40.0 °C and 6.0–10.0, respectively. According to Ji et al., (2010), at optimal magnetic flux level not exceeding 17.8 mT stimulates microbial metabolism, thereby improving treatment efficiency [46]. In turn, fluidized bed reactors were used by Liu et al., (2009) to examine steady alcohol fermentation [47]. Higher ethanol yields were demonstrated after MF stimulation of S. cerevisiae conversion processes. At an intensity of MF 95–110 Oe and starting glucose level of 90 g/dm3, the highest ethanol yields were achieved at the content of magnetically active particles ranging from 26% to 41% (v/v). Increasing the content of magnetically active particles in the bioreactor beyond 51% (v/v) lowered digestion efficiency [47]. According to the authors’ own research, the optimum magnetic properties in the operated reactor were achieved after magnets were installed in 25% of the pipe fittings were, as evidenced by previous research [39].
The literature indicates that the use of metal dissolving technology promotes methane production [35,48]. According to the authors’ own research, using neodymium magnets in FAF components improves biogas production and efficiency. The metal catalysts, such as the zero-valent iron, are electron-donors for methanogenic and denitrifying bacteria [49]. Under anaerobic conditions, iron corrosion is triggered by gaseous H2 and the formed CO2 is reduced to CH4 by hydrogenotrophic methanogens, such as Methanococcus thermolithotrophicus, Methanobacterium thermoautotrophicum or Methanospirillum hungatei [50]. Zhang et al., (2011) used a UASB reactor fitted with steel elements and achieved a methane content of 66.8%. However, in the UASB reactor without such elements, the methane content was only 47.9% [37]. Similarly, Shi et al., (2011) used iron nanoparticles to augment a UASB reactor. The biogas yields and methane levels produced increased by 12.9%–17.9% and 10.7%–12.9%, respectively [35]. Lee and Shoda, (2008) corroborated the positive impact of metals on the enrichment and purification of biogas. The iron addition at 6–8 g/dm3 increased methane content to 60% [51].
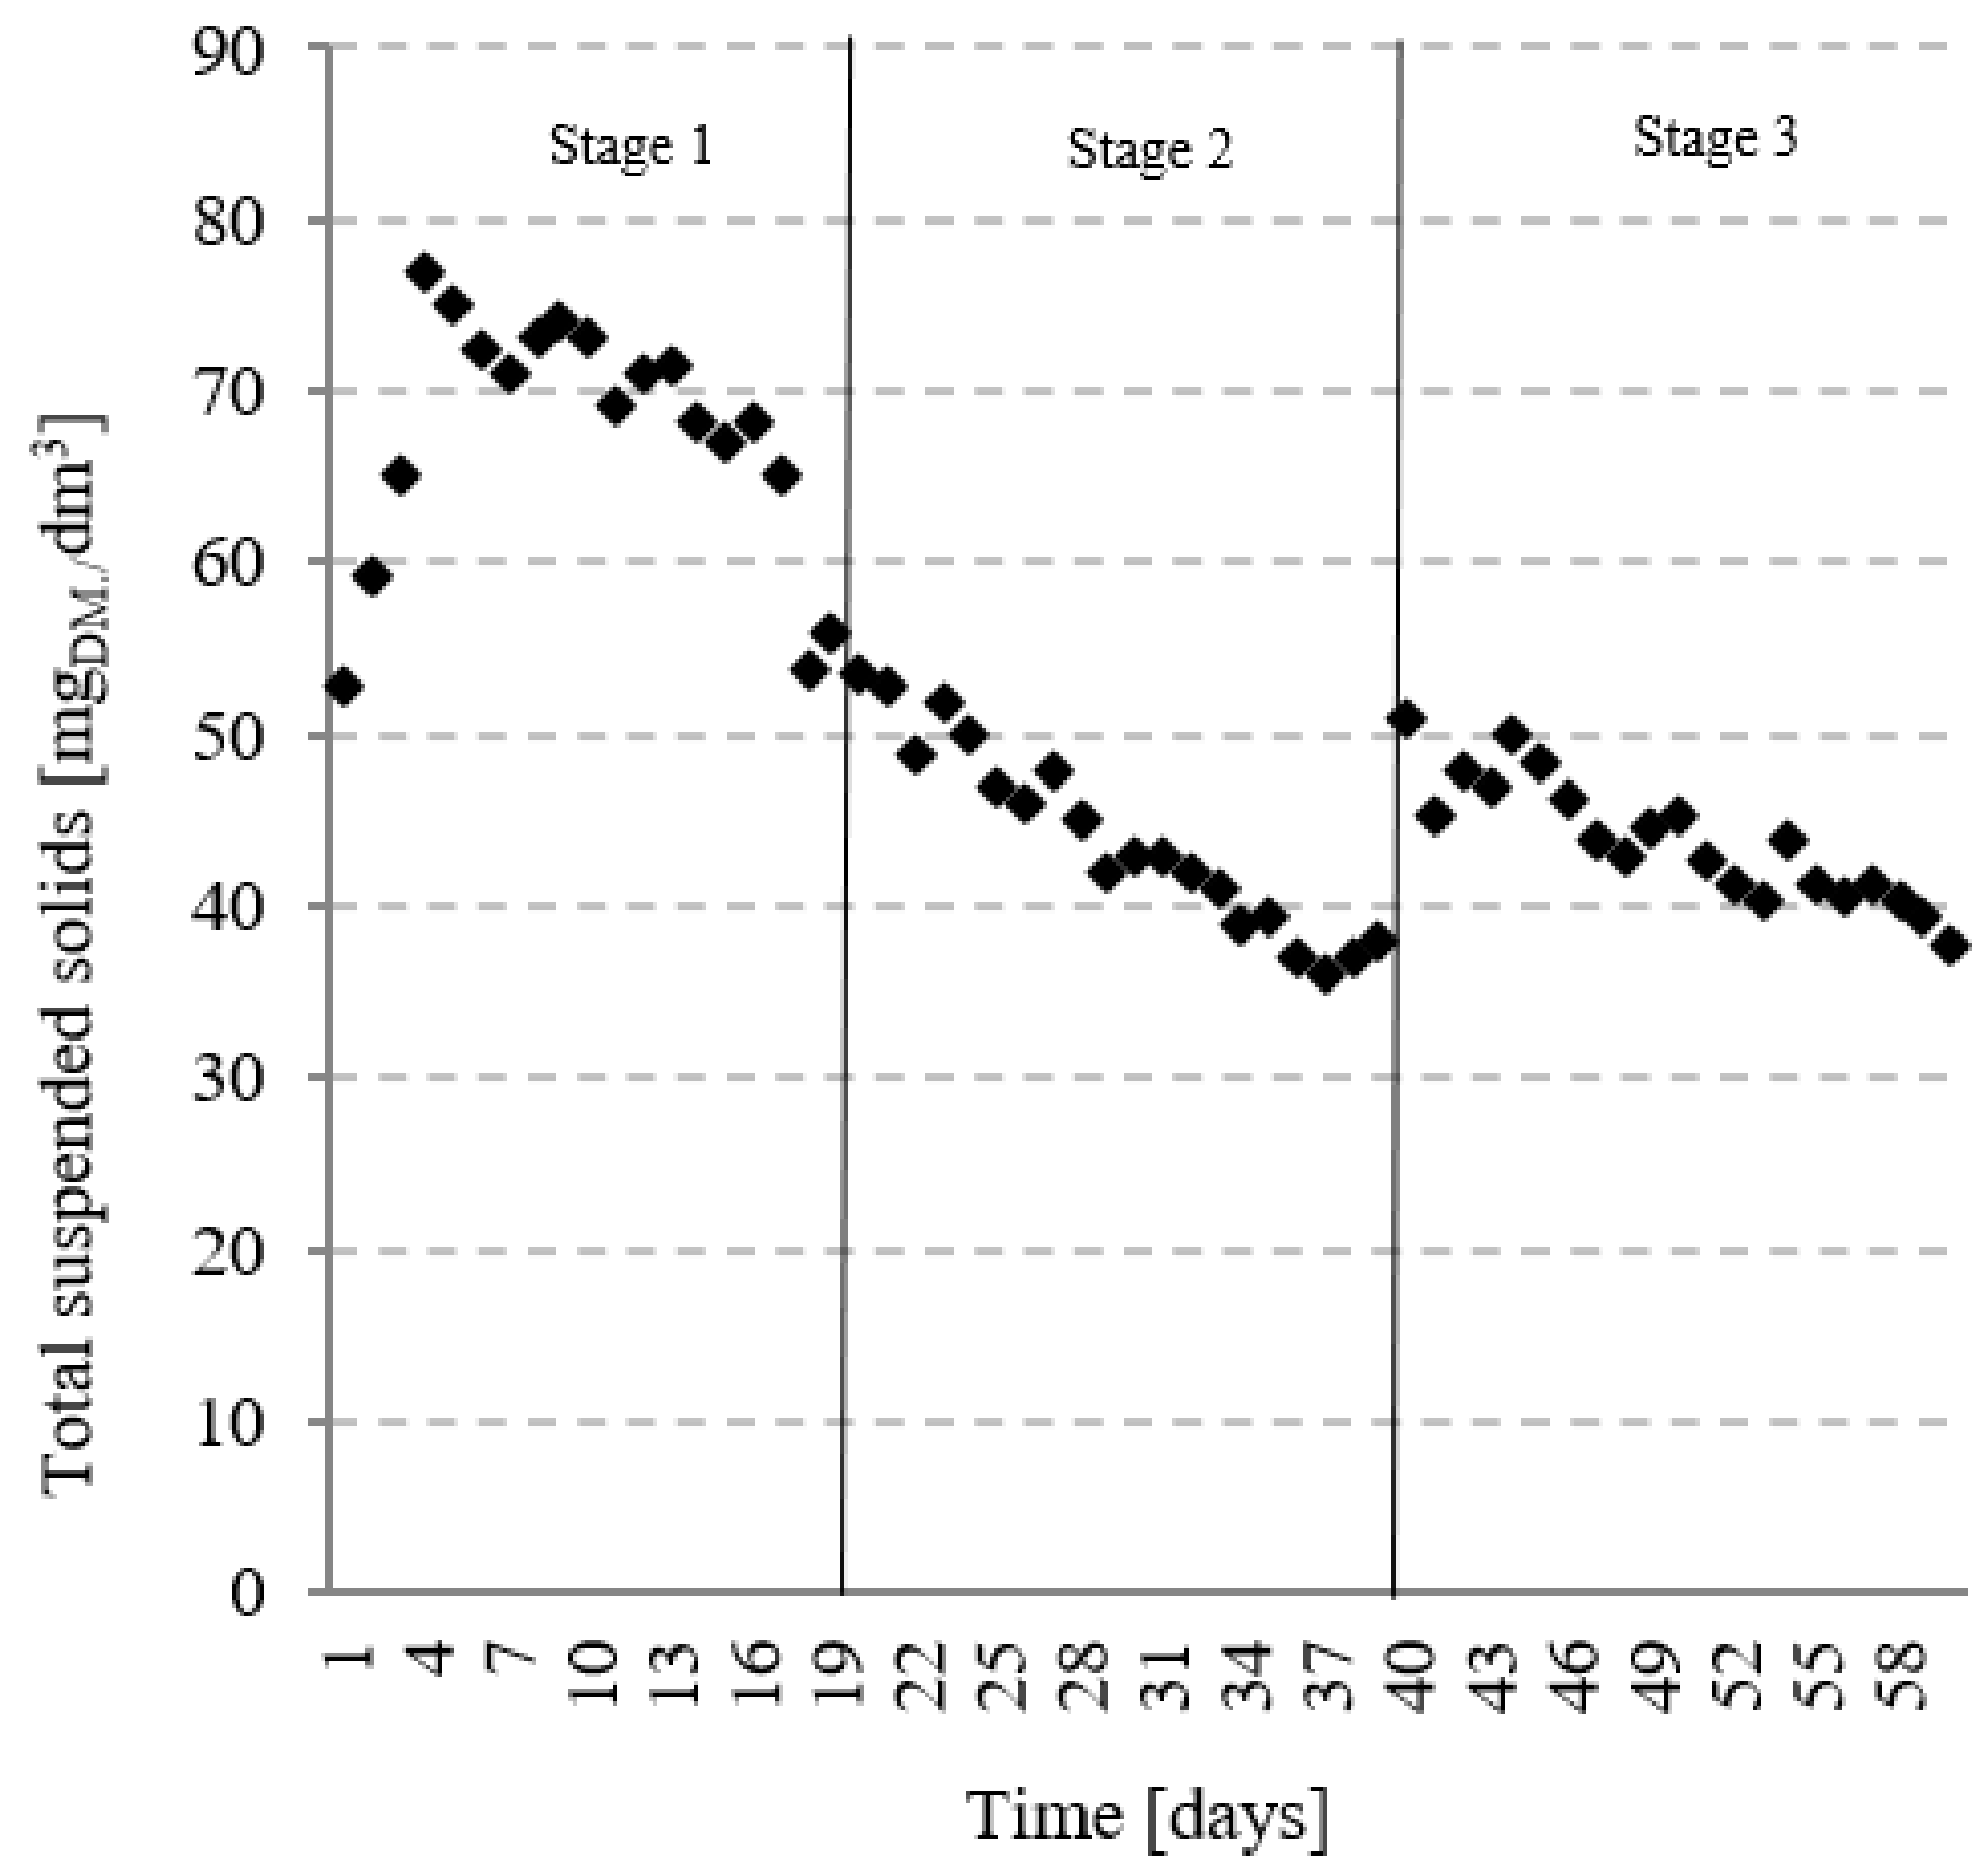
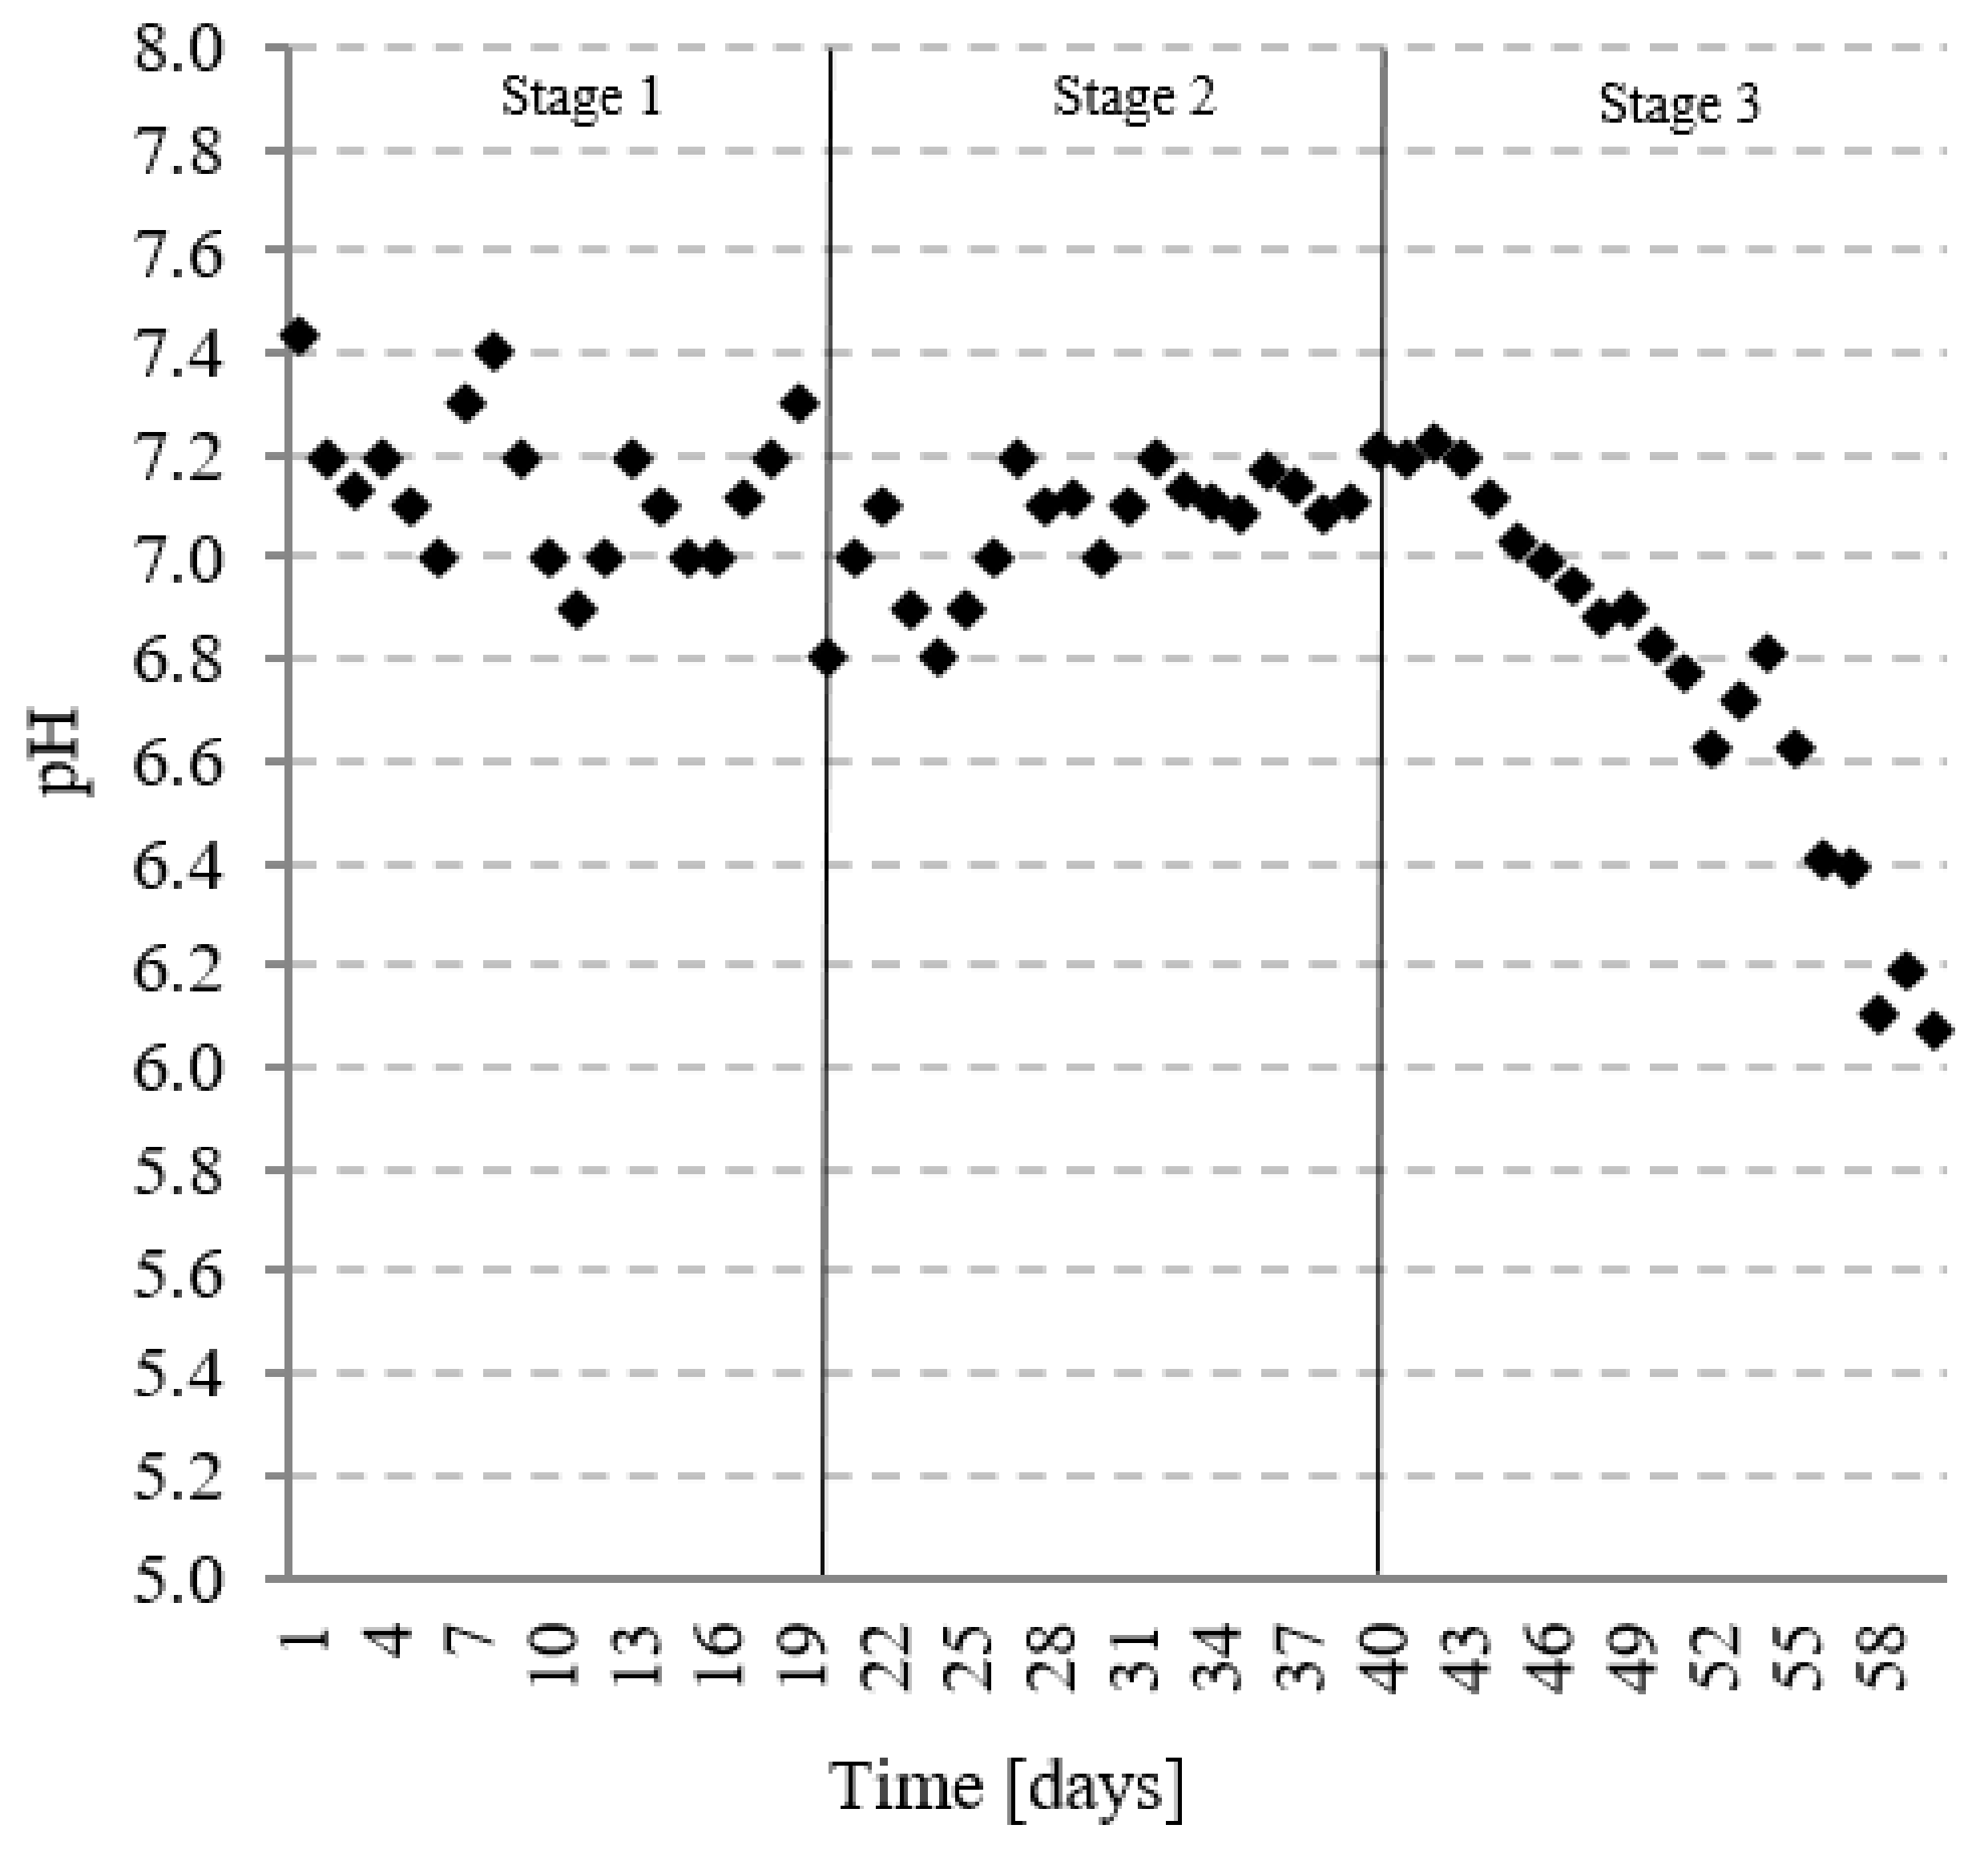
The content of total suspended solids in FAF-R outflow at the load 4.0 kg COD/m3·d varied significantly. During the first four days of operation, the value of this pollution indicator increased from 53 mg DM/dm3 to 78 mg DM/dm3 (Figure 7). In the following days, the value started progressively decreasing, reaching 33 ± 2 mg DM/dm3 on day 20 (Figure 7). The average content of total suspended solids in the FAF-R outflow at this stage was 67 ± 7 mg DM/dm3 (Table 6). Systematic increases of OLR from 6.0 kg COD/m3·d to 8.0 kg COD/m3·d caused no significant changes in its values, which varied between 43 ± 3 mg DM/dm3 and 44 ± 6 mg DM/dm3 (Table 6, Figure 7). When the FAF-R was running at OLRs of 4.0 to 6.0 kg COD/m3·d, the observed pH ranged from pH 7.05 ± 0.22 to pH 7.13 ± 0.16 (Table 6, Figure 8). A significant (p = 0.05) decrease of the average value of this parameter to pH 6.75 ± 0.18 was noted after increasing the OLR to 8.0 kg COD/m3·d (Table 6).
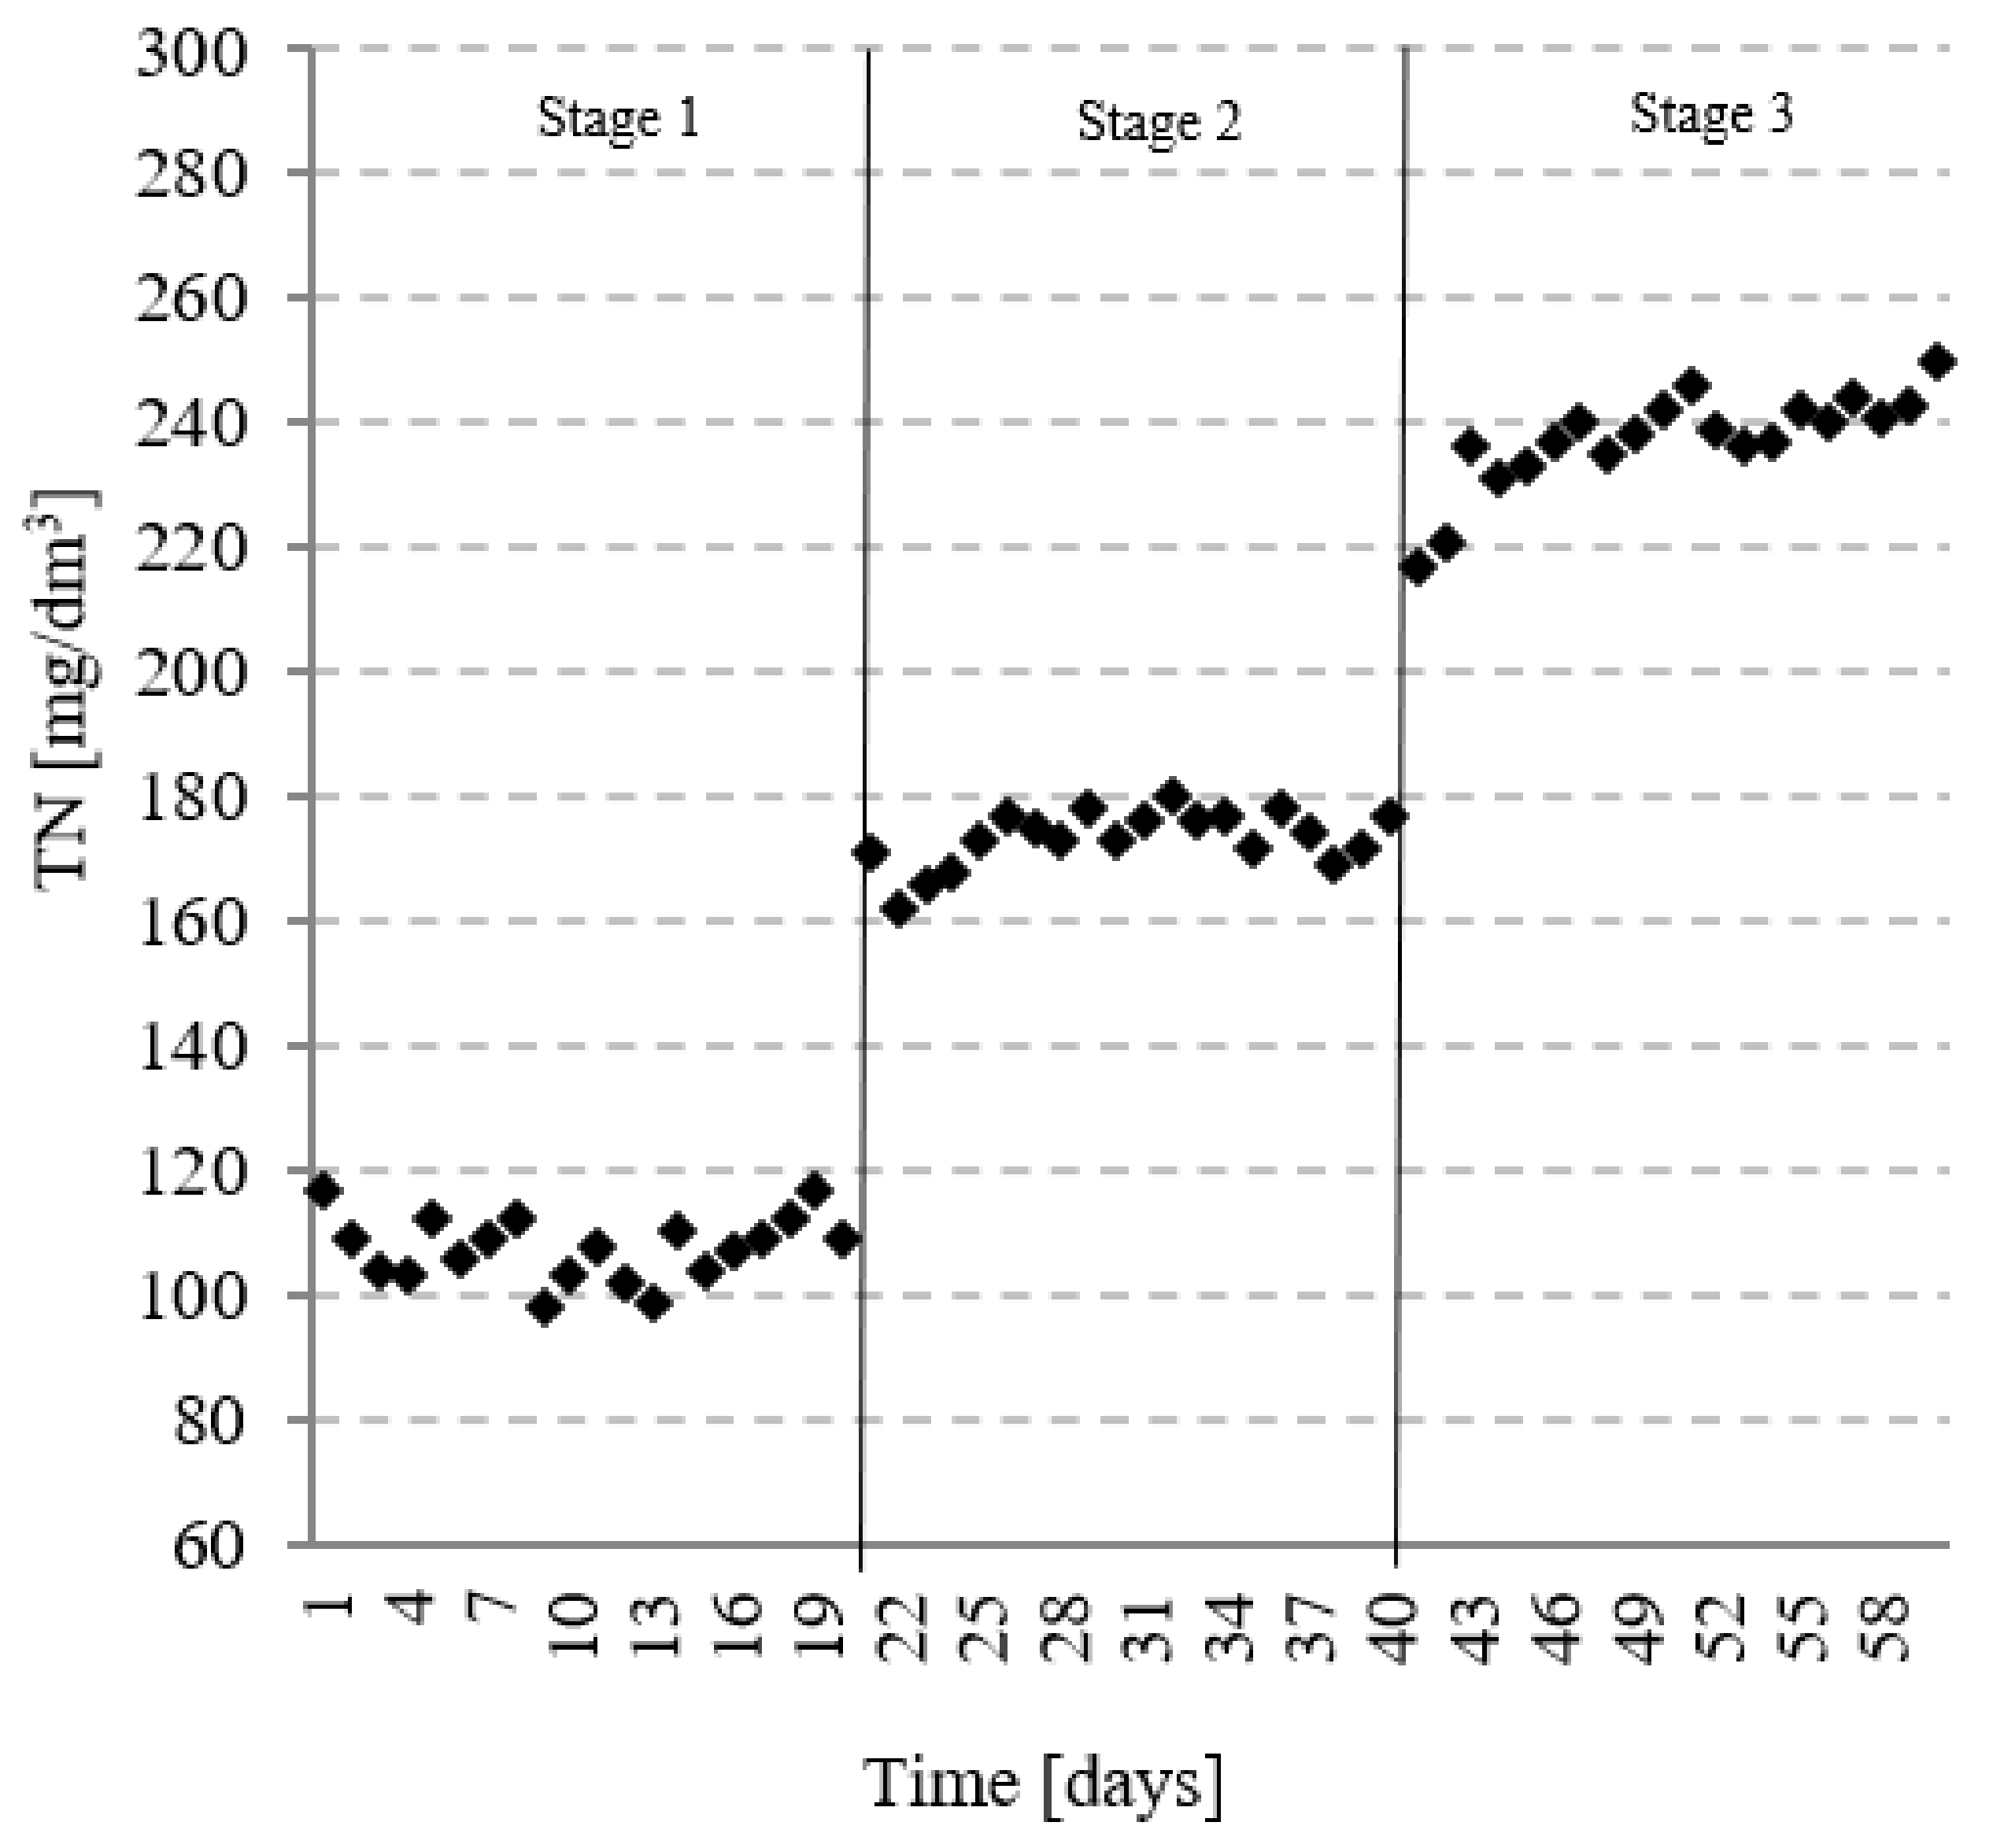
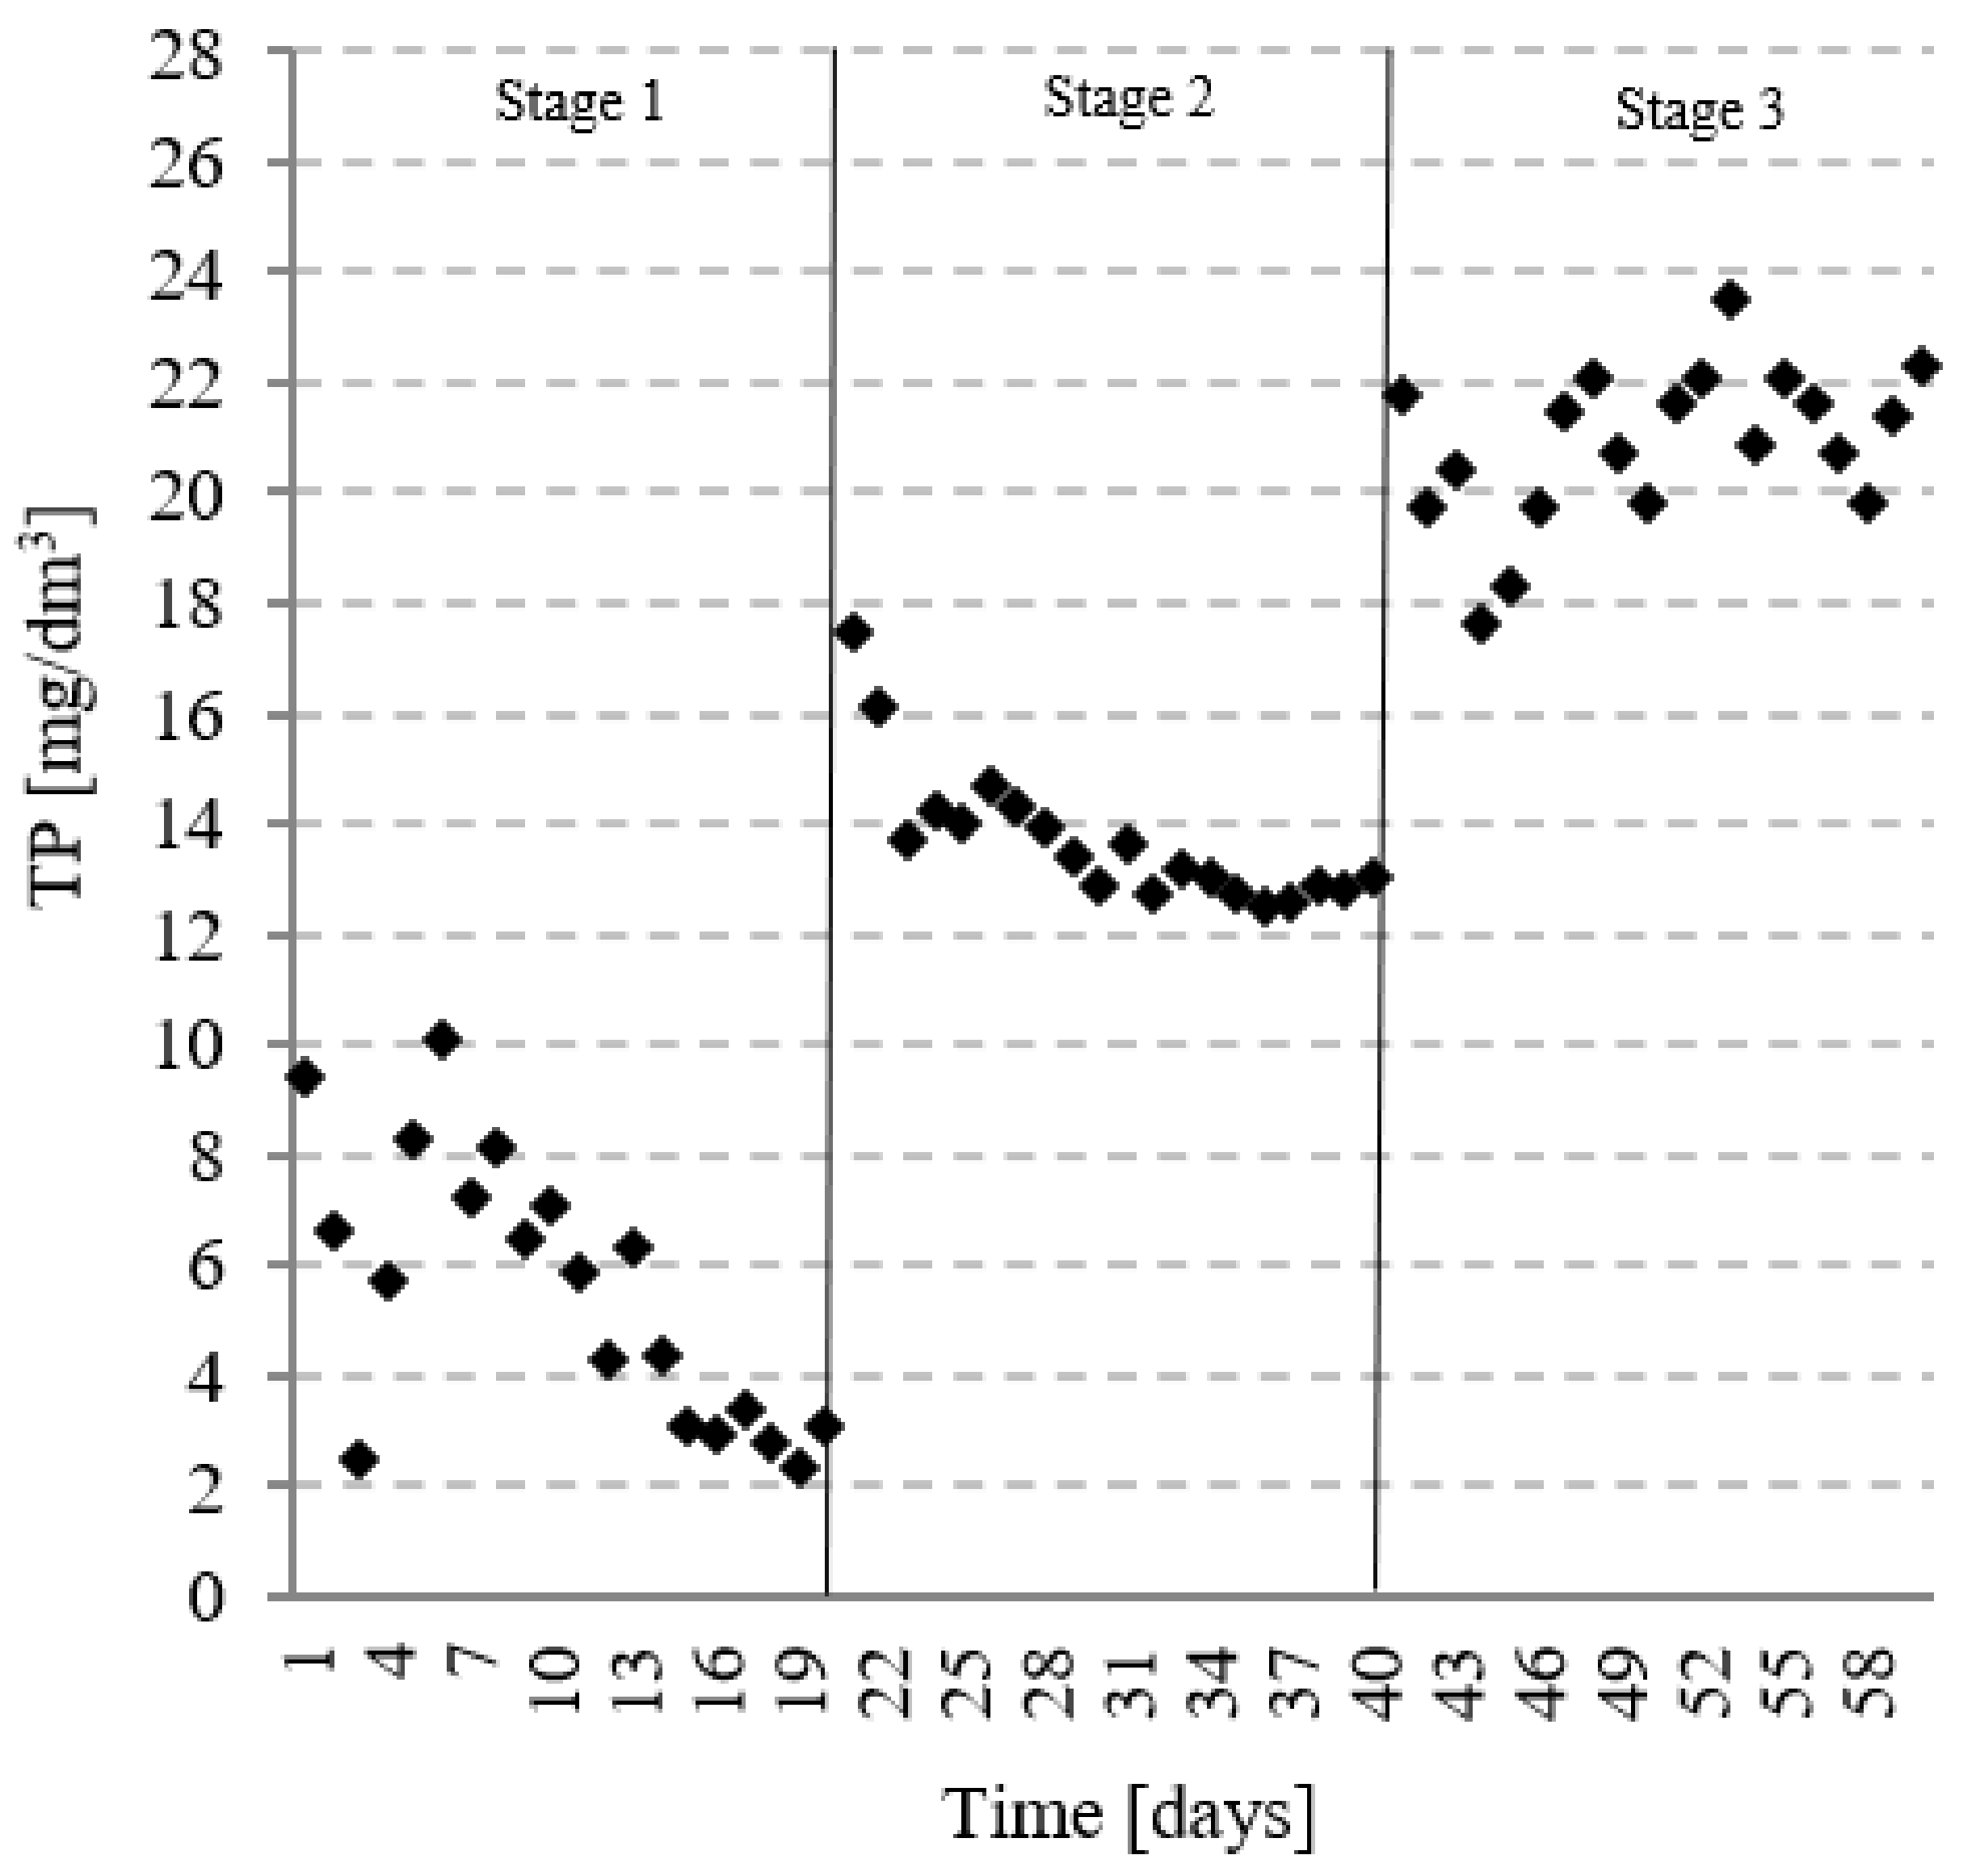
The nitrogen removal rate ranged from 17.3 ± 4.0% in stage 1 to 8.7 ± 3.0% in stage 3 (Table 6). The concentration observed in the outflow from R-FWA was 107 ± 5.0 mg/dm3 for OLR-kg COD/m3·d and increased proportionally with the increasing OLR up to 237 ± 7.7 mg/dm3 (Figure 9). Because the treated effluent was discharged from the reactor through the AF filtration layer, where biological binding and chemical sorption took place, very high phosphorus removal rates were noted throughout the experiment (Table 6, Figure 10). In stage 1, the rate was 81.2 ± 8.2%, leading to a concentration of 5.5 ± 2.4 mg/dm3 in the outflow (Figure 10). When the FAF-R was running at OLRs of 6.0 to 8.0 kg COD/m3·d, the observed phosphorus removal rates were significantly lower (p = 0.05) and ranged from 69.8 ± 5.4% to 64.4 ± 2.4% (Table 6). The observed treated effluent concentrations were 13.2 ± 2.7 mg/dm3 in stage 2 and 20.9 ± 1.4 mg/dm3 in stage 3 (Figure 10).
In the present study, the innovative active substances with metal additives fed into anaerobic reactors led to efficient phosphorus removal (64.4 ± 2.4–81.2 ± 8.2%) and elimination of suspended solids. Many researchers indicate that metal corrosion stimulates the biochemical degradation of organic compounds through the modification of anaerobic conditions within the reactor, by means of reducing the redox potential and increasing buffer capacity [37,49,50]. It also enhances the abiotic processes of contaminant removal, because the formed colloids help eliminate the organic suspended solids in flocculation, adsorption and precipitation reactions [52]. Also significant is the formation of insoluble vivianite compounds through a reaction between metals and phosphates, leading to lower phosphorus levels in the treated effluent [35]. Removal of phosphorus compounds using metal dissolution is based on similar premises as the electrocoagulation method. However, metal ions are introduced into the wastewater as a result of spontaneous corrosion process and after transformations in the wastewater environment become responsible for the removal of phosphates. The best results were observed under anaerobic conditions using steel fillings [53]. When steel is exposed to wastewater, the electrochemical and biological corrosion process became very intensive. Iron corrosion in an anaerobic conditions produces iron ions in the form of Fe2+ [54]. In the next stage, in the process of coagulation and adsorption, phosphor is bound to the chemical compound Fe3(PO4)2 on the surface of saline filling [55]. A similar process may promote nitrogen removal through the formation of complexes with metal ions. However, no increased TN removal was observed in the present study.
Phosphorus recovery has received increasing attention as the phosphate rock resources deplete and the need for finding a replacing source of phosphorus becomes ever more important [56]. At the same time, a great amount of sewage sludge is disposed of by using methods that do not ensure the sustainable recycling of the nutrients bound in the sludge [57]. Furthermore, as the most economical way to dispose the sludge, the agricultural use, appears to be increasingly restricted, new technologies are needed to recover phosphorus from sludge and to process it into a suitable form for fertilizing purposes [58]. A number of methods has been developed to recover phosphorus from the sludge and to convert it to a reusable form. Most implementation cases in full scale are based on the largely researched technologies: the crystallization or precipitation of phosphorus as calcium phosphate or struvite [59,60]. However, these technologies can only reach the recovery efficiency of 50 to 60% of total phosphorus [61]. Methods with higher recovery potential are typically wet chemical [62].
Empirical equations were elaborated by multiple regression and they allowed estimating the biogas and the methane potentials as a result of methane digestion of sugar-industry effluent in a reactor with fluidized active filling (FAF). It was stated that such variables as: OLR, total nitrogen and total phosphorus in the raw effluent statistically significantly influenced the production of biogas. Meanwhile, statistically significant changes in methane production were influenced by: OLR, ammonia nitrogen and total phosphorus. Biogas estimation model (1) is characterized by an estimation error on the level of ±136.04 and reflects ca. 76.99% of changes in the process of biogas generation (coefficient of determination R2 = 0.7699). Methane estimation model (2) reflects ca. 80.84% of changes in the process of biogas generation (coefficient of determination R2 = 0.8084) with an estimation error on the level of ±140.03. The developed models were subjected to estimation. Normality of residuals decomposition was verified along with the correctness of biogas and methane models.
where BIOGAS—daily biogas production [dm3/d]; METHANE—daily CH4 production [/d]; OLR—organic load rate in the digesters [kg COD/m3 d]; TN—total nitrogen concentration [mg N/dm3]; TP—total phosphorus concentration [mg P/dm3]; N–NH4—ammonia nitrogen [mg N–NH4/dm3].
4. Conclusions
Effluent treatment technologies based on methane fermentation have been gaining great recognition among operators in recent years. Unfortunately, their wide take-up is hampered by their many limitations. One disadvantage of the fermentation methods is that the anaerobic process is characterized by low nitrogen and phosphorus removal rates and difficulties with separating treated effluent from the fermentation microflora. This precludes anaerobic reactors from being used to produce final discharge-ready water. As such, it is necessary to identify solutions that would counteract these limitations of fermentation reactors. One of the potential solutions is offered by the active filling.
Within the studied OLR range of 4.0–6.0 kg COD/m3·d, the COD removal rate was higher than 74%, leading to a concentration of 879 ± 235 to 1141 ± 206 mg O2/dm3 in the outflow. At these experimental stages, the methane content in the biogas was around 70%. Increasing OLR to 6.0 kg COD/m3·d led to a significant reduction in the observed results of methane digestion of the sugar-industry effluent. The COD at the outflow increased and averaged 2113 ± 255 mg O2/dm3 at a removal rate of 68.9 ± 4%. A lower by 10% methane content in the biogas were also observed, reaching 61.9 ± 3.1%. Decreased effluent treatment and methane fermentation efficiencies were correlated with an observed pH decrease to 6.75 ± 0.18 and the FOS/TAC ratio increase to 0.44 ± 0.2.
It was shown that the use of FAF-R could improve phosphorus removal rates. The process efficiency ranged from 64.4 ± 2.4 to 81.2 ± 8.2% at different stages. The regime of operation and filtering the treated effluent through a magnetically-active filling layer also led to low levels of total suspended solids in the treated effluent.
Author Contributions
Conceptualization, data curation, formal analysis, funding acquisition, investigation, methodology, project administration, resources, software, supervision, validation, visualization, M.D. and M.Z.; writing—original draft preparation, M.D.; writing—review and editing, M.D. and M.Z. All authors have read and agreed to the published version of the manuscript.
Funding
The manuscript was also supported by “Project financially co-supported by Minister of Science and Higher Education in the range of the program entitled “Regional Initiative of Excellence” for the years 2019–2022, Project No. 010/RID/2018/19, amount of funding 12,000,000 PLN.”
Conflicts of Interest
The authors declare no conflict of interest.
Abbreviations
| FAF | fluidized active filling |
| FAF-R | fluidized active filling reactor |
| OLR | organic load rate (kg COD/m3·d) |
| HRT | hydraulic retention time [day] |
| COD | chemical oxygen demand [mg O2/dm3] |
| BOD5 | biological oxygen demand [mg O2/dm3] |
| FOS/TAC | volatile organic acid and buffer capacity ratio |
References
- Ahmed, E. Assessment of the Liquid and Solid Waste from EL Gunied Sugar Factory. Ph.D. Thesis, University of Khartoum Dspace (UofK), Khartoum, Khartoum State, Sudan, 2015. [Google Scholar]
- Gondudey, S.; Chaudhari, P.K. Treatment of Sugar Industry Effluent Through SBR Followed by Electrocoagulation. Sugar Tech 2020, 22, 303–310. [Google Scholar] [CrossRef]
- Sahu, O. Significance of iron compounds in chemical and electro-oxidation treatment of sugar industry wastewater: Batch reaction. Environ. Qual. Manag. 2019, 29, 113–123. [Google Scholar] [CrossRef]
- Fito, J.; Tefera, N.; Kloos, H.; Van Hulle, S.W.H. Physicochemical Properties of the Sugar Industry and Ethanol Distillery Wastewater and Their Impact on the Environment. Sugar Tech 2019, 21, 265–277. [Google Scholar] [CrossRef]
- Farhadian, M.; Borghei, M.; Umrania, V.V. Treatment of beet sugar wastewater by UAFB bioprocess. Bioresour. Technol. 2007, 98, 3080–3083. [Google Scholar] [CrossRef] [PubMed]
- Lettinga, G.; Hulshoff Pol, L.W. UASB-process design for various types of wastewaters. Water Sci. Technol. 1991, 24, 87–107. [Google Scholar] [CrossRef]
- Pradeep, N.V.; Anupama, S.; Kumar, J.M.A.; Vidyashree, K.G.; Lakshmi, P.; Ankitha, K.; Pooja, J. Treatment of sugar industry wastewater in anaerobic downflow stationary fixed film (DSFF) reactor. Sugar Tech 2014, 16, 9–14. [Google Scholar] [CrossRef]
- Hamoda, M.F.; Al-Sharekh, H.A. Sugar wastewater treatment with aerated fixed-film biological systems. Water Sci. Technol. 1999, 40, 313–321. [Google Scholar] [CrossRef]
- Sharma, S.; Simsek, H. Sugar beet industry process wastewater treatment using electrochemical methods and optimization of parameters using response surface methodology. Chemosphere 2020, 238, 124669. [Google Scholar] [CrossRef]
- Fernandez-Rodríguez, J.; Perez, M.; Romero, L.I. Temperature-phased anaer- obic digestion of industrial organic fraction of municipal solid waste: A batch study. Chem. Eng. J. 2015, 270, 597–604. [Google Scholar] [CrossRef]
- Harb, M.; Lou, E.; Smith, A.L.; Stadler, L.B. Perspectives on the fate of micropollutants in mainstream anaerobic wastewater treatment. Curr. Opin. Biotechnol. 2019, 57, 94–100. [Google Scholar] [CrossRef]
- Kong, Z.; Li, L.; Xue, Y.; Yang, M.; Li, Y.-Y. Challenges and prospects for the anaerobic treatment of chemical-industrial organic wastewater: A review. J. Clean. Prod. 2019, 231, 913–927. [Google Scholar] [CrossRef]
- Liu, X.; Li, A.; Ma, L.; Jing, Z.; Yang, J.; Tang, Y.; Hu, B. A comparison on phosphorus release and struvite recovery from waste activated sludge by different treatment methods. Int. Biodeterior. Biodegrad. 2020, 148, 104878. [Google Scholar] [CrossRef]
- Chew, K.W.; Chia, S.R.; Yen, H.-W.; Nomanbhay, S.; Ho, Y.-C.; Show, P.L. Transformation of Biomass Waste into Sustainable Organic Fertilizers. Sustainability 2019, 11, 2266. [Google Scholar] [CrossRef] [Green Version]
- Samuel, A.; Bungau, S.; Tit, D.M.; Melinte, E.; Purza, L.; Badea, G. Effects of Long Term Application of Organic and Mineral Fertilizers on Soil Enzymes, Bucharest-Original Edition. Rev. Chim. 2018, 69, 2608–2612. [Google Scholar] [CrossRef]
- Neshat, S.A.; Mohammadi, M.; Najafpour, G.D. Photosynthesis Assisted Anaerobic Digestion of Cattle Manure Leachate in a Hybrid Bioreactor: An Integrated System for Enhanced Wastewater Treatment and Methane Production. Chem. Eng. J. 2017, 330, 616–624. [Google Scholar] [CrossRef]
- Łagód, G.; Duda, S.M.; Majerek, D.; Szutt, A.; Dołhańczuk-Śródka, A. Application of Electronic Nose for Evaluation of Wastewater Treatment Process Effects at Full-Scale WWTP. Processes 2019, 7, 251. [Google Scholar] [CrossRef] [Green Version]
- González, D.; Guerra, N.; Colón, J.; Gabriel, D.; Ponsá, S.; Sánchez, A. Characterization of the Gaseous and Odour Emissions from the Composting of Conventional Sewage Sludge. Atmosphere 2020, 11, 211. [Google Scholar] [CrossRef] [Green Version]
- Orzi, V.; Cadena, E.; D’Imporzano, G.; Artola, A.; Davoli, E.; Crivelli, M.; Adani, F. Potential odour emission measurement in organic fraction of municipal solid waste during anaerobic digestion: Relationship with process and biological stability parameters. Bioresour. Technol. 2010, 101, 7330–7337. [Google Scholar] [CrossRef]
- Song, X.; Luo, W.; Hai, F.I.; Price, W.E.; Guo, W.; Ngo, H.H.; Nghiem, L.D. Resource recovery from wastewater by anaerobic membrane bioreactors: Opportunities and challenges. Bioresour. Technol. 2018, 270, 669–677. [Google Scholar] [CrossRef]
- Khan, M.A.; Ngo, H.H.; Guo, W.; Chang, S.W.; Nguyen, D.D.; Varjani, S.; Liu, Y.; Deng, L.; Cheng, C. Selective production of volatile fatty acids at different pH in an anaerobic membrane bioreactor. Bioresour. Technol. 2019, 283, 120–128. [Google Scholar] [CrossRef]
- Atelge, R.; Atabani, A.E.; Banu, R.; Krisa, D.; Kaya, M.; Eskicioglu, C.; Kumar, G.; Lee, C.; Yıldız, Y.; Ünalan, S.; et al. A critical review of pretreatment technologies to enhance anaerobic digestion and energy recovery. Fuel 2020, 270, 117494. [Google Scholar] [CrossRef]
- Tang, J.; Wang, X.C.; Hu, Y.; Pu, Y.; Huang, J.; Ngo, H.H.; Zeng, Y.; Li, Y. Nutrients removal performance and sludge properties using anaerobic fermentation slurry from food waste as an external carbon source for wastewater treatment. Bioresour. Technol. 2019, 271, 125–135. [Google Scholar] [CrossRef] [PubMed]
- Kisielewska, M.; Dębowski, M.; Zieliński, M.; Krzemieniewski, M. Enhancement of Dairy Wastewater Treatment in a Combined Anaerobic Baffled and Biofilm Reactor with Magneto-Active Packing Media. J. Ecol. Eng. 2018, 19, 165–171. [Google Scholar] [CrossRef]
- Petta, L.; De Gisi, S.; Casella, P.; Farina, R.; Notarnicola, M. Evaluation of the treatability of a winery distillery (vinasse) wastewater by UASB, anoxic-aerobic UF-MBR and chemical precipitation/ adsorption. J. Environ. Manag. 2017, 201, 177–189. [Google Scholar] [CrossRef]
- Ojo, P.; Ifelebuegu, A.O. The Effects of Aluminium- and Ferric-Based Chemical Phosphorus Removal on Activated Sludge Digestibility and Dewaterability. Processes 2019, 7, 228. [Google Scholar] [CrossRef] [Green Version]
- Kazadi Mbamba, C.; Lindblom, E.; Flores-Alsina, X.; Tait, S.; Anderson, S.; Saagi, R.; Batstone, D.J.; Gernaey, K.V.; Jeppsson, U. Plant-wide model-based analysis of iron dosage strategies for chemical phosphorus removal in wastewater treatment systems. Water Res. 2019, 155, 12–25. [Google Scholar] [CrossRef] [PubMed]
- Yamashita, T.; Yamamoto-Ikemoto, R. Nitrogen and Phosphorus Removal from Wastewater Treatment Plant Effluent via Bacterial Sulfate Reduction in an Anoxic Bioreactor Packed with Wood and Iron. Int. J. Environ. Res. Public Health 2014, 11, 9835–9853. [Google Scholar] [CrossRef] [PubMed] [Green Version]
- Lay, C.H.; Vo, T.P.; Lin, P.Y.; Abdul, P.M.; Liu, C.M.; Lin, C.Y. Anaerobic hydrogen and methane production from low-strength beverage wastewater. Int. J. Hydrogen Energy 2019, 44, 14351–14361. [Google Scholar] [CrossRef]
- Li, B.; Dinkler, K.; Zhao, N.; Sobhi, M.; Merkle, W.; Liu, S.; Dong, R.; Oechsner, H.; Guo, J. Influence of anaerobic digestion on the labile phosphorus in pig, chicken, and dairy manure. Sci. Total Environ. 2020, 737, 140234. [Google Scholar] [CrossRef]
- Dębowski, M.; Zieliński, M.; Kisielewska, M.; Krzemieniewski, M.; Makowska, M.; Grądkowski, M.; Tor-Świątek, A. Simulated dairy wastewater treatment in a pilot plant scale magneto-active hybrid anaerobic biofilm reactor (MA-HABR). Braz. J. Chem. Eng. 2018, 35, 553–562. [Google Scholar] [CrossRef] [Green Version]
- Calabrò, P.; Fazzino, F.; Folino, A.; Scibetta, S.; Sidari, R. Improvement of semi-continuous anaerobic digestion of pre-treated orange peel waste by the combined use of zero valent iron and granular activated carbon. Biomass Bioenergy 2019, 129, 105337. [Google Scholar] [CrossRef]
- Zhao, B.; Sha, H.; Li, J.; Cao, S.; Wang, G.; Yang, Y. Static magnetic field enhanced methane production via stimulating the growth and composition of microbial community. J. Clean. Prod. 2020, 271, 122664. [Google Scholar] [CrossRef]
- Germec, M.; Demirci, A.; Turhan, I. Biofilm reactors for value-added products production: An in-depth review. Biocatal. Agric. Biotechnol. 2020, 27, 101662. [Google Scholar] [CrossRef]
- Shi, R.; Xu, H.; Zhang, Y. Enhanced treatment of wastewater from the vitamin C biosynthesis industry using a UASB reactor supplemented with zerovalent iron. Environ. Technol. 2011, 32, 1859–1865. [Google Scholar] [CrossRef]
- Lin, H.; King, A.; Williams, N.; Hu, B. Hydrogen sulfide removal via appropriate metal ions dosing in anaerobic digestion. Environ. Prog. Sustain. Energy 2017, 36, 1405–1416. [Google Scholar] [CrossRef]
- Zhang, Y.; Jing, Y.; Quan, X.; Liu, Y.; Onu, P. A Built-In Zero Valent Iron Anaerobic Reactor to Enhance Treatment of Azo Dye Wastewater. Water Sci. Technol. 2011, 63, 741–746. [Google Scholar] [CrossRef] [PubMed]
- Zieliński, M.; Dębowski, M.; Krzemieniewski, M.; Brudniak, A.; Kisielewska, M. Possibility of improving technological effectiveness of dairy wastewater treatment through application of active fillings and microwave radiation. J. Water Chem. Technol. 2016, 38, 342–348. [Google Scholar] [CrossRef]
- Dębowski, M.; Zieliński, M.; Krzemieniewski, M.; Brudniak, A. Effect of magneto-active filling on the effectiveness of methane fermentation of dairy wastewaters. Int. J. Green Energy 2014. [Google Scholar] [CrossRef]
- Nacheva, P.M.; Chávez, G.M.; Chacón, J.M.; Chuil, A.C. Treatment of cane sugar mill wastewater in an upflow anaerobic sludge bed reactor. Water Sci. Technol. 2009, 60, 1347–1352. [Google Scholar] [CrossRef]
- Hampannavar, U.S.; Shivayogimath, C.B. Anaerobic treatment of sugar industry wastewater by Upflow anaerobic sludge blanket reactor at ambient temperature. Int. J. Environ. Sci. 2010, 1, 631–639. [Google Scholar]
- Zhang, L.; Ban, Q.; Li, J.; Wan, C. Functional bacterial and archaeal dynamics dictated by pH stress during sugar refinery wastewater in a UASB. Bioresour. Technol. 2019, 288, 121464. [Google Scholar] [CrossRef] [PubMed]
- Barrera, E.L.; Spanjers, H.; Romero, O.; Rosa, E.; Dewulf, J. A successful strategy for start-up of lab-scale UASB reactor treating sulfate-rich sugar cane vinasse. J. Chem. Technol. Biotechnol. 2019, 95, 205–212. [Google Scholar] [CrossRef]
- Kushwaha, J.P. A review on sugar industry wastewater: Sources, treatment technologies, and reuse. Desalin. Water Treat. 2013, 53, 309–318. [Google Scholar] [CrossRef]
- Fito, J.; Tefera, N.; Kloos, H.; Van Hulle, S.W.H. Anaerobic treatment of blended sugar industry and ethanol distillery wastewater through biphasic high rate reactor. J. Environ. Sci. Health Part A 2018, 53, 676–685. [Google Scholar] [CrossRef] [PubMed] [Green Version]
- Ji, Y.; Wang, Y.; Sun, J.; Yan, T.; Li, J.; Zhao, T.; Yin, X.; Sun, C. Enhancement of biological treatment of wastewater by magnetic field. Bioresour. Technol. 2010, 101, 8535–8540. [Google Scholar] [CrossRef] [PubMed]
- Liu, C.; Wang, F.; Ou-Yang, F. Ethanol fermentation in a magnetically fluized bed reactor with immobilized Saccharomyces cerevisiae in magnetic particles. Bioresour. Technol. 2009, 100, 878–882. [Google Scholar] [CrossRef]
- Liu, Y.; Wang, Q.; Zhang, Y.; Ni, B.J. Zero valent iron significantly enhances methane production from waste activated sludge by improving biochemical methane potential rather than hydrolysis rate. Sci. Rep. 2015, 5, 1–6. [Google Scholar] [CrossRef] [Green Version]
- Karri, S.; Sierra-Alvarez, R.; Field, J.A. Zero valent iron as an electron-donor for methanogenesis and sulfate reduction in anaerobic sludge. Biotechnol. Bioeng. 2005, 92, 810–819. [Google Scholar] [CrossRef]
- Wu, D.; Zheng, S.; Ding, A.; Sun, G.; Yang, M. Performance of a zero valent iron-based anaerobic system in swine wastewater treatment. J. Hazard. Mater. 2015, 286, 1–6. [Google Scholar] [CrossRef]
- Lee, H.; Shoda, M. Stimulation of anaerobic digestion of thickened sewage sludge by iron-rich sludge produced by the Fenton method. J. Biosci. Bioeng. 2008, 106, 107–110. [Google Scholar] [CrossRef]
- Noubactep, C. A critical review on the process of contaminant removal in Fe0-H2O systems. Environ. Technol. 2008, 29, 909–920. [Google Scholar] [CrossRef] [PubMed] [Green Version]
- Wysocka, I.; Krzemieniewski, M. The effects of total phosphorus and orthophosphates removal with the method of metals solubilisation on steel, aluminum, and mixed media. Pol. J. Nat. Sci. 2007, 22, 307–316. [Google Scholar] [CrossRef]
- Ruzhitskaya, O. Efficient phosphate removal by biological corrosion method. E3S Web Conf. 2020, 180, 04009. [Google Scholar] [CrossRef]
- Wysocka, I. A Comparative Study of Metals Solubilization and Electrocoagulation Methods’ Effectiveness in Orthophosphate Removal from Synthetic Wastewater. Pol. J. Environ. Stud. 2013, 22, 945–949. [Google Scholar]
- Tomei, M.C.; Stazi, V.; Daneshgar, S.; Capodaglio, A.G. Holistic Approach to Phosphorus Recovery from Urban Wastewater: Enhanced Biological Removal Combined with Precipitation. Sustainability 2020, 12, 575. [Google Scholar] [CrossRef] [Green Version]
- Daneshgar, S.; Buttafava, A.; Callegari, A.; Capodaglio, A.G. Simulations and Laboratory Tests for Assessing Phosphorus Recovery Efficiency from Sewage Sludge. Resources 2018, 7, 54. [Google Scholar] [CrossRef] [Green Version]
- Daneshgar, S.; Callegari, A.; Capodaglio, A.G.; Vaccari, D. The Potential Phosphorus Crisis: Resource Conservation and Possible Escape Technologies: A Review. Resources 2018, 7, 37. [Google Scholar] [CrossRef] [Green Version]
- Berg, U.; Donnert, D.; Weidler, P.G.; Kaschka, E.; Knoll, G.; Nüesch, R. Phosphorus removal and recovery from wastewater by tobermoriteseeded crystallisation of calcium phosphate. Water Sci. Technol. 2006, 53, 131–138. [Google Scholar] [CrossRef] [PubMed] [Green Version]
- Hallas, J.F.; Mackowiak, C.L.; Wilkie, A.C.; Harris, W.G. Struvite Phosphorus Recovery from Aerobically Digested Municipal Wastewater. Sustainability 2019, 11, 376. [Google Scholar] [CrossRef] [Green Version]
- Shaddel, S.; Bakhtiary-Davijany, H.; Kabbe, C.; Dadgar, F.; Østerhus, S.W. Sustainable Sewage Sludge Management: From Current Practices to Emerging Nutrient Recovery Technologies. Sustainability 2019, 11, 3435. [Google Scholar] [CrossRef] [Green Version]
- Roeleveld, P.; Loeffen, P.; Temmink, H.; Klapwijk, B. Dutch analysis for Precovery from municipal wastewater. Water Sci. Technol. 2004, 49, 191–199. [Google Scholar] [CrossRef] [PubMed]
Figure 1.
Scheme of fluidized active filling (FAF) production (1—inter layer with metal powder, 2—middle cellular layer with blowing agent, 3—outer layer with metal powder, 4—metal particles, 5—micropores).
Figure 1.
Scheme of fluidized active filling (FAF) production (1—inter layer with metal powder, 2—middle cellular layer with blowing agent, 3—outer layer with metal powder, 4—metal particles, 5—micropores).

Figure 2.
A diagram of the experimental process system (1—hydrolysis tank, 2—fermentation tank, 3—agitators, 4—rotary lobe pump, 5—peristaltic pump, 6—magneto-active filling, 7—limiting grid, 8—biogas outflow with a meter, 9—outflow of treated effluent).
Figure 2.
A diagram of the experimental process system (1—hydrolysis tank, 2—fermentation tank, 3—agitators, 4—rotary lobe pump, 5—peristaltic pump, 6—magneto-active filling, 7—limiting grid, 8—biogas outflow with a meter, 9—outflow of treated effluent).

Figure 3.
Changes in the chemical oxygen demand (COD), in the treated effluent.

Figure 4.
COD load removed during treatment.

Figure 5.
One-time yields of biogas per removed COD load.

Figure 6.
Methane content in the biogas.

Figure 7.
Changes in the total suspended solids concentration in the treated effluent.

Figure 8.
Changes in pH value in the fermentation bioreactor.

Figure 9.
Changes in the total nitrogen concentration in the treated effluent.

Figure 10.
Changes in the total phosphorus concentration in the treated effluent.


Table 1.
Properties of the raw effluent used in the study.
| Indicator mg/dm3 | Stage/Organic Load Rate | ||
|---|---|---|---|
| Stage 1—4.0 kg COD/m3·d | Stage 2—6.0 kg COD/m3·d | Stage 3—8.0 kg COD/m3·d | |
| COD | 3400 ± 201 | 4600 ± 190 | 6800 ± 270 |
| BOD5 | 1930 ± 170 | 2890 ± 154 | 3850 ± 206 |
| Total nitrogen | 130± 20 | 195 ± 22 | 260 ± 27 |
| COD/N | 26 ± 2 | 25 ± 2.2 | 26 ± 1.8 |
| Ammonia nitrogen | 20.4 ± 5.7 | 30.6 ± 8.3 | 40.8 ± 12 |
| Total phosphorus | 29.3 ± 4.9 | 43.9 ± 9.7 | 58.6 ± 9.1 |
| Orthophosphates | 4.2 ± 0.8 | 6.3 ± 1.6 | 8.4 ± 2.3 |
| Total suspended solids | 18.1 ± 1.9 | 27.2 ± 3.3 | 36.2 ± 5.2 |
Table 2.
Experimental design.
| Stage | OLR [kg COD/m3·d] | Fraction of Raw Effluent [%] | Fraction of Tap Water [%] |
|---|---|---|---|
| Adaptation | 1.0 | 12.5 | 87.5 |
| 1 | 4.0 | 50 | 50 |
| 2 | 6.0 | 75 | 25 |
| 3 | 8.0 | 100 | 0 |
Table 3.
Properties of the anaerobic sludge used in the experiment.
| Parameter | Unit | Average |
|---|---|---|
| pH | 7.44 ± 0.37 | |
| Water content | % | 97.9 ± 0.82 |
| Dry matter | % | 2.1 ± 0.82 |
| Volatile matter | % DM | 62.7 ± 3.01 |
| Ash | % DM | 47.3 ± 2.73 |
| Capillary suction time | s | 503 ± 28.29 |
Table 4.
Basic properties PVC (poly(vinyl chloride)) Alfavinyl GFM/4-31-TR according to manufacturer’s specifications.
Table 4.
Basic properties PVC (poly(vinyl chloride)) Alfavinyl GFM/4-31-TR according to manufacturer’s specifications.
| Property | Unit | Value |
|---|---|---|
| Density | [kg/m3] | 1230 ± 20 |
| Elastic modulus | [MPa] | 2600 ± 30 |
| Tensile strength | [MPa] | 21 ± 2 |
| Elongation at break | [%] | 300 ± 12 |
| Shore hardness A | [°Sh] | 80 ± 4 |
Table 5.
Specifications of the pipe fittings for the active filling.
| Property | Unit | Value |
|---|---|---|
| Density | [kg/m3] | 874 ± 2 |
| Porosity | [%] | 40 ± 1 |
| Tensile strength | [MPa] | 14 ± 2 |
| Hardness | [°Sh] | 25 ± 3 |
Table 6.
Performance characteristics of the FAF-R.
| Parameter | Unit | Stage 1 | Stage 2 | Stage 3 |
|---|---|---|---|---|
| Technological Parameters | ||||
| OLR | kg COD/m3·d | 4.0 | 6.0 | 8.0 |
| HRT | h | 24 | 24 | 24 |
| Operation time | d | 20 | 20 | 20 |
| Temperature | °C | 38 ± 1 | 38 ± 1 | 38 ± 1 |
| Results | ||||
| COD removal | % | 74.1 ± 7.0 | 74.9 ± 4.0 | 68.9 ± 4.0 |
| TP removal | % | 81.2 ± 8.2 | 69.8 ± 5.4 | 64.4 ± 2.4 |
| TN removal | % | 17.3 ± 4.0 | 11.4 ± 2.5 | 8.7 ± 3.0 |
| Biogas | dm3/kg CODremoved | 356 ± 25 | 427 ± 14 | 364 ± 11 |
| CH4 in biogas | % | 69.6 ± 1.4 | 72.0 ± 1.9 | 61.9 ± 3.1 |
| Daily biogas production | dm3/d | 638 ± 98 | 1134 ± 127 | 1206 ± 96 |
| Daily CH4 production | dm3CH4/d | 443 ± 64 | 817 ± 99 | 750 ± 91 |
| pH | 7.13 ± 0.16 | 7.05 ± 0.22 | 6.75 ± 0.18 | |
| FOS/TAC ratio | 0.31 ± 0.1 | 0.37 ± 0.1 | 0.44 ± 0.2 | |
Publisher’s Note: MDPI stays neutral with regard to jurisdictional claims in published maps and institutional affiliations. |
© 2020 by the authors. Licensee MDPI, Basel, Switzerland. This article is an open access article distributed under the terms and conditions of the Creative Commons Attribution (CC BY) license (http://creativecommons.org/licenses/by/4.0/).
Share and Cite
MDPI and ACS Style
Dębowski, M.; Zieliński, M. Technological Effectiveness of Sugar-Industry Effluent Methane Fermentation in a Fluidized Active Filling Reactor (FAF-R). Energies 2020, 13, 6626. https://0-doi-org.brum.beds.ac.uk/10.3390/en13246626
AMA Style
Dębowski M, Zieliński M. Technological Effectiveness of Sugar-Industry Effluent Methane Fermentation in a Fluidized Active Filling Reactor (FAF-R). Energies. 2020; 13(24):6626. https://0-doi-org.brum.beds.ac.uk/10.3390/en13246626
Chicago/Turabian StyleDębowski, Marcin, and Marcin Zieliński. 2020. "Technological Effectiveness of Sugar-Industry Effluent Methane Fermentation in a Fluidized Active Filling Reactor (FAF-R)" Energies 13, no. 24: 6626. https://0-doi-org.brum.beds.ac.uk/10.3390/en13246626
Note that from the first issue of 2016, this journal uses article numbers instead of page numbers. See further details here.