Airtightness Analysis of the Built Heritage–Field Measurements of Nineteenth Century Buildings through Blower Door Tests

 ,
,  , , and
Abstract
:1. Introduction
2. Background
2.1. Airtightness and Infiltrations
2.2. Database
- Walls 18–50%; 35%.
- Ceiling details 3–30%; 18%.
- Forced air heating and/or cooling systems 3–28%; 18%.
- Windows and doors 6–22%; 15%.
- Fireplace 0–30%; 12%.
- Vents in conditioned spaces 2–12%; 5%.
- Difussion through walls <1%
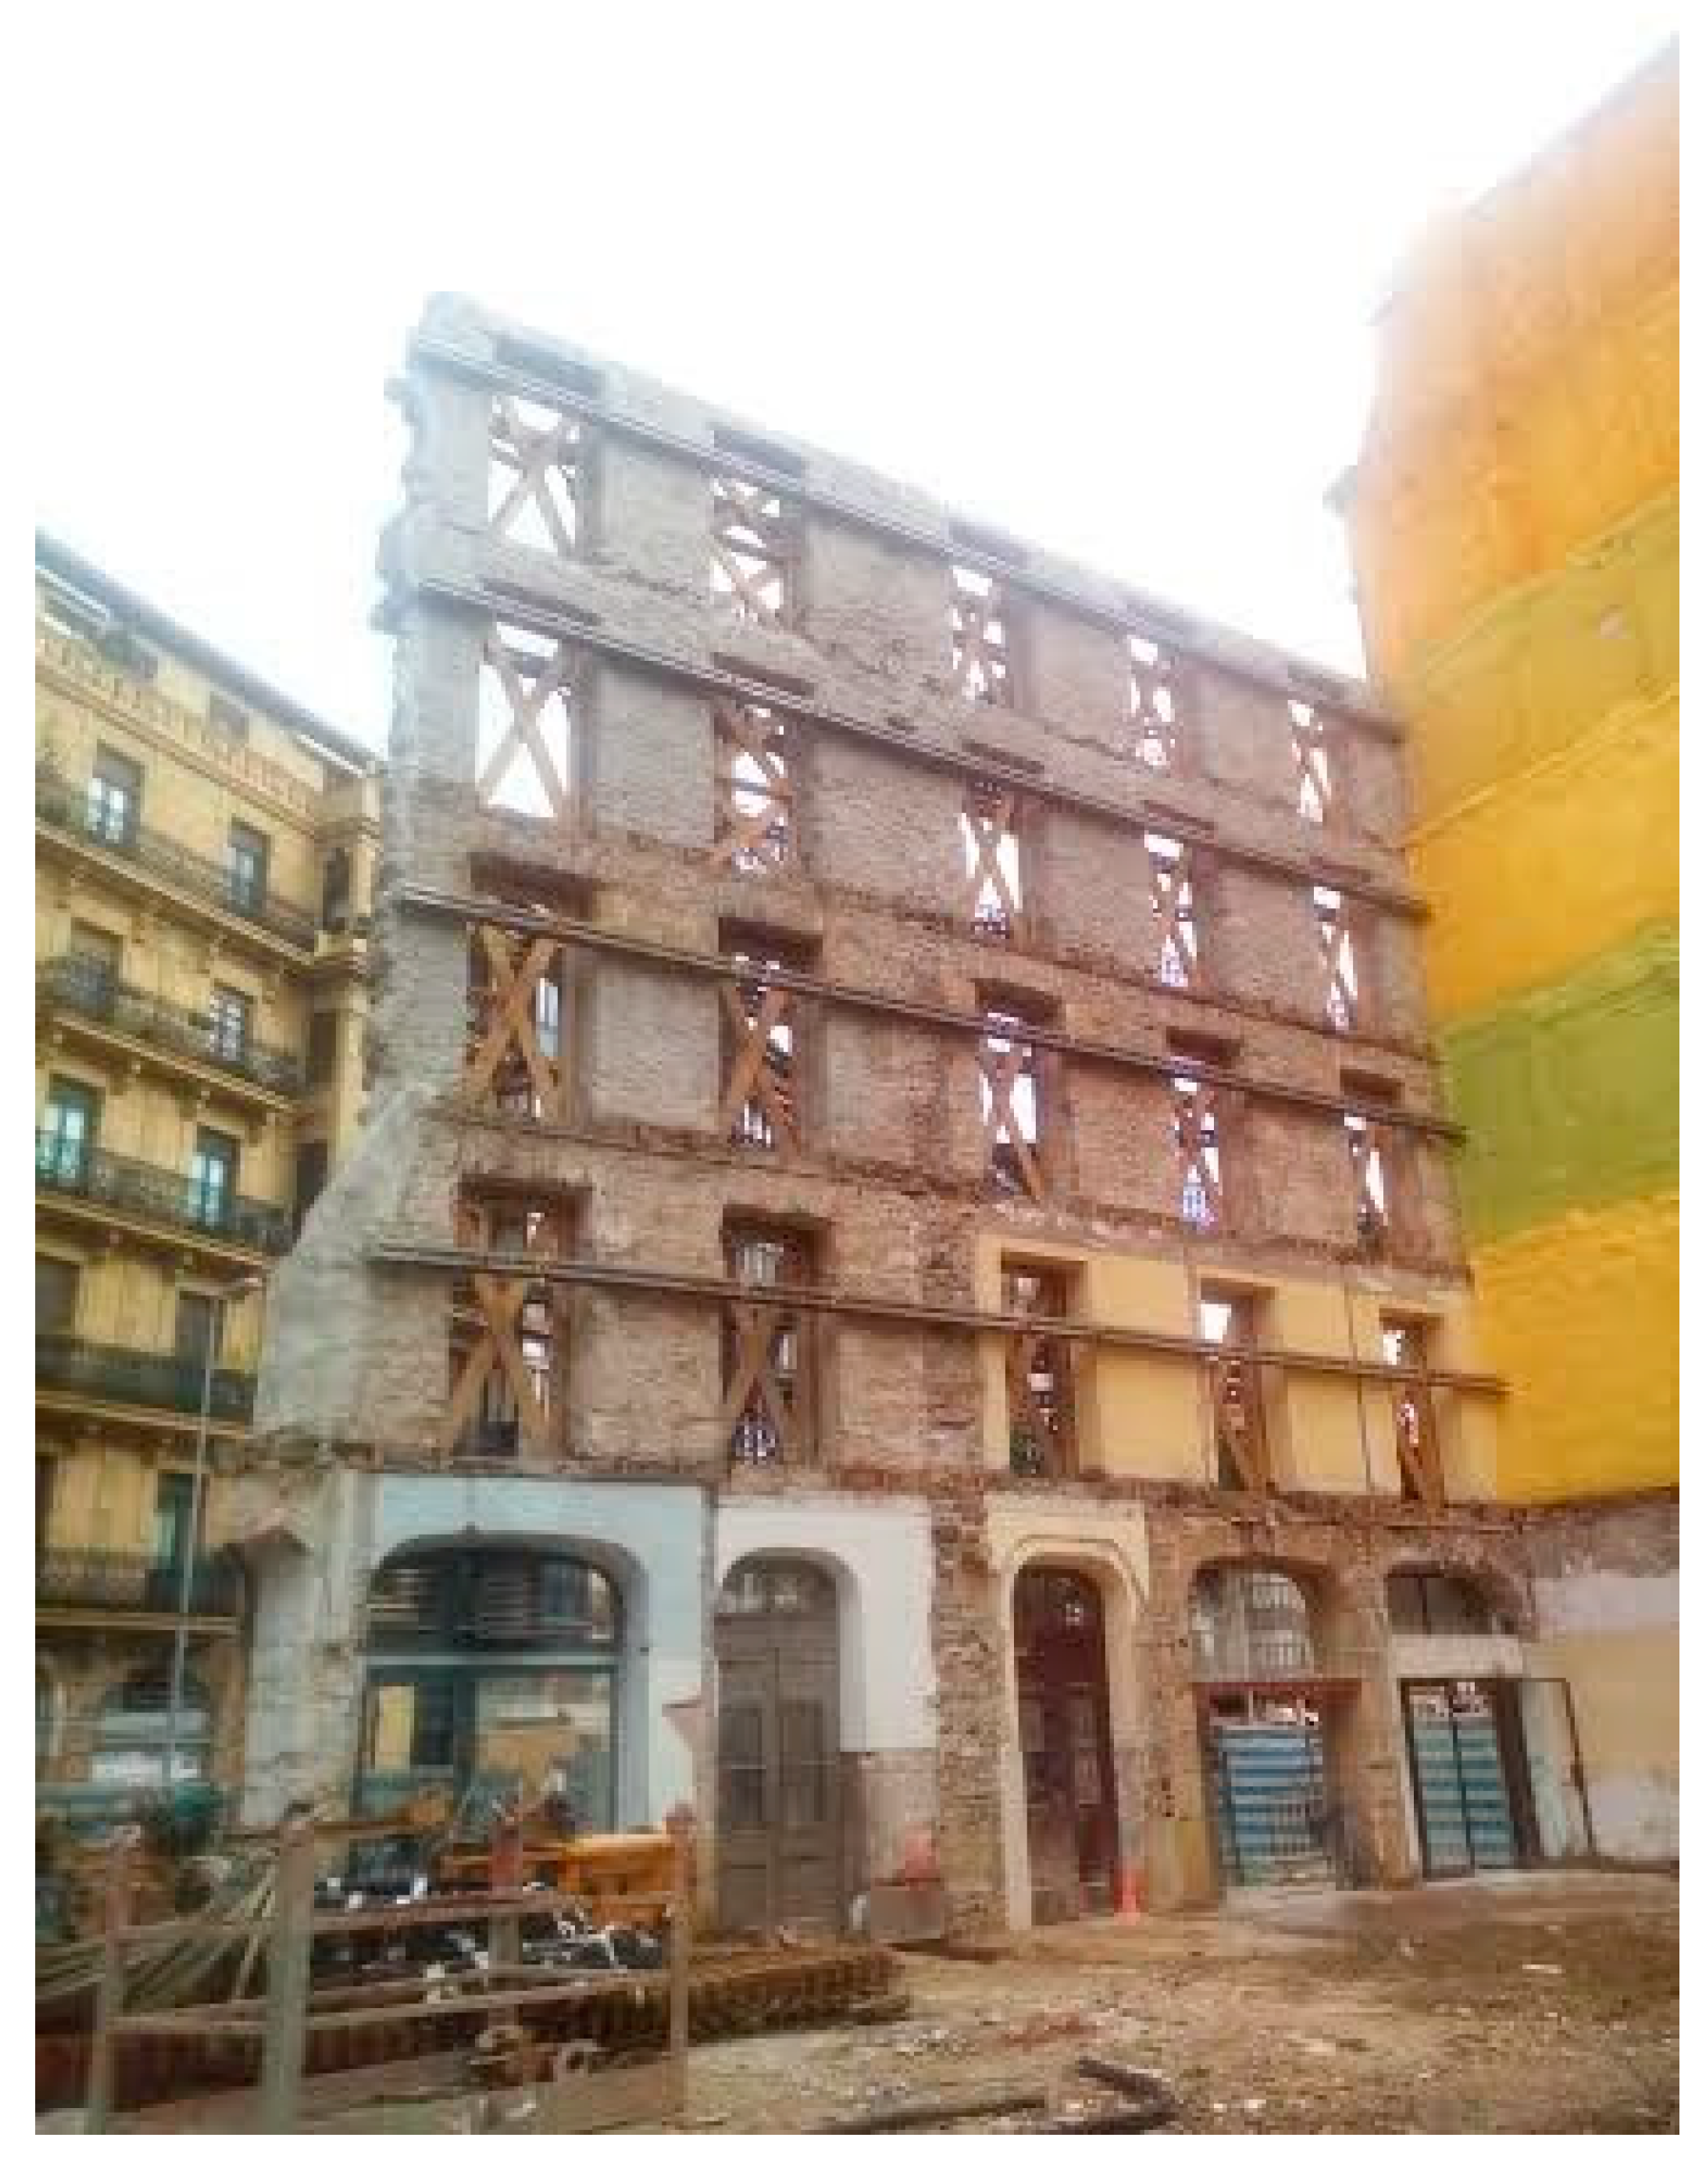
2.3. Built Heritage
3. Materials and Methods
3.1. Context
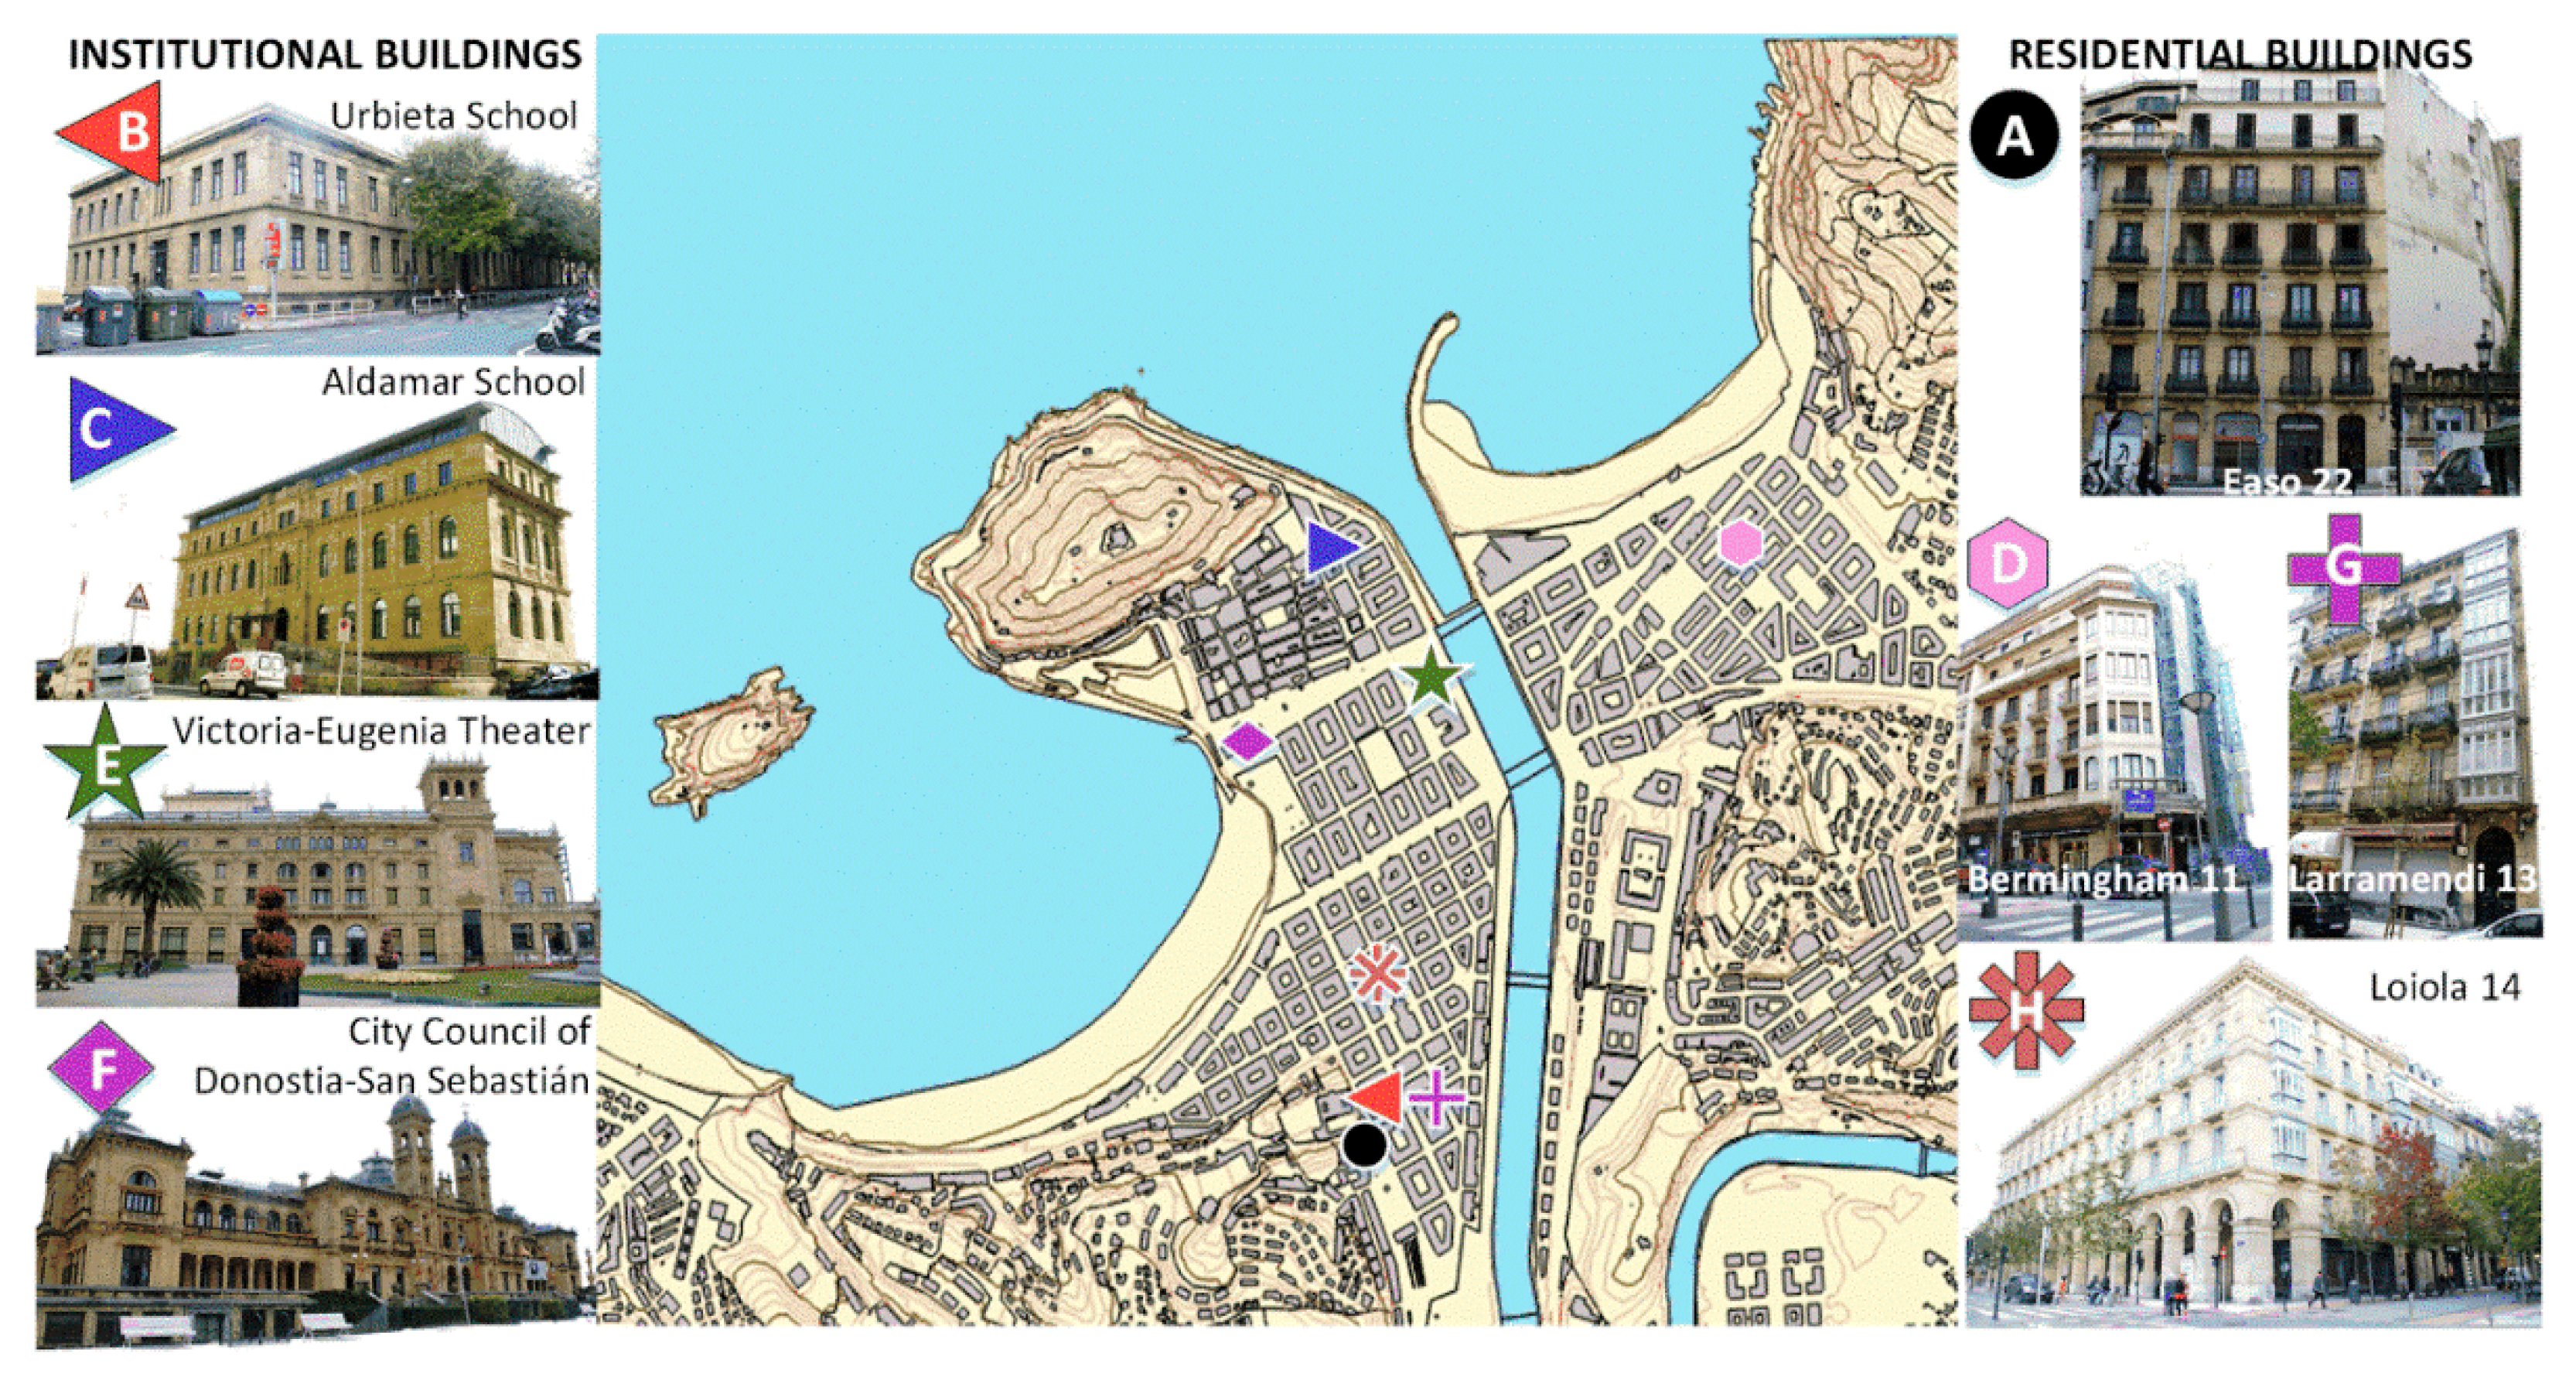
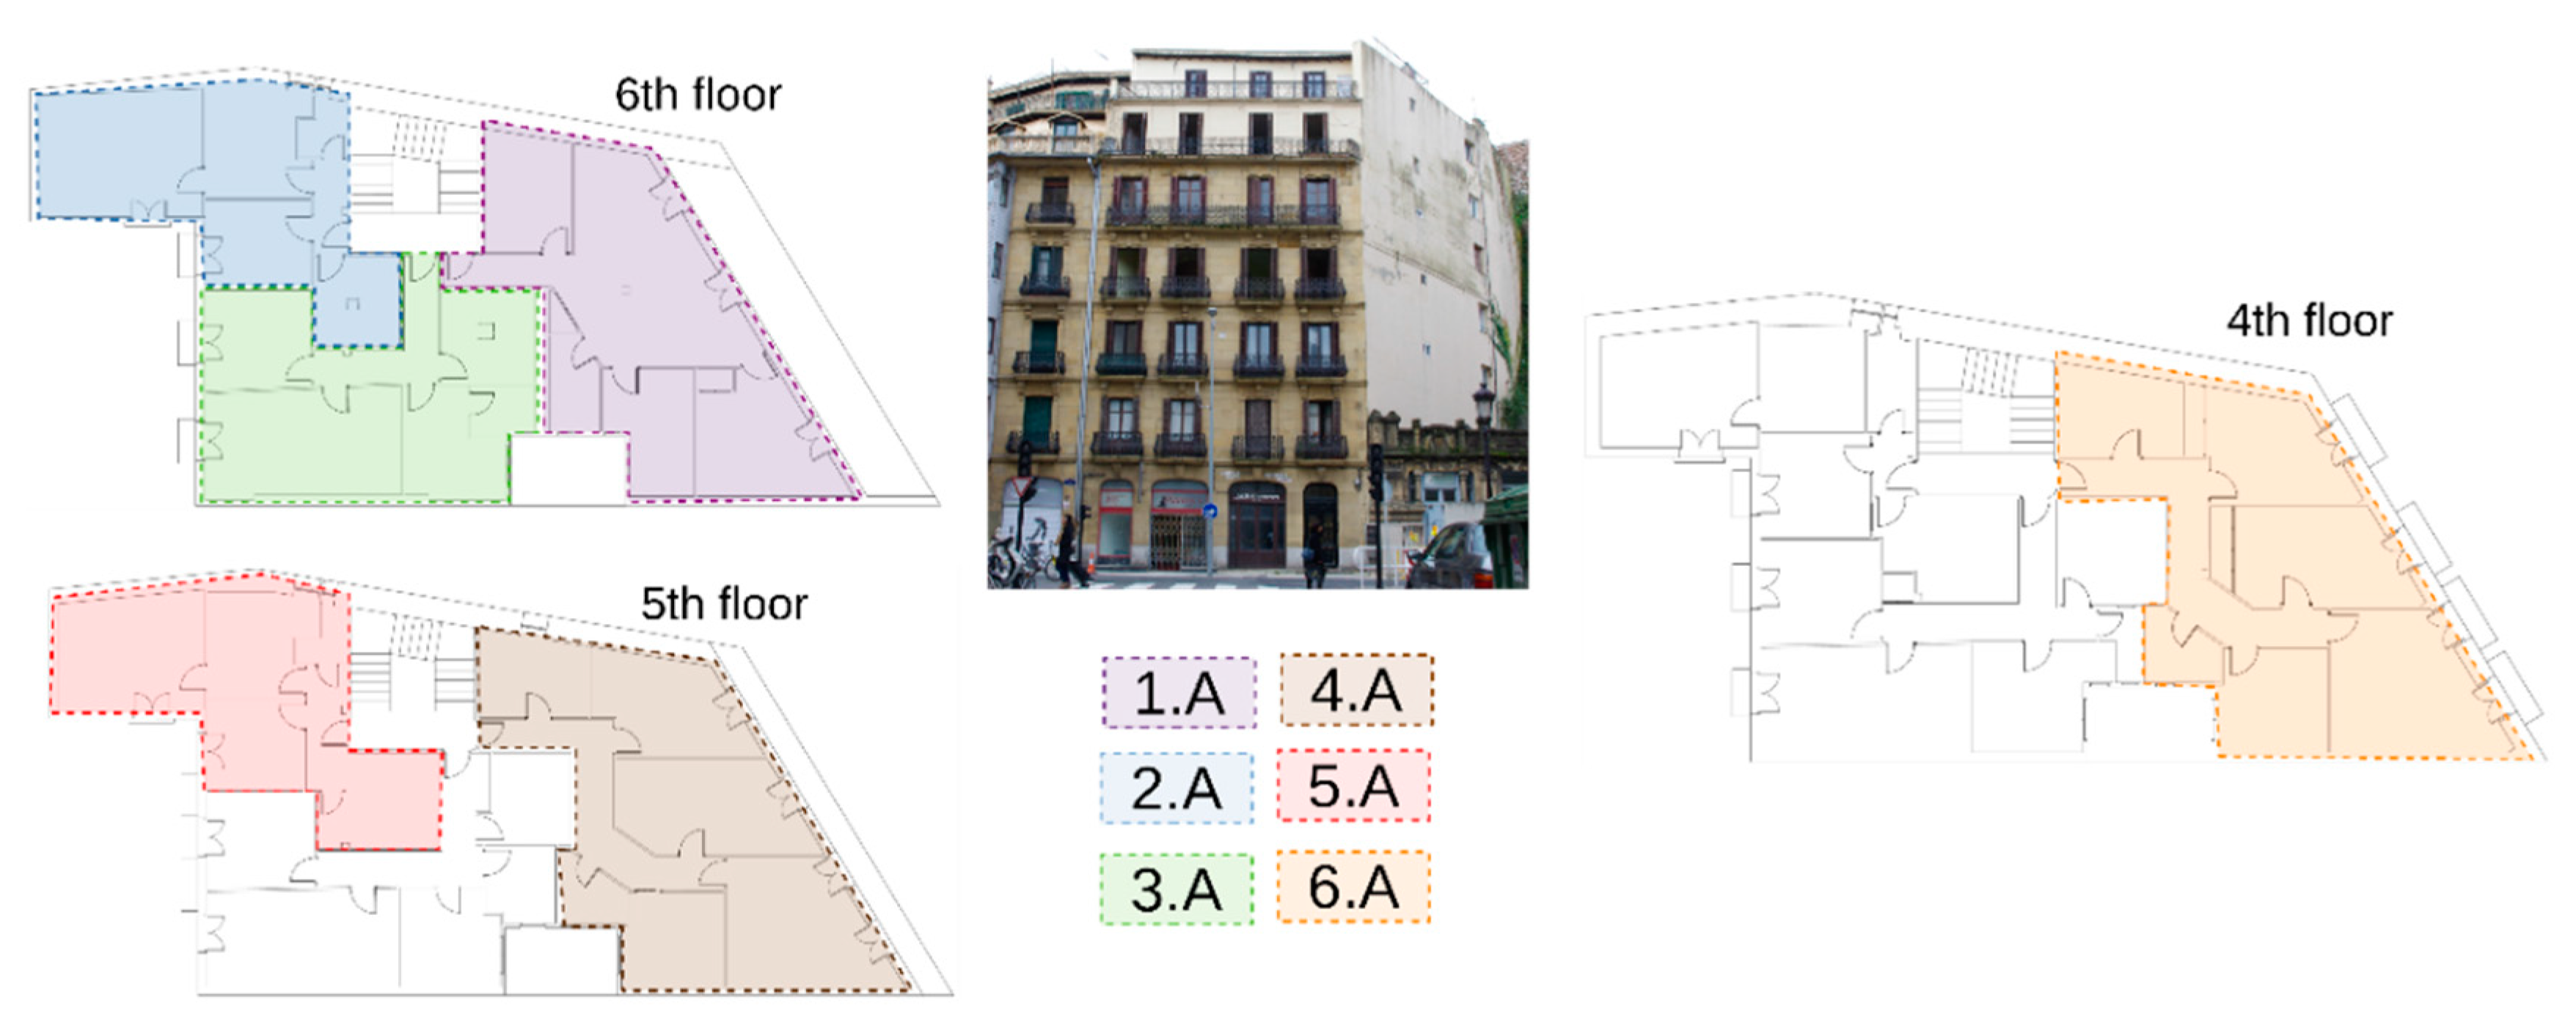
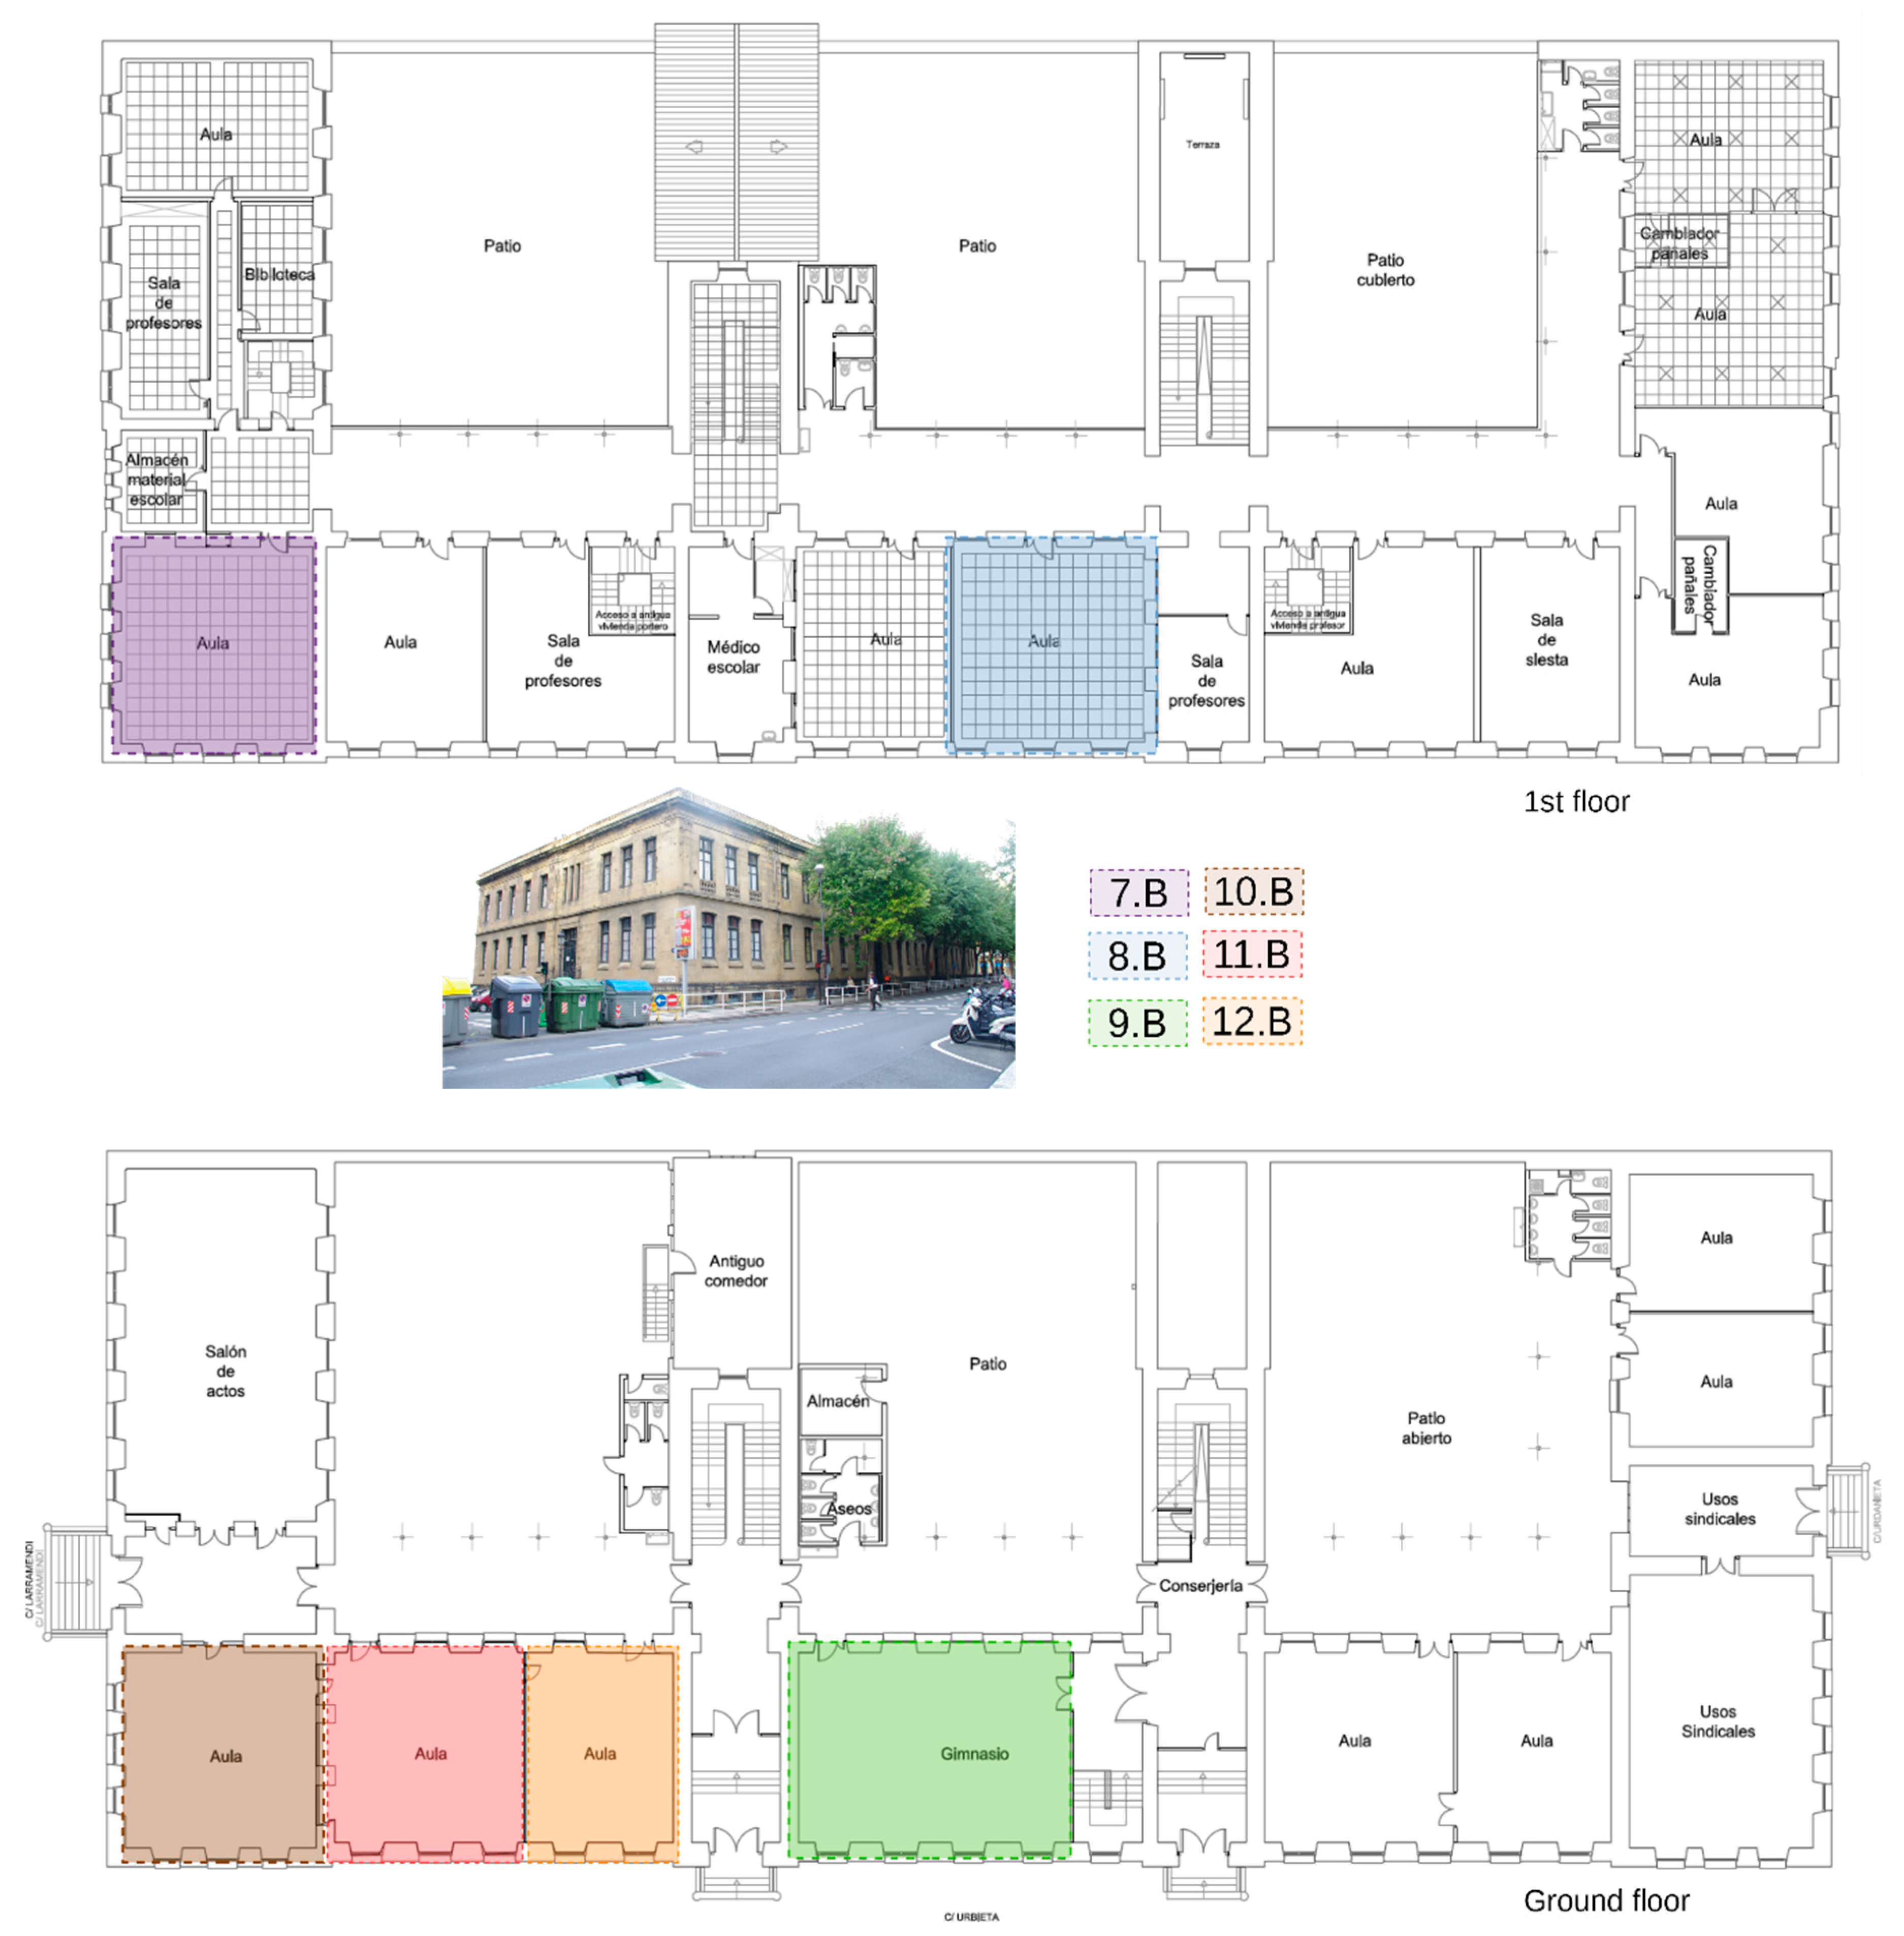
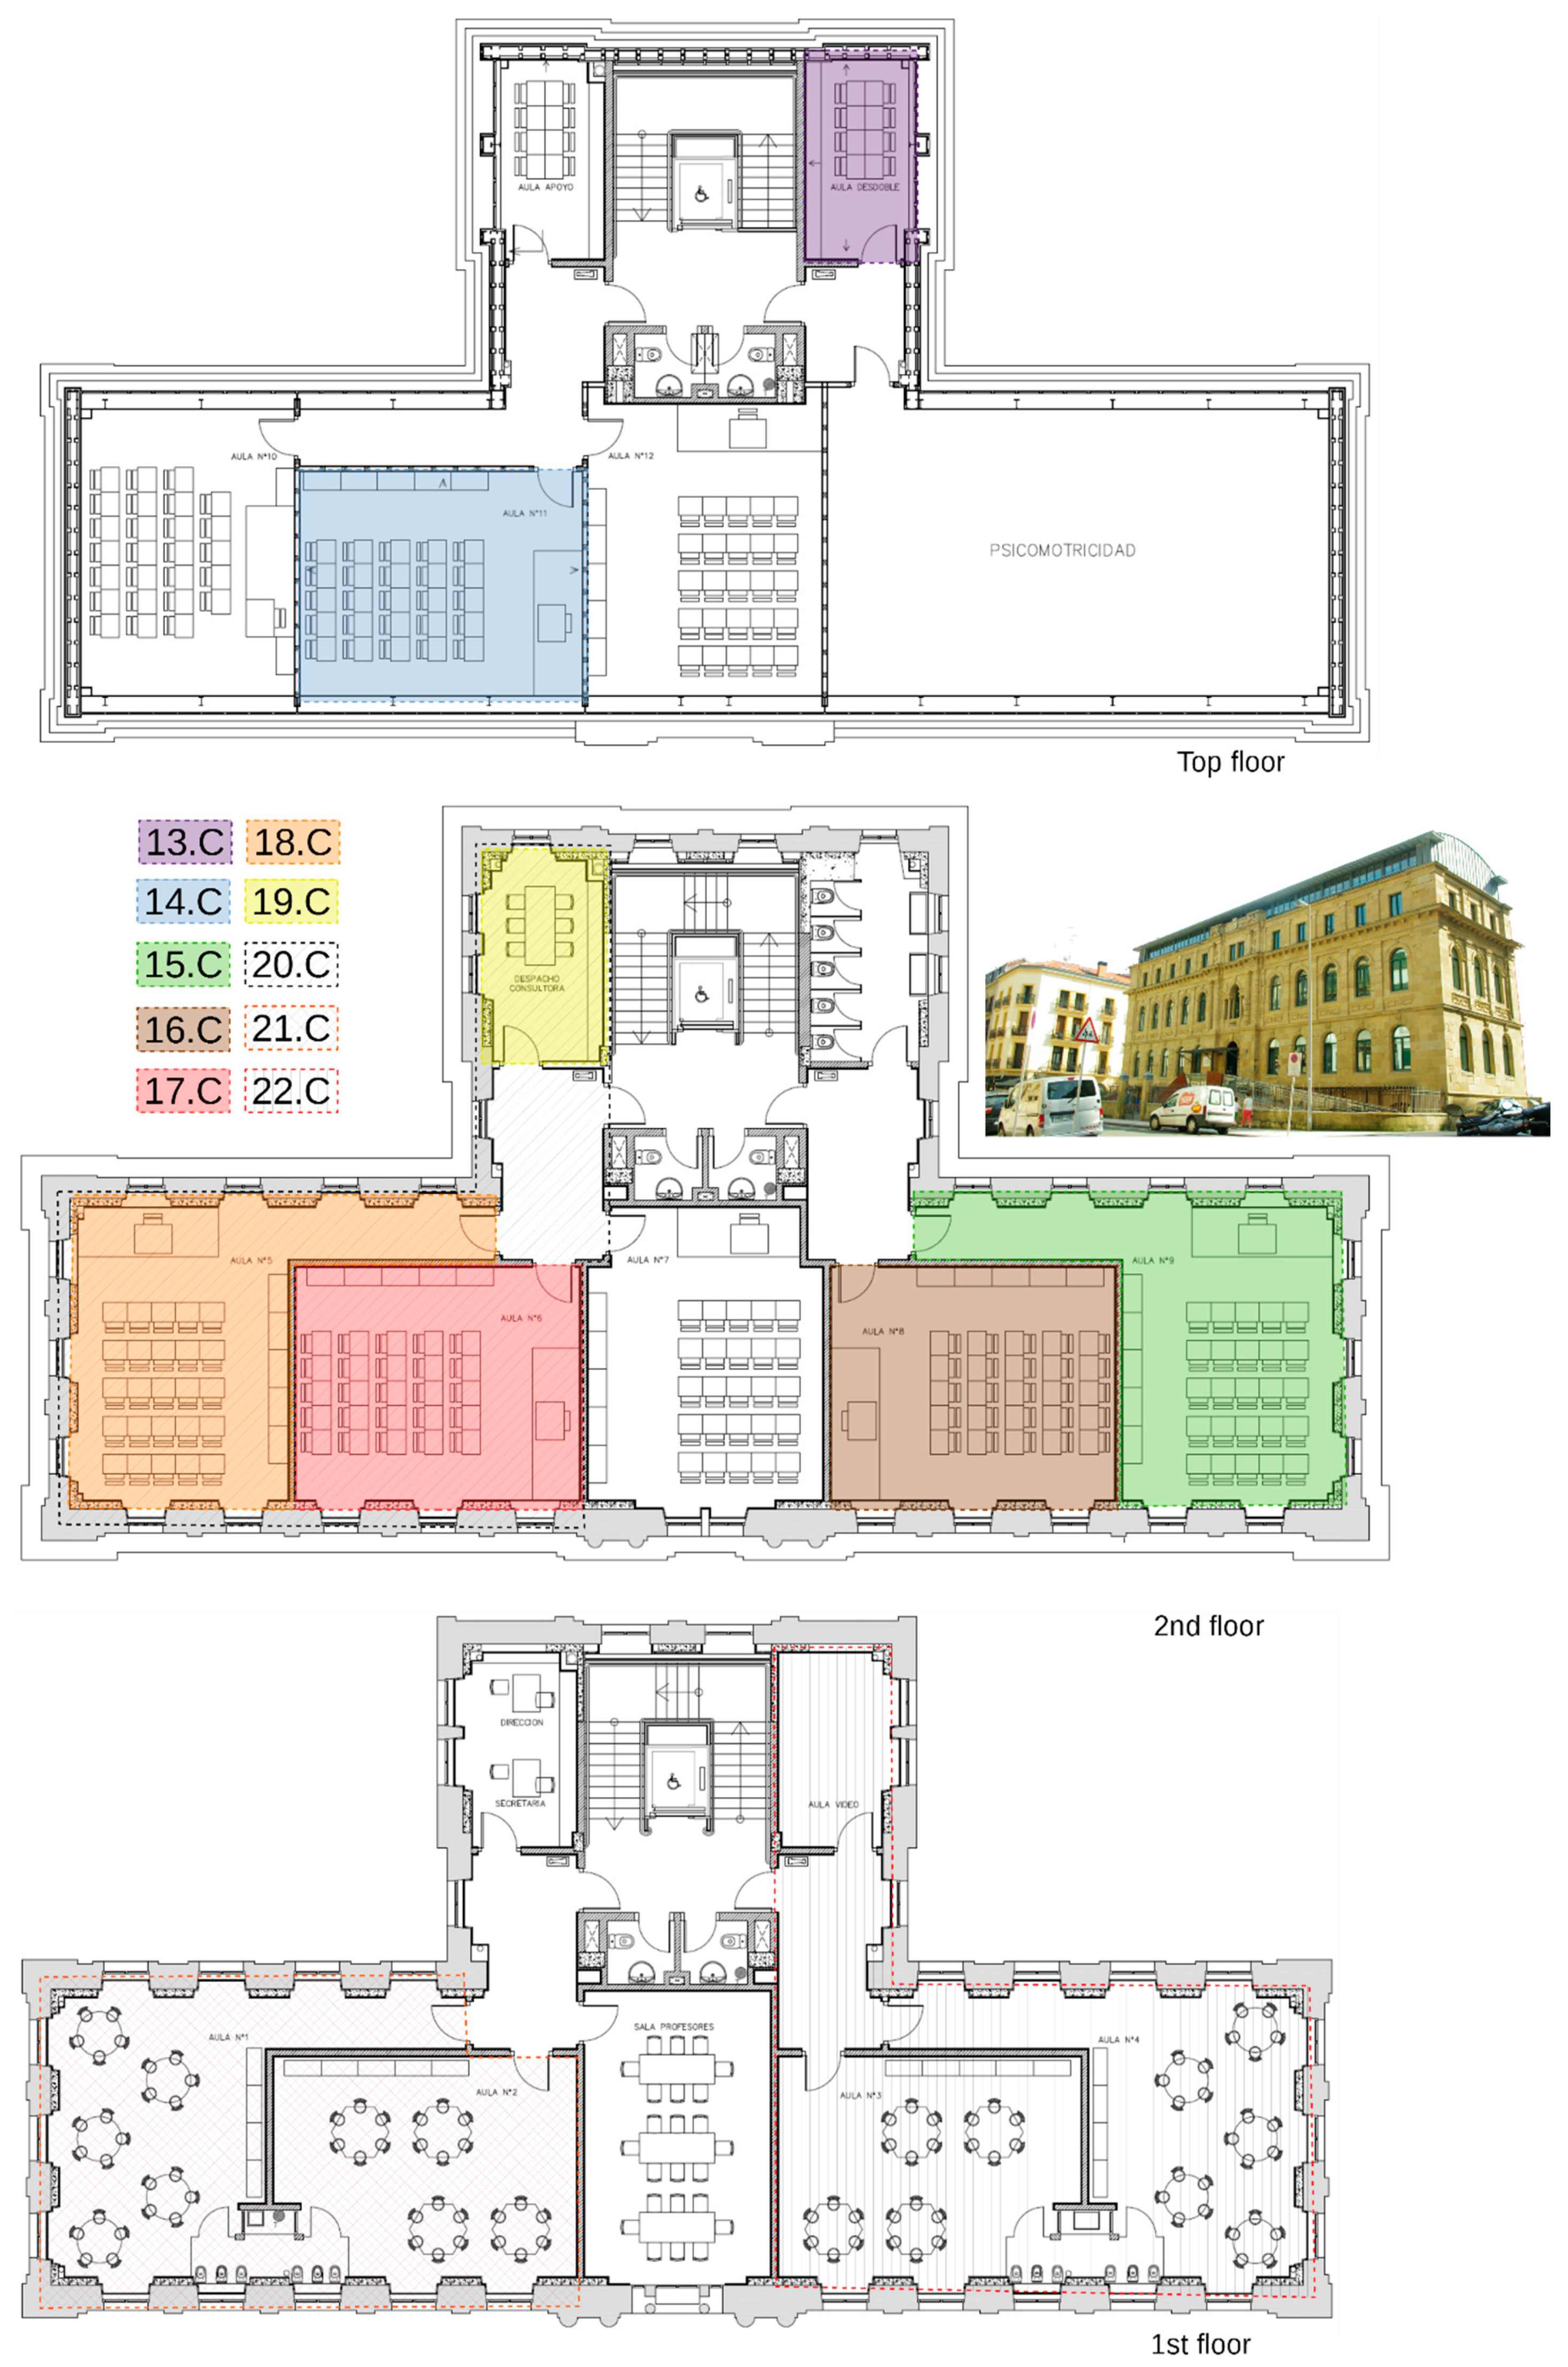
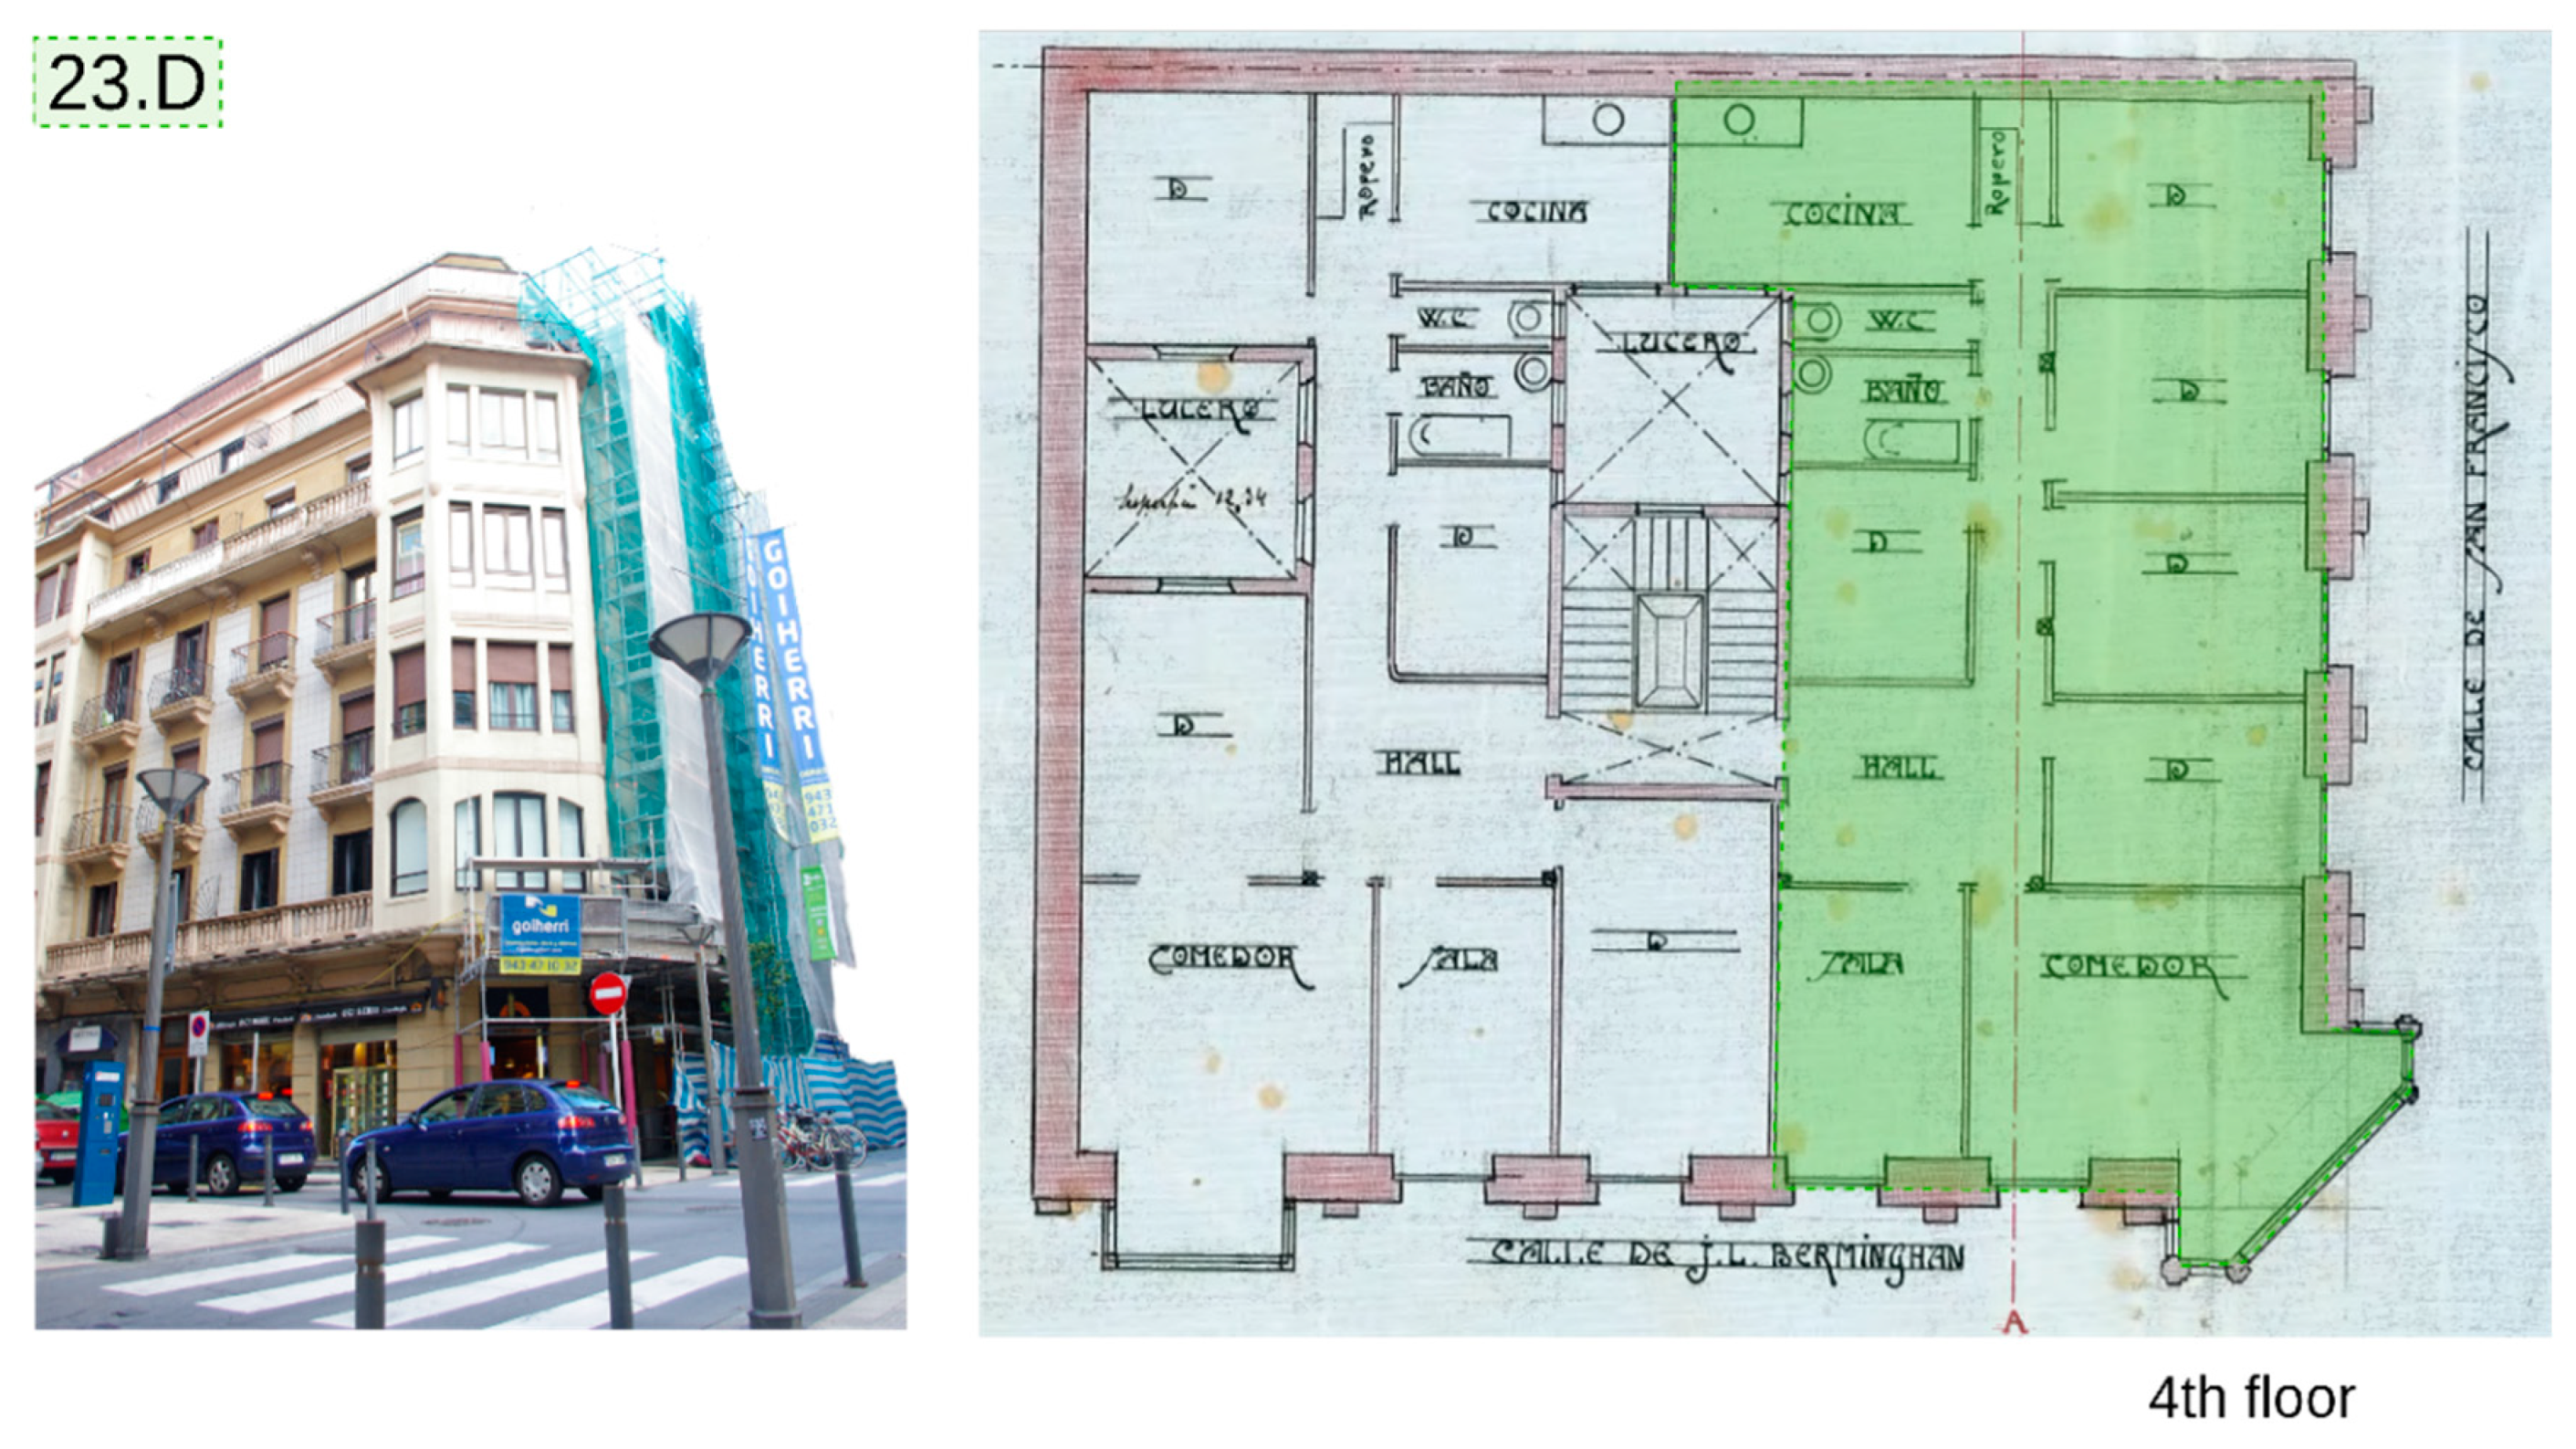
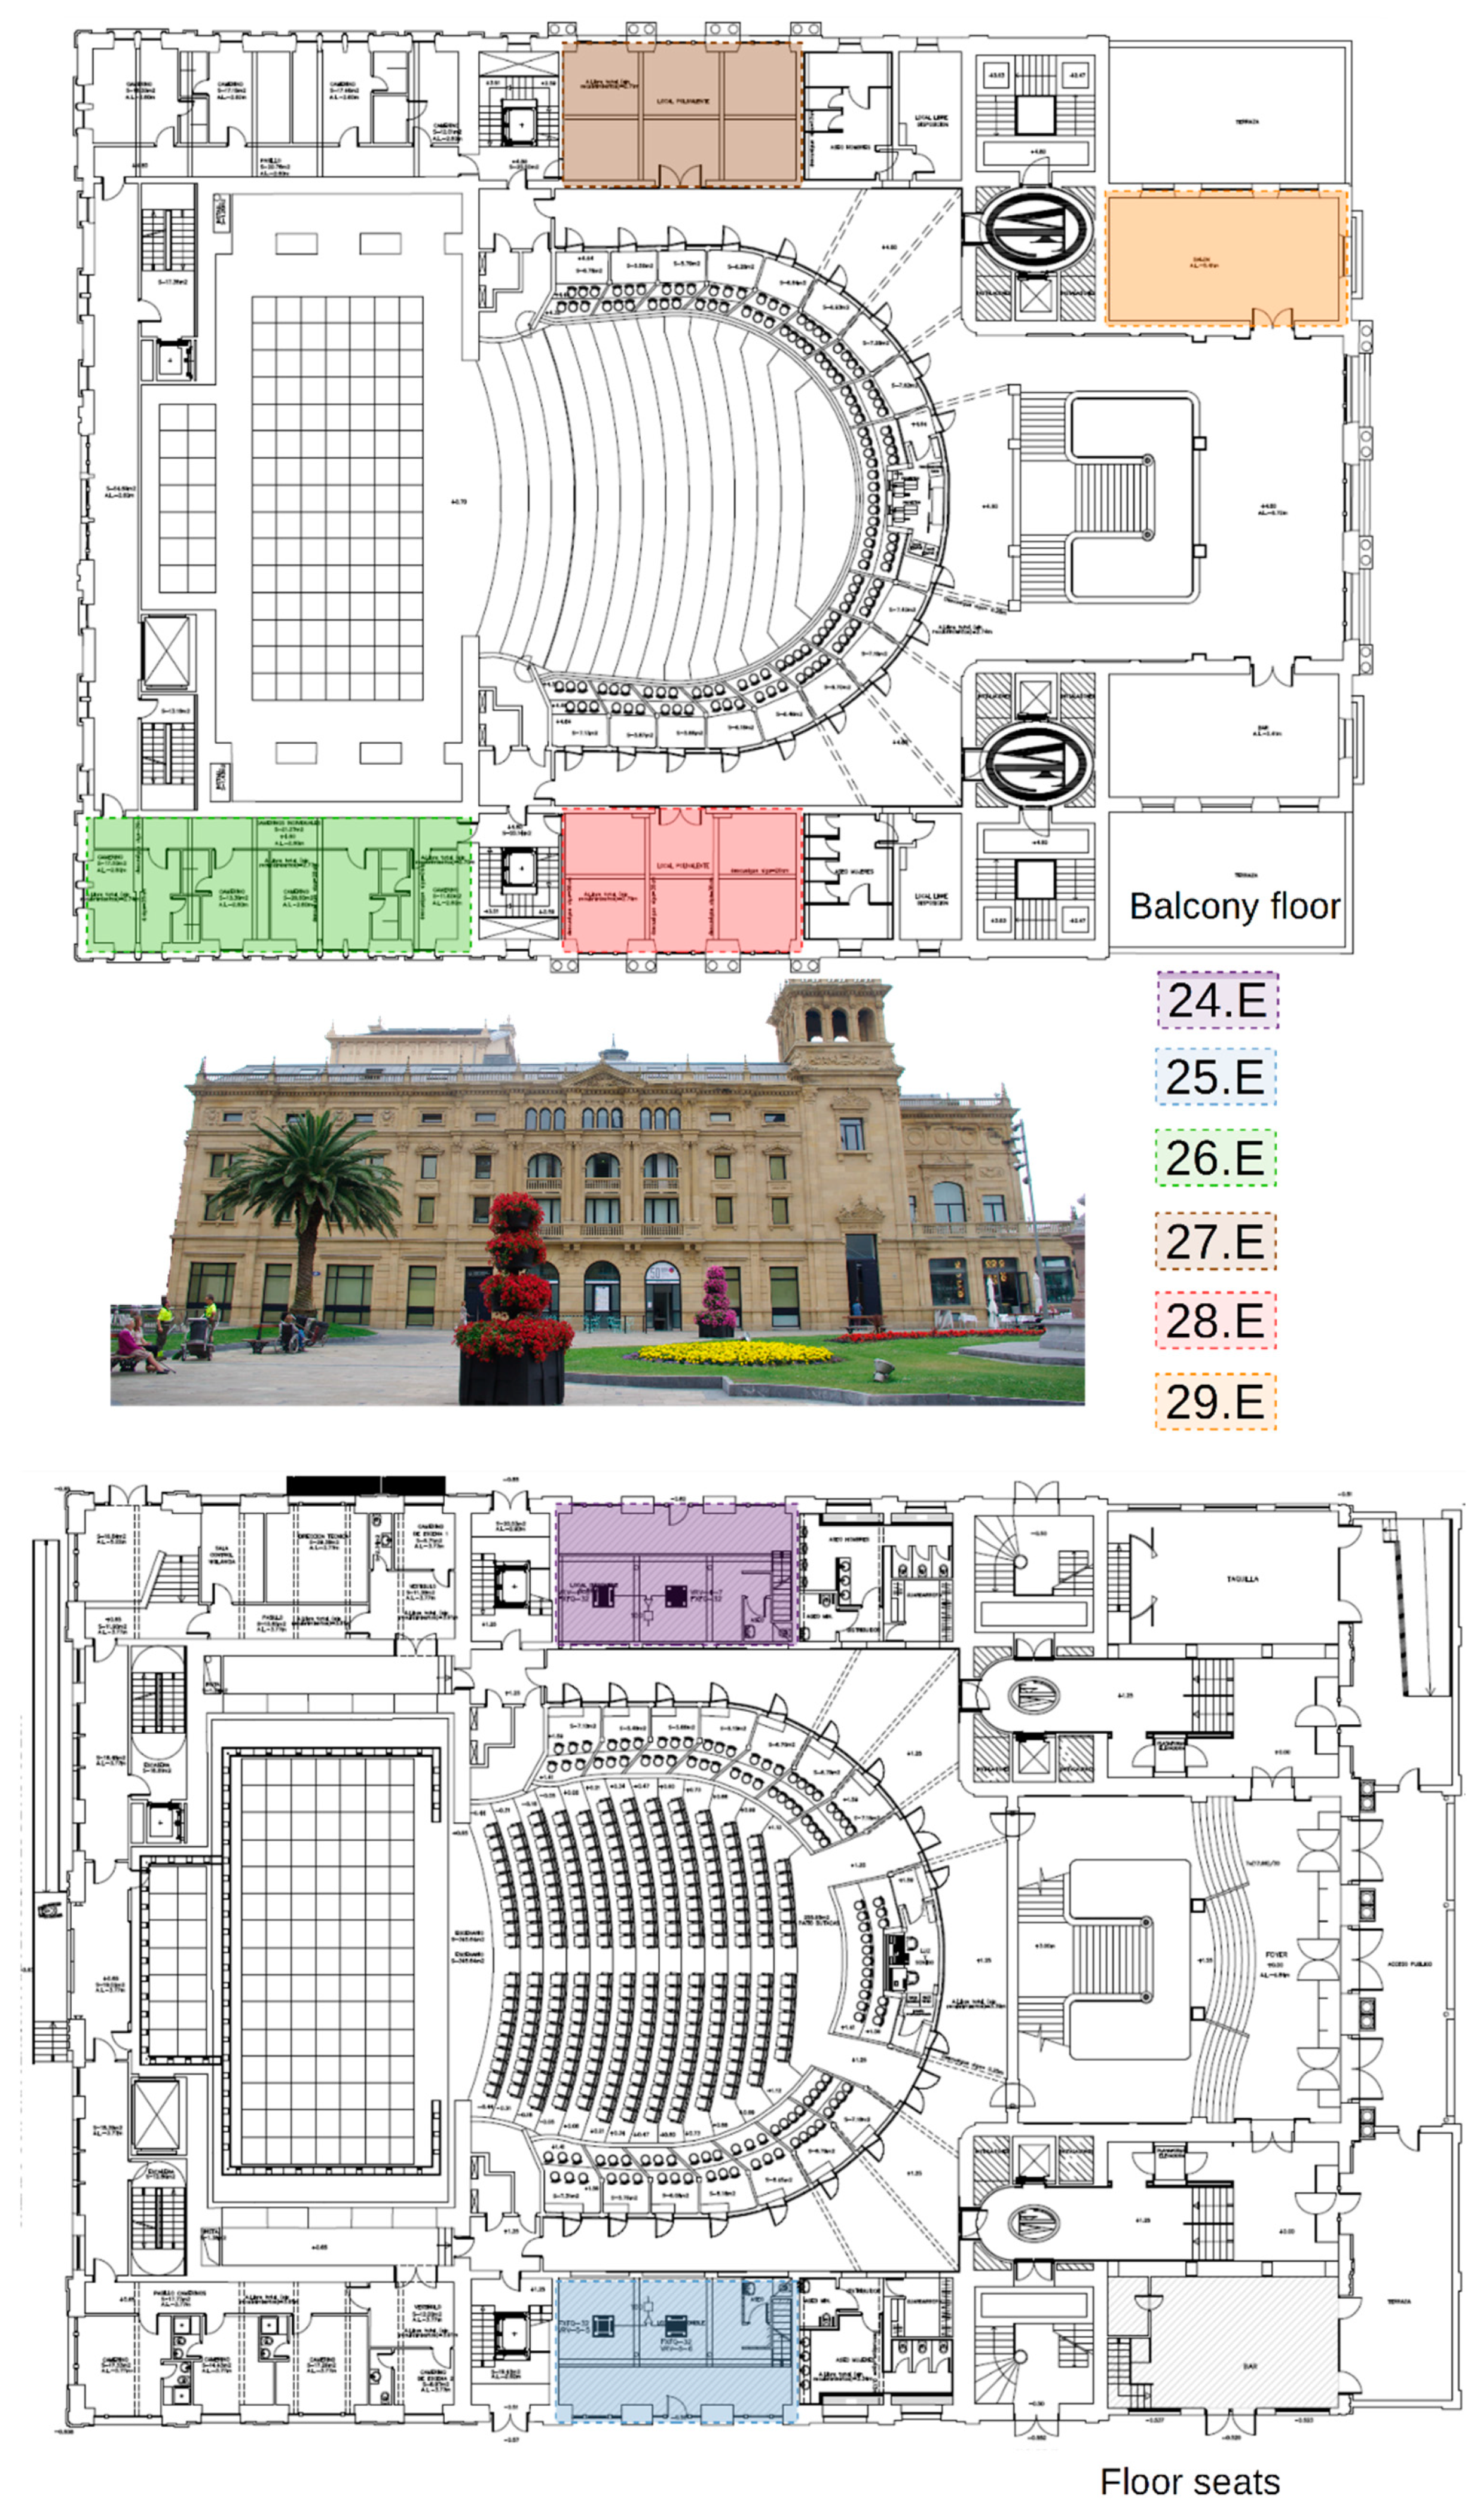
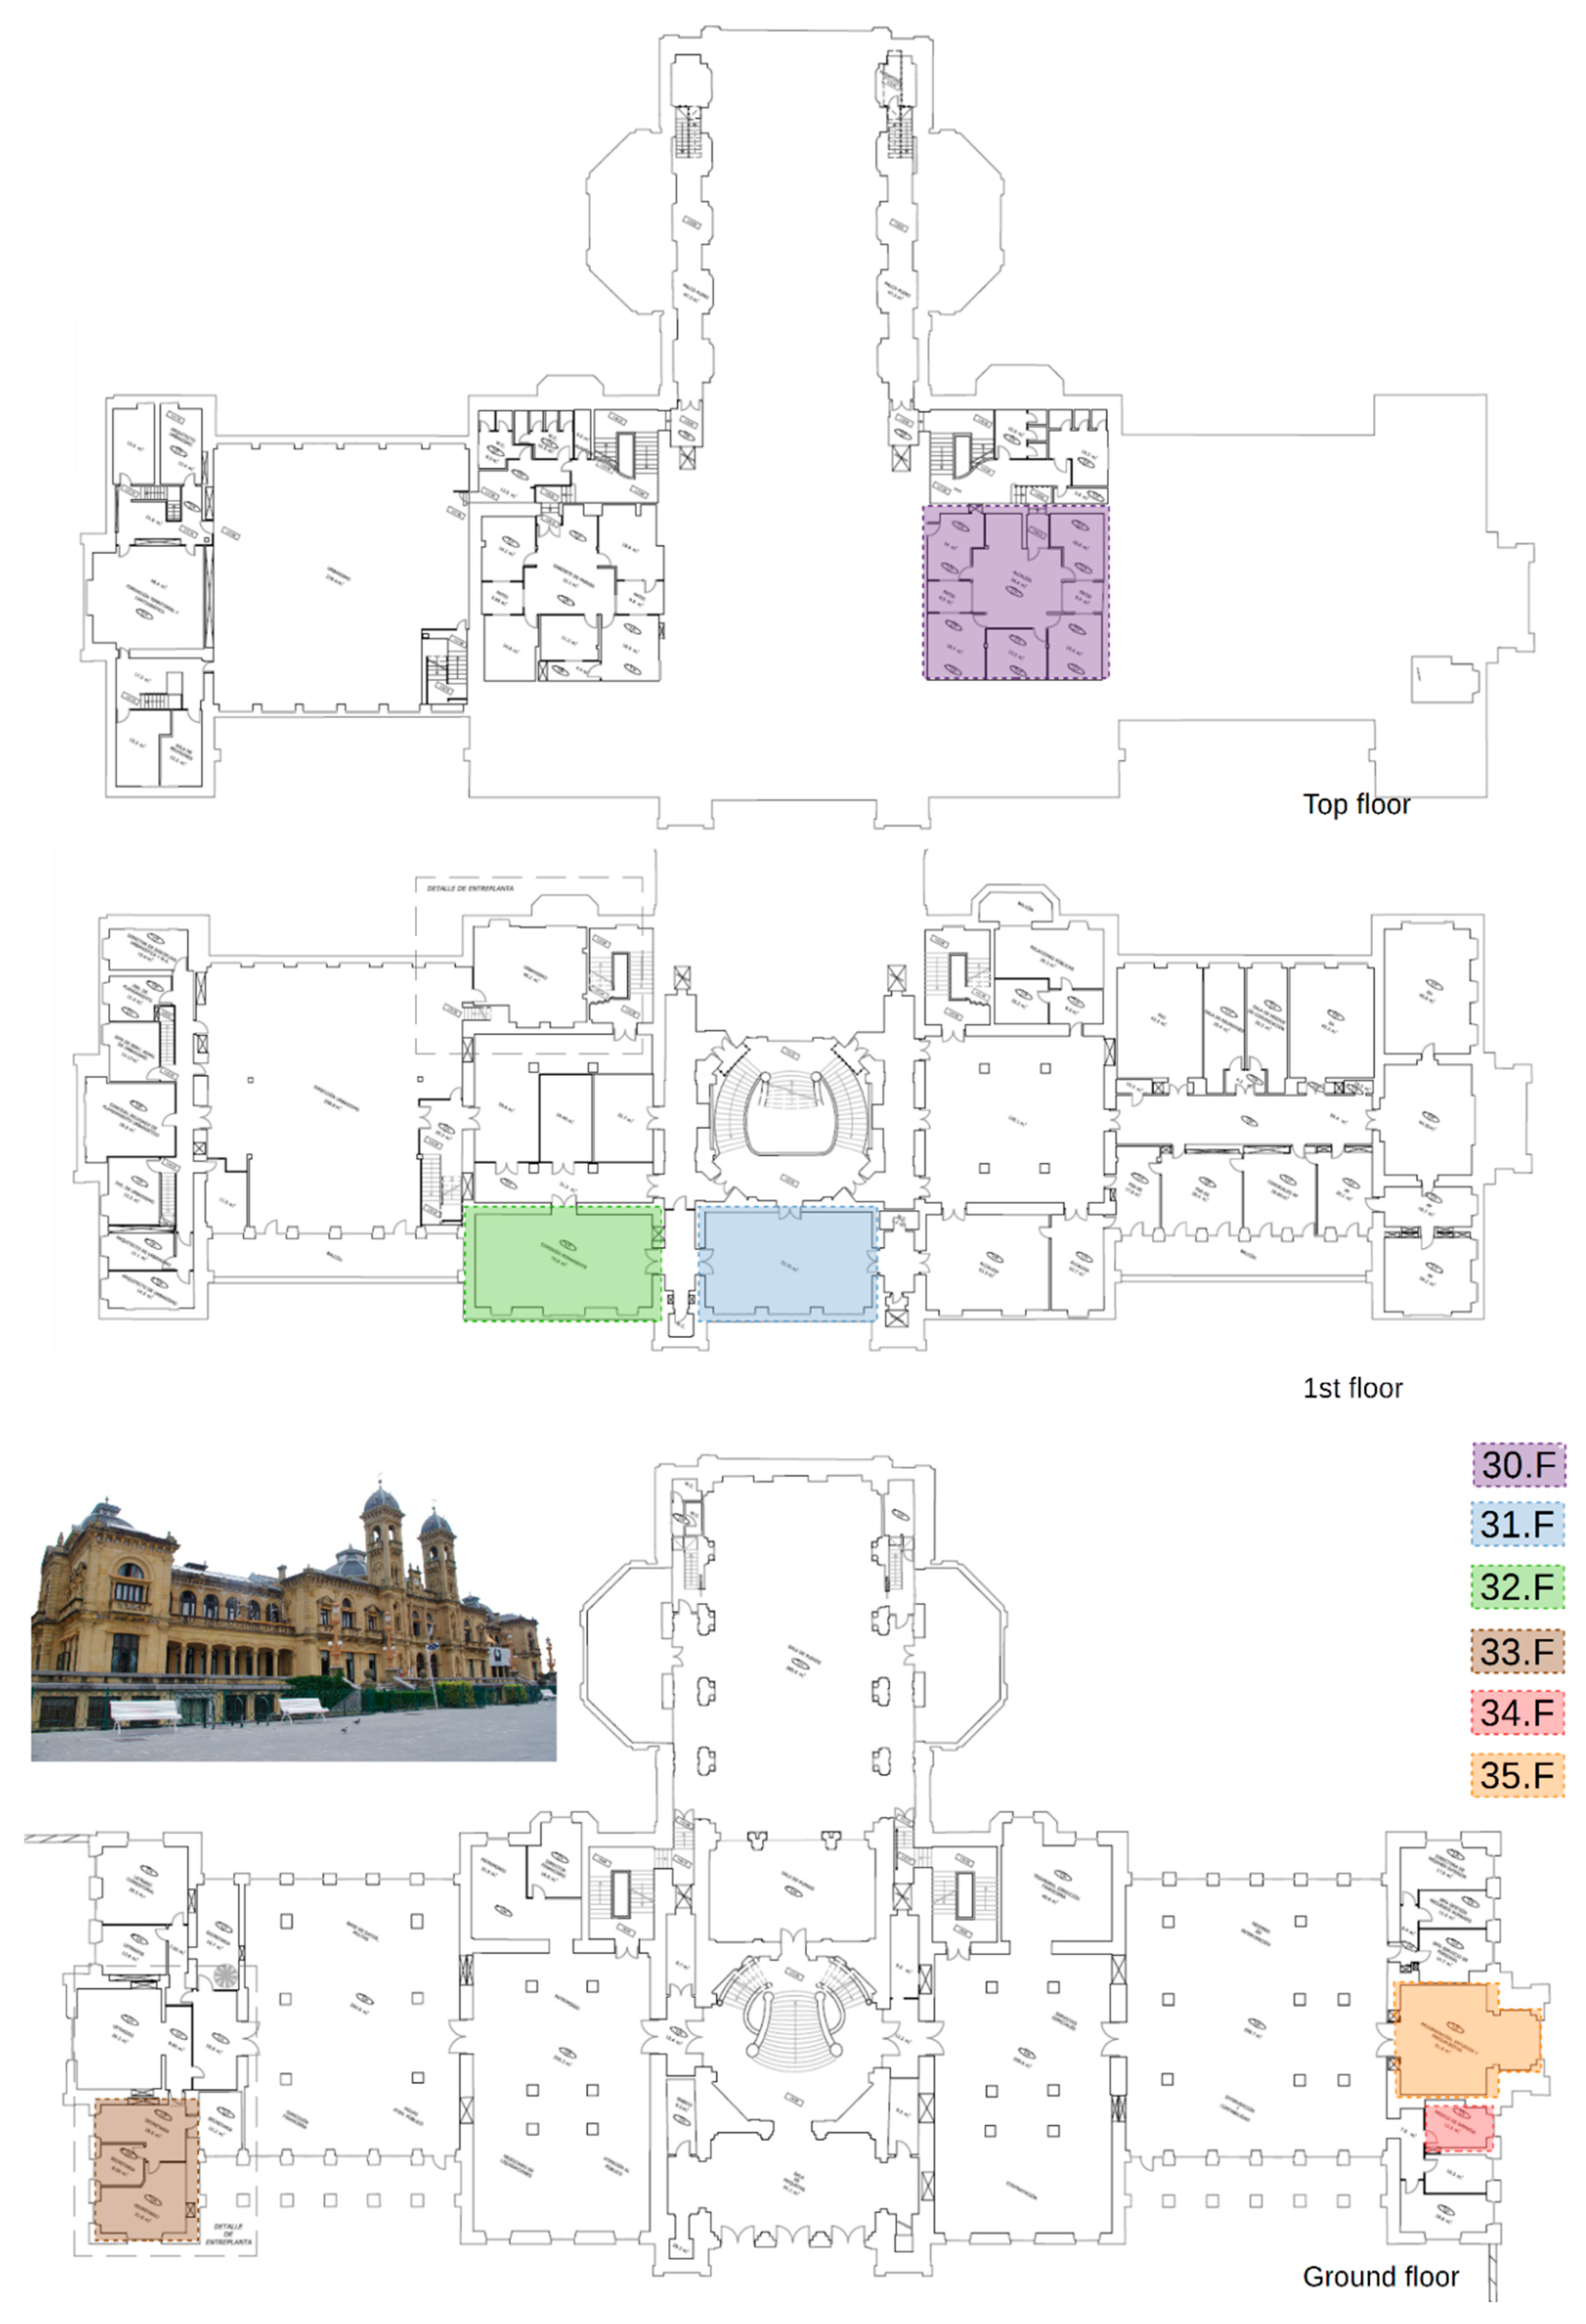
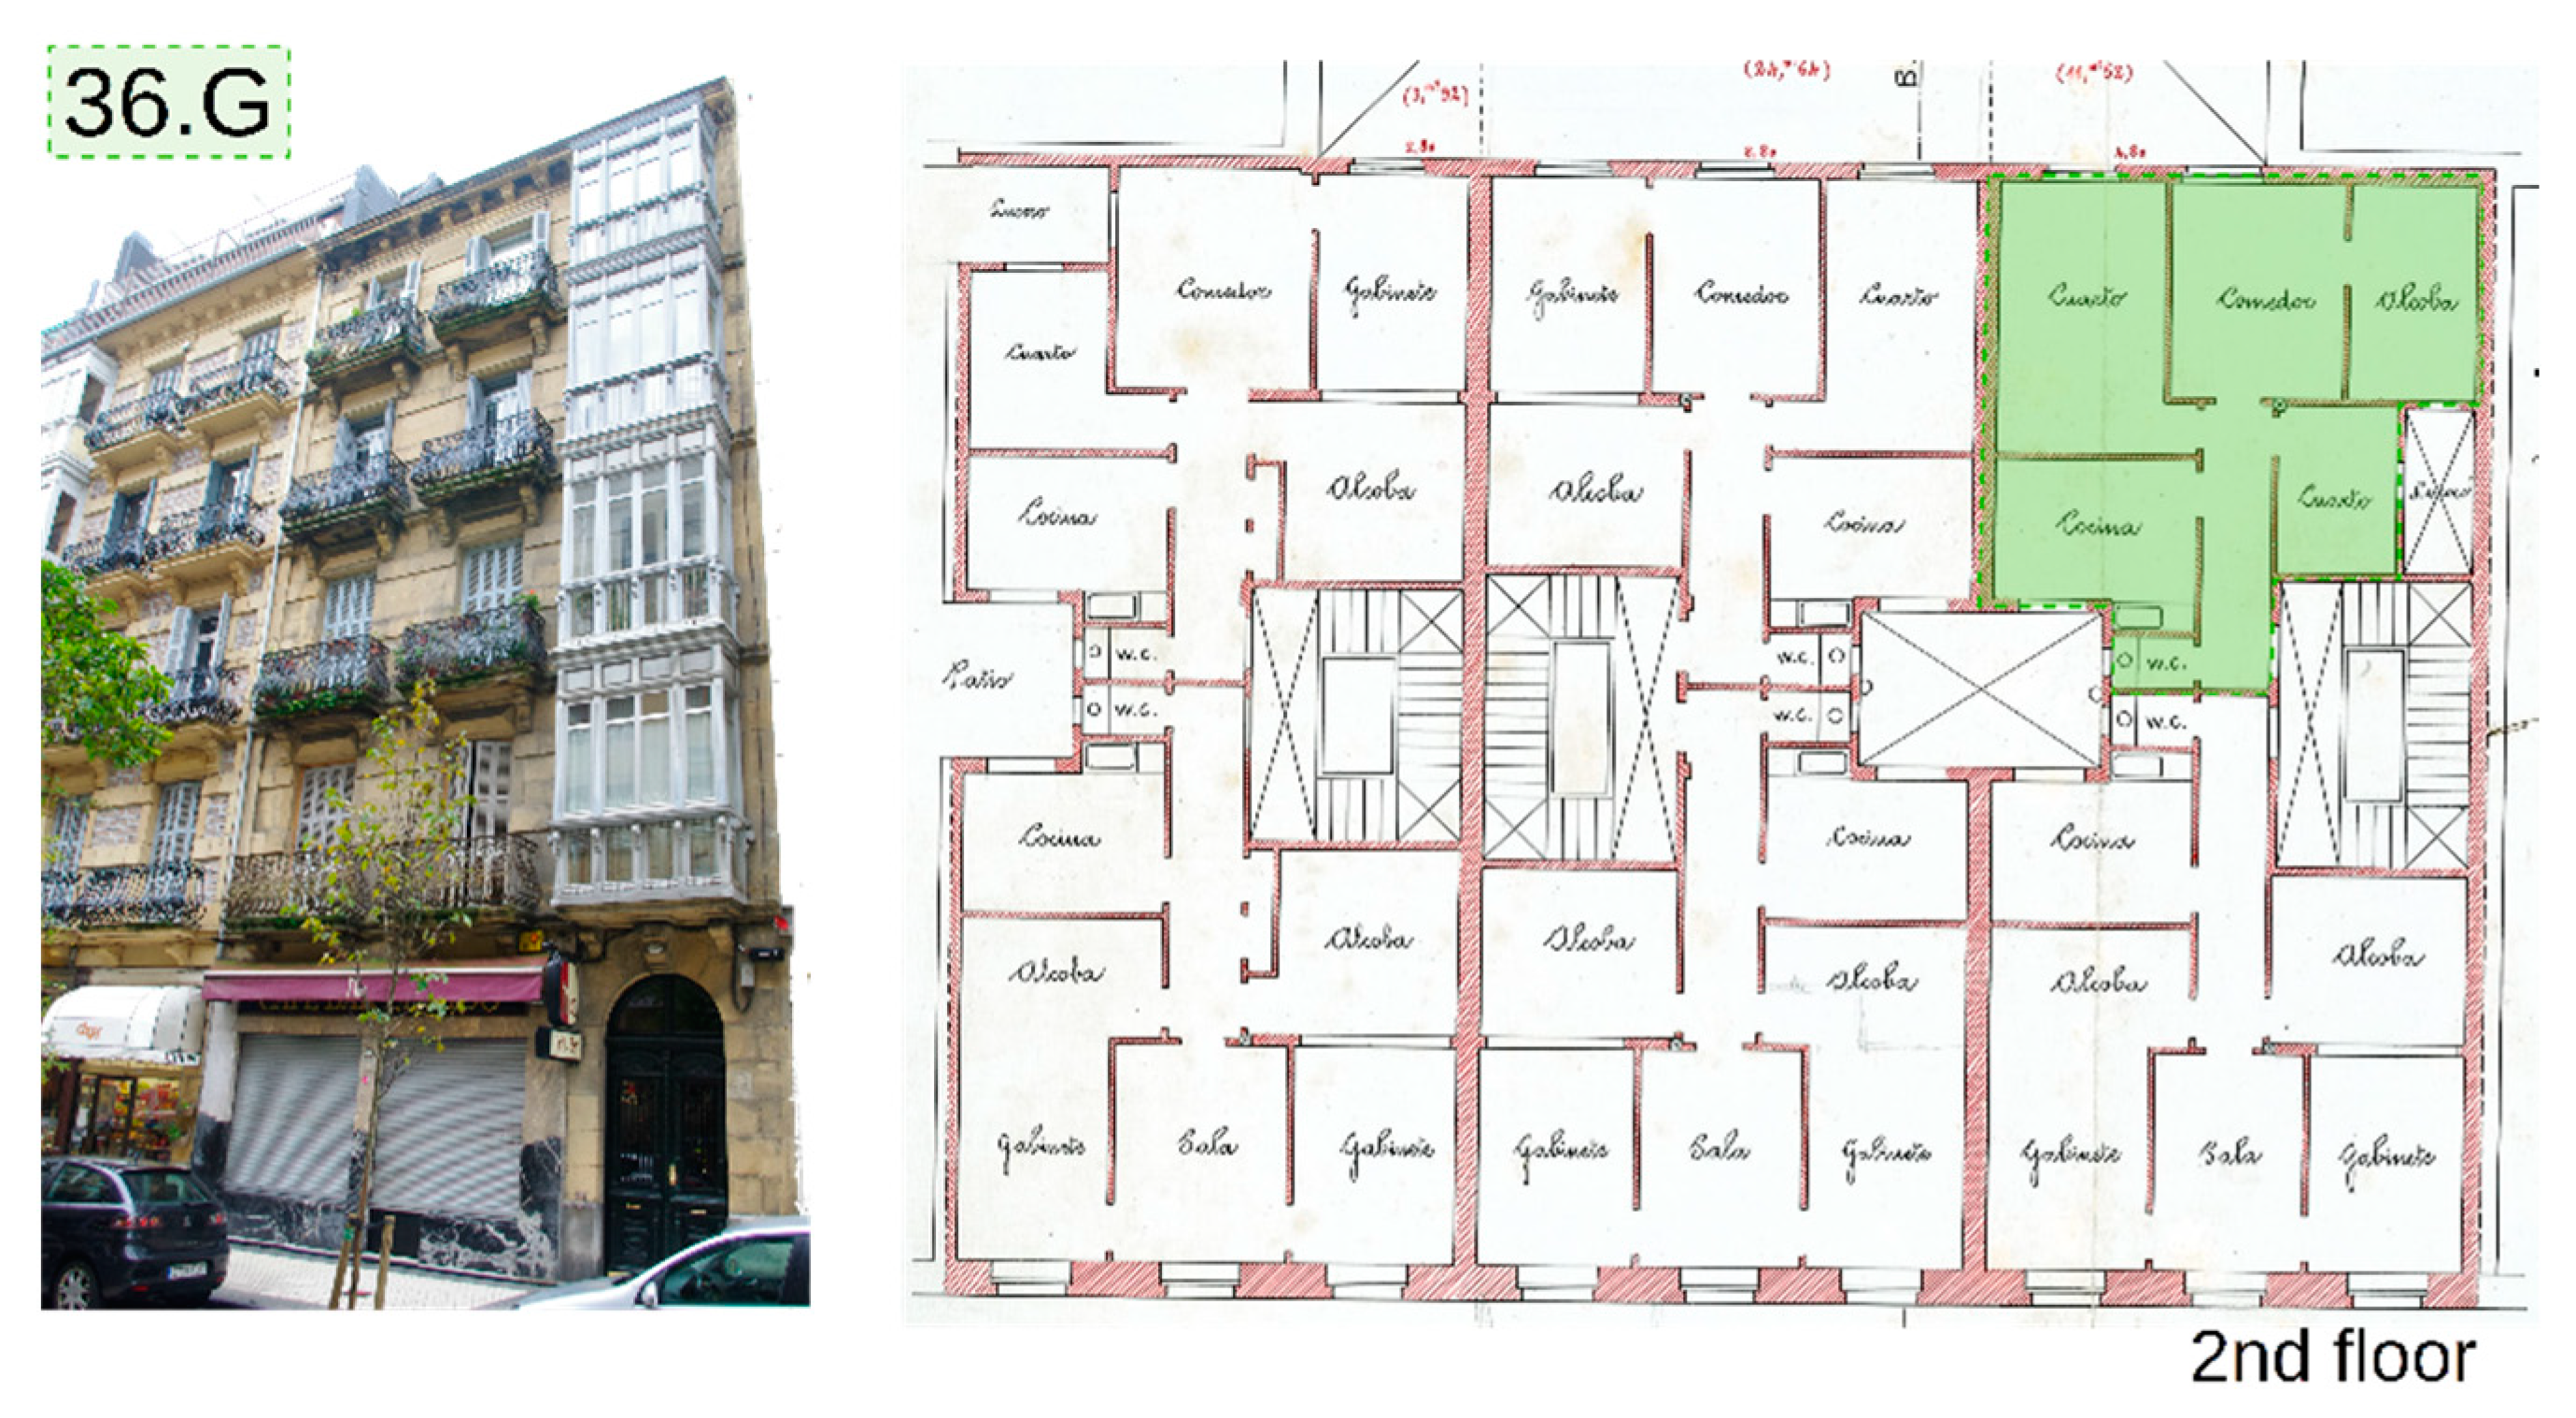
3.2. Case Study and Sample Definition
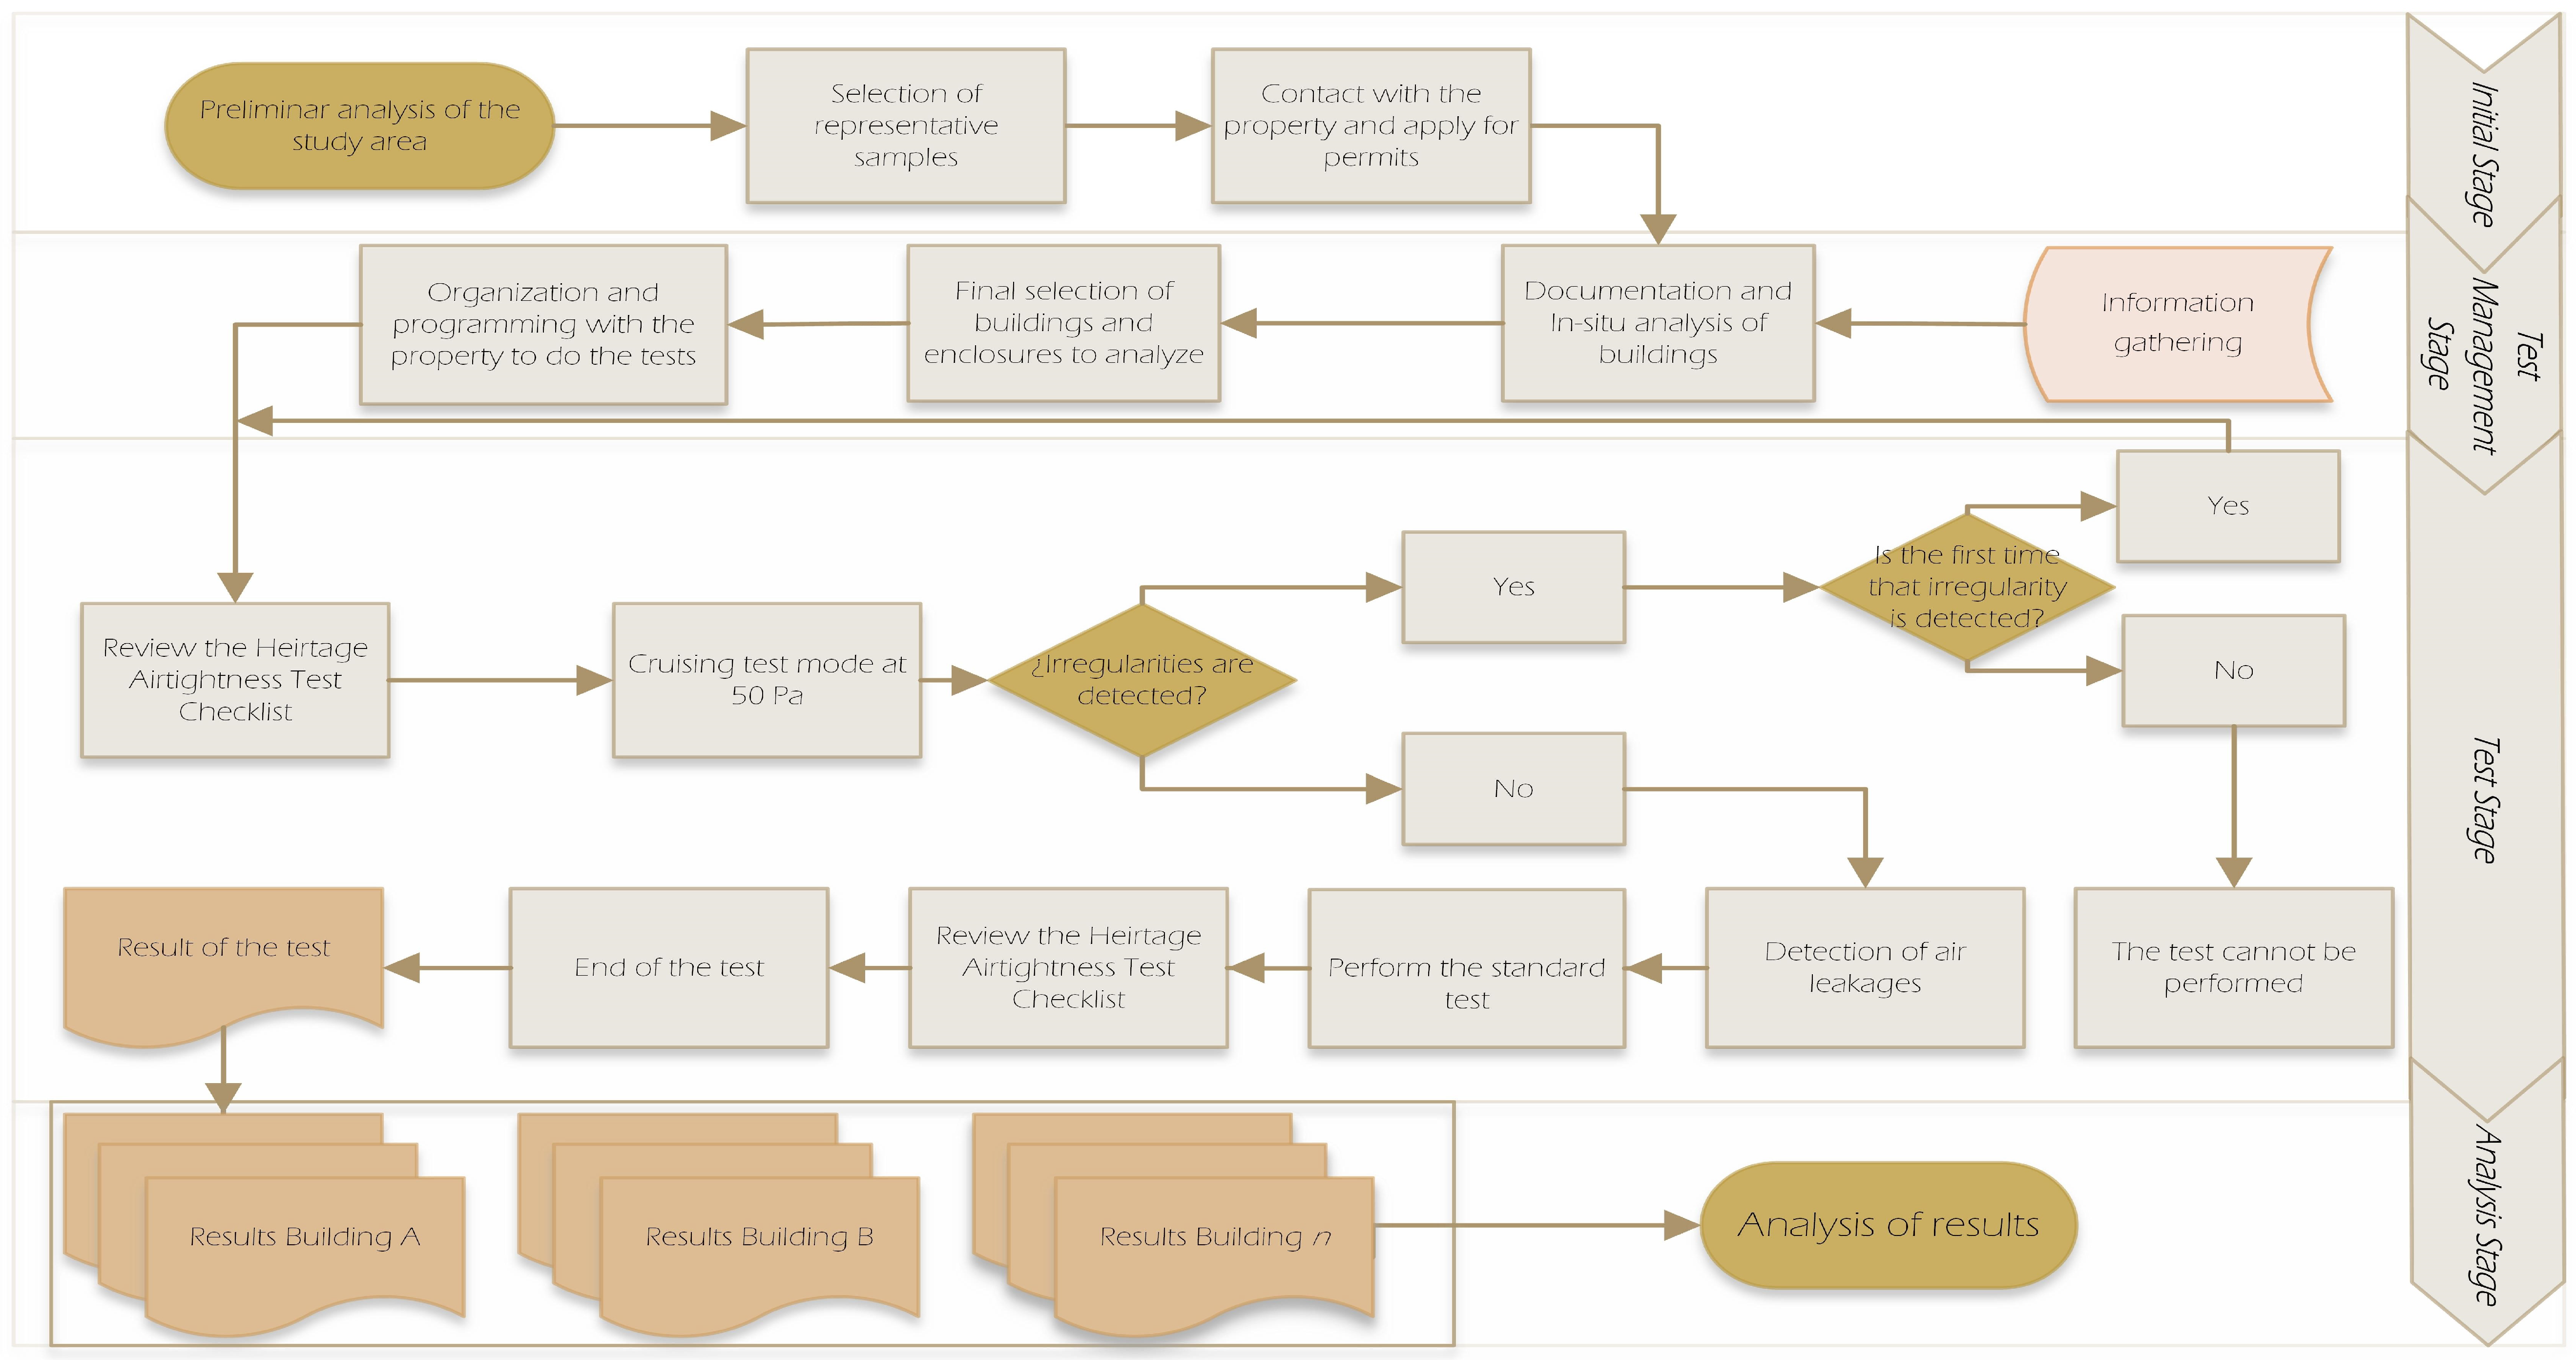
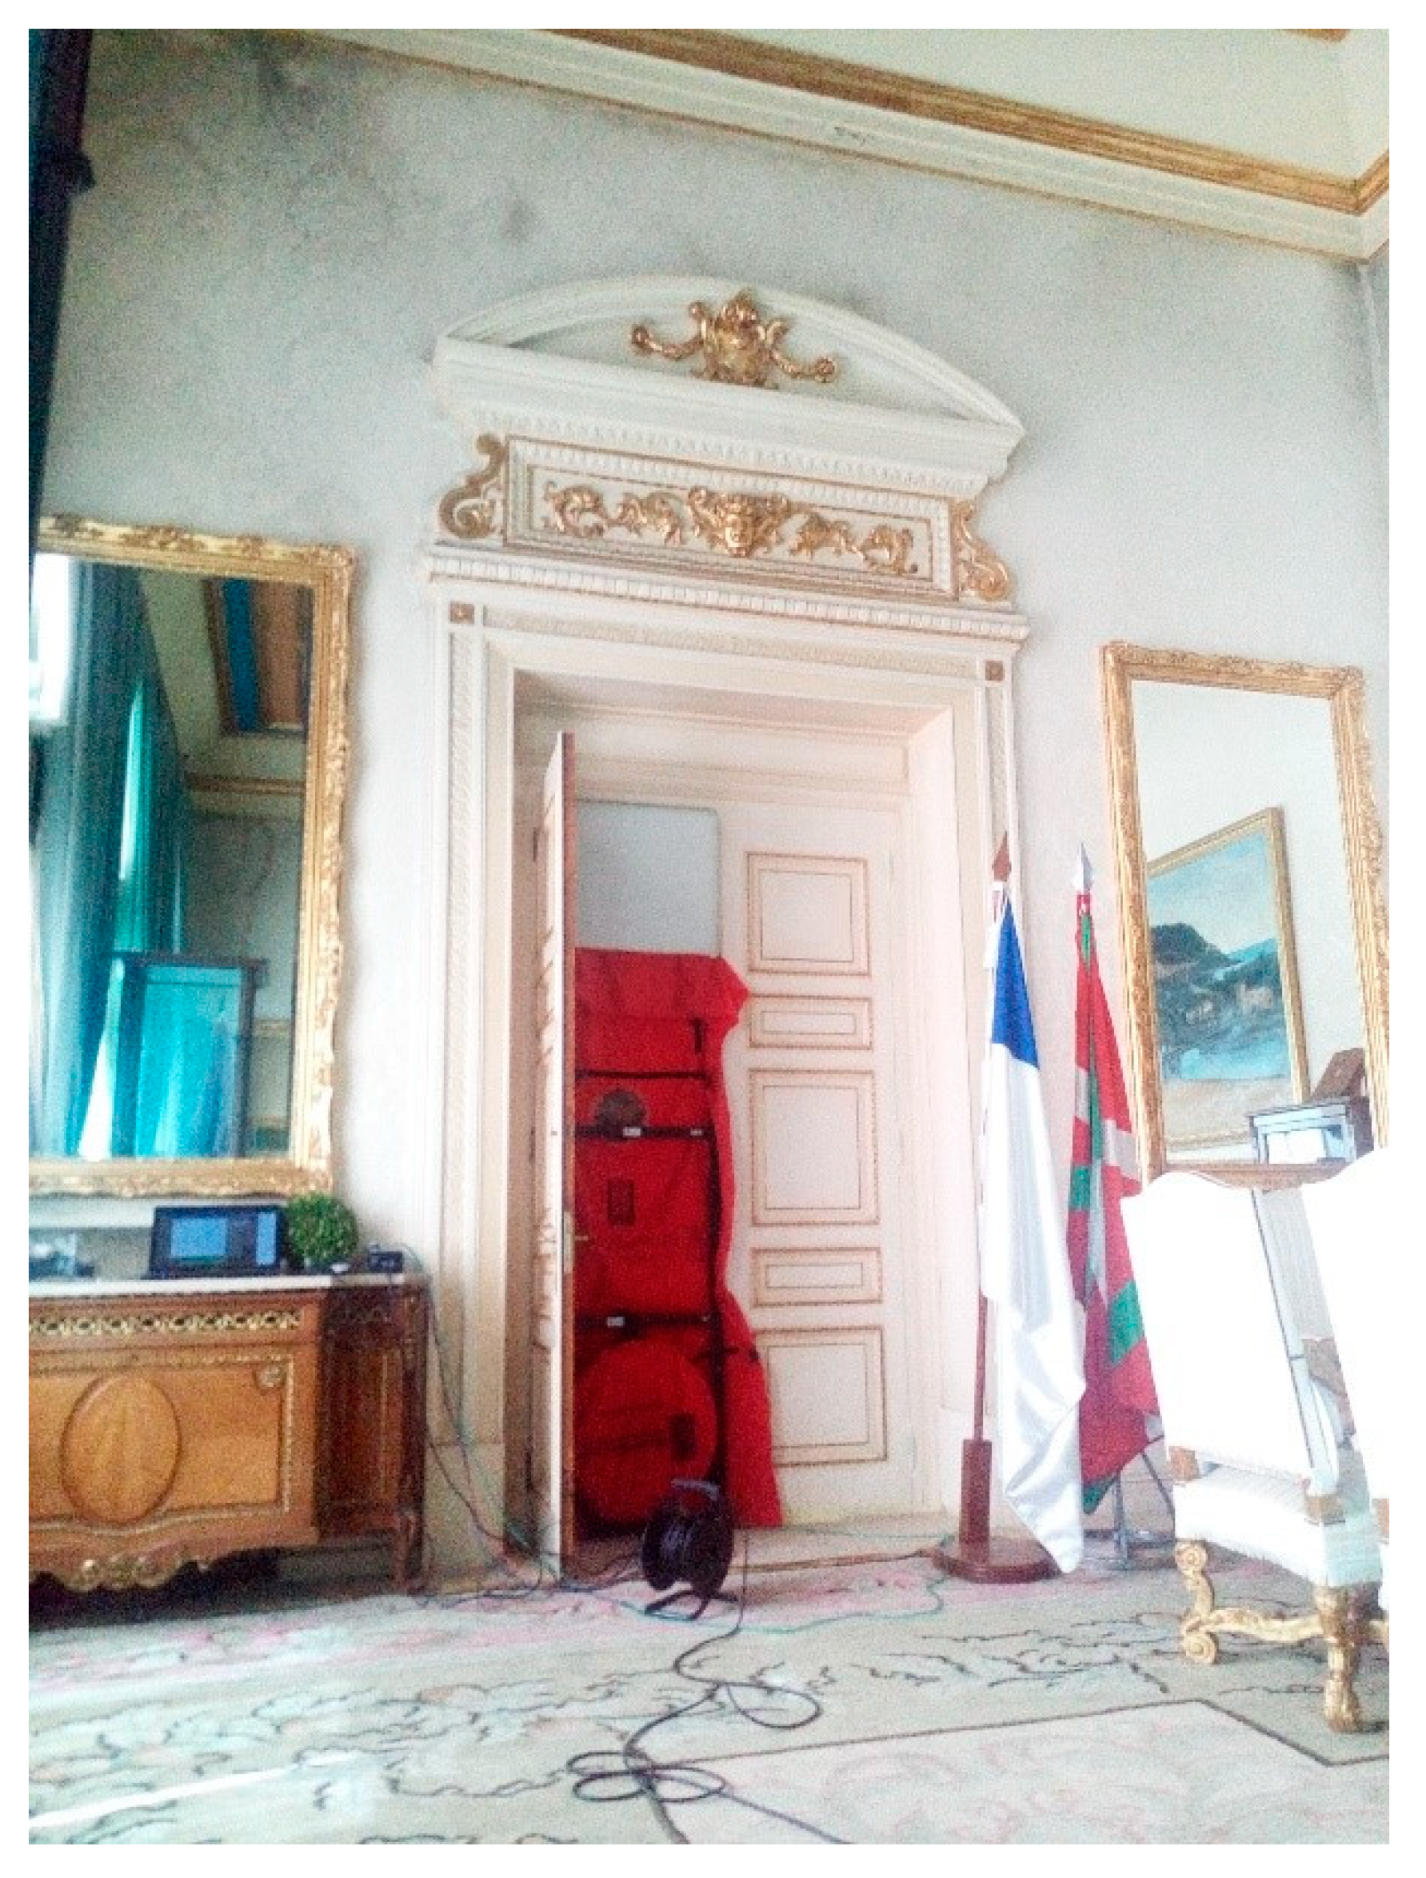
3.3. Methodology
4. Results
5. Analysis and Discussion
- Fenestration, in the wall joints and the joints in the frame, especially in mobile parts.
- Apertures across the envelope to let ducts or conduits go inside (fresh water, waste water, gas and/or ventilation)
- Electrical devices (switchboards, plugs, switches, lighting)
- Large cracks caused by ground settlement or cavities in wooden structure.
- Baseboards and in tongue and grove joints of the floor boards.
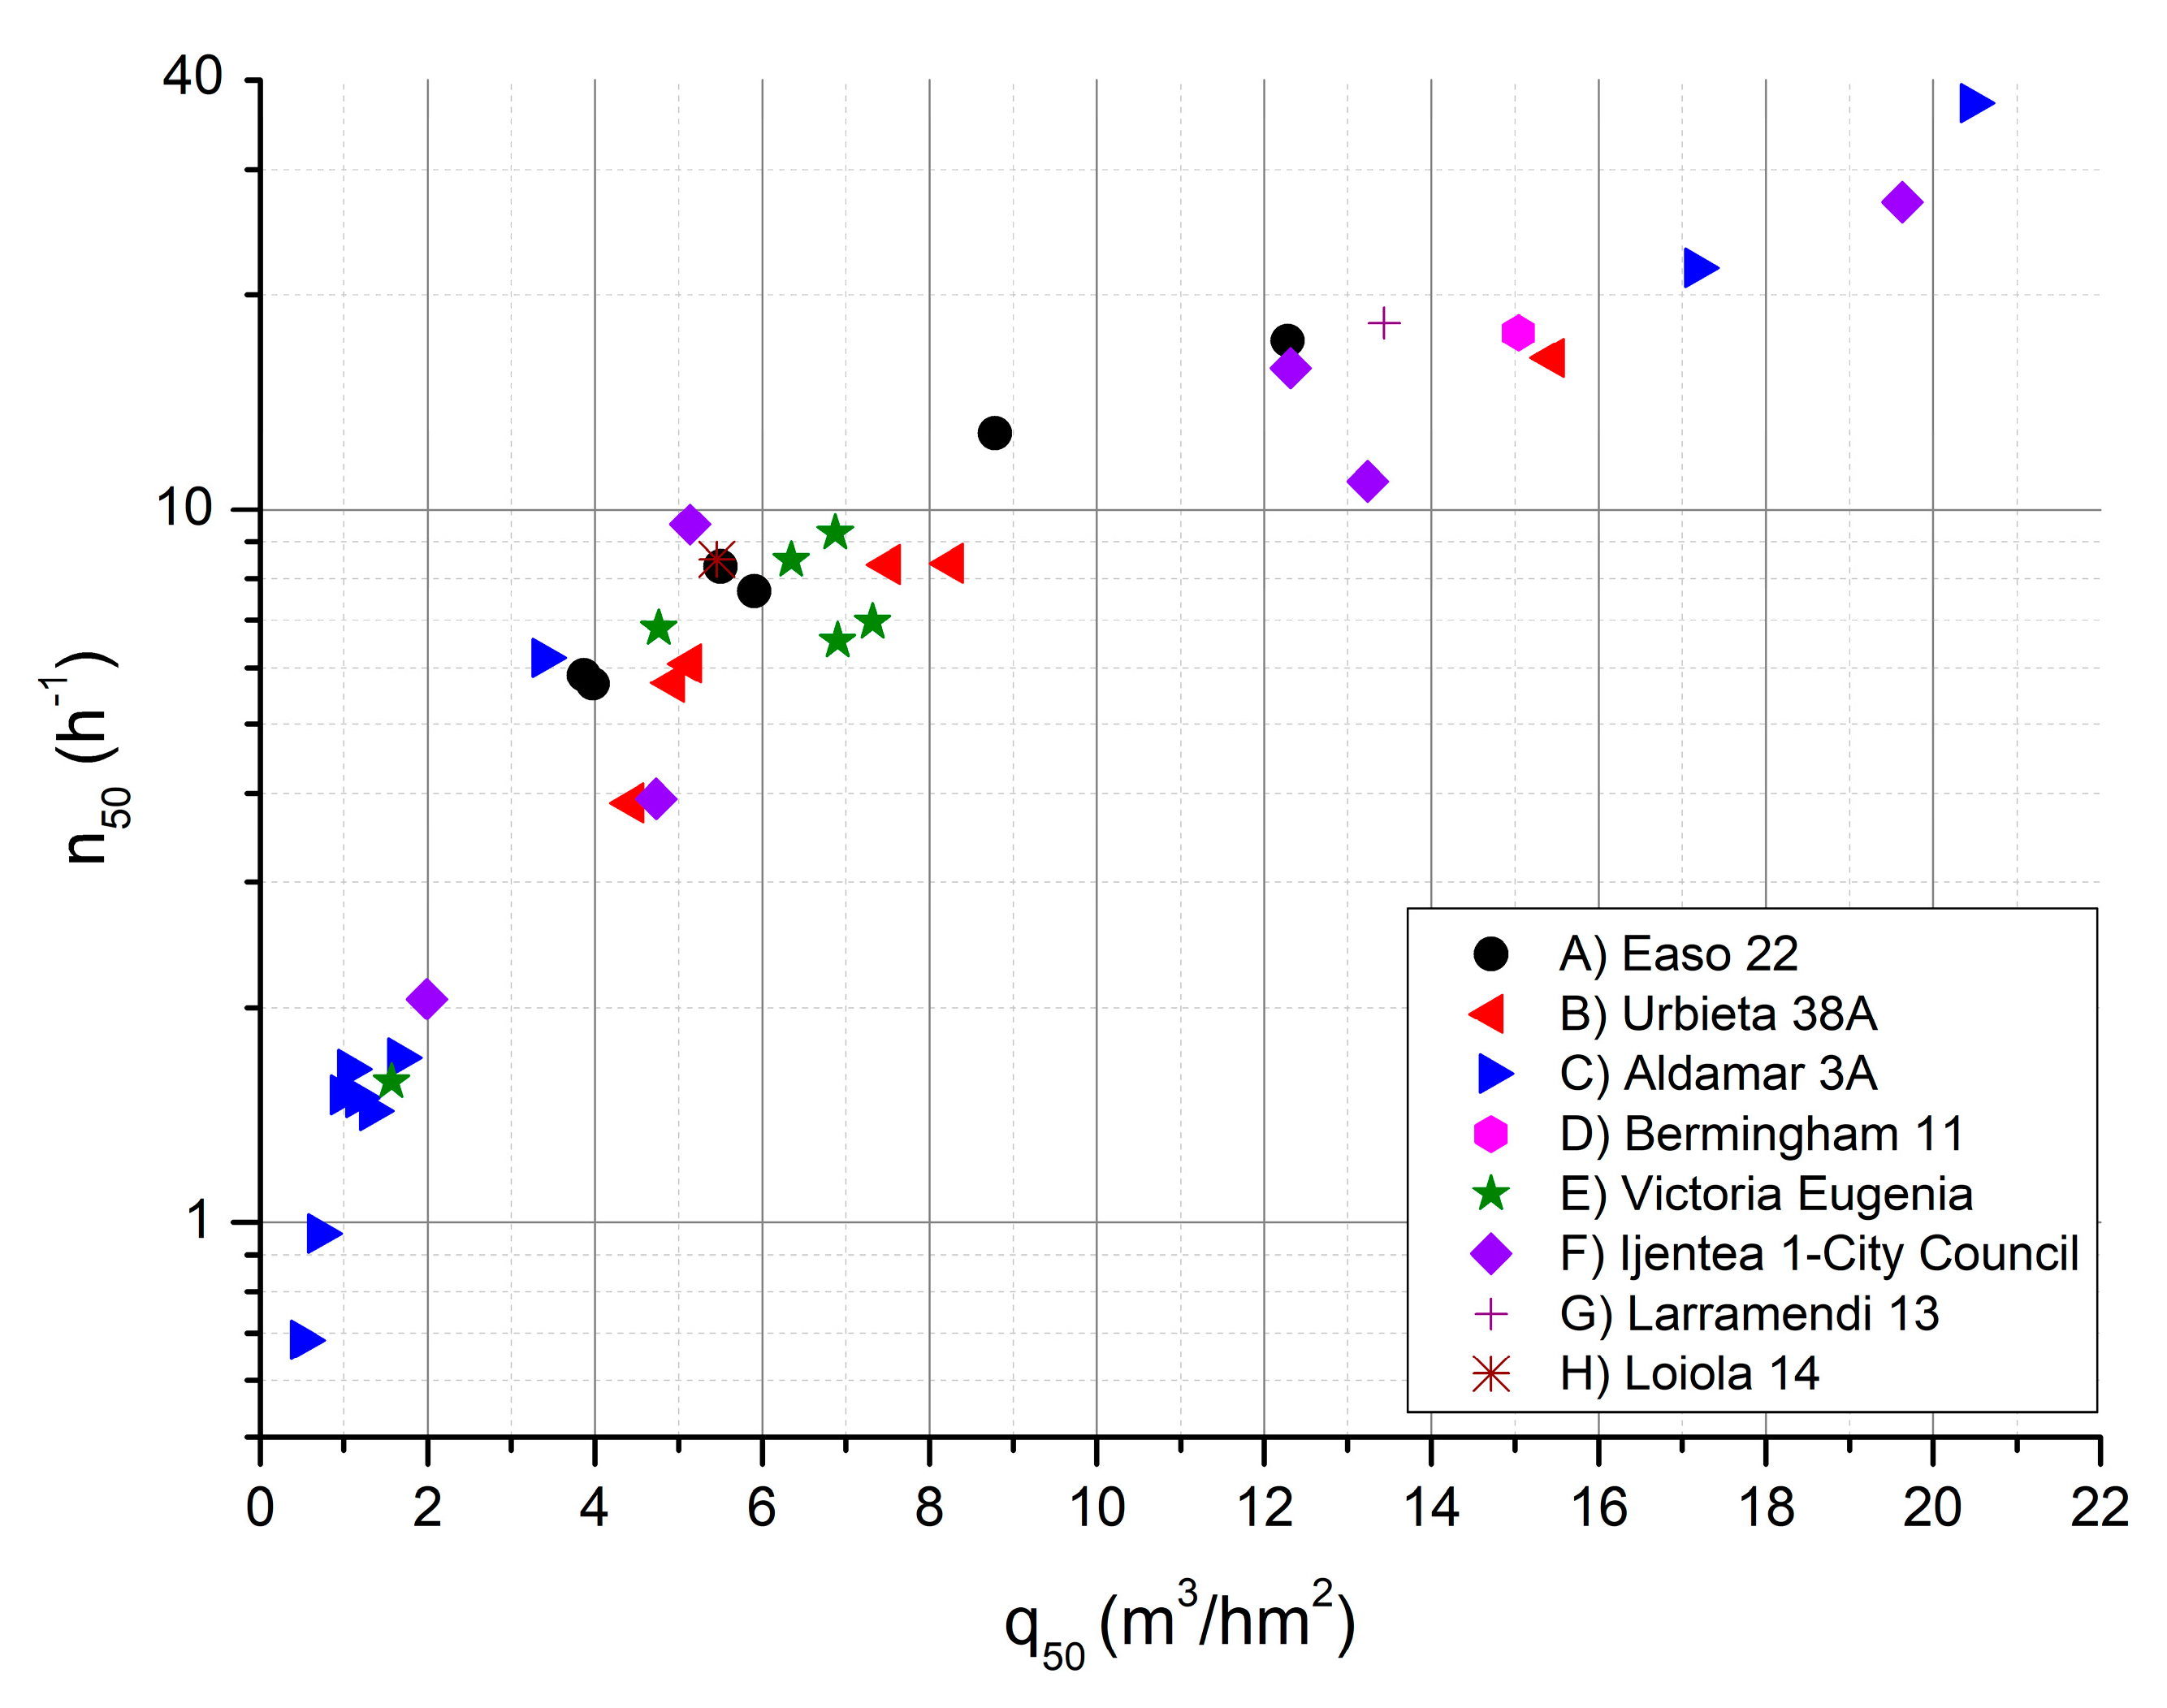
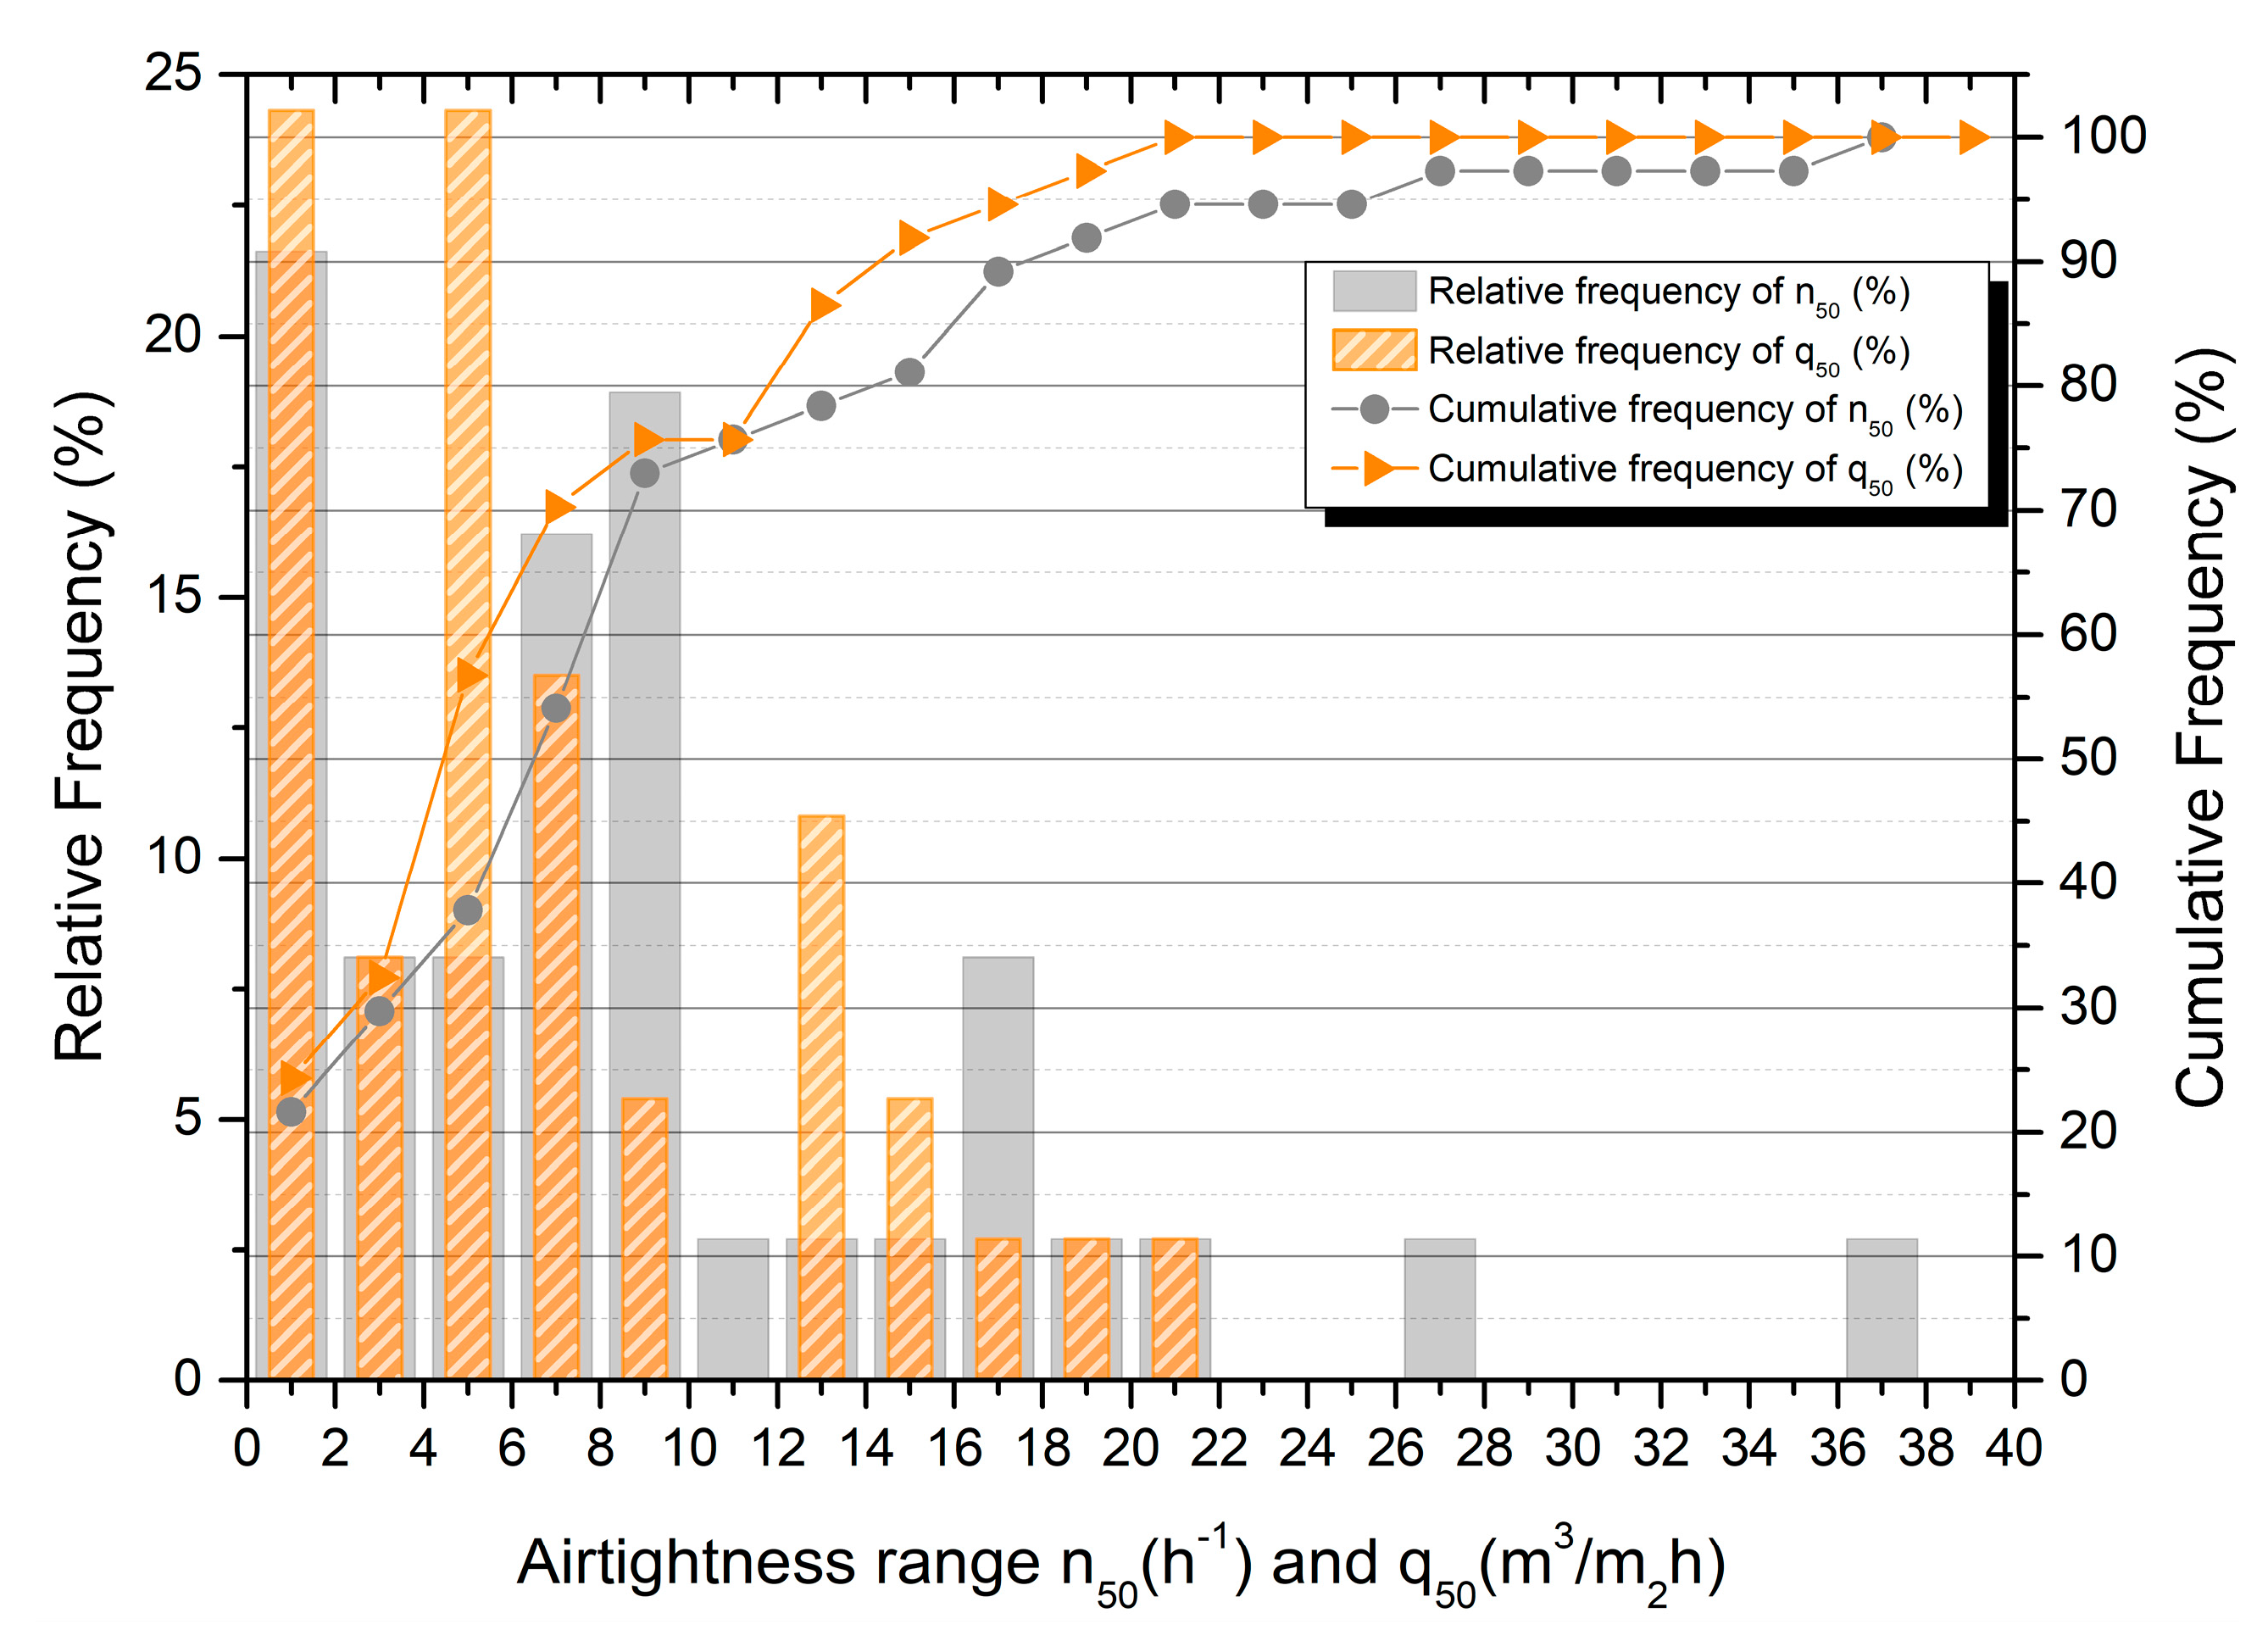
5.1. Airtightness Values
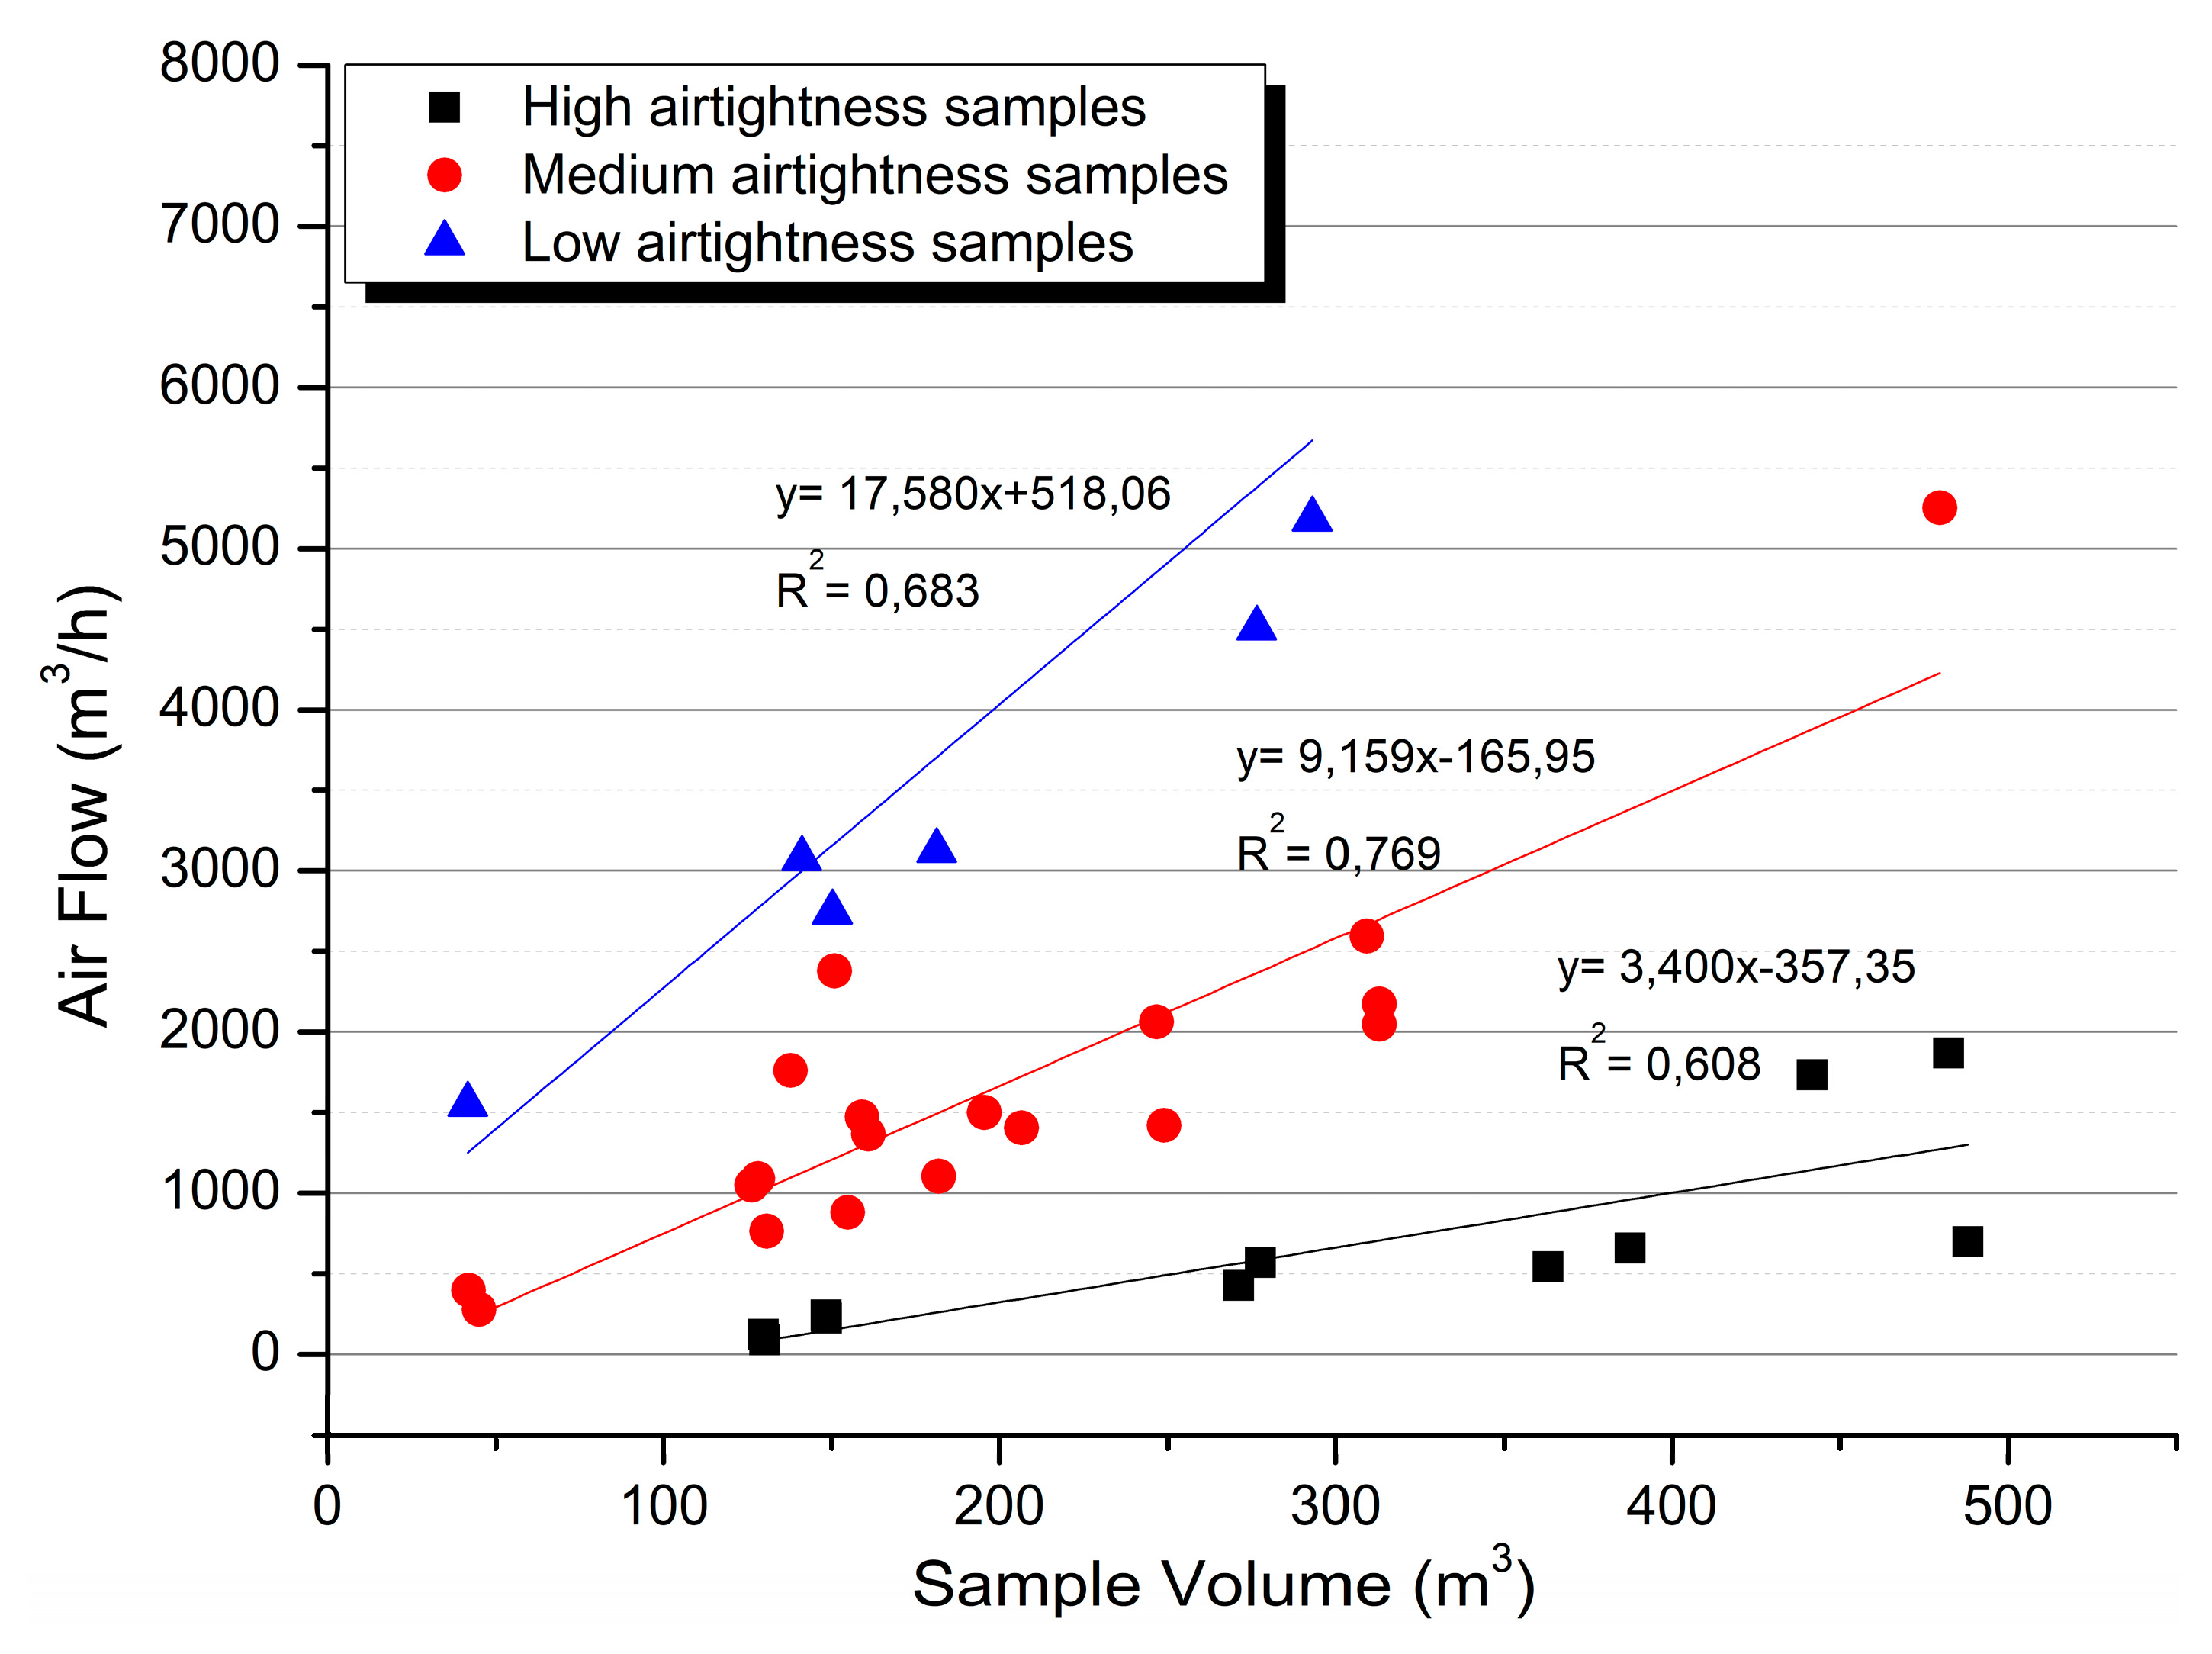
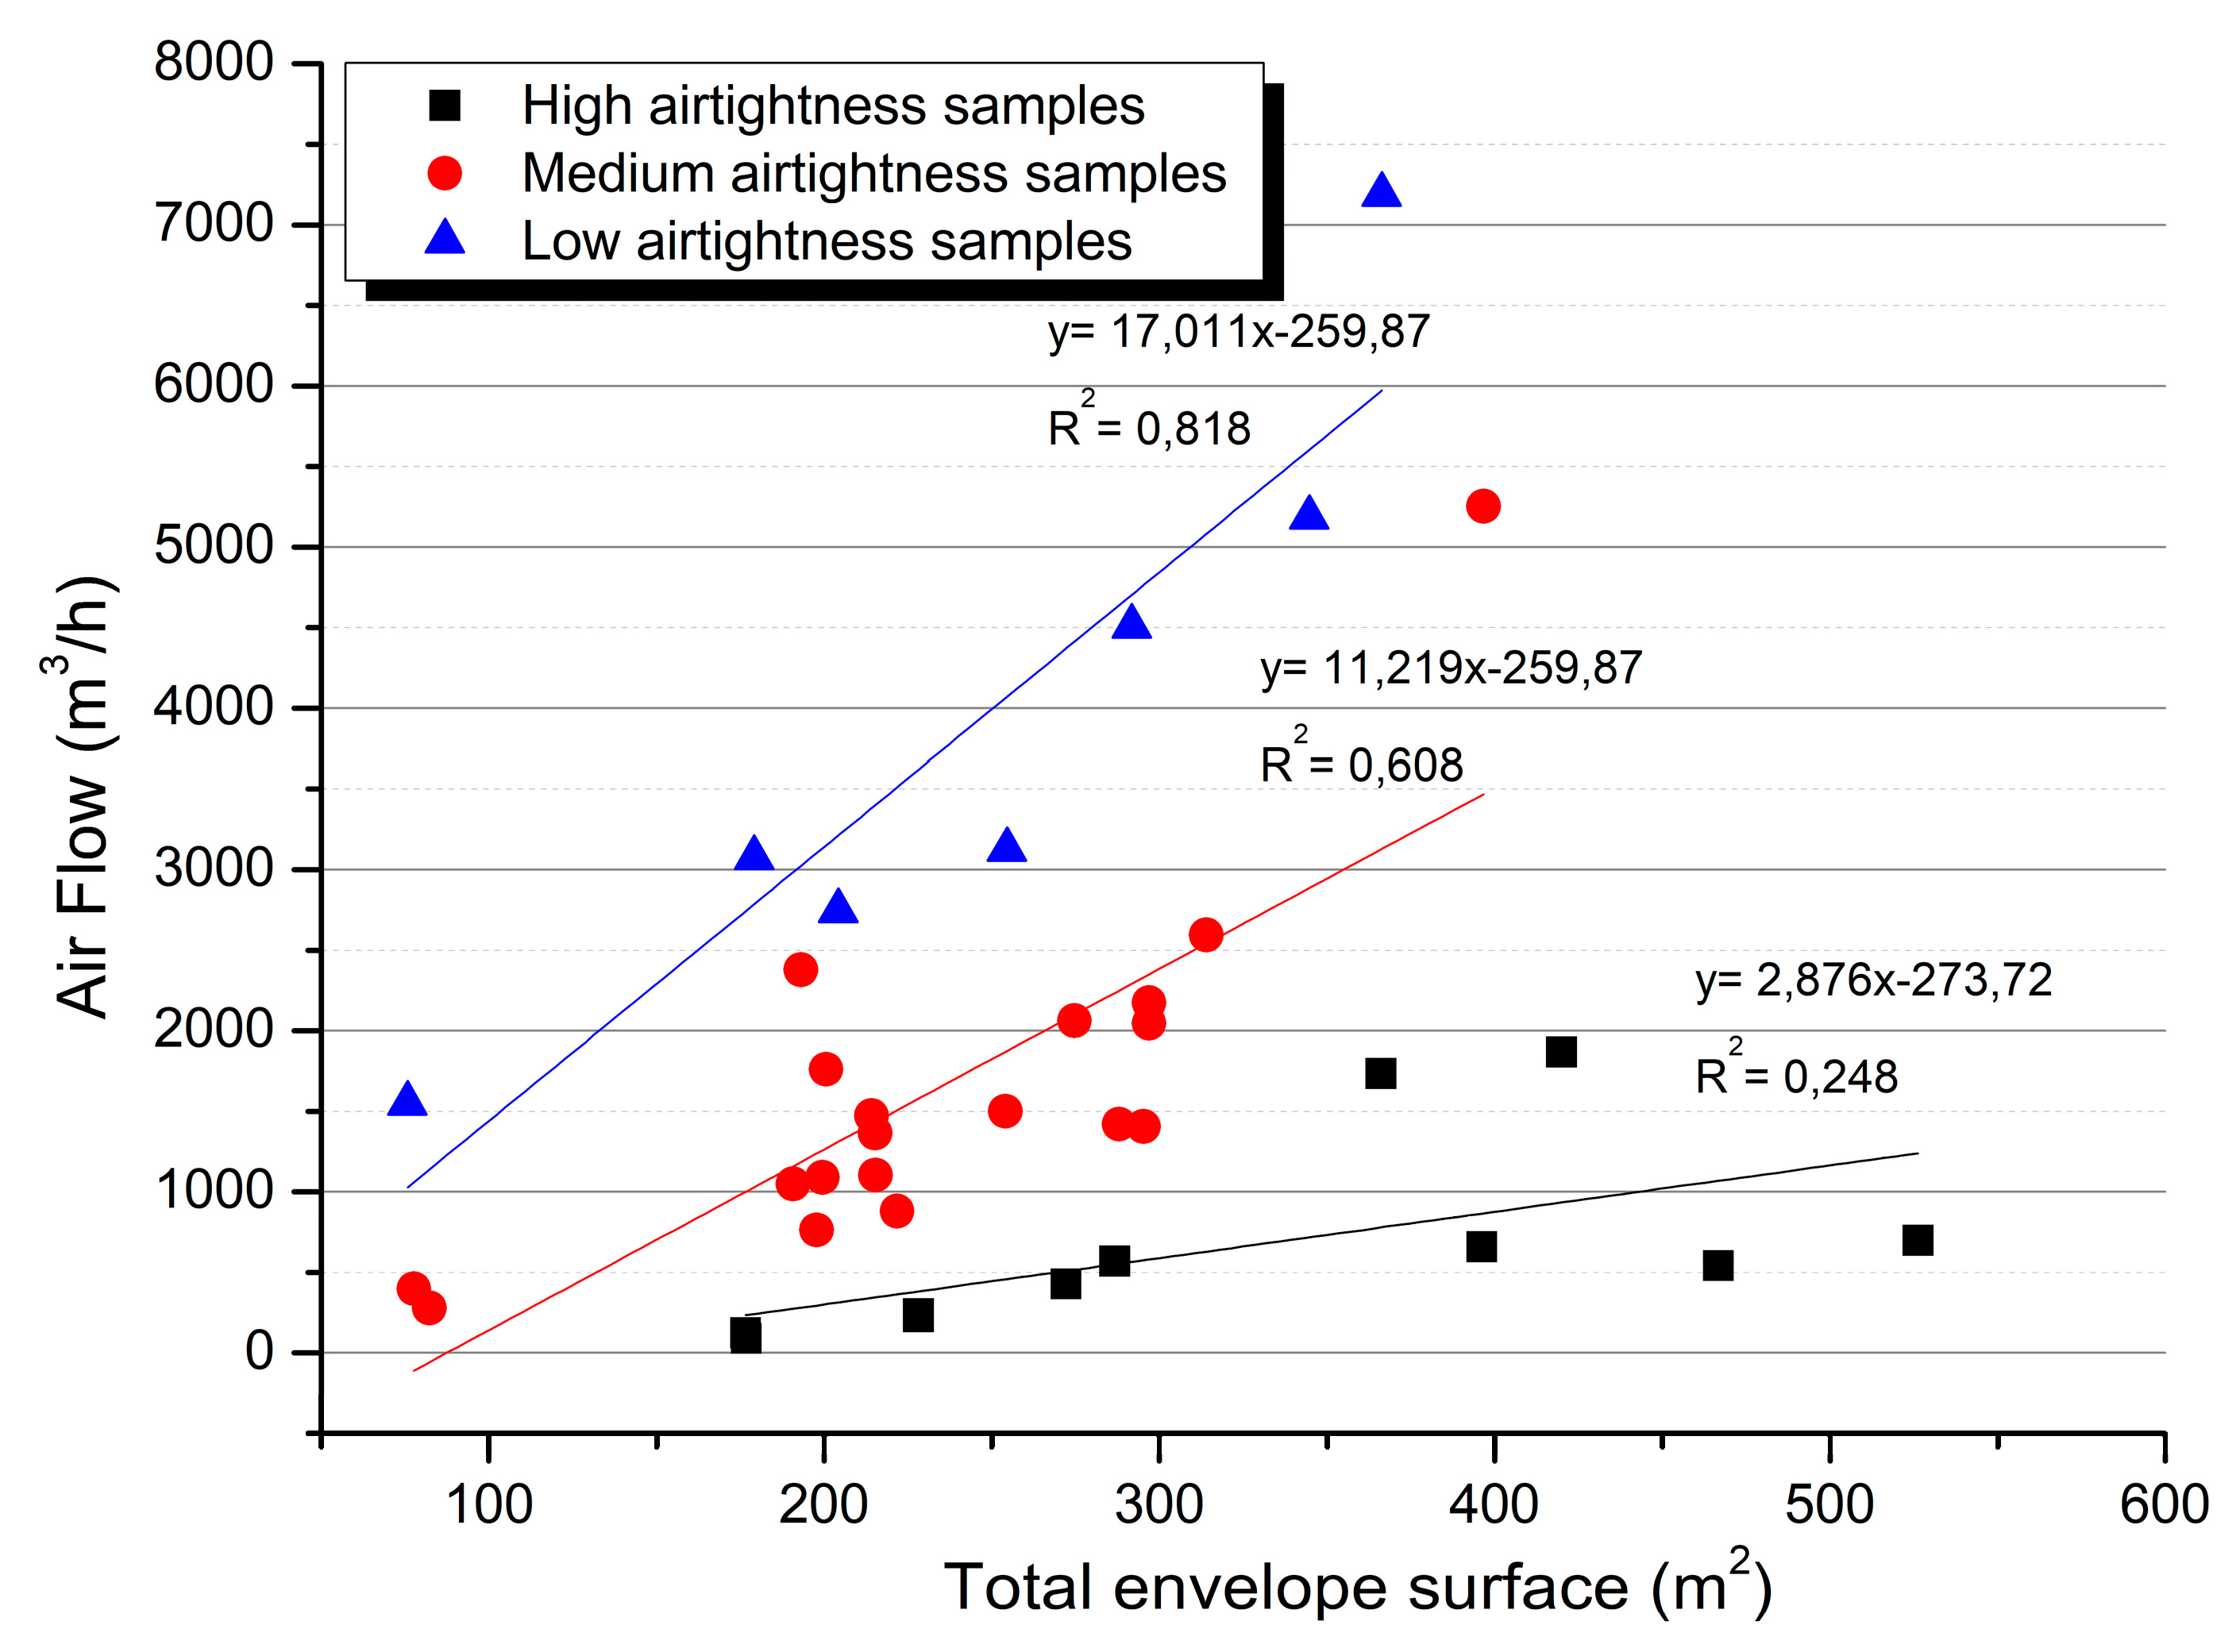
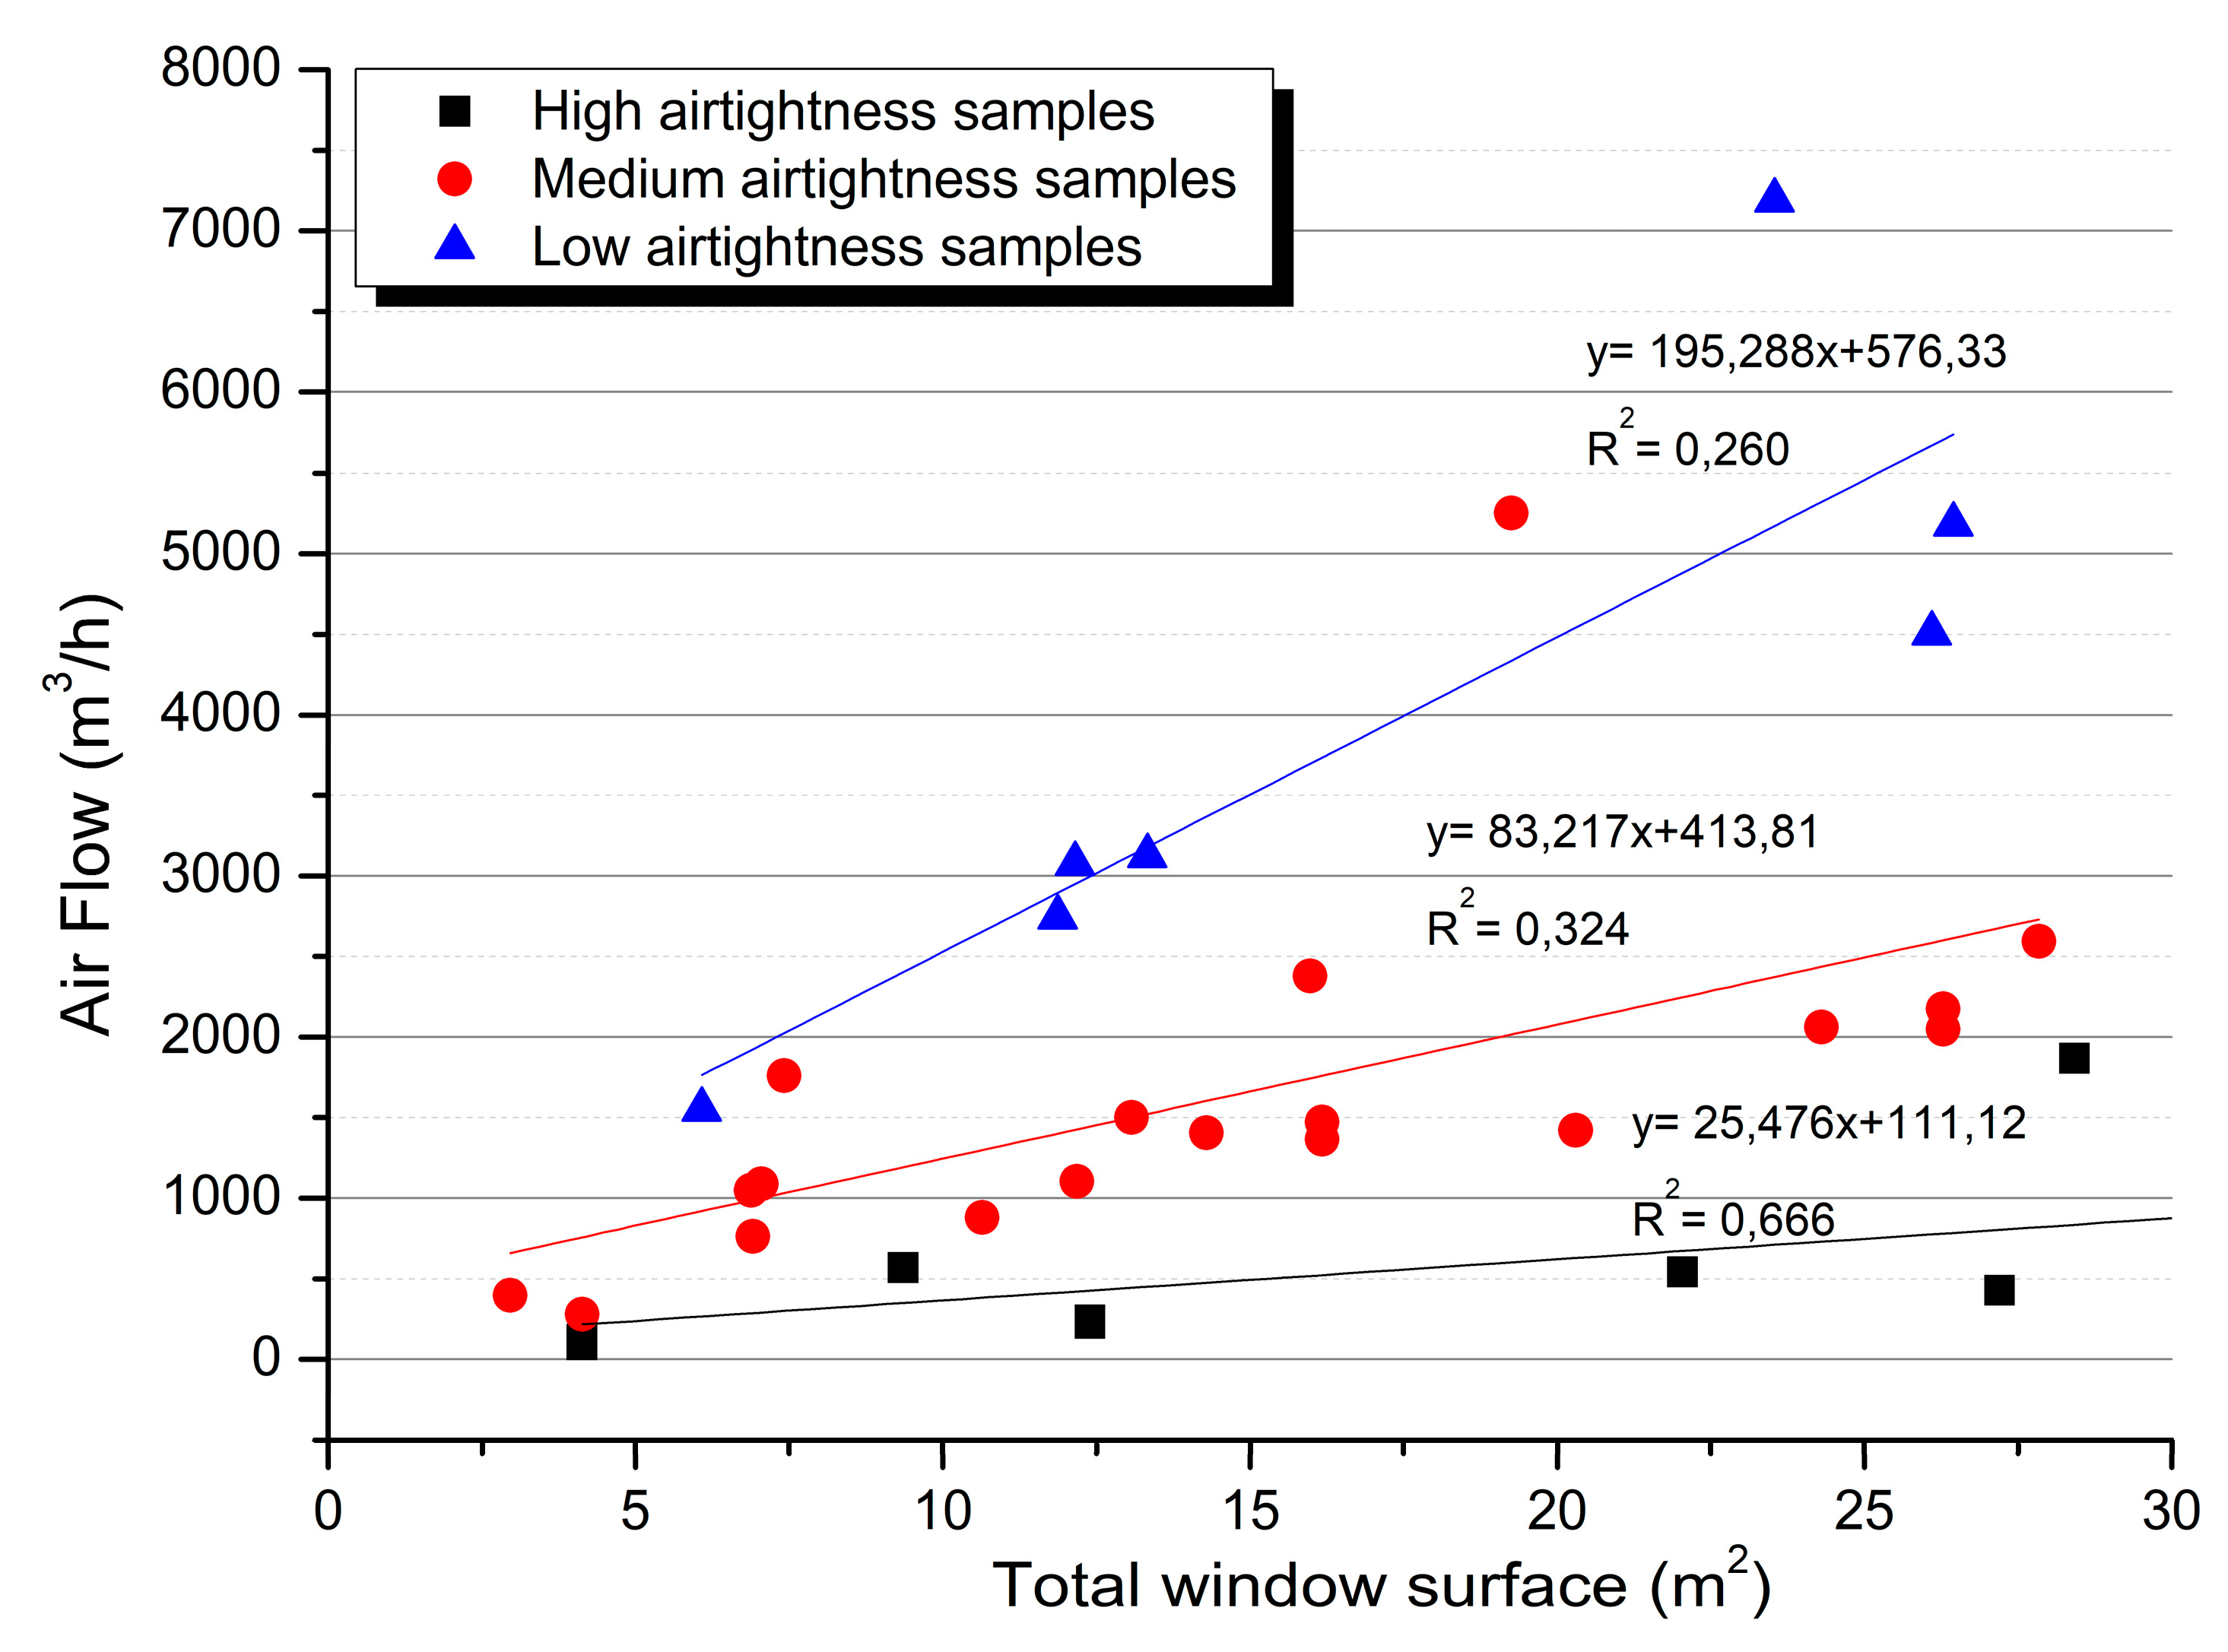
5.2. Trends and Correlations
5.3. Methodology to Estimate the Airtightness of Built Heritage based on its Conservation Status and Geometric Characteristics
6. Findings and Conclusions
Author Contributions
Funding
Acknowledgments
Conflicts of Interest
Appendix A


References
- Dodoo, A.; Gustavsson, L.; Sathre, R. Primary energy implications of ventilation heat recovery in residential buildings. Energy Build. 2011, 43, 1566–1572. [Google Scholar] [CrossRef]
- European Parliament. Directive 2010/31/EU of the European Parliament and of the Council of 19 May 2010 on the energy performance of buildings (recast). 2010/31/EU. Off. J. Eur. Union 2010, L, 153/13. Available online: http://eur-lex.europa.eu/LexUriServ/LexUriServ.do?uri=OJ:L:2010:153:0013:0035:EN:PDF (accessed on 15 September 2019).
- European Parliament. Directive 2012/27/EU of the European Parliament and of the Council of 25 October 2012 on energy efficiency, amending Directives 2009/125/EC and 2010/30/EU and repealing Directives 2004/8/EC and 2006/32. Off. J. Eur. Union 2012, 315, 1–56. Available online: http://eur-lex.europa.eu/LexUriServ/LexUriServ.do?uri=OJ:L:2012:315:0001:0056:en:PDF (accessed on 15 September 2019).
- European Parliament. Directive (EU) 2018/844 of the European Parliament and of the Council of 30 May 2018 amending Directive 2010/31/EU on the energy performance of buildings and Directive 2012/27/EU on energy efficiency. Dir (EU) 2018/844. Off. J. Eur. Union 2018, L, 156/75. Available online: https://eur-lex.europa.eu/procedure/EN/2016_381 (accessed on 19 June 2018).
- Fernández-Agüera, J.; Sendra, J.J.; Domínguez, S. Protocols for measuring the airtightness of multi-dwelling units in Southern Europe. Procedia Eng. 2011, 21, 98–105. [Google Scholar] [CrossRef] [Green Version]
- Troi, A.; Bastian, Z. Energy Efficiency Solutions for Historic Buildings: A Handbook; Birkhäuser: Basel, Switzerland, 2014. [Google Scholar]
- Eskola, L.; Alev, Û.; Arumägi, E.; Jokisalo, J.; Donarelli, A.; Sirén, K.; Kalamees, T. Airtightness, air exchange and energy performance in historic residential buildings with different structures. Int. J. Vent. 2015, 14, 11–26. [Google Scholar] [CrossRef]
- Alves, S.; Fernández-Agüera, J.; Sendra, J.J. Infiltration rate performance of buildings in the historic centre of Oporto. Inf. Constr. 2014, 66. [Google Scholar] [CrossRef] [Green Version]
- Akkurt, G.G.; Aste, N.; Borderon, J.; Buda, A.; Calzolari, M.; Chung, D.; Costanzo, V.; Del Pero, C.; Evola, G.; Huerto-Cardenas, H.E.; et al. Dynamic thermal and hygrometric simulation of historical buildings: Critical factors and possible solutions. Renew. Sustain. Energy Rev. 2020, 118, 109509. [Google Scholar] [CrossRef]
- Kronvall, J. Testing of houses for air leakage using a pressure method. Ashrae Trans. 1978, 84, 72–79. [Google Scholar]
- Gadsby, K.; Linteris, G.; Dutt, G.; Harrje, D. The Blower Door; Center for Energy and Environmental Studies, Princeton University: Princeton, NJ, USA, 1981; p. 124. [Google Scholar]
- ISO. ISO 7730: Ergonomics of the Thermal Environment. Analytical Determination and Interpretation of Thermal Comfort Using Calculation of the PMV and PPD Indices and Local Thermal Comfort criteria; ISO: Geneva, Switzerland, 2005. [Google Scholar]
- ISO. ISO 9972: Thermal Performance of Buildings—Determination of Air Permeability of Buildings—Fan Pressurization Method. Performance Thermique des Bâtiments—Détermination de la Perméabilité à L’air des Bâtiments—Méthode de Pressurisation par Ventilateur, 3rd ed.; ISO: Geneva, Switzerland, 2015; p. 26. [Google Scholar]
- Martín-Garín, A.; Millán-García, J.A.; Baïri, A.; Gabilondo, M.; Rodríguez, A. IoT and cloud computing for building energy efficiency (Ch. 10). Start-Up Creation, 2nd ed.; The Smart Eco-Efficient Built Environment; Elsevier: Amsterdam, The Netherlands, 2020; pp. 235–265. [Google Scholar] [CrossRef]
- ASHRAE. Ventilation and Infiltration; Ch. 16 of 2017 ASHRAE Handbook—Fundamentals, SI ed.; American Society of Heating, Refrigerating and Air-Conditioning Engineers: Atlanta, GA, USA, 2017. [Google Scholar]
- Persily, A.K.; Linteris, G.T. A Comparison of Measured and Predicted Infiltration Rates; ASHRAE Transactions: Peachtree Corners, GA, USA, 1983; pp. 183–200. [Google Scholar]
- Grimsrud, D.T.; Sherman, M.H.; Diamond, R.C.; Condon, P.E.; Rosenfeld, A.H. Infiltration: Pressuriztion Correlations: Detailed Measurement on a California House; No. LBL-7824; CONF-790112-5; Lawrence Berkeley National Laboratory: Berkeley, CA, USA, 1978. [Google Scholar]
- Sherman, M.H.; Grimsrud, D.T. Infiltration-Pressurization Correlation: Simplified Physical Modeling; Lawrence Berkeley National Laboratory: Berkeley, CA, USA, 1980. [Google Scholar]
- Sherman, M.H. Estimation of infiltration from leakage and climate indicators. Energy Build. 1987, 10, 81–86. [Google Scholar] [CrossRef] [Green Version]
- Jones, B.; Persily, A.; Sherman, M. The Origin and Application of Leakage-Infiltration Ratios. Conference Proceeding by ASHRAE and AIVC IAQ. 2016. Available online: https://www.techstreet.com/standards/the-origin-and-application-of-leakage-infiltration-ratios?product_id=1928359 (accessed on 19 December 2020).
- Jokisalo, J.; Kurnitski, J.; Korpi, M.; Kalamees, T.; Vinha, J. Building leakage, infiltration, and energy performance analyses for Finnish detached houses. Build. Environ. 2009, 44, 377–387. [Google Scholar] [CrossRef]
- Kronvall, J. Correlating Pressurization and Infiltration Rate Data—Tests of an Heuristic Model; Lund Institute of Technology, Division of Building Technology: Lund, Sweeden, 1980. [Google Scholar]
- Shaw, C.Y. A correlation between air infiltration and air tightness for houses in a developed residential area. Ashrae Trans. 1981, 87, 333–341. [Google Scholar]
- Dickerhoff, D.; Grimsrud, D.T.; Lipschutz, R.D. Component Leakage Testing in Residential Buildings; Lawrence Berkeley National Laboratory: Berkeley, CA, USA, 1982. [Google Scholar]
- Harrje, D.; Born, G. Cataloguing Air Leakage Components in Houses. In Proceedings of the American Council for an Energy-Efficient Economy, 1982 Summer Study, Santa Cruz, CA, USA, 21 August 1982; American Council for an Energy-Efficient Economy: Washington, DC, USA, 1982. [Google Scholar]
- European Comittee for Standarization. EN 15242—Ventilation for Buildings. Calculation Methods for the Determination of Air Flow Rates in Buildings Including Infiltration; EN Standard 15242; European Comittee for Standarization: Brussels, Belgium, 2007. [Google Scholar]
- Meiss, A.; Feijó-Muñoz, J. The energy impact of infiltration: A study on buildings located in north central Spain. Energy Effic. 2014, 8, 51–64. [Google Scholar] [CrossRef]
- Jimenez Tiberio, A.; Branchi, P. A study of air leakage in residential buildings. In Proceedings of the 2013 International Conference on New Concepts in Smart Cities: Fostering Public and Private Alliances (SmartMILE), Gijon, Spain, 11–13 December 2013; pp. 1–4. [Google Scholar]
- Villi, G.; Peretti, C.; Graci, S.; de Carli, M. Building leakage analysis and infiltration modelling for an Italian multi-family building. J. Build. Perform. Simul. 2013, 6, 98–118. [Google Scholar] [CrossRef]
- D’Ambrosio Alfano, F.R.; Dell’Isola, M.; Ficco, G.; Tassini, F. Experimental analysis of air tightness in Mediterranean buildings using the fan pressurization method. Build. Environ. 2012, 53, 16–25. [Google Scholar] [CrossRef]
- Sfakianaki, A.; Pavlou, K.; Santamouris, M.; Livada, I.; Assimakopoulos, M.N.; Mantas, P.; Christakopoulos, A. Air tightness measurements of residential houses in Athens, Greece. Build. Environ. 2008, 43, 398–405. [Google Scholar] [CrossRef]
- Sinnott, D.; Dyer, M. Air-tightness field data for dwellings in Ireland. Build. Environ. 2012, 51, 269–275. [Google Scholar] [CrossRef]
- Kalamees, T. Air tightness and air leakages of new lightweight single-family detached houses in Estonia. Build. Environ. 2007, 42, 2369–2377. [Google Scholar] [CrossRef]
- Ramos, N.M.M.; Almeida, R.M.S.F.; Curado, A.; Pereira, P.F.; Manuel, S.; Maia, J. Airtightness and ventilation in a mild climate country rehabilitated social housing buildings—What users want and what they get. Build. Environ. 2015, 92, 97–110. [Google Scholar] [CrossRef]
- Šadauskiene, J.; Paukštys, V.; Šeduikyte, L.; Banionis, K. Impact of air tightness on the evaluation of building energy performance in lithuania. Energies 2014, 7, 4972–4987. [Google Scholar] [CrossRef] [Green Version]
- Azkarate, A.; Ruiz De Ael, M.J.; Santana, A. El Patrimonio Arquitectónico; Plan Vasco de Cultura; Servicio de Publicaciones del Gobierno Vasco: Vitoria-Gasteiz, Spain, 2003. [Google Scholar]
- De Santoli, L.; d´Ambrosio Alfano, F.R. Energy efficiency and HVAC systems in existing and historical buildings. Rehva Eur. HVAC J. 2014, 51, 44–48. [Google Scholar]
- Cantin, R.; Burgholzer, J.; Guarracino, G.; Moujalled, B.; Tamelikecht, S.; Royet, B.G. Field assessment of thermal behaviour of historical dwellings in France. Build. Environ. 2010, 45, 473–484. [Google Scholar] [CrossRef]
- Ueno, K. Masonry wall interior insulation retrofit embedded beam simulations. In Proceedings of the Building Enclosure Science & Technology Conference, BEST 3: High performance buildings–combining field experience with innovation, Atlanta, GA, USA, 2–4 April 2012. [Google Scholar]
- Hens, H. Heat, Air and Moisture Transfer in Highly Insulated Envelope Parts, Task 1: Modelling; Final Report, Modelling, International Energy Agency, Annex 24; Catholic University-Leuven, Laboratorium for Building Physics: Antwerp, Belgium, 1996; Volume 1. [Google Scholar]
- Künzel, H.M. Simultaneous Heat and Moisture Transport in Building Components; One-and two-dimensional calculation using simple parameters; Fraunhofer Institute of Building Physics: Stuttgart, Germany, 1995. [Google Scholar]
- European Comittee for Standarization. EN 15026: 2007: Hygrothermal Performance of Building Components and Building Elements-Assessment of Moisture Transfer by Numerical Simulation; EN Standard 15026; European Comittee for Standarization: Brussels, Belgium, 2007. [Google Scholar]
- ASHRAE. Standard 160-2009, Criteria for Moisture-Control Design Analysis in Buildings; Refrigerat ing and Air-conditioning Engineers; American Society of Heating: Atlanta, GA, USA, 2009. [Google Scholar]
- WTA (Ed.) Wissenschaftlich-Technische Arbeitsgemeinschaft für Bauwerkserhaltung und Denkmalpflege e.V. Merkblatt 6-2, Simulation wärme- und feuchtetechnischer Prozesse (Simulation of heat and moisture transfer); WTA-Publications, Fraunhofer IRB-Verlag: Stuttgart, Germany, 2014. [Google Scholar]
- Andreotti, M.; Bottino-Leone, D.; Calzolari, M.; Davoli, P.; Dias Pereira, L.; Lucchi, E.; Troi, A. Applied Research of the Hygrothermal Behaviour of an Internally Insulated Historic Wall without Vapour Barrier: In Situ Measurements and Dynamic Simulations. Energies 2020, 13, 3362. [Google Scholar] [CrossRef]
- Kehl, D.; Ruisinger, U.; Plagge, R.; Grunewald, J. Wooden Beam Ends in Masonry with Interior Insulation; A literature review and simulation on causes and assessment of decay; CESBP: Vienna, Austria, 2013; pp. 299–304. [Google Scholar]
- Ruisinger, U. Long-term measurements and simulations of five internal insulation systems and their impact on wooden beam heads. In Proceedings of the 2nd Central European Symposium on Building Physics, Vienna, Austria, 9–11 September 2013; p. 27. [Google Scholar]
- Viitanen, H.; Toratti, T.; Makkonen, L.; Peuhkuri, R.; Ojanen, T.; Ruokolainen, L.; Räisänen, J. Towards modelling of decay risk of wooden materials. Eur. J. Wood Wood Prod. 2010, 68, 303–313. [Google Scholar] [CrossRef] [Green Version]
- Viitanen, H. Modelling the time factor in the development of brown rot decay in pine and spruce sapwood—The effect of critical humidity and temperature conditions. Holzforschung 1997, 51, 99–106. [Google Scholar] [CrossRef]
- De Santoli, L. Guidelines on energy efficiency of cultural heritage. Energy Build. 2015, 86, 534–540. [Google Scholar] [CrossRef]
- Phoenix, T. Lessons learned: ASHRAE’s approach in the refurbishment of historic and existing buildings. Energy Build. 2015, 95, 13–14. [Google Scholar] [CrossRef]
- ASHRAE. ASHRAE Guideline 34-2019. Energy Guideline for Historic Buildings, SI ed.; American Society of Heating, Refrigerating and Air-Conditioning Engineers: Atlanta, GA, USA, February 2019. [Google Scholar]
- Arumägi, E.; Mändel, M.; Kalamees, T. Method for Assessment of Energy Retrofit Measures in Milieu Valuable Buildings. Energy Procedia 2015, 78, 1027–1032. [Google Scholar] [CrossRef] [Green Version]
- Instituto Nacional de Estadística (INE). Censos de Población y Viviendas 2011. Available online: https://www.ine.es/index.htm (accessed on 19 December 2020).
- Martín-Ramos, A. Los Orígenes del Ensanche Cortázar de San Sebastián. Fundación Caja de Arquitectos: Barcelona, Spain, 2004; ISBN 8493370142. [Google Scholar]
- Ayuntamiento de Donostia-San Sebastián, Departamento de Urbanismo. Plan Especial de Protección del Patrimonio Urbanístico Construido de San Sebastián. 2013. Available online: https://www.donostia.eus/info/ciudadano/urbanismo_planos.nsf/fwCategoria?ReadForm&idioma=cas&id=A423010377686&cat=Planes%20Especiales%20(PE) (accessed on 19 December 2020).
- Walther, W.; Rosenthal, B. Airtightness Testing of Large and Multi-Family Buildings in an Energy Performance Regulation Context. 2009. Available online: https://www.buildup.eu/en/node/7041 (accessed on 19 December 2020).
- De Pani, S. A Study on Single Blower Door Methods for Multifamily Buildings in Montreal. Ph.D. Thesis, Concordia University, Montreal, QC, Canada, 1999. [Google Scholar]
- Vinha, J.; Manelius, E.; Korpi, M.; Salminen, K.; Kurnitski, J.; Kiviste, M.; Laukkarinen, A. Airtightness of residential buildings in Finland. Build. Environ. 2015, 93, 128–140. [Google Scholar] [CrossRef] [Green Version]
- D’Ambrosio Alfano, F.R.; Dell’Isola, M.; Ficco, G.; Palella, B.I.; Riccio, G. Experimental air-tightness analysis in mediterranean buildings after windows retrofit. Sustainability 2016, 8, 991. [Google Scholar] [CrossRef] [Green Version]
- Furbringer, J.M.; Roecker, C.; Roulet, C.A. The use of a guarded zone pressurization technique to measure air flow permeabilities of a multi-zone building. In Proceedings of the 9th AIVC Conference “Effective Ventilation”, Gent, Belgium, 12–15 September 1988. [Google Scholar]
- Proskiw, G. An Innovative Airtightness Test Procedure for Separating Envelope Air Leakage from Interior Partition air Leakage in Multi-Zone Buildings. Ph.D. Thesis, Concordia University, Montreal, QC, Canada, 2007. [Google Scholar]
- Urquhart, R.; Richman, R.; Finch, G. The effect of an enclosure retrofit on air leakage rates for a multi-unit residential case-study building. Energy Build. 2015, 86, 35–44. [Google Scholar] [CrossRef]


| Indicator | Equation | Units | Scope of Application |
|---|---|---|---|
| Air flow rate at 50 Pa | m3/h | ||
| Air change rate | h−1 | Passivhaus, South Europe, South America, China | |
| Specific leakage rate | m3/h m2 | Sweden, Denmark | |
| Air permeability | m3/h m2 | North Europe, Ireland, UK, France, Canada | |
| Equivalent air leakage area (ELA-EqLA)-Orifice equation | m2 | For the LBL and AIM infiltration models. |
| Model | Equation |
|---|---|
| LBL | |
| Kronvall-Pesily | |
| Sherman | |
| Kronvall | |
| Shaw | 1. Temperature caused: 2. Wind caused: 3. Combination of wind and temperature: |
| Country [Reference] | Year Published | Samples | 50 (h−1) 50 (m3h/m2) | Min/Max 50 (m3h/m2) | Min/Max 50 (h−1) |
|---|---|---|---|---|---|
| Spain [27] | 2014 | 13 | 6.26; 4.41 | 1.78/8.44 | 2.57/13.43 |
| Spain [28] | 2013 | 120 | 3.40; - | - | - |
| Portugal [8] | 2014 | 8 | 46.51; 219.93 | 70.28/702.73 | 15.28/144.62 |
| Finland/Estonia/Sweden [7] | 2015 | 53 | -;13.0/15.8/17.4 | 3.9/35.2 | - |
| Italy [29] | 2013 | 5 | 1.74; - | - | 1.37/1.97 |
| Italy [30] | 2012 | 20 | 7.30; 8.73 | 2.1/62.7 | 3.2/23.3 |
| Greece [31] | 2008 | 20 | 6.79; - | - | 1.87/11.30 |
| Ireland [32] | 2012 | 28 | 9.64; 9.11 | 5.12/14.42 | 5.39/14.90 |
| Estonia [33] | 2007 | 32 | 4.90; 4.2 | 0.9/17.9 | 0.7/13.6 |
| Portugal [34] | 2015 | 49 | 7.83; - | - | - |
| Lithuania [35] | 2014 | 27 | 4.73; 5.06 | 0.4/14.61 | 0.41/11.3 |
| -Information not available. | |||||
| Building Name | Ref. Letter | Year of Construction | Building Use | Heritage Protection Level |
|---|---|---|---|---|
| Easo 22 | A | 1905 | Residential | Not protected |
| Urbieta 38A | B | 1893 | Schools | C |
| Aldamar 3A | C | 1901 | Schools | C |
| Bermingham 11 | D | 1919 | Residential | D |
| Victoria-Eugenia | E | 1910 | Theatre/Administrative | A |
| Ijentea 01 | F | 1882 | City Council | A |
| Larramendi 13 | G | 1906 | Residential | D |
| Loiola 14 | H | 1893 | Residential | C |
| Case Ref. | Net Flr. Area [m2] | Unit Perim. [m] | Net Avg. Ceiling ht. [m] | 1 Envelope Area [m2] | Vol. [m3] | 2 Conservation Status (W; C; S; L; F) | Wdw. Surf. [m2] | Wdw. Perim. [m] | Wdw. Perim. Operable [m] |
|---|---|---|---|---|---|---|---|---|---|
| 1.A | 60 | 39 | 2.56 | 222 | 155 | 3;3;1;1;1 | 10.6 | 34.3 | 42.3 |
| 2.A | 44 | 36 | 2.87 | 191 | 126 | 1;2;1;1;1 | 6.9 | 22.5 | 27.3 |
| 3.A | 49 | 36 | 2.83 | 201 | 138 | 3;3;1;1;1 | 7.4 | 23.6 | 29.5 |
| 4.A | 68 | 41 | 2.86 | 254 | 195 | 3;2;1;2;1 | 13.1 | 38.6 | 49.3 |
| 5.A | 46 | 37 | 2.85 | 198 | 131 | 3;2;1;2;1 | 6.9 | 19.0 | 25.0 |
| 6.A | 71 | 44 | 2.57 | 254 | 181 | 1;2;1;2;1 | 13.3 | 39.0 | 50.4 |
| 7.B | 73 | 40 | 4.21 | 314 | 309 | 2;3;1;2;1 | 27.8 | 55.8 | 83.7 |
| 8.B | 73 | 38 | 3.80 | 292 | 277 | 2;2;1;2;1 | 26.1 | 50.5 | 75.8 |
| 9.B | 100 | 46 | 4.80 | 420 | 482 | 2;2;1;2;1 | 28.4 | 59.5 | 89.3 |
| 10.B | 73 | 38 | 3.38 | 275 | 247 | 2;2;1;2;1 | 24.3 | 51.0 | 76.5 |
| 11.B | 74 | 42 | 3.38 | 288 | 249 | 2;2;1;2;1 | 20.3 | 42.5 | 63.8 |
| 12.B | 54 | 32 | 3.37 | 215 | 182 | 2;2;1;2;1 | 12.2 | 25.5 | 38.3 |
| 13.C | 15 | 17 | 2.72 | 76 | 42 | 4;4;2;1;2 | 6.1 | 14.1 | 21.3 |
| 14.C | 49 | 28 | 2.87 | 179 | 141 | 4;4;2;1;2 | 12.2 | 25.0 | 35.8 |
| 15.C | 55 | 44 | 2.72 | 228 | 148 | 4;4;2;2;2 | 12.4 | 43.2 | 56.3 |
| 16.C | 48 | 30 | 2.71 | 177 | 130 | 4;4;2;2;2 | 4.1 | 14.4 | 18.8 |
| 17.C | 48 | 30 | 2.72 | 177 | 130 | 4;4;2;2;2 | 4.1 | 14.4 | 18.8 |
| 18.C | 55 | 44 | 2.72 | 228 | 148 | 4;4;2;2;2 | 12.4 | 43.2 | 56.3 |
| 19.C | 17 | 18 | 2.72 | 82 | 45 | 4;4;2;2;2 | 4.1 | 14.4 | 18.8 |
| 20.C | 134 | 73 | 2.71 | 467 | 363 | 4;4;2;2;2 | 22.0 | 76.8 | 100.0 |
| 21.C | 104 | 50 | 3.71 | 396 | 387 | 4;4;2;2;2 | 36.0 | 84.1 | 122.0 |
| 22.C | 134 | 71 | 3.63 | 526 | 488 | 4;4;2;2;2 | 45.0 | 105.2 | 152.6 |
| 23.D | 102 | 49 | 2.88 | 345 | 293 | 3;1;1;2;1 | 26.5 | 84.4 | 106.9 |
| 24.E | 62 | 34 | 5.08 | 297 | 313 | 3;4;2;2;1 | 26.3 | 35.6 | 55.1 |
| 25.E | 62 | 34 | 5.08 | 297 | 313 | 3;4;2;2;1 | 26.3 | 35.6 | 55.1 |
| 26.E | 89 | 51 | 2.32 | 295 | 207 | 3;4;2;2;1 | 14.3 | 28.6 | 28.6 |
| 27.E | 63 | 35 | 2.52 | 214 | 159 | 3;4;2;2;1 | 16.2 | 27.9 | 42.5 |
| 28.E | 63 | 35 | 2.55 | 215 | 161 | 3;4;2;2;1 | 16.2 | 27.9 | 42.5 |
| 29.E | 59 | 33 | 4.62 | 272 | 271 | 3;4;2;2;2 | 27.2 | 43.6 | 61.7 |
| 30.F | 107 | 61 | 2.48 | 366 | 267 | 1;2;1;1;1 | 23.5 | 59.0 | 73.1 |
| 31.F | 69 | 36 | 6.37 | 366 | 442 | 1;1;1;2;1 | 32.8 | 52.4 | 81.2 |
| 32.F | 75 | 39 | 6.42 | 397 | 480 | 1;1;1;2;1 | 19.2 | 26.5 | 39.8 |
| 33.F | 47 | 31 | 3.22 | 193 | 151 | 1;1;1;2;1 | 16.0 | 32.3 | 44.8 |
| 34.F | 12 | 16 | 3.43 | 78 | 42 | 1;1;1;2;1 | 3.0 | 7.1 | 10.2 |
| 35.F | 52 | 34 | 5.30 | 287 | 278 | 3;2;1;2;1 | 9.4 | 12.4 | 29.2 |
| 36.G | 55 | 34 | 2.72 | 204 | 150 | 2;3;1;2;2 | 11.9 | 35.2 | 43.8 |
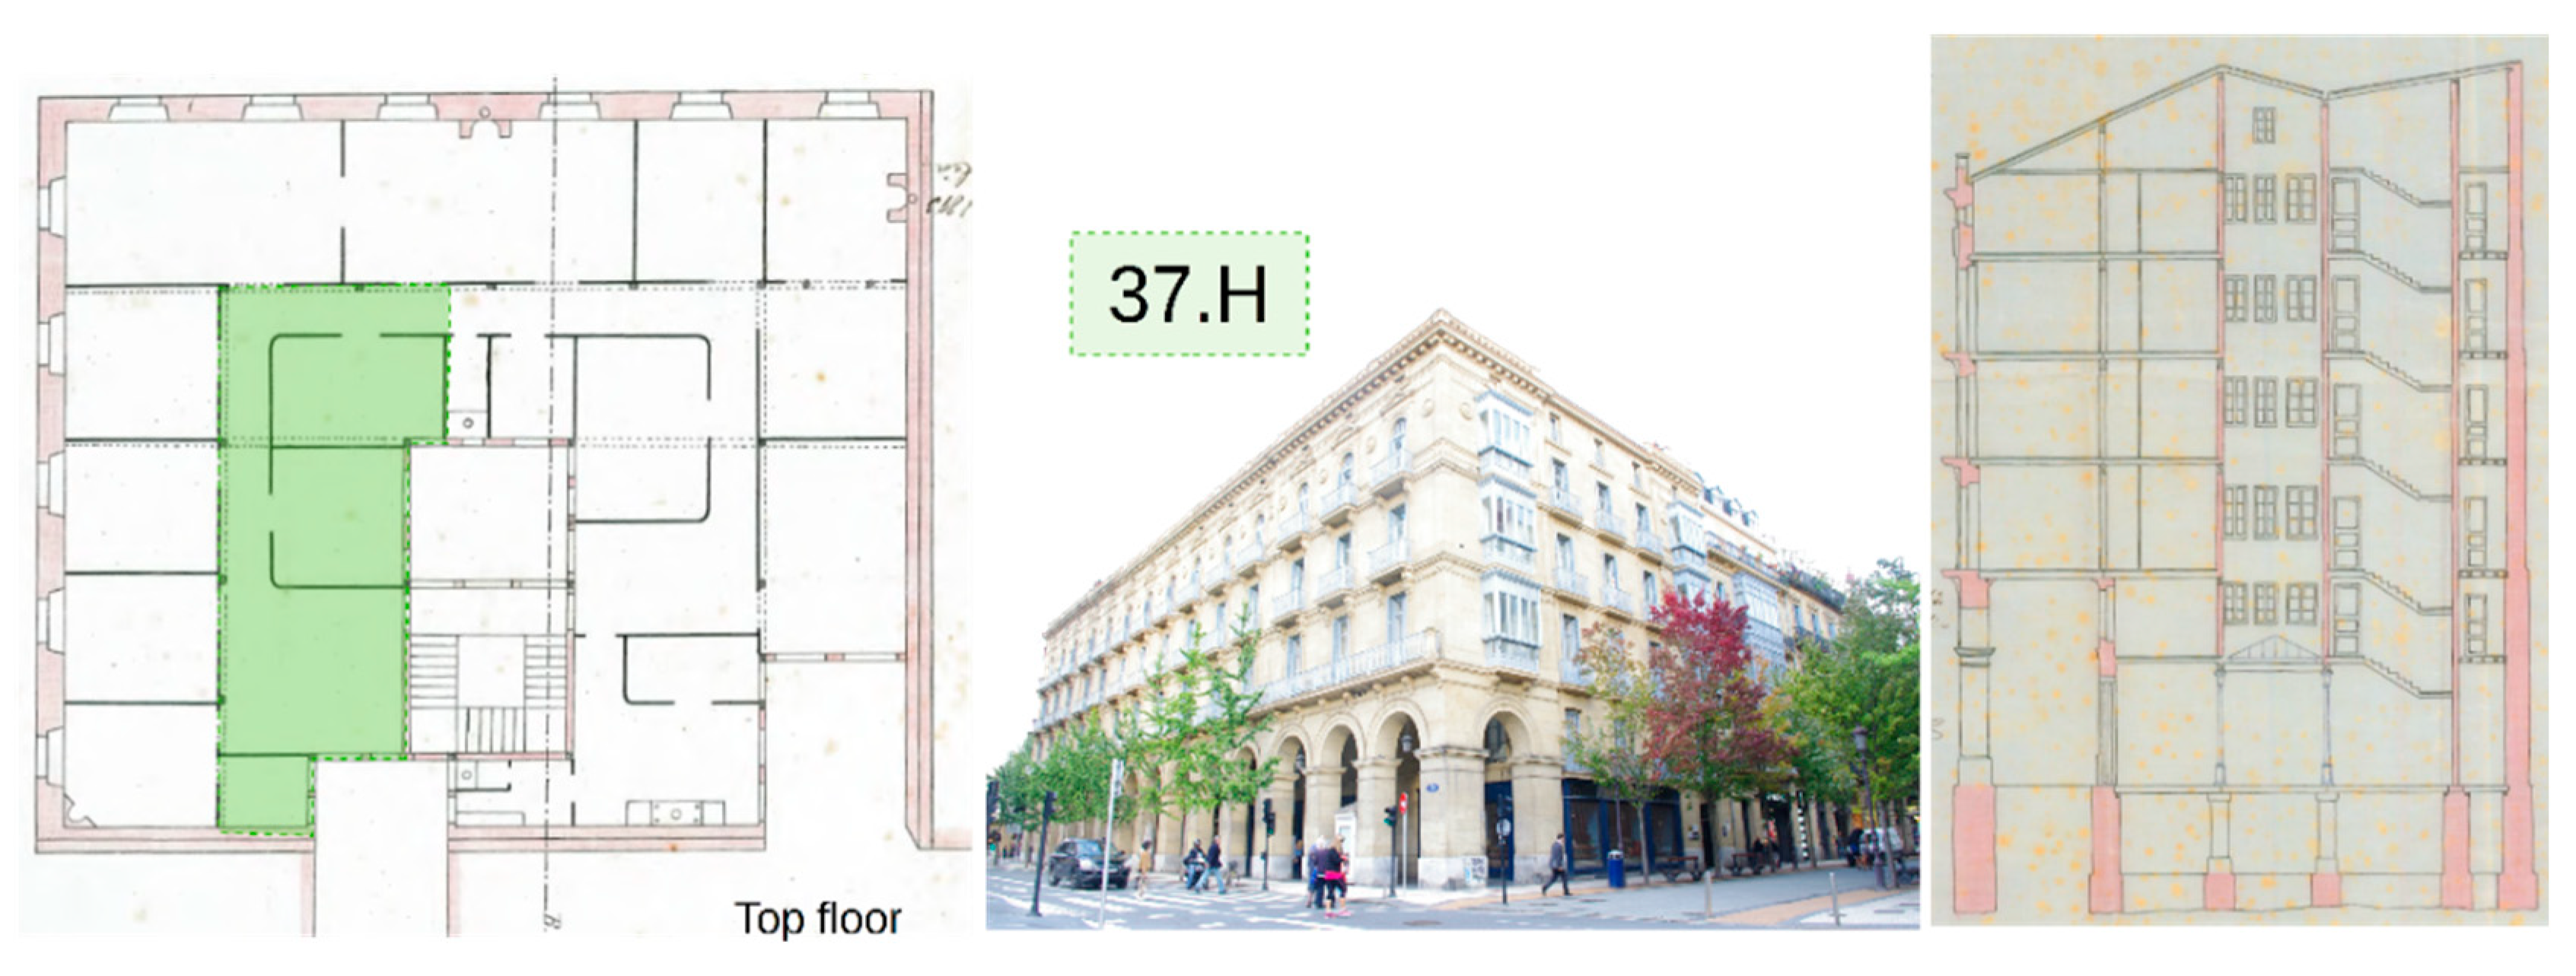
| 37.H | 58 | 36 | 2.19 | 199 | 128 | 1;2;1;1;2 | 7.1 | 22.9 | 28.7 |
| Case Ref. | Indoor Temp. [◦C] | Outdoor Temp. [◦C] | Air Flow Coeff. [m3/h Pan] | Air Flow Exponent [-] | V50 [m3/h] | n50 [h−1] | w50 [m3/hm2] | q50 [m3/hm2] | Airtightness Level 1 |
|---|---|---|---|---|---|---|---|---|---|
| 1.A | 17.5 | 17 | 80.9 | 0.611 | 881 | 5.69 | 14.57 | 3.97 | M |
| 2.A | 18.2 | 16.5 | 77.6 | 0.666 | 1049 | 8.31 | 23.84 | 5.50 | M |
| 3.A | 18.6 | 20.6 | 202.6 | 0.555 | 1761 | 12.78 | 36.18 | 8.78 | M |
| 4.A | 13.8 | 13 | 140.1 | 0.607 | 1500 | 7.68 | 21.95 | 5.91 | M |
| 5.A | 13 | 13 | 69.3 | 0.614 | 765 | 5.85 | 16.68 | 3.87 | M |
| 6.A | 14.2 | 13.7 | 318.0 | 0.585 | 3125 | 17.24 | 44.29 | 12.28 | L |
| 7.B | 25.5 | 25.3 | 297.5 | 0.554 | 2596 | 8.40 | 35.36 | 8.27 | M |
| 8.B | 24.8 | 25.8 | 395.2 | 0.622 | 4507 | 16.30 | 61.93 | 15.45 | L |
| 9.B | 24 | 24.1 | 186.5 | 0.589 | 1868 | 3.87 | 18.59 | 4.45 | H |
| 10.B | 24.4 | 23.2 | 211.9 | 0.581 | 2063 | 8.36 | 28.26 | 7.51 | M |
| 11.B | 25.2 | 24.9 | 132.9 | 0.606 | 1420 | 5.71 | 19.28 | 4.93 | M |
| 12.B | 24.8 | 24.3 | 105.1 | 0.602 | 1105 | 6.08 | 20.47 | 5.13 | M |
| 13.C | 24.7 | 23.1 | 153.7 | 0.591 | 1550 | 37.12 | 100.98 | 20.46 | L |
| 14.C | 27.6 | 25.3 | 263.0 | 0.633 | 3076 | 21.79 | 62.55 | 17.17 | L |
| 15.C | 25.6 | 24.5 | 18.8 | 0.655 | 243 | 1.64 | 4.45 | 1.07 | H |
| 16.C | 24.6 | 23.5 | 10.9 | 0.625 | 125 | 0.96 | 2.61 | 0.71 | H |
| 17.C | 25.6 | 24.3 | 7.8 | 0.624 | 89 | 0.68 | 1.86 | 0.50 | H |
| 18.C | 26.8 | 27.6 | 17.5 | 0.652 | 224 | 1.51 | 4.10 | 0.98 | H |
| 19.C | 28.1 | 29.1 | 26.8 | 0.600 | 279 | 6.19 | 16.84 | 3.39 | M |
| 20.C | 26.5 | 29.5 | 50.5 | 0.608 | 543 | 1.50 | 4.05 | 1.16 | H |
| 21.C | 27.1 | 33.2 | 63.7 | 0.597 | 659 | 1.70 | 6.31 | 1.66 | H |
| 22.C | 27.5 | 31.3 | 60.9 | 0.628 | 699 | 1.43 | 5.20 | 1.33 | H |
| 23.D | 27.3 | 26 | 533.8 | 0.581 | 5184 | 17.69 | 50.94 | 15.04 | L |
| 24.E | 23.3 | 26 | 242.4 | 0.561 | 2174 | 6.95 | 35.30 | 7.32 | M |
| 25.E | 25.1 | 22 | 228.2 | 0.561 | 2049 | 6.55 | 33.27 | 6.90 | M |
| 26.E | 26.5 | 21.5 | 105.5 | 0.662 | 1407 | 6.81 | 15.80 | 4.77 | M |
| 27.E | 24.4 | 22.8 | 162.6 | 0.564 | 1472 | 9.25 | 23.31 | 6.87 | M |
| 28.E | 28.8 | 30.3 | 136.9 | 0.588 | 1366 | 8.48 | 21.63 | 6.35 | M |
| 29.E | 24.5 | 21 | 33.8 | 0.649 | 427 | 1.57 | 7.27 | 1.57 | H |
| 30.F | 25.4 | 19 | 794.8 | 0.564 | 7190 | 26.95 | 66.93 | 19.63 | L |
| 31.F | 23 | 24.7 | 128.6 | 0.666 | 1734 | 3.93 | 25.02 | 4.74 | H |
| 32.F | 24.2 | 27.5 | 481.3 | 0.613 | 5253 | 10.95 | 70.31 | 13.24 | M |
| 33.F | 26.9 | 29.2 | 247.9 | 0.578 | 2378 | 15.77 | 50.77 | 12.32 | M |
| 34.F | 25.8 | 26.3 | 36.7 | 0.610 | 399 | 9.52 | 32.65 | 5.14 | M |
| 35.F | 25.5 | 21 | 64.2 | 0.560 | 571 | 2.06 | 10.90 | 1.99 | H |
| 36.G | 22.6 | 22.4 | 278.1 | 0.586 | 2744 | 18.26 | 49.67 | 13.44 | L |
| 37.H | 23.4 | 22.9 | 97.9 | 0.616 | 1089 | 8.51 | 18.66 | 5.46 | M |
| Classification Characteristics | Score | |
|---|---|---|
| Fenestrations | Original windows (inadequate maintenance) | 6 |
| Original windows with maintenance | 5 | |
| New windows (standard installation) | 2 | |
| New windows (high quality installation) | 1 | |
| General conservation status | Original (inadequate maintenance) | 4 |
| Well maintained (without being refurbished) | 3 | |
| Well maintained and renovated (only minor refurbishments) | 2 | |
| Good (fully renovated) | 1 | |
| Slabs and structure | Wood and metal elements (original or renovated) | 3 |
| Replaced by new concrete slabs | 1 | |
| Location | Upper floor, attic etc. | 3 |
| Intermediate floor | 1 | |
| Facilities | Concealed in partitions, ceilings or floors | 2 |
| Exposed (visible cables, ducts, etc) | 1 | |
Publisher’s Note: MDPI stays neutral with regard to jurisdictional claims in published maps and institutional affiliations. |
© 2020 by the authors. Licensee MDPI, Basel, Switzerland. This article is an open access article distributed under the terms and conditions of the Creative Commons Attribution (CC BY) license (http://creativecommons.org/licenses/by/4.0/).
Share and Cite
Martín-Garín, A.; Millán-García, J.A.; Hidalgo-Betanzos, J.M.; Hernández-Minguillón, R.J.; Baïri, A. Airtightness Analysis of the Built Heritage–Field Measurements of Nineteenth Century Buildings through Blower Door Tests. Energies 2020, 13, 6727. https://0-doi-org.brum.beds.ac.uk/10.3390/en13246727
Martín-Garín A, Millán-García JA, Hidalgo-Betanzos JM, Hernández-Minguillón RJ, Baïri A. Airtightness Analysis of the Built Heritage–Field Measurements of Nineteenth Century Buildings through Blower Door Tests. Energies. 2020; 13(24):6727. https://0-doi-org.brum.beds.ac.uk/10.3390/en13246727
Chicago/Turabian StyleMartín-Garín, Alexander, José Antonio Millán-García, Juan María Hidalgo-Betanzos, Rufino Javier Hernández-Minguillón, and Abderrahmane Baïri. 2020. "Airtightness Analysis of the Built Heritage–Field Measurements of Nineteenth Century Buildings through Blower Door Tests" Energies 13, no. 24: 6727. https://0-doi-org.brum.beds.ac.uk/10.3390/en13246727