1. Introduction
Adopted in 2015, the United Nations’ 2030 Agenda for Sustainable Development is underpinned by seventeen Sustainable Development Goals (SDGs). Chief among these for energy, SDG 7 aims to “Ensure access to affordable, reliable, sustainable and modern energy for all” [
1]. The access to energy and modern energy services is critical for social development, livelihood improvement, and economic growth [
2,
3]. Yet, energy access continues to be elusive for the 770 million people globally who still lack it in 2019 [
4]—75% of which are located in Sub-Saharan Africa (SSA).
With a fast-growing population of 112 million in 2019, expected to reach 140 million by 2030 and 170 million by 2040 (medium variant scenario [
5]), Ethiopia is the second-largest country in SSA behind Nigeria [
6]. While it remains a low-income country, its Gross domestic product (GDP) growth of 8.3% p.a. makes it one of the fastest-growing economies in the region and gives credence to the government’s ambitions of reaching a low middle-income status by 2025, increasing the gross national income per capita from 790 USD in 2018 to between 1006 USD and 3955 USD [
7,
8]. Supporting these combined dynamics suggests substantial increases in the country’s energy needs, yet low national electricity access levels remain a significant hurdle for the government’s ambitions.
Electricity access in Ethiopia has increased by only 30 percentage points over the past 25 years, reaching 45% in 2018. Extrapolating the average annual growth rate of 7% between 2010 and 2018 means that it would still take 19 years to achieve universal access [
9]. Besides, the electricity consumption per capita is among the lowest globally and, at 83 kWh/capita in 2018, is lower than the African continent average in the same year (500 kWh/capita) [
9]. The fact that 80% of the country’s population is rural, that electrification is currently concentrated in denser urban areas, and that only a low number of households are connected to the national grid infrastructure in 2018, the rest is off grid, further increase complexity [
10]. The government also faces “the last-mile paradox” in rural areas since 90% of the population live within 10 km of grid infrastructure, so the associated cost for grid extension is not high; however, only 34% of rural households are grid-connected in 2019 [
11,
12]. The development indicators of Ethiopia are presented below in
Table 1.
1.1. Government Policy
Recognizing the significance of these challenges, the Ethiopian government has, since 2010, implemented a consistent framework based on 5-year “Growth and Transformation Plans” (GTP) detailing ambitious and incremental infrastructure expansion targets for power, transport, and ICT across all sectors of the economy. The first phase (GTPI) saw power system expansions to 4.2 GW with a strong focus on new hydropower (89%) [
10], with 4.6 and 40.1 thousand km of new power transmission and distribution lines, respectively [
14]. Phase two covers the period 2015 to 2020. It focuses explicitly on structural and institutional transformations required to push rapid national economic growth to reach a middle-income country status by 2025. Also, increasing per capita income, GTPII aims to achieve universal electricity access and to turn Ethiopia into an electricity export hub for the Eastern African Power Pool (EAPP) [
14]. This vision is underpinned by deep industrial and infrastructural transformations that rely on public investment to turn the country into a manufacturing hub, implying average economic growth targets of 11% GDP p.a. Nevertheless, one of the government’s objective is to ensure a reliable supply of energy at an affordable price [
14]. Phase III of the GTP is expected to cover 2021–2025 [
15].
In combination with these stepwise GTP targets, the government has long signaled its commitment to green growth. A signatory of the 2015 Paris Agreement, Ethiopia has currently committed to a 2 °C compliant Nationally Determined Contributions (NDC) target of limiting 2030 GHG emissions to 145 MtCO
2e, i.e., a 64% drop compared to baseline projections [
16]. This target includes the substantial task of shifting from net positive land-use emissions, linked to unsustainable biomass uses responsible for 22.5% of baseline emissions in 2030, to net land-based sequestration of up to 40 MtCO
2e (emissions referred to Nationally Determined Contributions (NDC) as “Deforestation and forest degradation”). Power sector emissions represented just 3% of the 2010 baseline and are expected to remain low through the heavy reliance on renewable energy.
More widely, the government’s Climate Resilient Green Economy Strategy (CRGE) underpins the general direction of all other policy documents [
15]. With an estimated cost of 150 billion USD, the CRGE describes a modern energy Ethiopia that will be carbon neutral by 2030. It covers climate adaptation and mitigation objectives framed around four pillars: improving agriculture and livestock practices, protecting forests, ecosystem services and carbon stocks, deploying clean and renewable power, and leapfrogging to advanced technologies across the economy [
15].
In the National Electrification Program 2.0 (NEP 2.0) (2019), a follow-up of NEP I established in 2017, Ethiopia’s government presents the action plan for achieving universal electricity access nationwide by 2025. The action plan indicates that by 2025, 8.2 million new grid connections will be established and 6 million beneficiaries will have access to off-grid solutions through stand-alone solar and mini grids technologies to achieve 100% electricity access (35 percent off-grid). So far, in NEP I, the government has connected 33% of its population with on-grid technologies and 11% with off-grid technologies. Also, the electricity supply will increase as new hydropower, geothermal, solar, and wind power plants will be constructed in the future along with improvements in the security of the power system and reduction in technical losses. The NEP 2.0 includes a financial plan nearly 6 billion USD of financing in direct investments and technical assistance for on-grid and off-grid electrification [
17].
1.2. An Overview of Ethiopia’s Current Electricity System
Despite the country’s sustained economic growth over the past 15 years, the average per capita electricity consumption of 83kWh/capita in 2018 remains well below both the SSA and low-middle income countries’ averages of 484 and 749 kWh/capita, respectively [
18]. This represents an order of magnitude difference with short term government targets and highlights the significant challenge that SDG7 and the successive GTP policies represent for the country.
Accordingly, the total primary energy supply (TPES) in Ethiopia was 505 TWh in 2018, 88% of which was informal biomass and waste. The remaining contributions from hydro resources cover most of the power generation, and imported fossil fuels are used both for supplementary power production and end uses in transport. While hydropower is the main source of centralized electricity production, geothermal, solar and wind technologies are expected to increase their penetration in the country’s future electricity mix. Electricity consumption is currently shared between the residential (46%) industrial (27%), and commercial and public services (27%) sectors [
13].
These low electricity consumption levels are in stark contrast with the country’s very significant levels of available energy resources. In addition to hosting 45 GW of hydropower potential—the second largest on the continent, 90% of which remains untapped—Ethiopia is bidding to become the wind-power capital of Africa [
19] and boasts identified potentials over 1.35 TW [
17]. Due to its location in the East African Rift Valley, the country also has access to up to 5 GW of geothermal power.
Developing these high levels of renewable energy resources is at the root of Ethiopia’s ambition to establish international trade and become an electricity export hub for the neighboring East African Power Pool (EAPP). As an active member of the EAPP and the Northern Corridor (Ethiopia-Sudan-Egypt) [
14], Ethiopia has an existing interconnector capacity with Sudan (200 MW) and Djibouti (180 MW). Together, these factors supported 1.46 TWh electricity exports representing 11% of the Ethiopian generation in 2018 [
20]. Future infrastructure plans reach much higher. They include network expansions that would increase capacity by one order of magnitude to 5.4 GW and link with Kenya (1400 MW), Tanzania (412 MW), Sudan or Egypt (3000 MW), as well as Eritrea (200 MW) and Somalia (400 MW).
Supporting these high ambitions, both domestically and abroad, will require large infrastructure investments in the power sector. Historically, however, national electricity tariffs have been too low to generate public earnings and foster private investor interest, approximately 0.0187 USD/kWh (2005–2017), with revised tariffs to 2021 reaching 0.0765 USD/kWh [
21]. Notwithstanding this,
Table 2 shows that short-term CRGE plans have identified enough projects to double the existing power sector’s size from 8.96 GW in 2019 to 18.55 GW by 2026. Noticeably, 80% of the new capacity is expected to rely on hydropower, which existing studies for the region have highlighted a significant risk for system resilience concerning a changing climate [
22]. In recognition of this risk, the CRGE is also expected to seek a more diverse portfolio as the system develops [
15].
1.3. Previous Studies on Electrification Pathways for Ethiopia
The relationship between energy analysis and spatial systems has been widely recognized in the literature [
23,
24,
25,
26]. Specifically, it suggests that including the spatial dimension of energy access into otherwise “standard” energy modelling approaches can improve the medium-to-long-term assessments of least-cost power system expansion. This is because spatial methods can improve the underlying electricity cost and demand assumptions and consider location-specific technology characteristics to support key policy questions [
27]. Further, these approaches recognize that off-grid and mini grid systems are key complements to national-grid expansion when pushing for universal energy access. Indeed, infrastructural and cost-optimal dynamics of extending electricity supply can differ based on spatial factors, including the location and size of un-electrified populations, geophysical parameters, and fuel and technology costs [
27,
28].
While techno-economic studies focusing on Ethiopia have previously combined energy modelling and spatial electrification planning, these have, to date, either restricted their analyses of universal access to focusing on 2030, considered the residential electricity demand in isolation [
28], focused on a specific region of the country [
10,
29,
30], or considered the whole of Africa [
31,
32,
33,
34,
35,
36]. One key study does couple the TIMES Integrated Assessment Model of the Energy Research Centre of the Netherlands (TIAM-ECN) energy system cost optimization model [
37] with geospatial analysis to study energy access in Ethiopia considering the spatial dimension of grid expansions and off-grid technologies [
38]. However, the authors considered on- and off-grid residential electricity demand without reference to other demand sectors of the economy. Others have developed longer-term energy demand estimates using the Long-range Energy Alternative Planning (LEAP) model with high sectoral detail to examine alternative demand-side policy scenarios [
39]. While the study usefully identified trade-offs of economic development and environmental sustainability, the timeframe of the study was limited to 2030 and, the framework was not suitable for least-cost whole system analysis and did not include a geospatial component [
40]. Furthermore, none of these modelling studies consistently represent recent national policy with up-to-date available data.
This review of a relatively small number of existing studies for Ethiopia suggests that, to the best of the authors’ knowledge, no work has yet produced internally consistent national electrification and energy system pathways that are geographically explicit, extend beyond 2030, include more than just the residential sector, and account for the full level of national policy ambition. Thus, this work could contribute to national policy planning, including Ethiopia’s NDC submissions [
41], informing Sustainable Development Goal (SDG) 7 [
1] and regional strategy analyses, as indicated in the African Union Agenda goals 2063 [
42].
This work, therefore, asks two key questions. First, how can a country like Ethiopia identify internally consistent energy pathways that are least-cost but are also cognizant of the country’s context in terms of financial capacity, technological maturity, environmental constraints, but also growth in demand in different sectors and general policy goals for the medium and long-term? Second, how can geospatial analyses enhance energy system modelling to account for geospatial drivers of choices between electrification technology and how can they improve the results considering this extension?
To answer these questions and address these gaps, this study uses a soft-link between an Open-Source energy Modelling System (OSeMOSYS) whole-system cost-optimization model of the electricity system of Ethiopia [
43] and an Open-Source Spatial Electrification Tool (OnSSET) geospatial electrification model of the country [
31,
44]. The study period extends between 2015 and 2065, with results provided on an annual basis. It includes both supply and demand for electricity, focusing on the power sector, electricity needs in industrial, commercial, and residential sectors under different future demand levels. Importantly, this work uses a novel level of detail and complexity in linking the energy system and geospatial modelling. Combining the latest versions of OnSSET and OSeMOSYS, this analysis can focus on the spatial distribution of future connections in the residential area and estimate the cost-optimal mix of electrification technologies consistent with the corresponding whole system development pathways.
A previous geospatial electrification study for Ethiopia using OnSSET identified the importance of several factors including population density, demand levels, transmission networks, centralized grid electricity costs, techno-economic parameters for off-grid systems (mini grid and stand-alone), and diesel fuel costs in determining the least-cost electrification mix [
28]. These are key determinants of the scenarios applied also in this analysis.
Finally, this study considers calls for higher levels of transparency in long-term energy planning [
45]. The modelling frameworks used are, by definition, open-source and freely available. A qualitative approach follows, including stakeholder engagement in capacity building activities, developing the scenario narratives and evaluating the modelling results transparently regarding their suitability in providing policy insights for Ethiopia’s electrification pathways [
46]. Previous studies also focused on human capacity and institutional development towards a sustainable energy future in Ethiopia and the state and non-state actors’ role in this transition [
47,
48]. The data that is applied is thus taken from public reports and freely available national statistics. Ultimately, the tools will be transferred to local partners for future uses in academia and national policy analysis.
In our study, we explored three scenarios to examine how key factors (e.g., evolution of electricity demand, achieving universal access in different years, higher power generation costs, lack of financing) could influence the country’s energy transition and provide a broader understanding of the challenges that need to be overcome.
The paper is divided into four sections.
Section 1 provides an introduction to the socio-economic situation of Ethiopia and its energy challenges. It also contains a literature review of previous energy modeling studies for energy planning in Ethiopia.
Section 2 describes the methodology applied and scenarios examined to develop this study.
Section 3 presents the modelling results and discusses the policy insights and
Section 4 refers to the conclusions and policy recommendations.
2. Methods
2.1. Modelling Framework
We applied an open-source cost optimization tool for long-term energy planning, the Open-Source energy Modelling System (OSeMOSYS) [
43], and an open-source tool for geospatial electrification planning, the Open-Source Spatial Electrification Tool (OnSSET) [
31,
44] to the electricity supply system of Ethiopia to conduct this analysis. We developed and examined three scenarios for each of the models, capturing different levels of electrification, capital costs in power generation technologies, discount rates, levels of exported electricity, and the implementation year of future power plants. The two tools were soft-linked to examine the cost-optimal power generation mix for satisfying future residential electricity demand in both electrified and currently un-electrified areas.
The methodology used in this study has previously been applied to examine electrification pathways for Kenya [
49]. However, in this study, the level of analysis of the OnSSET model has been further improved and the time horizon spans until 2065 (
Section 2).
The scenarios, modelling assumptions, and the data used to develop this study were collected and handled through several capacity-building activities with local stakeholders, country analysts, and involved institutions and government agencies (Ministry of Water, Irrigation and Energy; Ministry of Mining, Petroleum and Natural Gas; Deutsche Gesellschaft für Internationale Zusammenarbeit (GIZ); UK aid funded Energy and Economic Growth Applied Research Programme; Addis Ababa Institute of Technology; Policy Studies Institute in Addis Ababa; University College of London Energy Institute; KTH Royal Institute of Technology) in Addis Ababa, Ethiopia, between 2018 and 2020. Two workshops involving directors and sectoral and key technical experts were carried out to develop the electrification pathways and narratives according to experts’ views from the different backgrounds. Four workshops were held in total, engaging with around 30 people on multiple occasions to conceptualize the study and evaluate the modelling inputs and results. Local stakeholder engagement helped effectively outline the electrification pathway policies for Ethiopia; however, limitations could also be associated with this approach [
50]. The sampling approach followed for the local stakeholders was purposive. However, in some cases, other participants attended instead of the invited ones due to commitments. This change did not affect the evaluation of the study and results since the participants were also experts in their fields. The models and narratives of the scenarios were developed following combined qualitative and quantitative methods, and the process is presented in
Figure 1. The final modelling results were presented to local stakeholders and country analysts to reach an agreement concerning the scenario narratives.
The modelling tools, input-data, model assumptions, and the scenarios examined under this study are presented in the following sections. One of the applied models’ strengths is that they can account for the domestic availability of energy resources, regional technical characteristics such as capacity factors of wind and solar technologies, the electricity supply system’s infrastructure, end-use demand patterns, and the associated techno-economic technology characteristics. Bottom-up models are used in this study since they are technology-specific. They allows us to investigate related dynamics and risks associated with long-term investments in the power system meeting a country’s local demand in the future [
51,
52,
53,
54,
55,
56]. However, they do not account for price distortion or economy-wide interactions and income effects [
57,
58,
59].
2.2. Cost-Optimization Framework for Long Term Energy Planning
The open-source energy modelling system (OSeMOSYS) tool is a freely available optimization modelling framework for medium to long-term energy planning [
43]. It is a bottom-up modelling framework that uses linear-optimization techniques to satisfy an exogenously defined energy demand. OSeMOSYS has been employed in the scientific literature [
34,
60,
61,
62,
63] and in academic teaching and capacity building for energy planners to provide insights on possible transformation trajectories of both country to continental-scale energy systems [
64]. The equation of the objective function consists of the sum of discounted operational and capital costs. The energy system consists of final energy demands distinguished between various end-use services, transmission and distribution networks, power generation technologies (on-grid and off-grid), energy trade links, conversion technologies, and technologies representing imports and extraction of energy resources. All technologies are modelled using a standard set of parameters (efficiency, investment cost, existing capacity, etc.). Technologies include both existing infrastructure and generation plants as well as options for new infrastructure and generation. Country specific energy targets can also be captured in the model, such as future renewable energy targets or environmental and economic constraints. The modelling results can include power generation capacity, production by technology, operation and maintenance costs, and emissions on an annual level with a timely resolution for some of the variables.
2.3. Geospatial Analysis for Electrification Planning
The OnSSET tool considers population settlements and, for each one, determines which is the least-cost technology to meet the electricity demand (grid, mini grid or stand-alone). In each case, the Levelized Cost of Electricity (LCOE) is calculated for each technology option, taking into account investment, operation and maintenance, and fuel costs. The technology that can meet the demand at the lowest LCOE is selected as the least-cost technology option in that settlement [
31]. The OnSSET tool has been used in national electrification studies (Malawi [
65], Kenya [
49], Tanzania [
66], Afghanistan [
67]) and regional electrification studies for the whole of Sub-Saharan Africa ([
31,
68]). A recent study by Korkovelos et al. [
65] introduced the possibility to force grid-extension to certain settlements, simulating potential policy options, as well as a staged electrification timelines. This study also moved the analysis from raster-based population data to settlement clusters [
65]. For this work, six technology options are considered: the national grid, PV mini grids, diesel mini grids, wind mini grids, hydro mini grids, and stand-alone PV technologies. The OnSSET model is used to determine the least-cost option for meeting the residential electricity demand in this study. Results are presented for 2025, 2030, and then in ten-year intervals from 2040–2070.
2.4. Soft-Linking the OSeMOSYS and the OnSSET Models
The OSeMOSYS model was used to model Ethiopia’s electricity supply system, considering all the available power generation technologies (on-grid, off-grid). However, it does not consider the geographical characteristics of the resources and the residential electricity demand’s spatial dimension to identify the least-cost split between on- and off-grid technologies. In that sense, the OnSSET model considers the off-grid technologies and extension of the centralized grid network to calculate the cost-optimal split of technologies to satisfy the residential electricity demand. Importantly, the OnSSET model does not optimize the mix of technologies supplying the centralized grid. The OnSSET model in this study does not include the electricity demand in the rest of the sectors as OSeMOSYS does. A soft-linking of these two tools can therefore overcome each tool’s limitations. In this study, their soft-linking can provide the least-cost optimal mix of on-grid and off-grid technologies considering the Geographical theory and Geographic Information Systems (GIS) in electrification planning together with a least-cost medium to long-run energy planning tool to cover the country’s future electricity demand in all sectors [
69]. The following methodology is presented in
Figure 2 (stages 1 to 4).
The process goes as folows: stage 1) the OSeMOSYS model cost-optimizes the electricity supply system of Ethiopia considering electricity demands in all sectors; stage 2) the levelized cost of generating centralized grid electricity is calculated from the output of the OSeMOSYS model; stage 3) the levelized cost of generating grid electricity is fed into the OnSSET model and used to calculate the least-cost electrification mix (on-grid and off-grid) to meet the residential electricity demand; stage 4), the transmission and distribution costs for grid expansion per kW of new generation capacity, capacity factors for the off-grid technologies identified based on local energy resource characteristics at off-grid locations, and the demand split between grid- and off-grid technologies for the country are calculated; stage 4 to 1) this information is used as an input into the OSeMOSYS model to cost-optimize the whole electricity supply system and define the average electricity cost of generating electricity. This process will impact the cost-optimization process of the OSeMOSYS model and, eventually, the grid cost. Thus, a second iteration is required to calibrate the modeling outputs between the two models. The iterations of the two models continue until reaching a point where the average cost of generating electricity in each scenario does not change after each iteration.
The formula used to calculate the Levelized Cost of Generating Electricity for each technology is the following:
In year t, is the investment cost, are the operation and maintenance costs, are the fuel expenditures, and is the generated electricity. Further, r is the discount rate and n corresponds to the technology’s lifetime. The average LCOE of all grid-connected power generation technologies is calculated to estimate the input grid cost to OnSSET.
2.5. Data—Model Assumptions
This section presents the input data and model assumptions associated with developing the OSeMOSYS and OnSSET models (
Table 3). The authors used different sources to gather the data required to build the models since there is no systematic practice to collect energy data in Ethiopia.
2.5.1. Overall Assumptions
The following key assumptions have been made for this study: (i) only the electricity supply system in Ethiopia is modelled, (ii) the monetary unit is 2015 USD; accordingly, the USD gross domestic product (GDP) deflator from the World Bank Group is used [
6] to adjust the fuel prices reported in different years to the base year (2015) considered in the analysis, (iii) the real discount rate changes among the scenarios. However, it remains the same in both models. The same discount rate was used for all technologies and kept constant for the entire model horizon.
2.5.2. Modeling Assumptions
Table 3 below presents the modelling assumptions associated with each one of the modelling tools.
2.5.3. The Electricity Supply System
The schematic representation of Ethiopia’s electricity supply system included in the modelling framework is called a Reference Energy System (presented in
Supplementary Materials) [
74]. In the Reference Energy System (RES), the technologies are represented by boxes and the fuels are represented by lines. Techno-economic (power plant capacities, capacity factors, efficiencies, lifetime, costs) and environmental (CO
2 emissions) parameters are assigned to the technologies. The final electricity demand has been divided into two categories and is being supplied by different energy chains based on the least-cost option for the whole country computed by the model for the timeframe 2015–2065. The extraction or imports of fuel resources according to the country’s fuel availability define the “primary” level. The fuels supplied to the power plants in the “secondary” level are transformed to generate electricity, transmitted through the national transmission network to the “tertiary” level, to be distributed and meet each sector’s final demand. Unlike centralized ones, decentralized technologies are not connected to the national grid but generate and supply electricity directly to end-users. Also, in the model, electricity imports and exports from Ethiopia to other countries are considered.
The model was designed assuming price-inelastic demand, free competition with no market imperfections and exogenously calculated projections for electricity demand (
Section 2.5.4), fuel prices, renewable technology costs, energy resources availability (fossil fuel, renewable), and energy policy.
The estimated fuel prices considered in both models can be found in
Supplementary Materials. The price between the imported fuel and the domestic one is adjusted based on a distance factor defined between the capital and the closest capital-port using a Geographic information system (GIS) tool.
The grid-connected power generation technologies are disaggregated into “old” (existing capacities before 2015) and “new” (capacity investments 2015–2065). The difference between the two technologies is associated with efficiency. The list of the power generation capacities was compiled using local data sources as well as the “World Electric Power Plants Database (December 2015)” [
75] and “NEP 2.0, 2019” [
17] (
Supplementary Materials). An overview of the power generation technologies (grid, mini grid, stand-alone) considered in the models is presented in
Table 4. Only the capacity of committed future projects (power plants, electricity trade links) in which their contract has been signed or the construction has started is installed into the model. The rest of the future power plants and trade links are provided as an option for the model to invest in. A technical (lifetime, construction time, efficiency, load factor) and an economic parameter (overnight cost, operational and maintenance cost) is assigned to each of the power generation technologies (on-grid, off-grid) (
Supplementary Materials).
Fuel-specific carbon dioxide emission factors are considered on the output of import and extraction technologies (
Supplementary Materials). These linkages help identify the country’s total amount of carbon dioxide emissions throughout the modelling period as opposed to consumption accounting. In the transmission and distribution network, country-specific losses are considered throughout the modeling period (
Supplementary Materials). The projections are until 2040, so it is assumed that the losses will remain constant after that year. The transmission and distribution costs are presented in
Supplementary Materials.
The transmission and distribution costs are calculated from the OnSSET outputs, since they depend largely on geospatial factors, such as the population density and local demand of each settlement, as well as the distance covered to connect each settlement to the centralized grid network in the case of grid-extension. These are reported in USD/kW of new generation capacity required to supply the settlement and summarized for the whole country. These transmission and distribution costs are then fed into the OSeMOSYS model to be included in the total system costs.
Ethiopia could export and import electricity to and from other countries (Djibouti, Eritrea, Egypt, Kenya, Somalia, Sudan, Tanzania) through electricity interconnectors. Each electricity interconnector project is represented in the model as a separate technology that can import and export based on each country’s electricity needs and electricity price (
Supplementary Materials).
2.5.4. The Electricity Demand
The electricity demand is disaggregated into “electrified (total)” and “residential (newly-electrified)” into the OSeMOSYS model. The “electrified (total)” includes the electricity demand of the current electrified people in the residential sector as well as the demand of the rest of the sectors (industry, commercial and public services). The “residential (newly-electrified)” includes the estimated future electricity demand of the newly electrified people both in rural and urban areas (aggregated). The OnSSET model considers as an input only the “residential (newly-electrified)” electricity demand.
The scenario projections of electricity demand made use of the following approach. Firstly, an expert elicitation process with sixteen (16) Ethiopian energy and economy experts—conducted as part of a broader project—informed the probable value ranges of chosen demand drivers over the model timeline. The drivers selected were annual average GDP growth, average yearly population growth, average household size by the model end year, and percentage urban population by model end year. The future values attributed to each driver were undertaken following the scenario narratives, guided by existing forecasts of these drivers for Ethiopia [
76,
77,
78], observed changes in other economies, and factoring in co-evolution considerations for the four drivers to avoid scenario inconsistencies.
Secondly, we used econometric models estimated by PATRP [
79] to extend aggregate sector demand projections to the model end year; converting the original model drivers to sector-specific drivers such as GDP per capita, sector output, and sector customers (see [
79] for further details on this approach). Finally, projection adjustments were made for each scenario using value judgments informed by IEA sector projections for East Africa [
80] and sector demand trends observed in other economies that previously held similar consumption levels, demographic characteristics and growth prospects as Ethiopia has today.
A limitation of the econometric models estimated by PATRP [
79] is the study’s reliance on seventeen (17) years of historical data (2001–2017), which largely exhibited exponential growth in electricity demand across sectors due to low levels in 2001. Econometric projections based on this growth trend will maintain an exponential growth trajectory that may be suitable for short-term predictions (e.g., ten years). However, it will likely overestimate demand levels in long term projections, such as those undertaken in this study. Therefore, to treat the above limitation, the final step outlined above was included, adjusting projections using value judgments. These adjustments provided limits to growth and speed of increase in demand across the different scenarios. The use of value judgments and drawing on the historical experiences of other countries is not new in scenario projections (see [
81,
82,
83]).
2.6. Scenarios
Ensuring the sustainable development of energy systems at both national and global scales relies heavily on our ability to anticipate and plan for different possible future outcomes. The best practice to achieve this relies on developing different scenarios addressing changes in pricing, innovation, financing, demand growth, policy strategy, and other factors [
84].
In the context of this work, alternative narratives describing the future energy system were developed in partnership with local stakeholders. This was achieved through an interactive workshop that identified key system drivers for Ethiopia and discussed their importance in enabling, or hindering, different alternative futures.
In this subsection, we describe three scenarios that mirror narratives developed to represent plausible futures for the Ethiopian electricity system. These are mainly driven by differences in future electricity demand, achieving universal access in different years, electricity consumption per capita levels for the newly connected population, availability of future power generation projects, discount rates, and technology cost changes over time.
The New Policy scenario considers that existing policy targets described above (
Section 1) will be primarily met and carried out as planned. It assumes that infrastructure projects that are past final investment decisions are built. As a relative status quo future, the scenario does not involve the deep institutional or public sector reform that would support fast-paced and efficient growth. As such, projects with known issues are delayed in their implementation, as are similar infrastructure projects facing similar risks. While it paints an optimistic future for energy access and growth, the New Policy does not involve fast-paced societal progress. While electrification targets are met, the end-use electricity level that it delivers is not as ambitious as it could be.
The Slow Down scenario describes a much less desirable future where the energy sector struggles to meet its targets. Development trends continue at current rates, putting national policy objectives at risk. Energy shortages and the use of fossil back-up generators continue to be frequent occurrences as national electrification creeps forward, delivering fewer connections at lower levels of given power. The electricity demand increases at a slower pace and electrification is achieved at later years. Because national institutions suffer from fragmentation and inefficiency, the national capacity to invest is affected and large infrastructure projects are delayed, potentially contributing further to creating unserved demand. Similarly, plans to become the export hub of the EAPP are negatively affected and trade remains low as new interconnectors fail to materialize on time. Also, the cost of new technologies is negatively affected by a high cost of finance and more complex power supply options, such as nuclear power, are difficult to envisage.
The Big Business scenario looks at supporting industrial partners and big business over residential consumers. This framework suggests higher support for developing centralized, high voltage electrical systems that support anchor industrial projects. This policy choice supports more robust growth than in the Slow Down. Still, it does not affect ambitious social change relating to, e.g., reducing the use of informal biomass or pushing for deep and fast-growing levels of electrification. As such, Big Business struggles to reach all policy ambitions set out in the NEP and other policy documents. The cost of finance, and therefore, of energy technology is positively impacted by this focus and is relatively lower than in other scenarios.
The differences between these narratives are implemented in OSeMOSYS using the assumptions shown in
Table 4; the OnSSET model, in turn, reflects these differences using residential electricity demand and discount rate levels. Changes to demand drivers are detailed in the following subsection.
Scenario Pathways for Demand Drivers
As mentioned in
Section 2.5.4, four drivers were used to project electricity demand: annual average GDP growth, average yearly population growth, average household size, and percentage urban population—all by the model end year. The values attributed to each driver for a given scenario were informed by the scenario’s narrative, existing forecasts, and expert judgments on the driver’s uncertain future.
In the New Policy scenario, Ethiopia’s GDP and population growth were assumed such that the country’s per capita GDP reaches a level commensurate with today’s lower-middle-income country by the early 2040s and that of an upper-middle income country by the model end year. Over the model timeline, Ethiopia obtains double-digit annual GDP growth in approximately only half a dozen years and averages 7.89% growth between 2015 and 2065. The UN forecasts Ethiopia’s population grows at a yearly average of 2.03% between 2016 and 2050 [
77]. Our New Policy scenario’s annual growth rates are not too dissimilar to this, slowing down only marginally quicker than UN projections, with a 2015 to 2065 annual average of 1.75%. Finally, we assume urbanization and average household size to reach 56.3% and 2.98, respectively, in 2065. In this scenario, it is assumed that Ethiopia’s electricity demand would reach approximately the United Kingdom’s current electricity consumption levels [
20].
In the Slow Down scenario, Ethiopia’s annual GDP growth falls as low as 3% within the decade leading up to 2030, together with a second slow down for half a decade leading up to 2040. Following those turbulent periods, only modest growth is experienced, with levels rarely exceeding 7%. Over the model timeline, the country is assumed to grow only as the average low-income country has with average annual GDP growth of 5.45%. Population growth is a lot faster in the Slow Down scenario, with a yearly average of 2.27% over the model timeline. It highlights a continued demand for larger households in a society with fewer developments relative to present circumstances, only reaching an annual growth rate that is akin to that of a lower-middle-income country by the end of the model timeline. By 2065, the country’s urban population only reaches 36% and the size of the average household is 4.15. It is assumed that the government only sees the type of urbanization changes that India observed in the 40 years to 2018, before growing marginally faster between 2060 and 2065. Ethiopia’s electricity demand by 2065 is expected to be similar to Sweden’s current level [
20].
Finally, the driver pathways for the Big Business scenario largely mirror those of the New Policy Scenario. It only experiences slightly faster GDP growth than the New Policy scenario, primarily in the early years. However, in calculations, according to the PATRP method [
79], much faster growth compared to the New Policy scenario is assumed in the industry and services sectors, but less so in agriculture. Ethiopia’s electricity consumption is expected to reach similar levels as Germany’s current level [
20].
The overview of the scenarios and the key parameters are presented in
Table 5 below.
The evolution of the annual electricity demand by sector throughout the modelling period for each scenario is presented in
Table 6 and only by a scenario in
Figure 3.
3. Results and Discussion
This section reports the key modelling results for the three scenarios related to the power generation capacity, electricity supply mix, the population connected per technology option, the residential electricity demand per technology option, maps of where the different technologies should be utilized, electricity exports, capital investments, operational and maintenance costs, revenues from electricity exports, overall technology split, and carbon dioxide emissions. Note that the demand per technology feeds into the OSeMOSYS model.
3.1. New Policies Scenario
3.1.1. Power Generation Capacity
In the New Policies scenario, the power generation capacity gradually increases from 3 GW in 2015 to 23 GW in 2030, 88 GW in 2050, reaching 169 GW in 2065 (
Figure 4). As the government aims to diversify its renewable energy portfolio mix to provide a secure electricity supply, the renewable energy share from 95% in 2015 increases to 100% in 2030, reaching 95% and 77%, respectively, in 2050 and 2065. This decrease is because some renewable technologies reach their maximum potential before 2065. Maintaining adequate generation capacity in the power system to keep the planning reserve margin investments on fossil fuel technologies is required. Specifically, hydropower reaches its max potential of 44GW in 2046, including the future installation of different phases of large hydropower plants such as Gilgel Gibe, Genale Gawa, and the Grand Renaissance Dam. Therefore, solar PV and CSP technologies gradually increase their share in the power system’s total capacity in the future, reaching 35 GW and 32 GW, respectively, in 2065. Consequently, due to the high availability of solar, solar technologies become the leading power generation technology in the country’s power system after hydropower. Besides, geothermal, wind and biomass gradually increase their power generation capacity going up to 5 GW in 2042, 10 GW in 2050 and 4 GW in 2065, respectively.
To maintain the planning reserve margin, the capacity of heavy fuel oil generation increases at the end of the modelling period (2062–2065), reaching 3.72 GW by 2065 and natural gas ones increase from 0.03 GW in 2046 to 29.5 GW in 2065 as hydropower reaches its maximum potential in 2046. Lastly, nuclear capacity grows from 0.46 GW in 2052 to 6.96 GW in 2065.
3.1.2. Electricity Supply Mix
In the New Policies scenario, the electricity supply increases from 12 TWh in 2015 to 98 TWh in 2030, 305 TWh in 2050, gradually reaching 517 TWh in 2065. Renewable energy technologies constitute most of the power generation mix, from 95% (12 TWh) in 2015, increasing to 100% (98 TWh) in 2030, gradually decreasing to 98% (299 TWh) in 2050 and finally reaching 89% (458 TWh) in 2065. To secure electricity supply and provide low-cost electricity to its citizens, the country diversifies its power generation mix by 2065. While hydropower remains the dominant source of power generation, constituting 41% (183 TWh) of the RET share in 2065 due its abundant resources, it is followed by CSP 29% (127 TWh) and solar PV 15% (66 TWh). Geothermal contributes to 8% (35 TWh), wind 7% (29 TWh) and biomass 4% (18 TWh) of the RET share in 2065.
Figure 5 shows that fossil fuels represent only 1% of the total electricity supply mix by 2065, primarily by heavy fuel oil 0.7% (3 TWh) and natural gas 0.6% (3 TWh). Consequently, nuclear supplies the rest of the electricity mix 10% (52 TWh) in the same year.
It is interesting to notice that as hydropower reaches its maximum electricity generation in 2046, natural gas and nuclear technologies gradually penetrate the electricity supply mix. Nevertheless, natural gas power plants do not generate electricity according to their full capacity to maintain the reserve margin due to the constrained availability of domestic natural gas reserves.
Lastly, electricity exports increase from 832 GWh in 2015, primarily to Djibouti (50%) and Sudan (50%), to 18 TWh in 2065, exporting mainly to Sudan (52%) followed by Kenya (40%), Tanzania (5%), and Djibouti (2%).
Electrification Split (Grid, Mini grid, Stand-Alone) in Residential Areas
The New Policies scenario assumes that the NEP 2.0 electricity access target levels (100% by 2025) are achieved, but at relatively lower consumption levels (
Supplementary Materials). Also, according to the NEP II targets, everyone within 5 km of the existing grid is connected by 2025 (65% of the population), and the remainder are electrified via off-grid technologies. It is also assumed that everyone within 25 km of the existing grid is connected by 2030 (95% of the population), and the remainder to be electrified via off-grid technologies. The resulting population splits in this scenario are therefore predetermined to a large extent by the NEP 2.0 targets until 2030 (65% grid and 35% off-grid by 2025 and 95% grid and 5% off-grid by 2030). Once connected to it, settlements stay “on the grid” for the rest of the modelling period.
Figure 6 illustrates that the majority of the population are grid-connected, followed by stand-alone PV, mini grid PV, and mini grid hydro to achieve universal access to electricity in Ethiopia by 2025. Following the NEP II targets, 95% of the population receive electricity from the centralized grid by 2030. In later years, the share of grid-connection increases slightly, and by the end of the modelling period just over 1% of the population receives electricity from off-grid technologies. These are mostly settlements located far from the existing network, where the extension of HV or MV lines would be very expensive. The population connected by stand-alone technologies in the early years has a significantly lower demand per capita, so their share of demand is much smaller than their percentage of the electrified population. Besides, the high residential demand areas are mostly found close to the existing network. Lastly, a small number of mini grids will be interconnected to the grid in this scenario, especially those that are deployed between 5 km and 25 km grid distance by 2025 to meet the demand in the short term.
3.1.3. Total System Costs and Electricity Export Revenues
In the New Policies scenario, the overall capital expenditure, including power generation technologies, expansion of the transmission and distribution network and electricity interconnector projects, is 548 billion USD for the period 2015–2065. Specifically, achieving universal access and cover the country’s future energy needs requires approximately 40 billion USD in capital investments in power generation technologies for the period 2020–2025. This includes 38 billion USD on grid-connected technologies, 0.9 billion USD on mini grid, and 1.5 billion USD on stand-alone technologies. Furthermore, for the same period, 37 million are spent on mini grid extension and 6.1 billion USD on the expansion of the transmission and distribution network. The total cumulative capital investments in grid-connected power generation technologies represents 466 billion USD while mini grid and stand-alone require 2.6 billion USD and 28 billion USD, respectively, between 2015 and 2065.
Also, the overall operational and maintenance costs are 183 billion USD for the period 2015–2065 including mainly fixed (168 billion USD) and variable (15 billion USD) costs (
Figure 7).
The country’s total export revenue potential is 175 billion USD for the period 2015–2065, primarily from electricity exports to Sudan (103 billion USD), followed by exports to Kenya (56 billion USD).
3.2. Comparison of Scenarios
The differences in some input factors among the scenarios such as achieving universal access in 2025 (New Policies) rather than in 2042 (Slow Down, Big Business), the electricity demand levels, the delay in the implementation year of the future power plant investments, the availability of technologies and the discount rate lead the power systems to evolve differently. Specifically, the power generation capacity is highest in the Big Business scenario, followed by the New Policies and the Slow Down scenario with a higher penetration of RET technologies in earlier years. Hydropower is the primary energy source in all systems, followed by solar PV. As hydropower reaches its maximum potential, gas power plants start penetrating the power system to maintain an adequate reserve margin. However, the limited availability of gas reserves ultimately restricts the growth of gas capacity and as the system grows in size (especially in the Big Business scenario), nuclear power gradually increases its capacity.
Achieving universal access and continuing to electrify future connected residential areas, the grid-connected technologies cover most of the population in the New Policies scenario. At the same time, in the Big Business, we see a higher penetration of mini grid and stand-alone technologies while in the Slow Down stand-alone PV technologies play a larger role.
Increasing the size of Ethiopia’s power system increases overall system costs and decreases electricity export revenues. Specifically, in the Slow Down scenario, future electricity exports reach zero.
The government’s vision is to achieve universal access and meet its future electricity needs without increasing greenhouse gas (GHG) emissions during 2010–2030. Under the New Policies scenario, Ethiopia’s CO2 emissions increase from 0.42 Mt CO2 in 2015 to 4 Mt CO2 in 2065, compared to the other two scenarios Slow Down and Big Business scenario, reach 30 Mt and 4 Mt respectively in 2065. Nevertheless, achieving universal access by 2025 (New Policies) and meeting the government’s targets, CO2 emissions reach cumulative 2.4 Mt CO2 during 2015–2030, on an average of 0.22 Mt CO2 annually.
3.2.1. Power Generation Capacity
In the Slow Down scenario, the lower future electricity demand than the New Policies scenario and the delay in the implementation year of the future committed projects lead to much lower power generation capacity requirements between the two scenarios in the future (
Figure 8). Specifically, the Slow Down scenario’s power generation capacity is 127 GW lower than in the New Policies scenario by 2065. Nevertheless, the Slow Down scenario’s renewable energy portfolio mix follows a similar pattern to the New Policies scenario, reaching 76% in 2065. Hydropower is the dominant power generation technology in both systems, 26 GW less in the Slow Down scenario, followed by solar PV, CSP, and wind and geothermal technologies. None of the renewable technologies reach their maximum potential in the Slow Down scenario due to higher capacity constraints and lack of financing, delaying the implementation year of future investments. In the Slow Down scenario, due to the non-availability of investing in nuclear power plants and maintaining adequate generation capacity, we see higher investments in diesel and heavy fuel oil power generation technologies reaching 6 GW and 1.7 GW, respectively, by 2065.
Figure 9 shows that the Big Business scenario requires higher power generation capacity investments than the New Policies scenario since the electricity demand levels are higher. In detail, in the Big Business scenario, the power generation capacity is 46 GW higher than in the New Policies scenario by 2065. In the Big Business scenario, the penetration of renewable technologies is lower than the New Policies scenario, primarily starting from 2040 onwards, reaching almost similar levels, 76% by 2065. This decrease is primarily because some renewable technologies reach their maximum potential at an earlier stage, between 2020–2040, in the Big Business scenario, with, e.g., hydropower reaching 44 GW in 2041, to satisfy the country’s electricity needs. Furthermore, in the Big Business scenario, higher solar PV and CSP investments are required than in the New Policies scenario, 23 GW and 9 GW, respectively, in 2065.
In the Big Business scenario, gas power plants gradually penetrate the power system at earlier years than in the New Policies one, to maintain the adequate reserve margin, reaching an overall capacity of 37 GW in 2065, constituting most of the fossil fuel power. The rest is covered by heavy fuel oil power plants, starting from 2052 onwards, reaching 6 GW in 2065. Furthermore, nuclear investments start earlier in the Big Business scenario reaching 0.7 GW in 2042, and 8 GW in 2065.
3.2.2. Electricity Supply Mix
Figure 10 illustrates that the Slow Down scenario electricity supply would be considerably lower than the New Policies scenario, approximately by 349 TWh, reaching 168 TWh in 2065. This decrease is due to the delay in the implementation year of future power generation projects and the lower electricity demand. The overall electricity supply mix is almost the same in both scenarios until 2040. However, the Slow Down scenario’s renewable energy supply mix reaches 75% in 2065 compared to 89% in the New Policies scenario. Hydropower is the primary energy source in both systems, supplying 35% in the New Policies scenario and 44% in the Slow Down scenario by 2065. Nevertheless, in the Slow Down scenario, geothermal is the second renewable energy source by 2065, supplying 10% of the total electricity, compared to the New Policies scenario where solar PV provides 13% of the total electricity in the same year. Following up, CSP technologies constitute 9% of the Slow Down scenario’s electricity supply mix compared with 24% in the New Policies scenario by 2065.
As hydropower reaches its maximum potential in the New Policies scenario in 2046, we see the gradual penetration of gas and nuclear power plants. On the other hand, in the Slow Down scenario, due to the lower availability of hydropower investments and the absence of nuclear investments, gas power plants penetrate the electricity supply mix in earlier years, starting from 2041 onwards.
Considering fossil fuel consumption between the two scenarios, results in the Slow Down scenario show gas-based electricity supply coming into the power system in 2041, compared to 2046 in the New Policies scenario. Similarly, heavy fuel oil power plants start supplying electricity in 2048 compared to 2062. This penetration is primarily to maintain an adequate reserve margin.
Figure 10 shows that the larger power system in the New Policies compared to the Slow Down scenario see hydropower-based electricity supply reach its maximum potential in 2046, shifting electricity supply thereafter to gas and then nuclear power plants satisfying the final electricity demand.
Electricity exports are, on average, 63% higher in the New Policies compared to the Slow Down scenario between 2021–2051, with exports in the latter hitting rock bottom from 2052 onwards. While the electricity interconnector with Tanzania is built in the Slow Down scenario, it is not cost-effective to export electricity except during 2026–2029.
Electrification Split in Residential Areas (Slow Down vs New Policies)
The Slow Down scenario assumes that the electrification rate increase follows the same rate as in the last decade, meaning universal access is achieved by 2042 (rather than 2025 as in the New Policies scenario). The maximum number of new grid connections is constrained to 500,000 households per year until 2030 (the rate of the last few years), and then assumed to ramp up to 750,000 households per year between 2030 to 2040, and 1,000,000 households per year from 2040 to 2050. Settlements within 2 km of the grid are connected after 2040, even if grid-connection is not the least-cost alternative (but may be connected in earlier years if it is least-cost optimal and the maximum number of grid-connections allows for it). The target of connecting everyone within 5 km and 25 km of the grid by 2025 and 2030 respectively as in the NEP II are not imposed in the Slow Down scenario (
Supplementary Materials).
In the Slow Down scenario, the residential electricity demand and the reliance on grid-connection are significantly lower compared to New Policies scenario. The considerably lower electricity demand in the Slow Down scenario has a high impact on technology choice. Grid-connection follows a much slower pace, replaced to a large part by stand-alone PV. Furthermore, PV mini grids start supplying electricity after 2040 as electricity demand increases in more remote areas. A significant share of the population will still have only Tier 1 level of electricity demand (5–19 kWh) with an increasing share of Tier 2 (180–230 kWh) and Tier 4 (1870–1910 kWh) electricity demand from 2040 onwards (
Supplementary Materials). Therefore, stand-alone PV systems would still be the least-cost solution for a large share of the population even by the end of the analysis. Similar to the New Policies, the Slow Down scenario shows most of the population with high electricity demand served by the grid (
Figure 11). The population connected per technology (grid, mini grid, stand-alone) in the Slow Down scenario is presented in
Supplementary Materials.
Electricity Supply Mix
Electricity supply in the Big Business scenario is higher than the New Policies scenario by 93 TWh in 2065, reaching an overall 611 TWh (
Figure 12). Renewable penetration is also higher and supplies approximately 88 TWh more in 2065, increasing the renewable energy technology share from 95% in 2015 to 90% in 2065, compared to 89% under New Policies. In the Big Business scenario, the higher electricity demand and achieving universal access by 2042 lead to higher electricity supply from renewable resources, specifically hydropower during 2023–2046. Also, wind technologies satisfy most of the electricity demand during 2022–2049, followed by primarily solar PV, CSP and biomass technologies.
In the Big Business scenario, we see a higher penetration of fossil fuel technologies, as some renewable technologies reach their maximum potential (hydropower, wind, geothermal). It is interesting to notice that even though gas power plants’ capacity is higher in the Big Business than the New Policy scenario, the electricity supplied is lower due to the limited availability of domestic natural gas reserves. Thus, nuclear power plants provide more electricity in the Big Business scenario to satisfy the required electricity needs, primarily from 2042 onwards. Furthermore, heavy fuel oil systems start producing electricity from 2052 onwards as the gas-based electricity supply decreases in the Big Business scenario.
Electricity exports are, on average, 25% higher in the New Policies scenario during 2021–2051 compared to the Big Business scenario, by 11% lower during 2052–2065. This shift in electricity exports is primarily due to the higher future penetration of CSP and heavy fuel oil technologies in the electricity supply mix in the Big Business scenario, exporting most of the electricity to Sudan, followed by Kenya and Tanzania.
Electrification Split in Residential Areas (Big Business vs New Policies)
In the Big Business scenario, it is assumed that electrification follows the same rate as in the last decade, meaning universal access is achieved by 2042. The maximum number of new connections to the grid is again constrained to 500,000 households per year until 2030 (the current level), then 750,000 households per year from 2030 to 2040 and 1,000,000 households per year from 2030 to 2040. The NEP 2.0 targets connecting settlements within a pre-defined distance to the grid is not imposed. Settlements within 2 km of the grid are connected after 2040, even if grid-connection is not the least-cost alternative (but may be connected in earlier years if it is least-cost optimal to be supplied by technology and the maximum number of grid-connections allows for it). A significant share of the population will have only Tier 1 (5–19 kWh) until 2040, then moving to Tier 3 (570–620 kWh) and Tier 4 (1870–1910 kWh) electricity demand (see
Supplementary Materials).
In the Big Business scenario, the residential electricity demand supplied increases slower than in the New Policies scenario, mainly due to a slower rate of electrification, but reaches the same level during later years (
Table 5). Between 2025 and 2040, a large share of the population is served by mini grid (14% in 2040) and stand-alone PV (27% in 2040) technologies, as the grid is focused on supplying the industrial demand over new residential connections in this scenario (
Figure 13). A large increase in grid-connections takes place between 2040 and 2050. From 2050 onwards, most of the population is served by the grid at the lowest cost, and mini grids supply remote locations. This means PV mini grids would supply electricity to the population in the short (5% in 2025) and medium term (13% in 2040), but these will later be connected to the grid. In many cases this is even before the system lifetime of the mini grids has expired. It has been assumed that this interconnection is possible from both technology and business/policy perspective. The population connected per technology (grid, mini grid, stand-alone) in the Big Business scenario is presented in the
Supplementary Materials.
The differences in technology split between grid-connected, mini grid and stand-alone technologies for the different scenarios between 2025 and 2070 can also be seen in the electrification maps shown in
Figure 14,
Figure 15 and
Figure 16. Corresponding maps for each of the scenarios for intermediate years can be found in
Supplementary Materials.
3.2.3. Total System Costs and Electricity Exports
The overall capital expenditure is estimated to be 375 USD billion lower in the Slow Down than the New Policies scenario (2015–2065) (
Figure 17). Although the higher discount rate in the Slow Down scenario leads to higher overall capital costs (173 billion USD during 2015–2065), the much lower power generation requirements than the New Policies scenario leads to lower overall costs between the two systems. In the Slow Down scenario, to achieve universal access between 2020–2042, 44 billion USD needs to be spent on capital investments on grid-connected technologies, 144 million USD on mini grid and 856 million USD on stand-alone technologies. Moreover, 14 million USD is spent on mini grid extension and 3.5 billion USD on the expansion of the transmission and distribution network during the same period.
Also, the fixed costs in the Slow Down scenario would be 121 million USD less than the New Policies scenario and the variable costs 55 million USD more, respectively, during the period 2015–2065. The increase in variable expenses is primarily due to the higher penetration of diesel, heavy fuel oil and gas technologies.
As overall electricity exports reach zero levels after 2051, the export revenues are getting higher in the New Policies than in the Slow Down scenario. Thus, in the Slow Down scenario, the overall export revenues would be 129 million USD less than the New Policies scenario.
A less aggressive electrification pathway, lower electricity demands, delay in the implementation year of the upcoming power generation projects, and a higher discount rate in the Slow Down scenario than the New Policies scenario leads to lower overall capital investments, fixed costs and revenues but higher variable costs.
In the Big Business scenario, the significantly larger system increases the overall capital costs by 121 million USD compared to the New Policies scenario during the period 2015–2065 (
Figure 17), notwithstanding the lower discount rate. In the Big Business scenario achieving universal access by 2042 requires 191 billion USD investments in grid-connected technologies, 5 billion on mini grids USD and 22 billion USD on stand-alone technologies during 2020–2042. Furthermore, 165 million USD is spent on mini grid expansion and 23 billion USD on developing the transmission and distribution network during the same period.
Also, in the Big Business scenario, the fixed and variable costs are 68 million USD and 13 million USD more than the New Policies scenario, respectively, during the period 2015–2065, due to the higher penetration of fossil fuel and nuclear technologies in the former. Conversely, electricity exports are lower during 2022–2050 than in the New Policies scenario before increasing during 2051–2065, leading to overall revenues of 25 billion USD.
3.2.4. Carbon Dioxide Emissions
The government’s vision is to achieve universal access and meet its future electricity needs without increasing greenhouse gas (GHG) emissions during 2010–2030. Under the New Policies scenario, Ethiopia’s CO
2 emissions increase from 0.42 Mt CO
2 in 2015 to 4 Mt CO
2 in 2065, peaking in 2049 at 7 Mt CO
2. Achieving universal access by 2025 and meeting the government’s vision, in the New Policies scenario, CO
2 emissions will be cumulative 2.4 Mt CO
2 during 2015–2030. Compared to the other two scenarios Slow Down and Big Business scenario, the CO
2 emissions reach 30 Mt and 4 Mt, respectively, in 2065 while cumulative 2.4 Mt and 31 Mt, respectively, during 2015–2030. In the Big Business scenario, the higher electricity demand, compared to the other two scenarios, with a sharp increase from 2020 onwards, leads to higher CO
2 emissions due to gas and diesel technology penetration. Nevertheless, the CO
2 emissions in the Slow Down and Big Business scenarios reach cumulative 0.67 Mt and 0 Mt, respectively, during 2030–2042 (
Figure 18). The sharp decrease in CO
2 emissions in the Slow Down and New Policies scenario is due to the lower use of the natural gas power plants due to the constrained availability of domestic natural gas reserves.
3.2.5. Electricity Exports
We model planned interconnections to reflect the government’s targets to expand its electricity trading scheme and become an electricity hub exporter in the region in the upcoming decades. Thus, the overall export capacity increases from 0.20 GW in 2015 to 5 GW in 2065. Specifically, the existing electricity interconnector capacity to Djibouti (0.19 GW) is expected to remain constant until 2065, while the one to Sudan increases from 0.10 GW in 2015 to 1.60 GW in 2023, finally reaching 3.10 GW in 2025. New electricity interconnector projects are expected with Tanzania, investing in 0.41 GW in 2021 and Kenya investing in 0.40 GW in 2020 and reaching 1.40 GW in 2028 (
Figure 19).
Lastly, while the government is expected to invest in all the future electricity interconnector capacity in both scenarios, these investments are delayed by five years in the Slow Down scenario (
Figure 20).
Lastly, the future electricity interconnector capacity to neighboring countries is expected to be the same between Big Business and New Policies scenarios.
In the New Policies scenario, the electricity exports increase from 832 GWh in 2015 to 18 TWh in 2065. This is linked to higher electricity exports to Sudan, followed by Kenya, Tanzania, and Djibouti. In the Slow Down scenario, higher investment costs and lower power availability lead electricity exports to be considerably lower than in the other two scenarios, reaching zero levels by 2052. The postponement in future investments in electricity interconnector projects and the lower limits on annual capital investments in technology lead to less electricity being available for export. Although the power generation is higher in the Big Business than the New Policies scenario, exports are lower due to the country’s higher electricity demand focusing on industrial development. On the other hand, higher investments in nuclear and other RET technologies in the Big Business scenario lead to higher electricity exports after 2054 compared with the New Policies scenario. The sharp increase and decrease during different periods between the New Policies and Slow Down scenarios is due to the shift in gas-based power generation (
Figure 21).
4. Conclusions and Policy Implications
Ethiopia relies on limited fossil fuel reserves (natural gas) to support a green and sustainable transformation of its electricity supply system, so it is challenging, and several factors need to be overcome.
Our study analyzed three scenarios to examine how key factors (e.g., evolution of the electricity demand, higher power generation costs, lack of financing) could influence the country’s energy transition (development indicators can be seen in
Supplementary Materials).
Ethiopia has many renewable resources to exploit to develop and restructure its electricity supply system, making it efficient and accessible for all its citizens, and providing security of supply. However, efficient energy system planning needs to consider the issues of low electricity access and of lack of financial resources together, particularly as the Covid-19 pandemic has disrupted the energy sector’s evolution [
85]. Viable markets, suitable energy policies, and political will are essential components of sustainable energy development [
86]. Addressing our first research question, this study sheds light on the type of power generation technologies the government could invest in and in which year to provide affordable-least-cost electricity to achieve universal access and cover its future electricity needs until 2065. It also looks at environmental and electricity export implications.
In all scenarios, the county needs to expand its power generation capacity to achieve universal access and cover its future energy needs. Nevertheless, as presented in
Section 2, the evolution of different electricity demand and consumption levels among the scenarios lead the power systems to evolve differently. As electricity demand increases at a higher pace and universal access is achieved in earlier years among the scenarios, we see a higher penetration of RET technologies in earlier years. Although hydropower is being fully exploited in different years, if investments are allowed (Big Business, New Policies), the country still diversifies its power generation mix in the future with the penetration of RET technologies such as solar PV, CSP, followed by wind, geothermal and biomass. In that way, the country harnesses its high availability of renewable resources. In case future investments in hydropower and other renewable technologies (Slow Down) are limited due to lack of finance, we see a higher penetration of fossil fuel technologies.
Specifically, natural gas, followed by heavy fuel oil, gradually penetrate the power system to maintain an adequate reserve margin as other technologies (e.g., hydropower) reach their maximum potential. This penetration leads to higher CO2 emission levels by 2065. Besides, as hydropower reaches its maximum potential, nuclear power gradually comes into the power system (New Policies, Big Business), providing low-cost electricity. Also, improvements in transmission and distribution networks are highlighted in all scenarios and are essential in the future.
However, this energy transition is associated with two challenges. Firstly, hydropower resources’ full exploitation could create a geopolitical crisis with other countries due to lower water resource availability. Specifically, most of Egypt’s population (90%) lives alongside the Nile River, which supplies most of Egypt’s and Ethiopia’s water [
87,
88]. Secondly, as the size of the power system increases (Big Business) constrained with the limited availability of domestic gas reserves, nuclear capacity gradually increases, which may be advantageous and challenging with this transition [
89].
Our study assessed how geospatial analysis could enhance the energy system modelling to account for geospatial drivers of choices between electrification technologies and how they improve the results considering this extension. Achieving universal access and continuing to electrify future connected residential areas, the grid-connected technologies cover most of the population in the New Policies scenario. Conversely, in the Big Business, we see a higher penetration of mini grid and stand-alone technologies, and in the Slow Down, stand-alone PV technologies play a larger role. The volume of electricity exports also varies between scenarios. Limits to investment that affect the Slow Down case gradually push export volumes to zero, significantly affecting Ethiopia’s ambitions. While exports continue at high levels under the New Policies and Big Business cases, their levels tend to decline over the modelling period before stabilizing. Domestic constraints on both the availability of finance and power system capacity growth will affect Ethiopia’s ability to meet its regional export ambitions.
Under the Slow Down assumptions, exports rapidly slow to zero as domestic demand increases while generation system capacity falters. While the New Policies and the Big Business cases reflect stronger abilities to invest in a larger generation system, their export levels also decrease over time as the pressure from domestic demand increases.
Finally, the difference between export levels in the Big Business and the New Policies scenarios highlights that Ethiopia may struggle to provide for large domestic industrial ambitions while also converting into a regional export hub for the EAPP.
Supporting the government’s future ambitions, both domestically and abroad, the energy transition requires large infrastructure investments in the power sector, leading to a range of capital expenditures between 173 billion USD (Slow Down) to 669 billion USD (Big Business) for the period 2015–2065. Also, the overall operational and maintenance costs are estimated to be in a range of 117 billion USD (Slow Down) to 265 billion USD (Big Business) for the period 2015–2065. These costs are primarily fixed costs in the New Policies and Big Business scenario, while in Slow Down, the higher penetration of fossil fuel technologies leads to higher variable costs.
One of the government’s ambitions is developing international trade and becoming an electricity exporter in the region. This is achieved in the New Policies and Big Business scenario. In contrast, in the Slow Down scenario, electricity exports drop to zero. Most of the electricity is exported to Sudan, followed by Kenya, Tanzania, and Djibouti, highlighting Ethiopia’s energy transition into other neighboring countries’ electricity supply.
Thus, the government could use the electricity export revenues to boost economic growth, support the development of its energy system, and finance the renewables’ investments. The country’s total export revenue potential is in a range of 46 billion USD (Slow Down) to 174 billion USD (New Policies) for the period 2015–2065, primarily from electricity exports to Sudan, followed by Kenya. A heavier industrialization electricity demand levels (Big Business) would lead to lower export revenues of 150 billion USD.
The government’s vision is to achieve universal access and meet its future electricity needs without increasing greenhouse gas (GHG) emissions during 2010–2030. Under the New Policies scenario, Ethiopia’s CO2 emissions increase from 0.42 Mt CO2 in 2015 to 4 Mt CO2 in 2065, compared to the other two scenarios Slow Down and Big Business scenario, reach 30 Mt and 4 Mt respectively in 2065. Nevertheless, achieving universal access by 2025 (New Policies) and meeting the government’s targets, CO2 emissions are expected to be cumulative 2.4 Mt CO2 during 2015–2030, on an average of 0.22 Mt CO2 annually.
Looking ahead, these results do, however, call for further work. The penetration of decentralized technologies into the country’s power system will play a complex role that needs to be examined in more detail [
90]. Similarly, the environmental and socio-economic impacts of power system investments are not considered in this study but may have significant implications in particular with respect to large hydropower. Trade-offs exist, for example, with potable, industrial and agricultural uses of water [
34,
91], but also with climate variability. While out of scope in this study, this relates particularly to precipitation and means that lower water availability resources could significantly impact future domestic power generation [
22,
92,
93,
94,
95,
96]. Modelling storage could also provide a better understanding of the country’s energy transition and energy markets. Also, the model is deterministic and the uncertainty surrounding future electricity demand, fuel prices, and technology costs projections could be further examined through a sensitivity analysis to quantify and have a formal understanding of the implications in the electricity supply system. The COVID-19 pandemic represents an uncertainty that impacted not only the energy system (e.g., electricity demand, power generation investments, fuel prices, electricity security, energy access) but also the economy of Ethiopia [
97,
98,
99]. Lastly, the study is open source, meaning that the input data could be updated in the future, using only one database, which is missing at the moment, to improve the accuracy of the modelling results further.
The strength of this work, however, is that it provides a new, geographically explicit, and more granular platform from which to expand studies into these limitations and with which to combine other modelling methodologies. It also establishes an analytical framework, co-developed with local stakeholders that could provide a whole energy system and in-depth analysis of Ethiopia’s future policy ambitions including to inform its upcoming NDC process.


 ,
, 


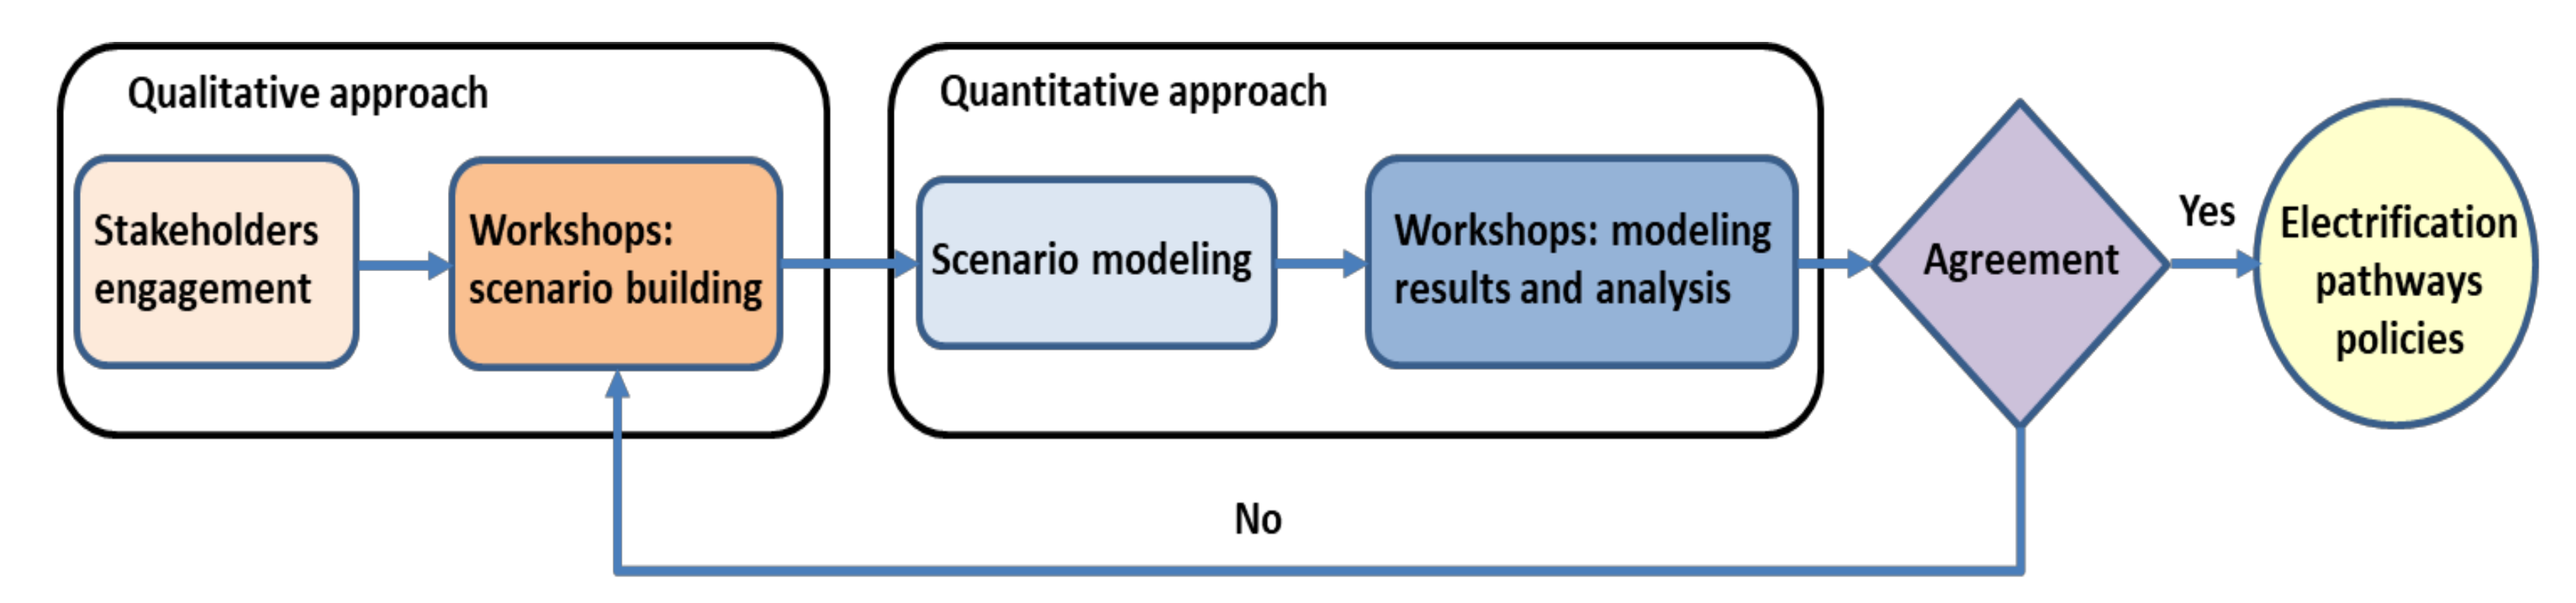
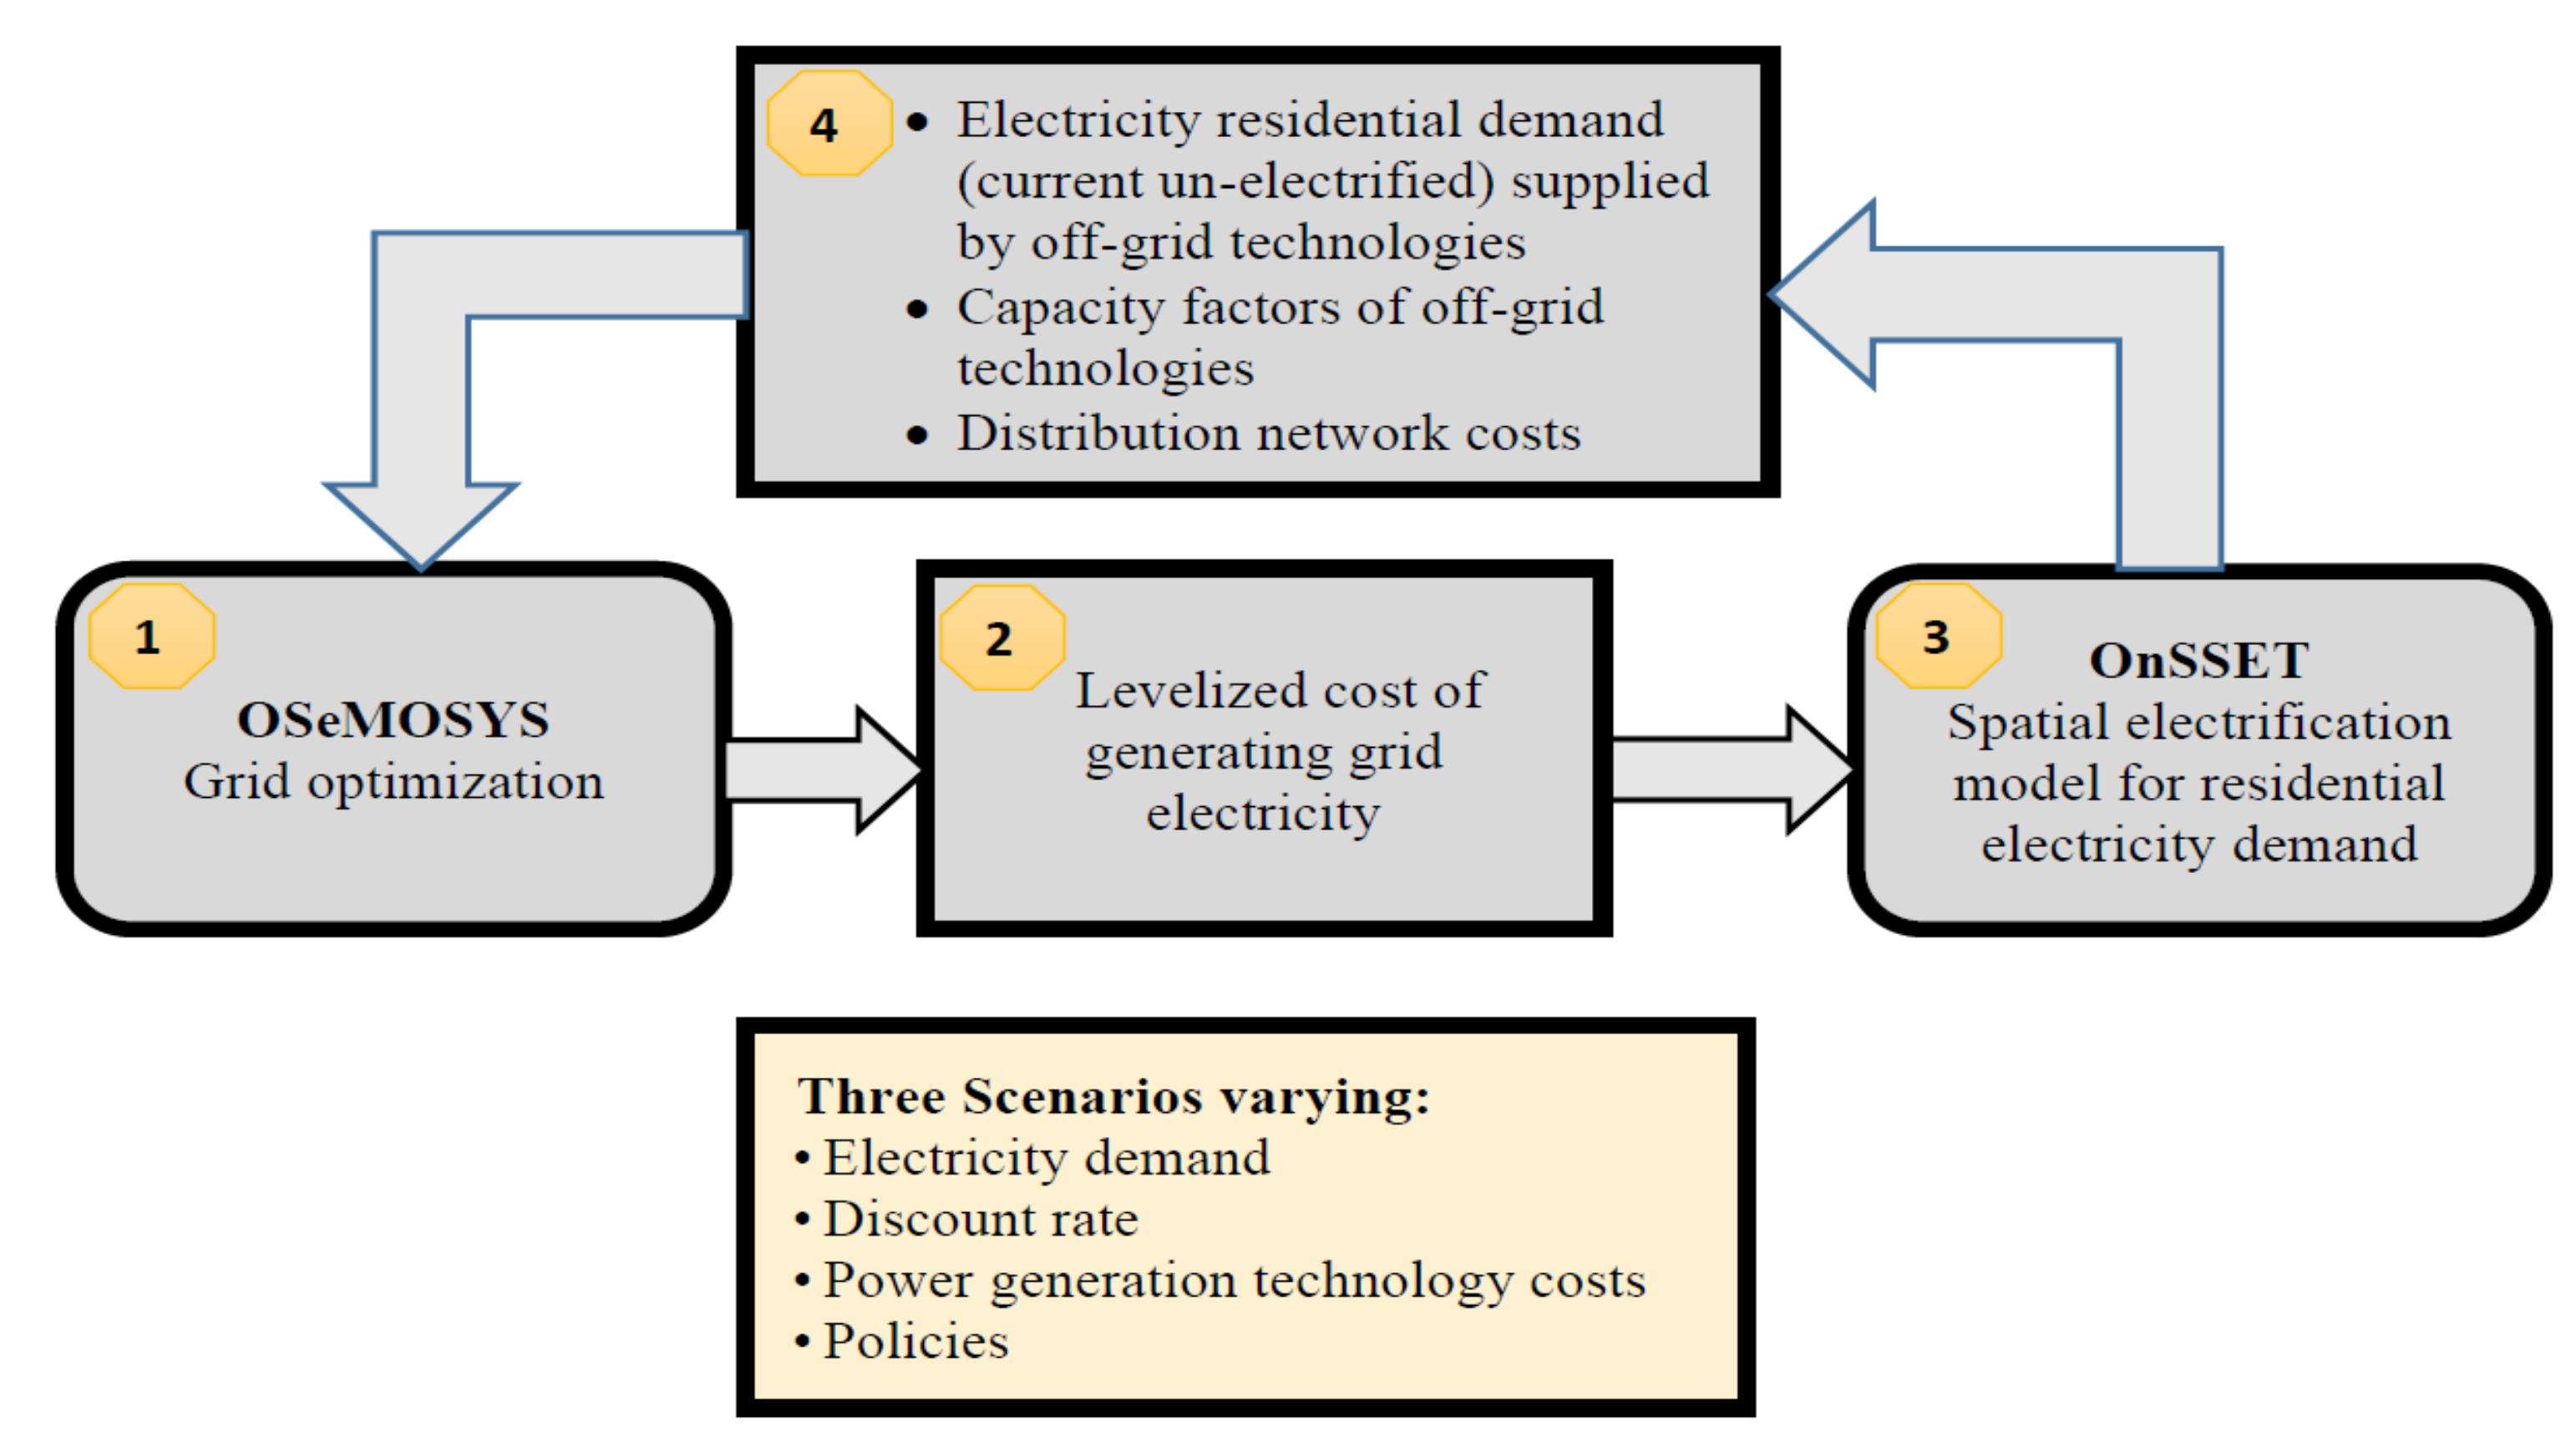
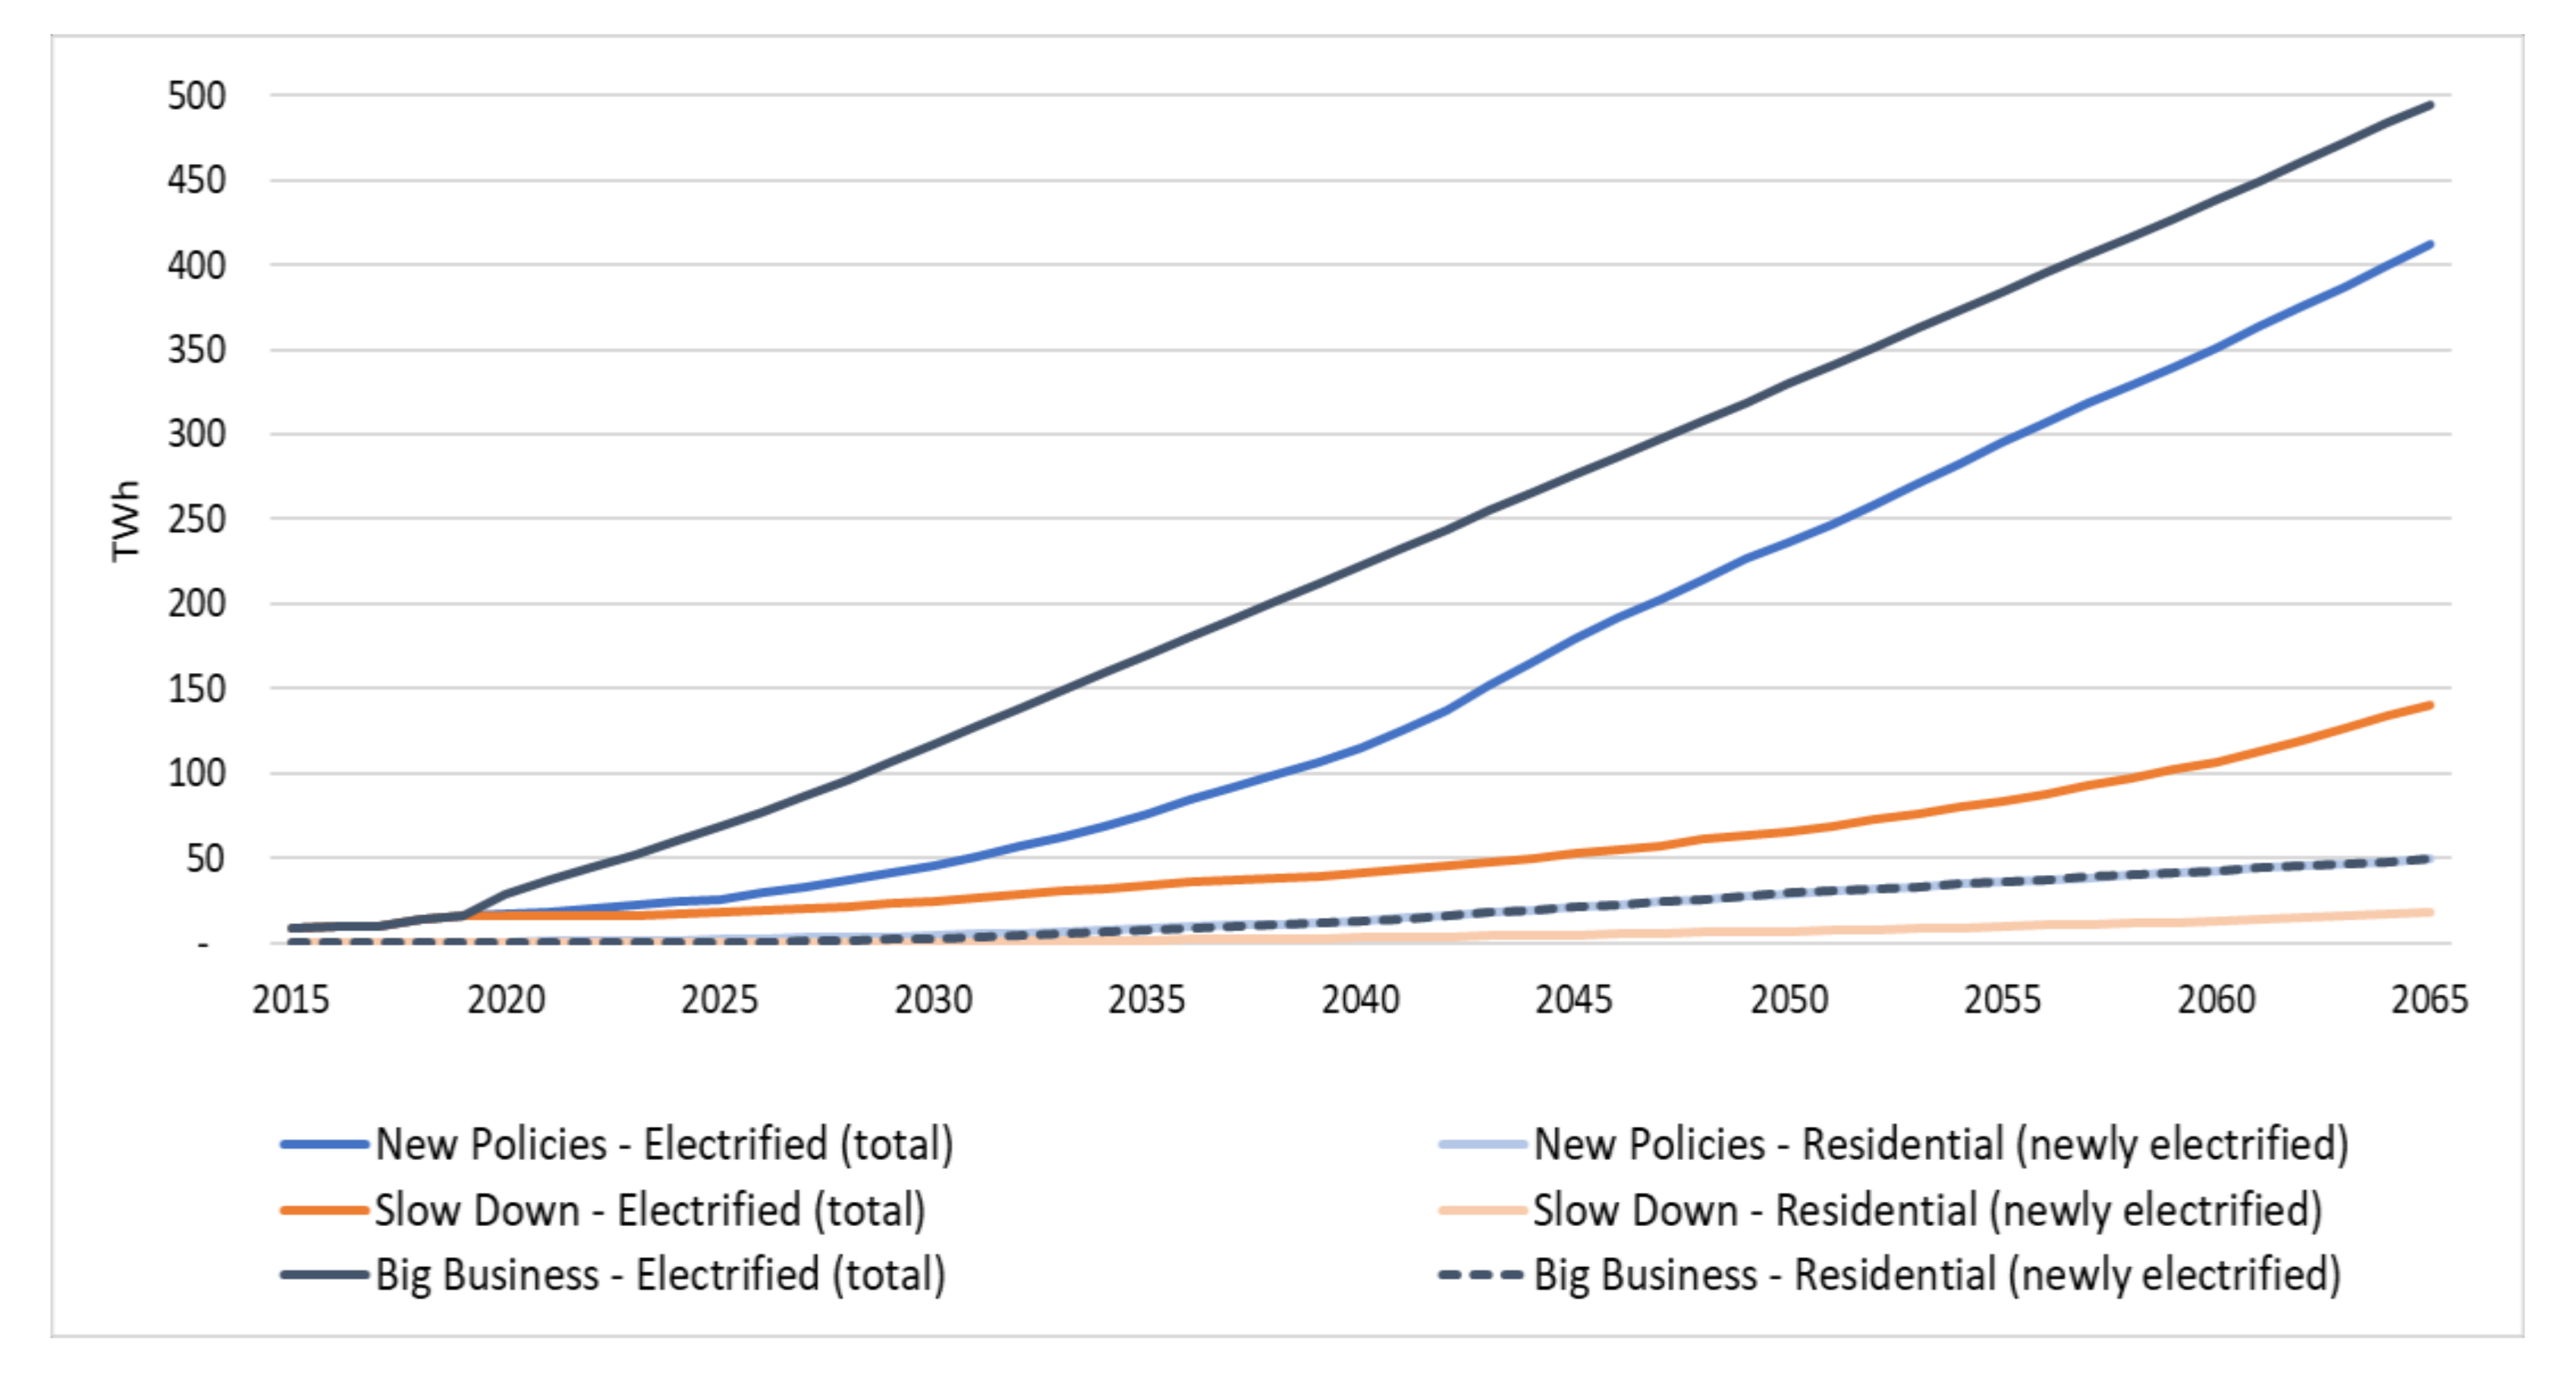
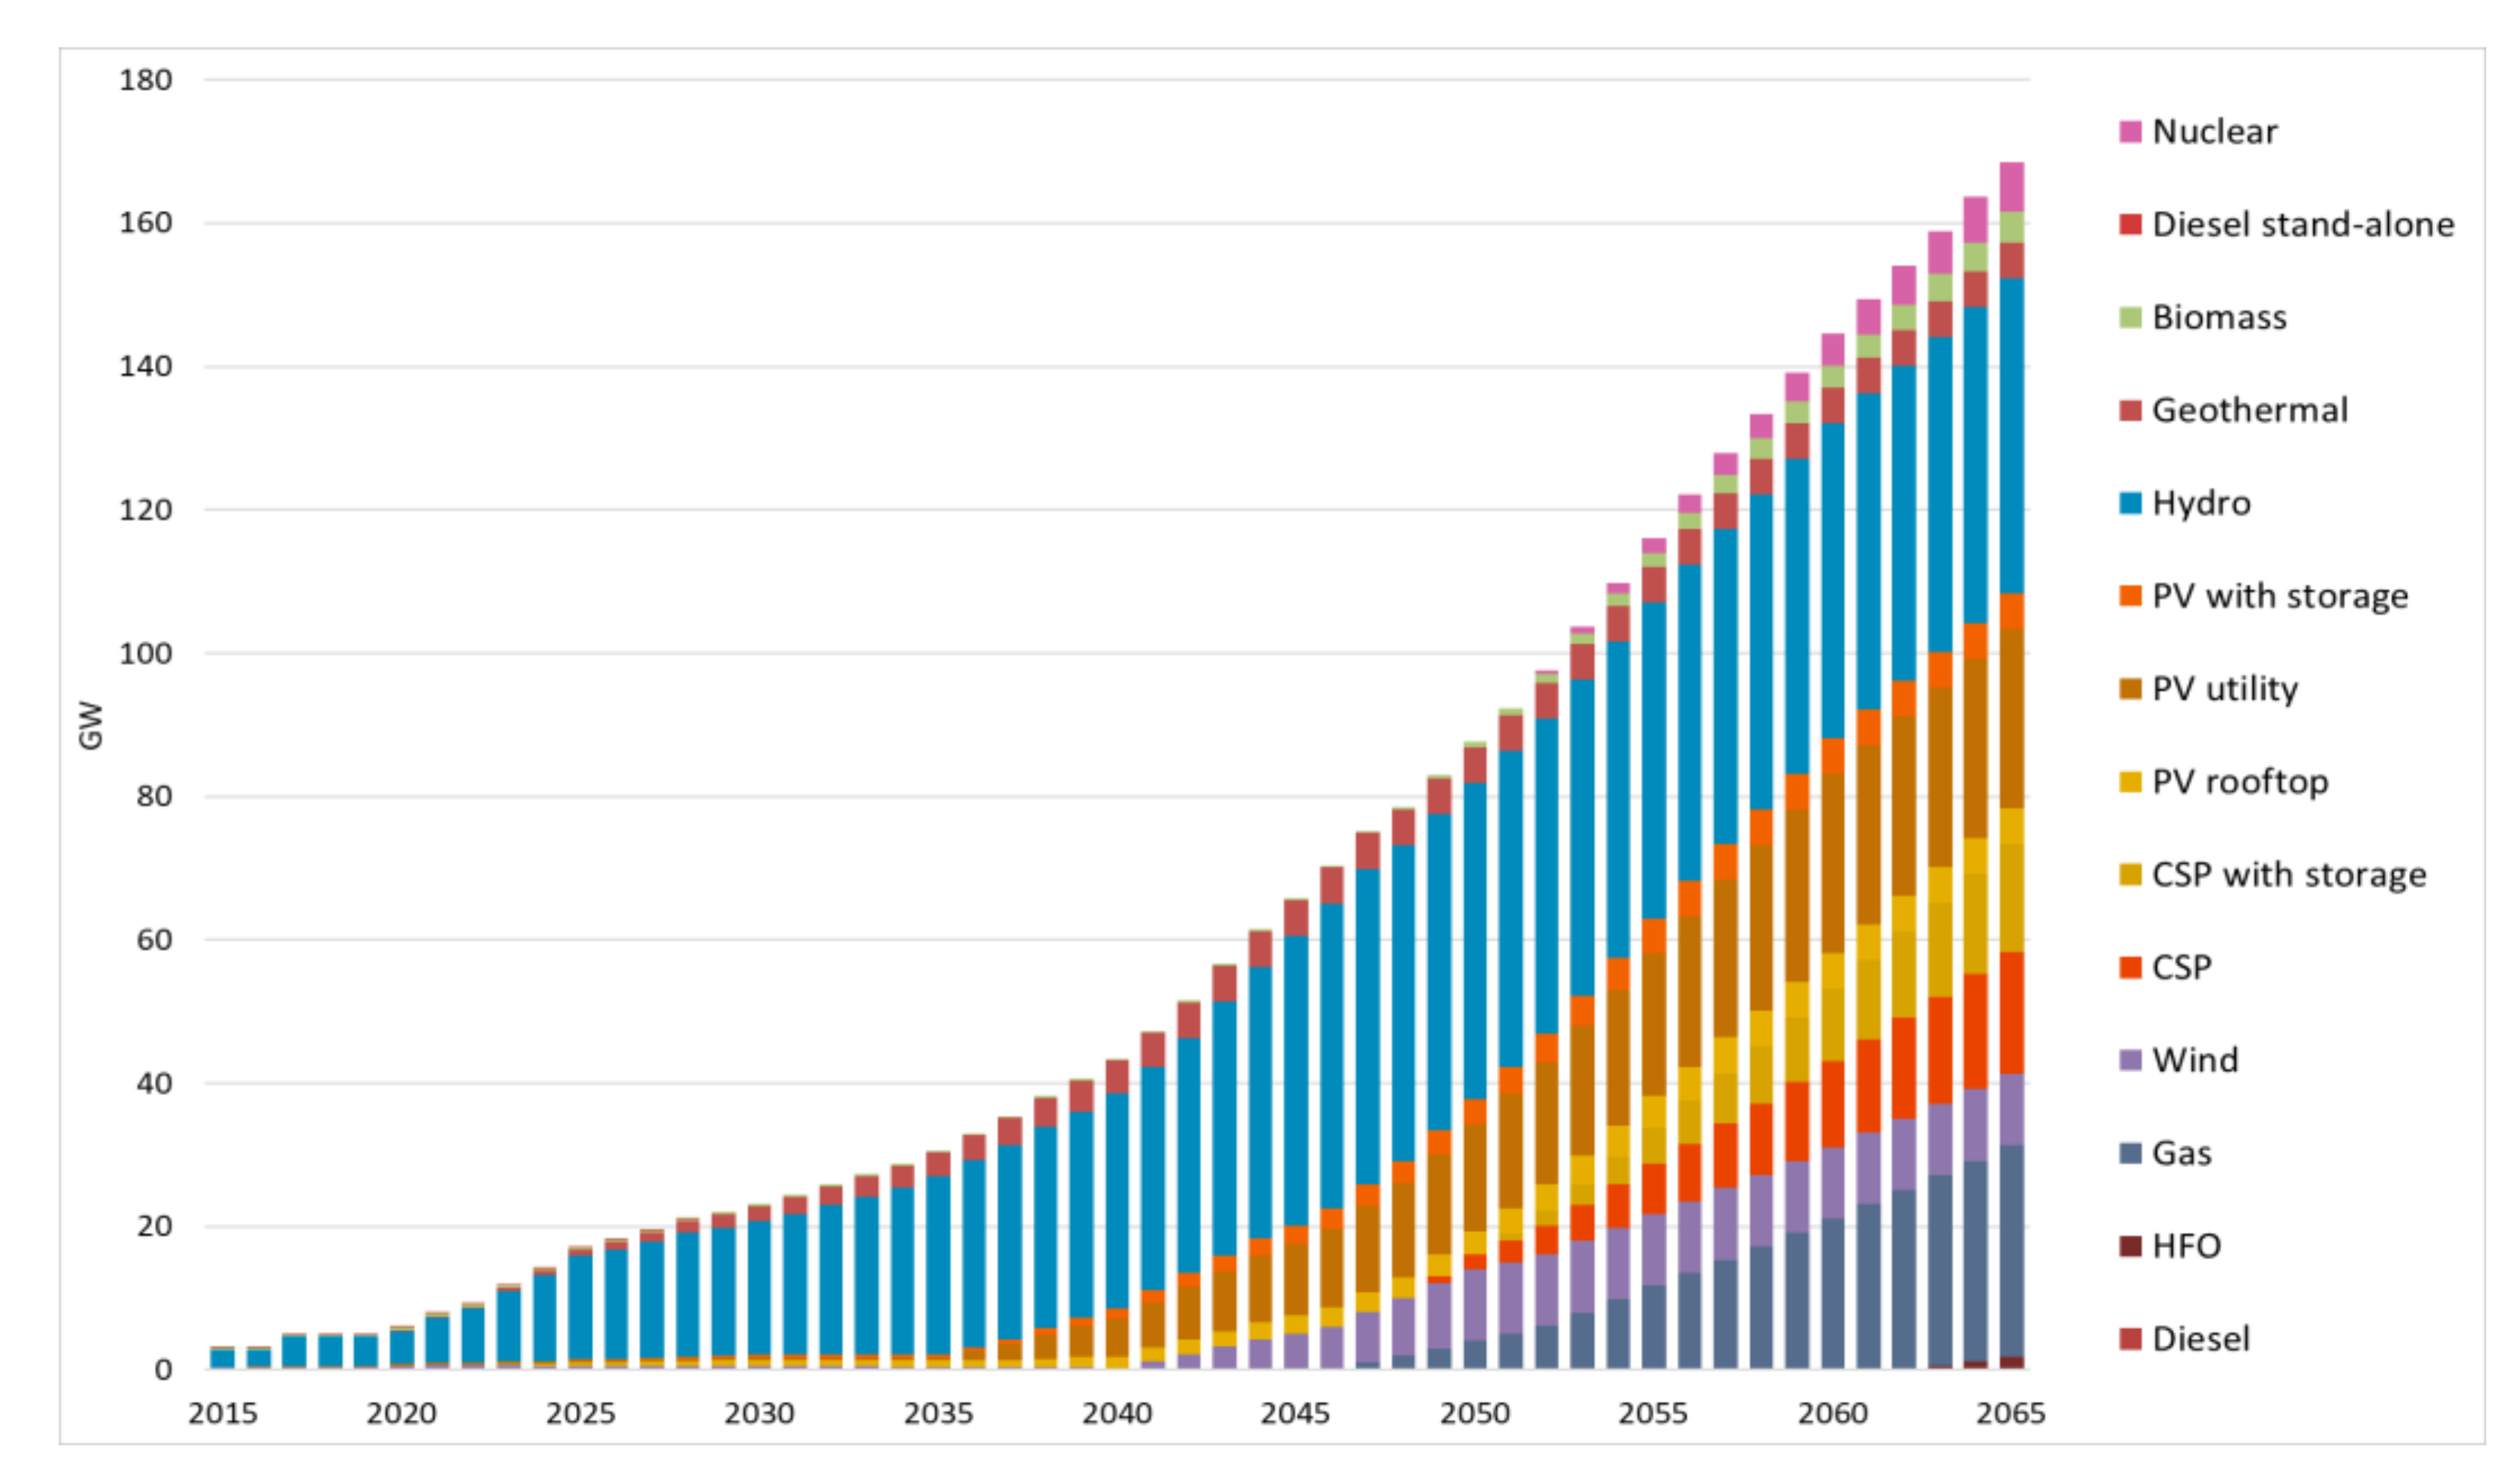
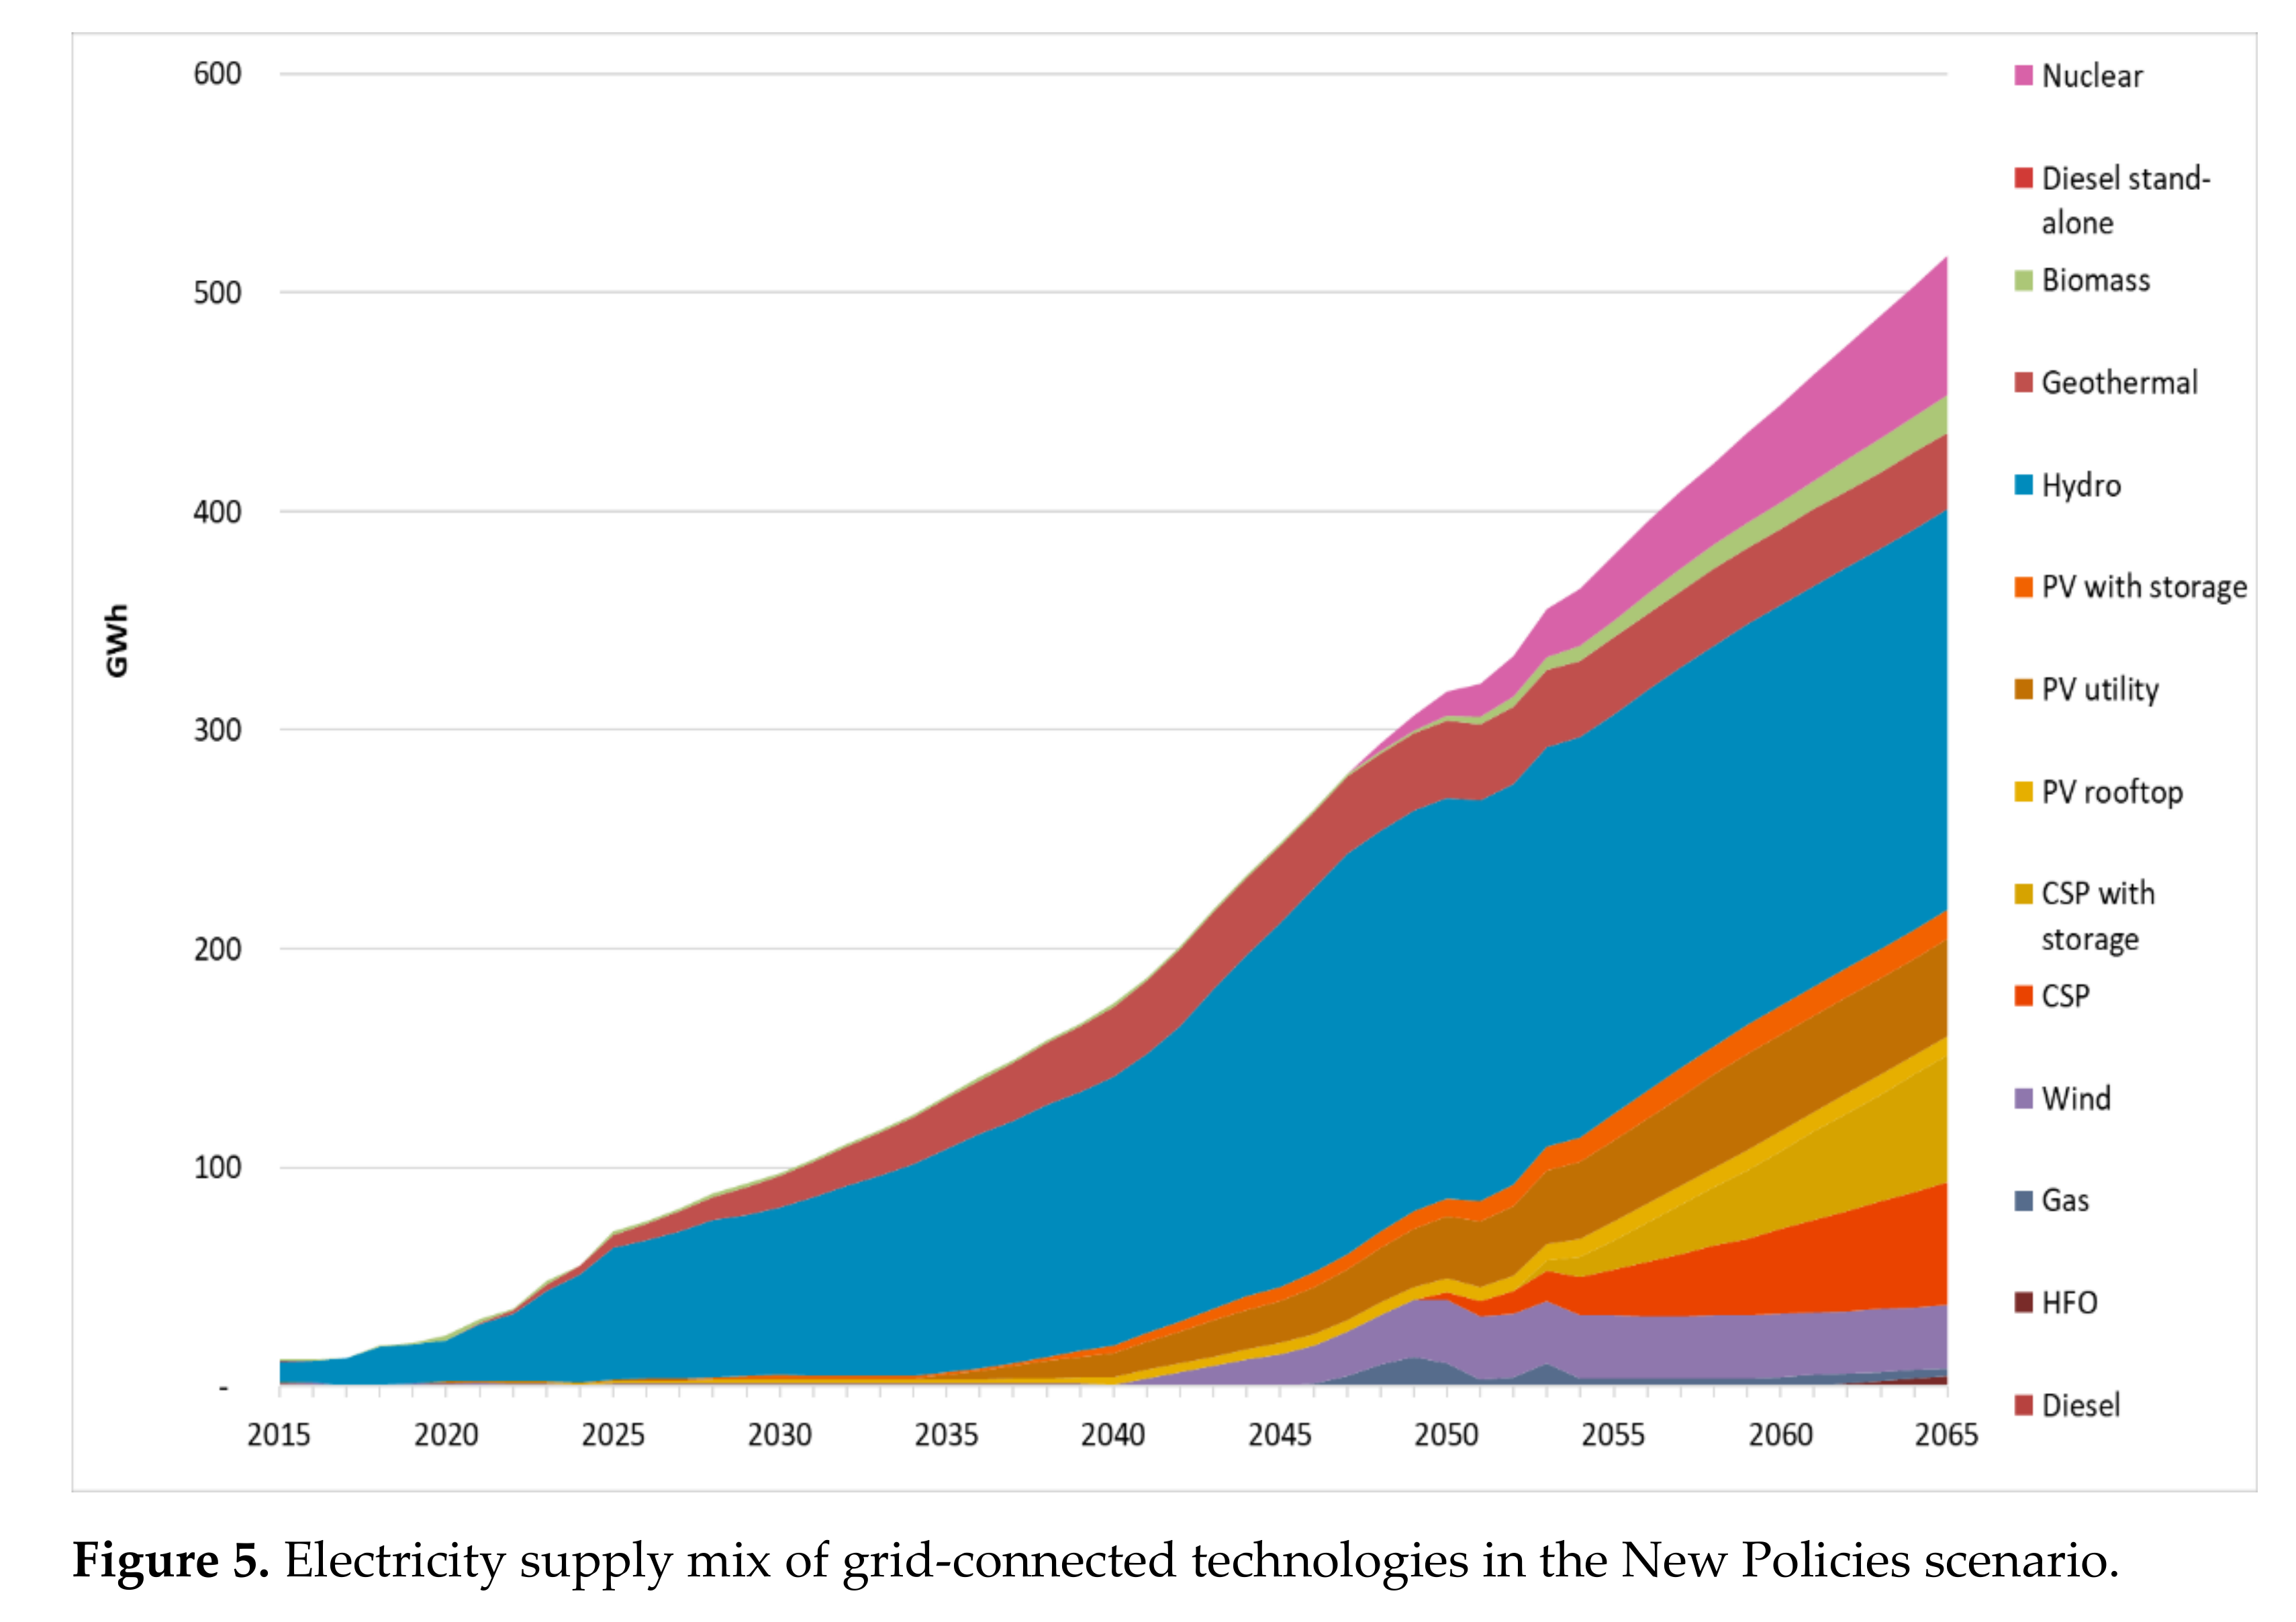
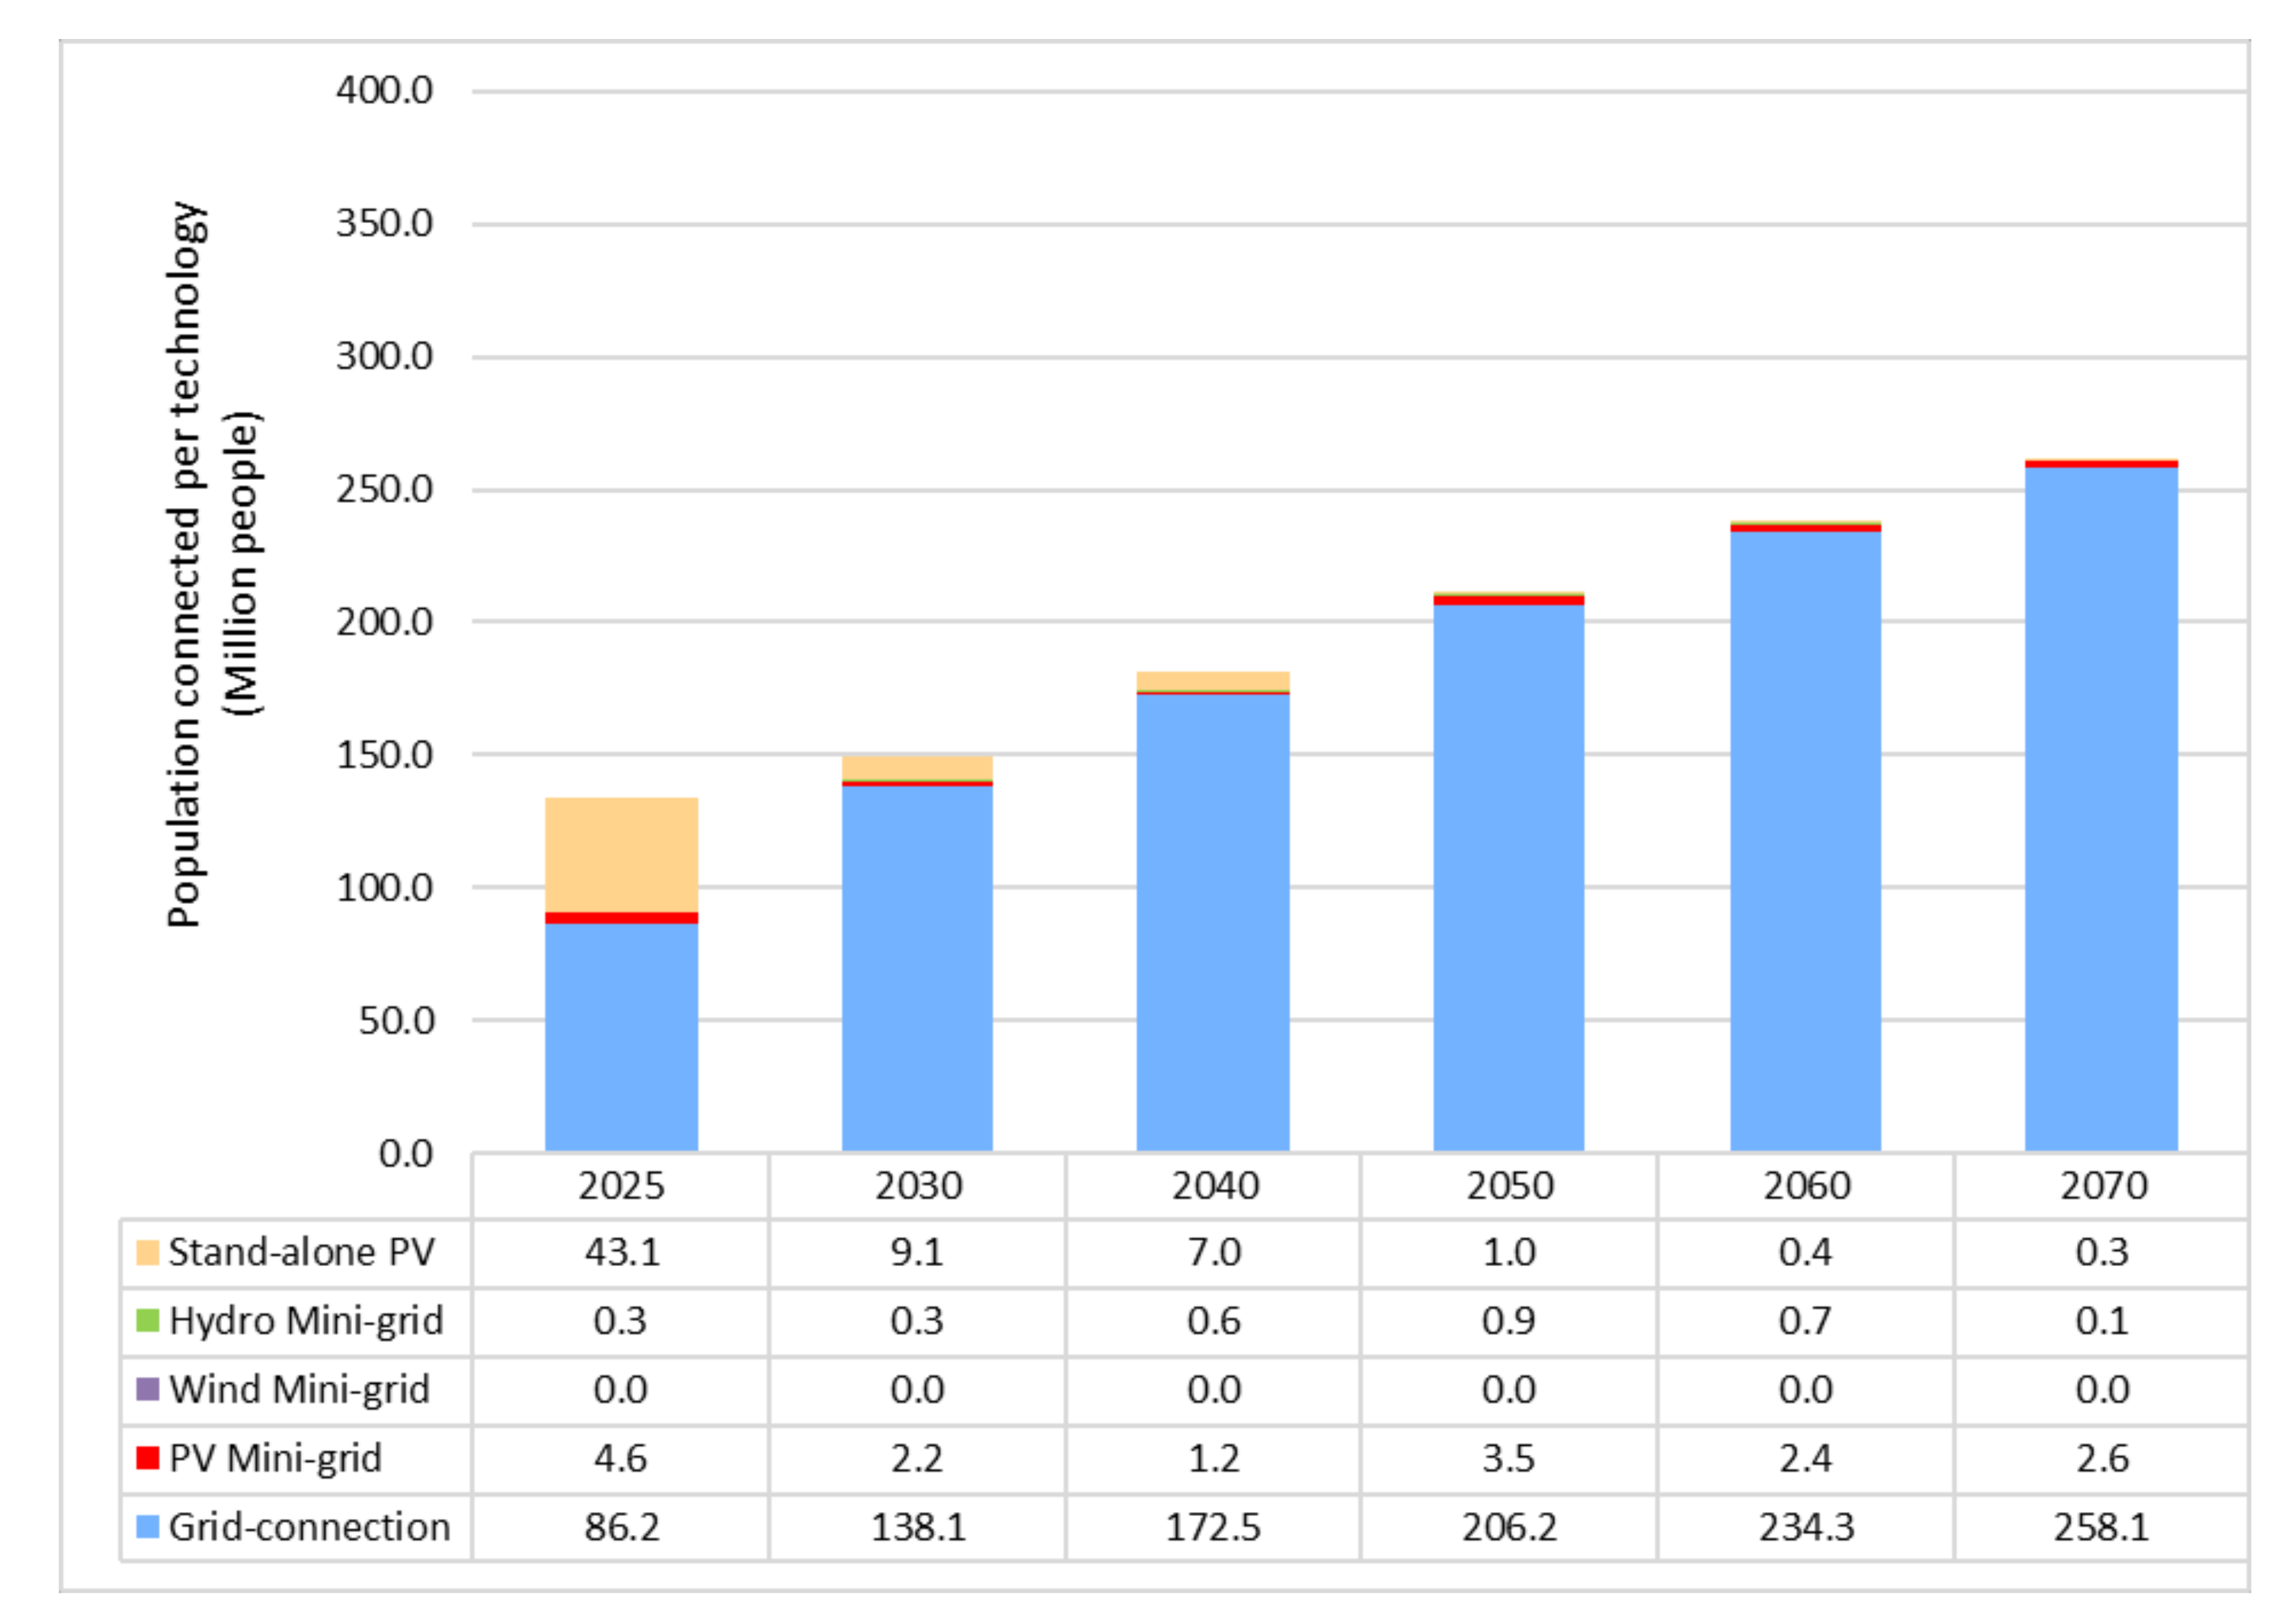
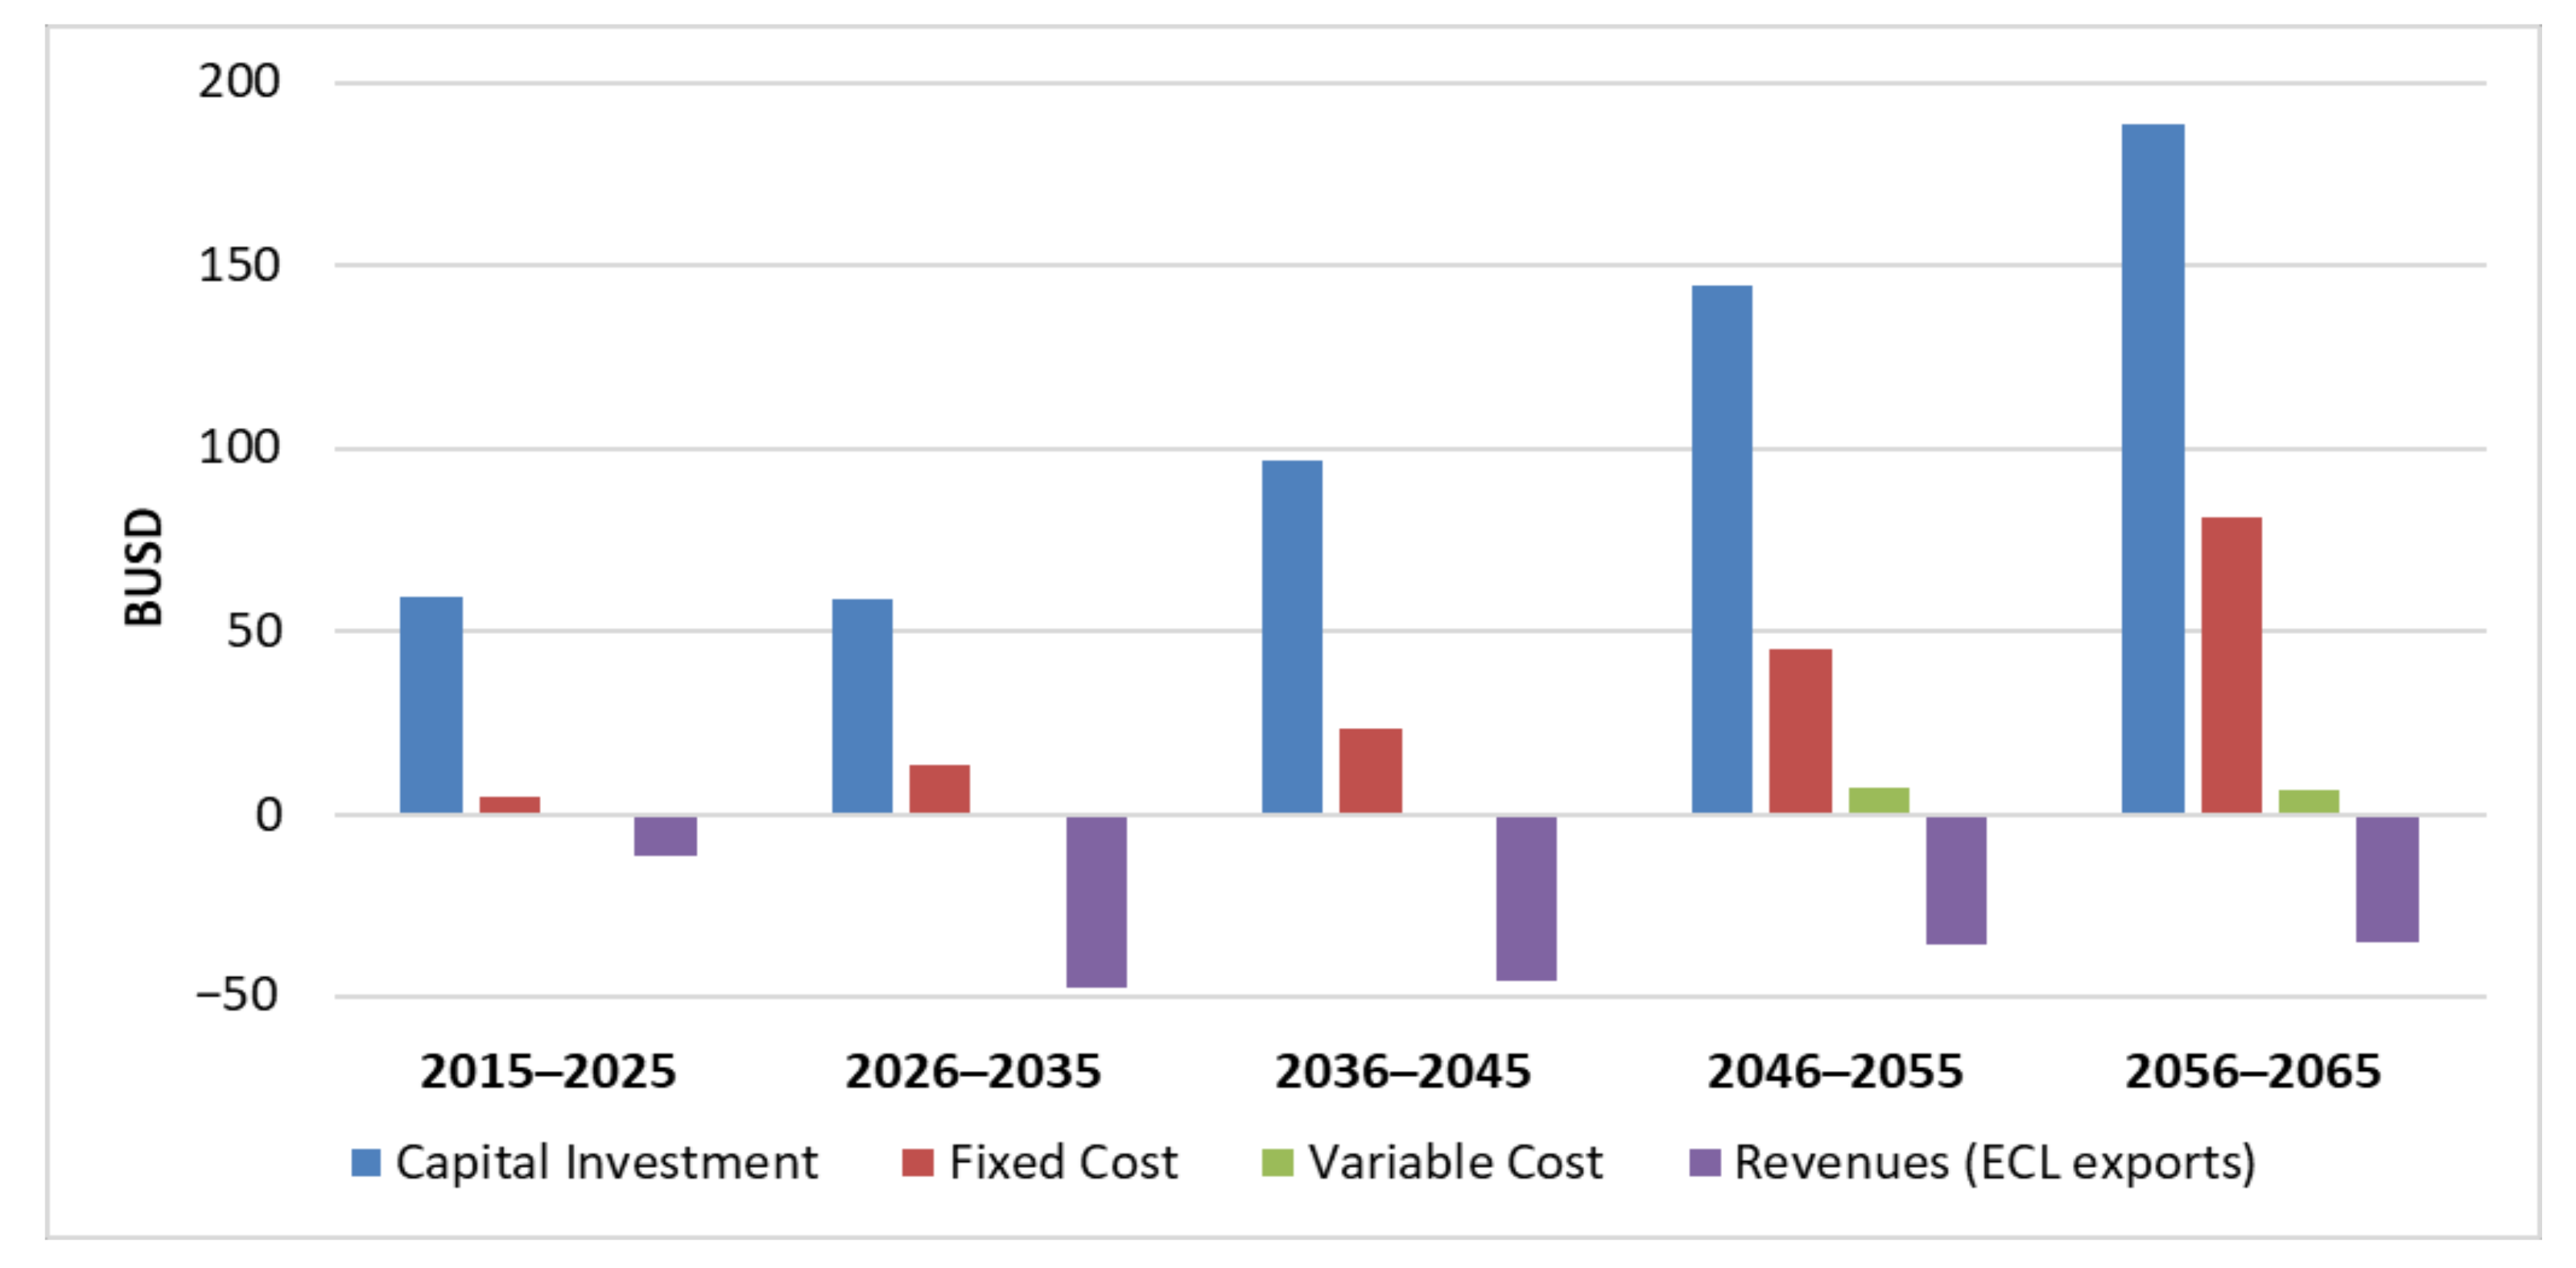
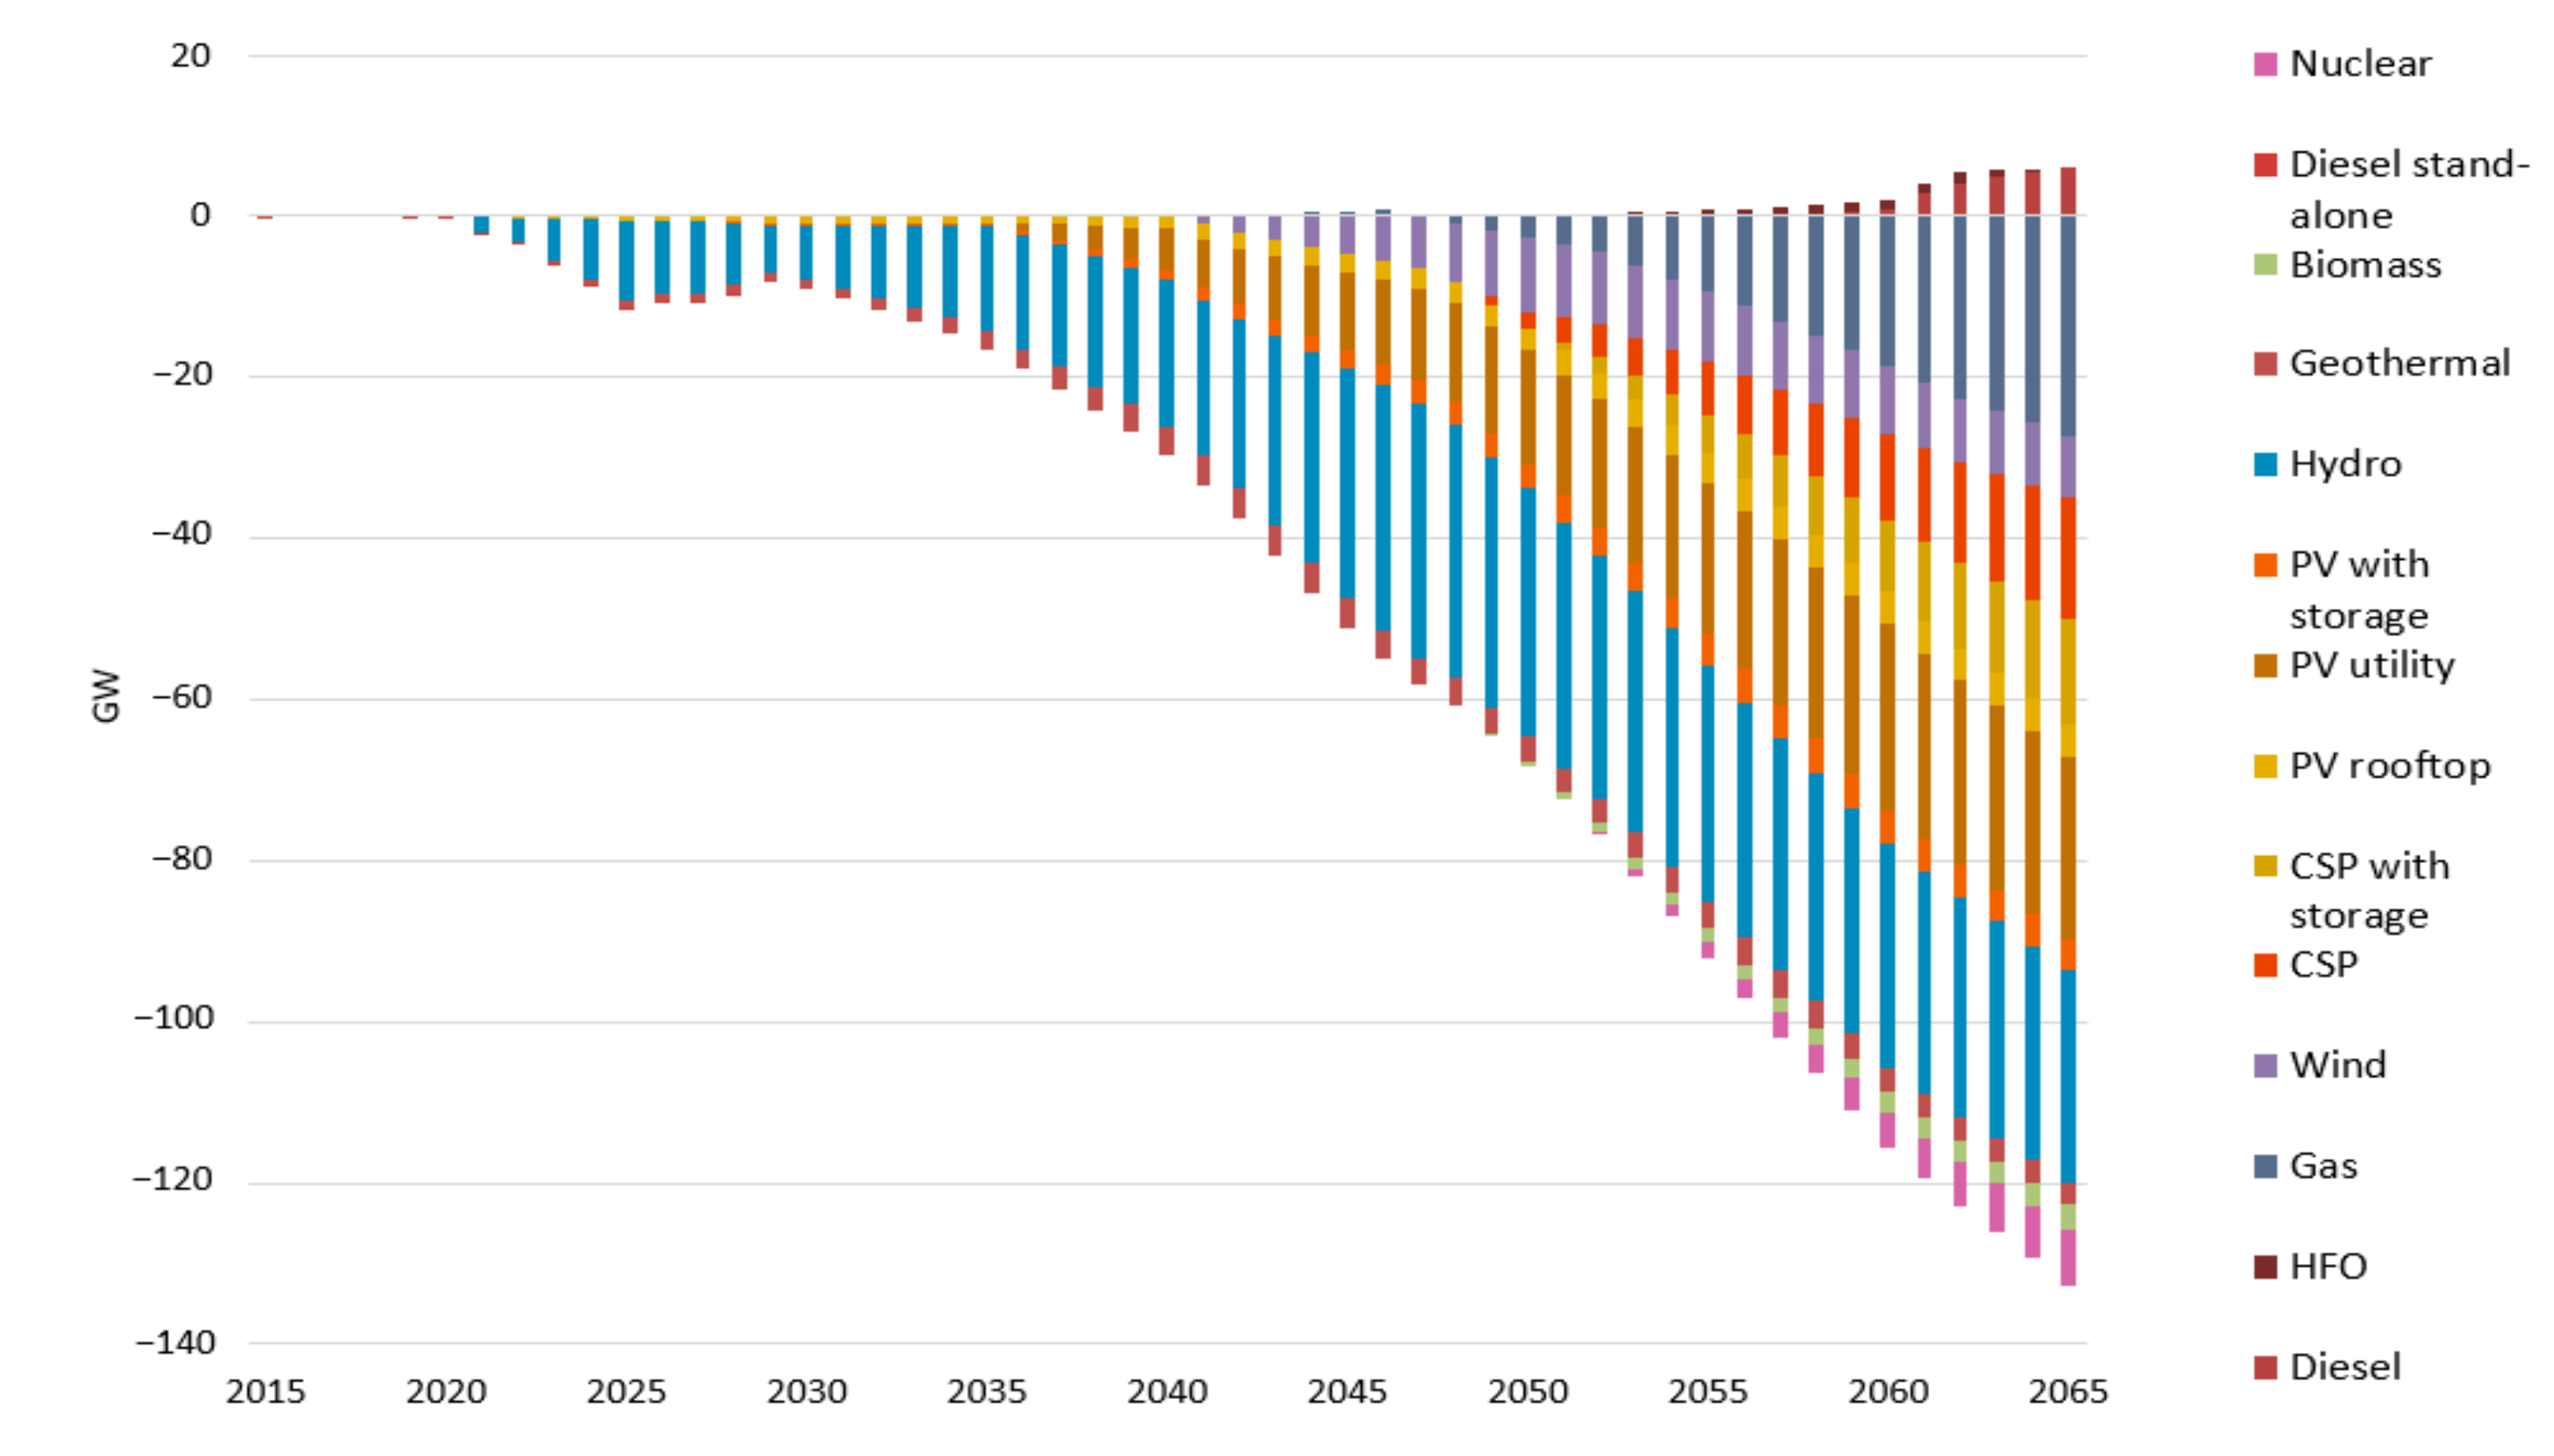
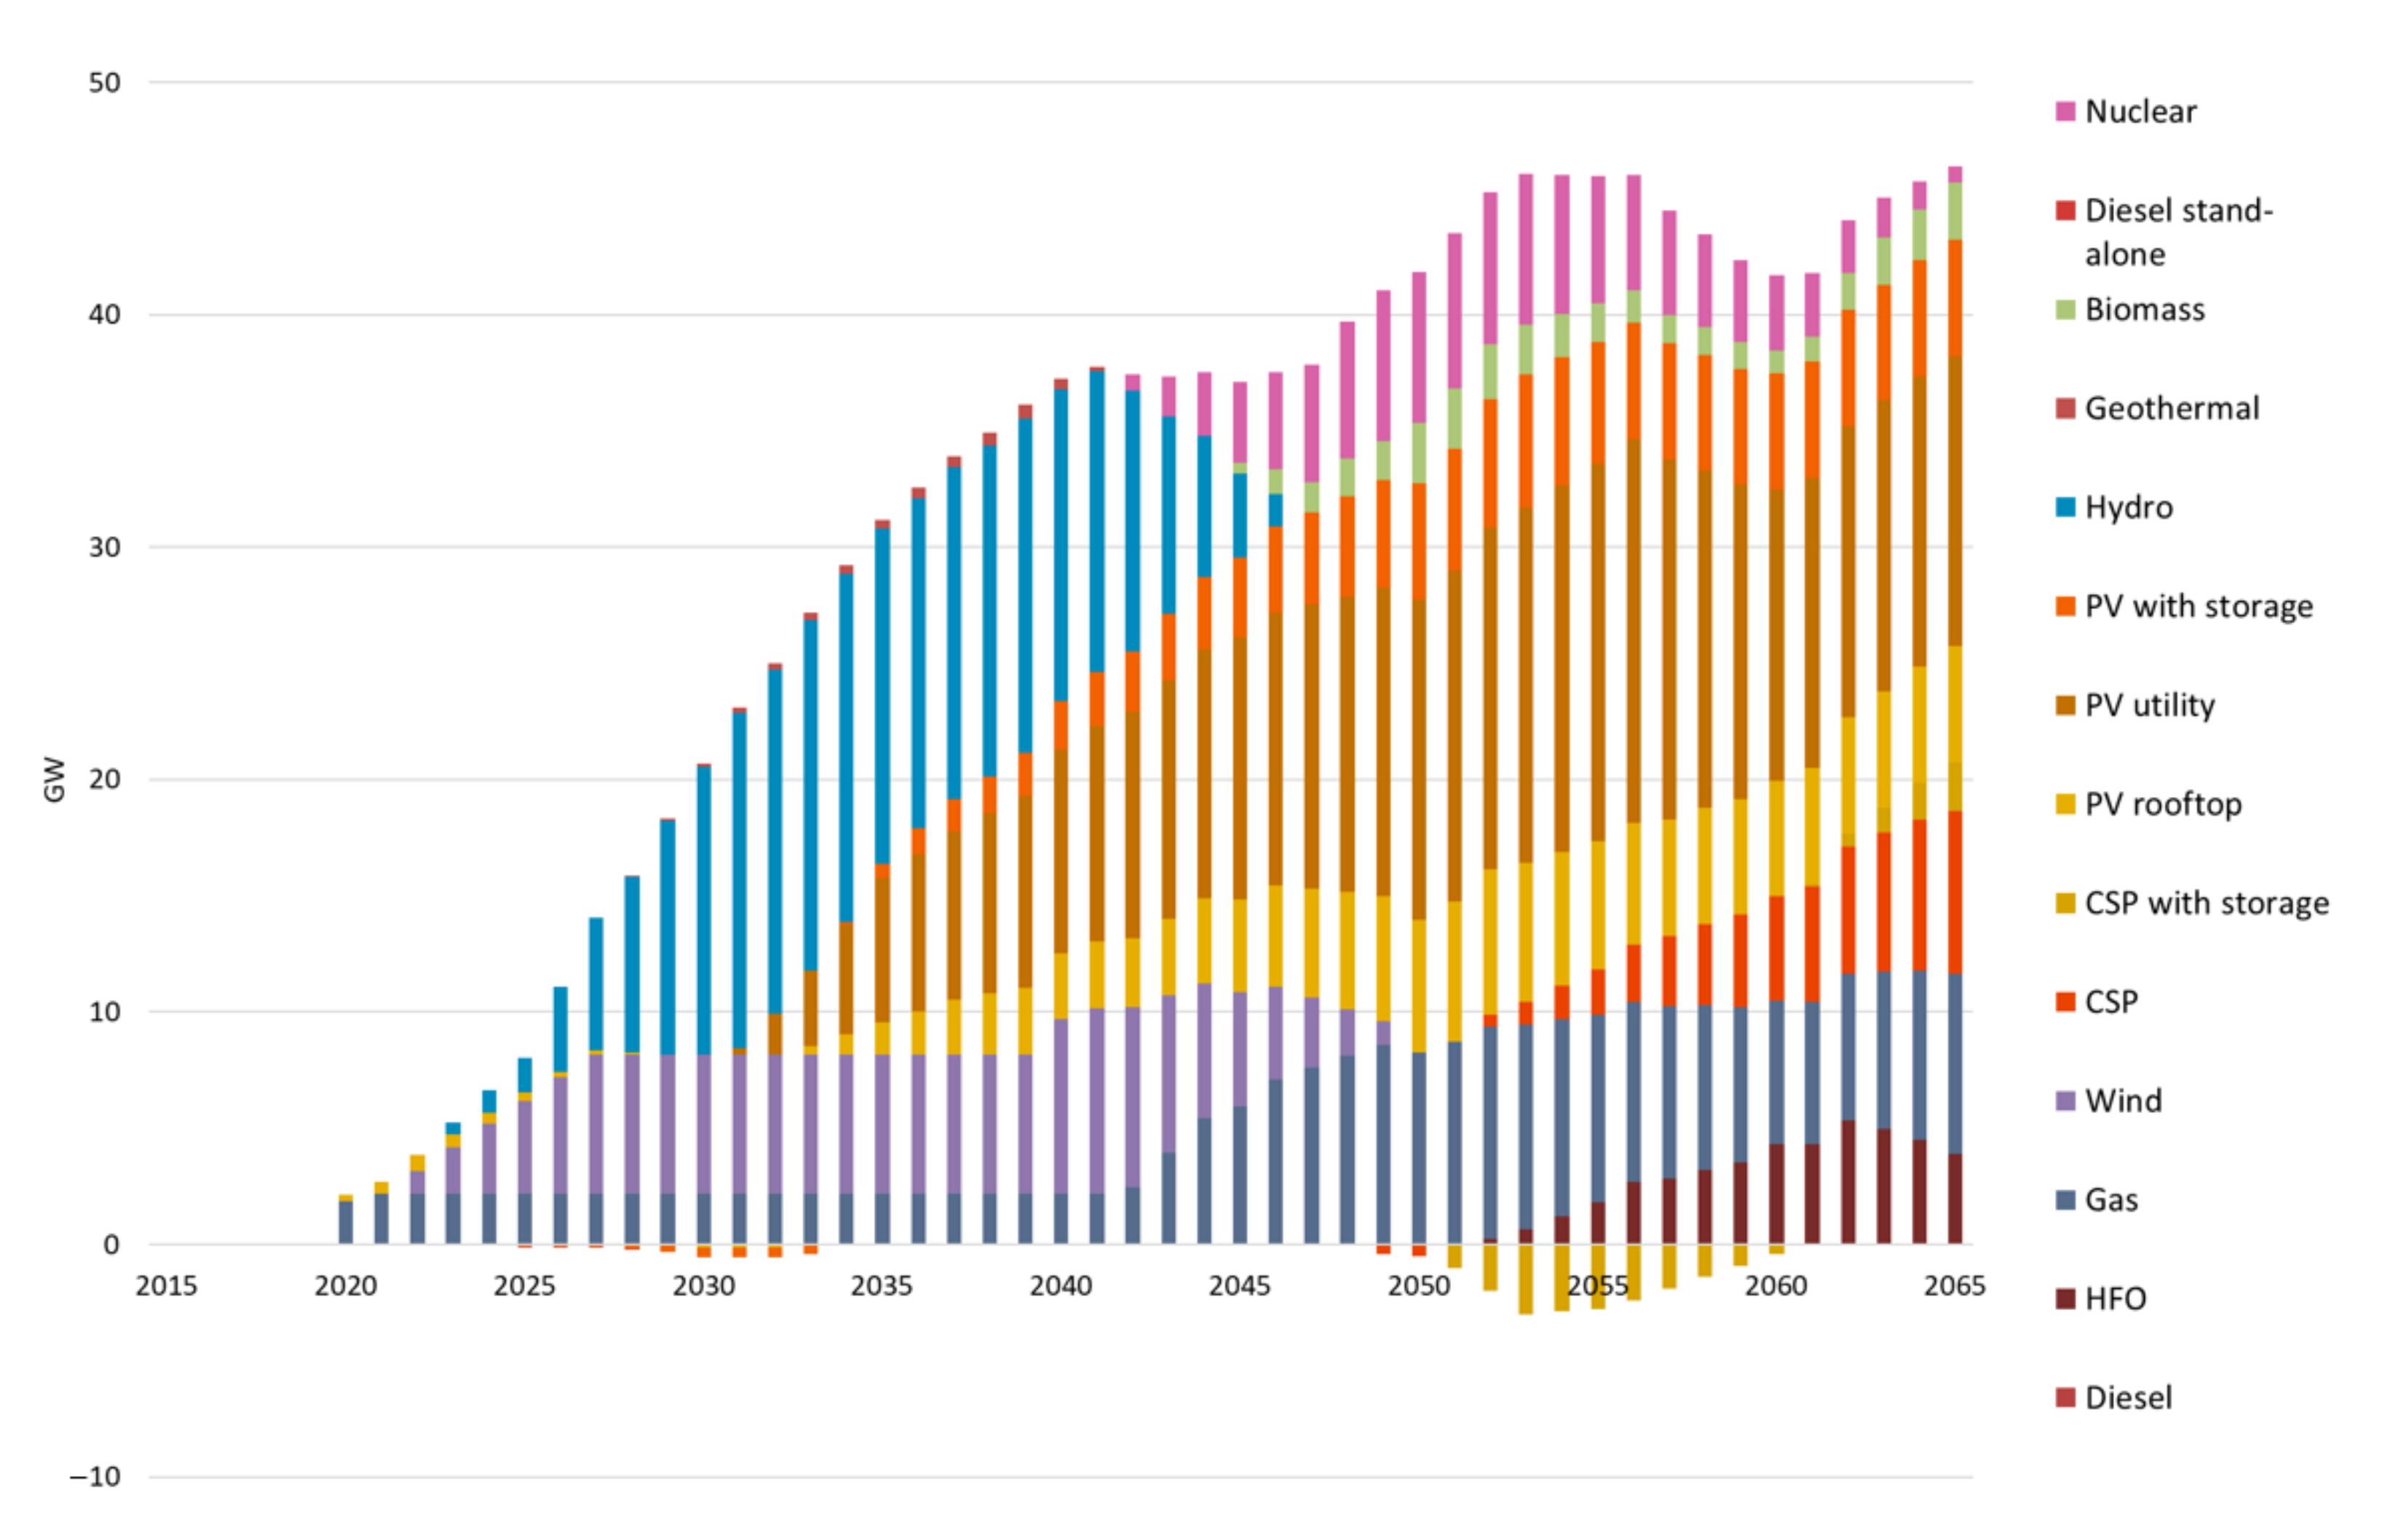
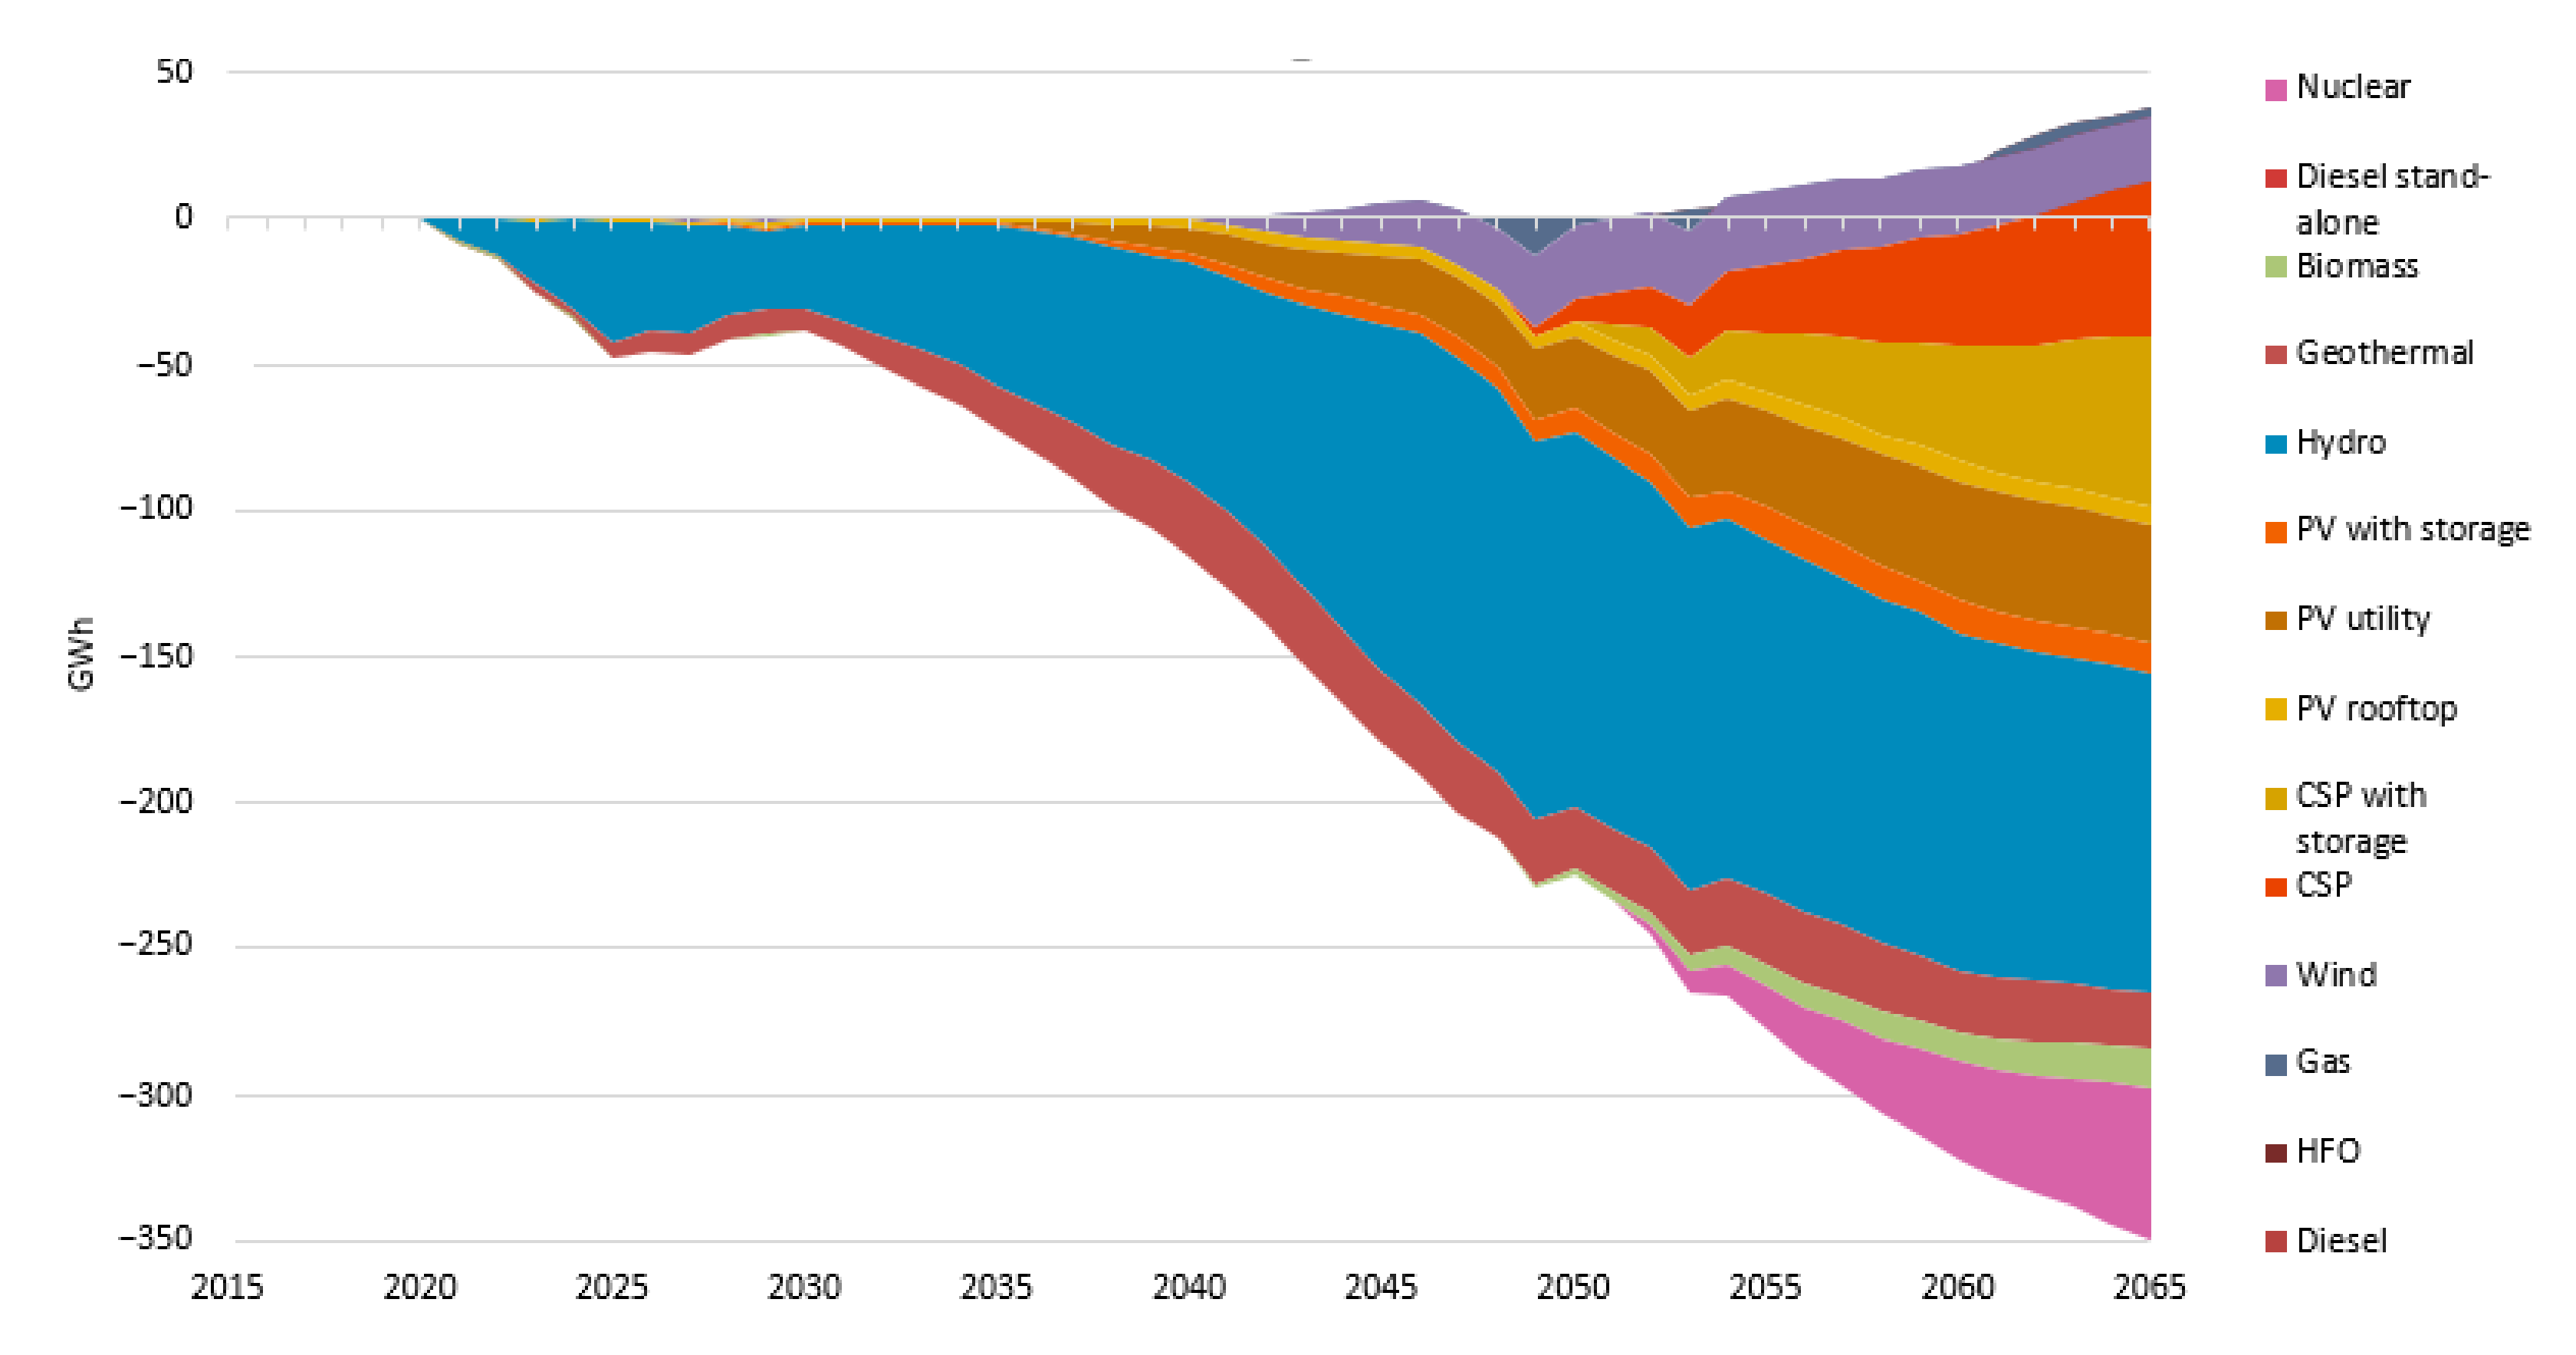
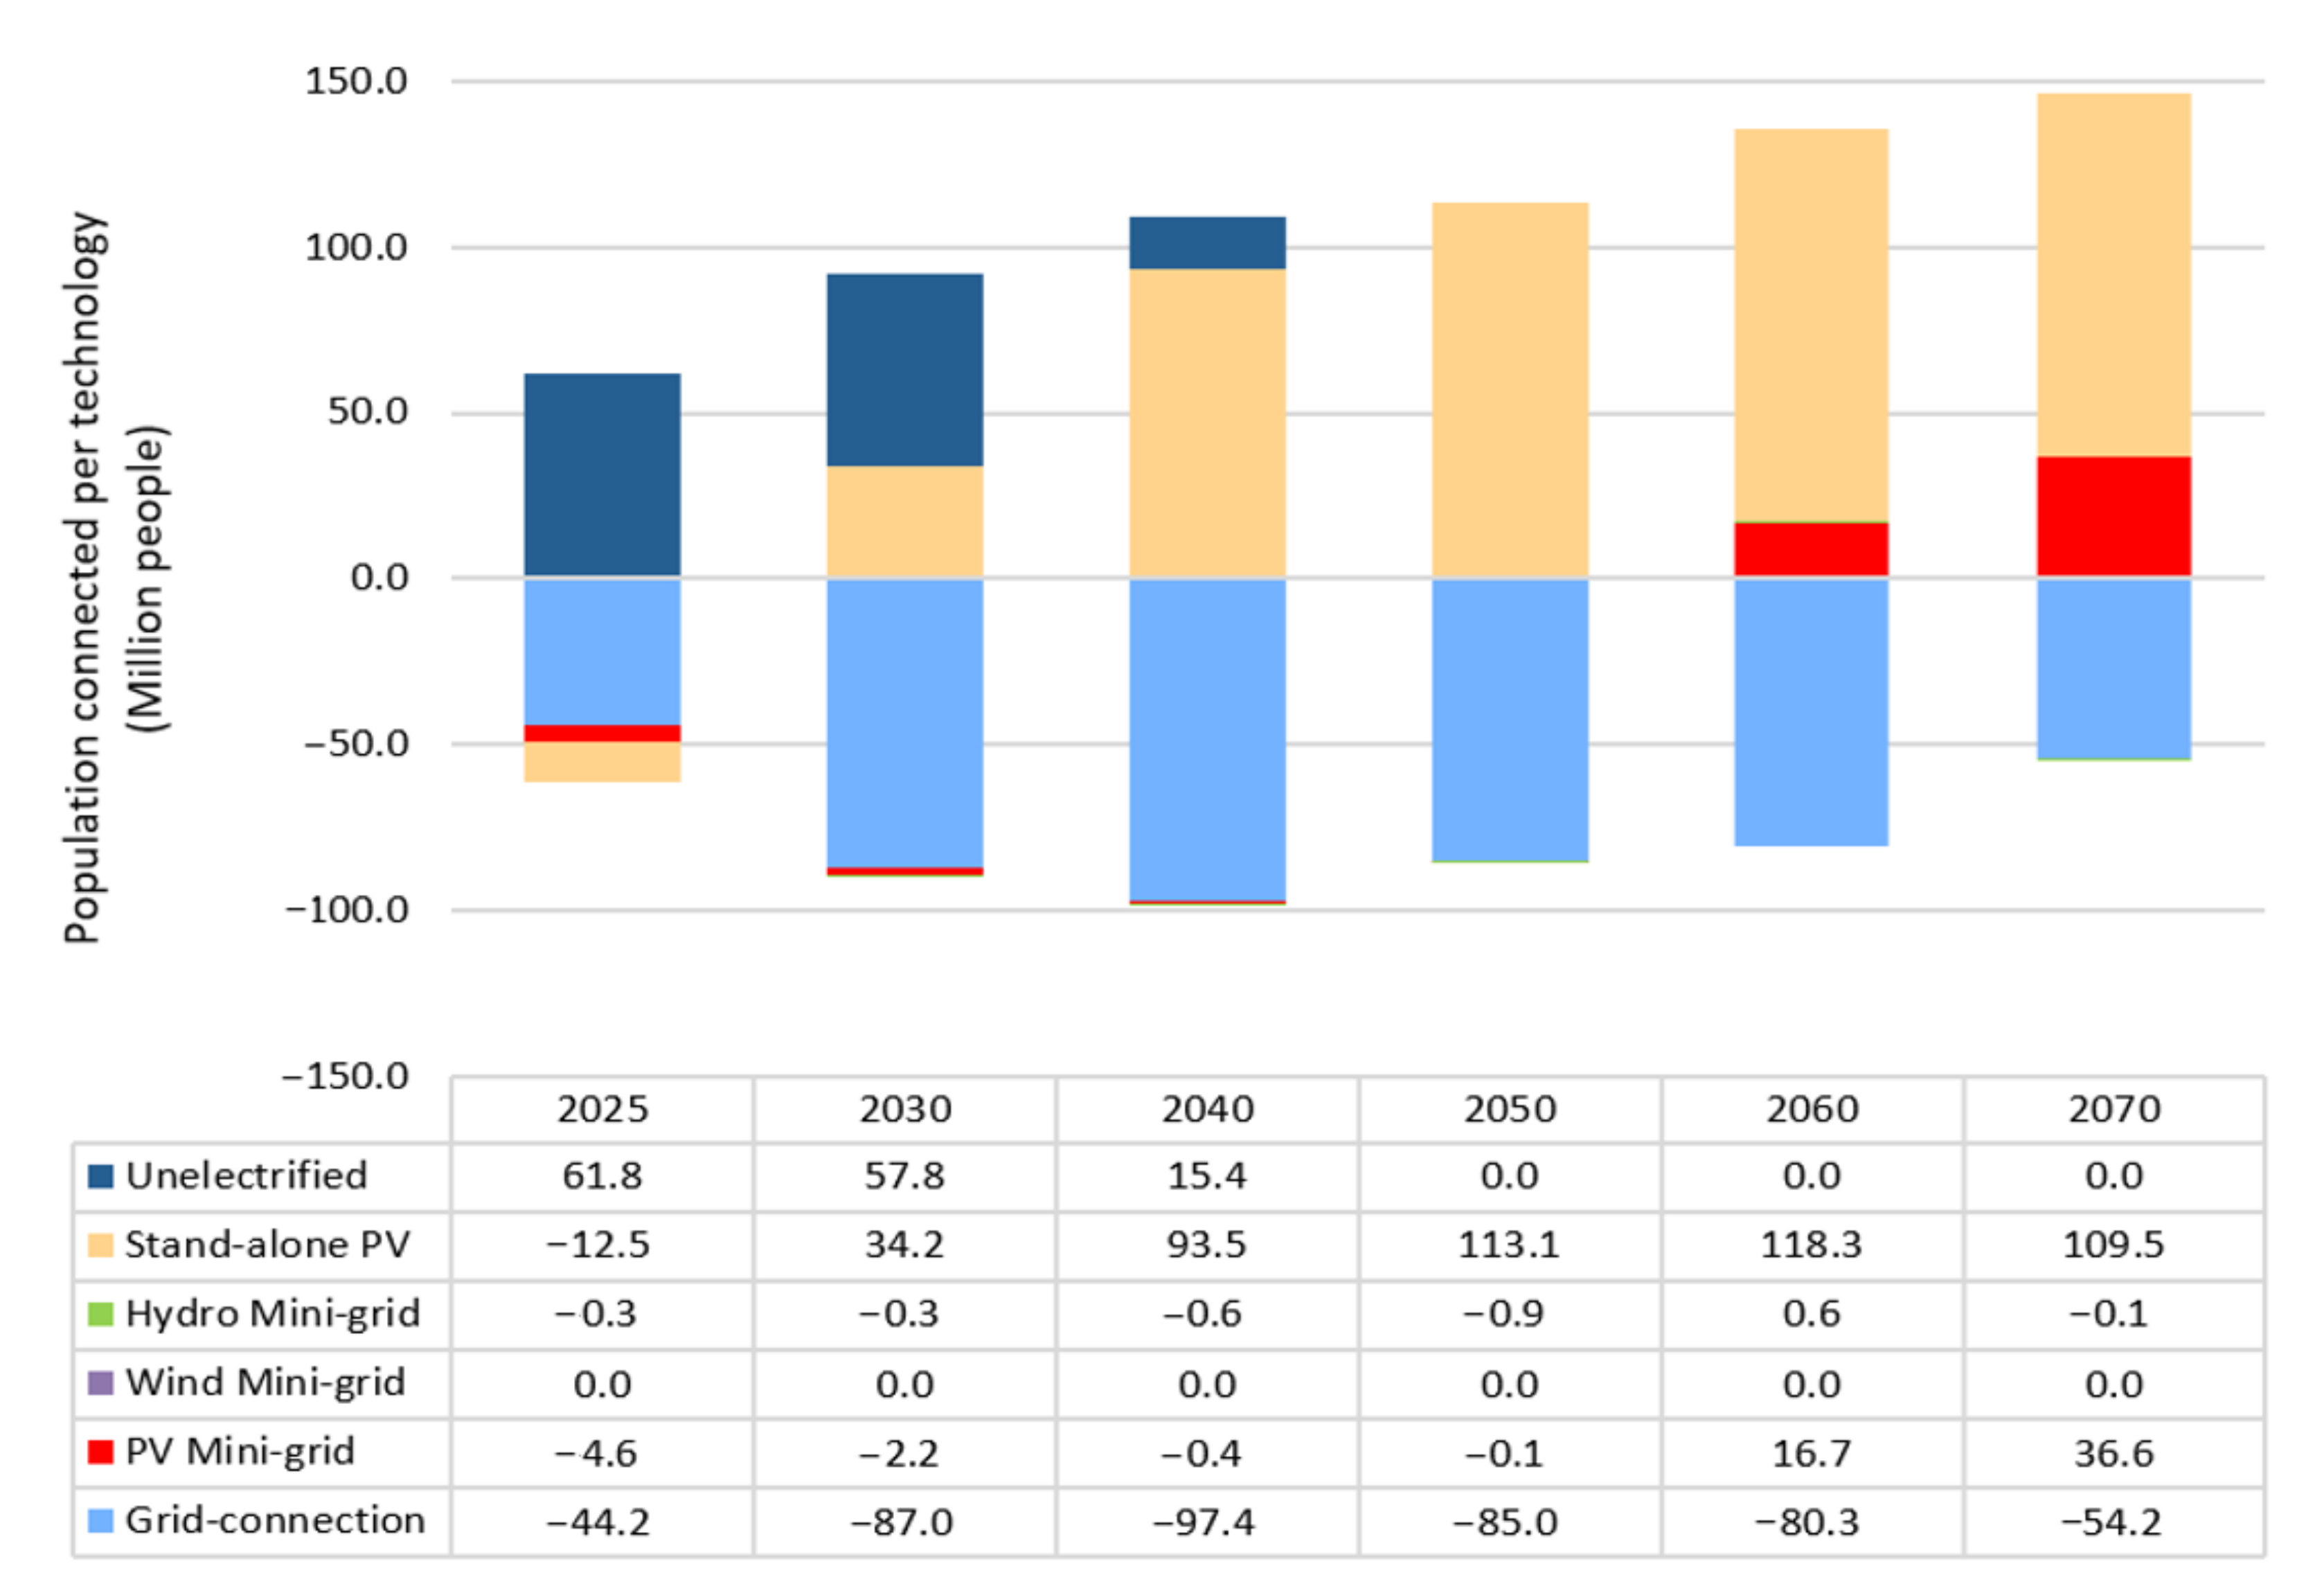
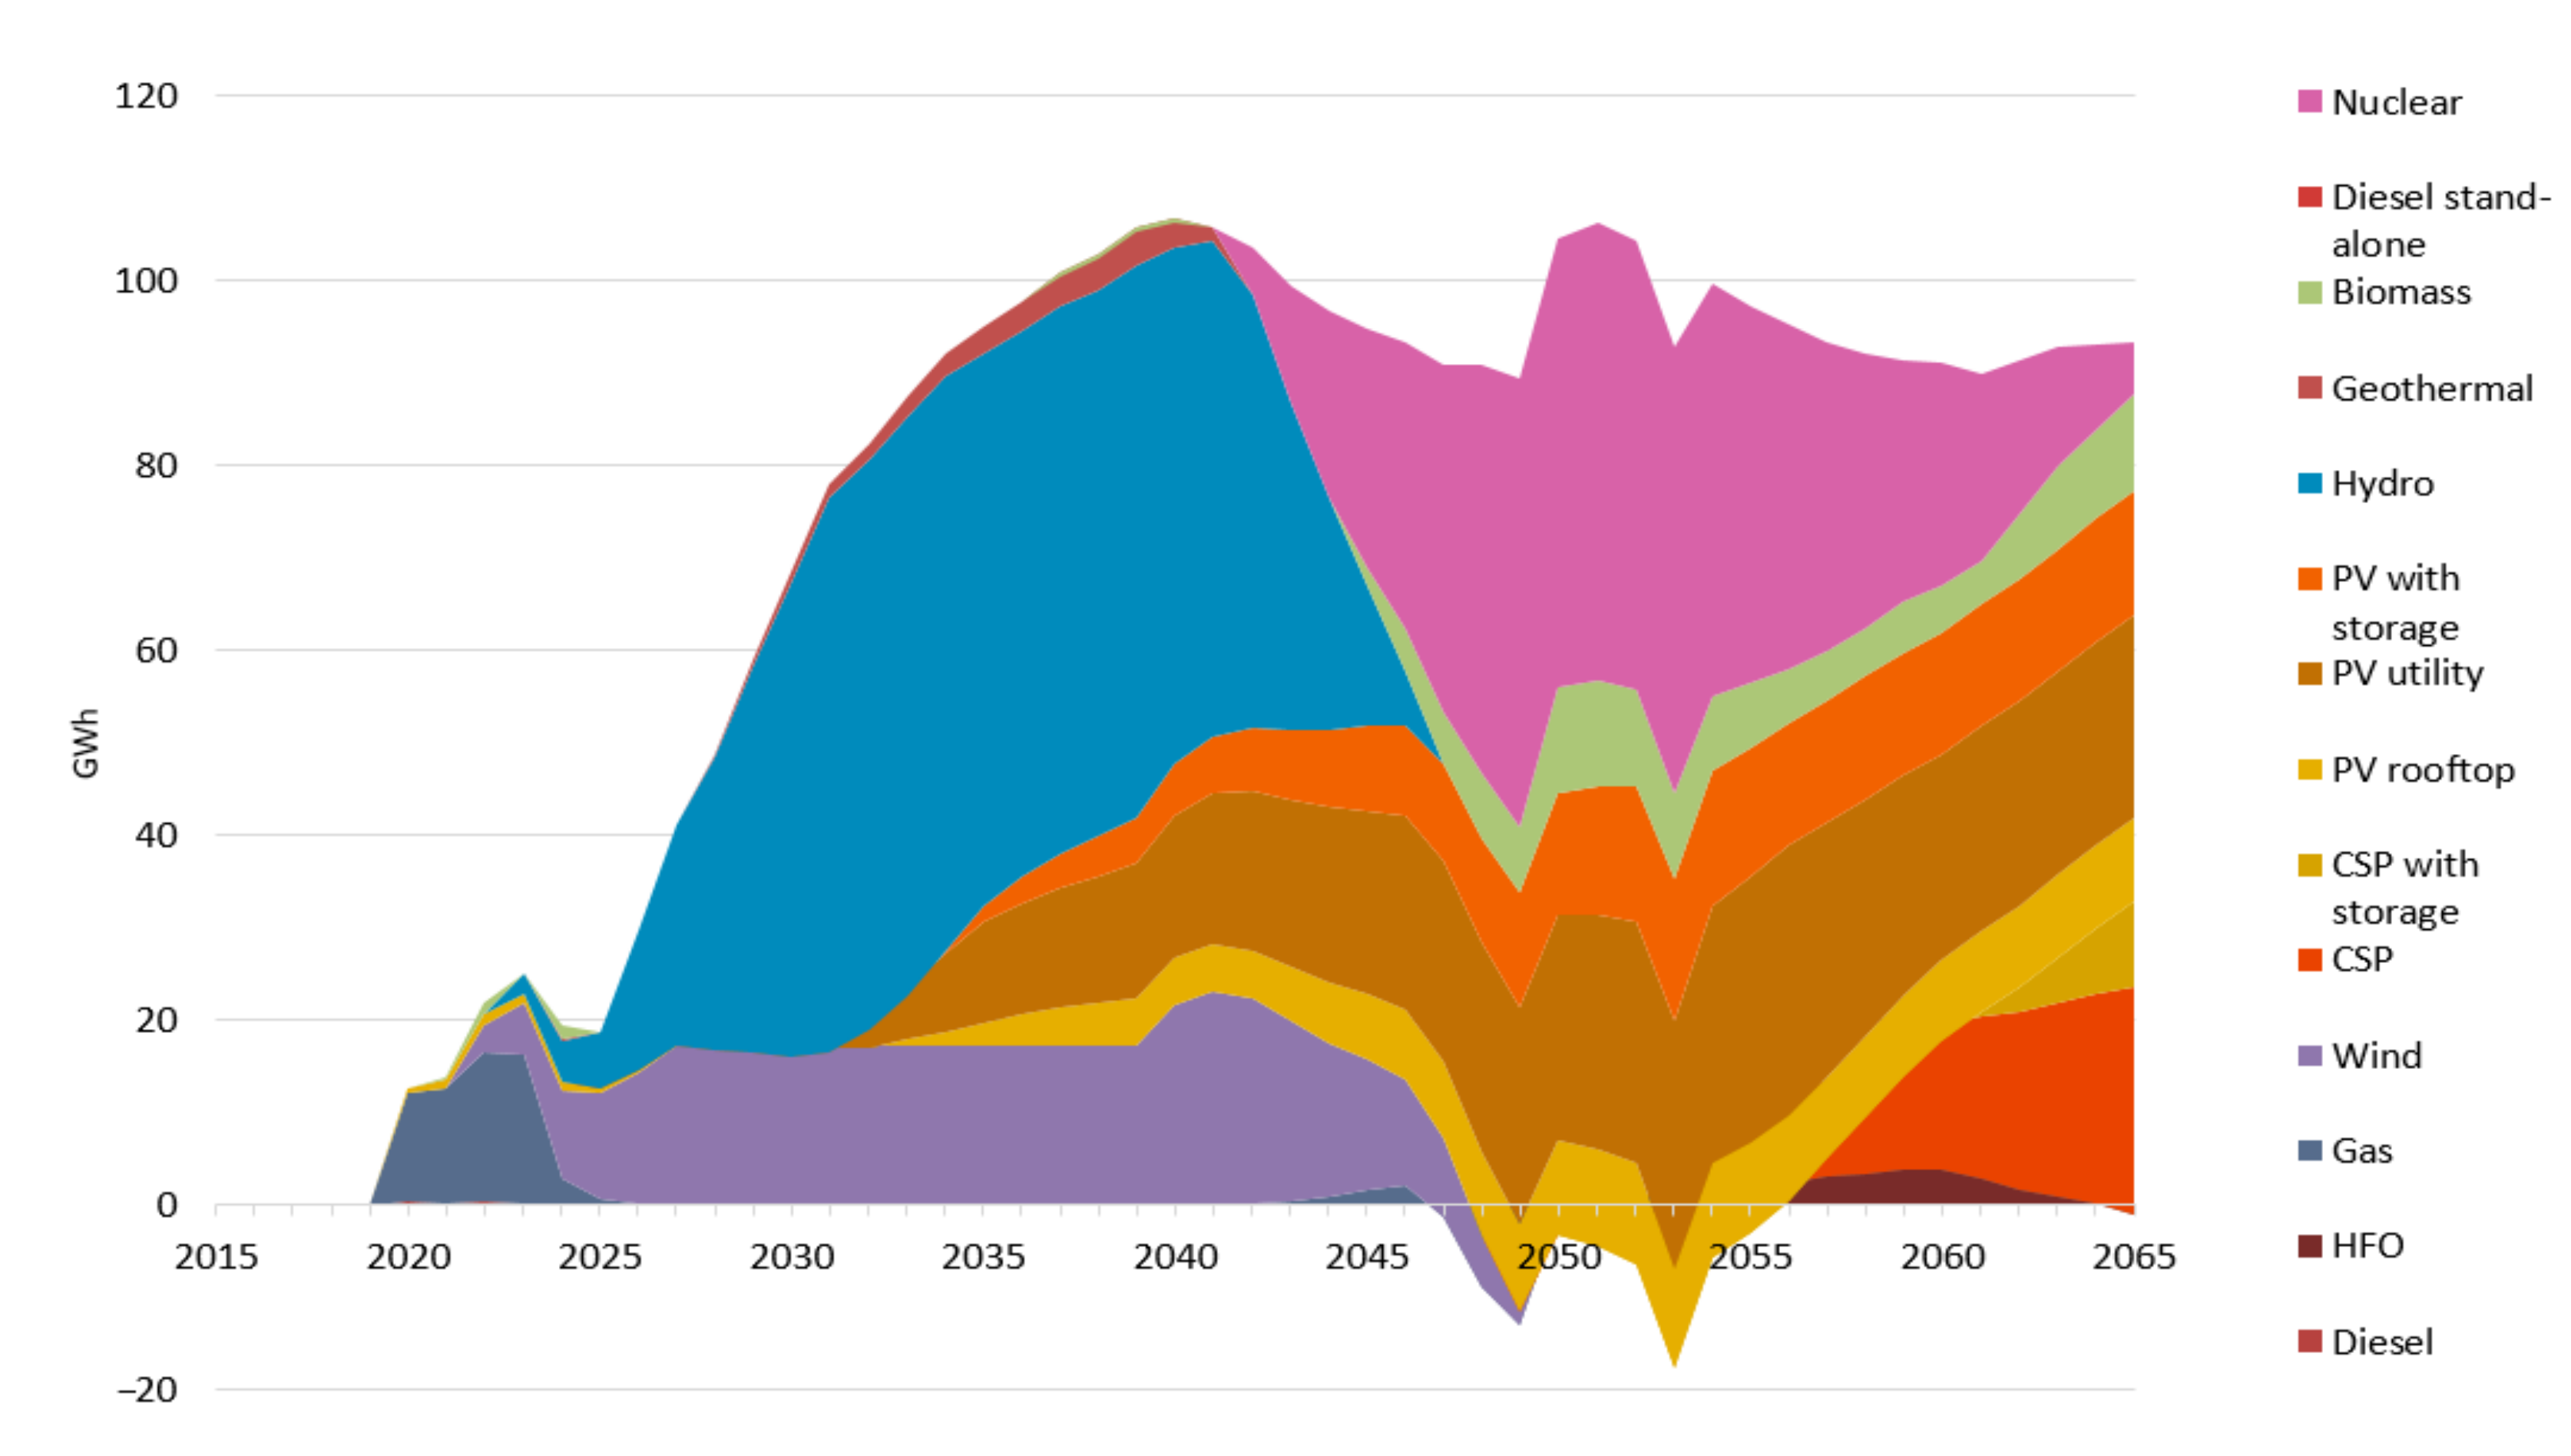
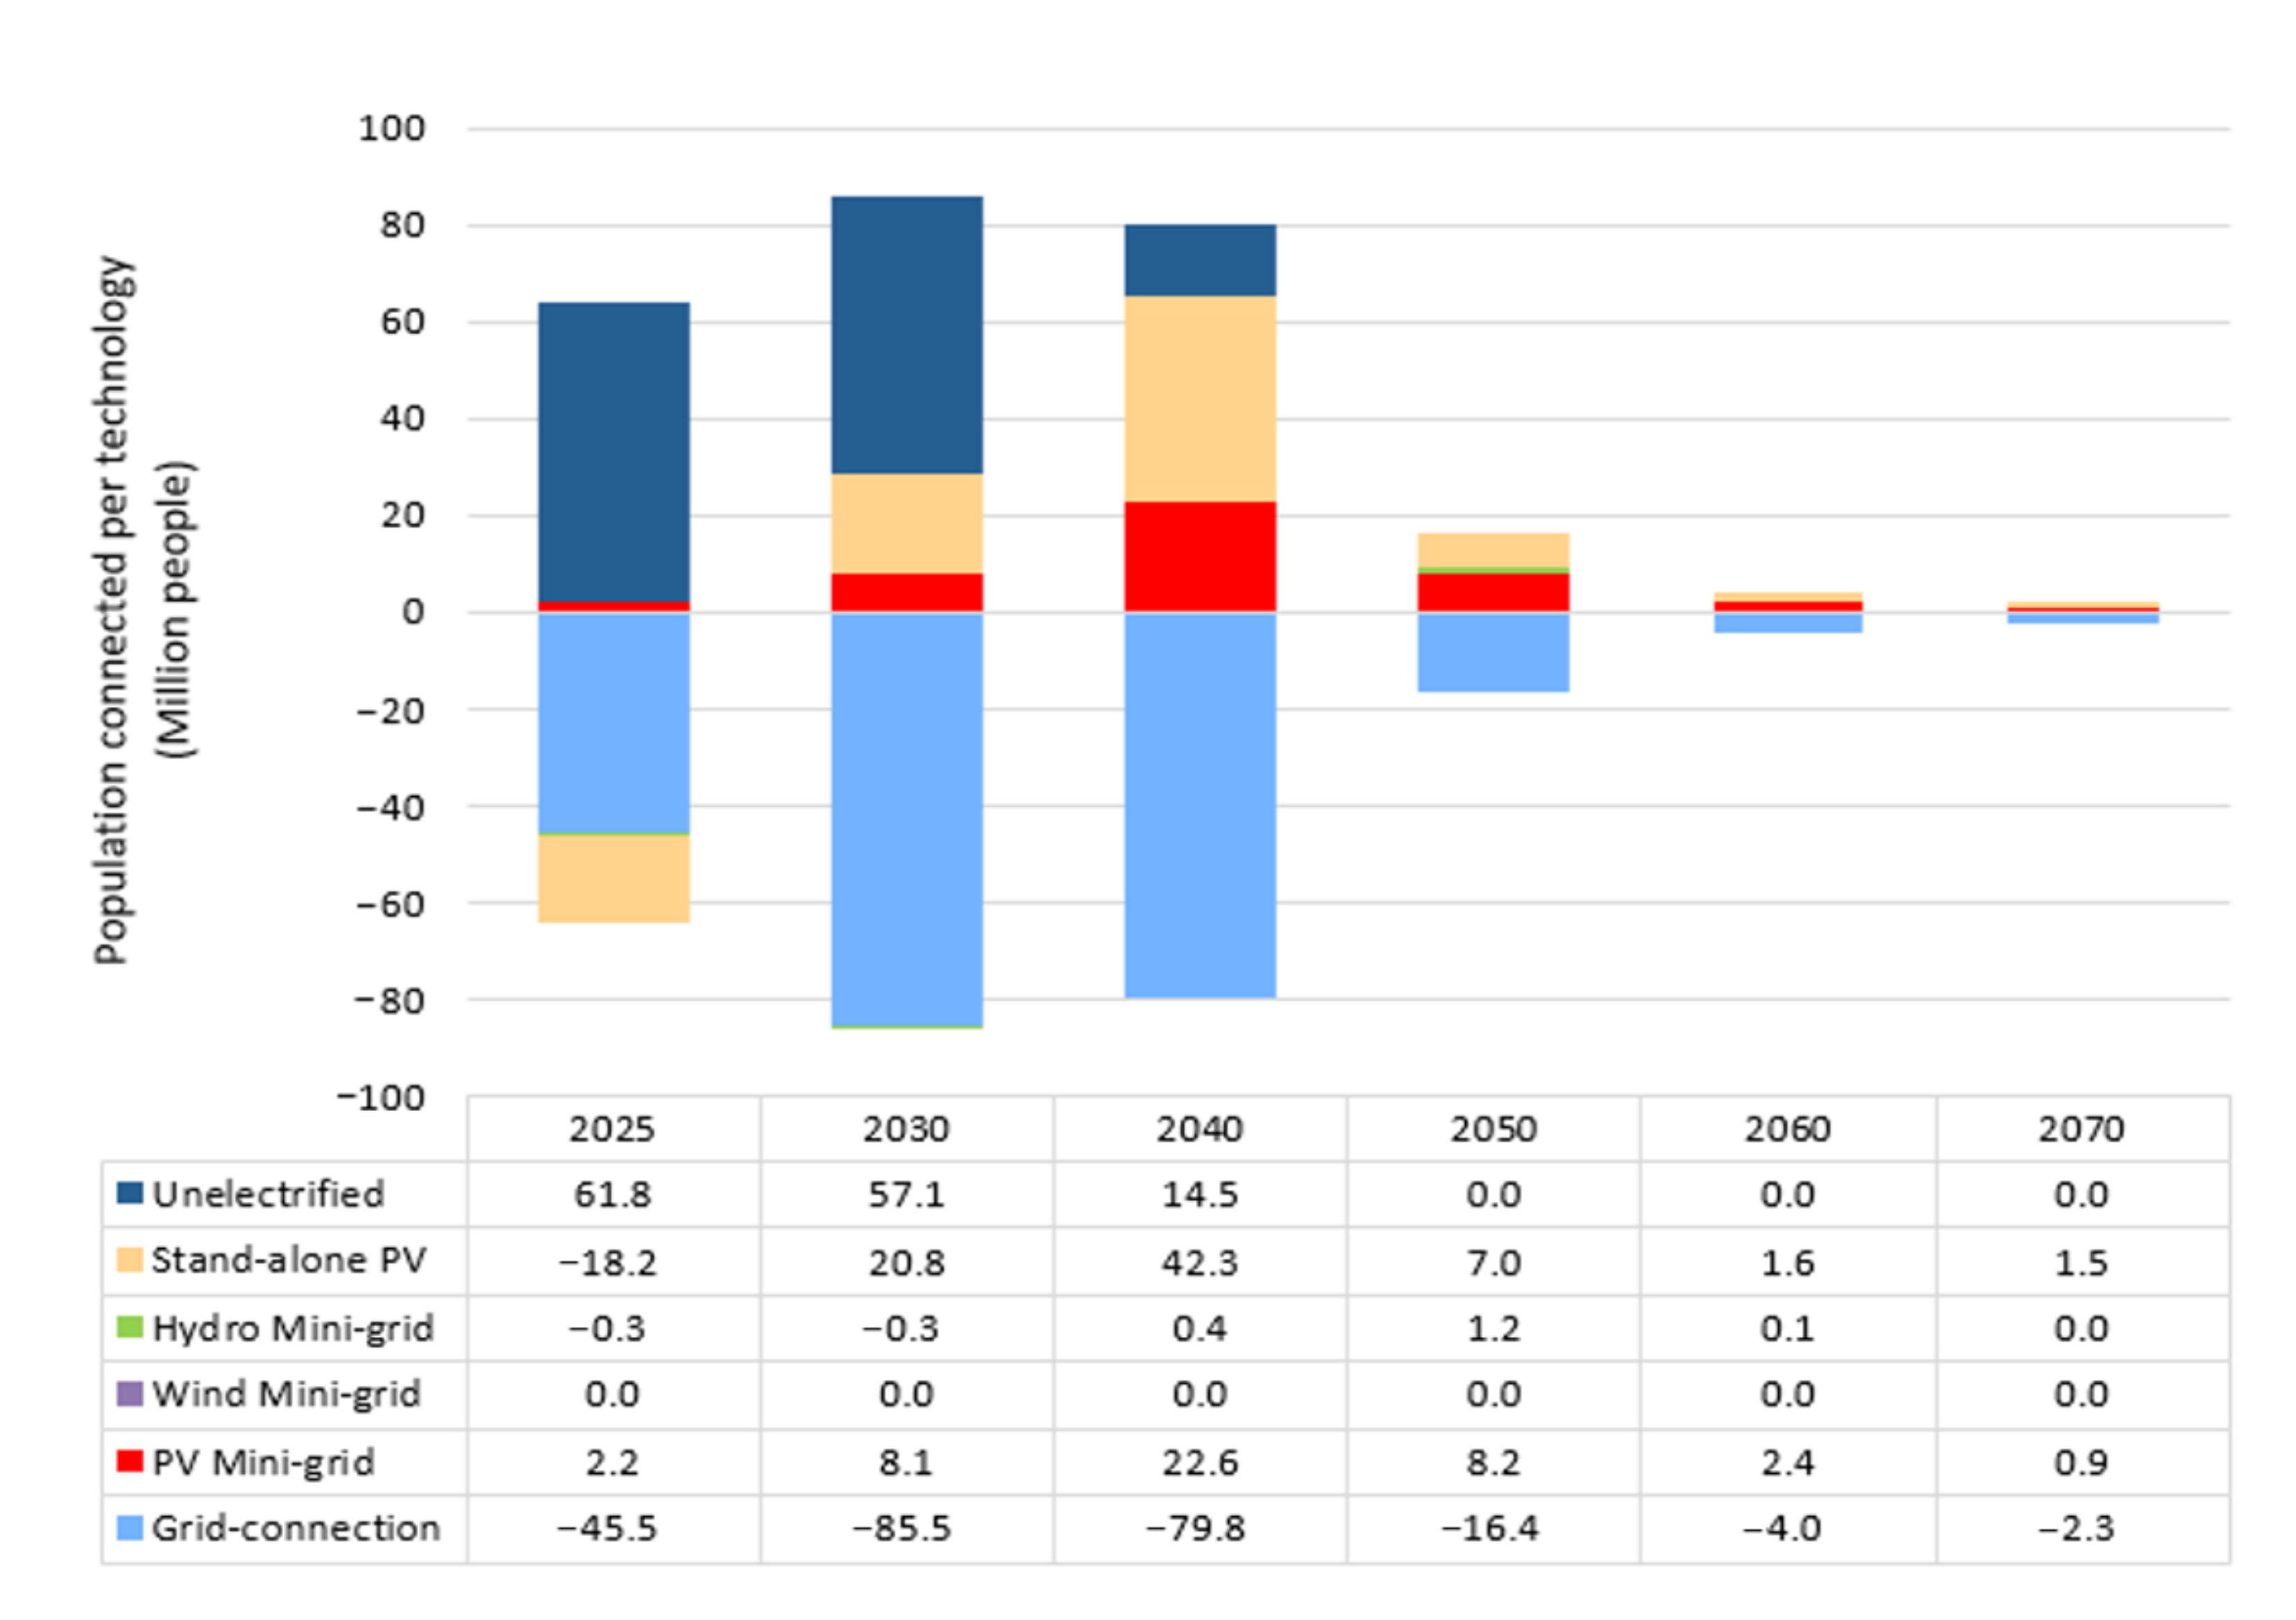
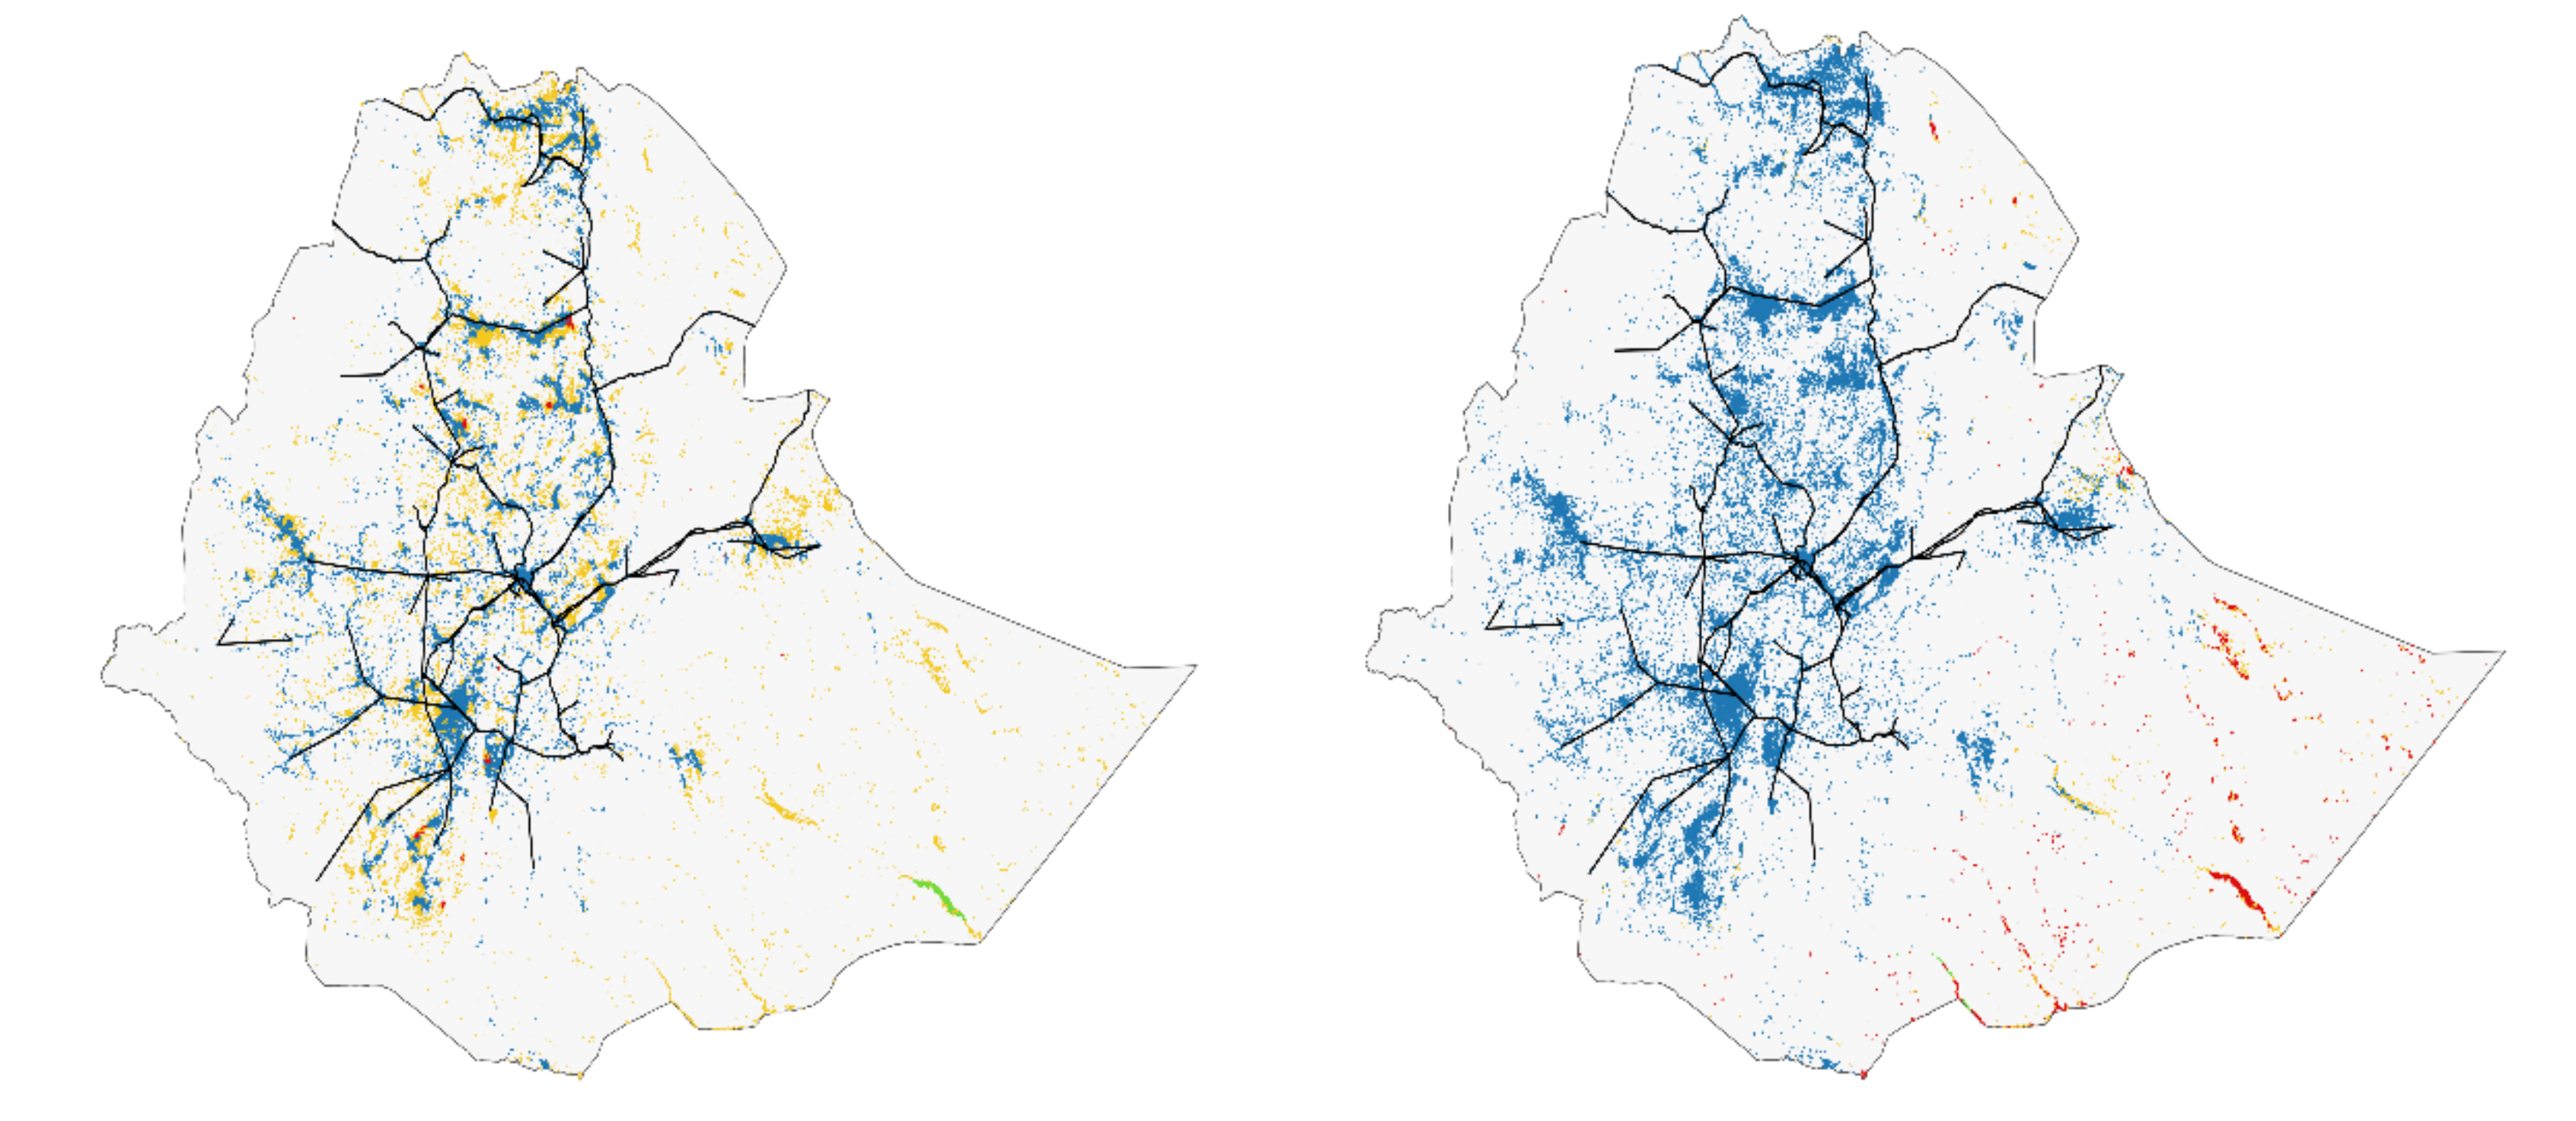
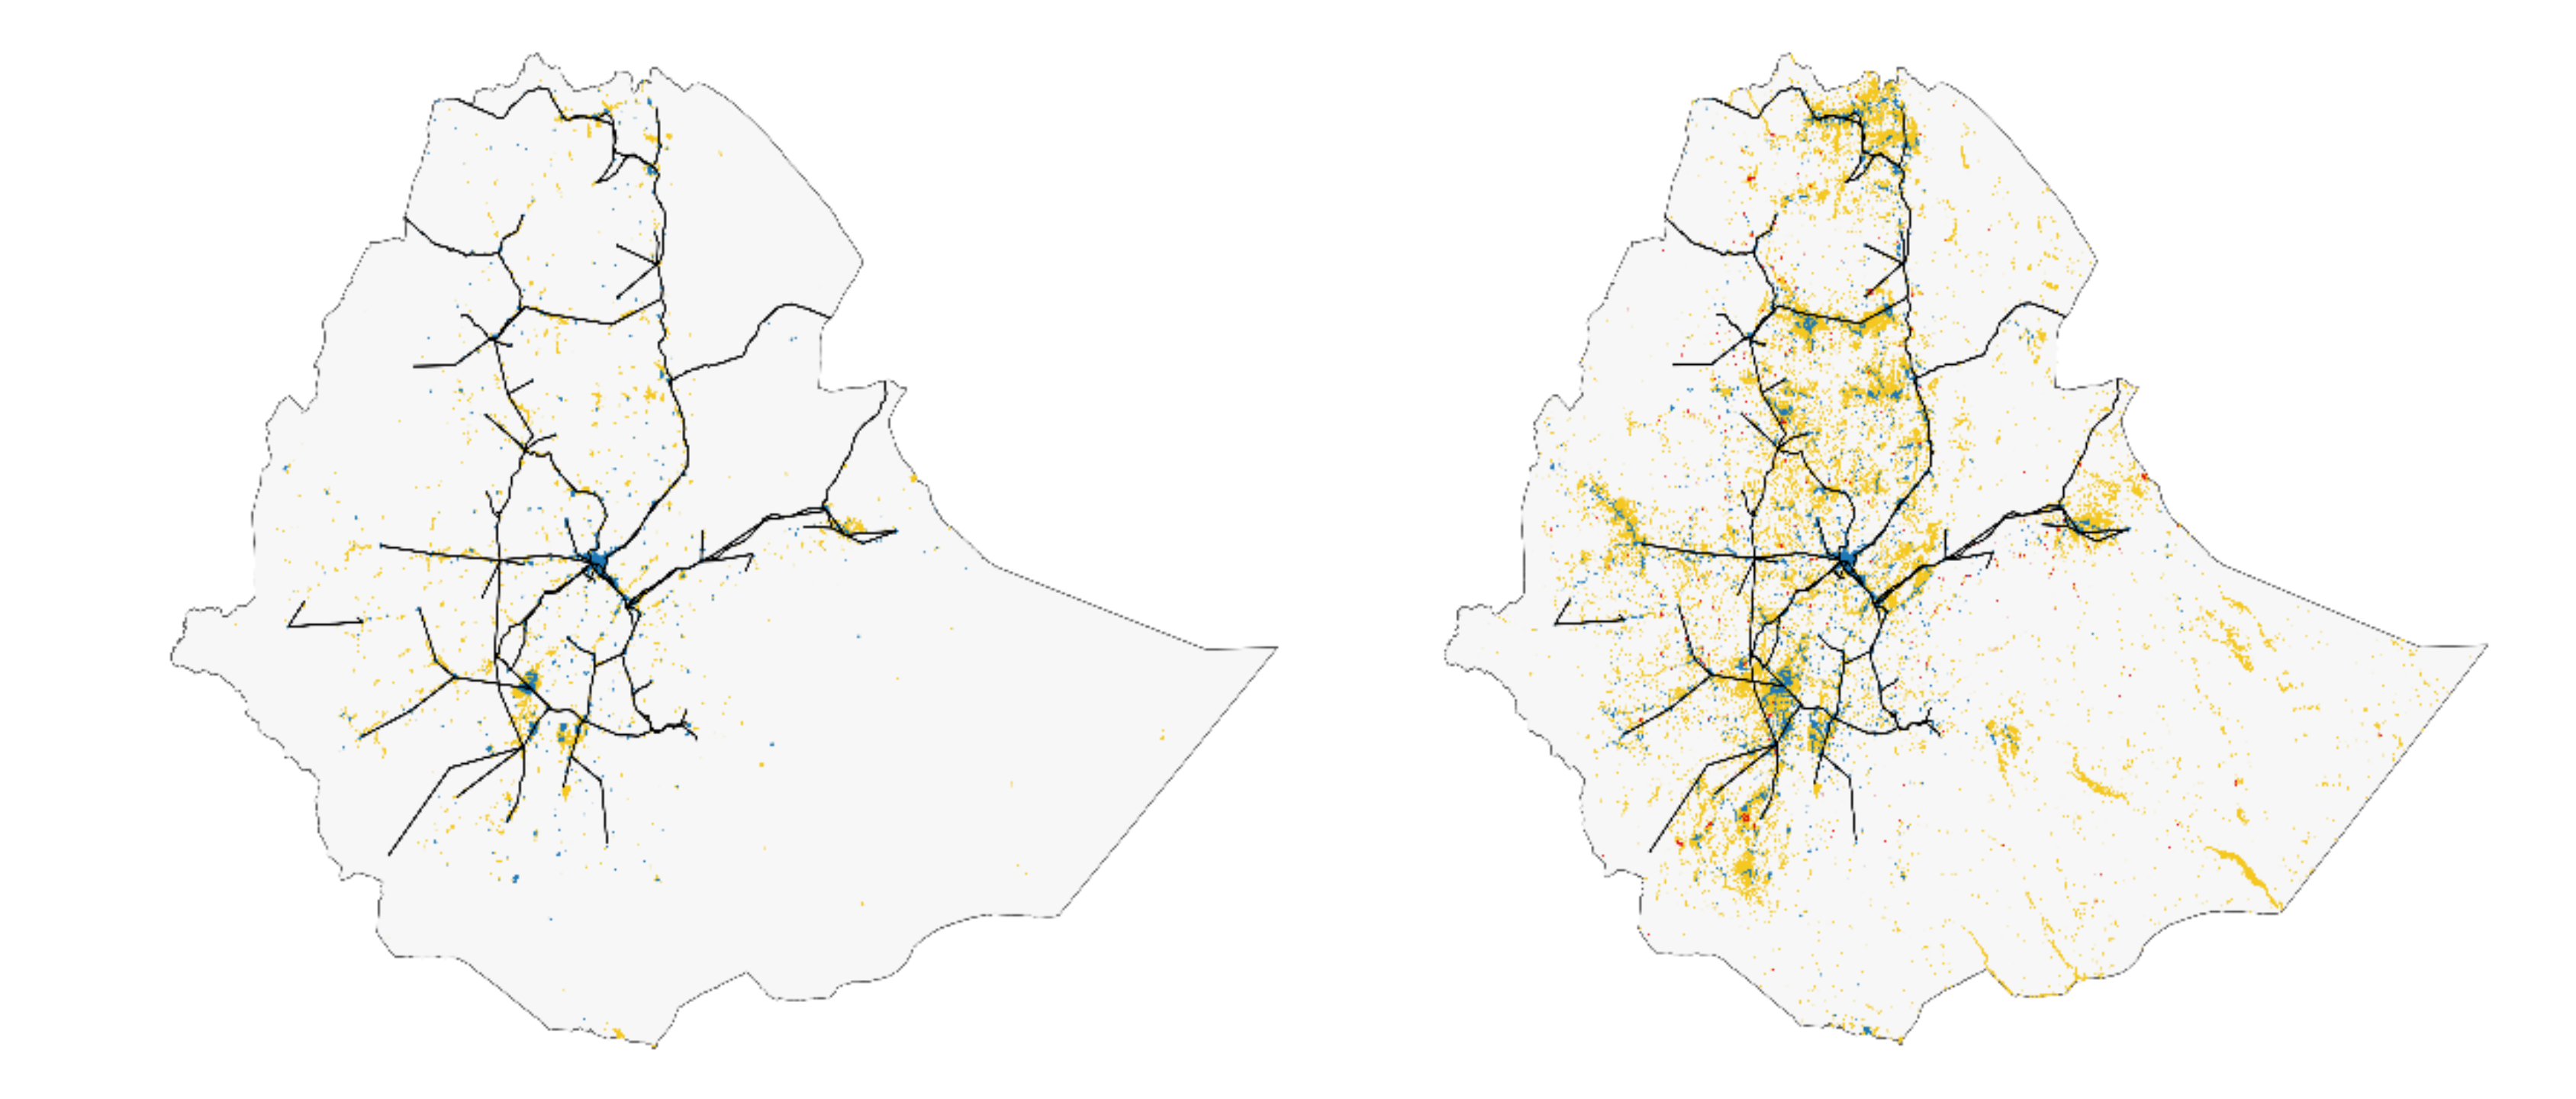
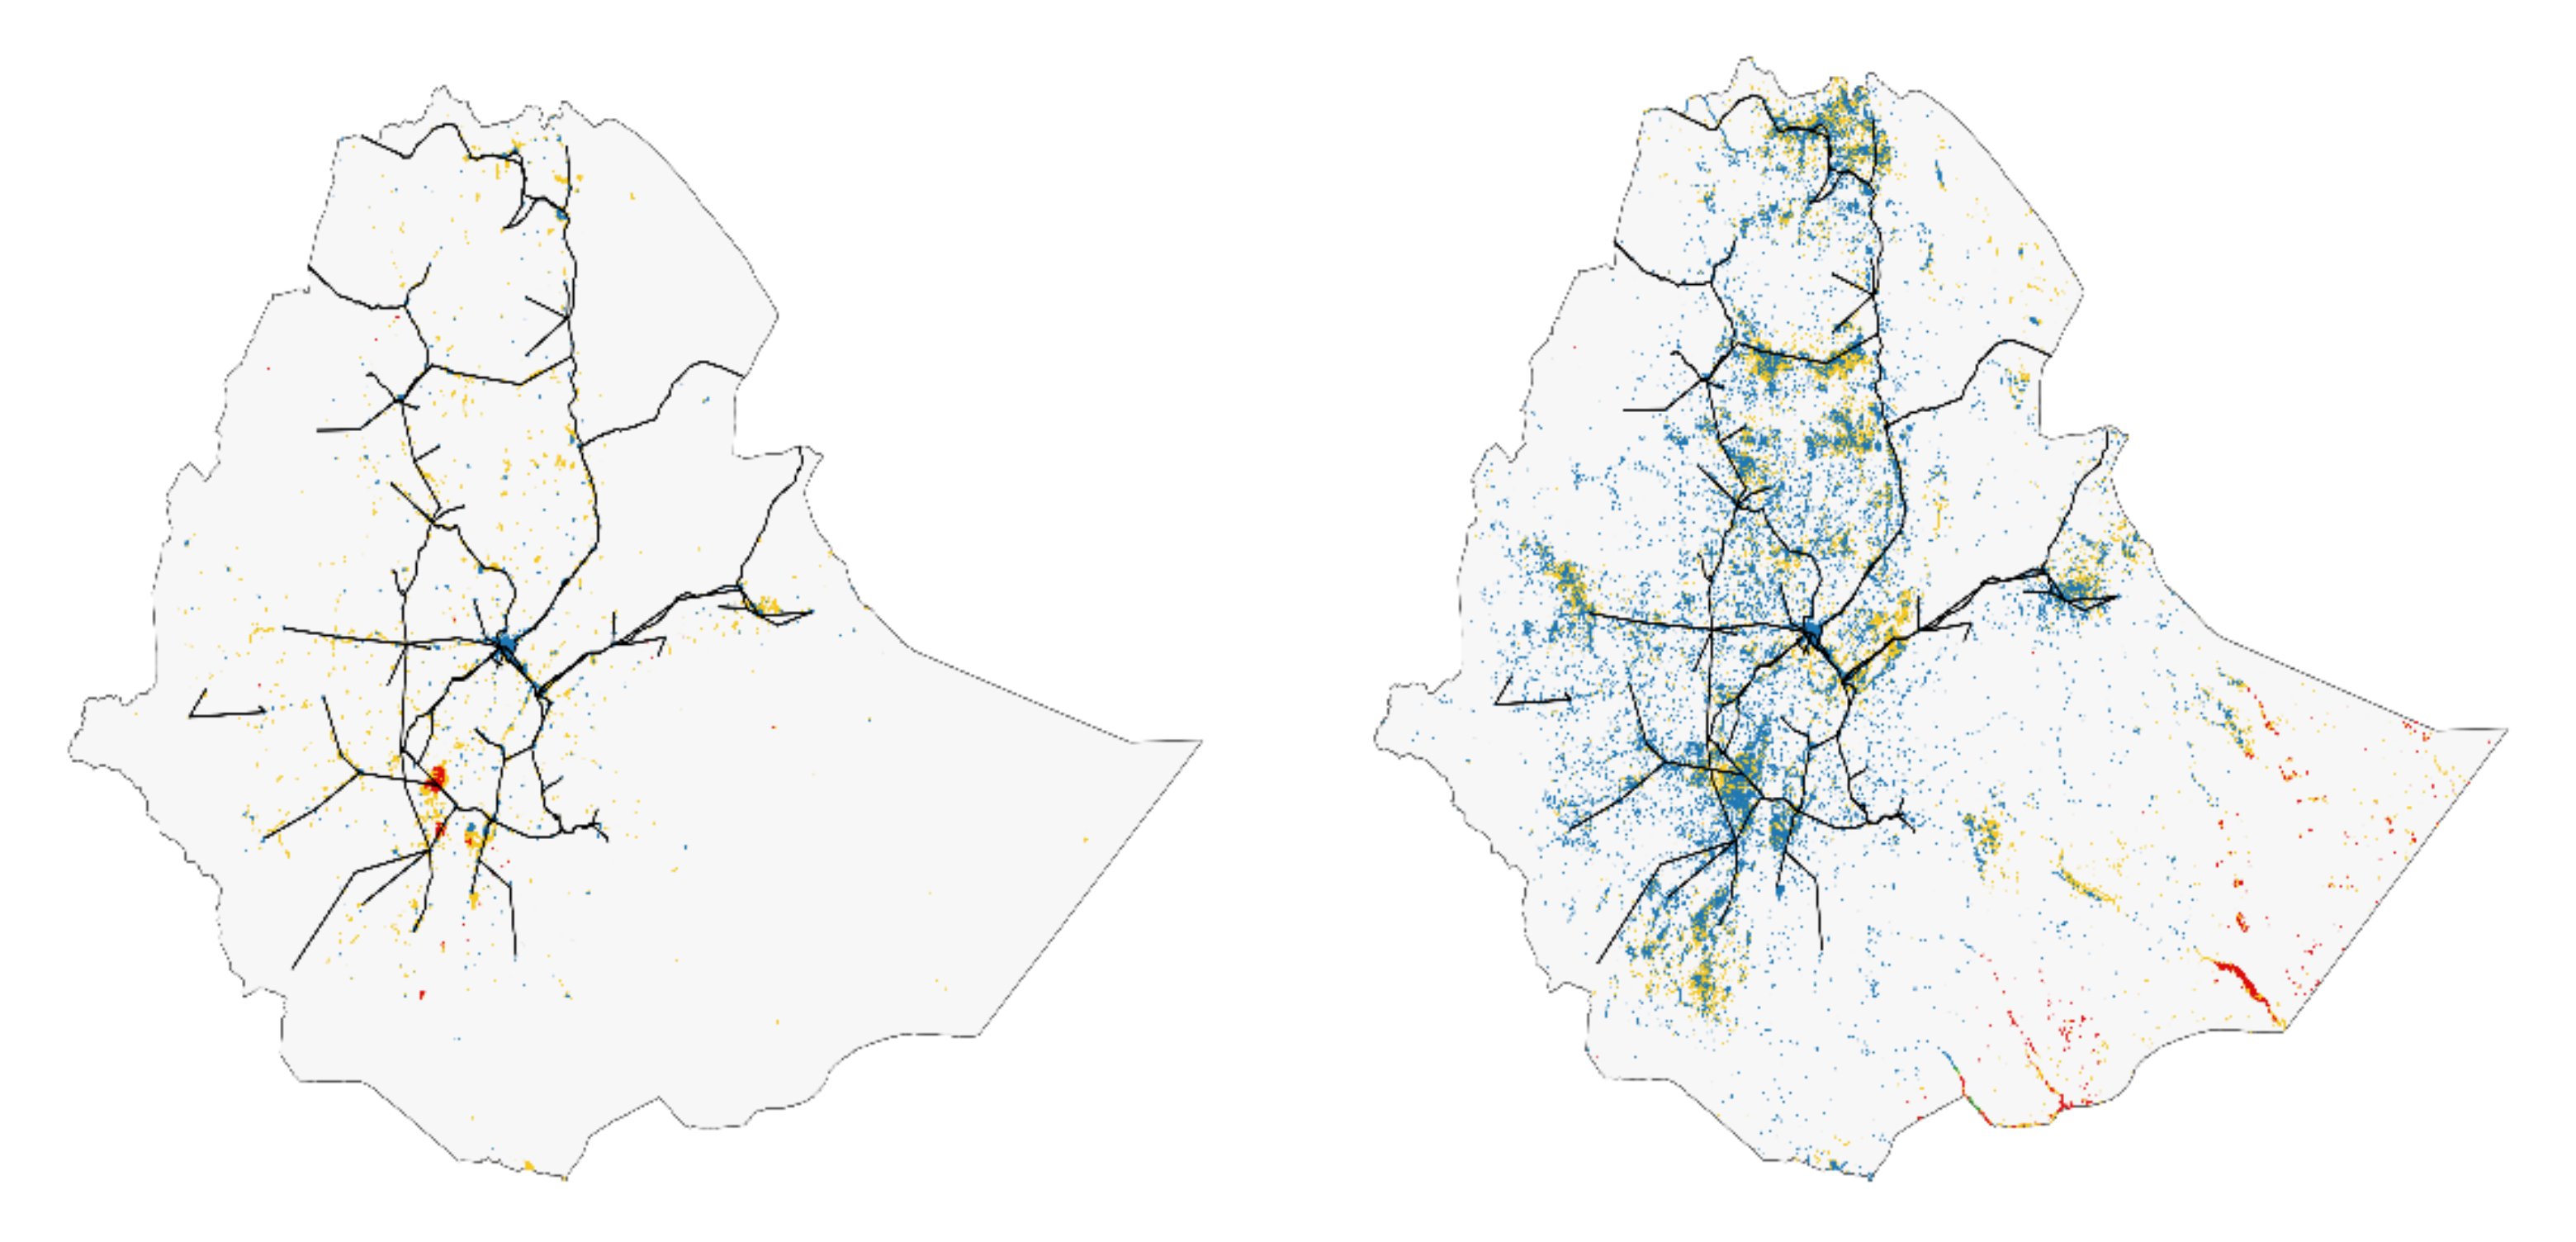
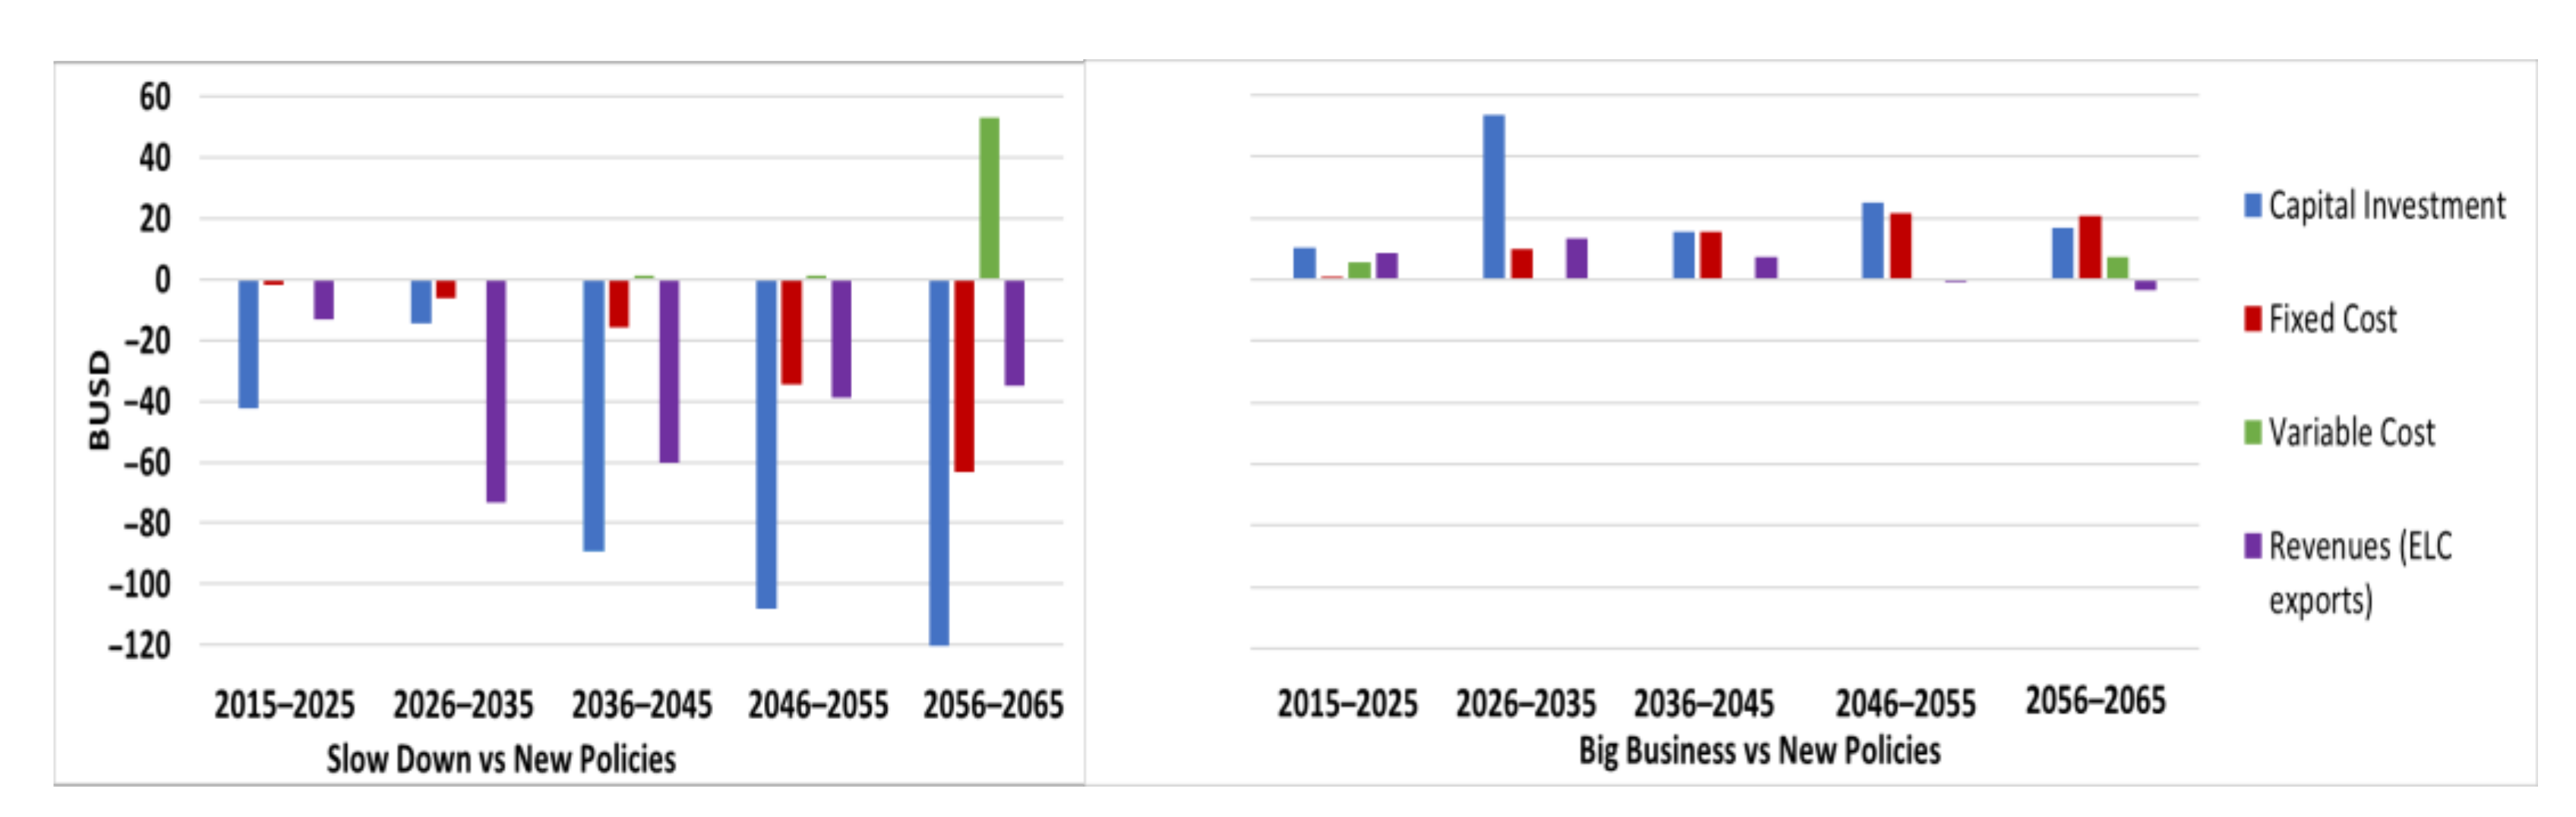
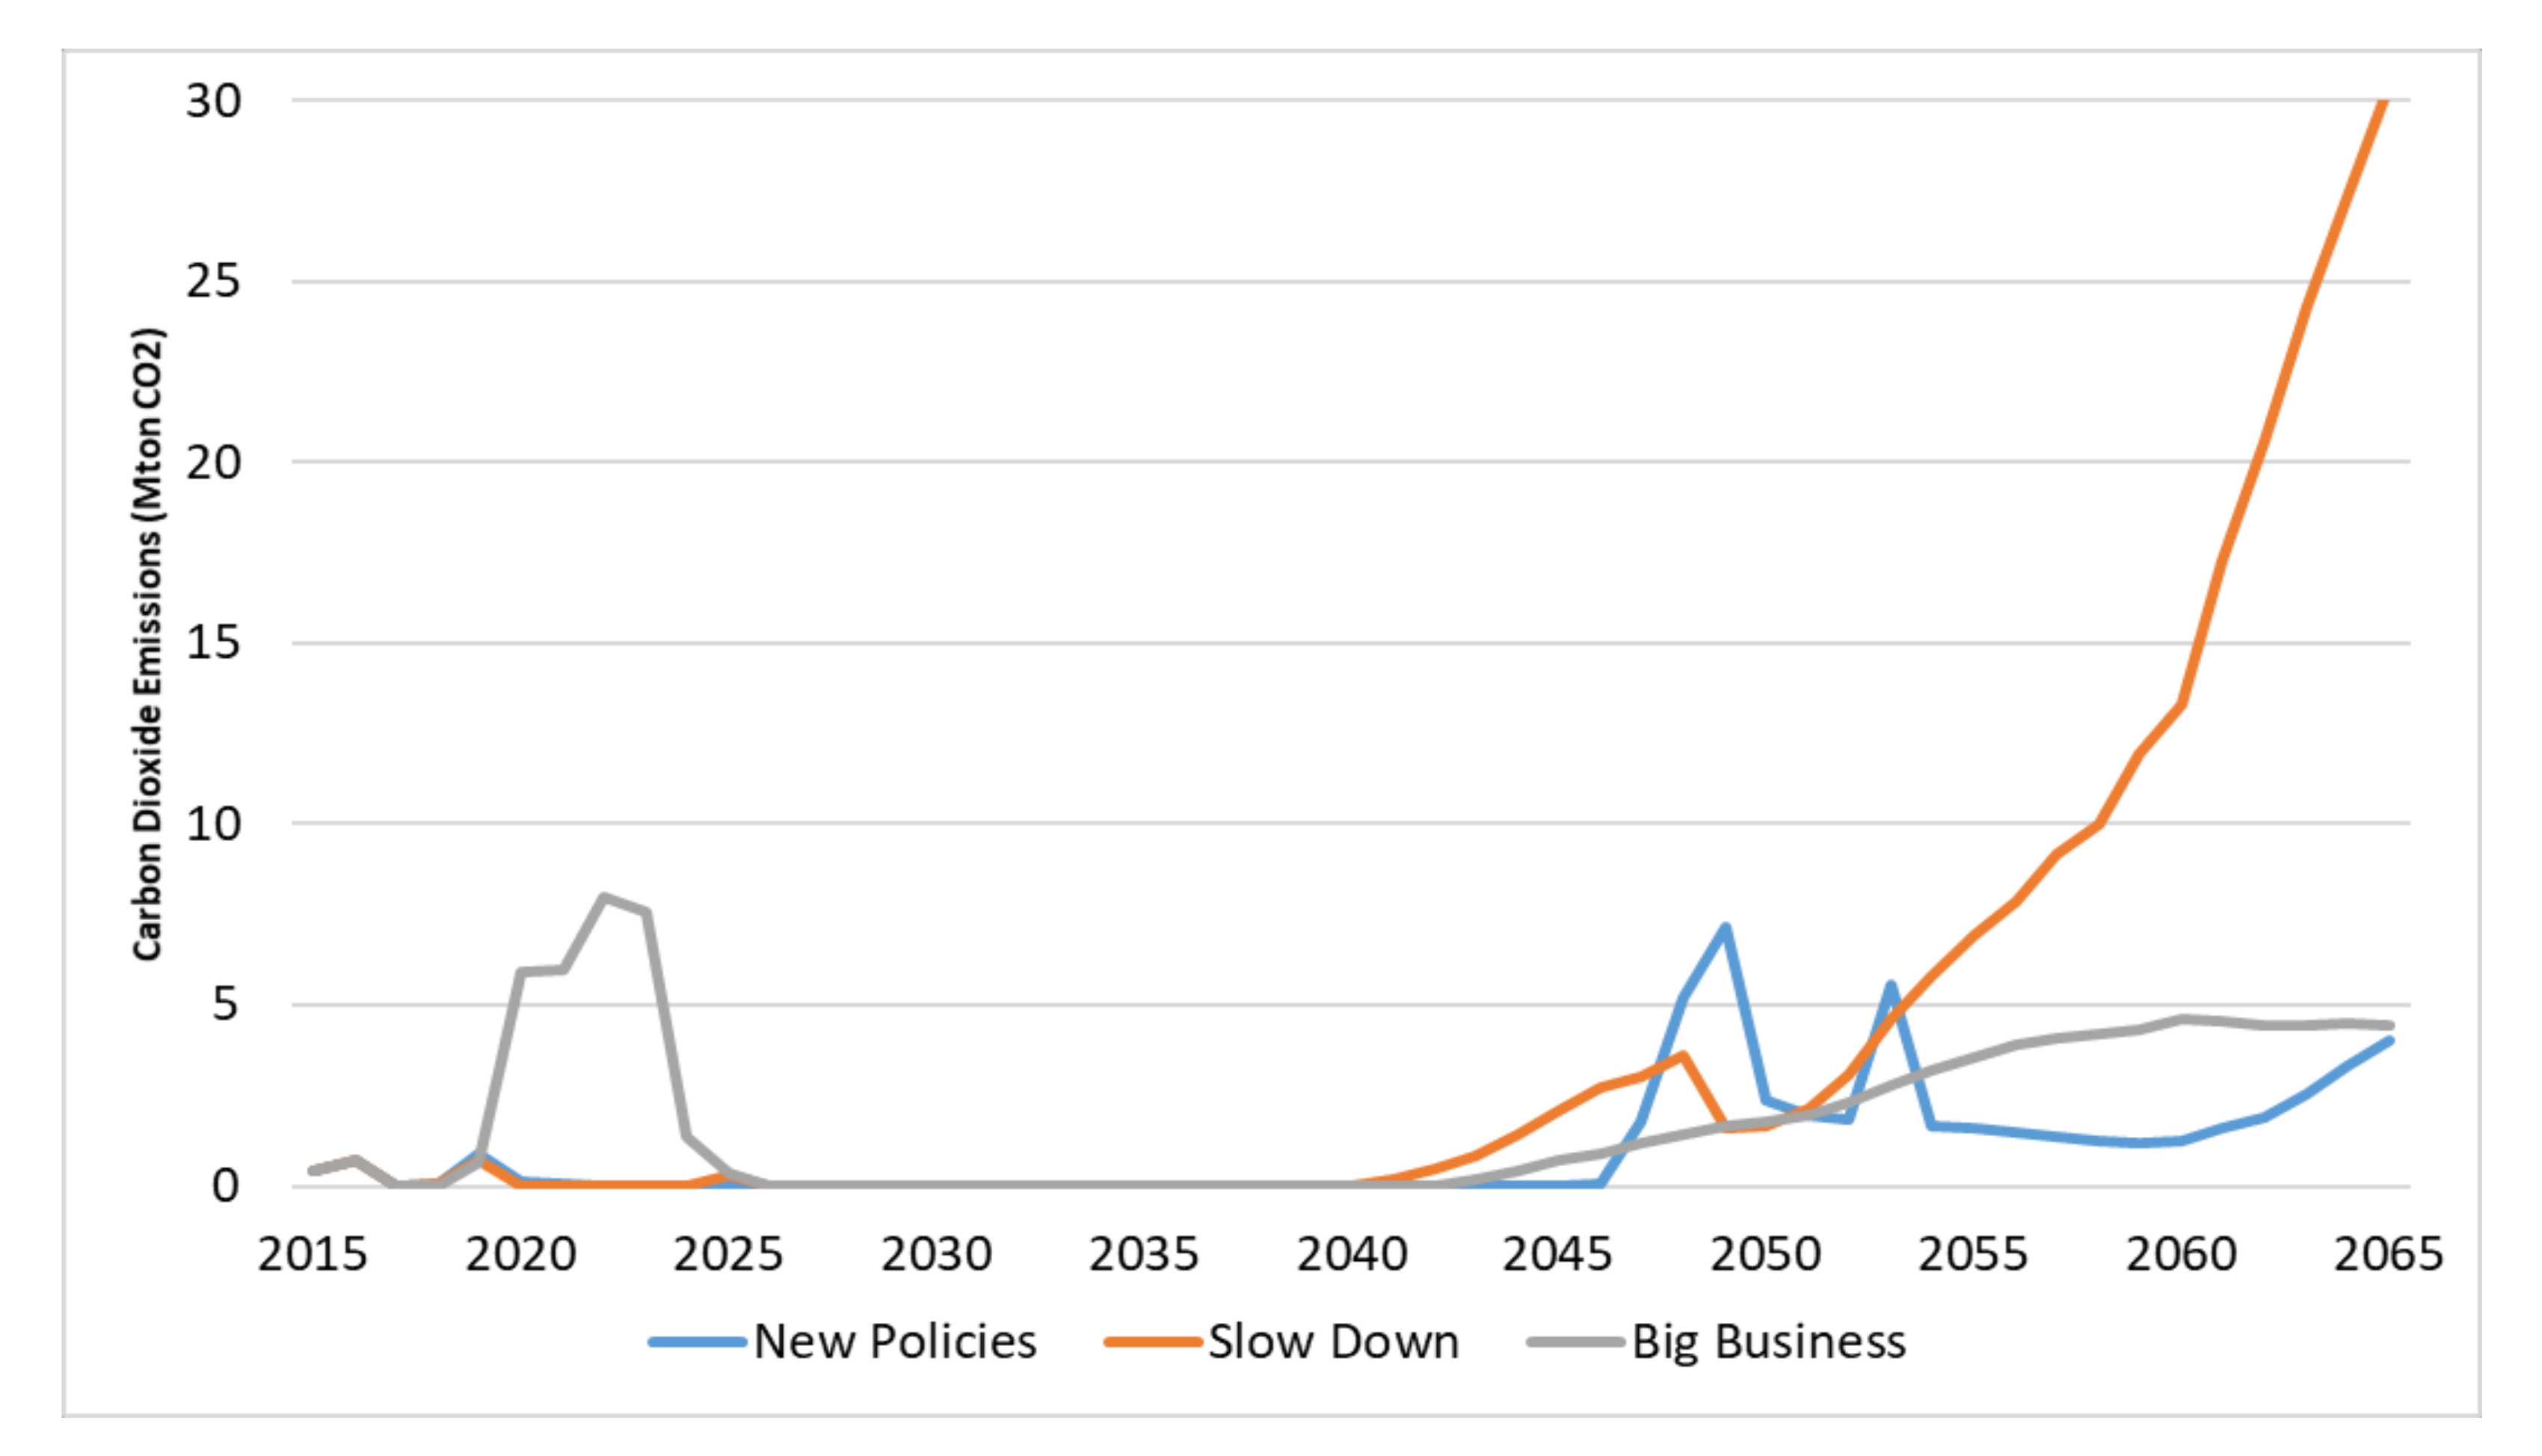
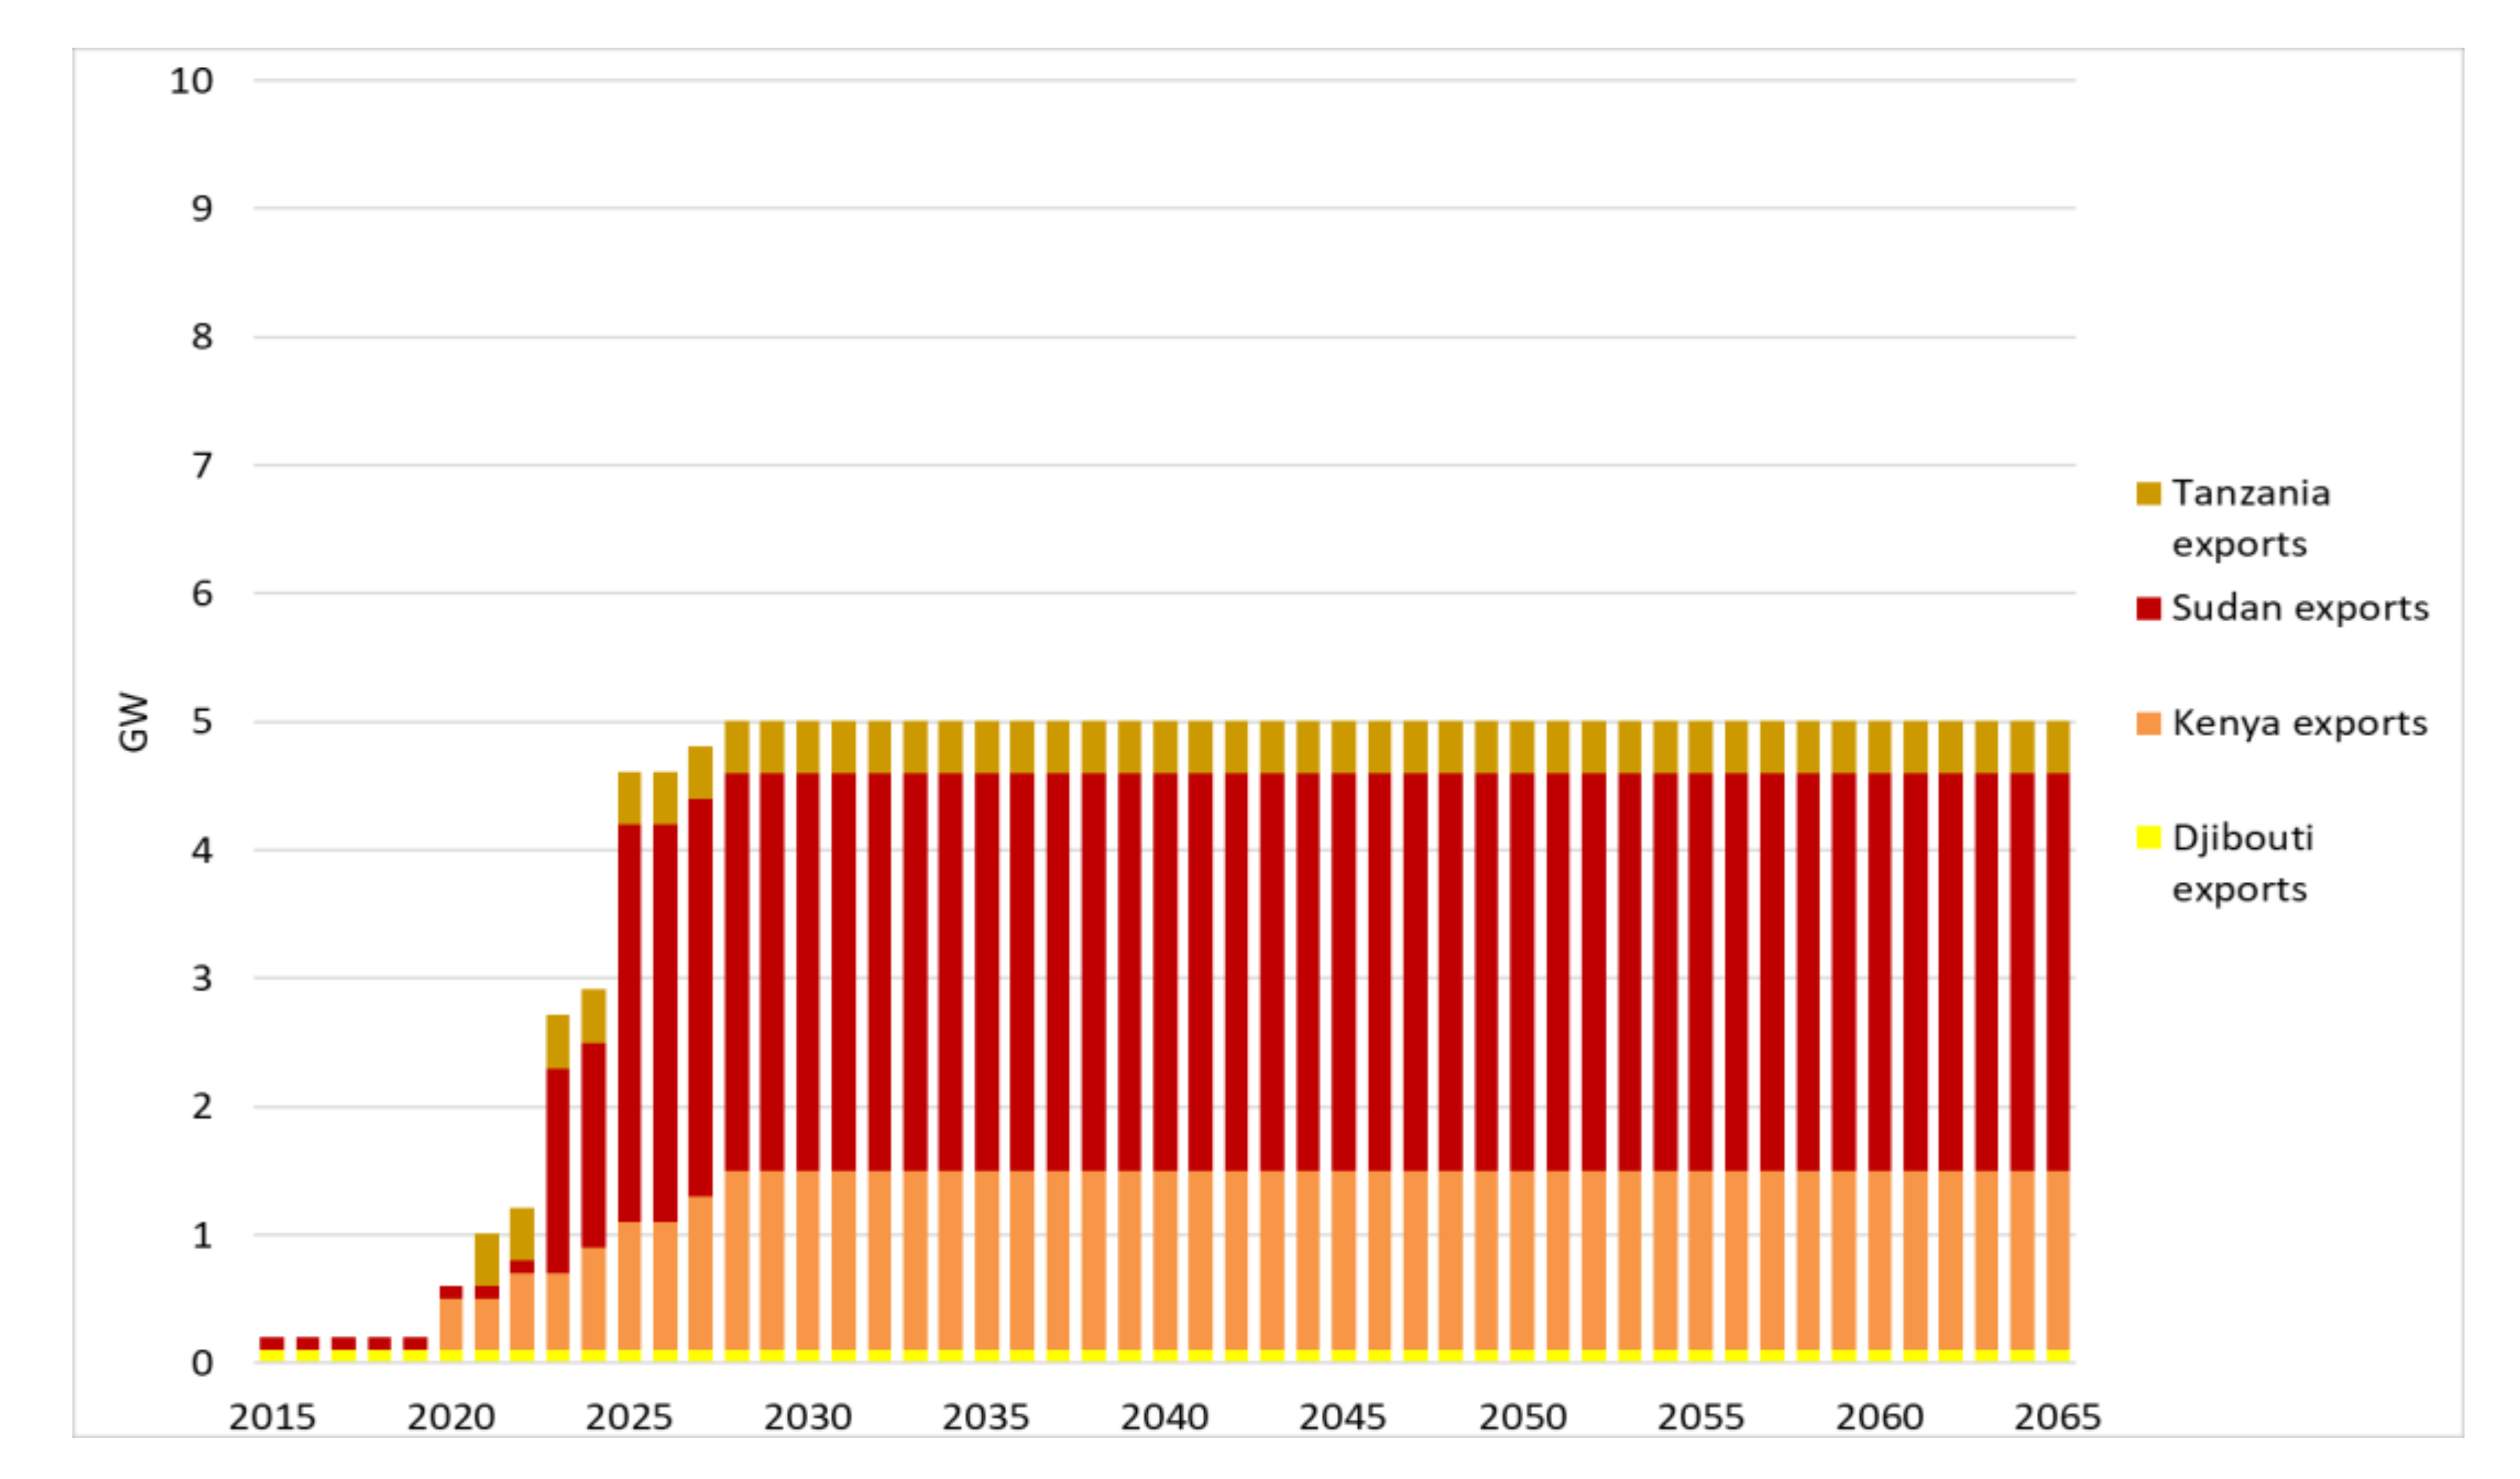
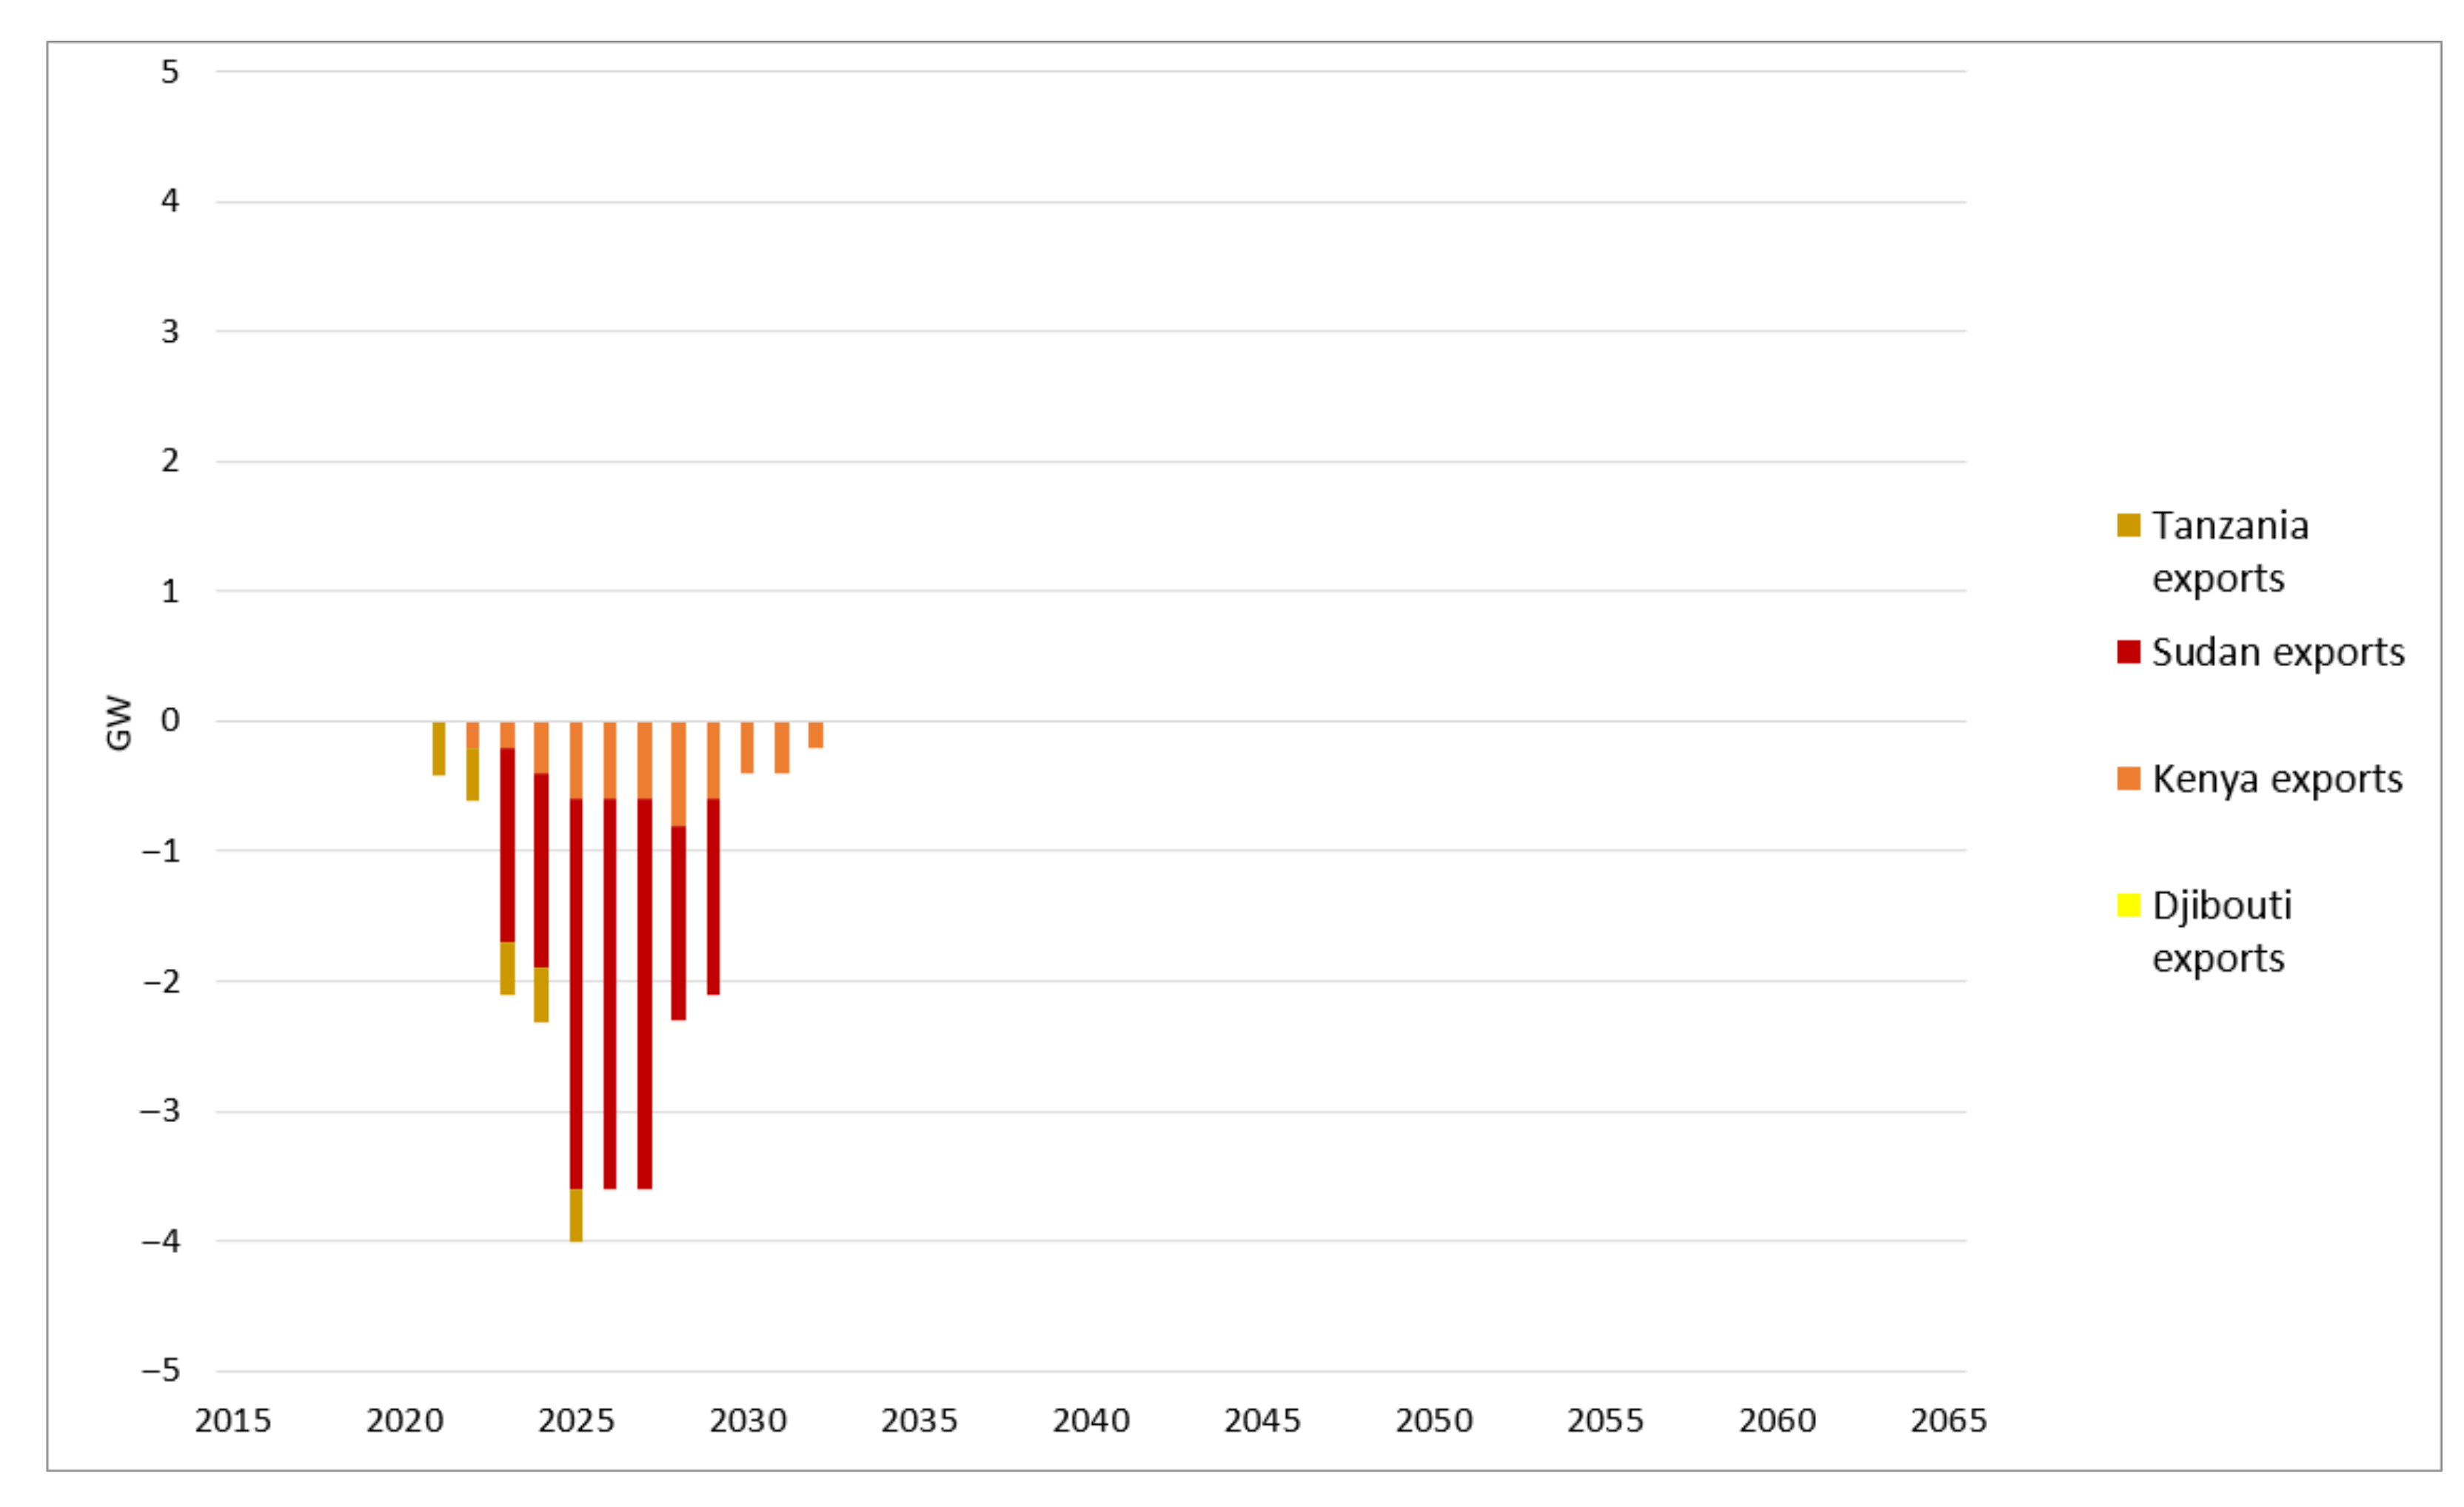
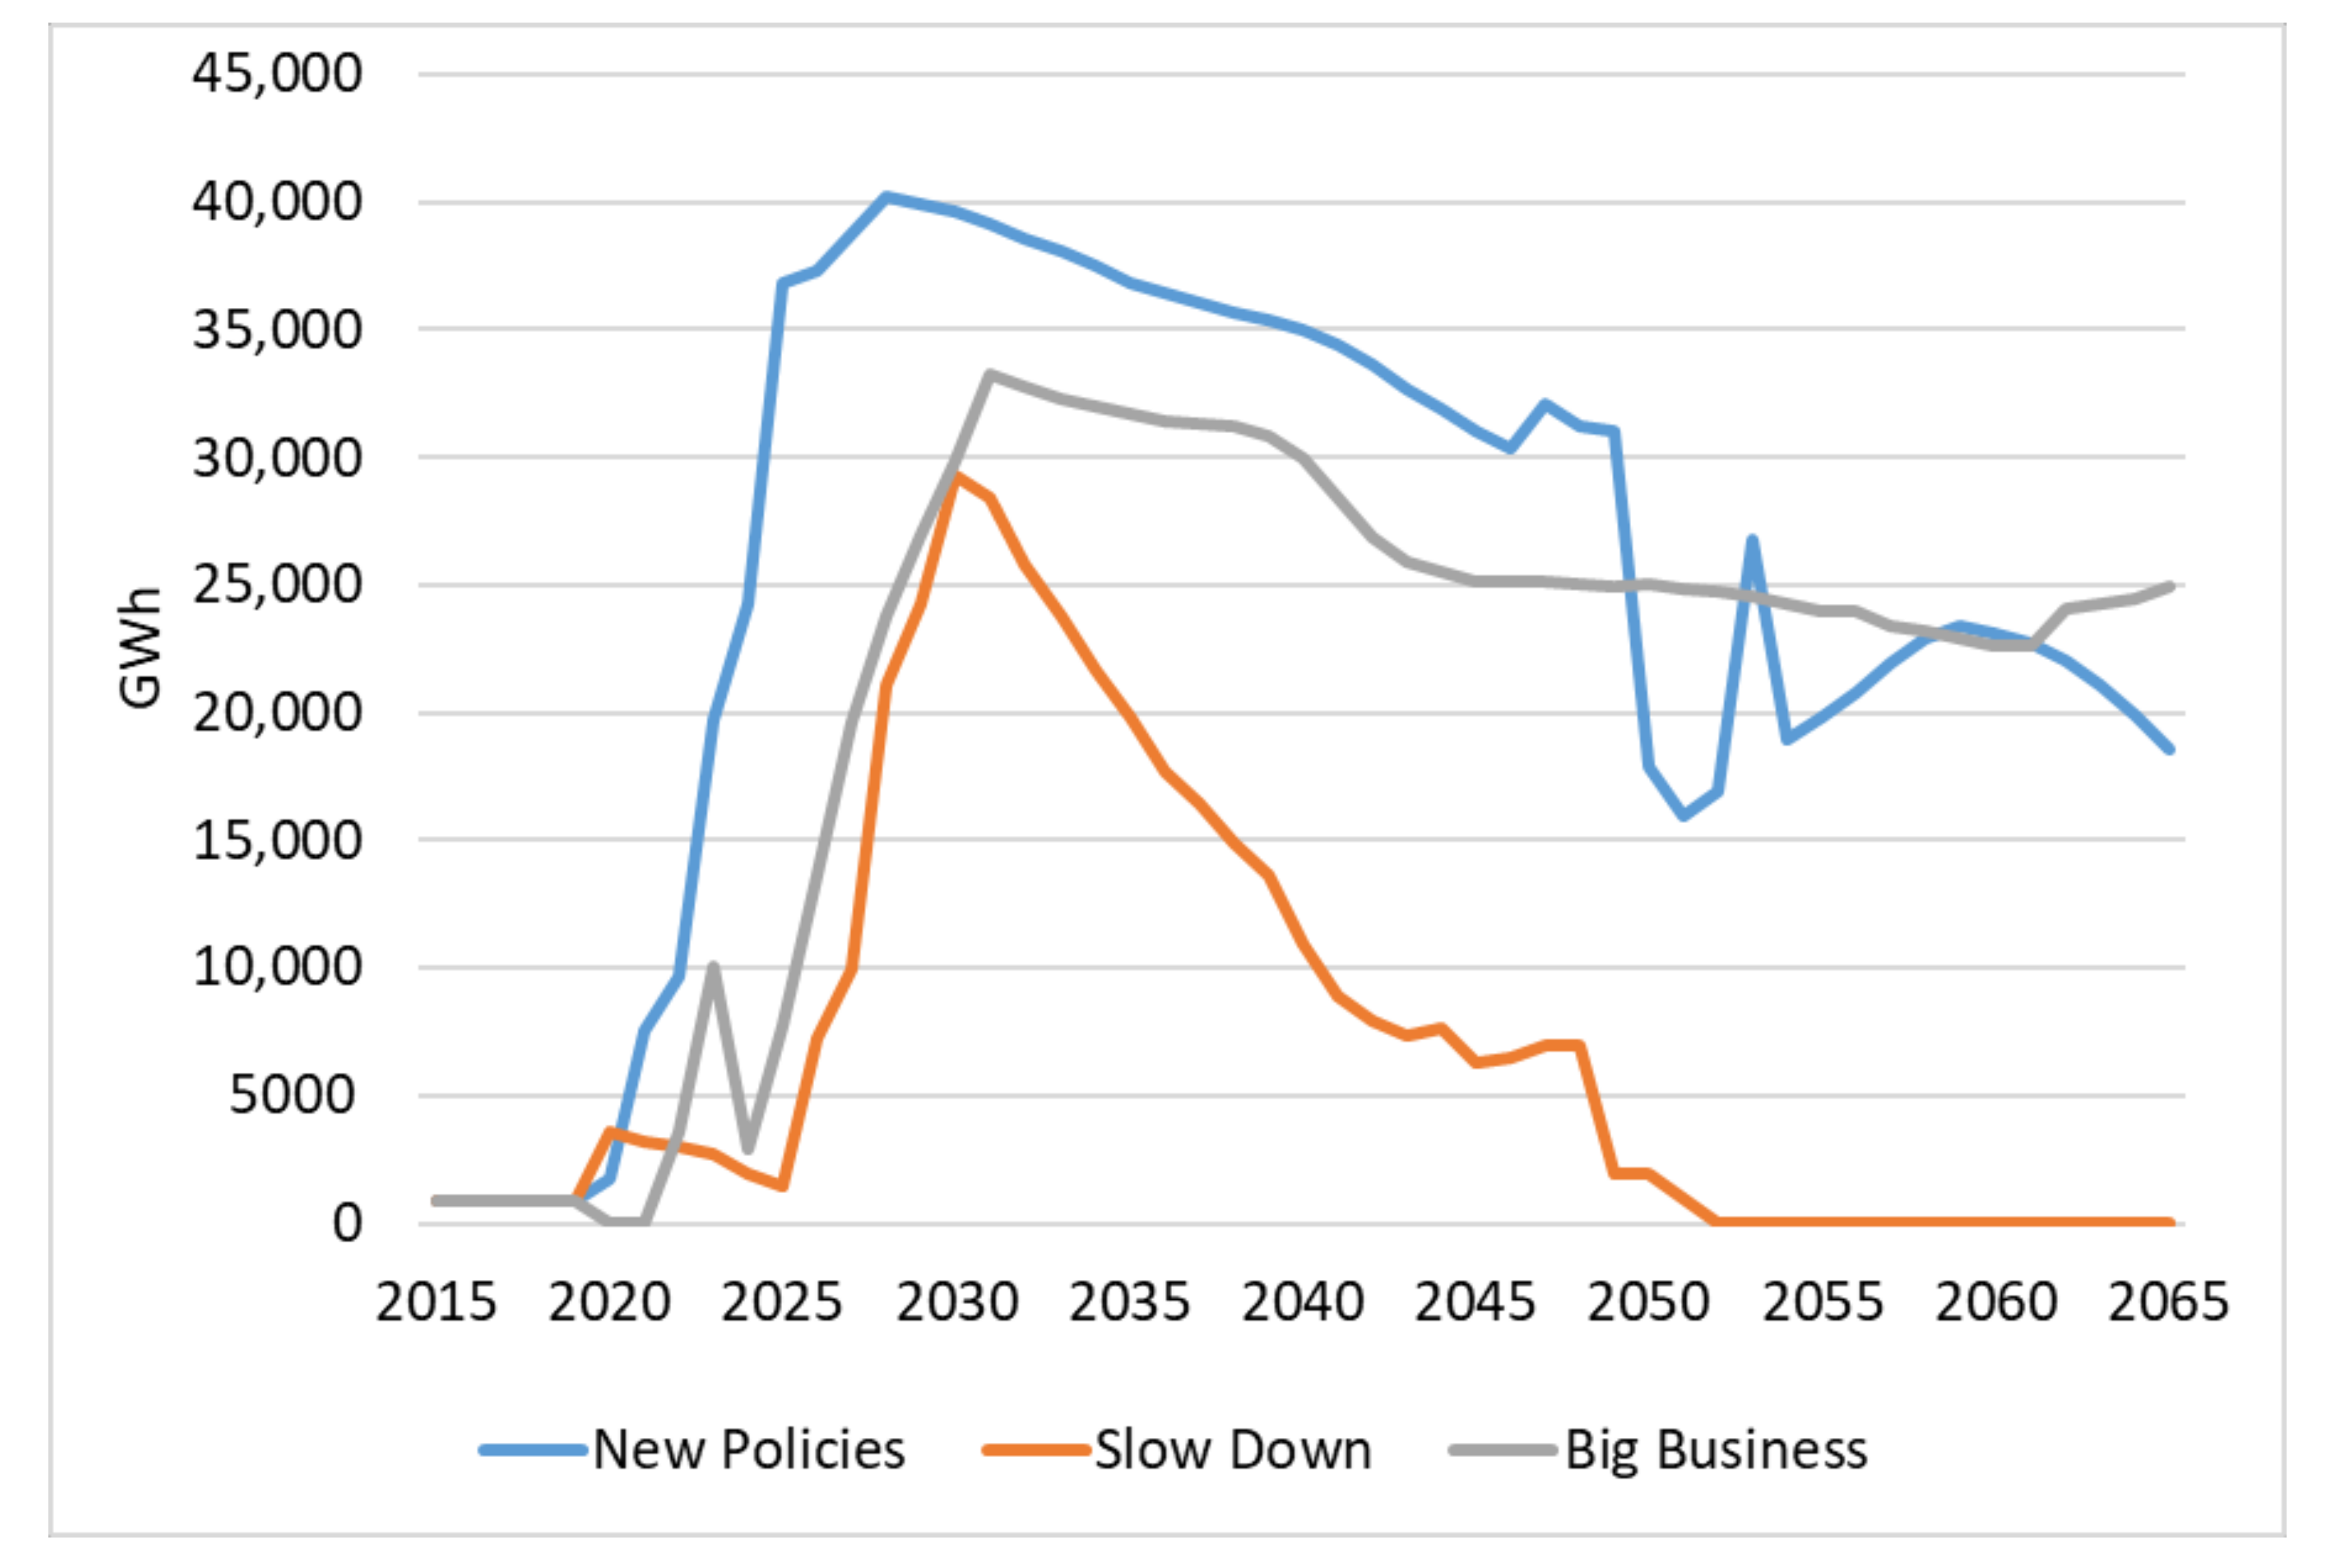