Review

Resilience Quantification of Smart Distribution Networks—A Bird’s Eye View Perspective

1
Electricité de France R&D, 7 Boulevard Gaspard Monge, 91120 Palaiseau, France
2
Risk and Resilience of Complex Systems, Laboratoire Génie Industriel, CentraleSupélec, Université Paris-Saclay, 3 Rue Joliot Curie, 91190 Gif-sur-Yvette, France
*
Author to whom correspondence should be addressed.
Submission received: 15 April 2021 / Revised: 10 May 2021 / Accepted: 13 May 2021 / Published: 17 May 2021
(This article belongs to the Special Issue Reliability, Security and Resiliency of Smart Grids)

Abstract

:
The introduction of pervasive telecommunication devices, in the scope of smart grids (SGs), has accentuated interest in the distribution network, which integrates a huge portion of new grid applications. High impact low probability (HILP) events, such as natural hazards, manmade errors, and cyber-attacks, as well as the inherent fragility of the distribution grid have propelled the development of effective resilience tools and methods for the power distribution network (PDN) to avoid catastrophic infrastructural and economical losses. Multiple resilience evaluation frameworks are proposed in the literature in order to assist distribution system operators (DSOs) in managing their networks when faced with exogenous threats. We conduct detailed analysis of existing quantitative resilience studies in both electric and telecommunication domains of a PDN, focusing on event type, metrics, temporal phases, uncertainty, and critical load. Our work adopts the standpoint of a DSO, whose target is to identify feasible resilience assessment frameworks, which apply to pre-defined requirements in terms of resilience evaluation objectives (planning, reactive response, or simple assessment), time of evaluation, and available enhancement strategies. Finally, results and observations on selected works are presented, followed by discussion of identified challenges and opportunities.

1. Introduction

Current information and communication technologies (ICTs) have achieved a high degree of penetration in all critical infrastructure (CI) systems, owing to the ever-increasing capabilities of their services in terms of coverage, throughput capacity, latency, scalability, and privacy [1,2,3,4]. In power systems, the massive introduction of telecommunication devices accelerated the shift toward smart grids (SGs) [5] that come with a whole new package of functionalities such as automated control, smart sensing and metering, high-power converters, and modern energy management techniques based on the optimization of demand, energy, and network availability [6]. The high-performance smart grid allows thereby for the insertion of new applications in the network like distributed generation, Industrial Internet of Things (IIOT), and electrical vehicles [7]. This comes, however at the expense of increased complexity, which brings new vulnerabilities and broadens the attack surface [8]. Recent extreme events of natural disasters, cyber-attacks, and man-made errors which we refer to as HILP events, have shown that SGs are susceptible to strong disruptions given the large-scale networks they represent, and the attendant interdependencies [9]. Some recent examples are the power disruptions in the US in 2017, caused by hurricanes and wildfires [10], which caused a cumulative damage of $306.2 billion, affecting a total of 47 million people—nearly 15 percent of the nation’s population. For instance, at the peak of hurricane Irma, more than 6.7 million electrical customers were without power [11], and hurricane Maria severely damaged the Puerto Rico power grid leaving 1.5 million people out of power [12]. China’s severe ice storm in 2008 resulted in the service disruption of 2000 power substations and 8500 towers leading to power interruptions in 13 provinces and 170 cities [13], and over 4 million customers went on power outage for over seven days during the Great East Japan Earthquake in 2011 [14]. During the Ukraine power grid cyber-attack in 2015, 30 power substations were turned off, and hundreds of thousands of people were without electricity for a period from 1 to 6 h [15,16].
Events like these reveal the need for strategies that are able to cope with such harsh impacts, especially given that the capacity to operate resiliently against attacks and natural disasters is one of the multiple smart grid attributes [17]. Resilience is defined as the ability to “anticipate, absorb, adapt to and/or rapidly recover from a disruptive event” [18]. In line with this definition, the U.S. Presidential Policy Directives-21(PPD-21) introduces resilience as “the ability to prepare for and adapt to changing conditions and withstand and recover rapidly from disruptions” [19]. This same directive involves the “fail safe” paradigm in system engineering through recommendations for cyber-physical security, while highlighting the shift toward “safe-to-fail” paradigm brought by cyber-physical resilience. Many conceptual frameworks are proposed for understanding and evaluating resilience, where the time dimension is very important, as various facets (anticipation, absorption, robustness, survivability, mitigation, flexibility, adaptability, restoration, and recovery) are linked to different temporal phases that describe system performance during an extreme event [20,21,22,23,24,25]. Resilience moves from traditional risk assessment, which relies on probabilistic analysis of likely failures, toward dealing with unexpected events, requiring mitigation and healing strategies. The main difference is that risk assessment aims to achieve situational awareness and diagnosis, while resilience moves one step further by incorporating reactive actions against the contingency and launching restoration operations, which maintain the functionality of most critical loads and/or make them rapidly recoverable [26].
Within the growing literature on power system resilience [27,28,29,30,31], utilities are particularly interesting in quantitative assessments of resilience, which propose relevant indicators to guide cost-benefit studies before planning investments. In this context, multi-dimensional characteristics of resilience are a considerable challenge [32,33,34]. Ouyang and Dueñas-Osorio [35] tackled technical, organizational, and social dimensions of resilience, while providing an alternative to evaluate the economic dimension by estimation of economic losses. Only the technical dimension of the power network is widely investigated in the literature [36], which reveals the need to examine all other dimensions for a comprehensive analysis of resilience [33,37,38]. Technical and organizational dimensions are the most suitable in the case of power grids as they can be applicable at individual system levels, while social and economic dimensions are better suited for community level (interdependent systems), to which resilience studies should converge in the future [38]. Temporal multi-phase resilience quantification is a well-adopted technique that can embed other dimensions by linking them to technical and organizational dimensions through the implementation of enhancement strategies. Unlike [35], most proposed metrics in literature exclude pre-event and post-recovery phases, suggesting that quantification is conducted for a single scenario and not for a sequence of disruptive events, which corroborates the relevance of resilience for HILP disruptions. Work in [39] introduced resilience-based component importance measures centered in the recovery phase; on the one hand by establishing a ranking for load restoration using optimal repair time, and on the other hand, by quantifying the potential loss in optimal system resilience due to a delay in component repair process (computed through resilience reduction worth metric). Likewise, [40] focuses on the recovery stage of resilience, with the goal of comparing different restoration strategies and selecting an appropriate performance measure. Authors in [41] proposed a multi-phase framework to assess the resilience of the UK power transmission network under a windstorm. The framework considered both infrastructural and operational aspects, introducing four simple metrics to describe the degree and speed of degradation, duration of the disruption, and recovery speed. Grid connectivity and operational metrics can jointly describe the whole span of post-event analysis, and be used for planning short-term mitigation and recovery, or long-term hardening [42]. Resilience strategies to minimize system performance loss can be further analyzed under budget constraint by a tri-level planner-attacker-defender model [43], where a planner optimizes long-term transmission network expansion before an attack hits the system. Short-term switching operations are then applied in reaction. Resilience is quantified using customer demand not supplied, which includes both mitigation and recovery capabilities in the system. Many other optimization models and performance measures are adopted in related studies [44,45].
Given widely stretched power networks, resilience studied at the system level for generation and transmission, does not (or negligibly) include distribution grid components [35,39,40,41,42,43]. In 2010, only 15% to 20% of feeders implement distribution automation in the North American grid, one of the most advanced electrical systems [46]. This illustrates that the PDN is the most fragile level of electrical systems due to legacy “blindness” and manual operations along with electromechanical components [47], especially with the fact that an estimated 90% of customer outages in the US are related to this part of the system [48].
The advent of smart grids renewed interest in enhancing the PDN performance [49] as nearly all SG provided abilities of self-healing, high reliability, energy management, and real-time pricing are empowered by technologies introduced at the distribution level such as advanced metering, automation, distributed generation, and distributed storage [50]. ICTs are the main enabler of this new portfolio of applications [7], by transforming a traditionally one-way, limited-control, and radial PDN into a two-way power flow, intelligent, and mesh-networked grid capable of guaranteeing improved service for all connected loads [51]. In this regard, expected high-performance capabilities of smart distribution grid can succeed in coping with most failures in the system [49,50]. The smart PDN remains susceptible to HILP events, or even more prone in some cases, due to increased uncertainty (in events, load, distributed generation, market prices) [52,53,54] and strong dependency on telecommunications that widen the attack surface [55] and may cause undesirable cascade effects [56]. Consequently, the resilience of smart PDN becomes a concern from both electric and communication domain perspectives, as a failure in the telecommunication service may affect the electric service [57] and vice-versa [58]. Recent publications recommend a joint handling of smart PDN resilience quantification as the robustness and adaptation ability of a coupled system are even lower than a single system [56,59,60,61]. However, such an approach needs to build upon a solid understanding of resilience assessment of electric and communication domains when considered distinctly.
The present paper aims to set the ground for future joint evaluation of PDN resilience by reviewing relevant works, centered thus far on electric service, and to a lesser extent on ICT service. Essentially, the type of HILP event is identified from each selected contribution with details in the method used for contingency characterization. Also, the measure of performance, recognized as an enabler for resilience quantification [62], is tracked through this work to explain how it is defined and computed, relying usually on system modeling, or empirical and surrogate models in some cases. In addition, a classification based on the temporal phase where resilience evaluation takes place is proposed, which allows for addressing practical requirements of utility companies. The resilience phase-based approach was linked with different objectives of the assessment, from simple metrics evaluation, to either planning or response for survivability and recovery, achieved through a variety of improvement strategies for which allocation is optimized under the constraint of a limited budget. This bridges resilience studies and economic considerations in order to help stakeholders in investment plan elaboration and crisis decision-making. Aspects of cost, critical load, microgrids, and uncertainty of hazards, load, and distributed generation are discussed to show their high importance, and available tools to date for their involvement in the study.
We extend by this work the wide spectrum of subjects associated with resilience quantification in power networks (modeling and simulation, enhancement strategies, metrics, and extreme events), covered in recent reviews [28,36,44,45,63,64,65]. The main contributions and novelty of this paper can be summarized as follows: (a) focus on resilience assessment of both electric and telecommunications domains of smart power distribution networks. (b) Detailed analysis and classification of performance calculation techniques. (c) Fine-grained categorization of quantitative resilience works based on time of evaluation and target objective.
Finally, despite the considerable number of works analyzed and relatively deep examination of reviewed methods for resilience quantification in smart PDNs, this paper does not claim to be comprehensive in the issues addressed (and related references), but remains complete enough to give a good overall perspective of the research trends and understanding of challenges and opportunities.
This paper is organized into five sections. Section 1 is the introduction. Section 2 introduces the link between resilience and both reliability and Quality of Service (QoS). Section 3 expands on the taxonomy of resilience evaluation methods and proposes a classification of associated models. Section 4 treats the relationship between the objective of resilience study and time of evaluation. Section 5 presents reviewed papers with all pertaining characteristics, observations, and discussions. Concluding notes are given in Section 6.

2. Resilience in Smart Grids

Amid desired functionalities for smart grids lays the need for capabilities like: self-healing, high reliability, power quality, and resistance against various disasters and attacks [50]. Resilience represents a promising approach to meet such requirements, by being able to address network circumstances not handled by widely adopted principles of reliability and quality of service.

2.1. From Reliability to Resilience

Reliability is the ability of an item (component or system) to operate under designated operating conditions for a designated period of time or number of cycles, where this ability can be formulated through a probability [66]. In electrical networks, this is equivalent to maintaining the delivery of electric services to customers in the face of routine uncertainty under operating conditions [67]. Metrics like Energy Not Supplied (ENS), Average Customer Curtailment Index (ACCI), System Average Interruption Duration Index (SAIDI), System Average Interruption Frequency Index (SAIFI), Customer Average Interruption Duration Index (CAIDI) are widely used to describe PDN reliability [68,69]. System operators use such indicators to track and enhance the performance of their networks. These indices are further used by system regulators and system operators in service level agreements (SLAs), in order to define penalty thresholds and ensure that the right compensation is paid based on the experienced outages. Reliability metrics are relevant to assess the impact of recurrent events with available historical records, over which maintenance actions are applicable; excluding major hazards such as severe weather events [70]. Some of these metrics were extended to capture more severe events, where metrics like STorm Average Interruption Frequency Index (STAIFI) and STorm Average Interruption Duration Index (STAIDI) are proposed [71]. However, a demonstration was made that these two metrics are not relevant for resilience evaluation because, when used during a storm, they show large deviation that can be even greater than the values of STAIDI and STAIFI [62].
Resilience is “the ability to prepare and plan for, absorb, recover from, or more successfully adapt to actual or potential adverse events” [72]. Unlike reliability, which focuses on the frequency and duration of failures “event-agnostically,” resilience seeks to further track the dynamics and resources of response, adaptability, and ability to restore. This is relevant to HILP hazards where consequences in the system need to be studied with respect to specific events, as each disruption has its distinguishing characteristics [73]. Thus, the fundamental difference resides in the scale, scope, and duration of events handled: resilience targets events with strong impact in a wide geographical area with long duration of outages, while reliability handles local impact in short duration outages [74].
Despite this difference between the two concepts, mainly due to events each of them tackles, they remain closely related because enhancing resilience or reliability may require the same strategies, with resilience being more general, confirming that being resilient typically encompasses being reliable, but not vice versa [75].

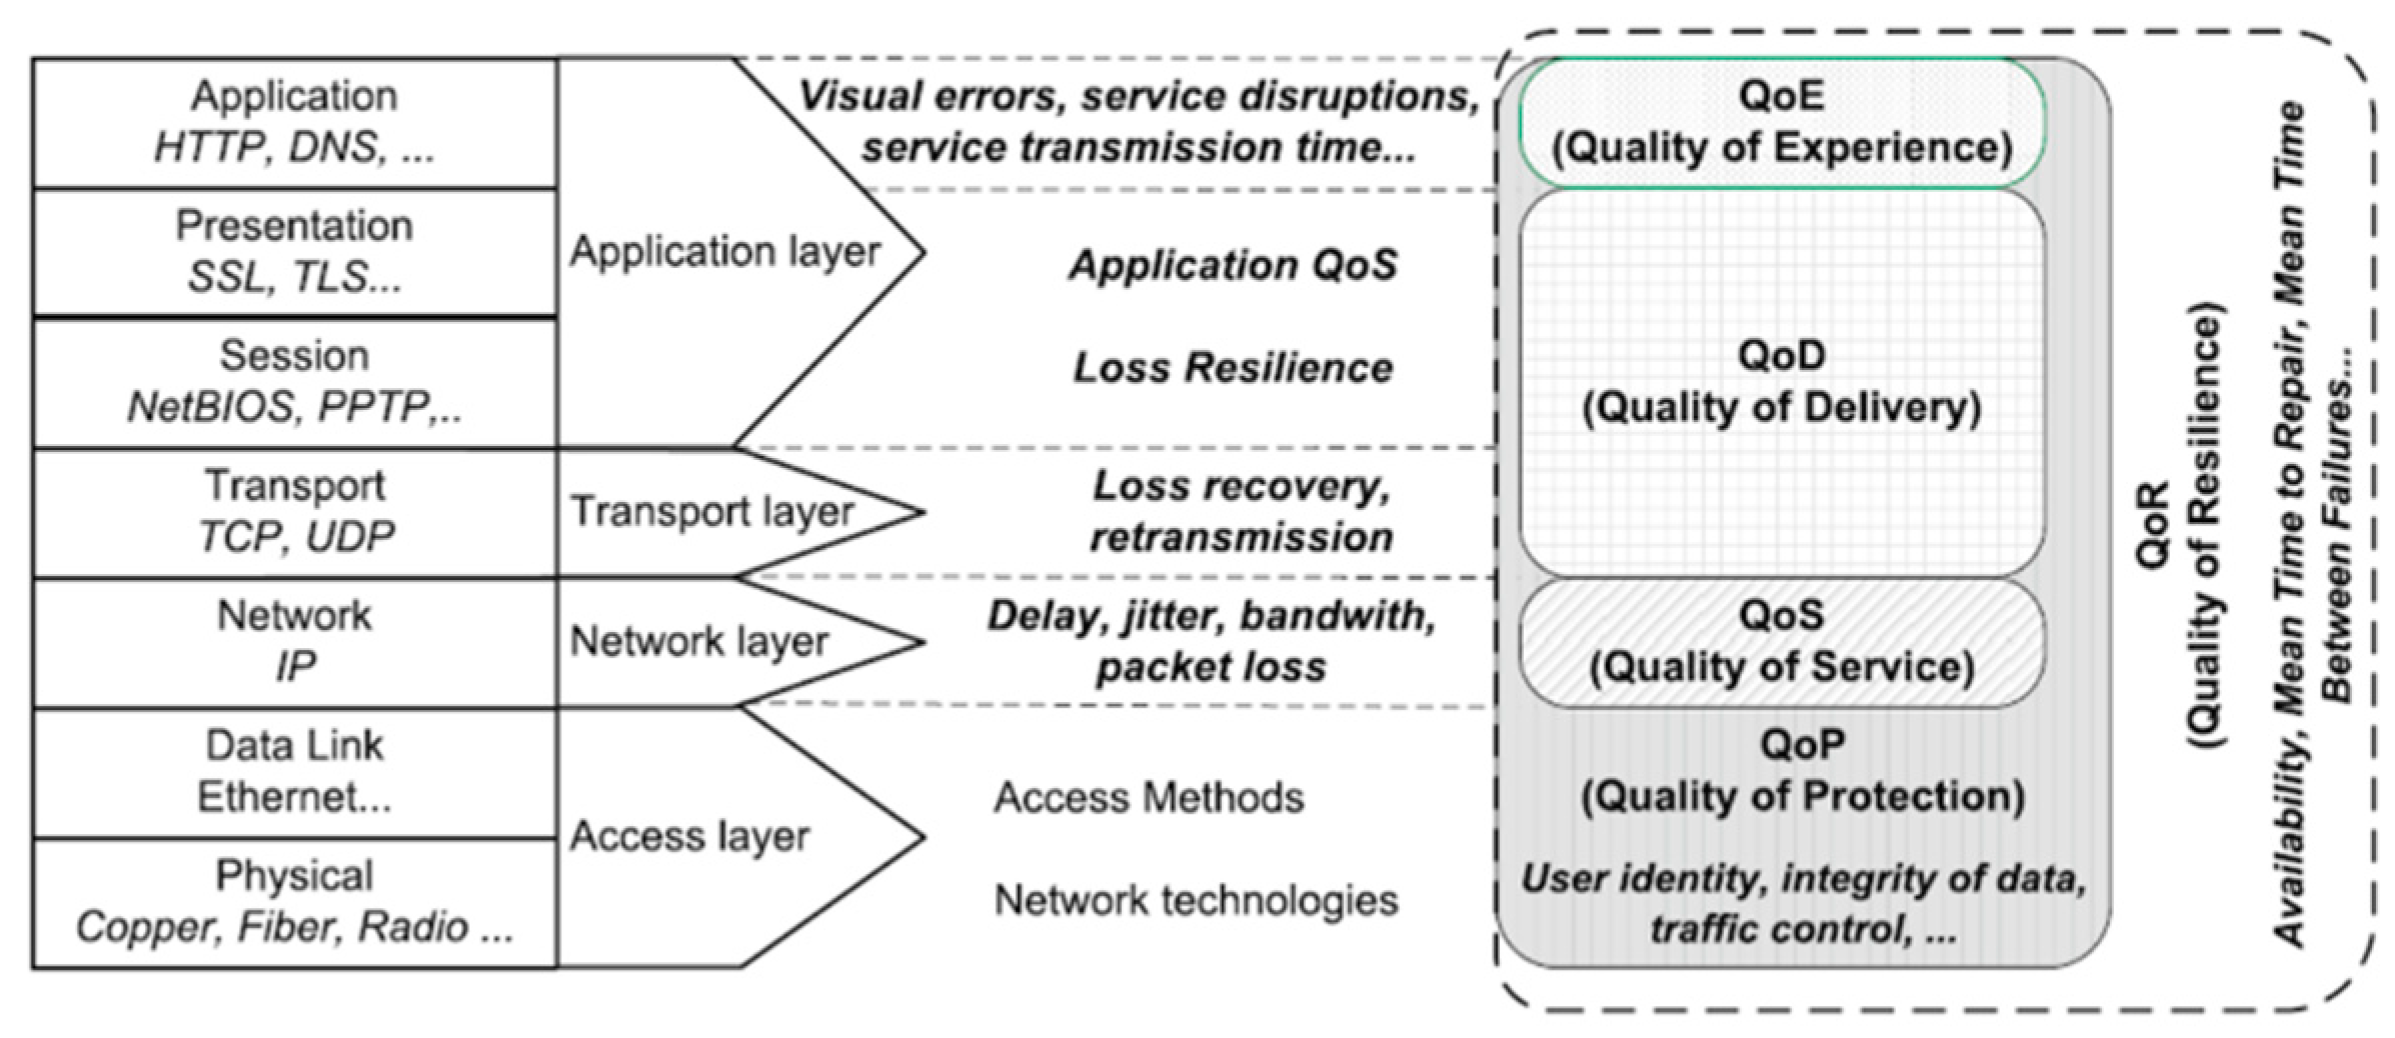
2.2. Resilience and QoS in ICT Networks

ICT networks traditionally rely on QoS metrics to define SLAs [76]. These metrics consisting of delay, jitter, bandwidth, packet loss, bit error rate, and traffic load are performance measures that do not give a comprehensive view of network state. Therefore, other complementary metrics are adopted in SLAs in order to better quantify the system state, namely availability metrics.
In the initial introduction of Quality of Resilience (QoR) in [77], QoS is divided into short-term quality parameters referred to by availability, and long-term quality parameters grouped under QoR. In other words, resilience is considered as an aspect of QoS, as latency or packet loss. However, QoR is presented in [78] as a concept-treating quality at different levels of the Open Systems Interconnection model (OSI-model), including the network level which corresponds to traditional QoS. Figure 1 shows how QoR extends QoS to include other types of quality: Quality of Experience (QoE), Quality of Delivery (QoD), and Quality of Protection (QoP). This is done by considering the additional metrics from each level. QoR is used as a transverse evaluation for all aforementioned qualities. This is done by considering the metrics that describe different resilience stages. From a high-level perspective, we can say that QoR is a shift from client-centric evaluation, conducted using QoS, toward a more general framework that includes the system potential in terms of resources, organizational processes, and humans.
Once again, in both cases above, the need for resilience stems from harsh large-scale events imposing consideration of stress in the system and recovery strategies. Then, despite the slight divergence in terminology that is still the case today, the two concepts go beyond the traditional QoS evaluation, to capture both requirements of customers and enhancement strategies of operators. Nevertheless, the idea that resilience takes in QoS is gaining more attention [75], suggesting that a system cannot be resilient if it does not offer acceptable QoS, but providing acceptable QoS is not the only requirement for a network to be resilient.

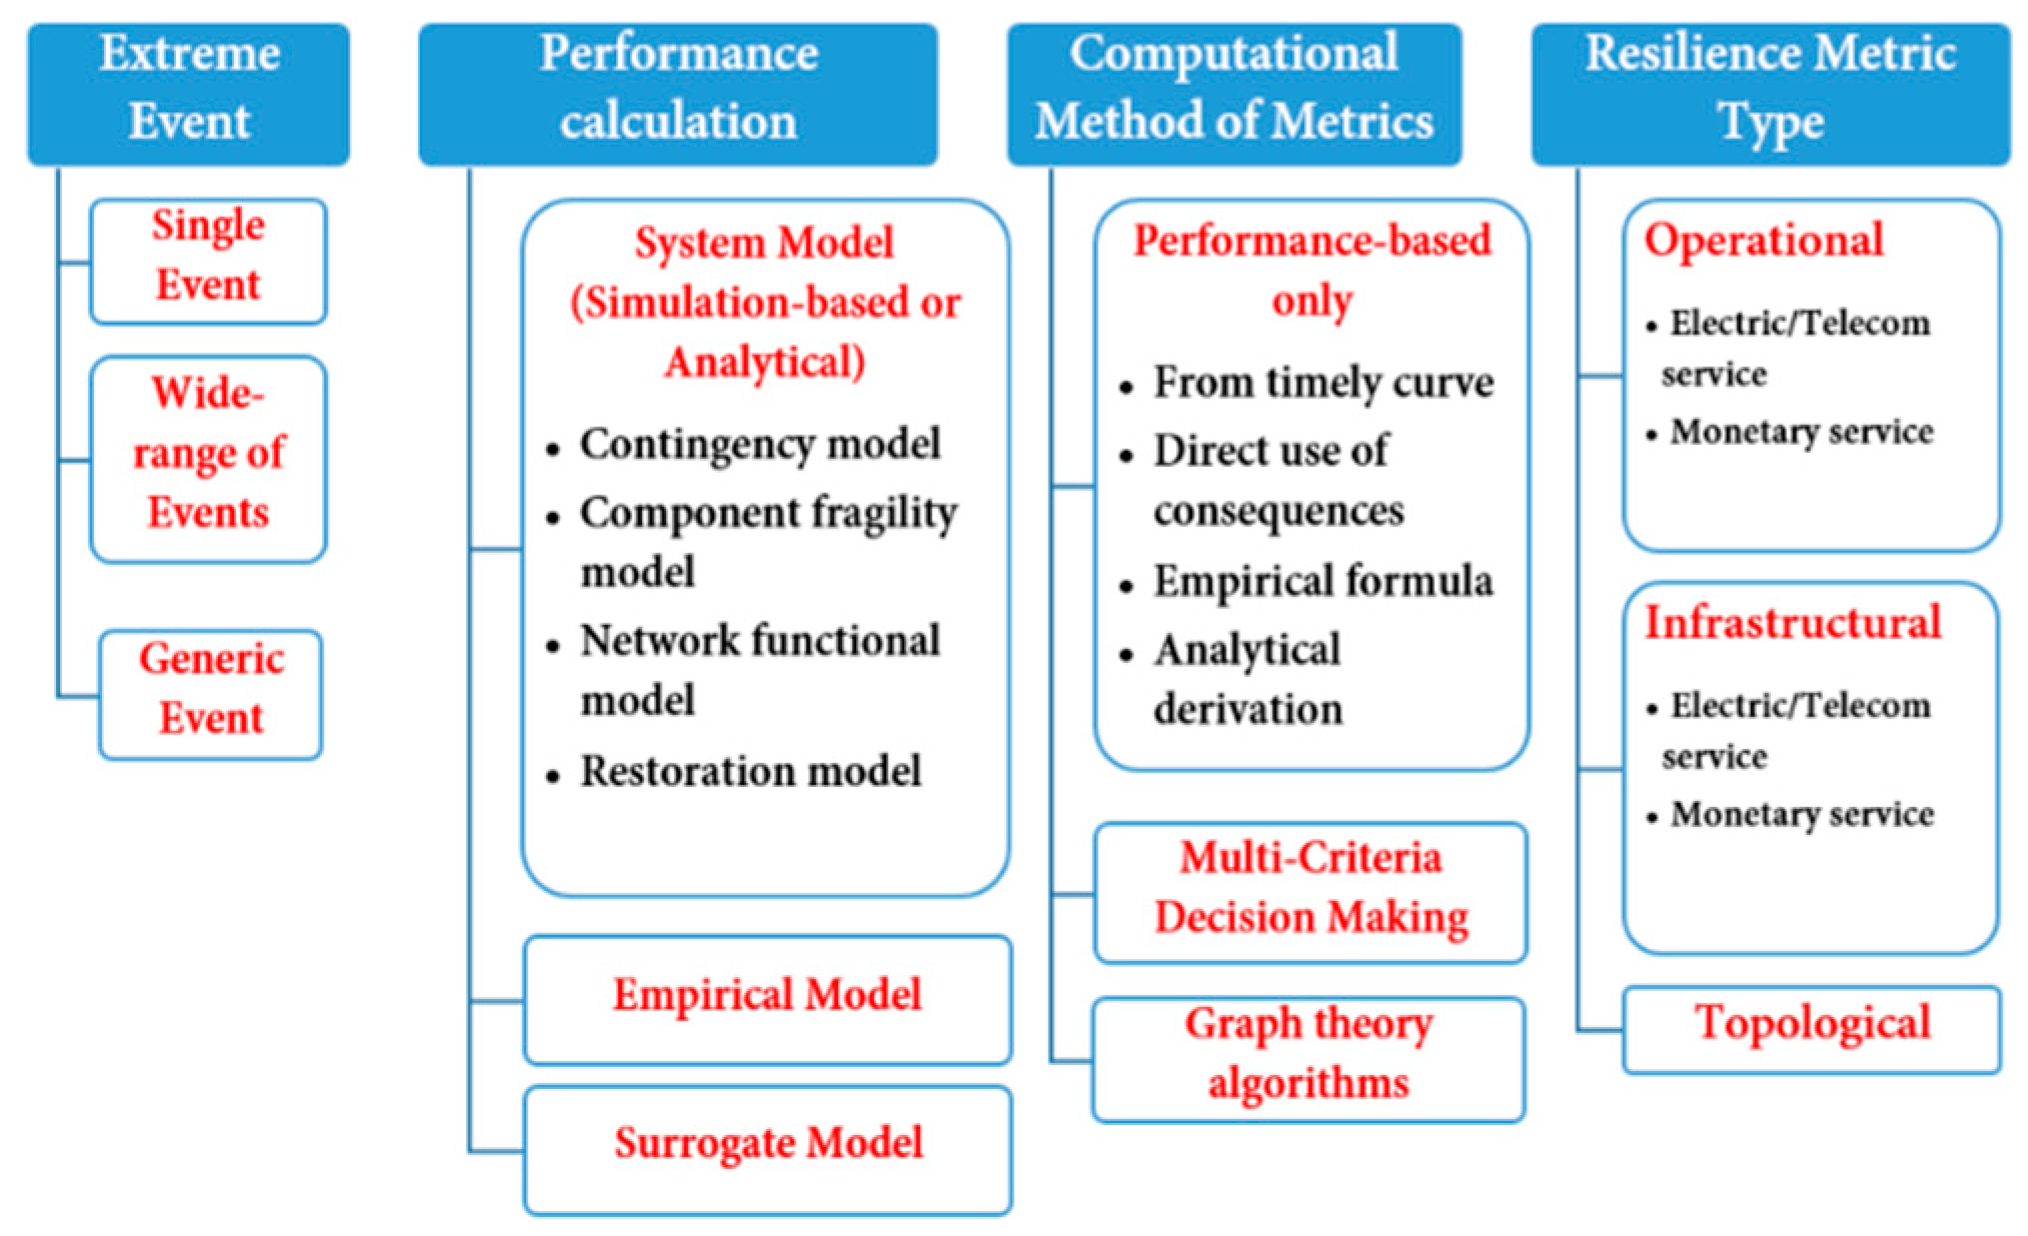
3. Taxonomy of Resilience Evaluation Methods

The panoply of methods proposed for qualitative evaluation of resilience in electric power networks [20,21,22,23,24,25] is not enough to convince critical infrastructure operators in general, and utilities in particular, to adopt the resilience-based design. They are unable to systematically discover hidden vulnerabilities and critical elements [79]. To overcome this, stakeholders need to have a closer, more tangible grasp of resilience, using quantitative analyses which gained huge momentum in recent years. Most of these analyses are performance-based, where performance is defined in various ways in order to fit different participants and study objectives [80]. The fact that almost all works selected in this paper happen to belong to this high-level method of quantification comes to stress the consensus in progress toward the adaptation of this method as a tool for resilience quantification.
In Figure 2, we propose four aspects based on which the state-of-the-art papers on resilience metrics for smart power distribution network could be classified, evaluated, and compared. Some of these aspects will be further elaborated in the later sections. For instance, in Section V we classify the papers based on extreme event handled, performance calculation method, and both type and computational method of resilience metrics. Each of these four aspects is explained in detail below.

3.1. Extreme Event

Given that resilience takes all its meaning when a high-impact hazard occurs [72], it is paramount to classify the works on resilience based on the extreme event(s) they target.

3.1.1. Single Event

Generally, resilience evaluation frameworks are by definition designed to cope with a single (type of) event (like a natural hazard, a cyber-attack, or a physical manmade attack) [67]. Disruptions studied are strong, have large geographic extents, and cause high impacts on the network, that no sequence of events is considered. However, a single event is considered capable to strike at different points in the network simultaneously.

3.1.2. Wide-Range of Events

There are attempts to address multiple events, in order to make developed methods more attractive to use by network operators as they sweep a wide spectrum of failure scenarios [81,82,83]. However, addressing multiple types of hazards is challenging, partially due to the various nature and properties of the hazards. It is often very hard to use a single modeling framework for different hazards (e.g., natural hazards vs. cyber-attacks). Also, the inherent trade-offs between resilience strategies make multi-event studies more challenging, as some enhancement operations can be profitable for a set of events but not for others [84]. Therefore, choosing the set of contingencies to be handled jointly turns out to be challenging and careful attention needs to be allotted.

3.1.3. Generic Event

The focus of some studies is limited to metric design, then authors prefer to render generic the choice of failure that hit the network by directly observing the impact [85,86]. In that case, the system model when considered, no longer needs to cover contingency and component fragility. Indeed, this is a straightforward way to skip the difficulties inherent to disaster impact modeling, but it does leave the designer with a large set of possible scenarios from which a selection of the most relevant ones is not easily made. A well-defined event helps to narrow down the number of possible system failure modes.

3.2. Performance Calculation

Performance, or Figure of Merit (FoM) [87], is a quantity that describes how good the system is at providing services, system operation cost-effectiveness, and the behavior of the system when confronted with internal or external stress. These issues are addressed with different indicators, each of which is relevant to system operator objectives, and can be adopted as a performance measure [35,41,78,88].
Evaluating performance is a key element toward the end goal of resilience quantification. This performance information necessary for resilience metrics computation is not readily available, and designers resort to modeling in order to calculate performance measures. We classify works based on the modeling method that permits obtaining performance indicators. Mention was given earlier to the dominance of performance-based studies in the field of resilience quantification. Even rare works, which consider other aspects of quantification as main enablers [89], resort to the use of performance within their frameworks.
Modeling methods adopted by the scientific community to evaluate performance are described below.

3.2.1. System Model Method

The study of power distribution or telecommunication networks requires, as with other critical infrastructure, modeling the system with all its internal and external characteristics [79,90]. Two broad families of modeling are usually embraced for performance evaluation: analytical models, and simulation-based models [61]. Analytical models rely on mathematical concepts like graph theory, percolation theory, worst-case analysis, Markov chains (or processes), and statistics [91,92,93,94] to represent the structure and behavior in any network and interactions therein. Theoretical analyzes can also be used for the threat, fragility, and recovery characterization process. Then, rigorous formulation is conducted using multiple mathematical tools.
Simulation-based models basically have the same objective of system representation analytical models, but with the intent to have less abstraction and more fidelity to real networks. To do so, simulators are developed [95,96,97], based on the analytical approaches, however with many practical considerations which are usually too complex and not tractable by mathematical formulation. Thus, it is quite common to use simulation-based models as a validation method for the solution obtained by analytical analysis [79].
A deeper look at the modeling techniques explained above shows that both are comprised of four distinguishable sub-models [35]. Note that this further granularity allows, in some cases, hybrid analytical-simulation models, as each sub-model is constructed analytically or by simulation, independently from the others. These sub-models are:
  • Contingency model: describes hazard profile, which is expressed in terms of characterizing parameters. An example would be to have a statistical profile that gives the probability distribution of wind intensities [41] or meteorological data to calculate the amount of ice accreted on conductors and overhead lines during an ice disaster [91]. Another widely considered example is cyber (or cyber/physical) attack scenarios [98,99]. In some cases, there is deep uncertainty about the threat, then worst-case analysis [100,101] and less conservative approaches like robust optimization [43] are the most suitable to model such events.
  • Component fragility model: represents the sensitivity of system components to a threat. This goes hand in hand with the contingency models, as fragility curves or other ways of representation are developed with respect to event profiles [41,91].
  • Restoration model: complements previous contingency and fragility models in order to yield threat impact quantification [102]. Focus is in recovery times which can be estimated using mathematical programming, fuzzy logic, statistical methods, specialist expertise, random distributions, or even heuristic approaches in some cases [28,103].
  • Network functional model: functional models in use range in complexity from pure topological approaches to physics-based models of AC power flows [104]. They describe system infrastructure, topology, services, and all related dynamic interactions. This is present in all system models and constitutes their core element, because it replicates the structure and all functions found in real networks as much as possible. Examples include percolation theory and complex networks [92], graph theory analysis [21,105], power flow [14,41], agent-based information traffic flow [106], and many simulation software that emulate network behavior [82,96].

3.2.2. Empirical Model Method

Post-recovery surveys are conducted by network operators, government agencies, and market regulators to assess the impact of extreme events in the system and efficiency of implemented enhancement strategies, saving results as historical records [14]. Collected field data are so informative that it can be used to construct models by which performance is calculated [31,107,108]. Note that other sources of information for such models are network management systems, like outage management system (OMS), distribution management system (DMS) in electric network, core network in telecommunications, as well as expert judgements [94]. This kind of models serve as baseline for previous analytical and simulation-based representations [61].

3.2.3. Surrogate Model Method

A relatively new approach to performance evaluation in smart grids is the introduction of surrogate models, borrowed from the evolutionary computation community [109]. Surrogate models aim to reduce runtime and complexity of analytical and simulation-based models while maintaining a high degree of fidelity. The idea is to bypass conventional system modeling (where the name “surrogate” or “meta-model”) using techniques such as neural networks [110,111], and kriging methods [112]. A simple example is a machine learning (ML) agent taking as input system topology parameters, hazard characteristics, area climate, and topography; and outputs performance measures. The system model is replaced by an implicit non-linear multi-variate function implemented by the ML agent. The biggest challenge is to choose the right inputs (predictors). A Polynomial Chaos Expansion-based method is proposed in [113] to conduct risk analysis for rare events, which is projected by the authors to have an extension to resilience assessment.

3.3. Resilience Metric Computational Method

Once the performance is calculated using one of the methods described before, it will be used to compute resilience metrics. The goal is to provide the decision-maker with resilience information in the most instructive way.

3.3.1. Service and Assets Performance Only

Resilience computation is solely based on performance measures obtained from the operational services and infrastructural assets of the network. Metrics can be calculated from a curve describing the evolution of performance with time [41], using a justified empirical formula [114], following an analytical derivation, or taken directly as the consequences observed from the event [80].

3.3.2. Multi-Criteria

This method combines various parameters (such as service performance, topology, topography, and event characteristics) to output resilience metrics. Different analytical tools are used to aggregate all these parameters into final metrics [67,92,115].

3.3.3. Graph Theory Algorithms

Resilience computation is uniquely based on performance measures obtained from network topology and calculated using graph theory algorithms [116].

3.4. Resilience Metric Type

There are many possible angles to categorize and classify metrics based on their types [45,63]. The choice is made in our classification to select simple categories, which link intuitively to metric computational methods presented above.

3.4.1. Operational Metrics

Metrics that use performance as described in terms of functional service (electric, telecoms) and associated monetary costs. Expected lost load [24], supplied energy [117], and recovery duration [14] are examples of performance measures used by this type of resilience metrics.

3.4.2. Infrastructural Metrics

Metrics that use performance as described in terms of network infrastructure (electric, telecoms) and associated monetary costs. The number of affected components [41,101] (and associated costs) is an example of a performance measure used by this type of resilience metrics.

3.4.3. Topological Metrics

Metrics that use performance as described in terms of network topology and static connections between different elements such as measures of connectivity, betweenness, and redundancy [116].

4. Resilience Quantification Objectives

Four broad classes of resilience metrics are generally adopted: (i) average performance metrics, (ii) integrated multi-phase metrics, (iii) time-dependent metrics, and (iv) probability-based metrics [118]. In the case of a HILP event, probability distributions are often not available, whereas the other three classes depend on the measure of performance in the network. Thus, a reasonable statement is that an ideal evaluation of resilience may consist of a complete tracking of the time-dependent performance function P(t). This way, network operators can have the value of performance at any instant for the complete event duration. However, despite the apparent dependence of P(t) in time, performance function does not necessarily change with time if it is not for the extreme event which hits the system. In other words, performance function depends on many parameters including hazard intensity, system preparedness, resilience strategies in hand, and priority decisions made, all of which cause network state to change. This sends back the problem of resilience multi-dimensionality, which makes developing closed form derivation for resilience function challenging and hitherto out of reach. Performance-based methods try to include all previously mentioned parameters and additional ones into a temporal curve describing the performance evolution of the network. It can be said that many resilience features are embedded in a performance curve as shown in Figure 3, because the construction of such a graph takes into consideration all factors intervening during a catastrophic contingency.
A salient advantage of such an approach is to have the temporal follow-up of network state which allows decision-makers to be in a best-informed posture. Four main phases can be distinguished, among which some can be further detailed into sub-phases:
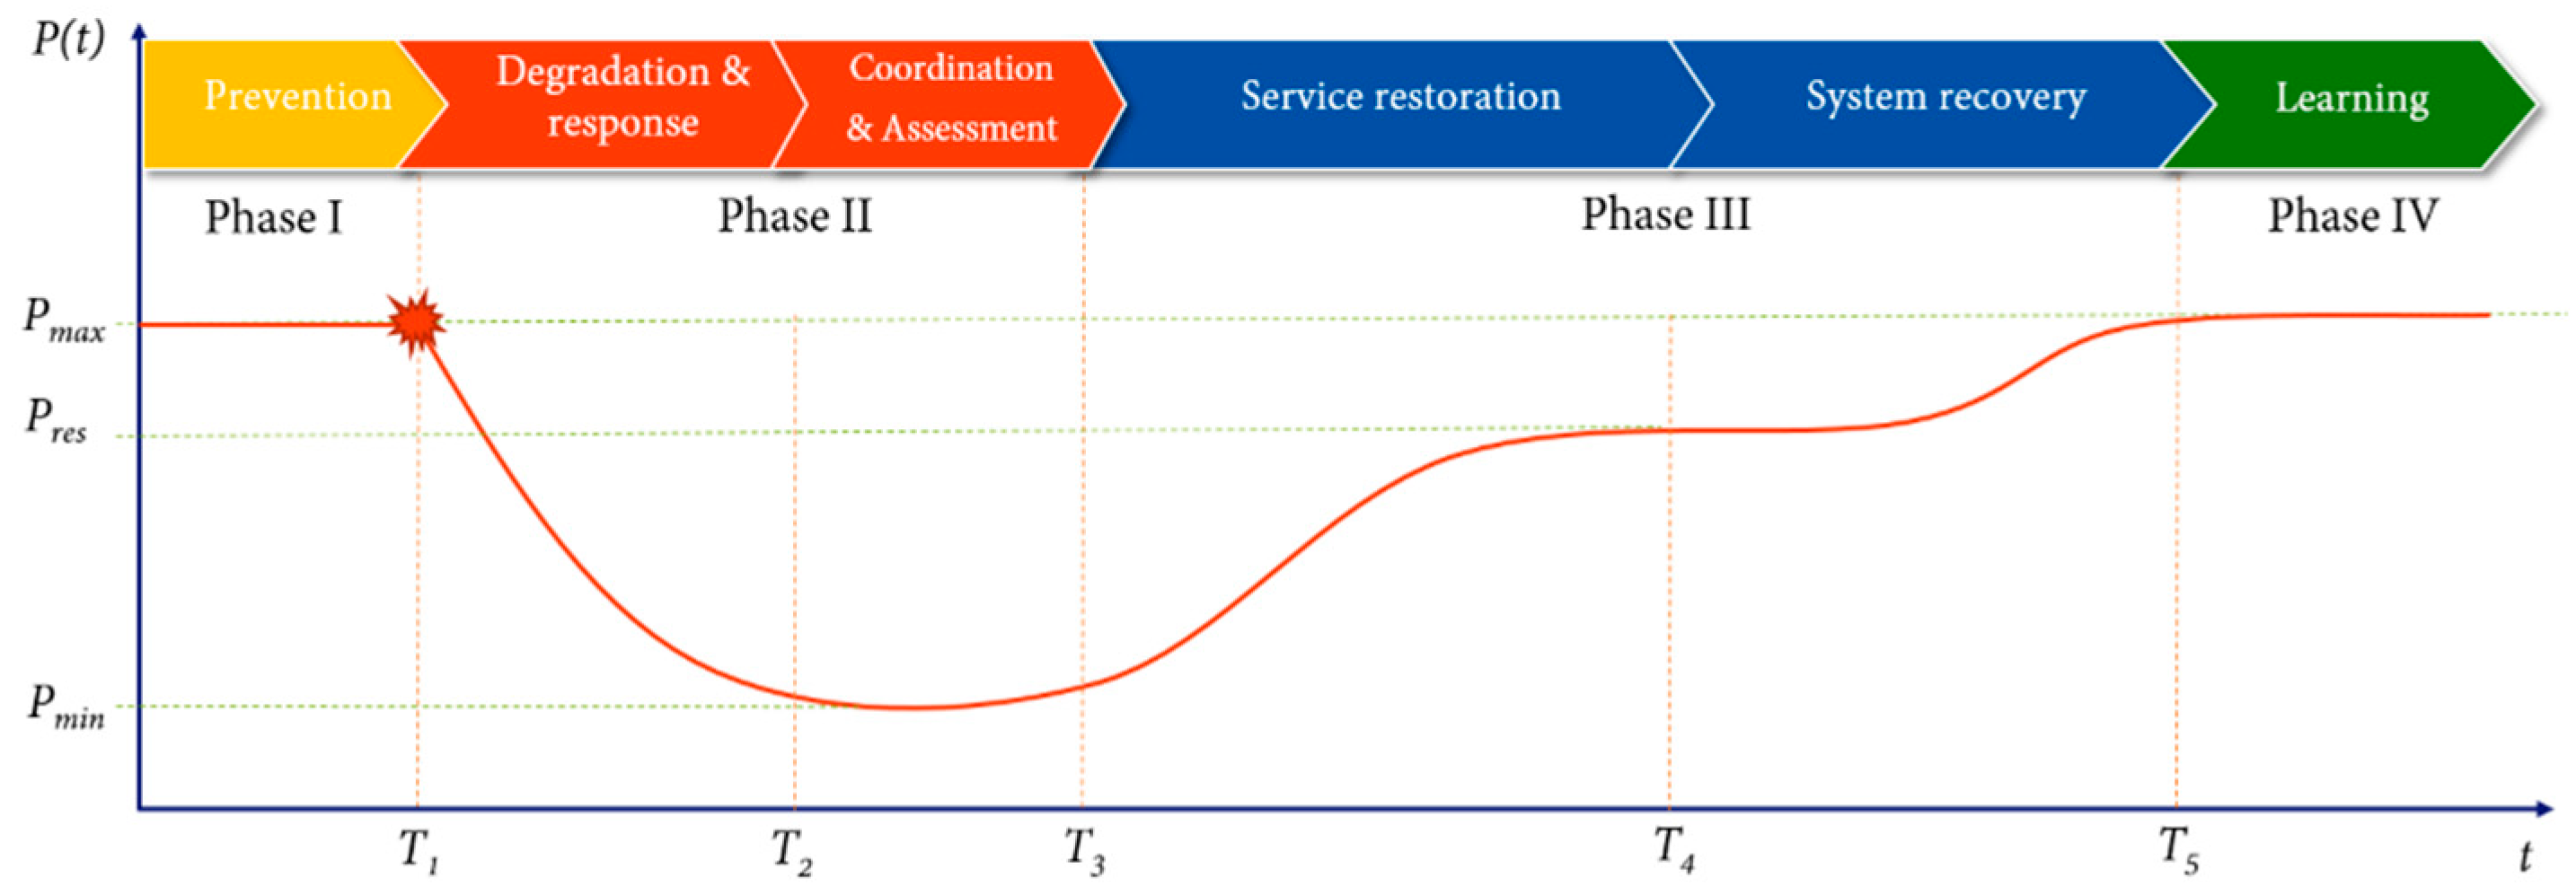
  • Anticipation phase (phase I): Represents the time period before the event occurrence, when performance is at its nominal level. Monitoring information, impact projections, and historical data when available are used for prediction studies, and all possible defensive measures are implemented. This serves particularly in the case of multi-hazard management where risks and vulnerabilities to each event are investigated. For single hazard resilience analysis which is the most relevant in the case of HILP event, this phase is not considered and a post-event resilience study is adopted. However, this also refers to the period of normal operation where reliability and risk management for recurrent failures can be conducted, which participates in system resilience, because a resilient system needs to be first as reliable and low-risk as possible. In addition, security measures for protecting the system and preparing it to withstand malicious behaviors are implemented at this stage [96].
  • Mitigation phase (phase II): Once an extreme event hits the network, reliance is on system robustness, reactivity, and absorption to minimize the effect on services and infrastructure. Adding to some preparation policies that could be anticipated, many dynamic actions can be implemented to reduce the aftermath, like distribution automation actions, load shedding, and monitoring actions in power distribution networks or customer prioritization in telecom networks. These actions can withstand performance degradation that is in place, or serve to coordinate between entities in order to achieve an accurate assessment of consequences and prepare next crisis management steps.
  • Recovery phase (phase III): Unlike short-timed low impact incidents where maintenance actions are achieved relatively fast, in major events, recovery actions can require anywhere between several weeks to months [119]. The main reason is that, given the safety of emergency crews and logistic constraints, restoration is conducted carefully and waits for the reduction in hazard intensity, or more generally identification of restoration windows. Priority is first given to service restoration where all alternative (even temporary) ways to provide services are explored and deployed allowing to regain an intermediate level of performance. Complete recovery will take more time and effort as it involves mostly infrastructure catering which turns out to be very challenging.
  • Learning phase (phase IV): This phase is less considered than the two previous phases in quantitative resilience frameworks, generally with the argument that resilience is best examined in face of exogenous threats [120]. The post-recovery phase should still be looked at closely in order to draw conclusions about damages experienced by the network and how various implemented policies helped to alleviate consequences. Data collection through field surveys and supervisory management tools enable improvement in system performance and enhancement in preparation for upcoming extreme events backing the vision for a sustainable network.
Many works [13,27,45,63] explore each of these phases with slightly different denominations. Here a generalizing description is adopted where the four above-mentioned phases are considered, with mitigation and recovery divided each into two sub-phases in order to better explain all involved mechanisms. Resilience quantitative frameworks can be assessed based on phases they handle [64]. The more phases taken into consideration, the better the insight into system operation during extreme events. Furthermore, the layout can be used to seek answers for the following questions: When is resilience evaluation conducted and for which reason?
Figure 4 distinguishes time instants at which resilience quantification can be conducted, and objectives of this evaluation. The former here orients/guides/steers the latter, because for example, an operator who aims to plan investments for his network will most likely opt for pre-event evaluation, while another who only wants to see the impact induced by a contingency in his network may adopt post-recovery damage evaluation. Knowing “why” resilience is to be evaluated serves as a guideline to choose “when” it should be done. Without loss of generality, resilience evaluation can be induced from the performance curve in Figure 3; so it is important to know when system operators can get such a representation. Three options are available:
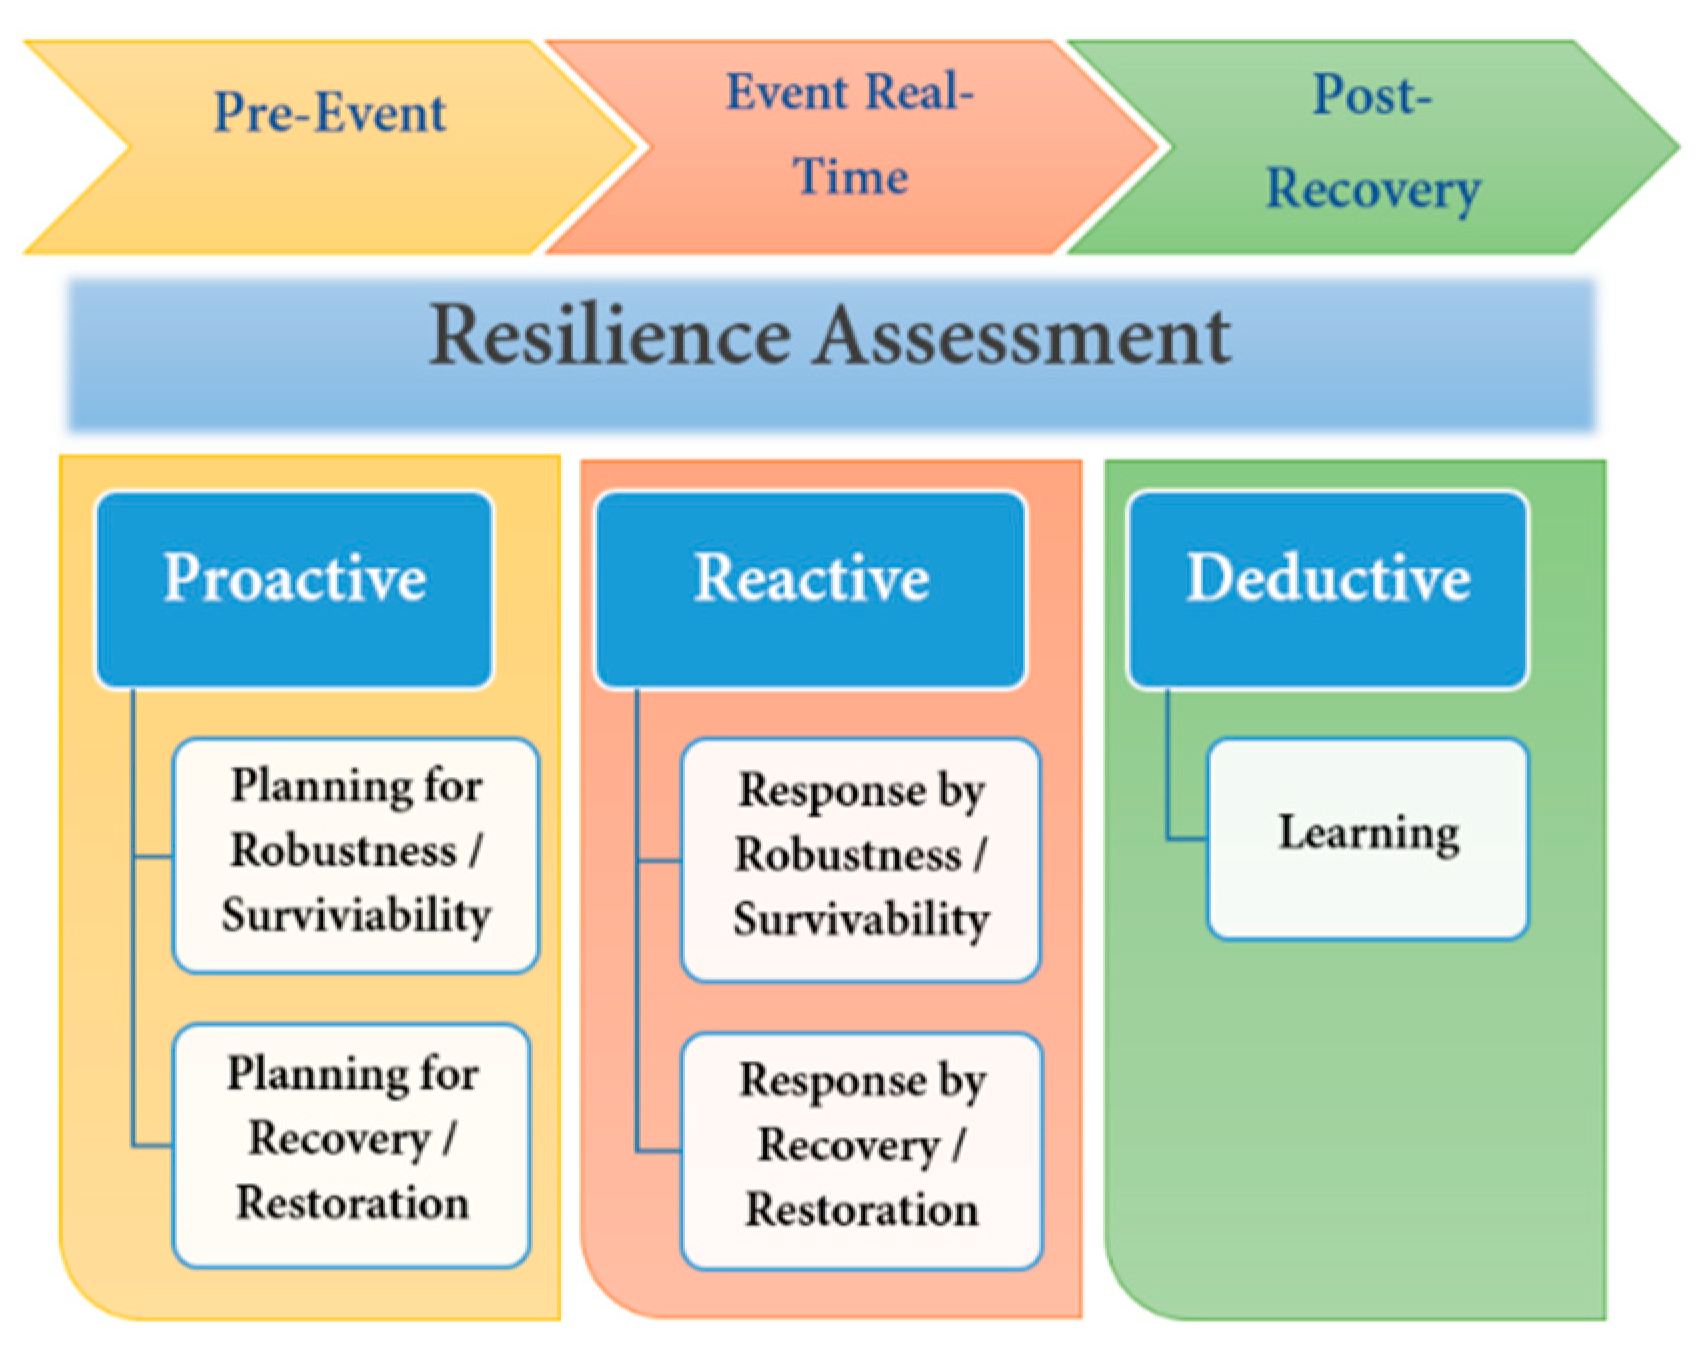
  • Proactive evaluation: The procedure in this case is to drive pre-event studies with the goal of obtaining resilience indicators before contingency happens. The outbuilding is in prediction data, recommendations of experts, supervision alerts, and historical records. However, for HILP anomalies, little information is available, then designing preventive measures appeals for simulation tools, emulation, and analytical models which help to make projections for the impact that will be borne by the network in face of uncertain events.
Once metrics are computed, they can be used to make informed decisions about resilience strategies to implement in order to minimize the impact and speed up recovery. In other words, the output of this phase is planning schemes which enhance robustness, survivability, restoration, and recovery of the system that can be summarized in the concept of resilience. The prominent advantage of a proactive evaluation is the ability to look-forward that allows foreseeing what is coming. On the other hand, the large number of possible contingency scenarios and little relevant data cause low-confidence results.
  • Reactive evaluation: Quantification is carried out as the event happens, meaning that resilience metrics are computed on-the-fly, and policies adopted to cope with severe hazards are taken from the inherent reaction capacity of the system without support from pre-event recommendations. Metrics are calculated as the event goes for the two broad phases of robustness and recovery. In such real-time setup, information that can be gathered is realistic and narrows down failure modes space. However, the flexibility margin can be very tight because the HILP event hits the network by surprise while no anticipative actions are in place. There are no good or bad choices between proactive and reactive evaluation, they are both suitable for resilience analysis and can be complementary. The goal is to find a balanced fit for a given use case [121].
  • Deductive evaluation: When resilience metrics are computed at the end of a HILP disturbance, they mainly serve to draw conclusions about how the system handled an external event [81,107,108]. Results of this are intended to point out axes of improvement for future reference in similar extreme situations, and can also be considered as performance evolvement baseline. Further, the output of such post-recovery evaluation can be fed to the pre-event phase for hazards in the future, closing a kind of a cycle with the evaluations presented above.
Proactive approaches are dominant in resilience engineering, especially when considering the fact that in some cases the reactive approach is subsumed therein. The combination of the two is simply referred to as proactive approaches.

5. Literature Review

The present work, on state-of-the-art resilience quantification of smart grids at the distribution level, is conducted with three main objectives:
  • Understanding architectures and models involved in resilience quantification methodologies;
  • Identifying all considered objectives behind resilience quantification;
  • Explaining implementation specifics that directly relate to the practical application of the proposed methods.
The selection process of reviewed papers is briefly introduced in the following section, then a detailed discussion and results are presented.

5.1. Paper Selection Process

With the aim of being as comprehensive as possible, a wide swipe of various digital libraries was carried out: IEEE Xplore, Science Direct, Scopus, Elsevier, Google Scholar. The review is limited to the last six years (2015 to 2020 included), and search expressions comprised various combinations of specific words: resilience, quantification, evaluation, assessment, metrics, indicators, measures, smart grid, distribution network, ICT network, (tele)communication network.
A first selection step consisted of reviewing abstracts of all found papers (in the order of several hundreds), and shortlisting works which:
  • Analyze the power network at the distribution level, or the ICT network of power network, and;
  • Present quantitative analysis of resilience, with the proposed metrics.
This resulted in a total of 34 pre-selected papers, 10 of which were excluded from this survey as they were recognized after deep analysis to not entirely satisfy the two selection criteria. Thus, the final selection included 24 papers, 18 of them targeting distribution power network [122,123,124,125,126,127,128,129,130,131,132,133,134,135,136,137,138,139], and 6 for grid ICT network [140,141,142,143,144,145]. This set of works was evaluated based on proposed categorizations in Section 3 and Section 4.

5.2. Power Distribution Network

The set of 18 papers that analyze resilience quantification from the perspective of PDN electrical service is summarized in Table 1. In addition to the provided implementation details, the references are assessed based on extreme events and methods adopted for performance calculation. Metrics type and computational method are not shown in Table 1 for convenience considerations.

5.2.1. Performance Calculation

Performance evaluation under disruptions is the milestone of resilience assessment, where system modeling-based approaches prevail. Still, in [130] and [134], field data are used to calculate the resilience of recent natural disasters like: 2010 earthquake and tsunami in Chile, 2011 earthquake and tsunami in Japan, 2011 earthquake in New Zealand, and hurricanes: Isaac (2012), Sandy (2012), and Ike (2008). This fits post-recovery evaluation given the availability of the information a posteriori [130]. This is also a useful experience for upcoming events when included in a proactive analysis for response and restoration [134]. An alternative to system physical and operational modeling is exposed in [129], where a machine-learning-based agent is leveraged to compute the number of outages, the outage duration, and the number of unserved customers; from clusters of focal variables used to estimate a multivariate resilience manifold.
Other than these options, the reviewed literature stipulates using system modeling due to a lack of data in the case of HILP extreme events. One can recall all aspects of the model: contingency, fragility, restoration, and functionality; which are achieved in different ways. Works in [127,128,136,137,139] suggest using simulation-based frameworks to implement the quantification procedure, while [123,124,131,135,138] opt for complete analytical formulation. A good compromise is found in [122,125,126,132,133] with a hybrid analytical-simulation modeling, for example [133] where the functional model is experimental, and remaining contingency, fragility, and restoration models are posed as optimization problems.
In the case of generic events, the model omits handling contingency and fragility, because direct impact scenarios are applied in the study; except for [137], which needs Matlab graph analysis libraries to compute quantities that contribute to the failure scenarios selection.

5.2.2. Extreme Event and Time of Evaluation

A closer inspection of Table 1 shows that in some cases the restoration model is not specified, and the explanation is given in the electric service portion in Table 2. These works do not target recovery and restoration capabilities of the distribution network, as they proactively plan for survivability [123,132], react to an event uniquely by resilience assessment [139] and a damage minimization response [138], or even drive a post-recovery study like in [127]. This illustrates, as discussed in Section 4, how the objective of resilience quantification instructs the choice of system model. It goes without saying that planning and response cells in Table 2 include resilience assessment as a first step and enrich it by further use of the obtained metrics.
By steering interest toward when resilience metrics are obtained, the concentration of resilience quantification in the pre-event phase can be pointed out, corroborating the preventive nature of such studies and their contribution to planning for unseen events. However, real-time evaluation gained some interest [133,136,137,138,139] and offers valuable information used on-the-fly to monitor and enhance the distribution network resilience. Next, after recovery from a HILP hazard, works in [127] and [130] survey the network for lessons, with [127] offering more learning opportunities as empirical advanced experiments are done for moderate and heavy damage scenarios.
Natural hazards catch most of the attention in present PDN resilience research due to various recent catastrophic events which raised awareness among the government agencies, regulators, and network operators about the damage that a distribution system may incur. Generally, a resilience study handles a single event, which makes the setting dependent on considered specific characteristics. Table 1 shows that some resilience frameworks are designed for a wider scope so as to tackle a set of these natural events [130,131,132,136]. This renders anomaly modeling challenging, albeit feasible through a knapsack problem [131] or extended N-k network interdiction model [132]. Even so, the model should be readjusted whenever applied to a specific contingency. To handle multiple events simultaneously, [136] derives a code-based metric by computing network resilience several times for all possible natural hazards. Even though the approach is based on an empirical formula and more work should be done to justify the choice, it is an easy-to-understand measure and introduces an interesting concept of the “service potential” of the network.
With the exception of [133], cyber or cyber-physical (CP) attacks are put aside in this portion of the literature despite increasing damage induced even in physical electrical infrastructure, but this apparent neglect remains understandable due to the focus of this section on electric service.

5.2.3. Uncertainty

Uncertainties in HILP events, intermittent power generation (with DER), load, and energy markets are a major concern for resilience assessment [52,53,54]. In [123], the spatio-temporal uncertainty of a harsh weather event and wind turbine generation is managed through a probabilistic approach. Authors in [134] assume a probability distribution for uncertain parameters in their resource allocation optimization problem (event parameters and resource allocation effectiveness parameters), by modifying the objective to the expected value of resilience. Likewise, in [135] a stochastic scenario-based optimization is adopted to cope with event uncertainties. However, for deep uncertain events, little to no data are available, turning interest toward robust optimization in both [132] for multi-stage and multi-zone natural hazard, and [138] for load and renewable generation. Also, simulation tools in [128,139] take into consideration the uncertainties in HILP events and intermittent power sources, respectively. Uncertainty is sometimes handled implicitly as it is inherent to HILP events without clear and well-defined formulation, like in [125].

5.2.4. Critical Load

An essential distinguishing feature of resilience is the ability to establish a differentiation between loads. For instance, in electrical networks, groups of customers are prioritized during emergencies, and will be spared from load shedding strategies due to their relative importance compared to other loads. Analyses in [128,135] assign weights to loads based on the priority they have during the load-shedding procedure or the restoration phase in case of a strong event which affects even critical nodes. Resilience evaluation is however done on impact over the entire network. Works such as [124,127,131] take it a step further by evaluating the resilience metrics for the whole system on the one hand, then on the other hand only for critical loads, giving a deeper insight into the network dynamics during the event. Finally, frameworks in [126,136,137,138] focus mainly on the critical load, as priority rankings are considered during curtailment and recovery stages, and resilience metrics quantify the impact in critical units.

5.2.5. Metrics Computation

As said before, performance assessment is an enabler for resilience quantification. Performance can include network topological characteristics and human factors, but it is mostly associated with service operational aspects defined in various ways: number of disconnected users [122,127,129,134], probability of lines failure [123], power from the main grid [123], power from distribution generation [123], supplied/connected load [124,126,128,130,131,135,136] (or equivalently load shedding [122,123,126,127,132,133]), critical supplied load [124,131], total customer-hours of outages [127], total customer energy not served [122,125,127], outage duration [129,130,134], number of outages [129], loss of voltage and frequency regulation [133], load control and islanding [133], probability of source availability and penalty [137], total forecasted load [138], and current flow [139].
A straightforward approach suggests considering displayed performance indicators as resilience metrics [122,123,127,128,129,132] or proposes a justified empirical formula [136] that concocts performance into resilience. The dominant technique is to build a representation of performance (e.g., time curve) and use it to extract indicators, as in [122] where an index of resilience is proposed by tracking the number of LV customers not served. This results in a time-dependent index which can be used in different phases illustrated in Figure 3. With the same dynamic, [138] introduces an index calculated periodically as the ratio between the level of priority (or critical) load and total load. Moreover, authors in [124] propose to compute multiple phase-specific indices for vulnerability, degradation, and restoration efficiency, all from a timely curve of supplied load. This is then supplemented with a resilience index, which covers the whole event horizon. The same tendency is observed in [128] where the load expected maximum loss, interruption rate, restoration rate, and the recovery rate are evaluated. In relation to this, works in [131,139] present fewer details on phase, but still offer the possibility to distinguish, in a broad sense, between survivability and restoration. A novel approach is highlighted in [135], where the percentage of loss load is proposed as a resilience metric, explicitly distinguishing in its terms loss of load in each single resilience phase.
However, unlike the above phases fine-grained analyses of resilience, studies in [126,130,133,134] opt for embedding the entire resilience information in a single metric, based on the inverse of power loss during an extreme typhoon event in [126], the ratio between up-time and event time in [130], loss percentage in [133], and combination of average loss and recovery time in [134]. This offers the advantage to be more attractive for DSOs as the framework is simple and less cumbersome, but it should be handled carefully to not miss tradeoffs that exist in resilience assessment. A good example is illustrated in [130], where resilience is calculated as the ratio between up-time and total event time. Attention was given to emphasize that this measure is defined for a single node, embodying another kind of granularity different from the one offered by multiple metrics for different phases.
Poudel et al. [125], extend a risk-based metric, value-at-risk (VaR) which calculates the maximum loss expected over a given time period and give a specified degree of confidence. The proposal is conditional VaR (CVaR), defined to calculate the expected resilience loss due to probabilistic threat events, conditioned on the events being HILP. This bridges traditional risk management and all-phases resilience study.
Topological characteristics are considered in [131] in the form of node degree. Bajpai et al. [137] make advanced use of the modeling graph, by proposing a multi-criteria decision-making (MCDA) approach which takes a set of inputs, among which performance and topology parameters, and aggregates them into a single resilience metric using Choquet Integral.

5.2.6. Resilience Strategies

Table 3 summarizes the different implemented measures to enhance PDN resilience. Infrastructure hardening, energy storage, and distributed generation resources are intensively explored owing to their wide deployment and availability. In addition, both distribution automation and network reconfiguration (which can be manual or automatic) contribute to enhancing the robustness and adaptability of the network, and enable very efficient recovery. It can be seen thereby that all works from Table 2 that handle recovery either in pre-event, or event real-time, implement one or both of these two strategies. Contribution in [128] develops a set of probabilistic metrics that capture features and a detailed process of automatically locating, isolating faults, and restoring the service to customers in distribution systems. More precisely, the proposed algorithm devises a switching sequence and calculates load interruption when dealing with a large number of switches in large-scale distribution networks. Despite promising results to boost resilience, attention should be paid to the level of automation to be introduced in the network, because it can produce the inverse effect in rare events [146].
Various smart grid functions of improved safety, self-healing, high DER penetration, and active load control can be enhanced using microgrids [147]. Microgrids (MGs) are in some cases operated in parallel with the main distribution grid, where the possibility to have their separate resilience analysis [30,148,149], meaning that MGs can be taken as a testbed to illustrate the applicability of the proposed resilience quantification [124,136,137]. In another approach, MGs are adopted as a resilience strategy that can be enabled in case of a disaster through islanding technique [150,151], thus the need to schedule the formation of MGs and associated DER dispatch and remote switches operation [133,138]. Further resilience benefit is achieved when multiple MGs are interconnected, given a better situational awareness conveyed between networked grids and eventually sharing of distributed resources [30,127]. Contributions in [124,127,133,136,137,138] are only a small part of the increased interest in MGs for distribution grid resilience enhancement [65]. In a general sense, resilience strategies are in some cases adapted only to certain disruption, and can be even a shortcoming during different circumstances [30]; thus, network planner needs to conduct a general study which includes all possible anomalies and try to manage all the tradeoffs therein when it comes to implementing resilience enhancement strategies.

5.3. Grid ICT Network

The resilience of PDN communication service is analyzed in [140,141,142,143,144,145] and a summary is given in Table 4. Again, classifications are used as in Section 3 and Section 4 to review these works.

5.3.1. Performance Calculation, Resilience Metrics, and Extreme Event

Figures of performance (FoP) defined for ICT system in distribution grid are different from the ones presented before for electric service. Both [142,144] adopt simulation-based modeling to set the ground for resilience quantification. The former builds upon the ad-hoc nature of wireless sensor networks (WSNs) technology that can be used to support metering infrastructure for redundancy and replication, therefore the use of a WSN simulator to evaluate various routing protocols (assumed 300 nodes) based on five performance measures: average delivery ratio, energy efficiency, delivery fairness, average throughput, and delay efficiency. Then, all these are normalized and provided as an equiangular polygon where each performance metric is presented by an axis. Resilience metric is taken as the area of that polygon, so the wider it is, the more resilient is the routing protocol against selective forwarding attacks. Authors in [144] consider a simpler configuration with one software defined networking (SDN) controller, and three substations each having a connected field device; with the goal to show that SDN is a viable technology with negligible switching delay to backup wireless communication and a minimum number of packet loss, which are taken as resilience metrics.
A graph-based analytical model is adopted in [140] to determine the needed transmission power and required number of gateways for wireless-enabled mesh architectures in the context of smart metering. A proposed methodology involves clustering to assign each smart meter to a gateway, then the average number of hops and the number of independent paths to reach the gateway are calculated as intra-cluster resilience metrics, while node capability to connect to other gateways in case of a primary gateway failure is addressed by inter-cluster resilience. A different graph approach is used by [141] to consider dependencies between ICT and measurement layers which, seen from a higher perspective, are no more than the entire communication infrastructure used in a smart grid. The degree of centrality is used to find the importance of each communication link and measurement unit, then resilience metric is defined as the deviation from ideal importance values, knowing that the main goal is to reduce the importance of critical nodes that increases the robustness of the network.
At this point, one can notice the absence of resilience phases notion from the presented works so far, which is a major drawback. This can be seen also from the relatively low importance given to disruption modeling and characterization, considered very important in resilience studies. On the contrary, [143,145] introduce temporal phases; though with fewer details than electric service cases, but sufficiently to convey all relevant information about resilience. Both works rely on empirical data from post-recovery assessments by DSOs. In the case of [143], the proposed resilience metric is calculated for the infrastructure and the service using expected cost from customer and system sides (4 considered DSOs) during hurricane sandy (2012). Obtained curves show the effectiveness of coupled non-stationary random processes modeling for failures, recoveries, and costs to customers.
As suggested in [130], the same author defines power supply resilience of an ICT site in [145] as the ratio between up-time and event duration, and uses real field data from different natural disasters to calculate this quantity. This illustrates how the same metric can be applied to quantify the resilience of electric and telecommunication services in a smart grid.

5.3.2. Time of Evaluation

Attention was drawn above to the absence of temporal analysis in most ICT network reviewed works, and when present, empirical models are used for resilience frameworks. This renders knowing when performance measures should be calculated and for which objective without detailed exploration. In other words, analysis is still at an initial level of uniquely obtaining the metrics and, except for [141], no planning or response is based on these metrics. For instance, [141] proposes to optimize the wide area monitoring system (WAMS) design through the optimal resilient deployment of phasor measurement units (PMUs) and new optical ground wires, formulated as an optimization problem based on performance measures used to calculate the resilience metric. Thus, almost all evaluations are conducted after the event as illustrated in the telecommunications part of Table 2 which entails no further use in planning or response.

5.3.3. Resilience Strategies

Proposing resilience enhancement is tightly connected to the type of conducted evaluation. So, due to the limitation here to post-recovery metric calculation, improvement strategies are shown to have a positive impact on the network but only one optimized implementation [141] is achieved to exploit the whole potential of these measures (Table 3).
Data-related strategies of replication and redundancy are completely adapted to multi-hop routing mechanisms in WSN networks, and need to be explored considering the associated cost for either the initial investment or subsequent maintainability [142]. SDN and virtualization technologies represent an attractive option for SG resilience under different architectures (e.g., substation automation, utility Machine-to-Machine (M2M) applications, cloud and IoT applications…) which can address SG-related issues of security, privacy, granularity, vendor-specific components, and network management [152]. This wide penetration of SDN opens the opportunity to leverage it also to improve the resilience of the network.
Furthermore, measures seen for electric service [130] are suggested for ICT case [145] highlighting interdependence between the two networks, and the possibility to develop promising joint evaluation frameworks treated in the recent literature [61], out of the scope of present work.

5.4. Results and Insights

This section builds on presented observations and analysis of the reviewed literature to explain challenges and priority perspectives for resilience quantification in modern distribution grids.

5.4.1. Moving from Qualitative to Quantitative Resilience Assessments of the ICT Domain

From a qualitative perspective, resilience studies are very well established and succeed to demonstrate the shift of paradigm they incarnate in terms of preventing a given infrastructure from catastrophic failures and orchestrating restoration of nominal services. However, when it comes to quantitative assessments, general tendency heads toward restraining resilience capacity to one of its components such us robustness, survivability, adaptability, restoration, and recovery [153].
Power network resilience analyses in general, and PDN in particular, are managed in recent years to develop quantitative frameworks that describe and harness all capabilities of resilience. This is not limited to proposing metrics for all temporal phases, but includes also using developed indicators to optimize enhancement strategies like done in [125,131,133,134,135,137]. Certainly, more works should be carried out in this sense and even more to mutualize visions through standardization to yield consensus in evaluation methodologies and metrics; but the right research direction is indeed being explored in electric distribution networks. Parallel to this, the same dynamic should be adopted also for telecommunication services involved in smart grids which so far, as shown through this review, stick to partial definitions of resilience adopted even in studies targeting communication networks outside the scope of smart grids. Differently said, ICT resilience studies are a step behind compared to what is done in power networks in terms of adopted definitions and proposed frameworks. Awareness then increases that smart grid comprehensive resilience analysis goes hand in hand with both electric and telecommunication services evaluation at comparable levels of advancement, meaning that ICT layer in distribution grid has a considerable margin for improvement that can mimic electric service analyzes and be guided by recent works in general purpose resilient communication networks [75,78].
One can argue that tracking electric service performance subsumes the telecommunication aspect, because the latter contributes to the degradation of power supply to customers which is after all the main concern. This is a client-centric approach that resilience contains, but also complements with operator (or network) centric view, where a fine-grained analysis of all system mechanisms is needed, involving among others a separate and deep look at ICT functions.

5.4.2. Need to Specify Time of Evaluation

Emphasis is put throughout previous sections on the importance of “when” resilience evaluation is conducted (Table 2), which is not to be confused with the time of the event occurrence [36]. The difference is easily seen in an example of proactive approaches, where the entire event time horizon is studied in the pre-event phase of real-time scale. This means that event time is taken as the virtual quantity, which in case of data availability or use of modeling can be observed before it happens, while the real-time scale describes the moment of resilience quantification. Therefore, the concern of event time is to know if the resilience framework treats all phases (the more phases the better), but time of evaluation wants to know when resilience assessment metrics will be available, probably for use in optimization by enhancement strategies.
Obviously, DSOs are more interested in the look-forward method, which allows them to anticipate major disruptions and prepare the network. However, HILP events are so unpredictable that fidelity of assumed models and projections is reduced, supporting the need for real-time resilience analyzes that will have more knowledge into the impact of an event, and could complement initial proactive measures. Thereby, effort should be put to explore the possibility of a framework with both proactive and reactive resilience quantification in order to seize the advantages of the two approaches. At last, post-recovery evaluation can back both previous alternatives by collecting valuable field data after hazards.

5.4.3. Topology and Service Performance Metrics

Only a few reviewed papers consider topological parameters in metrics computation [127,131,140,141] due to the high level of abstraction in graph-based methods and static features therein. Still, it is important to include them in resilience studies because they capture network architecture and internal dependencies between different elements that complement service performance measures. As discussed in Section 5, a noteworthy multi-criteria approach was suggested in [137] to combine topological and operational characteristics in the same metric. Although more inclined toward topological features, this proposal illustrates how multiple weighted parameters can be aggregated into a single representative indicator. In addition, interdependence modeling widely adopts topological approach [154,155], so it is unavoidable to embrace it in power systems, because in the long run, smart grids resilience must be analyzed taking into account the interactions between electric and ICT layers; and with other infrastructure networks (gas, heat, cooling, transports, etc.).
Like transmission power networks [29], multiple metrics are proposed for resilience quantification in [124,128,131,135,142]. A single resilience metric, even in the case where it embeds a maximum number of resilience features, can represent a drawback if it offers less information for enhancement strategies implementation. The reason is apparent in some strategies that only target one facet of resilience, let us say for example robustness; hence, when the metric combines many features it dilutes the information about robustness in the general index. This is why multiple metrics, each handling an aspect or phase of resilience, can help to build better knowledge and guide more specific actions.

5.4.4. Spatial Scale

Resilience frameworks need to combine qualitative and quantitative analyses at various temporal and spatial scales [156]. The temporal aspect is treated widely through monitoring of performance evolution with time, however, more effort should be put into considering time horizons of different events which directly relate to the system resilience and the efficiency of quantification methods [136]. For a small service area, the same failure probability of each component is considered when the distribution system suffers from natural disasters [131]. In the case of larger areas, it becomes very important to consider the spatial distribution of an event, in order to better estimate the hazard impact and recovery duration [105]. This can be achieved by defining multiple impact zones and use of failure probability or N-k contingency constraint [123,132]. Other methods use a model for event path [128], the spatial distribution of the number of outages [129], and spatio-temporal random processes [143]. Since post-disruption electric grid performance is highly sensitive to event spatial characteristics [105], the spatial dimension should be explicitly incorporated into performance function, unlike most related works.

5.4.5. Critical Load

Different levels of prioritization exist between loads in an electric distribution network. Resilience involves the tolerance to curtail less important customers while keeping supply to more critical ones (hospitals, emergency services, banking, government facilities…). When the outage is general, critical loads are to be restored first. This behavior needs to be captured by resilience metrics where the difference between normal and crucial loads can be explicitly seen.
In the telecommunication layer of distribution networks, the concept of critical elements is less applied (not found at all in reviewed articles) due to the fact that communicating devices are mostly used in protection, monitoring, management, and control functions which are all very important to the whole network operation. However, within the telecommunication architecture used by grid functions, hierarchies exist, and entities can be prioritized. For example, a regional control center can have the highest criticality in a given region, compared to remote terminal units (RTUs) at substations, or field devices. With the advent of smart grids, there is an ever-increasing number of distribution-connected items that can be seen as loads more than controlling devices such as smart meters, industry 4.0 robots, and industrial IoT. Thereby, even more hierarchy can be put in place based on which elements are most important, or even achieve cross-importance rankings with electric infrastructure and loads in the system.

5.4.6. Uncertainty Quantification

The main sources of uncertainty in smart grids are HILP events, load demand, distributed generation, and market prices. Among these, HILP hazards have the characteristic to severely damage the network, thus like seen in [123,132,134,135], different methods are proposed to cope with its uncertainties. Again, this topic necessitates being investigated for the grid telecommunication layer because it is also vulnerable to extreme event uncertainties, especially as it is in the front line against cyber-attacks.

5.4.7. Economical Cost

DSOs do not just scrutiny costs due to phenomenal disasters and attacks, but also audit their investment strategies to find the best balance between resilience and minimal spending. Cost is inserted in resilience studies at different levels, most of the time directly on the metric [123,127,128,133,143], but can also be incorporated in objective functions of cost-benefit analyzes [131,134,138,141] that search the optimal tradeoff between resilience and associated investment costs.

5.4.8. Resilience Potential

Performance-based evaluation of resilience is widely adopted to conduct an assessment from event eruption until the final recovery. It is always reported to the nominal performance of the system before a contingency. Authors in [136] introduced “service potential” which describes how able is the network to deliver its service under given the unfavorable conditions. This allows comparing two grid systems or architectures under different orders of event durations. We can extend this into resilience potential, which is no more than a quantity that gives resilience of a network, considering all possible redundancies and resources, very similar to risk assessment empowered with consideration for enhancement strategies. Concisely, expand on the idea that the same nominal level of performance does not mean the same level of resilience.

5.4.9. Interdependencies

Separate analysis of electric and ICT services in distribution grids is deemed to converge into a joint layout due to multiple existent interdependencies, wherein the continuation of this work, the study should be steered by a resilience perspective [90]. Contribution in [61] summarizes research in interdependent power-ICT research on system modeling, failure, and resilience enhancement strategies. From the fact that mutualized resilience evaluation is the best approach to deal with interdependency which makes the coupled network more vulnerable to disruptions through cascading and escalating effects [155], many recent works conduct resilience studies jointly for both communication (or cyber) and electric domains of the grid [56,157,158,159].
Dependencies of electric network with other infrastructures are also handled jointly in case of gas network [102], buildings [160], urban transportation [161], integrated energy system [88], water network [162]; allowing for the possibility to adapt some prominent ideas and principles for application in the specific case of smart grids. Further discussion of interdependencies is out of the scope of this article, but it should be emphasized that this topic is the natural follow-up of the work presented here.

6. Conclusions

In this paper, state-of-the-art studies on resilience quantification of smart distribution grids are summed up with the perspective to analyze all involved tools and point out assessment objectives. Performance calculation is identified as the main enabler of resilience evaluation, as almost all reviewed metrics rely either exclusively on operational performance measures, or as a mix of operational and topological parameters. Many models are proposed in the literature to compute performance, among which system modeling is the most dominant with a focus on four main aspects: contingency, fragility, restoration, and functional dynamics. Empirical models serve as baseline and data feeder for system models, whereas surrogate models try to bypass network modeling by the harness of advanced machine learning techniques to directly infer performance measures from various topological, topographic, and operational parameters.
Distribution grid resilience is defined in reviewed research in the face of HILP events which need to be foreseen using forecast data, historical records, estimation tools, and contingency models. Accentuation is made on the difficulty to design resilience for multiple events, especially with the fact that enhancement strategies can be very specific as they are advantageous in some cases and not in others. In addition, we propose a classification based on the time of resilience evaluation, which allows projecting real case applicability of presented assessment frameworks. The resilience phases-based approach was linked with different objectives of the assessment, from simple metrics evaluation, to either planning or response for survivability and recovery; achieved through a variety of improvement strategies for which allocation is optimized under the constraint of a limited budget. This bridges resilience studies and economic considerations in order to help stakeholders in investment plans elaboration and crisis management decision-making.
Aspects of critical load, microgrids, and uncertainty of hazards, load, and distributed generation are discussed to show their high importance, and explain available tools so far for their involvement in the study. Finally, a demonstration was made on ahead steps that resilience studies in the electric domain have compared to telecommunication domain, and an urgent need to level up the two for complete joint resilience analysis of smart grids, unlike current separate works that neglect several pertaining interdependencies. Therefore, future works need to focus on coupled electric-ICT networks with joint quantification frameworks, which not only consider the resilience of the coupled system, but seek further granularity by investigating constituent applications and functions such as distribution automation, automatic metering, and grid management.

Author Contributions

Methodology, formal analysis, investigation, writing—original draft preparation, Y.N.B.; methodology, visualization, supervision, writing—review and editing, P.C., J.S.-T., Y.-P.F., Z.Z., A.B. All authors have read and agreed to the published version of the manuscript.

Funding

This research received no external funding.

Acknowledgments

Authors would like to thank the reviewers for their insightful comments and constructive suggestions.

Conflicts of Interest

The authors declare no conflict of interest.

References

  1. Soldani, D.; Manzalini, A. Horizon 2020 and Beyond: On the 5G Operating System for a True Digital Society. IEEE Veh. Technol. Mag. 2015, 10, 32–42. [Google Scholar] [CrossRef]
  2. Yu, W.; Liang, F.; He, X.; Hatcher, W.G.; Lu, C.; Lin, J.; Yang, X. A Survey on the Edge Computing for the Internet of Things. IEEE Access 2018, 6, 6900–6919. [Google Scholar] [CrossRef]
  3. O’Mahony, M.J.; Politi, C.; Klonidis, D.; Nejabati, R.; Simeonidou, D. Future Optical Networks. J. Light. Technol. 2006, 24, 4684–4696. [Google Scholar] [CrossRef]
  4. Galli, S.; Scaglione, A.; Wang, Z. For the Grid and Through the Grid: The Role of Power Line Communications in the Smart Grid. Proc. IEEE 2011, 99, 998–1027. [Google Scholar] [CrossRef] [Green Version]
  5. Fang, X.; Misra, S.; Xue, G.; Yang, D. Smart Grid—The New and Improved Power Grid: A Survey. IEEE Commun. Surv. Tutor. 2012, 14, 944–980. [Google Scholar] [CrossRef]
  6. Gungor, V.C.; Sahin, D.; Kocak, T.; Ergut, S.; Buccella, C.; Cecati, C.; Hancke, G.P. Smart Grid Technologies: Communication Technologies and Standards. IEEE Trans. Ind. Inform. 2011, 7, 529–539. [Google Scholar] [CrossRef] [Green Version]
  7. Gungor, V.C.; Sahin, D.; Kocak, T.; Ergut, S.; Buccella, C.; Cecati, C.; Hancke, G.P. A Survey on Smart Grid Potential Applications and Communication Requirements. IEEE Trans. Ind. Inform. 2013, 9, 28–42. [Google Scholar] [CrossRef] [Green Version]
  8. Moslehi, K.; Kumar, R. A Reliability Perspective of the Smart Grid. IEEE Trans. Smart Grid 2010, 1, 57–64. [Google Scholar] [CrossRef]
  9. Momoh, J.A. Smart grid design for efficient and flexible power networks operation and control. In Proceedings of the 2009 IEEE/PES Power Systems Conference and Exposition, Seattle, WA, USA, 15–18 March 2009; pp. 1–8. [Google Scholar]
  10. The President’s National Infrastructure Advisory Council. Surviving a Catastrophic Power Outage—How to Strengthen the Capabilities of the Nation. Available online: https://www.cisa.gov/sites/default/files/publications/NIAC%20Catastrophic%20Power%20Outage%20Study_FINAL.pdf (accessed on 7 December 2020).
  11. U.S. Departement of Energy. Infrastructure Security and Energy Restoration. Hurricane Irma & Hurricane Harvey Event Summary (Report #28). September 2017. Available online: https://www.energy.gov/sites/prod/files/2017/10/f37/Hurricanes%20Irma%20and%20Harvey%20Event%20Summary%20%2328.pdf (accessed on 7 December 2020).
  12. Román, M.O.; Stokes, E.C.; Shrestha, R.; Wang, Z.; Schultz, L.; Carlo, E.A.S.; Sun, Q.; Bell, J.; Molthan, A.; Kalb, V.; et al. Satellite-based assessment of electricity restoration efforts in Puerto Rico after Hurricane Maria. PLoS ONE 2019, 14, e0218883. [Google Scholar] [CrossRef]
  13. Panteli, M.; Mancarella, P. The Grid: Stronger, Bigger, Smarter? Presenting a Conceptual Framework of Power System Resilience. IEEE Power Energy Mag. 2015, 13, 58–66. [Google Scholar] [CrossRef]
  14. Bie, Z.; Lin, Y.; Li, G.; Li, F. Battling the Extreme: A Study on the Power System Resilience. Proc. IEEE 2017, 105, 1253–1266. [Google Scholar] [CrossRef]
  15. Liang, G.; Weller, S.R.; Zhao, J.; Luo, F.; Dong, Z.Y. The 2015 Ukraine Blackout: Implications for False Data Injection Attacks. IEEE Trans. Power Syst. 2017, 32, 3317–3318. [Google Scholar] [CrossRef]
  16. Sullivan, J.E.; Kamensky, D. How cyber-attacks in Ukraine show the vulnerability of the U.S. power grid. Electr. J. 2017, 30, 30–35. [Google Scholar] [CrossRef]
  17. The Smart Grid Implementation Strategy Team; National Energy Technology Laboratory. What is the Smart Grid? March 2009. Available online: https://www.power-grid.com/smart-grid/smart-grid-implementation-strategies-for-success/#gref (accessed on 7 December 2020).
  18. Civil Contingencies, Cabinet Office. Keeping the Country Running: Natural Hazards and Infrastructure. October 2011. Available online: https://assets.publishing.service.gov.uk/government/uploads/system/uploads/attachment_data/file/61342/natural-hazards-infrastructure.pdf (accessed on 7 December 2020).
  19. Obama, B.; Presidential Policy. Directive 21: Critical Infrastructure Security and Resilience. Homeland Security Digital Library. 12 February 2013. Available online: https://www.hsdl.org/?abstract&did= (accessed on 7 December 2020).
  20. Cimellaro, G.P.; Reinhorn, A.M.; Bruneau, M. Seismic resilience of a hospital system. Struct. Infrastruct. Eng. 2010, 6, 127–144. [Google Scholar] [CrossRef]
  21. Ganin, A.A.; Massaro, E.; Gutfraind, A.; Steen, N.; Keisler, J.M.; Kott, A.; Mangoubi, R.; Linkov, I. Operational resilience: Concepts, design and analysis. Sci. Rep. 2016, 6, 19540. [Google Scholar] [CrossRef] [PubMed] [Green Version]
  22. Henry, D.; Ramirez-Marquez, J.E. Generic metrics and quantitative approaches for system resilience as a function of time. Reliab. Eng. Syst. Saf. 2012, 99, 114–122. [Google Scholar] [CrossRef]
  23. Madni, A.M.; Jackson, S. Towards a Conceptual Framework for Resilience Engineering. IEEE Syst. J. 2009, 3, 181–191. [Google Scholar] [CrossRef]
  24. Panteli, M.; Mancarella, P. Modeling and Evaluating the Resilience of Critical Electrical Power Infrastructure to Extreme Weather Events. IEEE Syst. J. 2017, 11, 1733–1742. [Google Scholar] [CrossRef]
  25. Smith, P.; Hutchison, D.; Sterbenz, J.P.; Schöller, M.; Fessi, A.; Karaliopoulos, M.; Lac, C.; Plattner, B. Network resilience: A systematic approach. IEEE Commun. Mag. 2011, 49, 88–97. [Google Scholar] [CrossRef]
  26. Arghandeh, R.; von Meier, A.; Mehrmanesh, L.; Mili, L. On the definition of cyber-physical resilience in power systems. Renew. Sustain. Energy Rev. 2016, 58, 1060–1069. [Google Scholar] [CrossRef] [Green Version]
  27. Gholami, A.; Shekari, T.; Amirioun, M.H.; Aminifar, F.; Amini, M.H.; Sargolzaei, A. Toward a Consensus on the Definition and Taxonomy of Power System Resilience. IEEE Access 2018, 6, 32035–32053. [Google Scholar] [CrossRef]
  28. Wang, Y.; Chen, C.; Wang, J.; Baldick, R. Research on Resilience of Power Systems under Natural Disasters—A Review. IEEE Trans. Power Syst. 2015, 31, 1604–1613. [Google Scholar] [CrossRef]
  29. Espinoza, S.; Panteli, M.; Mancarella, P.; Rudnick, H. Multi-phase assessment and adaptation of power systems resilience to natural hazards. Electr. Power Syst. Res. 2016, 136, 352–361. [Google Scholar] [CrossRef]
  30. Li, Z.; Shahidehpour, M.; Aminifar, F.; AlAbdulwahab, A.; Al-Turki, Y. Networked Microgrids for Enhancing the Power System Resilience. Proc. IEEE 2017, 105, 1289–1310. [Google Scholar] [CrossRef]
  31. Reed, D.A.; Kapur, K.C.; Christie, R.D. Methodology for Assessing the Resilience of Networked Infrastructure. IEEE Syst. J. 2009, 3, 174–180. [Google Scholar] [CrossRef]
  32. Zhao, X.; Chen, Z.; Gong, H. Effects Comparison of Different Resilience Enhancing Strategies for Municipal Water Distribution Network: A Multidimensional Approach. Math. Probl. Eng. 2015, 2015, 1–16. [Google Scholar] [CrossRef] [Green Version]
  33. Cutter, S.L. The landscape of disaster resilience indicators in the USA. Nat. Hazards 2016, 80, 741–758. [Google Scholar] [CrossRef]
  34. Dessavre, D.G.; Ramirez-Marquez, J.E.; Barker, K. Multidimensional approach to complex system resilience analysis. Reliab. Eng. Syst. Saf. 2016, 149, 34–43. [Google Scholar] [CrossRef]
  35. Ouyang, M.; Dueñas-Osorio, L. Multi-dimensional hurricane resilience assessment of electric power systems. Struct. Saf. 2014, 48, 15–24. [Google Scholar] [CrossRef]
  36. Mahzarnia, M.; Moghaddam, M.P.; Baboli, P.T.; Siano, P. A Review of the Measures to Enhance Power Systems Resilience. IEEE Syst. J. 2020, 14, 4059–4070. [Google Scholar] [CrossRef]
  37. Kontokosta, C.E.; Malik, A. The Resilience to Emergencies and Disasters Index: Applying big data to benchmark and validate neighborhood resilience capacity. Sustain. Cities Soc. 2018, 36, 272–285. [Google Scholar] [CrossRef]
  38. Chang, S.E.; Shinozuka, M. Measuring Improvements in the Disaster Resilience of Communities. Earthq. Spectra 2004, 20, 739–755. [Google Scholar] [CrossRef]
  39. Fang, Y.-P.; Pedroni, N.; Zio, E. Resilience-Based Component Importance Measures for Critical Infrastructure Network Systems. IEEE Trans. Reliab. 2016, 65, 502–512. [Google Scholar] [CrossRef]
  40. Albasrawi, M.N.; Jarus, N.; Joshi, K.A.; Sarvestani, S.S. Analysis of reliability and resilience for smart grids. In Proceedings of the 2014 IEEE 38th Annual International Computer Software and Applications Conference, Vasteras, Sweden, 21–25 July 2014. [Google Scholar] [CrossRef]
  41. Panteli, M.; Mancarella, P.; Trakas, D.N.; Kyriakides, E.; Hatziargyriou, N.D. Metrics and Quantification of Operational and Infrastructure Resilience in Power Systems. IEEE Trans. Power Syst. 2017, 32, 4732–4742. [Google Scholar] [CrossRef] [Green Version]
  42. Dehghanian, P.; Aslan, S.; Dehghanian, P. Maintaining Electric System Safety through an Enhanced Network Resilience. IEEE Trans. Ind. Appl. 2018, 54, 4927–4937. [Google Scholar] [CrossRef]
  43. Fang, Y.; Sansavini, G. Optimizing power system investments and resilience against attacks. Reliab. Eng. Syst. Saf. 2017, 159, 161–173. [Google Scholar] [CrossRef]
  44. Jufri, F.H.; Widiputra, V.; Jung, J. State-of-the-art review on power grid resilience to extreme weather events: Definitions, frameworks, quantitative assessment methodologies, and enhancement strategies. Appl. Energy 2019, 239, 1049–1065. [Google Scholar] [CrossRef]
  45. Das, L.; Munikoti, S.; Natarajan, B.; Srinivasan, B. Measuring smart grid resilience: Methods, challenges and opportunities. Renew. Sustain. Energy Rev. 2020, 130, 109918. [Google Scholar] [CrossRef]
  46. Farhangi, H. The path of the smart grid. IEEE Power Energy Mag. 2010, 8, 18–28. [Google Scholar] [CrossRef]
  47. Ipakchi, A.; Albuyeh, F. Grid of the future. IEEE Power Energy Mag. 2009, 7, 52–62. [Google Scholar] [CrossRef]
  48. Beaty, H.W. Electric Power Distribution Systems: A Nontechnical Guide; PennWell Books: Tulsa, OK, USA, 1998. [Google Scholar]
  49. Heydt, G.T. The Next Generation of Power Distribution Systems. IEEE Trans. Smart Grid 2010, 1, 225–235. [Google Scholar] [CrossRef]
  50. Brown, R.E. Impact of Smart Grid on distribution system design. In Proceedings of the 2008 IEEE Power and Energy Society General Meeting—Conversion and Delivery of Electrical Energy in the 21st Century, Pittsburgh, PA, USA, 20–24 July 2008; pp. 1–4. [Google Scholar]
  51. Amin, S.M.; Wollenberg, B. Toward a smart grid: Power delivery for the 21st century. IEEE Power Energy Mag. 2005, 3, 34–41. [Google Scholar] [CrossRef]
  52. Ma, S.; Chen, B.; Wang, Z. Resilience Enhancement Strategy for Distribution Systems under Extreme Weather Events. IEEE Trans. Smart Grid 2018, 9, 1442–1451. [Google Scholar] [CrossRef]
  53. Bertsimas, D.; Litvinov, E.; Sun, X.A.; Zhao, J.; Zheng, T. Adaptive Robust Optimization for the Security Constrained Unit Commitment Problem. IEEE Trans. Power Syst. 2013, 28, 52–63. [Google Scholar] [CrossRef]
  54. Soroudi, A.; Ehsan, M. IGDT Based Robust Decision Making Tool for DNOs in Load Procurement Under Severe Uncertainty. IEEE Trans. Smart Grid 2012, 4, 886–895. [Google Scholar] [CrossRef] [Green Version]
  55. Chen, P.-Y.; Cheng, S.-M.; Chen, K.-C. Smart attacks in smart grid communication networks. IEEE Commun. Mag. 2012, 50, 24–29. [Google Scholar] [CrossRef]
  56. Chai, W.K.; Kyritsis, V.; Katsaros, K.V.; Pavlou, G. Resilience of interdependent communication and power distribution networks against cascading failures. In Proceedings of the 2016 IFIP Networking Conference (IFIP Networking) and Workshops, Vienna, Austria, 17–19 May 2016; pp. 37–45. [Google Scholar]
  57. Zio, E.; Sansavini, G. Modeling Interdependent Network Systems for Identifying Cascade-Safe Operating Margins. IEEE Trans. Reliab. 2011, 60, 94–101. [Google Scholar] [CrossRef] [Green Version]
  58. Kwasinski, A. Effects of Notable Natural Disasters of 2017 on Information and Communication Networks Infrastructure. In Proceedings of the 2018 IEEE International Telecommunications Energy Conference (INTELEC), Torino, Italy, 7–11 October 2018; pp. 1–8. [Google Scholar]
  59. Martins, D.L.; Girão-Silva, R.; Gomes, Á.; Jorge, L.M.G.; Musumeci, D.F.; Rak, D.J. Interdependence between Power Grids and Communication Networks: A Resilience Perspective. In Proceedings of the DRCN 2017—Design of Reliable Communication Networks, 13th International Conference, Munich, Germany, 8–10 March 2017; p. 9. [Google Scholar]
  60. Yang, Z.; Chen, Y.; Marti, J. Modelling cascading failure of a CPS for topological resilience enhancement. IET Smart Grid 2020, 3, 207–215. [Google Scholar] [CrossRef]
  61. Liu, X.; Chen, B.; Chen, C.; Jin, D. Electric power grid resilience with interdependencies between power and communication networks—A review. IET Smart Grid 2020, 3, 182–193. [Google Scholar] [CrossRef]
  62. Ji, C.; Wei, Y.; Poor, H.V. Resilience of Energy Infrastructure and Services: Modeling, Data Analytics, and Metrics. Proc. IEEE 2017. [Google Scholar] [CrossRef]
  63. Kandaperumal, G.; Srivastava, A.K. Resilience of the electric distribution systems: Concepts, classification, assessment, challenges, and research needs. IET Smart Grid 2020, 3, 133–143. [Google Scholar] [CrossRef]
  64. Chi, Y.; Xu, Y.; Hu, C.; Feng, S. A State-of-the-Art Literature Survey of Power Distribution System Resilience Assessment. In Proceedings of the 2018 IEEE Power & Energy Society General Meeting (PESGM), Portland, OR, USA, 5–9 August 2018; pp. 1–5. [Google Scholar]
  65. Chi, Y.; Xu, Y. Resilience-oriented microgrids: A comprehensive literature review. In Proceedings of the 2017 IEEE Innovative Smart Grid Technologies—Asia (ISGT-Asia), Auckland, New Zealand, 4–7 December 2017; pp. 1–6. [Google Scholar]
  66. Kafka, P. Reliability and Safety. CERN. February 2002. Available online: https://indico.cern.ch/event/412169/attachments/841055/1169721/AT_Kafka.pdf (accessed on 13 December 2020).
  67. Grid Modernization Laboratory Consortium. Grid Modernization: Metrics Analysis (GMLC1.1)—Resilience. April. Available online: https://gmlc.doe.gov/sites/default/files/resources/GMLC1.1_Vol3_Resilience.pdf (accessed on 13 December 2020).
  68. IEEE Guide for Electric Power Distribution Reliability Indices. In IEEE Std 1366–2003 (Revision of IEEE Std 1366–1998); Institute of Electrical and Electronics Engineers (IEEE): Piscataway, NJ, USA, 2008; pp. 1–50.
  69. Billinton, R.; Allan, R.N. Distribution systems—Basic techniques and radial networks. In Reliability Evaluation of Power Systems; Springer US: Boston, MA, USA, 1996; pp. 220–248. [Google Scholar]
  70. IEEE. IEEE Draft Guide for Electric Power Distribution Reliability Indices; IEEE P1366/D6; November 2011; IEEE: Piscataway, NJ, USA, 2011; pp. 1–40. [Google Scholar]
  71. Reed, D.A. Electric utility distribution analysis for extreme winds. J. Wind. Eng. Ind. Aerodyn. 2008, 96, 123–140. [Google Scholar] [CrossRef]
  72. Council, N.R. Disaster Resilience: A National Imperative; The National Academies Press: Washington, DC, USA, 2012. [Google Scholar]
  73. Elliot, R.; National Rural Elec Association; Organization of MISO States; Aaronson, S.; Edison Electric Institute; National Associatio Advocates. Utility Investments in Resilience of Electricity Systems. 2019. Available online: https://escholarship.org/content/qt9928v9jb/qt9928v9jb.pdf (accessed on 13 December 2020).
  74. DeMartini, P. Integrated, Resilient Distribution Planning. May 2020. Available online: https://pubs.naruc.org/pub/D3D1CE12-155D-0A36-3130-1E8E4E51F582 (accessed on 13 December 2020).
  75. European Network and Information Security Agency (ENISA). Enabling and Managing End-to-End Resilience. Report/Study. Available online: https://www.enisa.europa.eu/publications/end-to-end-resilience (accessed on 13 December 2020).
  76. Chana, I.; Gill, S.S. Quality of Service and Service Level Agreements for Cloud Environments: Issues and Challenges. In Cloud Computing. Computer Communications and Networks; Springer: Cham, Switzerland, 2014; pp. 51–72. [Google Scholar]
  77. Tapolcai, J.; Cholda, P.; Cinkler, T.; Wajda, K.O.; Jajszczyk, A.; Verchere, D. Joint Quantification of Resilience and Quality of Service. In Proceedings of the 2006 IEEE International Conference on Communications, Istanbul, Turkey, 11–15 June 2006; Volume 2, pp. 477–482. [Google Scholar]
  78. Rak, J.; Hutchison, D. (Eds.) Guide to Disaster-Resilient Communication Networks; Springer International Publishing: New York, NY, USA, 2020. [Google Scholar]
  79. Eusgeld, I.; Henzi, D.; Kröger, W. Comparative Evaluation of Modeling and Simulation Techniques for Interdependent Critical Infrastructures; Laboratorium für Sicherheitsanalytik, ETH: Zürich, Switzerland, 2008. [Google Scholar]
  80. Vugrin, E.D.; Castillo, A.R.; Silva-Monroy, C.A. Resilience Metrics for the Electric Power System: A Performance-Based Approach; SAND2017-1493, 1367499; Sandia National Lab. (SNL-NM): Albuquerque, NM, USA, 2017.
  81. Zobel, C.W.; Khansa, L. Characterizing multi-event disaster resilience. Comput. Oper. Res. 2014, 42, 83–94. [Google Scholar] [CrossRef]
  82. Friginal, J.; De Andrés, D.; Ruiz, J.C.; Martínez, M. REFRAHN: A Resilience Evaluation Framework for Ad Hoc Routing Protocols. Comput. Netw. 2015, 82, 114–134. [Google Scholar] [CrossRef] [Green Version]
  83. Mukherjee, S.; Nateghi, R.; Hastak, M. A multi-hazard approach to assess severe weather-induced major power outage risks in the U.S. Reliab. Eng. Syst. Saf. 2018, 175, 283–305. [Google Scholar] [CrossRef]
  84. Keogh, M.; Cody, C. Resilience in Regulated Utilities. National Association of Regulatory Utility Commissioners (NARUC). November 2013. Available online: https://pubs.naruc.org/pub/536f07e4-2354-d714-5153-7a80198a436d (accessed on 15 December 2020).
  85. Chen, G.; Dong, Z.Y.; Hill, D.J.; Zhang, G.H. An improved model for structural vulnerability analysis of power networks. Phys. A Stat. Mech. Its Appl. 2009, 388, 4259–4266. [Google Scholar] [CrossRef]
  86. Hines, P.; Cotilla-Sanchez, E.; Blumsack, S. Do topological models provide good information about electricity infrastructure vulnerability? Chaos Interdiscip. J. Nonlinear Sci. 2010, 20, 033122. [Google Scholar] [CrossRef]
  87. Janić, M. Modelling the resilience of rail passenger transport networks affected by large-scale disruptive events: The case of HSR (high speed rail). Transportation 2018, 45, 1101–1137. [Google Scholar] [CrossRef] [Green Version]
  88. Moslehi, S.; Reddy, T.A. Sustainability of integrated energy systems: A performance-based resilience assessment methodology. Appl. Energy 2018, 228, 487–498. [Google Scholar] [CrossRef]
  89. Gasser, P.; Suter, J.; Cinelli, M.; Spada, M.; Burgherr, P.; Hirschberg, S.; Kadziński, M.; Stojadinović, B. Comprehensive resilience assessment of electricity supply security for 140 countries. Ecol. Indic. 2020, 110, 105731. [Google Scholar] [CrossRef]
  90. Wang, J.; Zuo, W.; Rhode-Barbarigos, L.; Lu, X.; Wang, J.; Lin, Y. Literature review on modeling and simulation of energy infrastructures from a resilience perspective. Reliab. Eng. Syst. Saf. 2019, 183, 360–373. [Google Scholar] [CrossRef]
  91. Lu, J.; Guo, J.; Jian, Z.; Yang, Y.; Tang, W. Dynamic Assessment of Resilience of Power Transmission Systems in Ice Disasters. In Proceedings of the 2018 International Conference on Power System Technology (POWERCON), Guangzhou, China, 6–9 November 2018; pp. 7–13. [Google Scholar]
  92. Chanda, S.; Srivastava, A.K. Defining and Enabling Resiliency of Electric Distribution Systems with Multiple Microgrids. IEEE Trans. Smart Grid 2016, 7, 2859–2868. [Google Scholar] [CrossRef]
  93. Zhao, S.; Liu, X.; Zhuo, Y. Hybrid Hidden Markov Models for resilience metrics in a dynamic infrastructure system. Reliab. Eng. Syst. Saf. 2017, 164, 84–97. [Google Scholar] [CrossRef]
  94. Ouyang, M. Review on modeling and simulation of interdependent critical infrastructure systems. Reliab. Eng. Syst. Saf. 2014, 121, 43–60. [Google Scholar] [CrossRef]
  95. Smith, C. Representing Common-Cause Failures in the SAPHIRE Software. In Proceedings of the ASME International Mechanical Engineering Congress and Exposition, Boston, MA, USA, 31 October–6 November 2008; Volume 16, pp. 155–162. [Google Scholar]
  96. European Commission; Joint Research Centre. Institute for the Protection and the Security of the Citizen. In Risk Assessment Methodologies for Critical Infrastructure Protection. Part I: A State of the Art; Publications Office of the European Union, Grand Duchy of Luxembourg: Luxembourg, 2012. [Google Scholar]
  97. Broadwater, R.; Anderson, R. Distribution Engineering Workstation from EDD 2005. April 2006. Available online: https://www.researchgate.net/publication/332705760_DISTRIBUTION_ENGINEERING_WORKSTATION_FROM_EDD_2005 (accessed on 15 December 2020).
  98. Ashok, A.; Govindarasu, M.; Wang, J. Cyber-Physical Attack-Resilient Wide-Area Monitoring, Protection, and Control for the Power Grid. Proc. IEEE 2017, 105, 1389–1407. [Google Scholar] [CrossRef]
  99. Farraj, A.; Hammad, E.; Al Daoud, A.; Kundur, D. A Game-Theoretic Analysis of Cyber Switching Attacks and Mitigation in Smart Grid Systems. IEEE Trans. Smart Grid 2015, 7, 1846–1855. [Google Scholar] [CrossRef]
  100. Yuan, W.; Zhao, L.; Zeng, B. Optimal power grid protection through a defender–attacker–defender model. Reliab. Eng. Syst. Saf. 2014, 121, 83–89. [Google Scholar] [CrossRef]
  101. Alguacil, N.; Delgadillo, A.; Arroyo, J.M. A trilevel programming approach for electric grid defense planning. Comput. Oper. Res. 2014, 41, 282–290. [Google Scholar] [CrossRef] [Green Version]
  102. Fang, Y.; Zio, E. An adaptive robust framework for the optimization of the resilience of interdependent infrastructures under natural hazards. Eur. J. Oper. Res. 2019, 276, 1119–1136. [Google Scholar] [CrossRef]
  103. Arab, A.; Khodaei, A.; Han, Z.; Khator, S.K. Proactive Recovery of Electric Power Assets for Resiliency Enhancement. IEEE Access 2015, 3, 99–109. [Google Scholar] [CrossRef]
  104. LaRocca, S.; Johansson, J.; Hassel, H.; Guikema, S. Topological Performance Measures as Surrogates for Physical Flow Models for Risk and Vulnerability Analysis for Electric Power Systems. Risk Anal. 2014, 35, 608–623. [Google Scholar] [CrossRef] [PubMed] [Green Version]
  105. Rachunok, B.; Nateghi, R. The sensitivity of electric power infrastructure resilience to the spatial distribution of disaster impacts. Reliab. Eng. Syst. Saf. 2020, 193, 106658. [Google Scholar] [CrossRef]
  106. Zhabelova, G.; Vyatkin, V. Multiagent Smart Grid Automation Architecture Based on IEC 61850/61499 Intelligent Logical Nodes. IEEE Trans. Ind. Electron. 2011, 59, 2351–2362. [Google Scholar] [CrossRef]
  107. Maliszewski, P.J.; Perrings, C. Factors in the resilience of electrical power distribution infrastructures. Appl. Geogr. 2012, 32, 668–679. [Google Scholar] [CrossRef]
  108. Kelly-Gorham, M.R.; Hines, P.; Dobson, I. Using historical utility outage data to compute overall transmission grid resilience. arXiv 2019, arXiv:1906.06811. [Google Scholar]
  109. Jin, Y. Surrogate-assisted evolutionary computation: Recent advances and future challenges. Swarm Evol. Comput. 2011, 1, 61–70. [Google Scholar] [CrossRef]
  110. Cao, Z.; Wang, Y.; Chu, C.-C.; Gadh, R. Scalable Distribution Systems State Estimation Using Long Short-Term Memory Networks as Surrogates. IEEE Access 2020, 8, 23359–23368. [Google Scholar] [CrossRef]
  111. Liu, Y.; Zhang, X.; Gao, H.; Zhu, C.; Yao, Y. Data-driven Heuristic Optimization to Manage Congestion of Urban Power Grid. In Proceedings of the 2019 IEEE Innovative Smart Grid Technologies—Asia (ISGT Asia), Chengdu, China, 21–24 May 2019; pp. 580–586. [Google Scholar]
  112. Pan, I.; Das, S. Kriging Based Surrogate Modeling for Fractional Order Control of Microgrids. IEEE Trans. Smart Grid 2015, 6, 36–44. [Google Scholar] [CrossRef] [Green Version]
  113. Xu, Y.; Korkali, M.; Mili, L.; Chen, X.; Min, L. Risk Assessment of Rare Events in Probabilistic Power Flow via Hybrid Multi-Surrogate Method. IEEE Trans. Smart Grid 2020, 11, 1593–1603. [Google Scholar] [CrossRef]
  114. Cai, B.; Xie, M.; Liu, Y.; Liu, Y.; Feng, Q. Availability-based engineering resilience metric and its corresponding evaluation methodology. Reliab. Eng. Syst. Saf. 2018, 172, 216–224. [Google Scholar] [CrossRef]
  115. Moslehi, S.; Reddy, T.A. Sustainability Index of Community Energy Systems for Benchmarking and Multi-Criteria Decision Analysis. In Proceedings of the ASME 2016 International Mechanical Engineering Congress and Exposition, IMECE 2016, Phoenix, AZ, USA, 11–17 November 2016. [Google Scholar]
  116. Alenazi, M.J.; Sterbenz, J.P. Comprehensive comparison and accuracy of graph metrics in predicting network resilience. In Proceedings of the 2015 11th International Conference on the Design of Reliable Communication Networks (DRCN), Kansas City, MO, USA, 24–27 March 2015; pp. 157–164. [Google Scholar]
  117. Gao, H.; Chen, Y.; Mei, S.; Huang, S.; Xu, Y. Resilience-Oriented Pre-Hurricane Resource Allocation in Distribution Systems Considering Electric Buses. Proc. IEEE 2017, 105, 1214–1233. [Google Scholar] [CrossRef]
  118. Rodriguez, D.R. Physical and Social Systems Resilience Assessment and Optimization. Ph.D. Thesis, University of South Florida, Tampa, FL, USA, 2018. [Google Scholar]
  119. Kwasinski, A. Effects of Hurricane Maria on Renewable Energy Systems in Puerto Rico. In Proceedings of the 2018 7th International Conference on Renewable Energy Research and Applications (ICRERA), Paris, France, 14–17 October 2018; pp. 383–390. [Google Scholar]
  120. Huang, G.; Wang, J.; Chen, C.; Guo, C.; Zhu, B. System resilience enhancement: Smart grid and beyond. Front. Eng. Manag. 2017, 4, 271–282. [Google Scholar] [CrossRef] [Green Version]
  121. Jackson, S.; Ferris, T. Proactive and Reactive Resilience: A Comparison of Perspectives. INCOSE Insight 2015, 18, 7. [Google Scholar]
  122. Sordo, S.; Domaneschi, M.; Cimellaro, G.; Mahin, S. Seismic Resilience of Electric Power Networks in Urban Areas. In Proceedings of the IAMBAS 2018 International Conference on Bridge Maintenance, Safety and Management, Melbourne, Australia, 9–13 July 2018; pp. 1911–1919. [Google Scholar]
  123. Nikkhah, S.; Jalilpoor, K.; Kianmehr, E.; Gharehpetian, G.B. Optimal wind turbine allocation and network reconfiguration for enhancing resiliency of system after major faults caused by natural disaster considering uncertainty. IET Renew. Power Gener. 2018, 12, 1413–1423. [Google Scholar] [CrossRef]
  124. Amirioun, M.; Aminifar, F.; Lesani, H.; Shahidehpour, M. Metrics and quantitative framework for assessing microgrid resilience against windstorms. Int. J. Electr. Power Energy Syst. 2019, 104, 716–723. [Google Scholar] [CrossRef]
  125. Poudel, S.; Dubey, A.; Bose, A. Risk-Based Probabilistic Quantification of Power Distribution System Operational Resilience. IEEE Syst. J. 2019, 14, 3506–3517. [Google Scholar] [CrossRef] [Green Version]
  126. Luo, D.; Xia, Y.; Zeng, Y.; Li, C.; Zhou, B.; Yu, H.; Wu, Q. Evaluation Method of Distribution Network Resilience Focusing on Critical Loads. IEEE Access 2018, 6, 61633–61639. [Google Scholar] [CrossRef]
  127. Galvan, E.; Mandal, P.; Sang, Y. Networked microgrids with roof-top solar PV and battery energy storage to improve distribution grids resilience to natural disasters. Int. J. Electr. Power Energy Syst. 2020, 123, 106239. [Google Scholar] [CrossRef]
  128. Hosseini, M.M.; Parvania, M. Quantifying impacts of automation on resilience of distribution systems. IET Smart Grid 2020, 3, 144–152. [Google Scholar] [CrossRef]
  129. Nateghi, R. Multi-Dimensional Infrastructure Resilience Modeling: An Application to Hurricane-Prone Electric Power Distribution Systems. IEEE Access 2018, 6, 13478–13489. [Google Scholar] [CrossRef]
  130. Kwasinski, A. Quantitative Model and Metrics of Electrical Grids’ Resilience Evaluated at a Power Distribution Level. Energies 2016, 9, 93. [Google Scholar] [CrossRef]
  131. Wang, H.; Wang, S.; Yu, L.; Hu, P. A novel planning-attack-reconfiguration method for enhancing resilience of distribution systems considering the whole process of resiliency. Int. Trans. Electr. Energy Syst. 2020, 30, 12199. [Google Scholar] [CrossRef]
  132. Yuan, W.; Wang, J.; Qiu, F.; Chen, C.; Kang, C.; Zeng, B. Robust Optimization-Based Resilient Distribution Network Planning Against Natural Disasters. IEEE Trans. Smart Grid 2016, 7, 2817–2826. [Google Scholar] [CrossRef]
  133. Shelar, D.; Amin, S.; Hiskens, I. Resilience of Electricity Distribution Networks—Part II: Leveraging Microgrids. IEEE Transactions on Control Network Systems. May 2019. Available online: http://arxiv.org/abs/1812.01745 (accessed on 1 December 2020).
  134. MacKenzie, C.A.; Zobel, C.W. Allocating Resources to Enhance Resilience, with Application to Superstorm Sandy and an Electric Utility: Allocating Resources to Enhance Resilience. Risk Anal. 2015, 36, 847–862. [Google Scholar] [CrossRef] [PubMed]
  135. Liu, J.; Qin, C.; Yu, Y. Enhancing Distribution System Resilience with Proactive Islanding and RCS-Based Fast Fault Isolation and Service Restoration. IEEE Trans. Smart Grid 2020, 11, 2381–2395. [Google Scholar] [CrossRef]
  136. Chanda, S.; Srivastava, A.K.; Mohanpurkar, M.U.; Hovsapian, R. Quantifying Power Distribution System Resiliency Using Code-Based Metric. IEEE Trans. Ind. Appl. 2018, 54, 3676–3686. [Google Scholar] [CrossRef]
  137. Bajpai, P.; Chanda, S.; Srivastava, A.K. A Novel Metric to Quantify and Enable Resilient Distribution System Using Graph Theory and Choquet Integral. IEEE Trans. Smart Grid 2018, 9, 2918–2929. [Google Scholar] [CrossRef]
  138. Hussain, A.; Bui, V.-H.; Kim, H.-M. Resilience-Oriented Optimal Operation of Networked Hybrid Microgrids. IEEE Trans. Smart Grid 2017, 10, 204–215. [Google Scholar] [CrossRef]
  139. Jamborsalamati, P.; Hossain, J.; Taghizadeh, S.; Konstantinou, G.; Manbachi, M.; Dehghanian, P. Enhancing Power Grid Resilience Through an IEC61850-Based EV-Assisted Load Restoration. IEEE Trans. Ind. Inform. 2019, 16, 1799–1810. [Google Scholar] [CrossRef]
  140. Renofio, J.R.R.; Pellenz, M.E.; Santin, A.; Jamhour, E.; Penna, M.C.; Souza, R.D. Insights on the resilience and capacity of AMI wireless networks. In Proceedings of the 2016 IEEE Symposium on Computers and Communication (ISCC), Messina, Italy, 27–30 June 2016; pp. 610–615. [Google Scholar]
  141. Shahraeini, M.; Kotzanikolaou, P. A Dependency Analysis Model for Resilient Wide Area Measurement Systems in Smart Grid. IEEE J. Sel. Areas Commun. 2019, 38, 156–168. [Google Scholar] [CrossRef]
  142. Erdene-Ochir, O.; Abdallah, M.; Qaraqe, K.; Minier, M.; Valois, F. Routing resilience evaluation for smart metering: Definition, metric and techniques. In Proceedings of the 2014 IEEE 25th Annual International Symposium on Personal, Indoor, and Mobile Radio Communication (PIMRC), Washington, DC, USA, 2–5 September 2014; pp. 1867–1871. [Google Scholar]
  143. Ji, C.; Wei, Y. Dynamic resilience for power distribution and customers. In Proceedings of the 2015 IEEE International Conference on Smart Grid Communications (SmartGridComm), Miami, FL, USA, 2–5 November 2015; pp. 822–827. [Google Scholar]
  144. Aydeger, A.; Akkaya, K.; Cintuglu, M.H.; Uluagac, A.S.; Mohammed, O. Software defined networking for resilient communications in Smart Grid active distribution networks. In Proceedings of the 2016 IEEE International Conference on Communications (ICC), Kuala Lumpur, Malaysia, 23–27 May 2016; pp. 1–6. [Google Scholar]
  145. Kwasinski, A. Realistic assessment of building power supply resilience for information and communications technologies systems. In Proceedings of the 2016 IEEE International Telecommunications Energy Conference (INTELEC), Austin, TX, USA, 23–27 October 2016; pp. 1–8. [Google Scholar]
  146. Wafler, J.; Heegaard, P.E. Interdependency in smart grid recovery. In Proceedings of the 2015 7th International Workshop on Reliable Networks Design and Modeling (RNDM), Munich, Germany, 5–7 October 2015; pp. 201–207. [Google Scholar]
  147. Lasseter, R.H. Smart Distribution: Coupled Microgrids. Proc. IEEE 2011, 99, 1074–1082. [Google Scholar] [CrossRef]
  148. Farzin, H.; Fotuhi-Firuzabad, M.; Moeini-Aghtaie, M. Enhancing Power System Resilience through Hierarchical Outage Management in Multi-Microgrids. IEEE Trans. Smart Grid 2016, 7, 2869–2879. [Google Scholar] [CrossRef]
  149. Gholami, A.; Shekari, T.; Aminifar, F.; Shahidehpour, M. Microgrid Scheduling with Uncertainty: The Quest for Resilience. IEEE Trans. Smart Grid 2016, 7, 2849–2858. [Google Scholar] [CrossRef]
  150. Gao, H.; Chen, Y.; Xu, Y.; Liu, C.-C. Resilience-Oriented Critical Load Restoration Using Microgrids in Distribution Systems. IEEE Trans. Smart Grid 2016, 7, 2837–2848. [Google Scholar] [CrossRef]
  151. Chen, C.; Wang, J.; Qiu, F.; Zhao, D. Resilient Distribution System by Microgrids Formation after Natural Disasters. IEEE Trans. Smart Grid 2016, 7, 958–966. [Google Scholar] [CrossRef]
  152. Rehmani, M.H.; Davy, A.; Jennings, B.; Assi, C. Software Defined Networks-Based Smart Grid Communication: A Comprehensive Survey. IEEE Commun. Surv. Tutorials 2019, 21, 2637–2670. [Google Scholar] [CrossRef]
  153. Zeng, Z.; Fang, Y.-P.; Zhai, Q.; Du, S. A Markov reward process-based framework for resilience analysis of multistate energy systems under the threat of extreme events. Reliab. Eng. Syst. Saf. 2021, 209, 107443. [Google Scholar] [CrossRef]
  154. Donges, J.F.; Schultz, H.C.H.; Marwan, N.; Zou, Y.; Kurths, J. Investigating the topology of interacting networks. Eur. Phys. J. B 2011, 84, 635–651. [Google Scholar] [CrossRef] [Green Version]
  155. Buldyrev, S.V.; Parshani, R.; Paul, G.; Stanley, H.E.; Havlin, S. Catastrophic cascade of failures in interdependent networks. Nat. Cell Biol. 2010, 464, 1025–1028. [Google Scholar] [CrossRef] [Green Version]
  156. Renschler, C.S.; Frazier, A.E.; Arendt, L.A.; Cimellaro, G.P.; Reinhorn, A.M.; Bruneau, M. A Framework for Defining and Measuring Resilience at the Community Scale: The PEOPLES Resilience Framework. 2010. Available online: https://www.researchgate.net/profile/Amy-Frazier-3/publication/284507306_Framework_for_defining_and_measuring_resilience_at_the_community_scale_The_PEOPLES_resilience_framework/links/565e082408ae1ef92983a0ea/Framework-for-defining-and-measuring-resilience-at-the-community-scale-The-PEOPLES-resilience-framework.pdf (accessed on 18 December 2020).
  157. Clark, A.; Zonouz, S. Cyber-Physical Resilience: Definition and Assessment Metric. IEEE Trans. Smart Grid 2019, 10, 1671–1684. [Google Scholar] [CrossRef]
  158. Reed, D.; Wang, S.; Kapur, K.C.; Zheng, C. Systems-Based Approach to Interdependent Electric Power Delivery and Telecommunications Infrastructure Resilience Subject to Weather-Related Hazards. J. Struct. Eng. 2016, 142, 4015011. [Google Scholar] [CrossRef]
  159. Huang, G.; Wang, J.; Chen, C.; Guo, C. Cyber-Constrained Optimal Power Flow Model for Smart Grid Resilience Enhancement. IEEE Trans. Smart Grid 2019, 10, 5547–5555. [Google Scholar] [CrossRef]
  160. Cardoni, A.; Cimellaro, G.; Domaneschi, M.; Sordo, S.; Mazza, A. Modeling the interdependency between buildings and the electrical distribution system for seismic resilience assessment. Int. J. Disaster Risk Reduct. 2020, 42, 101315. [Google Scholar] [CrossRef]
  161. Wang, X.; Shahidehpour, M.; Jiang, C.; Li, Z. Resilience Enhancement Strategies for Power Distribution Network Coupled with Urban Transportation System. IEEE Trans. Smart Grid 2019, 10, 4068–4079. [Google Scholar] [CrossRef]
  162. Najafi, J.; Peiravi, A.; Anvari-Moghaddam, A.; Guerrero, J. An efficient interactive framework for improving resilience of power-water distribution systems with multiple privately-owned microgrids. Int. J. Electr. Power Energy Syst. 2020, 116, 105550. [Google Scholar] [CrossRef]
Figure 1. OSI-based classification of quality in relation with resilience [78].
Energies 14 02888 g001
Figure 2. Proposed classification for resilience evaluation frameworks.
Energies 14 02888 g002
Figure 3. Performance curve for resilience quantification.
Energies 14 02888 g003
Figure 4. Options for resilience evaluation timing and associated objectives.
Energies 14 02888 g004
Table 1. Review of handled extreme event and performance calculation method—electric service.
PaperExtreme EventPerformance Calculation
Single EventWide-Range of EventsGeneric EventSystem ModelEmpirical ModelSurrogate Model
Contingency ModelFragility ModelRestoration ModelFunctional Model
[122]Earthquake Range of Peak Ground AccelerationProbabilistic component fragilityDiscretized restoration functionsMatpower AC load flow analysis
[123]Weather Event Possibilistic-Scenario model AC Power Flow Analysis
[124]Wind storm Probabilistic profileFixed restoration time Included in OPF constraints
[125] Restoration problem as a MILPPower Flow (not explicitly mentioned)
[126]Typhoon weather Batts model for wind speedProposed fixed repair time
[127] Generic Storm Matpower load flow analysis
[128]Hurricane Stochastic Spatio-Temporal Hurricane Impact Analysis tool (STHIA)Ranges of Localization, Switching, and Repair timesSimulated Power Flow Analysis
[129] Machine Learning based
[130] Natural disasters e.g. Hurricane, Tropical cyclone, Earthquake, Tsunami Collected Field Data
[131] Worst N-k contingencies determined by knapsack problemRestoration rate-based optimizationPower Flow + Graph Theory
[132] Extended N-k Network Interdiction Model Linear Distribution Power Flow Analysis
[133]Cyber-Physical Attack Min-cardinality Disruption problemRestoration problem as a multi-period MIP
[134]Storm Sandy ConEdison Data
[135] Generic Faults in the distribution network Proposed MILP model for pre-event, degradation, isolation, and restoration phases with topological & operational constraints
[136] Generic events: duration from 1 to 106 SMATLAB/Simulink simulation-based model including Power Flow
[137] Generic Contingency Scenarios
[138] Generic emergency Robust counterpart of deterministic model
[139] Generic fault in a feeder Real-Time Digital Simulator
Table 2. Objective and time of evaluation for resilience.
[122][123][124][125][126][127][128][129][130][131][132][133][134][135][136][137][138][139][140][141][142][143][144][145]
Pre-EventResilience Assessmentx x x x
Planning for Robustness x x x xx xx x
Planning for Recovery x x xx
Event Real TimeResilience Assessment x
Response by Robustness x xxx
Response by Recovery x x
Post-RecoveryResilience Assessment x x xxxx
Learning x
Table 3. Resilience enhancement strategies.
[122][123][124][125][126][127][128][129][130][131][132][133][134][135][136][137][138][139][140][141][142][144][145]
Hardeningxxxxx xx x x
Defensive Islanding x x
Fuel genset dispatch x x
Energy storage x xx x x x x
Repair crews x x x x x
Distributed generation x x x xxxx xxxx
Network reconfiguration x x x x
Distribution automation xx x xx
Vegetation removal x x
Load control x x
Vehicle-to-grid power x
New deployment xx
Data replication x
Random behavior x
SDN and virtualization x
Table 4. Review of handled extreme event and performance calculation method—telecom service.
PaperExtreme EventPerformance Calculation
Single EventWide-Range of EventsGeneric EventSystem ModelEmpirical Model
Contingency ModelFragility ModelRestoration ModelFunctional Model
[140] Scenarios with different network conditions Graph theory + Clustering
[141] Generic HILP event WAMS dependency graphs analysis
[142]Selective Forwarding attacks k% randomly designated compromised nodes among all network nodes WSN simulator
[143]Hurricane Sandy Spatio-temporal non-Stationary random process Real data from 4 DSOs
[144] Generic failure DayLight SDN controller interfaced with Mininet-based testing framework integrated with ns-3 network simulator
[145] Natural disasters Real data from various scenarios
Publisher’s Note: MDPI stays neutral with regard to jurisdictional claims in published maps and institutional affiliations.

