The results of the simulation work are presented in this section. Aspects such as the heat pump’s COP and the ORC efficiency as a function of load are examined in more detail. The temperature profile of the storage is also mentioned and displayed depending on the load.
3.1. Key Performance Indicators of the Working Machines
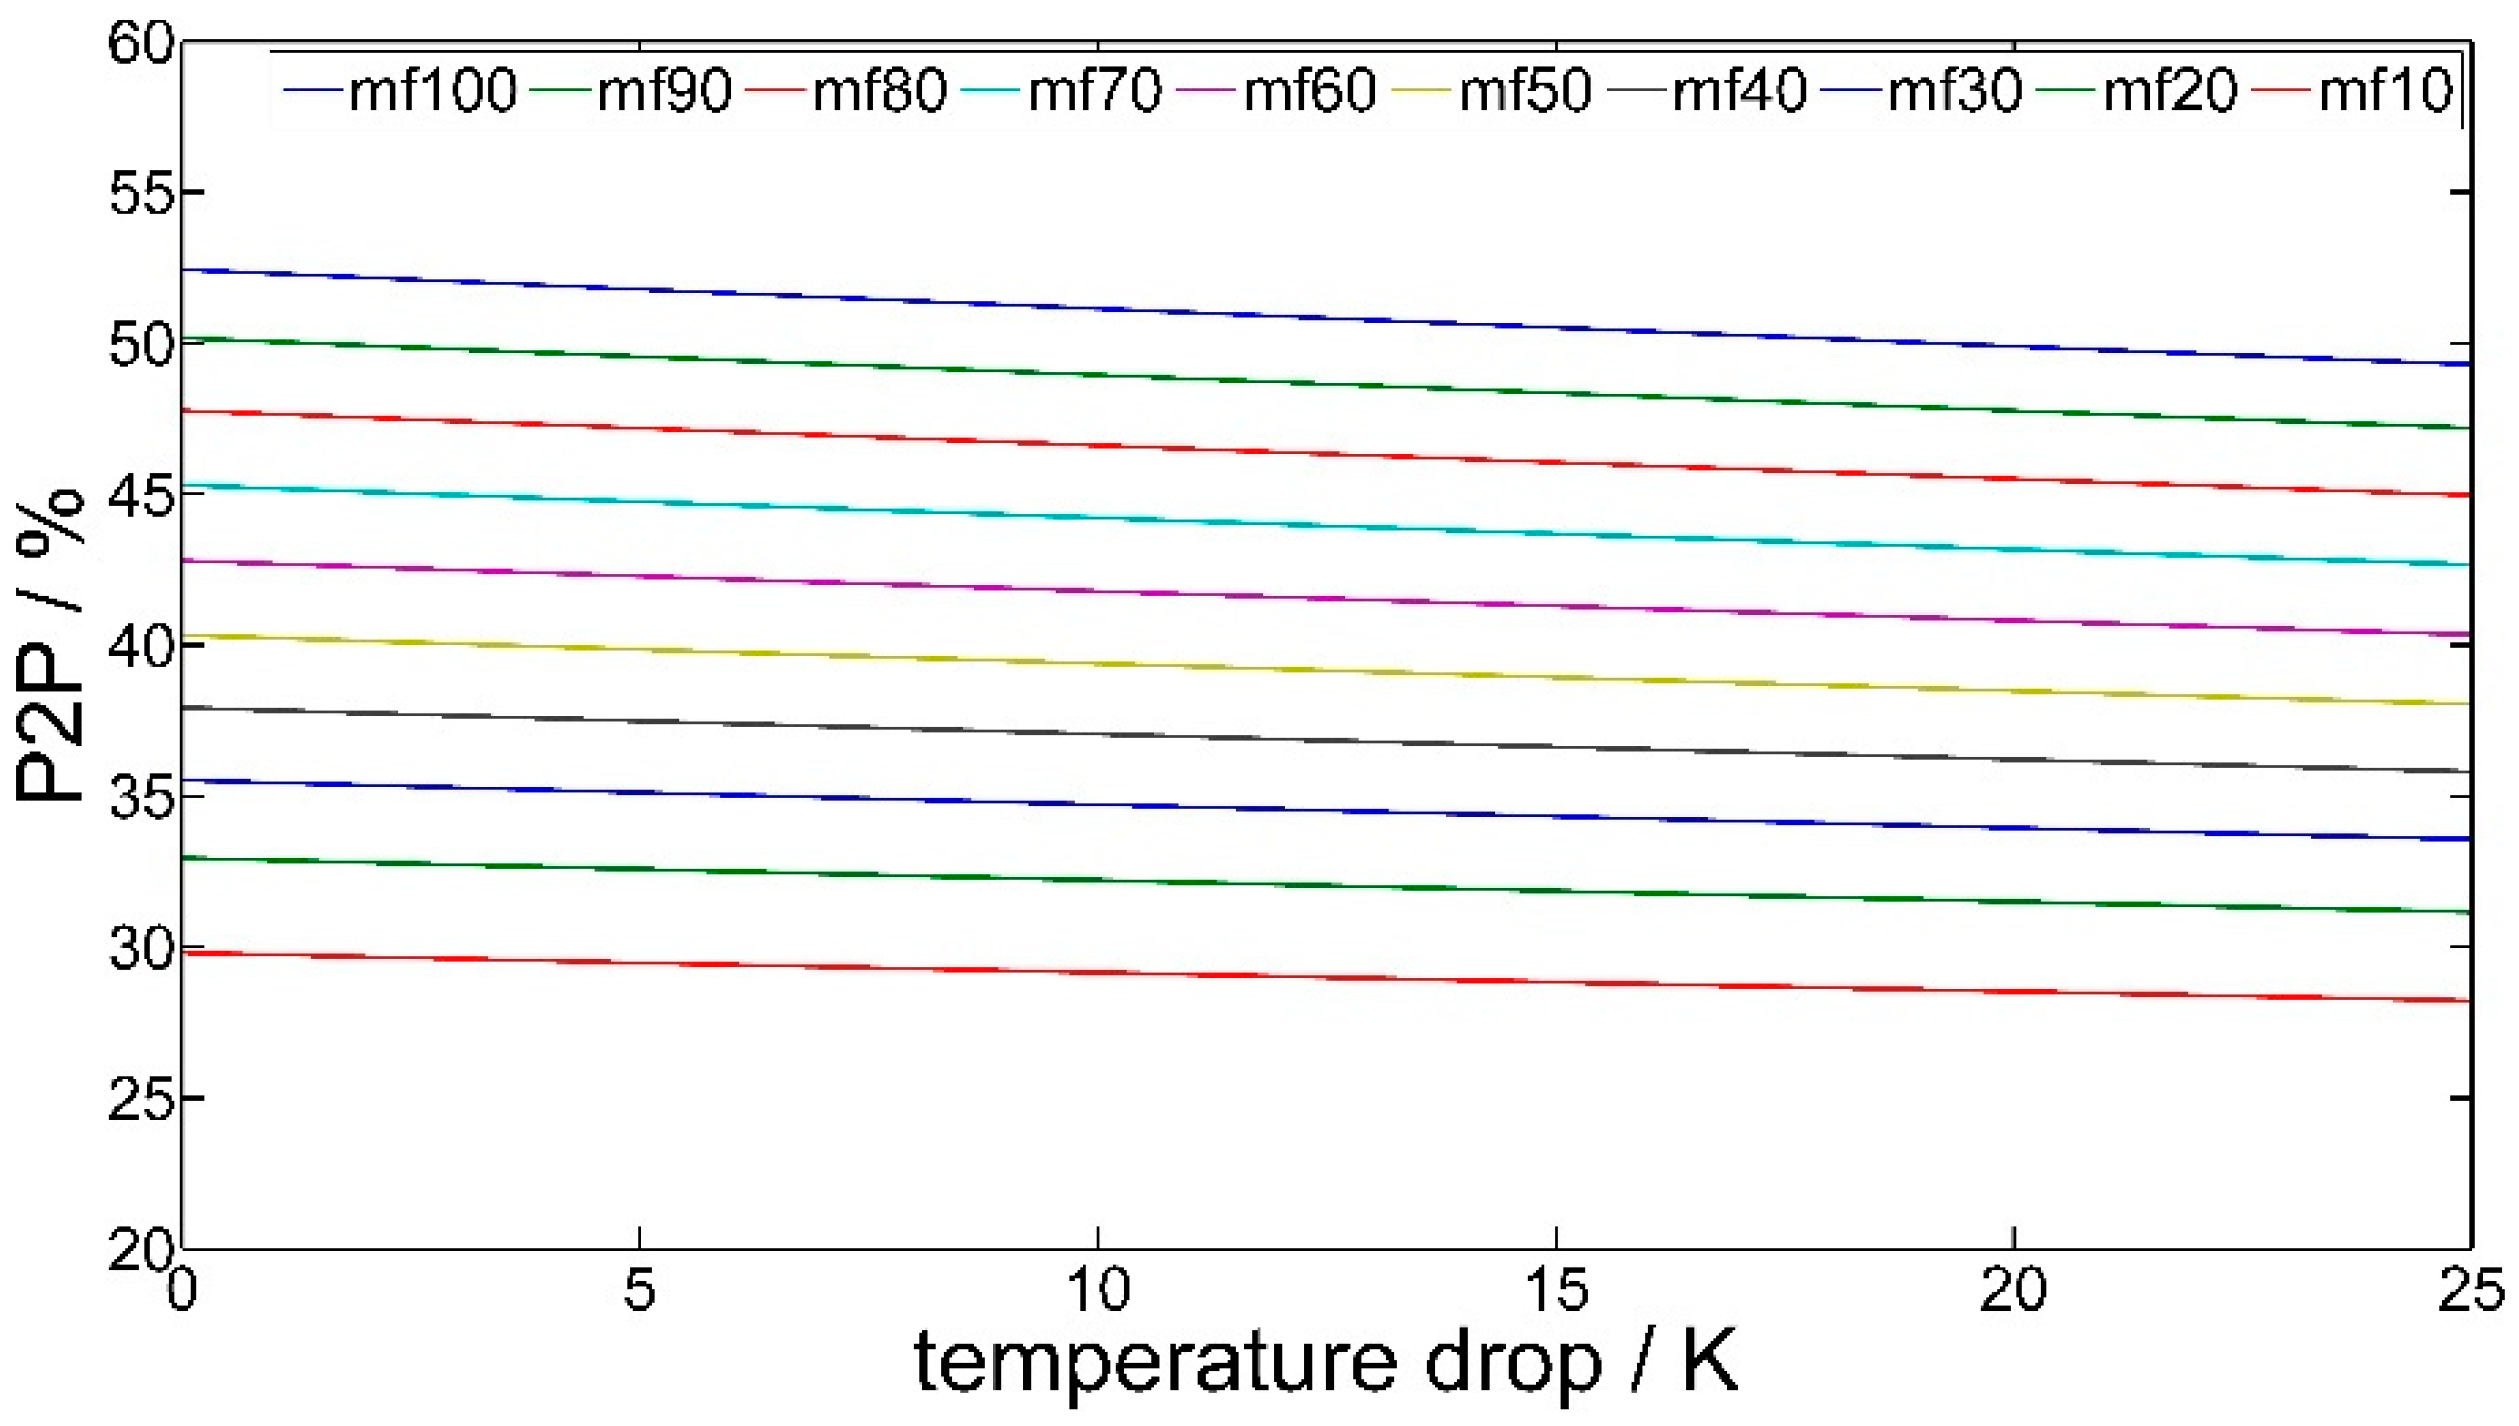
At full load, the heat pump COP reaches up to 5.0 and the ORC has an efficiency of around 10.6%. This results in a P2P efficiency of approximately 52%. The P2P course as a function of the load, which is set by the mass flow and the temperature drop after the thermal storage
, is shown in
Figure 3. The mass flow was varied at intervals of 10% and the temperature drop in 5 K steps. Each node represents a separate operating point.
Figure 3 shows that the reduction in mass flow causes a large drop in P2P efficiency. The temperature change covers a relatively small range, considering that the maximum temperature drop shows a transition from 393.15 K to only 363.15 K. However, a temperature drop still has a noticeable effect on the isentropic efficiency. As was mentioned in
Section 2.4.2, the drop in temperature affects the pressure level, which ultimately influences the isentropic efficiency through the volumetric efficiency in equation (9).
There is no correspondingly large difference when comparing the P2P value for full load operation (52%) with that of the part load case (about 40%) at a considerable temperature drop of 20 K, as well as a mass flow of 50%. This means that at half load, approximately one fifth of the P2P efficiency is lost. These results are in agreement with those of Liu et al. [
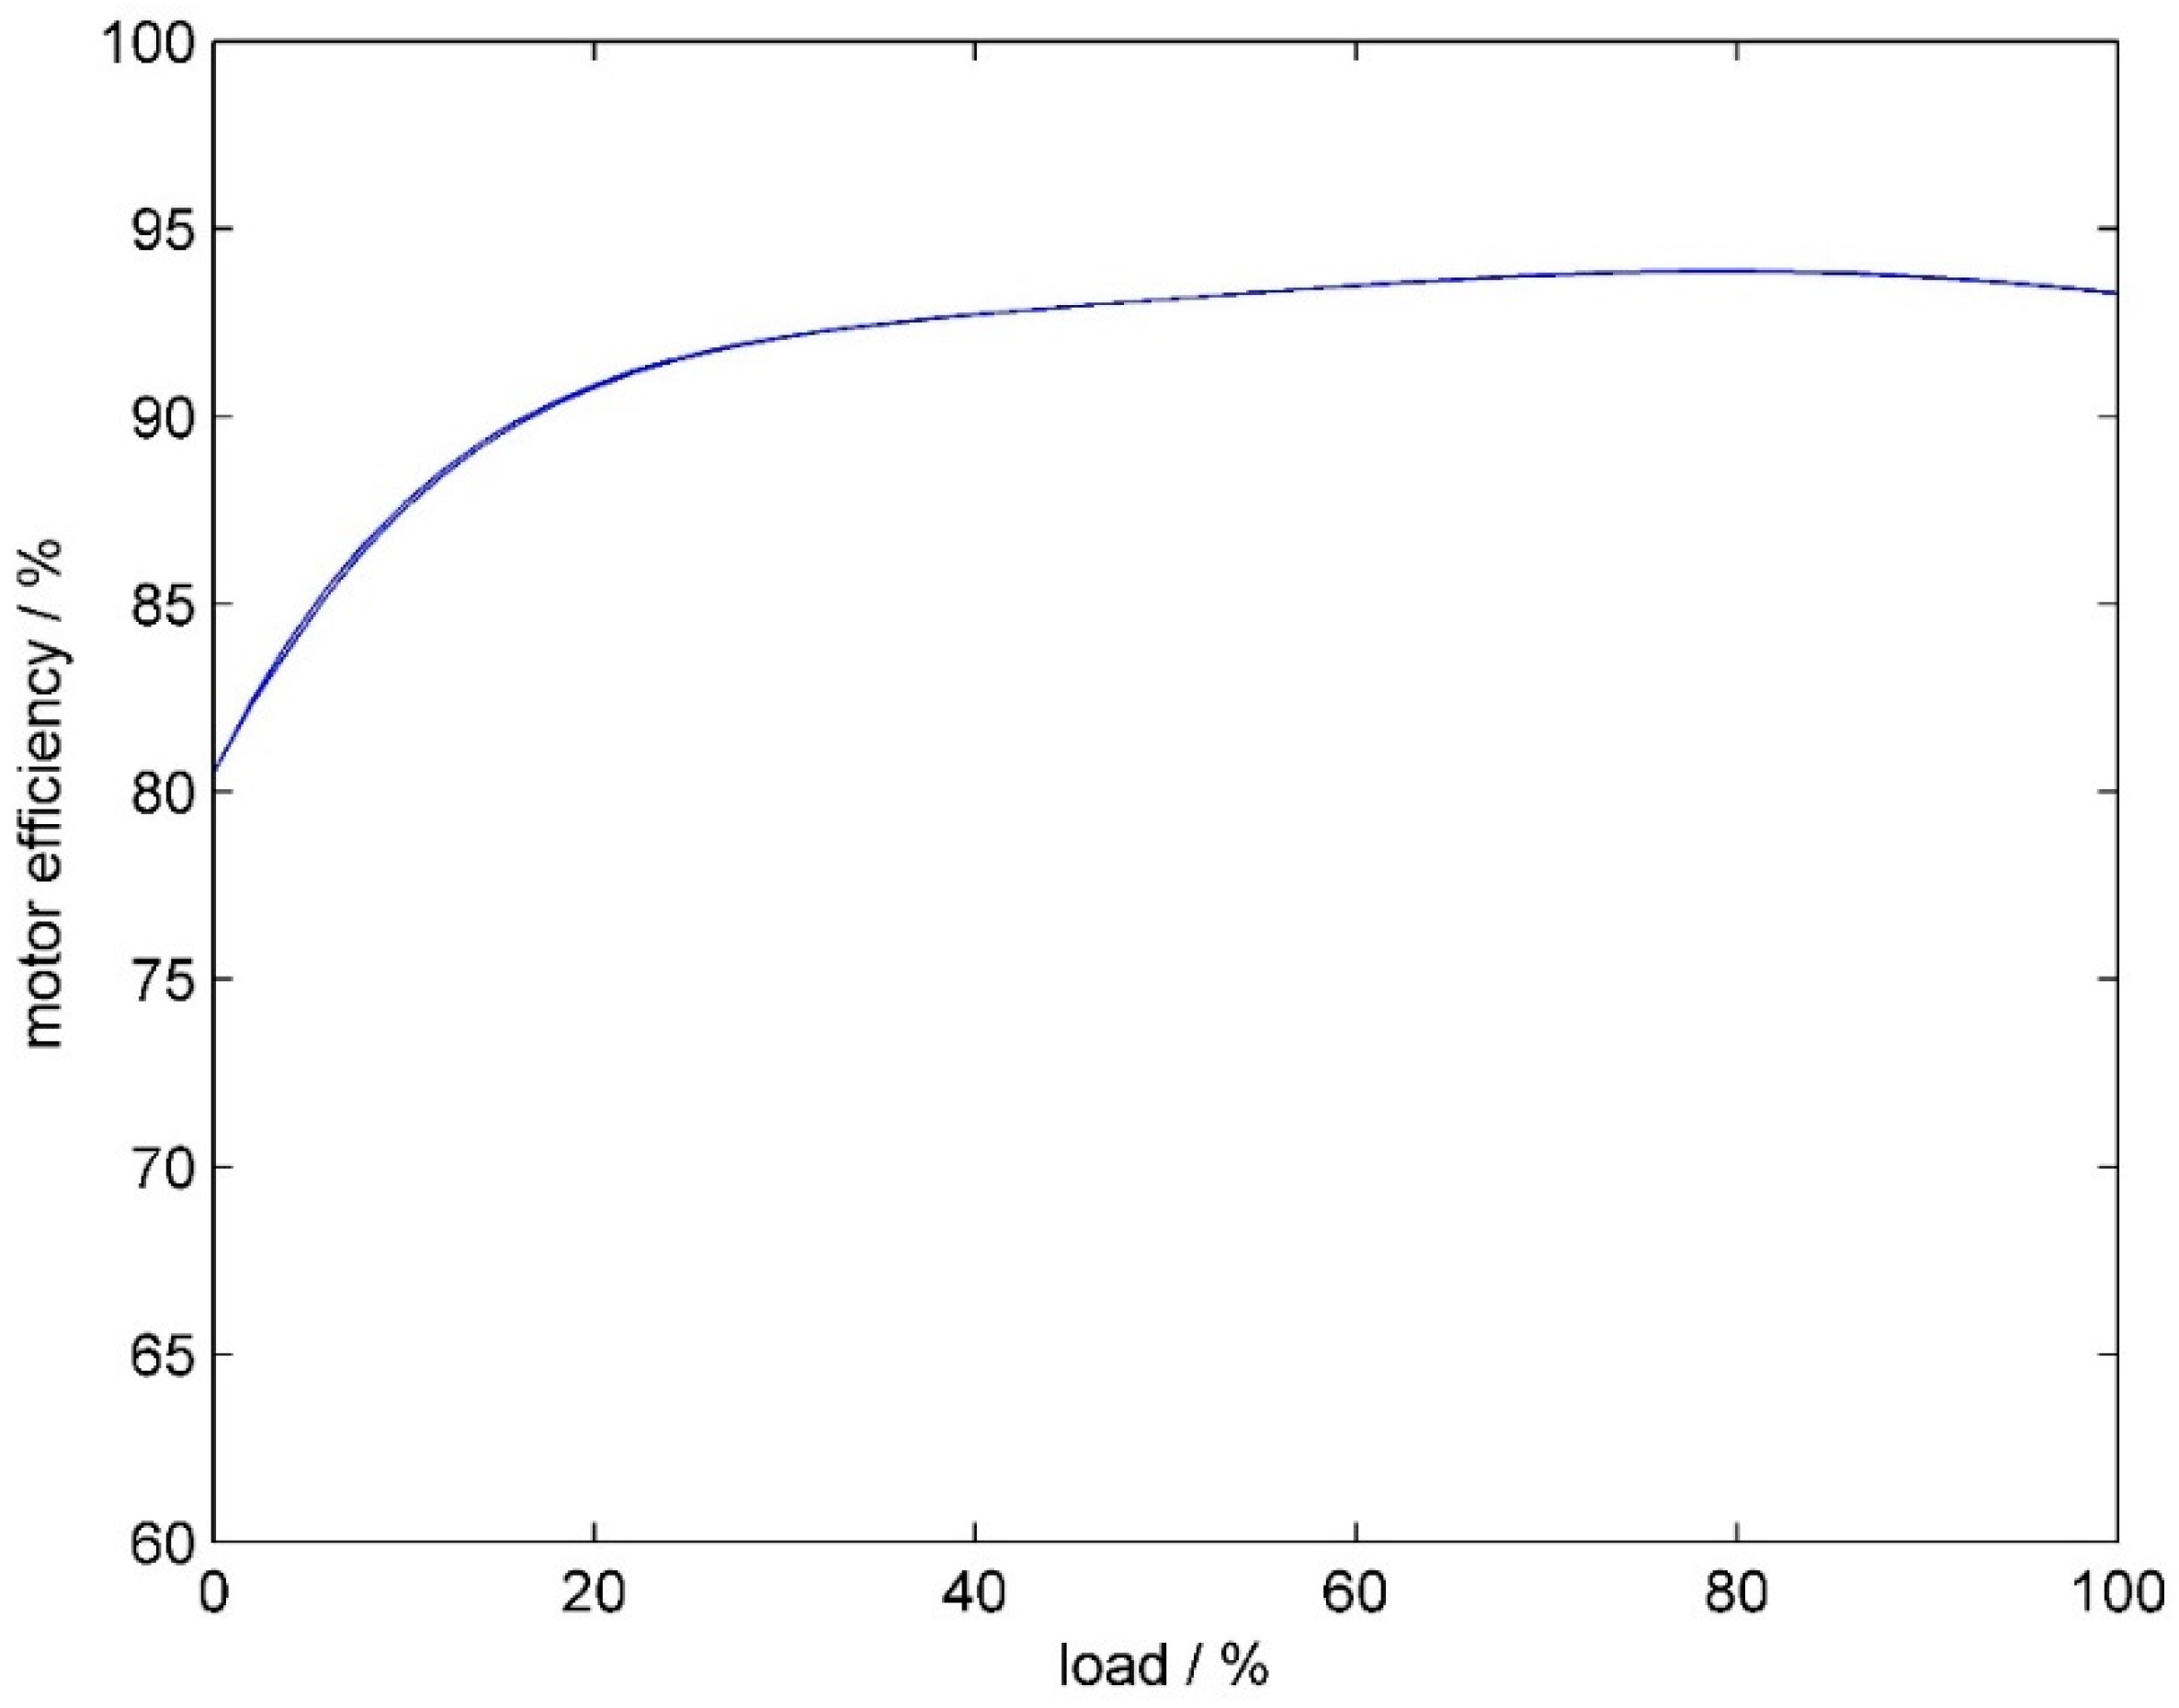
26], who also practically showed that their application had realistic efficiencies. The results would be similar for other machines, since only properties such as the motor efficiency differ. Overall, a drop in the storage temperature does not cause such large losses of the P2P efficiency compared to reducing the mass flow.
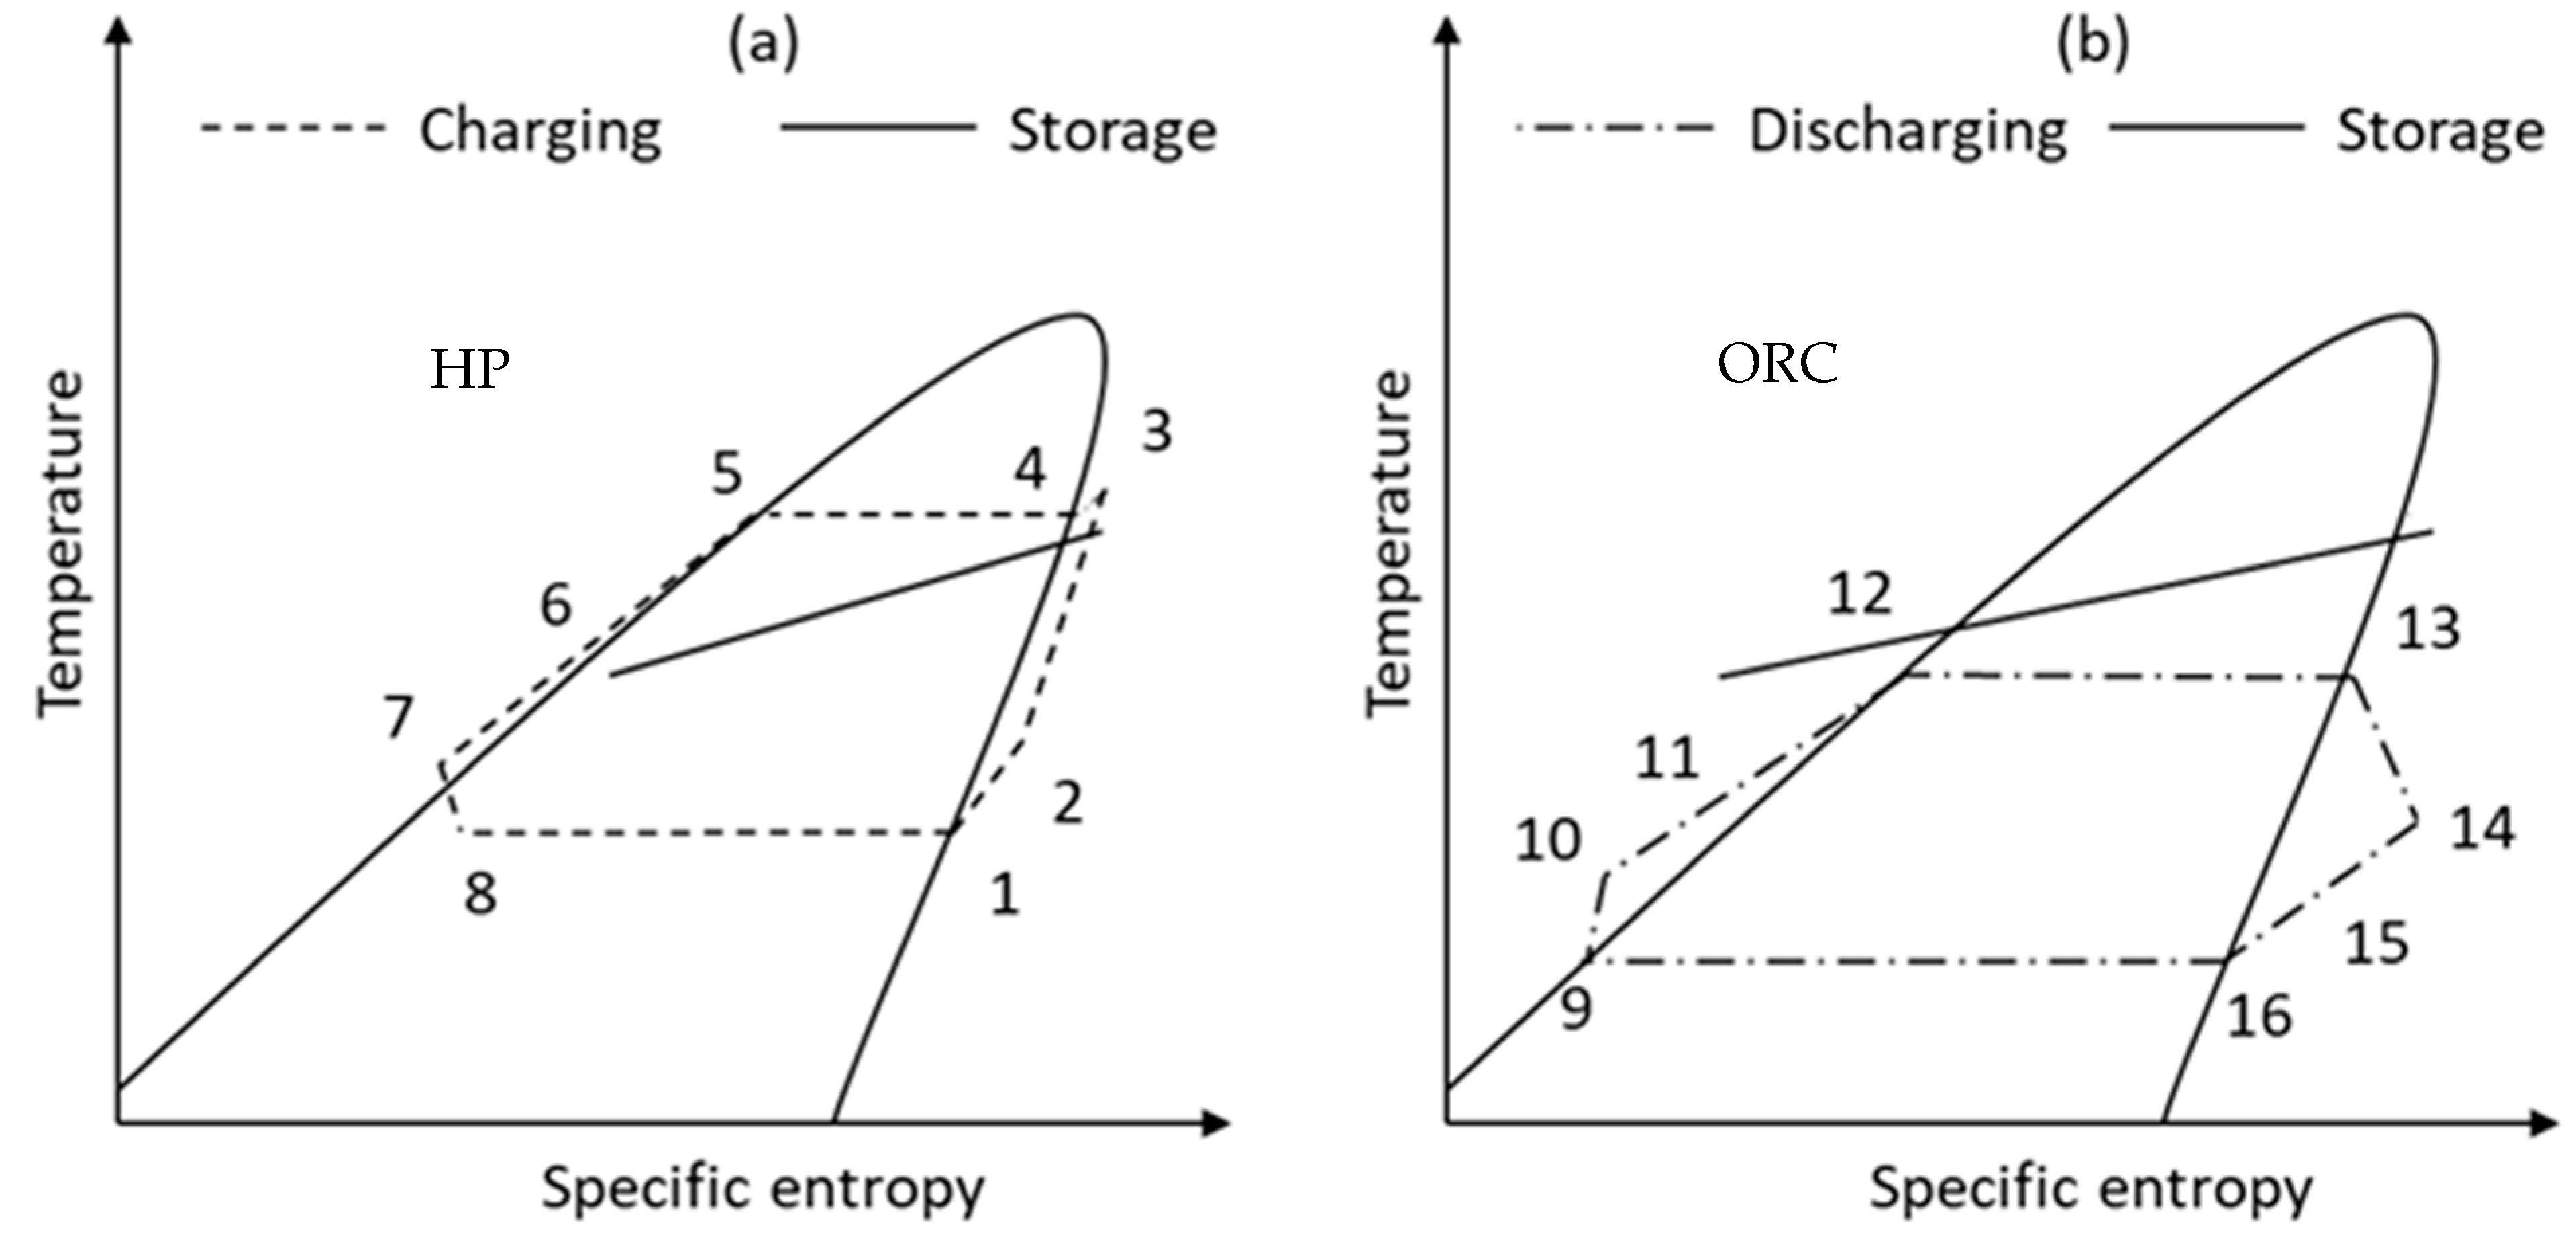
3.2. Shifting of the Pinch Point
In addition to the key performance indicators, the shift of the pinch point is also examined more closely using
t, Q-diagrams, which are shown in the following graphs. The pinch point analysis is explained in detail in the Appendix of reference [
24].
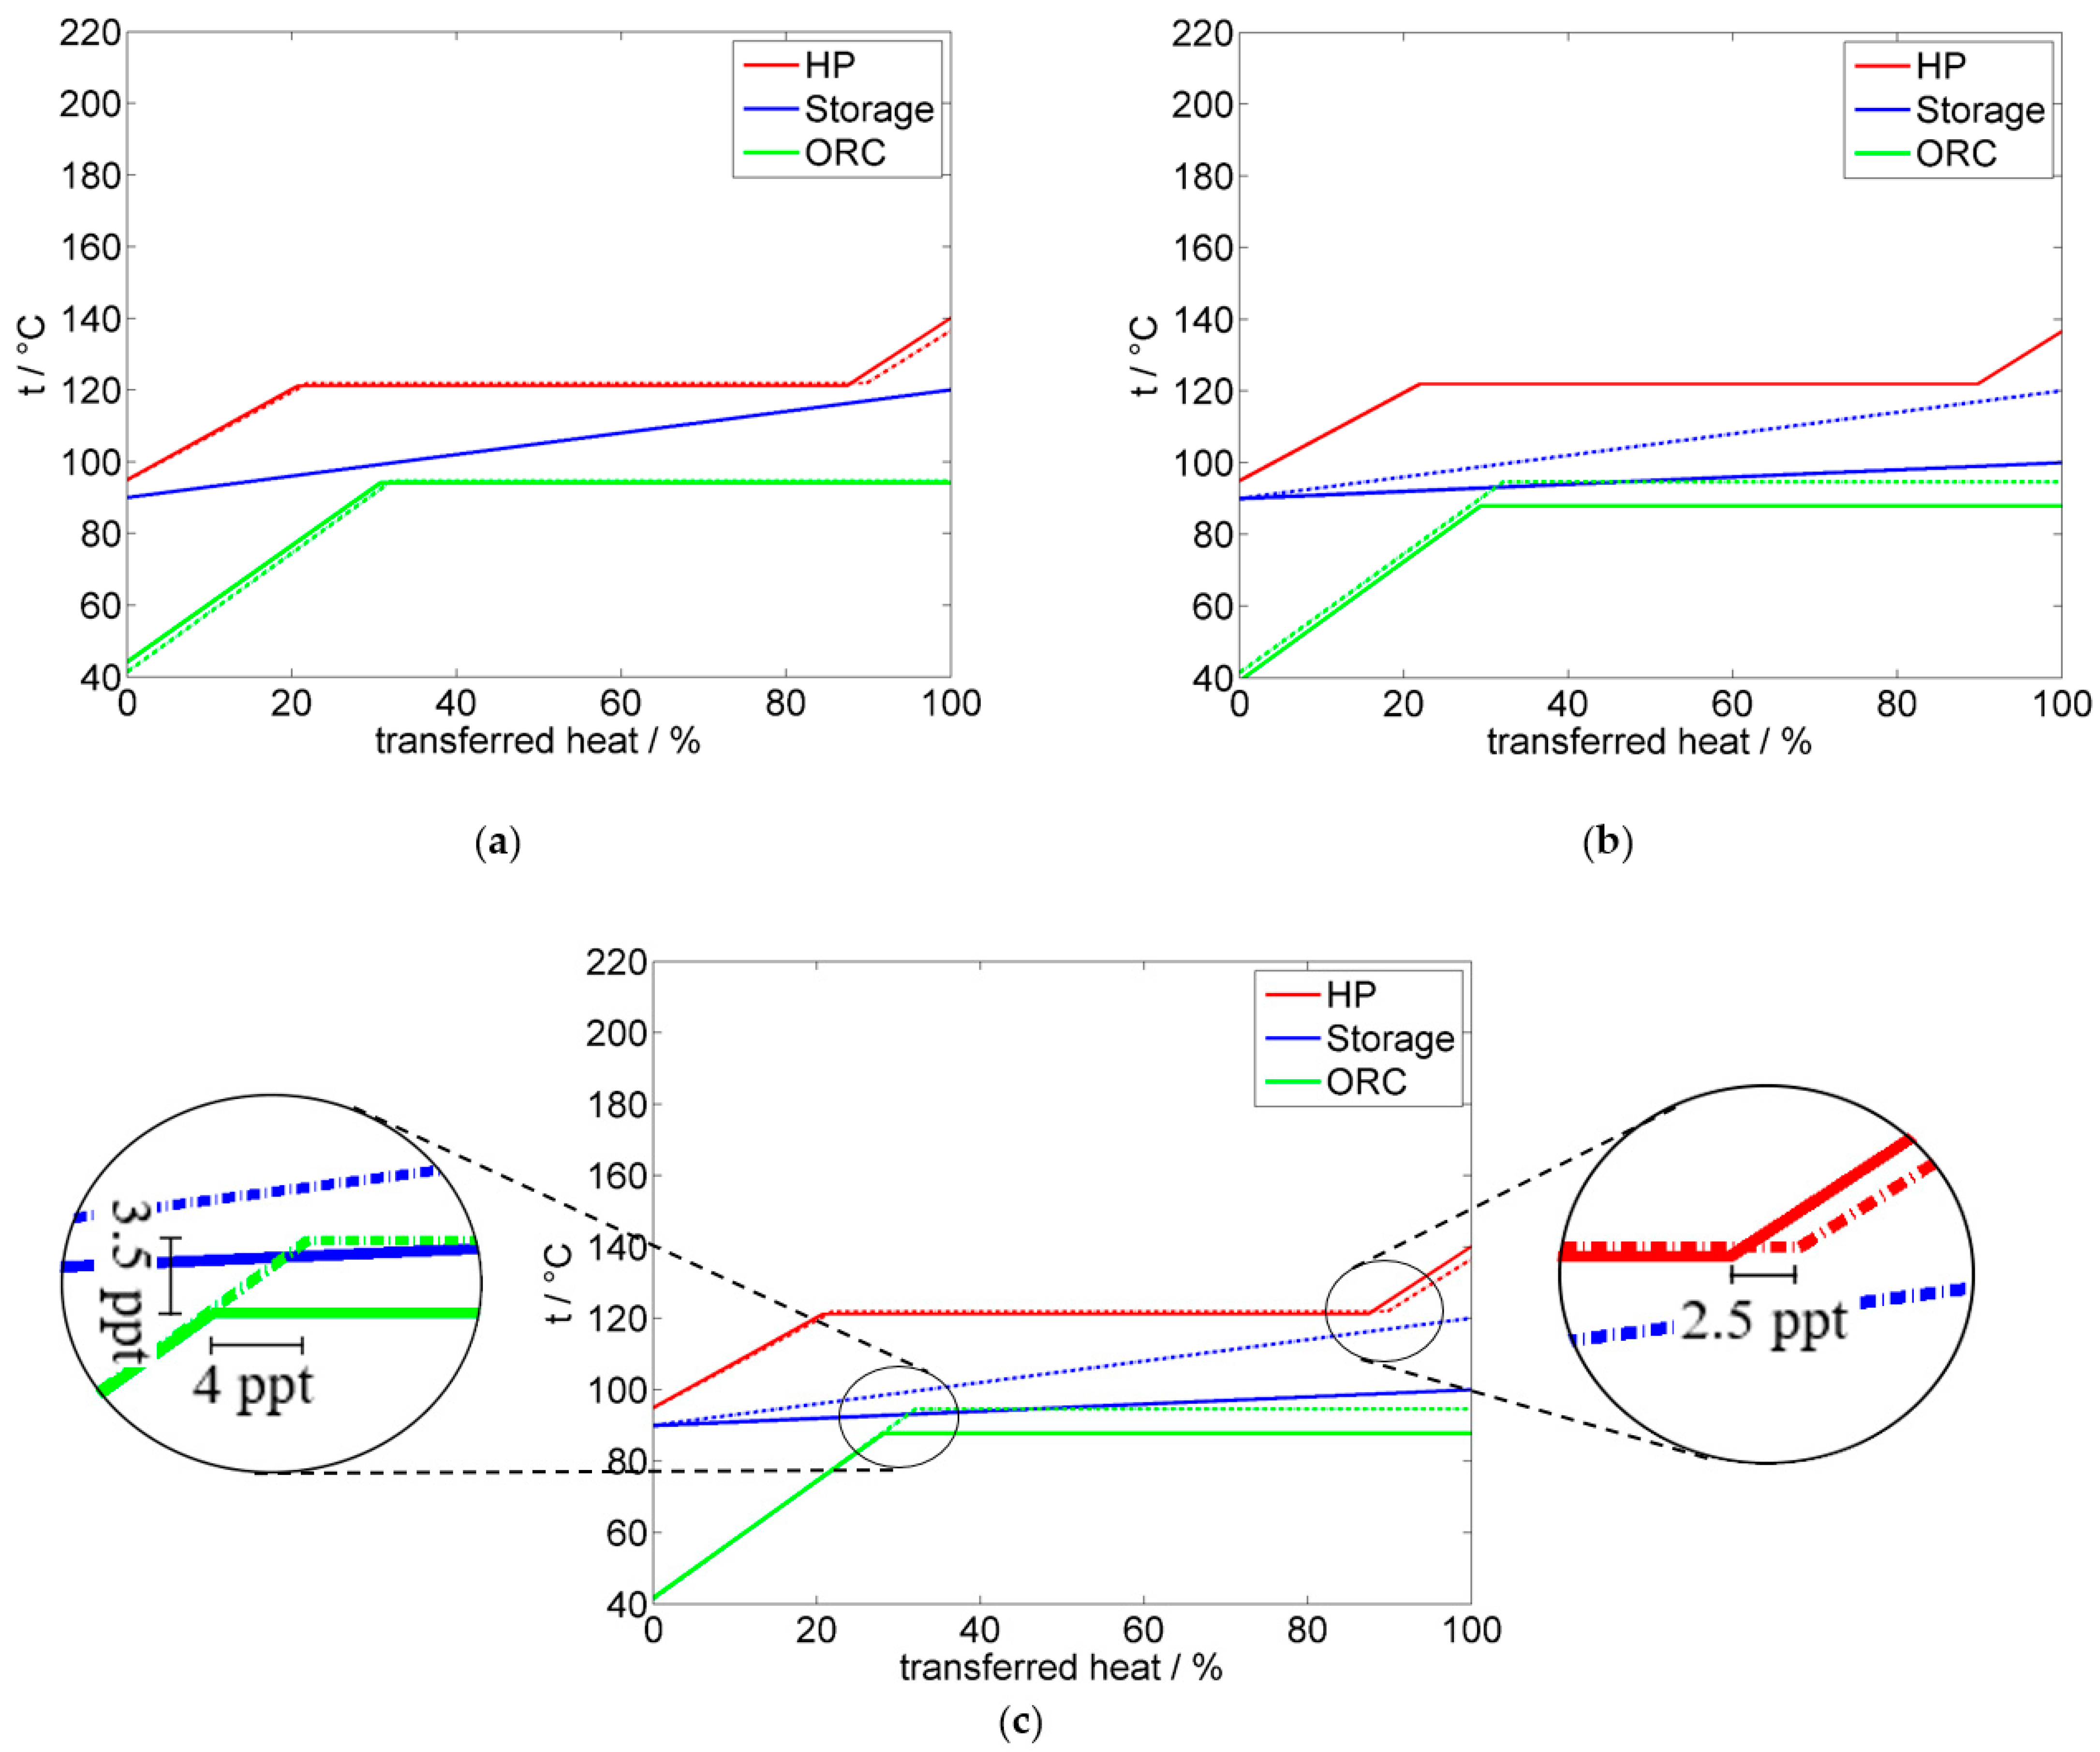
Figure 4a shows the
t, Q-curve for R1233zd for full load operation and for the part load case at a relative mass flow of 50% in both HP and ORC operation. The slight, horizontal shift of the pinch point for both operating cases shows the negative effect of the mass flow on the isentropic efficiency, which is explained as follows:
After the working medium has been brought to a higher temperature level by the compressor in HP operation, it then releases its heat to the thermal storage. Due to the poorer efficiency of the compressor at a mass flow of 50%, which leads to increased dissipation energy, the working medium has a higher temperature after compression and at the beginning of the heat transfer to the storage. Accordingly, the pinch point of the HP process is shifted horizontally by about 2.5 percentage points (ppt) compared to the full load case, because the higher inlet temperature of the superheated steam requires more cooling to reach the state of saturated steam.
In ORC mode, the working medium is evaporated while absorbing heat from the storage. The lower isentropic efficiency of the expansion machine is noticeable for the part load case with 50% mass flow, because the final temperature is about 5 K higher than in full load operation. Since the heat absorption from the storage takes place at a slightly lower pressure level, the pinch point for ORC operation is also slightly horizontally shifted to the left by about one ppt, so that a slightly increased heat transfer is required for condensation. This is because higher pressures are accompanied by higher evaporation temperatures.
The effects of a temperature drop in the thermal storage of 20 K for R1233zd is displayed in
Figure 4b. The temperature difference in the storage is clearly recognizable by the decreased straight gradient of the storage temperature. Since the mass flow in this operating point is 100%, there is no horizontal shift of the pinch point for the HP process as is the case in
Figure 4a. In fact, the process remains unchanged in this case.
For the ORC process, both a horizontal and a vertical shift of the pinch point can be observed. The horizontal displacement indicates that, as mentioned above, a larger amount of heat is required for evaporation. The vertical shift by about 7 K, which is more pronounced this time compared to the part load case at 50% mass flow, indicates that evaporation takes place at a significantly lower temperature level, since otherwise there would be an overlap between the temperature curves of the ORC and the thermal storage. It is not possible for the medium to reach the same, let alone a higher temperature, compared to the full load case, at the exit of the thermal storage. Therefore, the temperature for the pinch point must drop.
Figure 4c shows that the characteristics of the individual part load variants overlap when they are combined. Consequently, the HP process behaves like the part load case with 50% mass flow (see case (a)). For the ORC, the pinch point undergoes an additional horizontal shift due to the changed mass flow. In this case, the combined effects cancel each other out when it comes to the expansion end temperature of the ORC, which results in identical inlet and outlet temperatures at the IHX (internal heat exchanger).
These results show that a decrease in the storage temperature leads to a minor negative effect for the P2P efficiency compared to the part load behavior through reduced mass flow. The loss of thermal energy is not entirely considered in this calculation, it directly affects the P2P efficiency of the system in two ways: On the one hand, the loss of the thermal energy, which cannot be converted back into electrical power, affects the P2P efficiency. On the other hand, the loss of thermal energy results in reduced temperatures (between 90 °C and 120 °C) of the thermal storage, which is considered a reduction in the maximum storage temperature and the temperature induced part load of the ORC. For a better understanding of both effects, a dynamic simulation of the state of charge and the different temperature layers in the thermal storage is currently in development to fill this gap. This includes strategies to handle the reduced temperature layer either via HP or ORC.
3.3. Implementation of the PTES in a Small Energy Grid
In this section, an implementation of the HP-ORC system in a small energy grid is studied based on the data of a dynamic load analysis and the previously developed model. For the simulation, the software AnyLogic [
34] and the previously developed “i7-AnyEnergy” software library were used. The library contains modular components of energy systems, for example, PV or battery storages, which allows representation and simulation of complex smart grid applications. The simulation setup consists of a small settlement of 40 houses. Of these 40 houses, 20 are equipped with PV systems with a total installed capacity of 140 kW. For the power production of the PV system, solar irradiation data for the year 2016 from the German weather agency DWD [
35] (Deutscher Wetterdienst) is used. The results of Tjaden et al. [
36], in which electrical load profiles for residential buildings in Germany were created, are used to simulate the energy demand. The solar irradiance data for the city of Nuremberg in Southern Germany was considered. The maximum electrical power of the heat pump is 20 kW and up to 10 kW of electrical energy can be generated by the ORC. The thermal storage has a capacity of 1000 kWh thermal energy. This can be realized, for example, by a water storage with a volume of 28.6 m
3, which is equivalent to a tank of 2.5 m height and 1.9 m radius. For every minute of the year, the mentioned parameters were recorded and averaged over 24 h. Only the part load case due to changed mass flow was considered in this section.
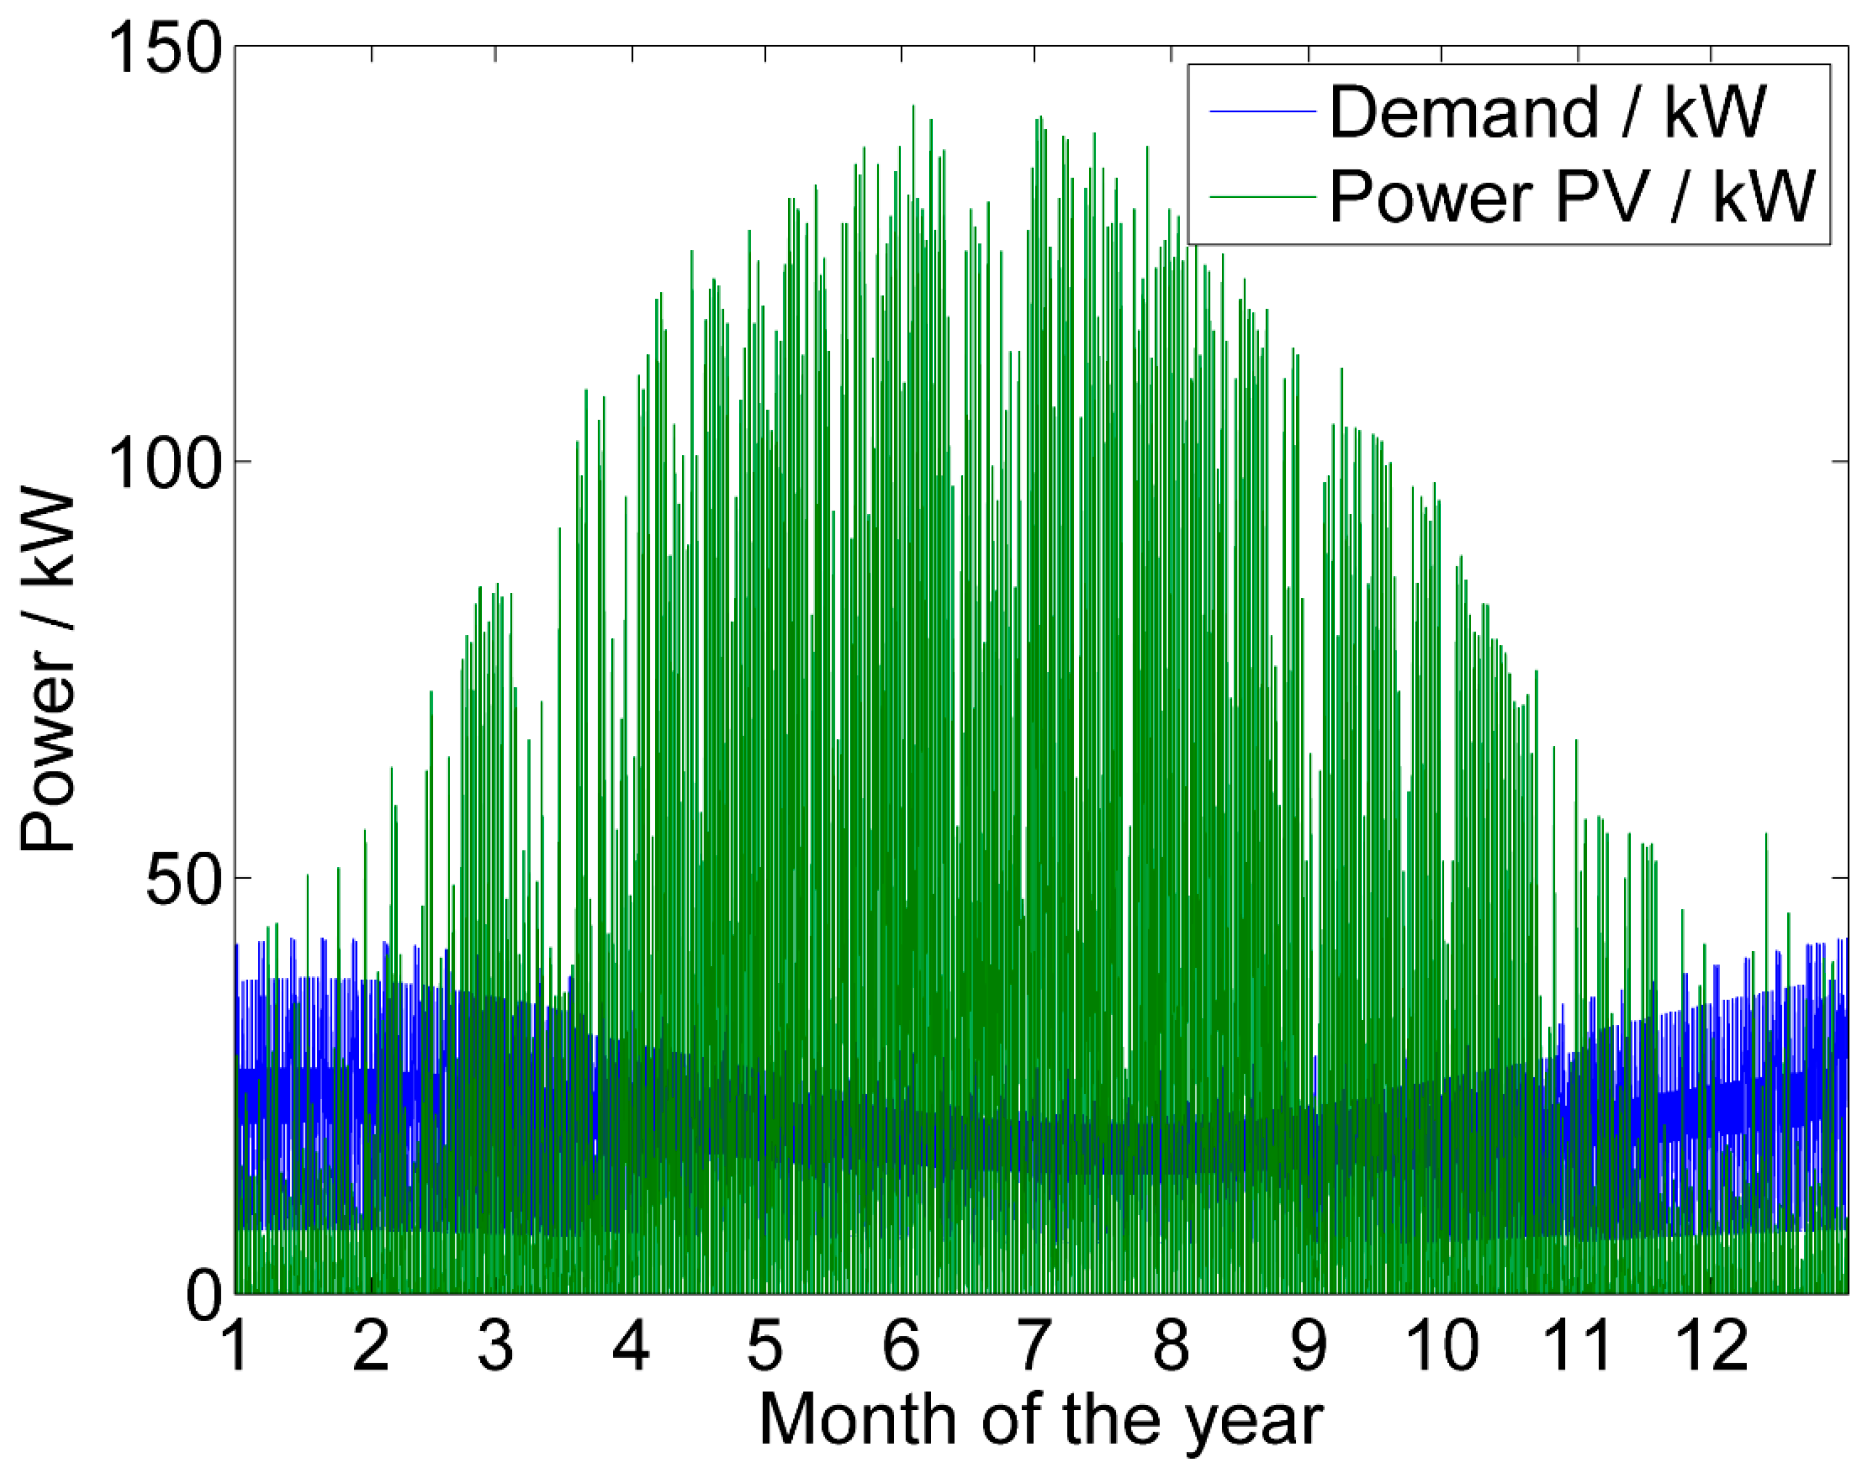
As shown in
Figure 5, the energy demand during the winter months is higher, but at the same time less electricity is supplied by the PV systems. This results in fewer ORC full load hours since the thermal storage is only charged when there is excess PV power to operate the heat pumps, which is rarely the case during winter.
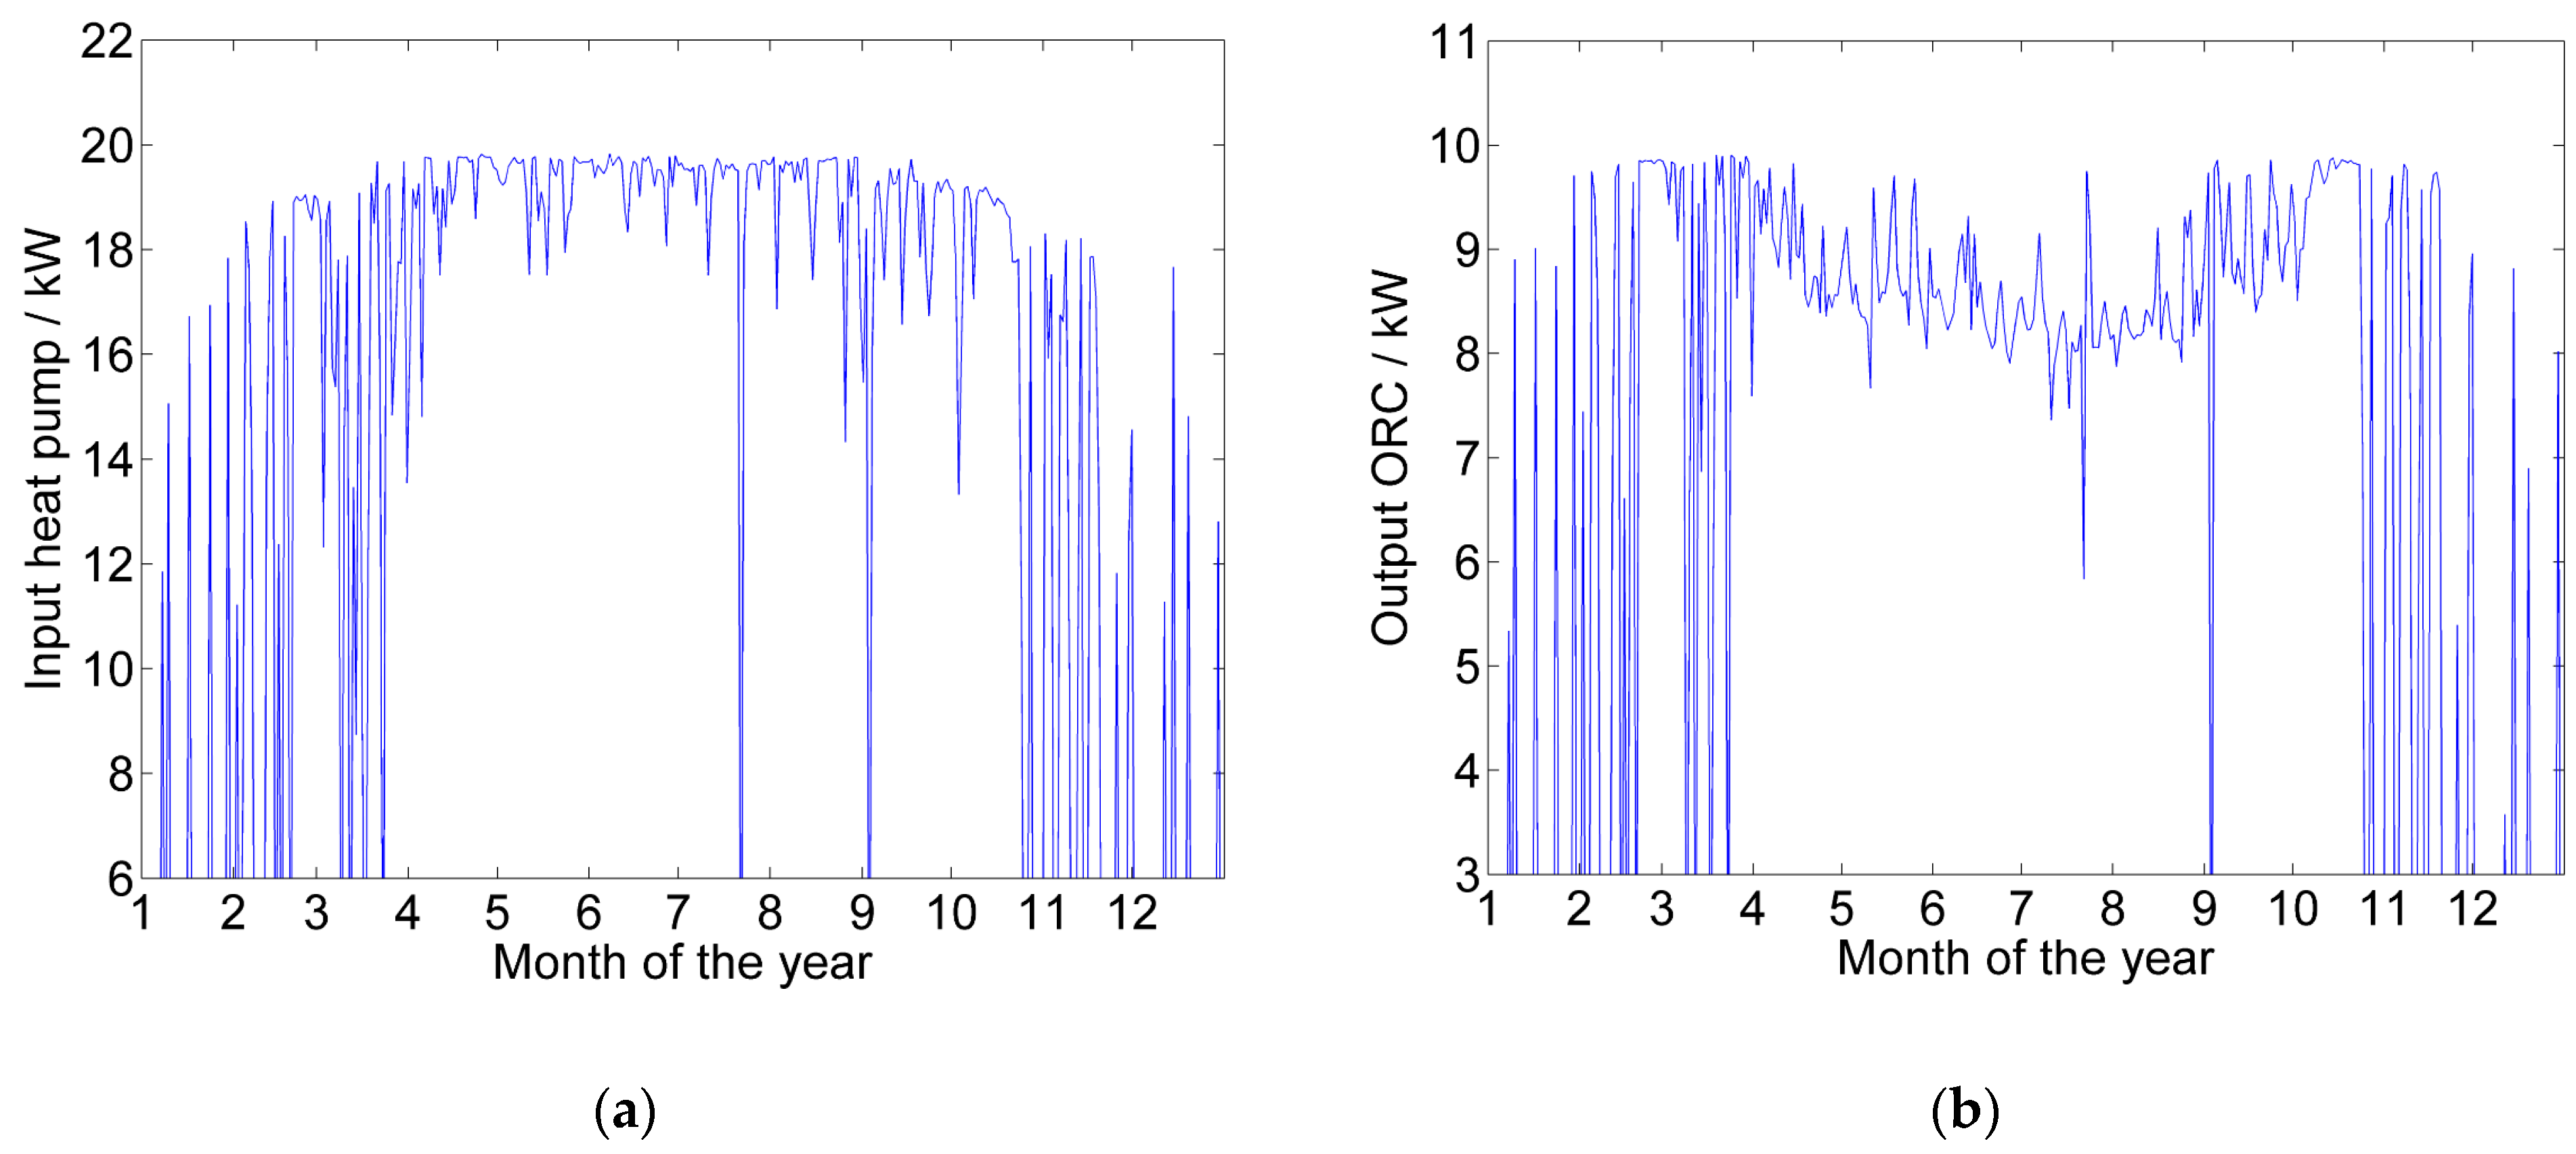
Furthermore,
Figure 6 and
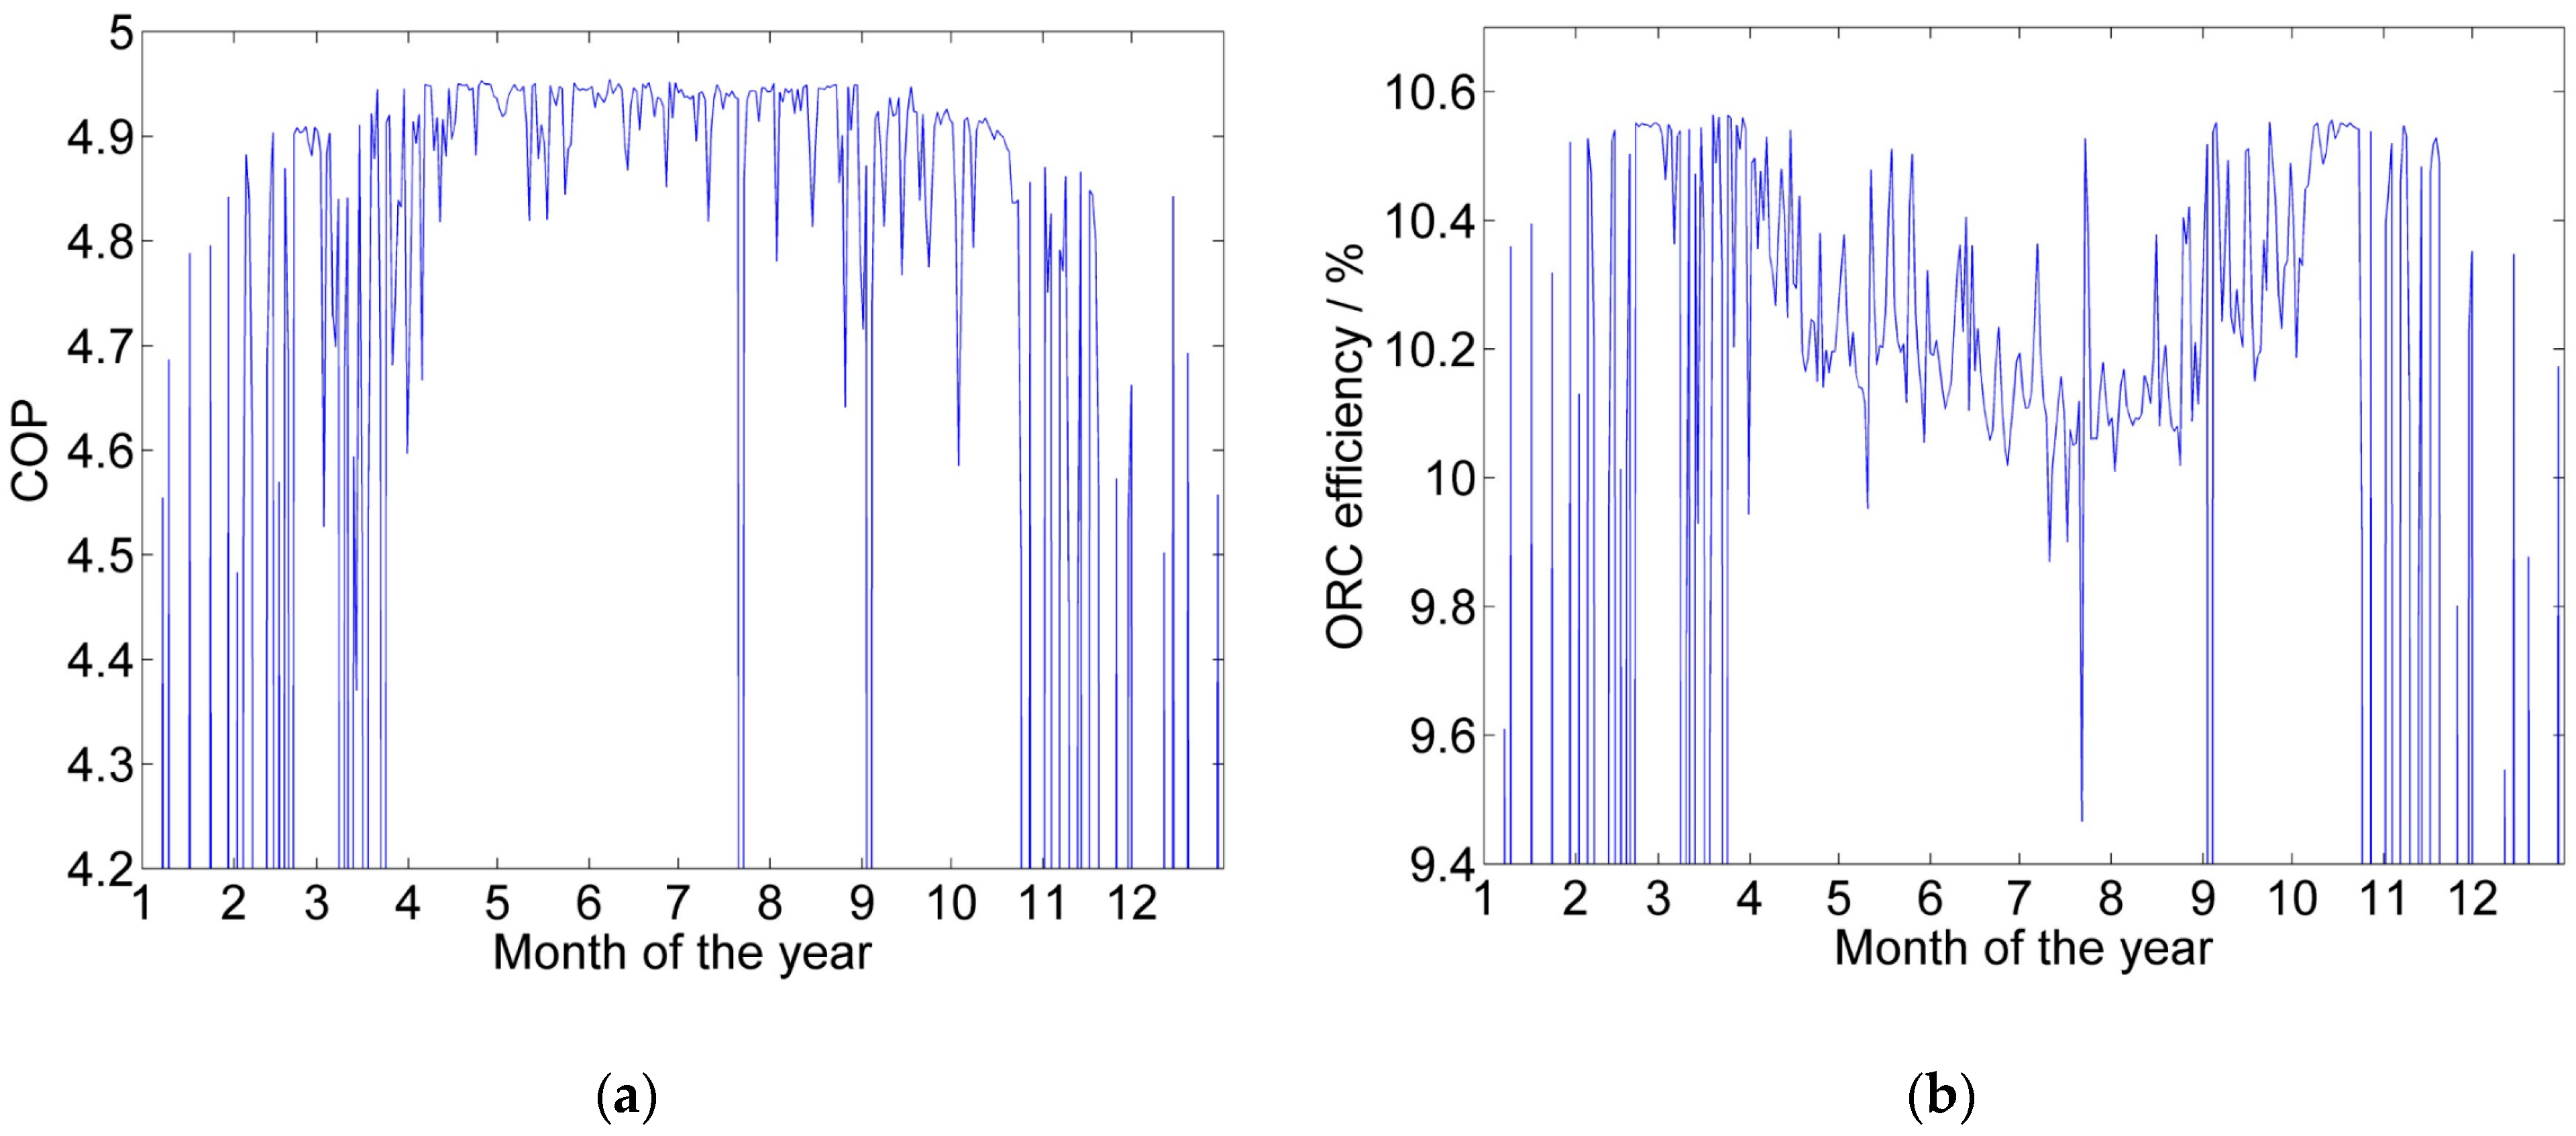
Figure 7 show that the ORC operates more often under part load conditions during summertime, since the maximum ORC power output tends to be relatively low compared to the other seasons. The reason for this is a lower state of charge of the thermal storage during the winter season, therefore the ORC operates only for short periods of time with maximum output until the thermal storage is depleted. During summer, longer operation times with changing loads lead to a lower average power output from the ORC and therefore to a slightly lower ORC efficiency. On the other hand, the heat pumps operate at full load and the 1000 kWh capacity thermal storage is filled most of the time.
During the winter months, there are often periods when the ORC is not working. This is because the thermal energy storage is empty, as the PV energy can rarely cover the demand.
Overall, there are 1979 full load hours (22.6% of the total time) for the heat pump and 1967 (22.5%) for the ORC throughout the year, where the average COP is 4.9 and the average ORC efficiency is 10.2%. The average heat pump load is 91.5% and the average ORC load is 88.5%. These values are collected in
Table 4 at the end of this section. The loads refer only to times when the respective systems are in operation. The full load hours are not evenly distributed over the months.
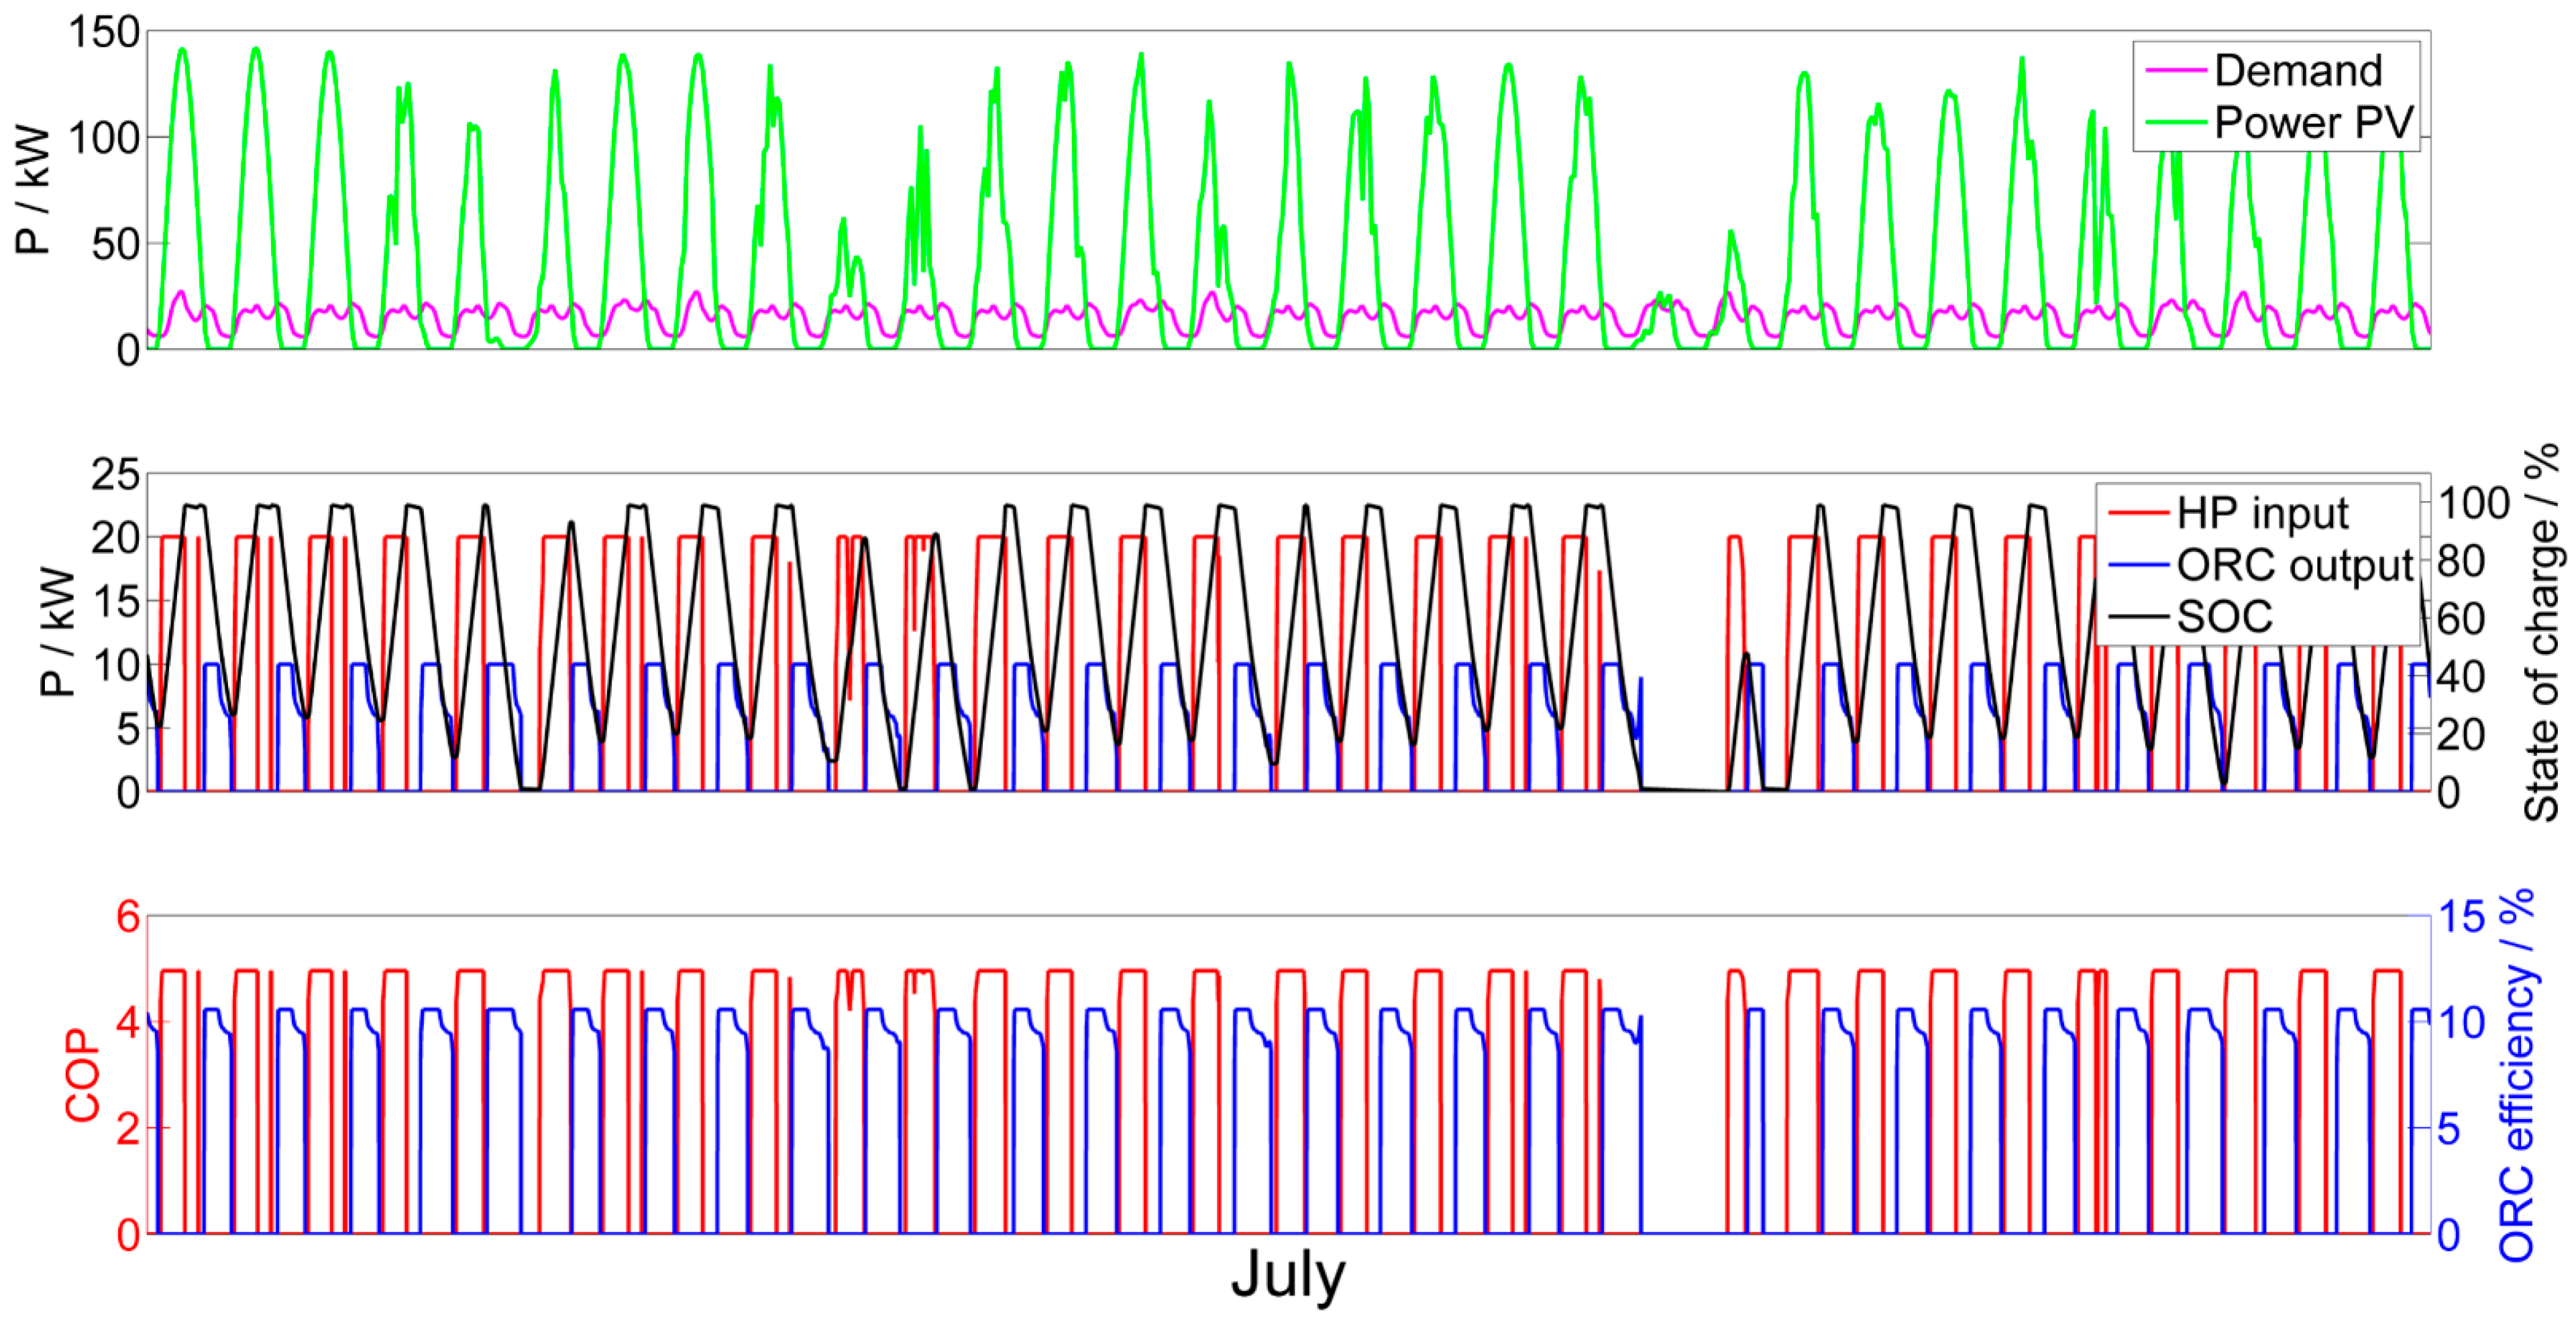
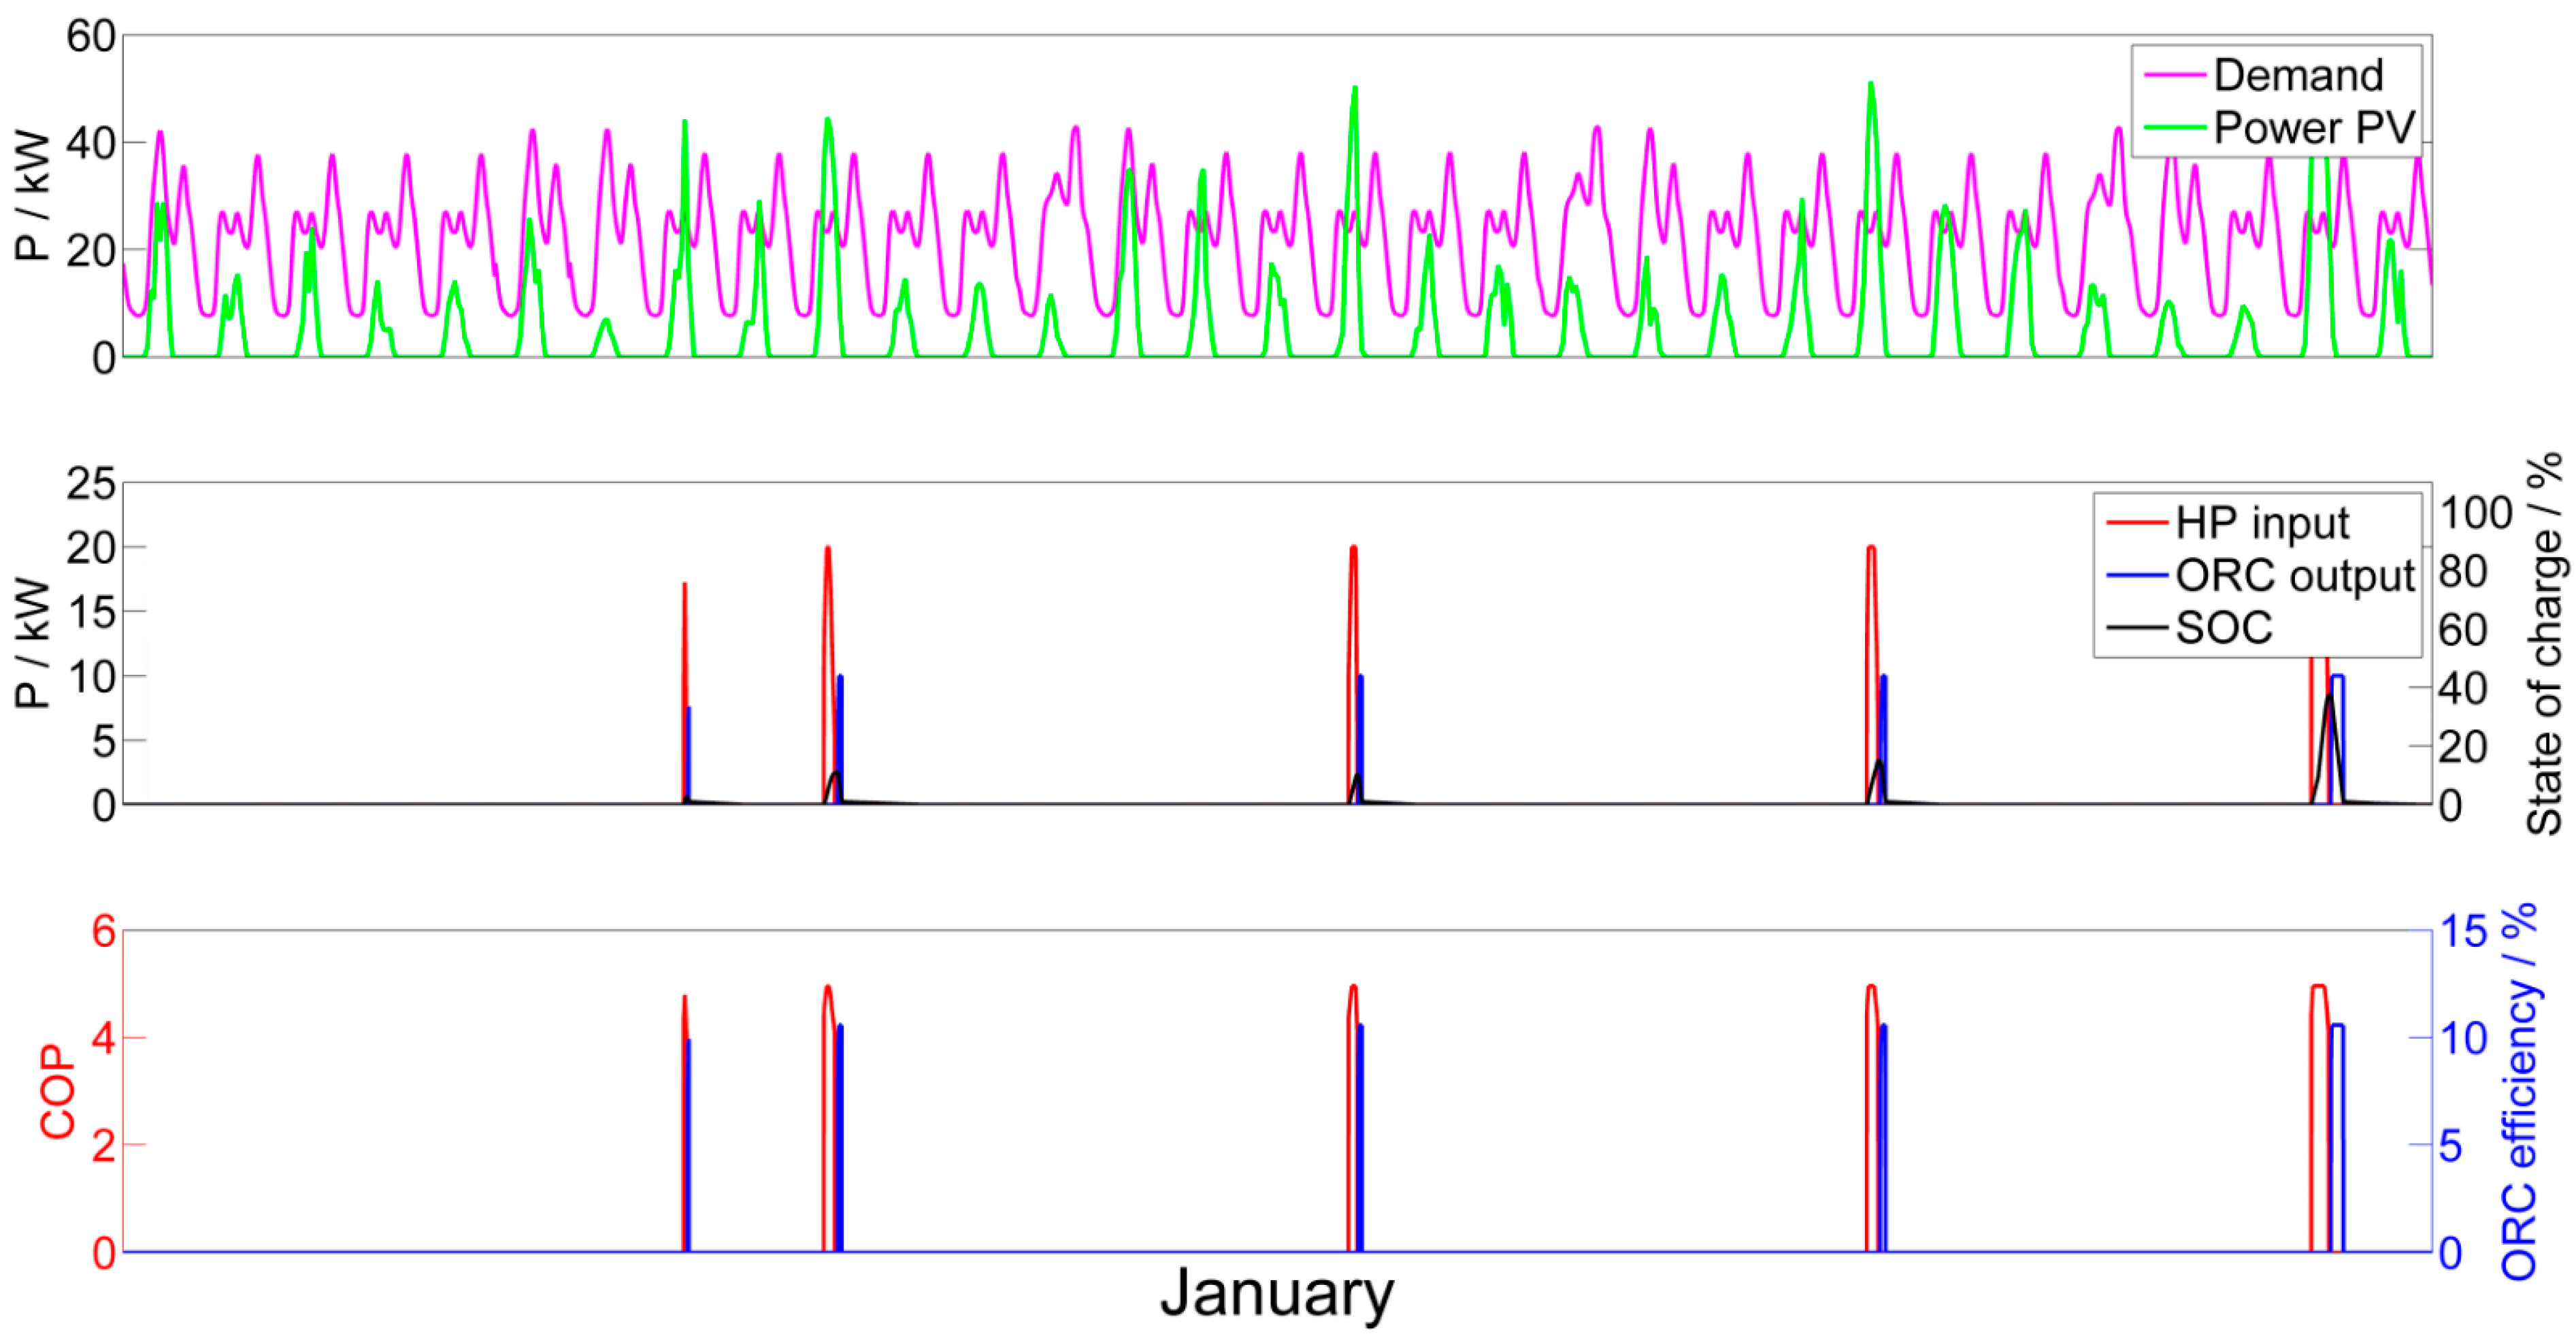
The months of July and January are examined in more detail below. While there is a lot of excess PV energy in July (see
Figure 8), the thermal storage is rarely filled in January (see
Figure 9). In fact, in January the energy supplied by PV is so low that the various demand peaks during the day are recognizable, which occur in the morning on workdays, at noon, and in the evening.
In July, the heat pump operating time is equivalent to 249.5 full load hours, while its mean COP is 4.9. The average relative load is 95.3%. For the ORC, there are 247.2 full load hours and the mean ORC efficiency is 10.1% with an average relative load of 83.1% (see also
Table 4). Most of the time, the state of charge (SOC) of the thermal energy storage reaches 100%. Moreover, it is shown that throughout the month of July the thermal storage is rarely completely discharged.
Gaps in the COP and ORC efficiency curves can be explained by the fact that on these days the PV energy does not exceed the demand, so that the thermal storage cannot be charged.
For January, the full load hours with 13.5 h for the heat pump and 7.5 h for the ORC turn out to be much smaller, as there are fewer opportunities to charge the storage due to the low PV energy. The average COP is 4.8 and the relative load is 77.1%. The average ORC efficiency is 10.3% with a load of 91.5%. Moreover,
Figure 9 shows that the thermal storage gets charged and discharged only five times for the whole month of January, since those are the only times when the energy supplied by the PV exceeds the energy that is demanded. Most of the time, the thermal storage cannot even be charged to 20% of its maximum capacity. In July however, it is almost always fully charged.
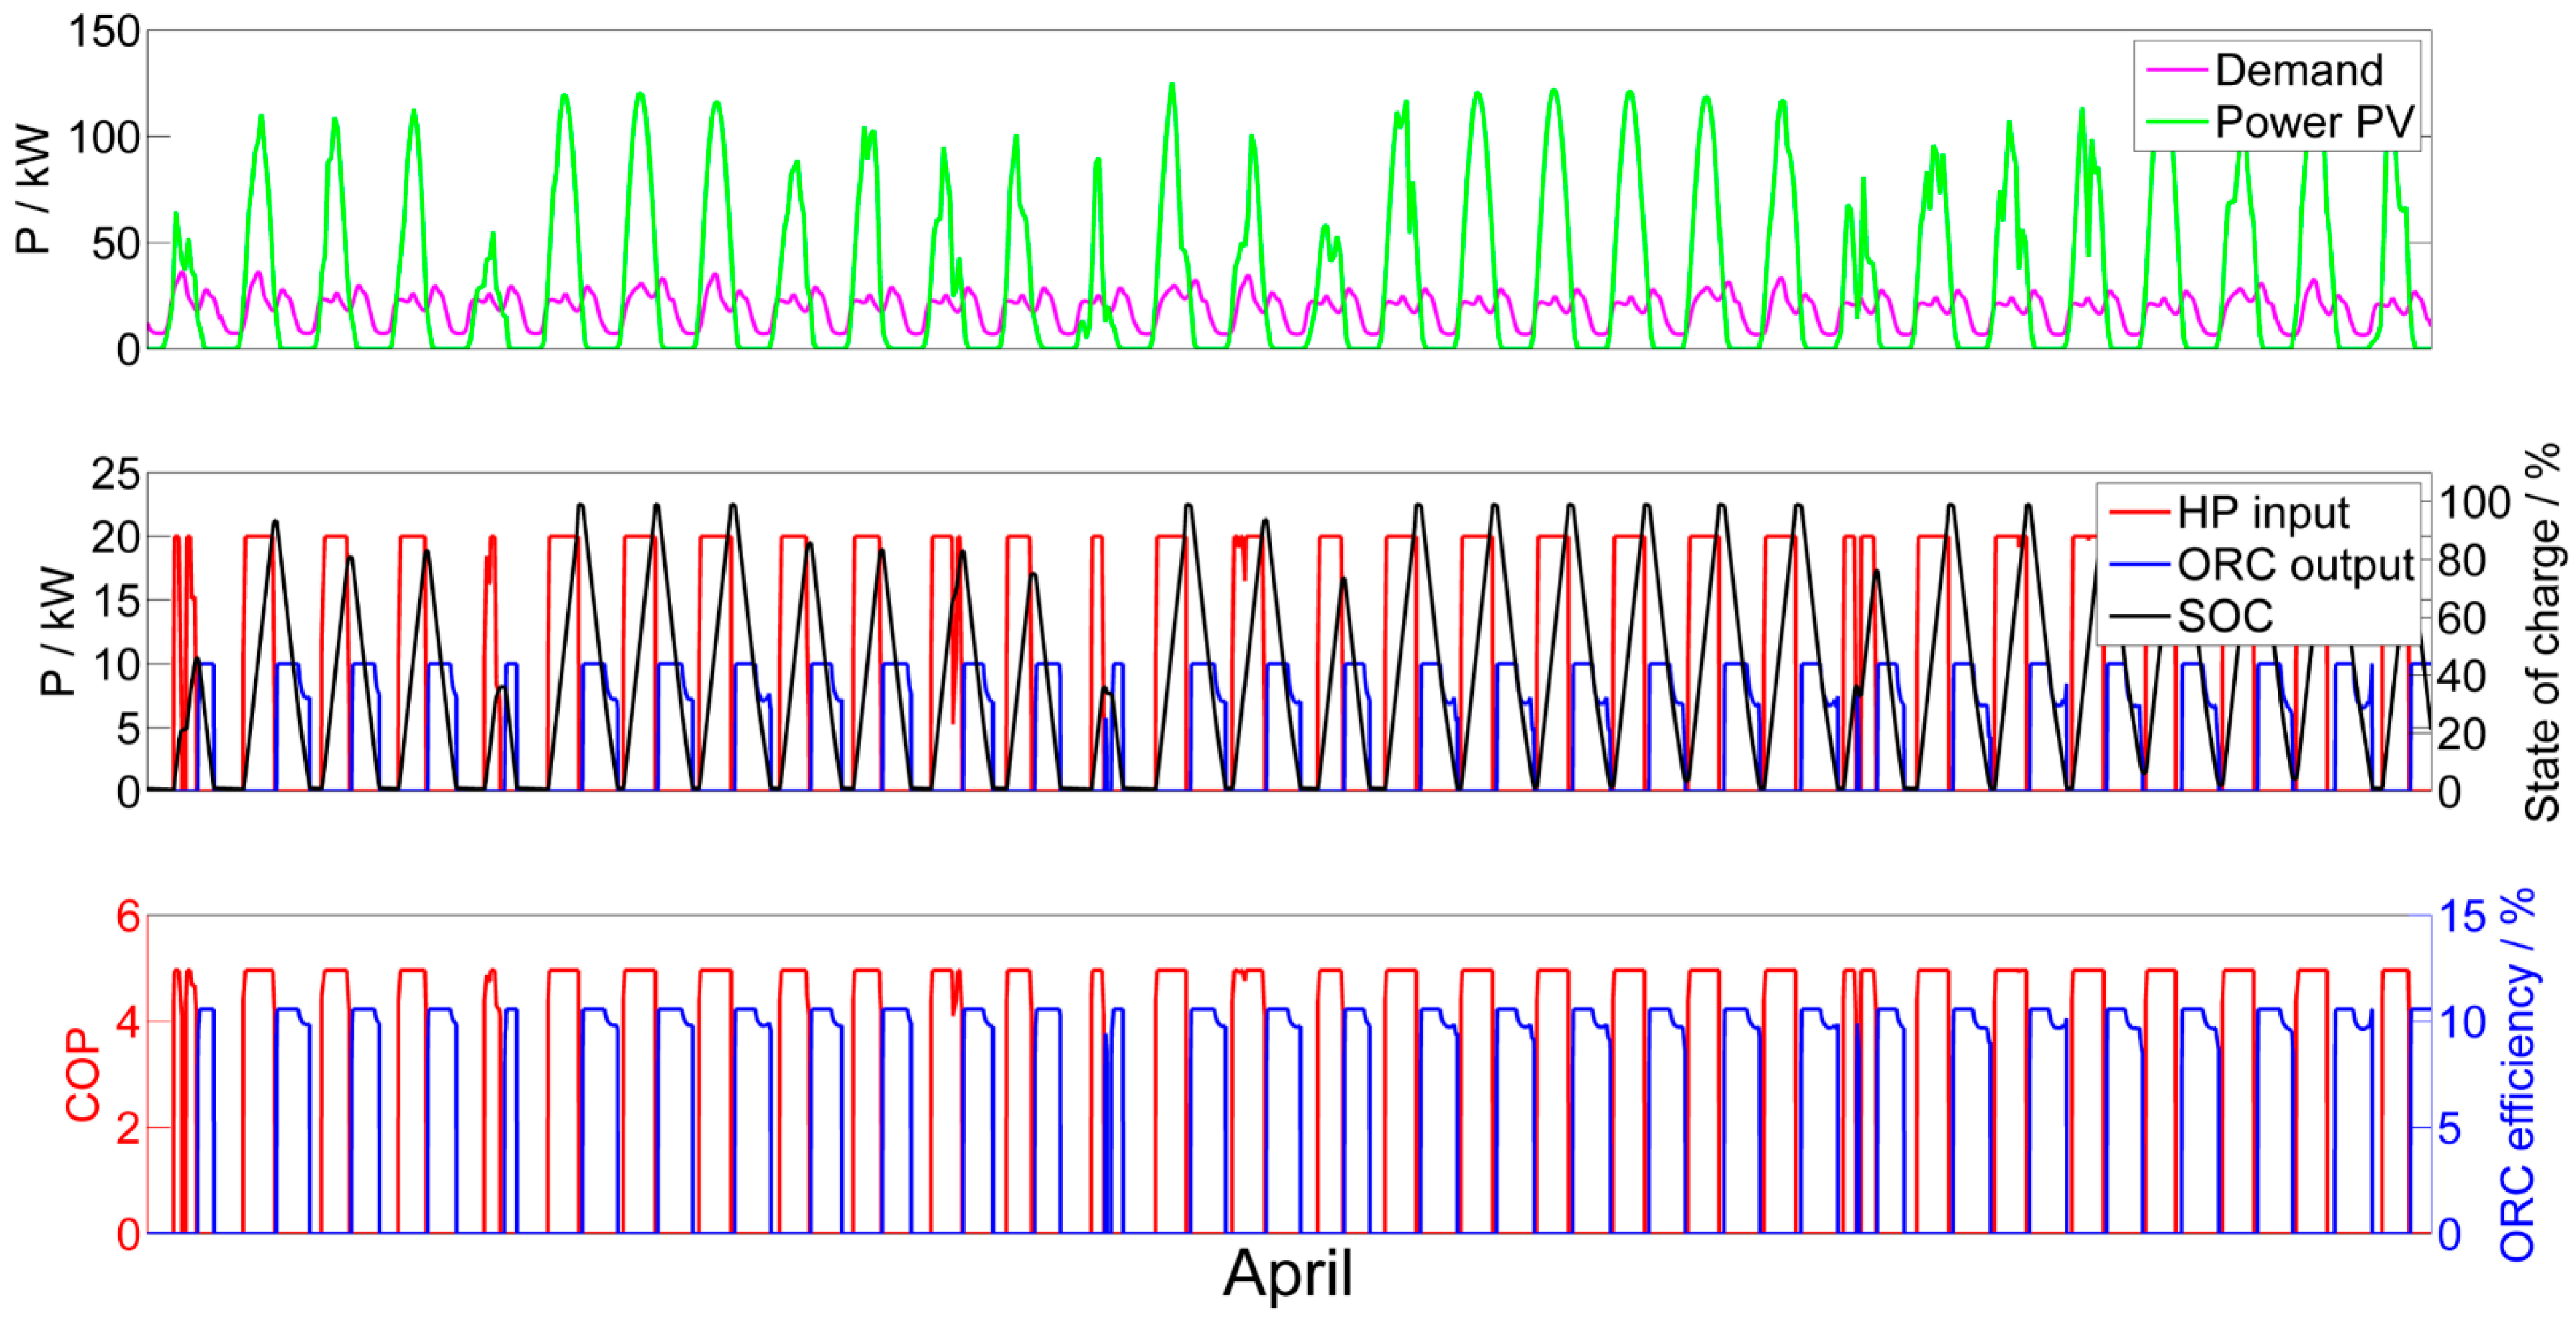
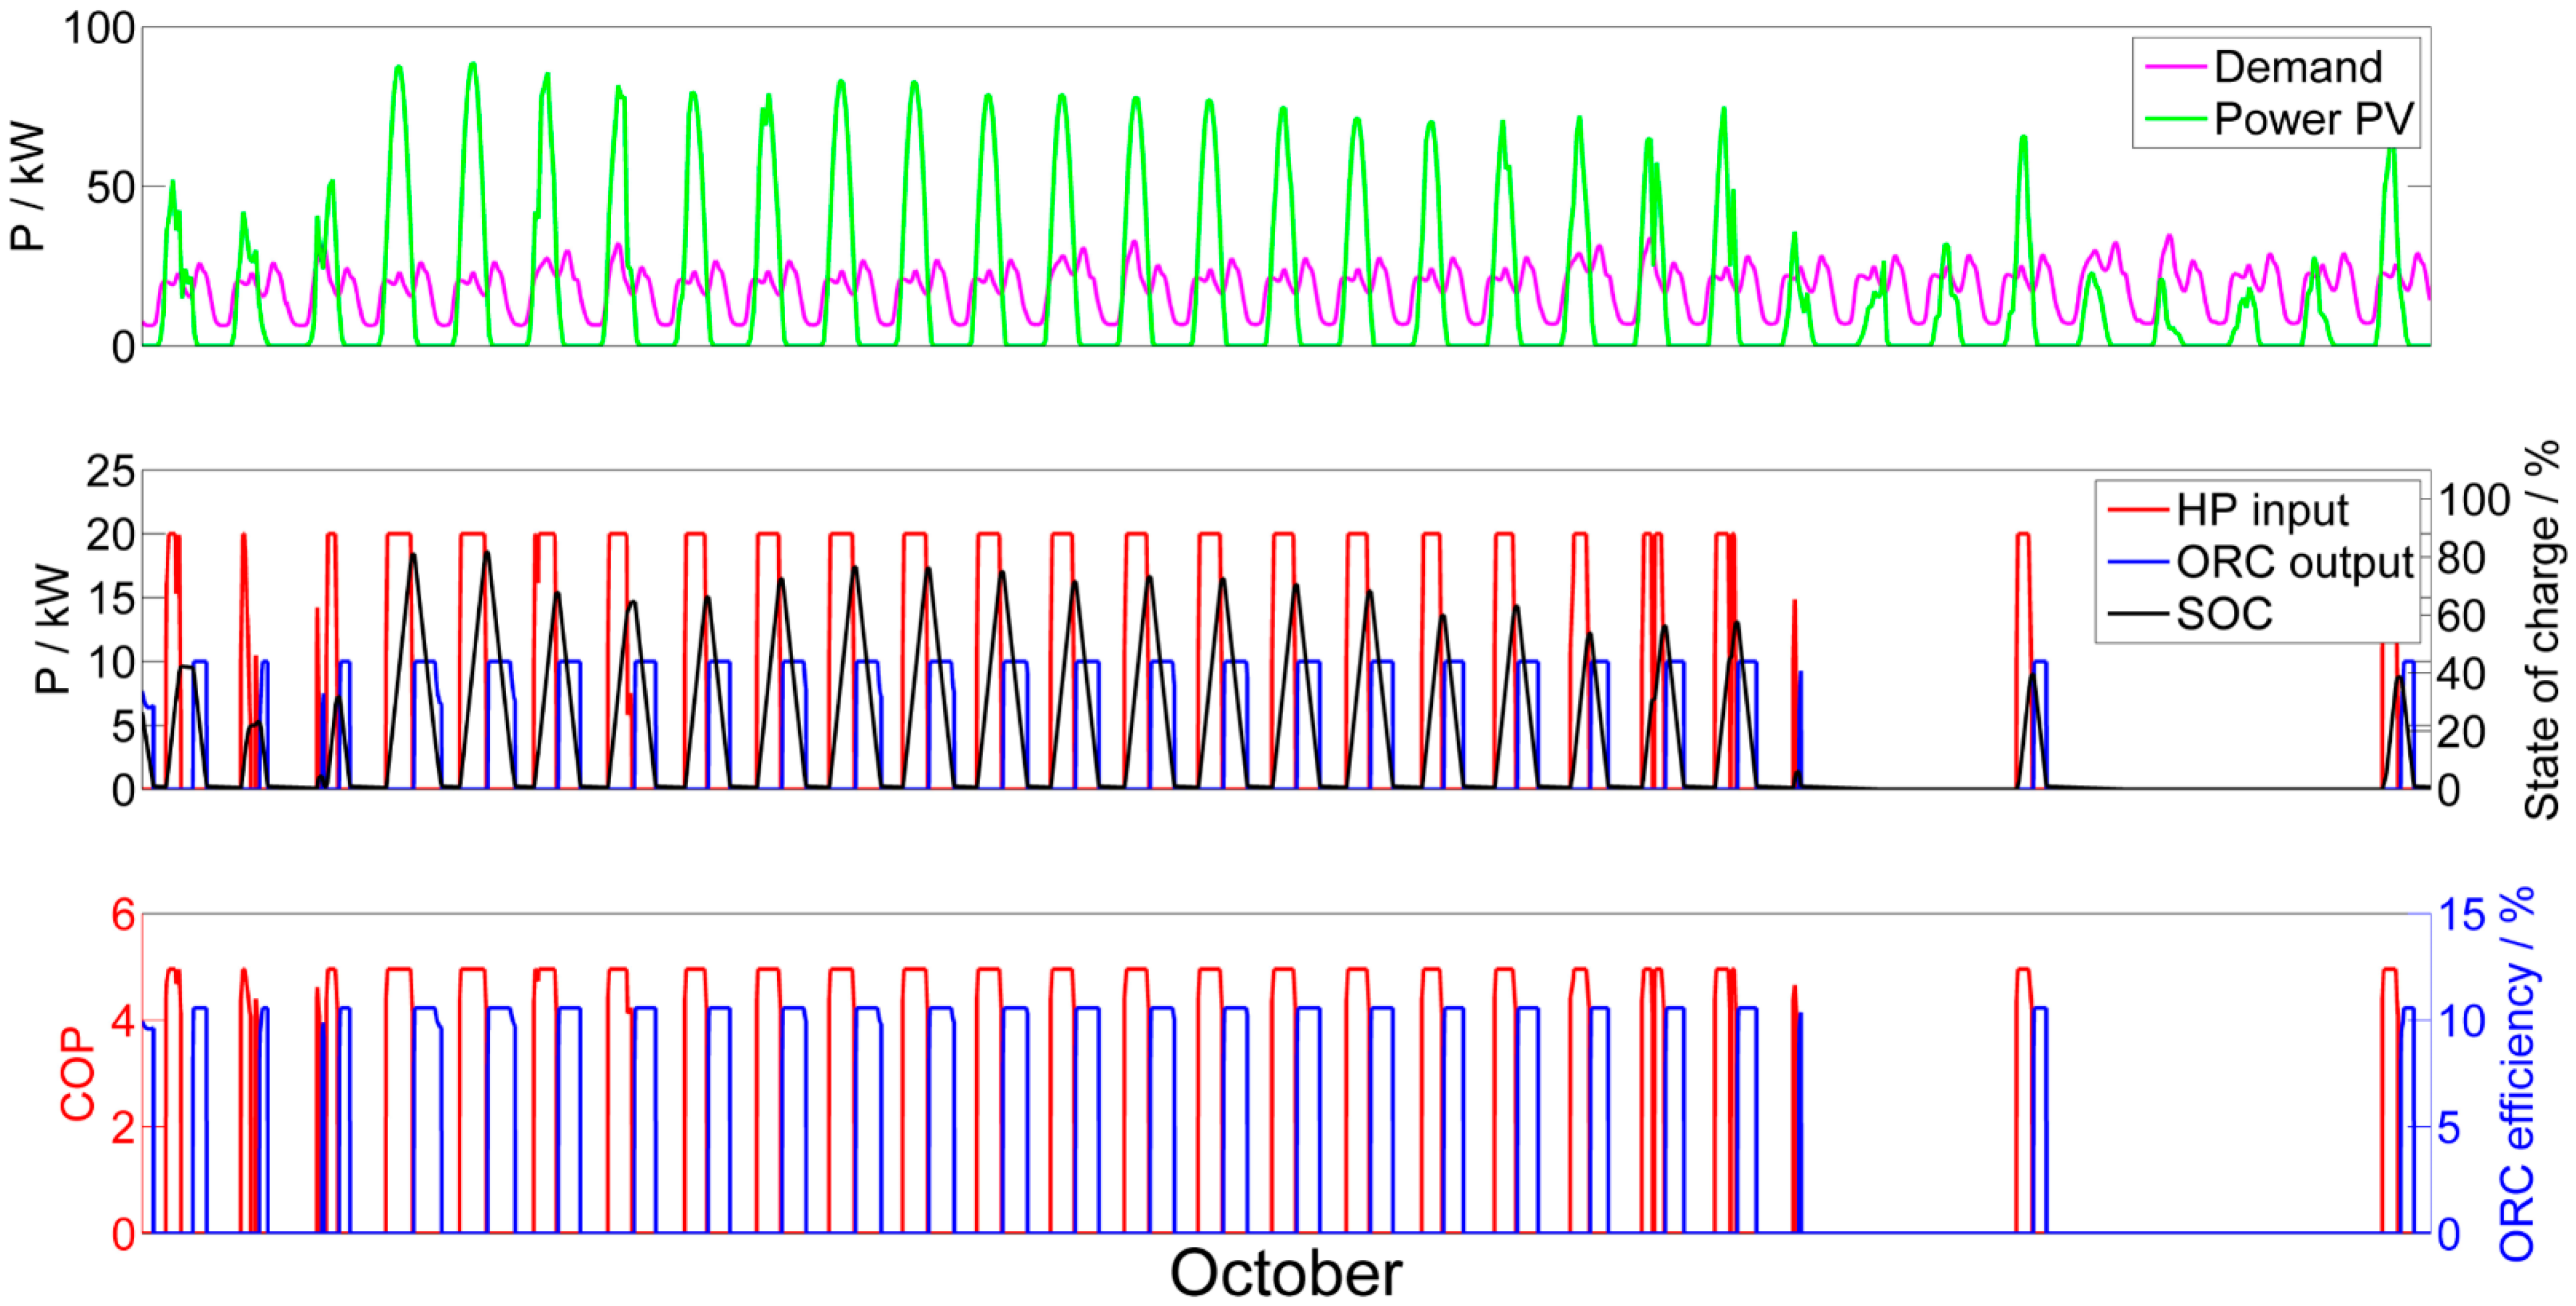
Figure 10 and
Figure 11 show the PTES usage during the months of April and October. For April, the HP and ORC operating time are equivalent to 261.6 and 263 full load hours, which is more than July. Furthermore, a mean COP of 4.9 with a load of 94.5% and a mean ORC efficiency of 10.3 with a load of 89.9% also indicate that the whole system is closer to full load conditions compared to July. While the SOC reaches 100% several times, the storage is also completely discharged by the ORC.
In the month of October 2016, the HP and ORC operating times are only at 154 and 157.7 full load hours, respectively. This is because less energy is supplied from the PV systems during the last days of the month. Since the mean COP is at 4.9 with a load of 88.8% and the mean ORC efficiency is at 10.5% with a load of 96.4%, the PTES works close to full load conditions also in October. This indicates that, in terms of overall system efficiency, the PTES operates best in the months of fall and spring, when supplied and demanded energy are in better balance. However, during these seasons, there are more often shortages in supplied PV energy compared to summer.


 ,
, 


