
Evaluation of Dairy Wastewater Treatment Systems Using Carbon Footprint Analysis


1
Faculty of Building Services Hydro and Environmental Engineering, Warsaw University of Technology, 20 Nowowiejska St., 00-653 Warsaw, Poland
2
Faculty of Civil Engineering and Environmental Science, Bialystok University of Technology, 45E Wiejska St., 15-351 Bialystok, Poland
3
Bielmlek Dairy Cooperative, Wojska Polskiego 52, 17-100 Bielsk Podlaski, Poland
*
Author to whom correspondence should be addressed.
Energies 2021, 14(17), 5366; https://0-doi-org.brum.beds.ac.uk/10.3390/en14175366
Submission received: 27 July 2021
/
Revised: 18 August 2021
/
Accepted: 24 August 2021
/
Published: 28 August 2021
(This article belongs to the Special Issue Wastewater, Water and Energy)
Abstract
:Modernisation of municipal and industrial wastewater treatment plants (WWTPs) should be carried out, taking into account its impact on global warming, e.g., through carbon footprint (CF) analysis. An important industrial sector in Poland is the dairy industry. In dairy WWTPs, the aerobic sewage sludge stabilisation applied thus far is being replaced by the anaerobic process. This change is positive due to the possibility of energy production, but it is unclear how it affects greenhouse gases (GHG) emissions. The aim of the research was to perform CF analysis for two scenarios of dairy WWTP operation. The analysis was based on the real operating data of the current system (current scenario) and project of its modernisation (alternative scenario). The current scenario consists of mechanical and dissolved air flotation (DAF) treatment, biological treatment in sequence batch reactors (SBRs), aerobic sewage sludge stabilisation and its final farmland usage. The alternative scenario assumes replacing aerobic stabilisation with anaerobic stabilisation and a combined heat and power (CHP) system. The CF calculations were based on empirical models, taking into account different emission input parameters, expressed in CO2 equivalents (CO2e). The total CF of the current scenario was 22 kg CO2e PE−1 year−1, while the alternative was 45 kg CO2e PE−1 year−1. The largest share in the current scenario belongs to emissions from WWTPs and energy use, while in the alternative, there is the addition of emissions from biogas use.

1. Introduction
As the awareness of the possible effects of human activities on climate change is growing, there is a need to estimate the emissions of greenhouse gases (GHG) from as many sources as possible. Wastewater treatment plants (WWTPs) are highlighted in the Intergovernmental Panel on Climate Changes (IPCC) guidelines as a source that should be considered in the national GHG emission inventories [1], although their share in total GHG emissions is estimated only at the level of 3% [2]. Using a carbon footprint (CF) analysis, it is possible to estimate the global warning potential (GWP) in relation to carbon dioxide (CO2). The emission of methane (CH4) and nitrous oxide (N2O) is converted into the equivalent of carbon dioxide (CO2e). N2O has a 298-fold stronger effect than CO2, while CH4 has a 34-fold stronger effect than CO2 [3]. The CF analysis can be used to estimate the GHG emissions from WWTPs [4,5].
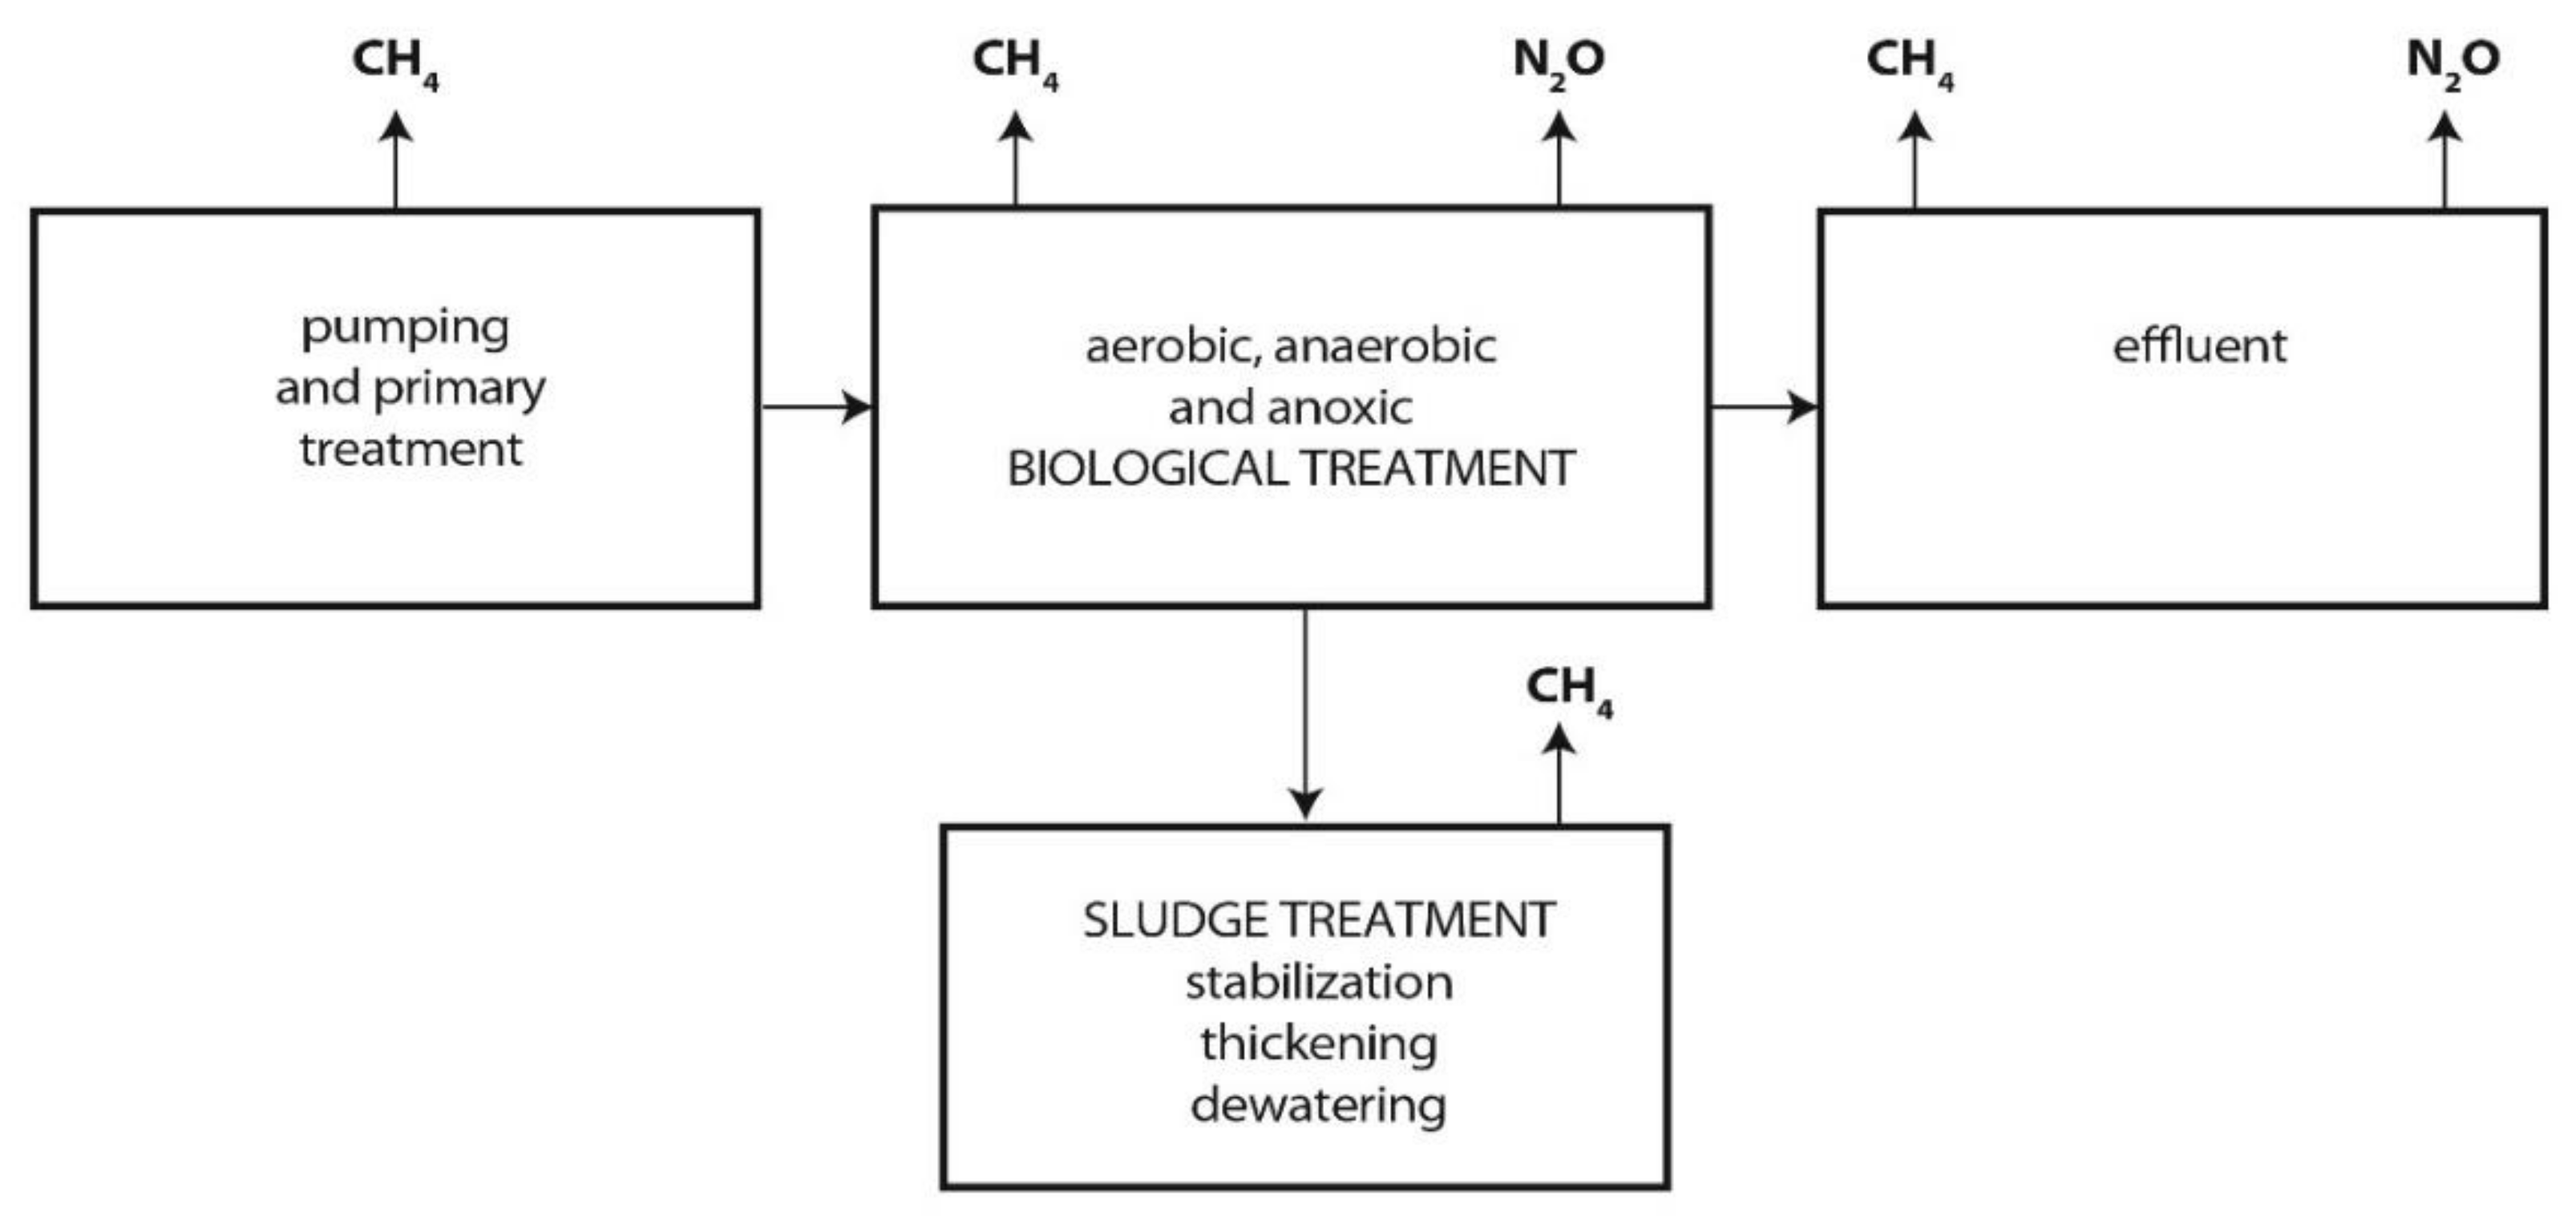
GHG emissions from WWTPs should be considered as direct emissions from technological processes and indirect emissions from transport, chemicals and energy consumption [6]. The direct emission of CO2, CH4 and N2O is associated with activities such as pumping and primary treatment, biological treatment, sewage sludge treatment (stabilisation, thickening, dewatering) and final sludge and sewage disposal (Figure 1).
Direct GHG emissions largely depend on the operational conditions of the wastewater and sludge treatment process (aerobic or anaerobic). It has been proven that for the biochemical oxygen demand (BOD5) in influent wastewater from 300 to 700 mgO2 L−1, lower emissions occur under aerobic conditions. At higher strengths, anaerobic wastewater treatment is more favourable; however, it is necessary to introduce aerobic posttreatment before effluent disposal. Anaerobic treatment offers improved energy conservation with a potential reduction in GHG. However, the produced CH4 may offset any reduction in CO2 emissions, if it is released to the environment [7].
Anaerobic wastewater and sludge treatment can release CH4, which has a greater GWP than CO2. Aerobic treatment involves the conversion of organic waste to biomass and CO2 by an aerobic bacterial culture, and generally does not produce CH4 [7]. The CO2 emissions from the biological treatment are predominantly biogenic and, therefore, climate neutral. It does not contribute to the CF and is not considered in CO2 balance [8]. However, 4 to 14% of the total organic carbon in wastewater influent originates from fossil fuel [9]. Therefore, assuming that all the CO2 emissions from wastewater are of biogenic origin may lead to an underestimation of emissions. The emissions of N2O from biological treatment shall also be taken into account. To sum up, N2O is formed during the conversion of nitrogenous compounds in wastewater, CO2 during aerobic treatment, while CH4 emission is derived from the sewer system, wastewater and sludge handling in anaerobic conditions [7].
An indirect GHG emission, especially from electricity consumption, cannot be ignored as WWTPs are responsible for 1% of its total usage in European countries [10]. This energy comes mainly from non-renewable sources, and its production causes GHG emissions. It is estimated that from 38 to 80% of GHG emissions from WWTPs originate from the combustion of fossil fuels in electric and heat power plants [11,12]. Hence, reducing energy consumption during WWTP operation causes a significant reduction in the CF [13]. The highest energy consumption is generated by the aeration process in the biological treatment of wastewater and sludge; therefore, it is recommended to increase its efficiency [14]. According to many researchers, the aeration devices are responsible for 46 to 69% of the total electricity consumption in WWTPs [15,16,17,18]. This is observed for both municipal and industrial WWTPs.
The volume of milk processed in dairy plants is steadily increasing, which results in growth in the global volume of dairy wastewater and its impact on the environment [19]. It causes an increase in indirect and direct emission from wastewater and sludge treatment process. Dairy wastewater shows more variation in the flow and concentration of pollutants than the municipal one [20,21,22,23]. About 60% of dairy plants in Poland are equipped with individual WWTPs, while small ones discharge wastewater to municipal WWTPs after pre-treatment with, e.g., dissolved air flotation (DAF) or the use of anaerobic reactors [24,25]. The dominant treatment method is the aerobic process with conventional activated sludge. Anaerobic wastewater treatment is rarely used. Sewage sludge is treated using aerobic or anaerobic stabilisation. The advantages and disadvantages of both processes are summarised in Table 1.
Recently, in the largest dairy WWTPs in Poland, the aerobic sludge stabilisation applied thus far is being replaced by anaerobic stabilisation. This is mainly due to the need for the proper management of the flotation sludge generated during the pre-treatment of dairy sewage. The widespread use of DAF has been forced by the overloading of activated sludge chambers. The increasing quantity of flotation sludge makes it necessary to use its anaerobic stabilisation. The presence of fats in the flotation sludge increases the amount of biogas and its calorific value. The change from aerobic to anaerobic sludge stabilisation is positive due to the possibility of energy production, but it is unclear how it affects the GHG emissions from dairy WWTPs. In the literature, there are no data concerning the CF of different dairy wastewater treatment systems.
The aim of the research was to perform CF analysis for two scenarios of dairy WWTP operation. The analysis was based on real operating data, the current technological system and the project of its modernisation. The current scenario consists of mechanical and DAF treatment, biological treatment in sequence batch reactors (SBRs), aerobic sewage sludge stabilisation and its final farmland use. The alternative scenario is based on mechanical and DAF treatment, biological treatment in SBRs, anaerobic sewage sludge stabilisation with a combined heat and power (CHP) system and its final farmland use. This study examined the impact of changing the sewage sludge stabilisation method on the CF of dairy WWTPs.
2. Materials and Methods
2.1. Study Site
The CF analysis was carried out based on the data provided by the dairy WWTP operator with a 17,200-person equivalent (PE), located in north-eastern Poland. PE was calculated taking into consideration the following real operation parameters: sewage flow of 653 m3d−1, BOD5 of 1582 mgO2 L−1 and unit load of 60 gO2 PE−1 d−1. The plant consists of mechanical treatment (sieve and grit chamber), averaging tank, DAF supported by adding coagulants and flocculant and biological treatment with two SBRs. Sewage sludge is subjected to aerobic stabilisation, mechanical dewatering and, finally, it is used as fertiliser (final farmland use).
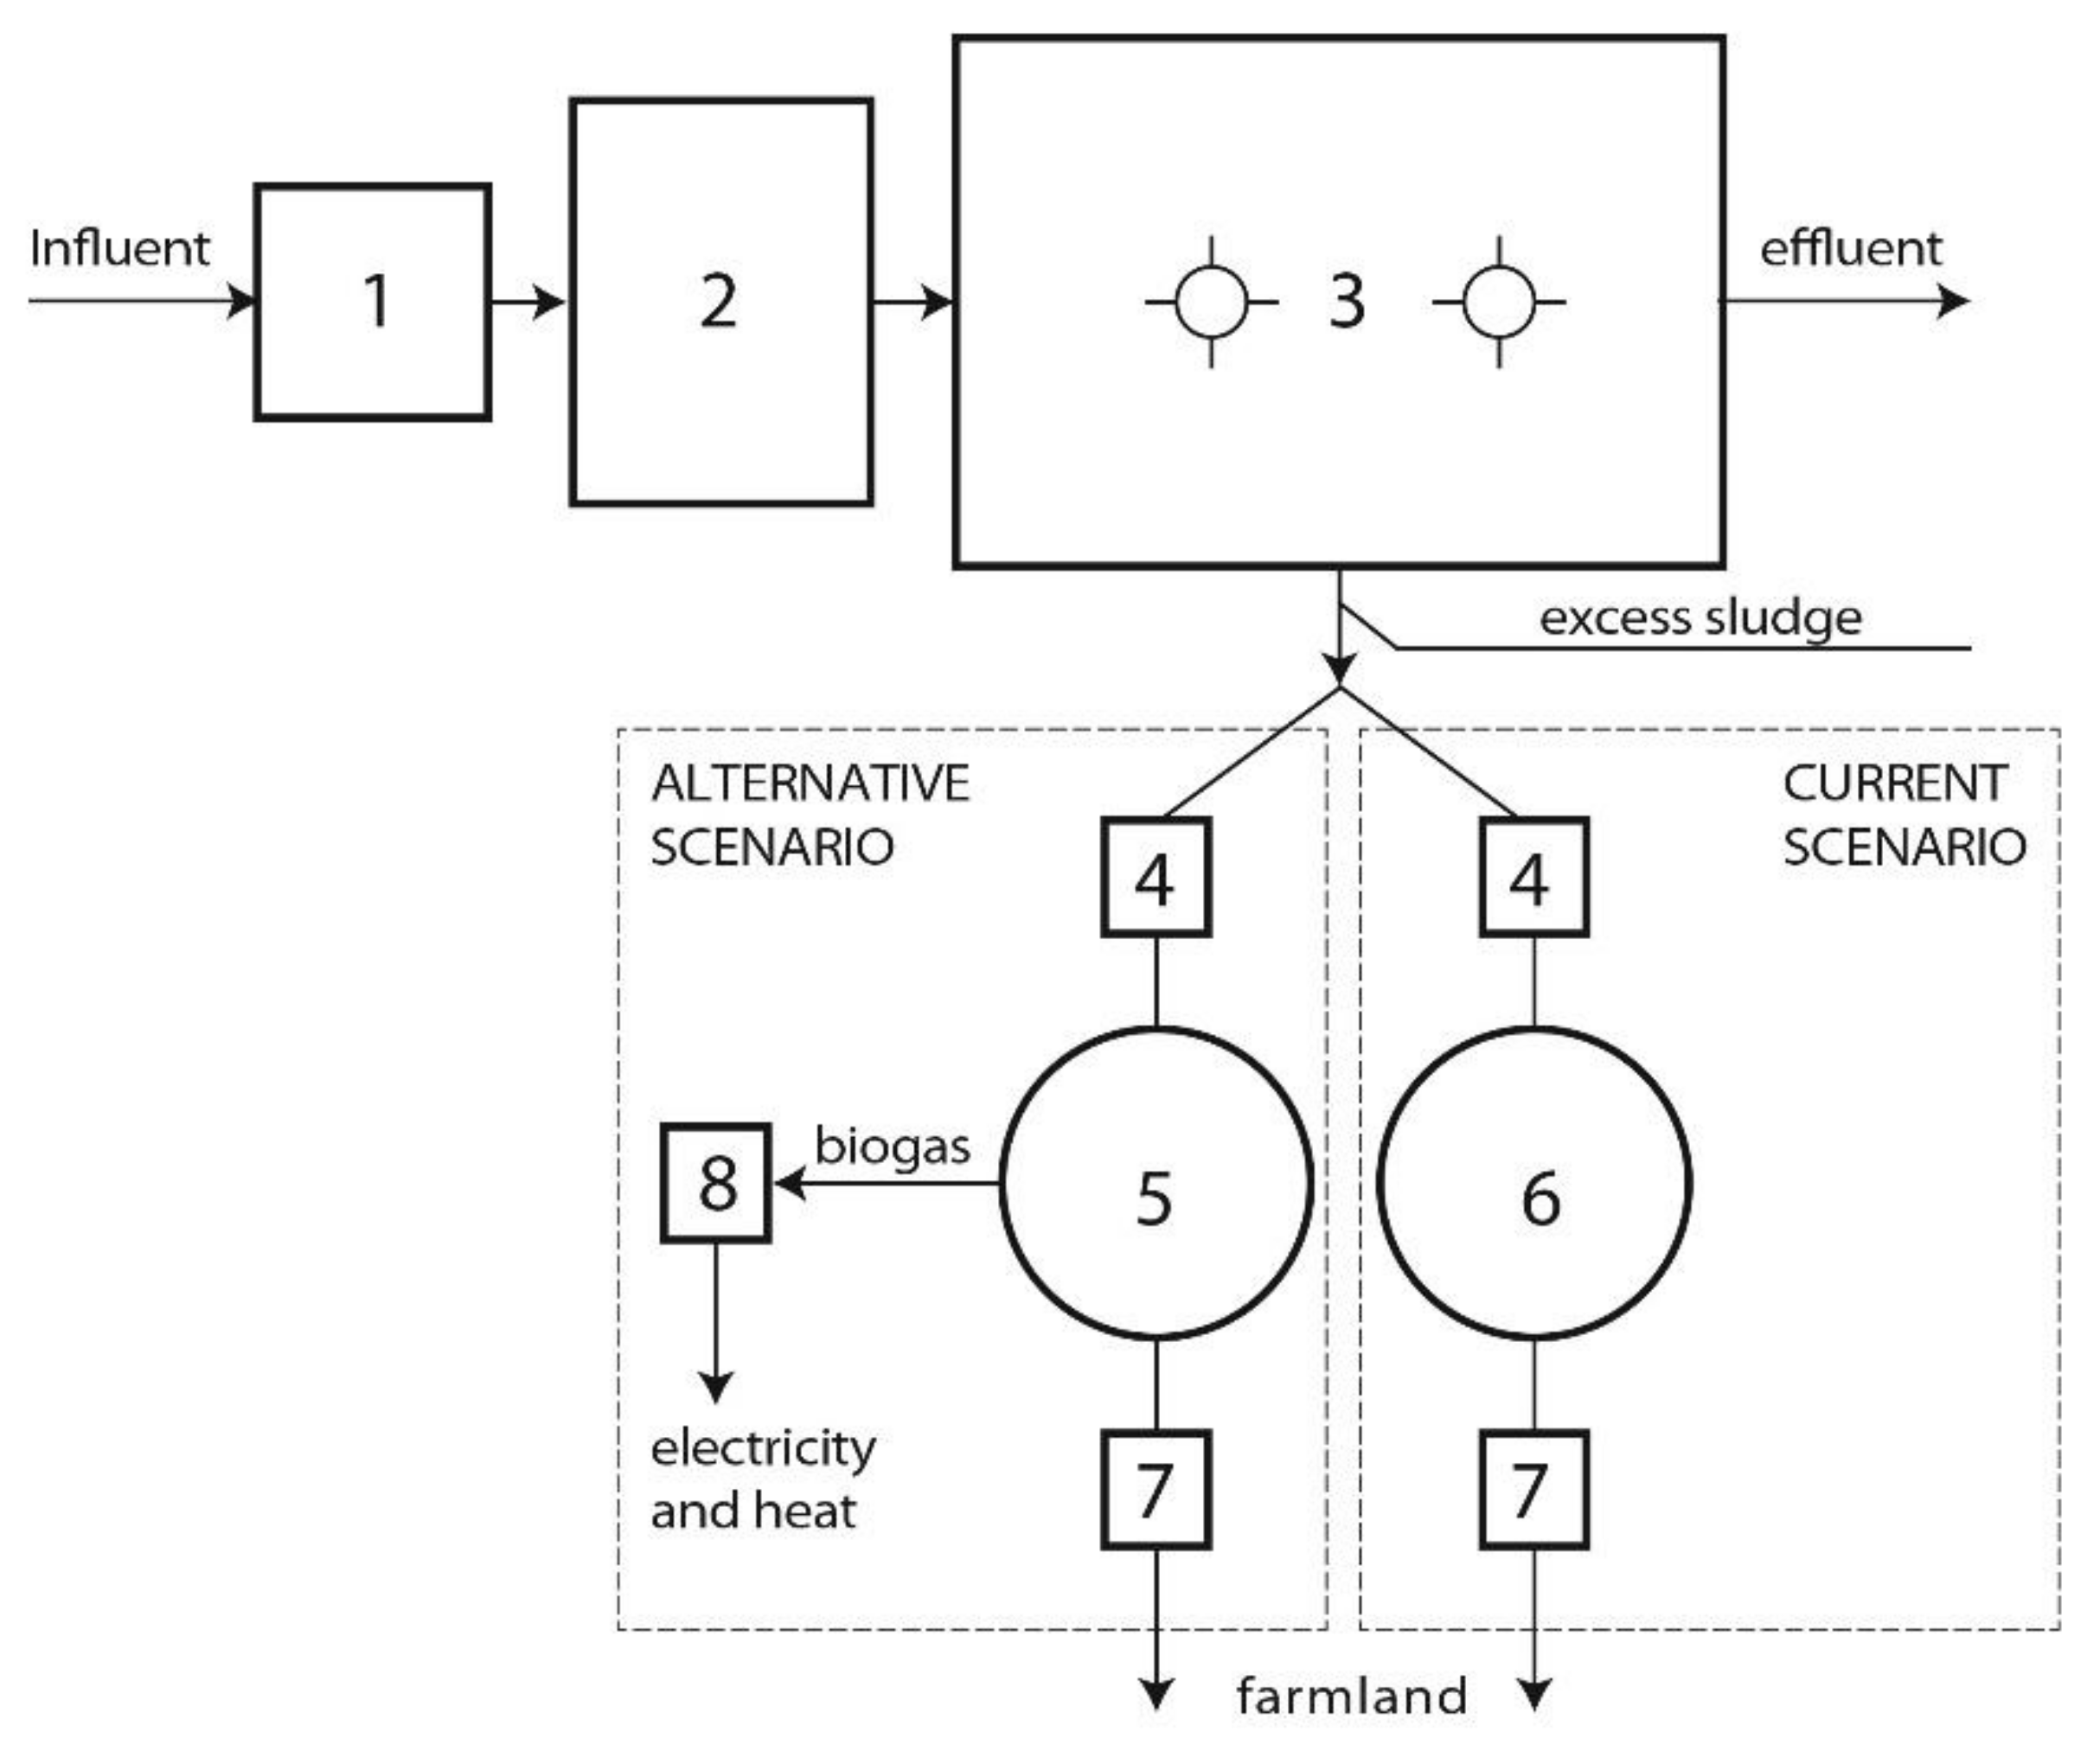
The data used in the alternative scenario derive from a modernisation project, prepared by a professional company. It is based on anaerobic sewage sludge digestion and a CHP system. Farmland remains the method of its final use. It is possible to apply stabilised sludge as a fertiliser due to its low content of heavy metals. The considered scenarios are shown in Figure 2.
The dairy WWTP was designed for an average sewage flow of 750 m3 d−1. The average daily flow during the research period was 653 m3 d−1. The basic wastewater parameters (biochemical oxygen demand BOD5, chemical oxygen demand COD, total nitrogen TN and total phosphorus TP) were presented in Table 2. The mean flow of sludge liquor was 1.09 m3 h−1. The annual demand for chemicals was 24 t of coagulant Fe2(SO4)3 and 11 t of polymers, which were delivered 6 times a year from a location 450 km away from the WWTP. The amount of screenings and sand are negligible. Based on the real operating data, it was assumed that there is 2.5 t of dry mass (DM) of sludge per day (6060 t of sludge before dewatering per year, 15% of total solids), which is directly treated onsite. Sewage sludge contained 63.2 kg N t−1 DM, 8.2 kg P t−1 DM and 9 kg K t−1 DM. Sludge is transported 72 times a year over a distance of 30 km by a vehicle with a maximum load of 40 t to farmland [26].
In the current scenario, the total electricity demand was 500 MWh year−1 and was entirely purchased. The structure of energy consumption was 54.1% for biological treatment, 17.0% for aerobic sewage sludge treatment, 17.1% for mechanical treatment, 6.9% for other (social, lighting, etc.), 2.6% for deodorisation and 2.3% for DAF. The operation of aeration devices for sewage and sludge treatment constituted 69.7% of the total energy consumption [19].
In the alternative scenario, the plant benefits from on-site electricity production in CHP system. The amount and caloric value of biogas depend on the amount and characteristics of the digested sludge. The main factor influencing biogas characteristics is the proportion of excess and flotation sludge. Increasing the efficiency of the flotation process by increasing chemical dosages allows for higher biogas quantity and quality (60–70% of CH4). In order to increase the energy efficiency of the digestion process, it is advisable to increase the efficiency of the flotation process. The total electricity demand is estimated at 400 MWh year−1 and is 20% lower than in the current scenario [27]. The heat requirement is 280 MWh year−1. Both energy and heat requirements are covered entirely by biogas produced in mesophilic anaerobic digestion. Biogas production was assumed to be 200,000 Nm3 year−1 and CH4 content at 60% allows approximately 1200 MWh year−1 to be obtained, of which 680 MWh year−1 are used in the WWTP, while surplus biogas energy of approximately 520 MWh year−1 is sold to the grid. Of the biogas, 50% was used by a gas engine for electric energy production, 40% by a gas boiler, 5% is a direct biogas flow to the atmosphere, while 5% is burnt in a torch. Such assumptions were made by a professional company in the modernisation project of WWTPs.
2.2. Analysis Tool
An MS Excel spreadsheet developed in the project ‘Calculation of the CF from Swedish WWTPs’ was used as a tool for the CF calculation [28]. It has been developed with the aim of increasing knowledge of the climate impact of individual WWTPs. The tool can be used for the elaboration of improvement strategies, as well as to enable comparisons between different WWTPs. The calculator uses global warning potentials (GWP) according to the IPCC [3], emission factors and other constants given in the literature, which are described in detail in spreadsheets. The input data were divided into the following categories: WWTP (input and output parameters), chemicals (carbon sources, coagulants, alkalinity, polymers, other chemicals), energy (electricity, heat, cooling, heat exchanger effluent wastewater, biogas), sludge (characteristic and usage), waste (screenings, sand) and transport (sludge, screenings and sand). The results are based on summing up emissions expressed in CO2e units with respect to CO2, CH4 and N2O. The results enable us to determine the parameters considerably affecting the total CF.
In the following paper, calculations were performed twice, using data relevant for the current and alternative scenarios. Missing data concerning N2O and CH4 emissions from the WWTP were estimated based on the literature, which is a source of uncertainty of CF estimates. Since obtaining a reliable result is highly dependent on the assumed values, the information compiled by Global Water Research Coalition [8,29,30,31,32] was analysed. The emission of N2O is a consequence of the nitrogen removal by nitrification and denitrification in the activated sludge process [29,30]. The degree of TN removal shows a correlation with direct N2O emission, which decreases with increasing TN removal efficiency [4]. The analysed scenarios do not differ in the biological wastewater treatment process—in both cases, the annual N2O emission was assumed to be 2% of the influent N load. For the current scenario with aerobic sludge stabilisation, CH4 emissions were assumed at 0.6% of annual influent COD load. CH4 emissions at WWTPs with aerobic sludge stabilisation are negligible as long as the activated sludge chambers are not overloaded and sufficiently aerated [1,4]. For the alternative scenario with anaerobic sewage sludge stabilisation and CHP system, it was assumed that the total CH4 emission amounts to 9 g CH4 per kg COD influent WWTP, which is in the range of the value given in the literature [32].
3. Results and Discussion
The results of the CF analysis were given in tonnes of equivalent CO2 per year (t CO2e a−1), then recalculated into kg of equivalent CO2 per PE per year (kg CO2e PE−1 a−1). The climate impact of N2O and CH4 was calculated by applying the GWP of 34 kg CO2e kg−1 of CH4 and of 298 kg CO2e kg−1 of N2O, respectively, referring to a 100-year framework and including climate carbon feedbacks [3]. The obtained results are presented in Table 3.
The CF for the current scenario is estimated at 376 t CO2e a−1. Considering the size of the plant, 17,200 PE, the unit emission is 22 kg CO2e PE−1 a−1. The largest share in the total emission belongs to emissions from the wastewater treatment (237 t CO2e a−1) and energy use (175 t CO2e a−1). The CF of the alternative scenario is estimated at 768 t CO2e a−1, while the unit emission is 45 kg CO2e PE−1 a−1. The largest share in the total emission is the emission from biogas use (257 t CO2e a−1), wastewater treatment (288 t CO2e a−1) and energy use (259 t CO2e a−1). In both cases, a negative CF value (−53 t CO2e a−1) was obtained for farmland sludge use, which can be explained by avoiding the production and usage of fertilisers. The structure of the CF for both scenarios is shown in Figure 3.
The issue of emissions from aerobic sewage sludge stabilisation is only addressed in a few studies [4,33]. The following values obtained for aerobic wastewater treatment and aerobic stabilisation is similar to those reported for municipal WWTPs: 24 kg CO2e PE−1 a−1 [4] and 39 CO2e PE−1 a−1 [34]. For the alternative scenario with anaerobic sludge stabilisation and a CHP system, the CF is higher than for municipal WWTPs: 36 kg CO2e PE−1 a−1 [4], or in the range given by [34]. A higher CF for a scenario with anaerobic sludge stabilisation with a CHP system can be explained by the higher amount and calorific value of biogas, due to the use of sludge containing a significant amount of volatile fatty acids.
The analysed scenarios do not differ in the wastewater treatment process, which generates N2O emissions. The source of CH4 emissions may be the sludge treatment process, which differs in the considered scenarios. CH4 emissions at WWTPs with aerobic sludge stabilisation are negligible as long as they are sufficiently aerated (1 mg O2 L−1). Momentary increases in the load on the chamber (e.g., during chamber feeding) can briefly initiate anaerobic processes. Therefore, it is recommended to control emissions by increasing the aeration efficiency of sewage sludge during its stabilisation. It is also important to avoid its long-term storage [33]. It is estimated that at WWTPs with anaerobic digestion about 75% of CH4 direct emission occurs in the sludge line [31]. Although the anaerobic process offers improved energy conservation with a potential reduction in GHG emissions, if the produced CH4 is released to the environment, it can offset any reductions in emissions [7,34]. Potential sources of CH4 emissions are anaerobic digesters, devices for sewage sludge thickening and dewatering, sludge storage tanks and the CHP system [31]. From anaerobic digesters, up to 11% of the produced CH4 can be released [1,35], 2–4.5% from dewatering and digested sludge storage and 1.3–1.8% from the CHP system [31].
The obtained results can also be compared with the emissions from aerobic sludge digestion, carried out in psychrophilic open digesters. In the 1980s and 1990s, open digesters were commonly used in large WWTPs in Poland. In later years, they were upgraded with aeration systems and converted to aerobic stabilisation chambers. In the case of aerobic digestion, the sludge is kept for a long time, which is a source of direct and uncontrolled CH4 emissions. The CF is many times higher than in aerobic sludge stabilisation and is also higher than in the case of anaerobic stabilisation combined with the CHP system [14,34,36,37]. In small WWTPs, open digesters should be redesigned into aerobic stabilisation chambers by adding aeration systems. If a flotation process is applied for dairy wastewater pre-treatment, anaerobic stabilisation and a CHP system should be considered.
4. Conclusions
The modernisation of WWTPs should be carried out taking into account its impact on the environment, including global warming, e.g., through CF analysis. In Poland, the amount of milk processed, and the amount of dairy sewage generated is constantly increasing. Overloading the biological chambers created the need for wastewater pre-treatment using the flotation process. This process generates flotation sludge, which is rich in volatile fatty acids. These constitute a valuable substrate for the co-digestion process with excess sewage sludge. Therefore, in the case of large dairy WWTPs, changing the sludge stabilisation technology from aerobic to anaerobic is inevitable. This became the premise of a study on the CF of both systems.
In the case of the current scenario, the CF is estimated at 376 t CO2e a−1 (22 kg CO2e PE−1 a−1). In the alternative scenario, after changing the stabilisation method to anaerobic digestion with biogas production and cogeneration, the CF increases to 768 t CO2e a−1 (45 kg CO2e PE−1 a−1). In the current scenario, the largest share in the total emissions belongs to the emissions from wastewater treatment (237 t CO2e a−1) and energy use (175 t CO2e a−1). The largest share in the CF of the alternative scenario is the emissions from wastewater treatment (288 t CO2e a−1), energy use (259 t CO2e a−1) and biogas use (257 t CO2e a−1). In both cases, a negative carbon footprint value (−53 t CO2e a−1) was obtained for the sludge used for farmland, which can be explained by the avoided production and usage of fertilisers. The source of uncertainty of the CF estimates are the CH4 and N2O emission factors estimated based on the literature. The use of anaerobic stabilisation in a dairy WWTP allows the production of renewable energy, reducing the CF of conventional energy production. However, these benefits are significantly reduced by the unavoidable release of CH4 into the environment. The use of anaerobic sludge stabilisation systems in dairy WWTPs may increase the CF, which should be taken into account while elaborating the national GHG inventories programme.
Author Contributions
Conceptualisation, B.K. and W.D.; formal analysis, B.K., investigation, B.K.; methodology, B.K. and W.D.; resources, R.Ż.; validation, W.D.; writing—original draft, B.K.; writing—review and editing, B.K., W.D. and R.Ż. All authors have read and agreed to the published version of the manuscript.
Funding
This research received no external funding.
Conflicts of Interest
The authors declare no conflict of interest.
References
- IPPC. Guidelines for National Greenhouse Gas Inventories; Prepared by the National Greenhouse Gas Inventories Programme; IGES Pub.: Hayama, Japan, 2006; Available online: http://www.ipcc-nggip.iges.or.jp/public/2006gl/ (accessed on 15 June 2021).
- Xu, X. The Carbon Footprint Analysis of Wastewater Treatment Plants and Nitrous Oxide Emissions from Full-Scale Biological Nitrogen Removal Processes in Spain. Master’s Thesis, Massachusetts Institute of Technology, Cambridge, MA, USA, 2013. [Google Scholar]
- IPCC. Climate Change: The Physical Science Basis. Contribution of Working Group I to the Fifth Assessment Report of the Intergovernmental Panel on Climate Change; Cambridge University Press: Cambridge, UK; New York, NY, USA, 2013. [Google Scholar]
- Parravicini, V.; Svardal, K.; Krampe, J. Greenhouse Gas Emission form Wastewater Treatment Plants. Energy Procedia 2016, 97, 246–253. [Google Scholar] [CrossRef] [Green Version]
- Foley, J.; de Hass, D.; Hartley, K.; Lant, P. Comprehensive life cycle inventories of alternative wastewater treatment systems. Water Res. 2010, 4, 1654–1666. [Google Scholar] [CrossRef] [PubMed]
- Maktabifard, M.; Zaborowska, E.; Mąkinia, J. Evaluating the effect of different operational strategies on the carbon footprint of wastewater treatment plants—Case studies from northern Poland. Water Sci. Technol. 2019, 79, 2211–2220. [Google Scholar] [CrossRef] [PubMed] [Green Version]
- Cakir, F.Y.; Stenstrom, M.K. Greenhouse Gas Production: A Comparison between Aerobic and Anaerobic Wastewater Treatment Technology. Water Res. 2005, 39, 4197–4203. [Google Scholar] [CrossRef]
- Global Water Research Coalition. N2O and CH4 Emission from Wastewater Collection and Treatment Systems; Technical Report; Global Water Research Coalition: London, UK, 2011; ISBN 9789077622247. [Google Scholar]
- Law, Y.; Jacobsen, G.E.; Smith, A.M.; Yuan, Z.; Lant, P. Fossil organic carbon in wastewater and its fate in treatment plants. Water Res. 2013, 47, 5270–5281. [Google Scholar] [CrossRef]
- Longo, S.; d’Antoni, B.M.; Bongards, M.; Chaparro, A.; Cronrath, A.; Fatone, F.; Lema, J.M.; Mauricio-Iglesias, M.; Soares, A.; Hospido, A. Monitoring and diagnosis of energy consumption in wastewater treatment plants. A state of the art and proposals for improvement. Appl. Energy 2016, 179, 1251–1268. [Google Scholar] [CrossRef] [Green Version]
- Bao, Z.; Sun, S.; Sun, D. Assessment of greenhouse gas emission from A/O and SBR wastewater treatment plants in Beijing, China. Int. Biodeterior. 2016, 108, 108–114. [Google Scholar] [CrossRef]
- Yerushalmi, L.; Ashrafi, O.; Haghighat, F. Reductions in greenhouse gas (GHG) generation and energy consumption in wastewater treatment plants. Water Sci. Technol. 2013, 67, 1159–1164. [Google Scholar] [CrossRef] [PubMed]
- Sweetapple, C.; Fu, G.; Butler, D. Does carbon reduction increase sustainability? A study in wastewater treatment. Water Res. 2015, 87, 522–530. [Google Scholar] [CrossRef] [PubMed] [Green Version]
- Mamais, D.; Noutsopoulos, C.; Dimopoulou, A.; Stasinakis, A.; Lekkas, T.D. Wastewater treatment process impact on energy savings and greenhouse gas emissions. Water Sci. Technol. 2015, 71, 303–308. [Google Scholar] [CrossRef] [PubMed]
- Daw, J.; Hallett, K.; DeWolfe, J.; Venner, I. Energy Effciency Strategies for Municipal Wastewater Treatment Facilities; Technical Report; National Renewable Energy Laboratory (NREL): Golden, CO, USA, 2012. Available online: www.nrel.gov (accessed on 19 December 2020).
- Li, W.; Li, L.; Qiu, G. Energy consumption and economic cost of typical wastewater treatment systems in Shenzhen, China. J. Clean. Prod. 2017, 163, 374–378. [Google Scholar] [CrossRef]
- Nowak, O.; Enderle, P.; Varbanov, P. Ways to optimize the energy balance of municipal wastewater systems: Lessons learned from Austrian applications. J. Clean. Prod. 2015, 88, 125–131. [Google Scholar] [CrossRef]
- Pasqualino, J.C.; Meneses, M.; Castells, F. Life cycle assessment of urban wastewater reclamation and reuse alternatives. J. Ind. Ecol. 2010, 15, 49–63. [Google Scholar] [CrossRef]
- Żyłka, R.; Karolinczak, B.; Dąbrowski, W. Structure and indicators of electric energy consumption in dairy wastewater treatment plant. Sci. Total Environ. 2021, 782, 146599. [Google Scholar] [CrossRef]
- Struk-Sokołowska, J.; Mielcarek, A.; Wiater, J.; Rodziewicz, J. Impacts of dairy wastewater and pre-aeration on the performance of SBR treating municipal sewage. Desalin. Water Treat. 2018, 105, 1944–3994. [Google Scholar] [CrossRef]
- Struk-Sokołowska, J.; Rodziewicz, J.; Mielcarek, A. Effect of dairy wastewater on changes in COD fractions in technical-scale SBR type reactors. Water Sci. Technol. 2018, 1, 156–169. [Google Scholar] [CrossRef]
- Kazimierowicz, J.; Bartkowska, I.; Walery, M. Effect of low-temperature conditioning of excess dairy sewage sludge with the use of solidified carbon dioxide on the efficiency of methane fermentation. Energies 2021, 14, 150. [Google Scholar] [CrossRef]
- Dębowski, M.; Zieliński, M.; Kisielewska, M.; Kazimierowicz, J. Evaluation of Anaerobic Digestion of Dairy Wastewater in an Innovative Multi-Section Horizontal Flow Reactor. Energies 2020, 13, 2392. [Google Scholar] [CrossRef]
- Descoins, N.; Deleris, S.; Lestienne, R.; Trouvé, E.; Maréchal, F. Energy efficiency in waste water treatments plants: Optimization of activated sludge process coupled with anaerobic digestion. Energy 2012, 41, 153–164. [Google Scholar] [CrossRef]
- Umiejewska, K. Biological anaerobic-aerobic treatment of dairy wastewater. In Proceedings of the 15th International Conference on Environmental Science and Technology, Rhodes, Greece, 31 August–2 September 2017. [Google Scholar]
- Żyłka, R. Modelling and Optimization of Electricity Consumption in a Dairy Wastewater Treatment Plant. Ph.D. Thesis, Bialystok University of Technology, Białystok, Poland, 2019. [Google Scholar]
- Dąbrowski, W.; Żyłka, R.; Malinowski, P. Evaluation of energy consumption during aerobic sewage sludge treatment in dairy wastewater treatment plant. Environ. Res. 2017, 153, 135–139. [Google Scholar] [CrossRef] [PubMed]
- CFCT 2014 Carbon Footprint Calculation Tool. Available online: https://va-tekniksodra.se/2014/11/carbon-footprint-calculation-tool-for-wwtps-now-available-in-english/ (accessed on 15 June 2021).
- Kampschreuer, M.J.; Temmink, H.; Kleerebezem, R.; Jetten, M.S.M.; van Loosdrecht, M.C.N. Nitrous oxide emission during wastewater treatment. Water Res. 2009, 43, 4093–4103. [Google Scholar] [CrossRef] [PubMed]
- Law, Y.; Ye, L.; Yuting, P.; Yuan, Z. Nitrous oxide emissions from wastewater treatment processes. Phil. Trans. R. Soc. B 2012, 367, 1265–1277. [Google Scholar] [CrossRef] [Green Version]
- Daelman, M.R.J.; van Voorthuizen, E.M.; van Dongen, L.G.J.M.; Volcke, E.I.P.; van Loosdrecht, M.C.M. Methane emission during municipal wastewater treatment. Water Res. 2012, 46, 3657–3670. [Google Scholar] [CrossRef] [PubMed]
- Daelman, M.R.J.; van Voorthuizen, E.M.; van Dongen, L.G.J.M.; Volcke, E.I.P.; van Loosdrecht, M.C.M. Methane and nitrous oxide emissions form municipal waste water treatment—results from a long-term study. Water Sci. Technol. 2013, 67, 2350–2355. [Google Scholar] [CrossRef] [PubMed]
- IPPC. Good Practice Guidance and Uncertainty Management in National Greenhouse Gas Inventories. International Panel of Climate Change. 1999. Available online: http://www.ipcc-nggip.iges.or.jp/public/gp/bgp/5_2_CH4_N2O_Waste_Water.pdf (accessed on 1 July 2021).
- Maktabifard, M.; Zaborowska, E.; Mąkinia, J. Energy neutrality versus carbon footprint minimalization in municipal wastewater treatment plants. Bioresour. Technol. 2020, 300, 122647. [Google Scholar]
- UK Water Industry Research Limited. Workbook for Estimating Operational GHG Emissions, Volume 3; UK Water Industry Research Limited: London, UK, 2009. [Google Scholar]
- Chai, C.; Zhang, D.; Yu, Y.; Feng, Y.; Wong, M.S. Carbon Footprint Analyses of Mainstream Wastewater Treatment Technologies under Different Sludge Treatment Scenarios in China. Water 2015, 7, 918–938. [Google Scholar] [CrossRef]
- Zaborowska, E.; Czerwionka, K.; Mąkinia, J. Integrated plant-wide modelling for evaluation of the energy balance and greenhouse gas footprint in large wastewater treatment plants. Appl. Energy 2021, 282, 116126. [Google Scholar] [CrossRef]
Figure 1.
Source of direct GHG emission of N2O and CH4 at WWTP.

Figure 2.
Current and alternative scenarios of dairy wastewater and sludge treatment lines. 1—mechanical treatment (sieve and grit chamber), 2—averaging tank and dissolved air flotation (DAF), 3—biological treatment in sequence batch reactors (SBRs), 4—thickening, 5—anaerobic sludge stabilisation, 6—aerobic sludge stabilisation, 7—dewatering, 8—combined heat and power (CHP) system.

Figure 3.
Structure of the CF for current and alternative scenarios.


Table 1.
Advantages and disadvantages of aerobic and anaerobic sewage sludge stabilisation.
| Process | Advantages | Disadvantages |
|---|---|---|
| Anaerobic stabilisation |
|
|
| Aerobic stabilisation |
|
|
Source: own study.
Table 2.
Wastewater parameters.
| Parameters | Unit | Influent Parameters | Effluent Parameters | Effluent Standards |
|---|---|---|---|---|
| BOD5 | mgO2 L−1 | 1582 | 16 | 25 |
| COD | mgO2 L−1 | 2166 | 66 | 125 |
| TN | mg L−1 | 93 | 11 | 30 |
| TP | mg L−1 | 19 | 2 | 2 |
Source: own study.
Table 3.
Results of the CF analysis for current and alternative scenario.
| Unit | Current Scenario | Alternative Scenario | |
|---|---|---|---|
| Total carbon footprint: | t CO2e a−1 | 376 | 768 |
| energy use | t CO2e a−1 | 175 | 259 |
| wastewater treatment | t CO2e a−1 | 237 | 288 |
| recipient | t CO2e a−1 | 0 | 0 |
| chemicals | t CO2e a−1 | 8 | 8 |
| transport | t CO2e a−1 | 9 | 9 |
| sludge use | t CO2e a−1 | −53 | −53 |
| biogas use | t CO2e a−1 | 0 | 257 |
| Unit carbon footprint | kg CO2e PE−1 a−1 | 22 | 45 |
Source: own study.
Publisher’s Note: MDPI stays neutral with regard to jurisdictional claims in published maps and institutional affiliations. |
© 2021 by the authors. Licensee MDPI, Basel, Switzerland. This article is an open access article distributed under the terms and conditions of the Creative Commons Attribution (CC BY) license (https://creativecommons.org/licenses/by/4.0/).
Share and Cite
MDPI and ACS Style
Karolinczak, B.; Dąbrowski, W.; Żyłka, R. Evaluation of Dairy Wastewater Treatment Systems Using Carbon Footprint Analysis. Energies 2021, 14, 5366. https://0-doi-org.brum.beds.ac.uk/10.3390/en14175366
AMA Style
Karolinczak B, Dąbrowski W, Żyłka R. Evaluation of Dairy Wastewater Treatment Systems Using Carbon Footprint Analysis. Energies. 2021; 14(17):5366. https://0-doi-org.brum.beds.ac.uk/10.3390/en14175366
Chicago/Turabian StyleKarolinczak, Beata, Wojciech Dąbrowski, and Radosław Żyłka. 2021. "Evaluation of Dairy Wastewater Treatment Systems Using Carbon Footprint Analysis" Energies 14, no. 17: 5366. https://0-doi-org.brum.beds.ac.uk/10.3390/en14175366
Note that from the first issue of 2016, this journal uses article numbers instead of page numbers. See further details here.