Article

Effect of Low-Temperature Conditioning of Excess Dairy Sewage Sludge with the Use of Solidified Carbon Dioxide on the Efficiency of Methane Fermentation

Department of Water Supply and Sewage Systems, Faculty of Civil Engineering and Environmental Sciences, Bialystok University of Technology, 15-351 Bialystok, Poland
*
Author to whom correspondence should be addressed.
Submission received: 25 November 2020 / Revised: 20 December 2020 / Accepted: 23 December 2020 / Published: 30 December 2020
(This article belongs to the Special Issue Wastewater Treatment and Biogas Production)

Abstract

:
This study aimed to determine the effect of the low-temperature conditioning of excess dairy sewage sludge using solidified carbon dioxide on the efficiency of methane fermentation. An increase in the solidified carbon dioxide to excess dairy sewage sludge volumetric ratio above 0.3 had no significant effect on chemical oxygen demand concentration in the dissolved phase. The highest chemical oxygen demand values, ranging from 490.6 ± 12.9 to 510.5 ± 28.5 mg·dm−3, were determined at solidified carbon dioxide to excess dairy sewage sludge ratio ranging from 0.3 to 0.5. The low-temperature conditioning caused ammonia nitrogen concentration to increase from 155.2 ± 10.2 to 185.9 ± 11.1 mg·dm−3 and orthophosphates concentration to increase from 198.5 ± 23.1 to 300.6 ± 35.9 mg·dm−3 in the dissolved phase. The highest unitary amount of biogas, reaching 630.2 ± 45.5 cm3·g o.d.m.−1, was produced in the variant with the solidified carbon dioxide to excess dairy sewage sludge volumetric ratio of 0.3. Methane content of the biogas produced was at 68.7 ± 1.5%. Increased solidified carbon dioxide dose did not lead to any significant changes in biogas and methane production. The efficiency of biogas production from unconditioned excess dairy sewage sludge was lower by 43.0 ± 3.2%. The analysis demonstrated that the low-temperature conditioning is an energetic viable technology aiding the methane fermentation process.

1. Introduction

Wastewater generated by the dairy industry has high concentrations of organic matter and biogenes [1,2]. Their successful removal requires employing advanced methods making use of sewage sludge technology [3,4]. Systems operating based on this technology allow for the simultaneous removal of carbon compounds, nitrification, denitrification, and enhanced bio-removal of phosphorus species [5]. A drawback of the aerobic wastewater treatment systems is the high energy consumption of the process resulting from the necessity of aerating bioreactors and from the intensive growth of excess sewage sludge biomass [6]. Due to the specific characteristics and properties of dairy sewage sludge, its high organic compound load, susceptibility to rotting, as well as the resultant odor nuisance and sanitary parameters, it requires effective neutralization and stabilization [7].
A technologically viable and environment-friendly technology recommended for dairy sewage sludge treatment has been offered by methane fermentation (MF) [8,9]. Its proper course leads to suppressed susceptibility to rotting, partial hygienization, reduced volume of the sludge, and also to high-methane biogas recovery [10,11,12]. These effects can be intensified by sludge pre-conditioning and disintegration [13,14].
Disintegration methods for sewage sludge pre-treatment before MF represent dynamically developing technologies [15]. They result in the damage of the sludge’s structure, including flock fragmentation, microbial cell damage, and release of organic matter and extracellular polymers to the dissolved phase [16,17]. Various studies have reported on the use of different disintegration methods, including: high-pressure methods [18]; mechanical methods [19]; ultrasound energy [20,21,22]; microwaves [23,24]; biological methods [25,26,27]; chemical methods, like alkalization [28], acidification [29], ozonation [30,31], and oxidation technique [32]; as well as thermal methods, like heat treatment and freezing–defrosting [33,34]. The combined disintegration methods, called the hybrid approach, are employed as well [35,36,37].
Scarce information has been devoted in the worldwide literature to the feasibility of the low-temperature conditioning of excess dairy sewage sludge (DSS) using solidified carbon dioxide (LTC-SCDO). Solidified carbon dioxide (SCDO) is a completely natural product. It is produced in granular form by compressing gaseous carbon dioxide (CO2) into a liquid form and removing the heat generated by compression followed by rapid expansion. This expansion and rapid evaporation of CO2 cools the rest of the liquid to its melting point, where CO2 freezes into “snow”, which takes the form of balls or lumps. SCDO sublimates and the sublimation heat amounts to 573 kJ, making it about 3.3 times more efficient than water ice (at the same volume). The specific gravity of SCDO ranges from 1.2 to 1.6 kg-dm−3 and its Mohs hardness is 2, which corresponds to that of gypsum [38]. SCDO creates a bacteriostatic atmosphere, which improves the quality of cooled products by preventing them from oxidizing. It is non-flammable, odorless and tasteless, non-poisonous, and approved for contact with food products. It is used in catering, refrigeration, cleaning of all types of machines and in laboratories to slow down exothermic reactions, and currently also to process sewage sludge [39]. The cause of microbial death during freezing, including SCDO freezing, is an increase in the volume of water freezing in the cytoplasm, mechanical damage to the wall and cell membrane, osmotic shock, and destruction of cellular organelles. Mechanical damage is also caused by the formation of ice crystals in the environment surrounding the cells and inside them, as well as by the partial loss of hydration water of proteins, leading to changes in their properties. The extracellular crystals increasing in the freezing process destroy the microbial cells between them [40]. The formation of intercellular crystals causes damage to biomembranes and changes their properties, which leads to the leakage of intracellular substances into the environment. Considering DSS characteristics and structure as well as available literature data, the use of the LTC-SCDO technology can offer both a technologically and energetically viable alternative to other methods [41,42]. Given the above, this study aimed to determine the effect of the low-temperature conditioning of dairy sewage sludge (DSS) using solidified carbon dioxide (SCDO) on the effectiveness of its methane fermentation (MF).

2. Materials and Methods

2.1. Organization of Experimental Works

The research works were carried out in six variants differing in the SCDO/DSS ratio: variant 1—control, variant 2—0.1, variant 3—0.2, variant 4—0.3, variant 5—0.4, and variant 6—0.5. Experiments were performed in a laboratory scale in batch-fed reactors with a total volume of 500 cm3, equipped with magnetic stirrers and a temperature controlling and stabilizing system. The reactors were fed with a single dose of 200 cm3 of DSS with a temperature of 20 °C, and then with a respective amount of pelleted SCDO (with pellet diameter of 3.0 ± 1.0 mm). The mixture was stirred in the reactors at 50 rpm for 20 min. Afterward the samples were left for complete SCDO sublimation. When they had reached a temperature of 20 °C, they were subjected to MF.

2.2. Materials

DSS was derived from a wastewater treatment facility of a milk processing plant, with an average flow rate of 7500 m3·d−1 and an equivalent number of inhabitants of 350,000. The production profile of the milk processing plant focused on drinking milk, butter, white and cottage cheese, sweet cream, and ripening cheeses. Samples of concentrated DSS (2.0 dm3) were collected with a scoop from a pumping station of excess sludge thickened gravimetrically in the secondary sedimentation tank, according to the Polish Standards (PN-EN ISO 5667-3:2005; PN-ISO 5667-10:1997). They were delivered to the laboratory approximately 40 min after collection. The characteristics of DSS are provided in Table 1. Anaerobic sludge, which served as the inoculum for fermentation reactors, came from a closed fermentation chamber (CFC) with a capacity of 7300 m3, from the sewage treatment plant in Bialystok, which operated at 35 °C, organic loading rate (OLR) of 2.0 g o.d.m.·dm−3·d−1, and 21-day hydraulic retention time (HRT). Anaerobic sludge characteristics are presented in Table 1. Before being used as the inoculum, the anaerobic sludge was adapted to the experimental conditions (i.e., temperature of 42 °C) in a continuous operation for 40 days (HRT = 20 days) and was fed with sewage sludge at OLR of 1.0 g o.d.m.·dm−3·d−1.

2.3. Respirometric Measurements

The MF analyses were carried out in WTW respirometers (Wissenschaftlich-Technische Werkstätten, Weilheim in Oberbayern, Deutschland) with 500 cm3 volume, connected with a system recording changes in the partial pressure caused by biogas production. The volume of entered inoculum was 200 cm3 and then assumed amounts of substrate were added. In order to remove oxygen from the reaction chambers, the feedstock and gaseous phase of the respirometer were purged with compressed nitrogen (N40). Nitrogen was introduced via a rubber hose terminated with a stone diffuser placed below the surface of the inoculum and feedstock mixture for 3 min. The initial OLR was 5.0 g o.d.m.·dm−3. Respirometers were placed in a temperature-controlled cabinet with hysteresis ±0.5 °C. Measurements were conducted at 42 °C. Pressure of the produced biogas was recorded every 24 h. Methane fermentation was conducted until the difference between the three consecutive daily measurements of the partial pressure was not greater than 1.0%.

2.4. Analytical Methods

The DSS and anaerobic sludge inoculum of the exploited fermentation tanks were evaluated for: dry matter content (d.m.), organic dry matter content (o.d.m.), and mineral dry matter content (m.d.m.) with the gravimetric method. The total carbon (TC) content was determined using high-temperature decomposition with infrared detection in a TOC multi NC 3100 analyzer (Analytik Jena, Jena, Germany). The contents of total nitrogen (TN), ammonia nitrogen, orthophosphates, and chemical oxygen demand (COD) were determined with the spectrophotometric method after previous mineralization in a UV-VIS DR6000 spectrometer (Hach, Loveland, CO, USA). The same methods were used to determine the contents of ammonia nitrogen, orthophosphates, and COD in the dissolved phase of DSS obtained by its centrifugation using an MPW-251 laboratory centrifuge (MPW Med. Instruments, Warsaw, Poland) at 5000 rpm for 10 min. The potentiometric method was used to determine pH value.
Biogas samples (20 cm3) were taken with a needle and a gas-tight syringe and then were analyzed using a gas chromatograph (GC Agilent 7890 A-Agilent Technologies, Inc., Wilmington, DE, USA) equipped with a thermoconductometric detector (TCD) to determine the percentage content of methane (CH4).

2.5. Computation Methods

The amount of biogas produced in respirometric studies was calculated based on the ideal gas law. The pressure change determined inside the measuring chamber allowed calculating the volume of generated biogas translated into normal conditions. The results express biogas production minus biogas production in the control variant.
Furthermore, the rate of biogas production (r) depending on the experimental variants applied was specified. Reaction rate constants (k) were determined based on the test data obtained by non-linear regression using Statistica 13.1 PL (StatSoft, Cracow, Poland). The iteration method was applied, in which in every iterative step the function is replaced by a linear differential in relation to the defined parameters. The φ2 contingency coefficient was adopted as a measure of curve fit (with defined parameters) into the test data. This coefficient is a ratio of the sum of the squared deviations of the values calculated based on the determined function from experimental values, to the sum of squared deviations of experimental values from the mean value. Contingency is the better; the lower is the φ2 coefficient. A model fit in which the value of the contingency coefficient did not exceed 0.2 was assumed in the study [43].
The specific energy input (Es) was calculated using Equation (1):
E s = P SCDO · M SCDO · Y SCDO 1   [ Wh ]
where:
PSCDO—SCDO generator performance [W],
MSCDO—SCDO mass [kg],
YSCDO—SCDO generator yield [kg·h−1].
The energy output (Eout) generated from methane production was calculated using the following Equation:
E out = Y Methane · CV Methane · M DSS     [ Wh ]
where:
YMethane—methane yield [dm3·kg f.m.−1],
CVMethane—methane calorific value [Wh·dm−3],
MDSS—DSS mass [kg].
The net energy gain (Enet) was calculated as follows:
E net = E out E S   [ Wh ] .

2.6. Statistical Methods

All experimental variants were conducted in triplicate. The statistical analysis of the results was made using Statistica 13.1 PL package (StatSoft, Cracow, Poland). The Shapiro–Wilk test was used to verify the hypothesis regarding decomposition of every researched variable. The ANOVA test was made to establish the significance of differences between variance. The Levene’s test was used to check the homogeneity of the variance in groups and the Tukey’s Honestly Significant Difference (HSD) Test was used to determine the significance of differences between the analyzed variables. p = 0.05 significance level was adopted in the tests [43].
Empirical equations were elaborated using stepwise regression with multiple regression. They allowed estimating the amount of biogas and methane depending on the DSS characteristics after LTC-SCDO. Predictors having a significant impact on the changes in the estimated parameters in model systems were determined. Furthermore, the accuracy of model fit to empirical data was estimated via coefficient of determination. The significance of multiple regression models was verified based on the F-test. The lack-of-fit test was conducted to evaluate whether the proposed models were sufficiently detailed. This test consisted in comparing the proposed models with full models (having certain other parts of explanatory variables omitted in the proposed models). Developed models were subjected to estimation. Next, their fit to the obtained results was evaluated by the analysis of residuals. The assumption of normality of residual decomposition was verified and model accuracy was evaluated by deleting residual values with respect to predicted values (Statistica 13.1 PL) [43].

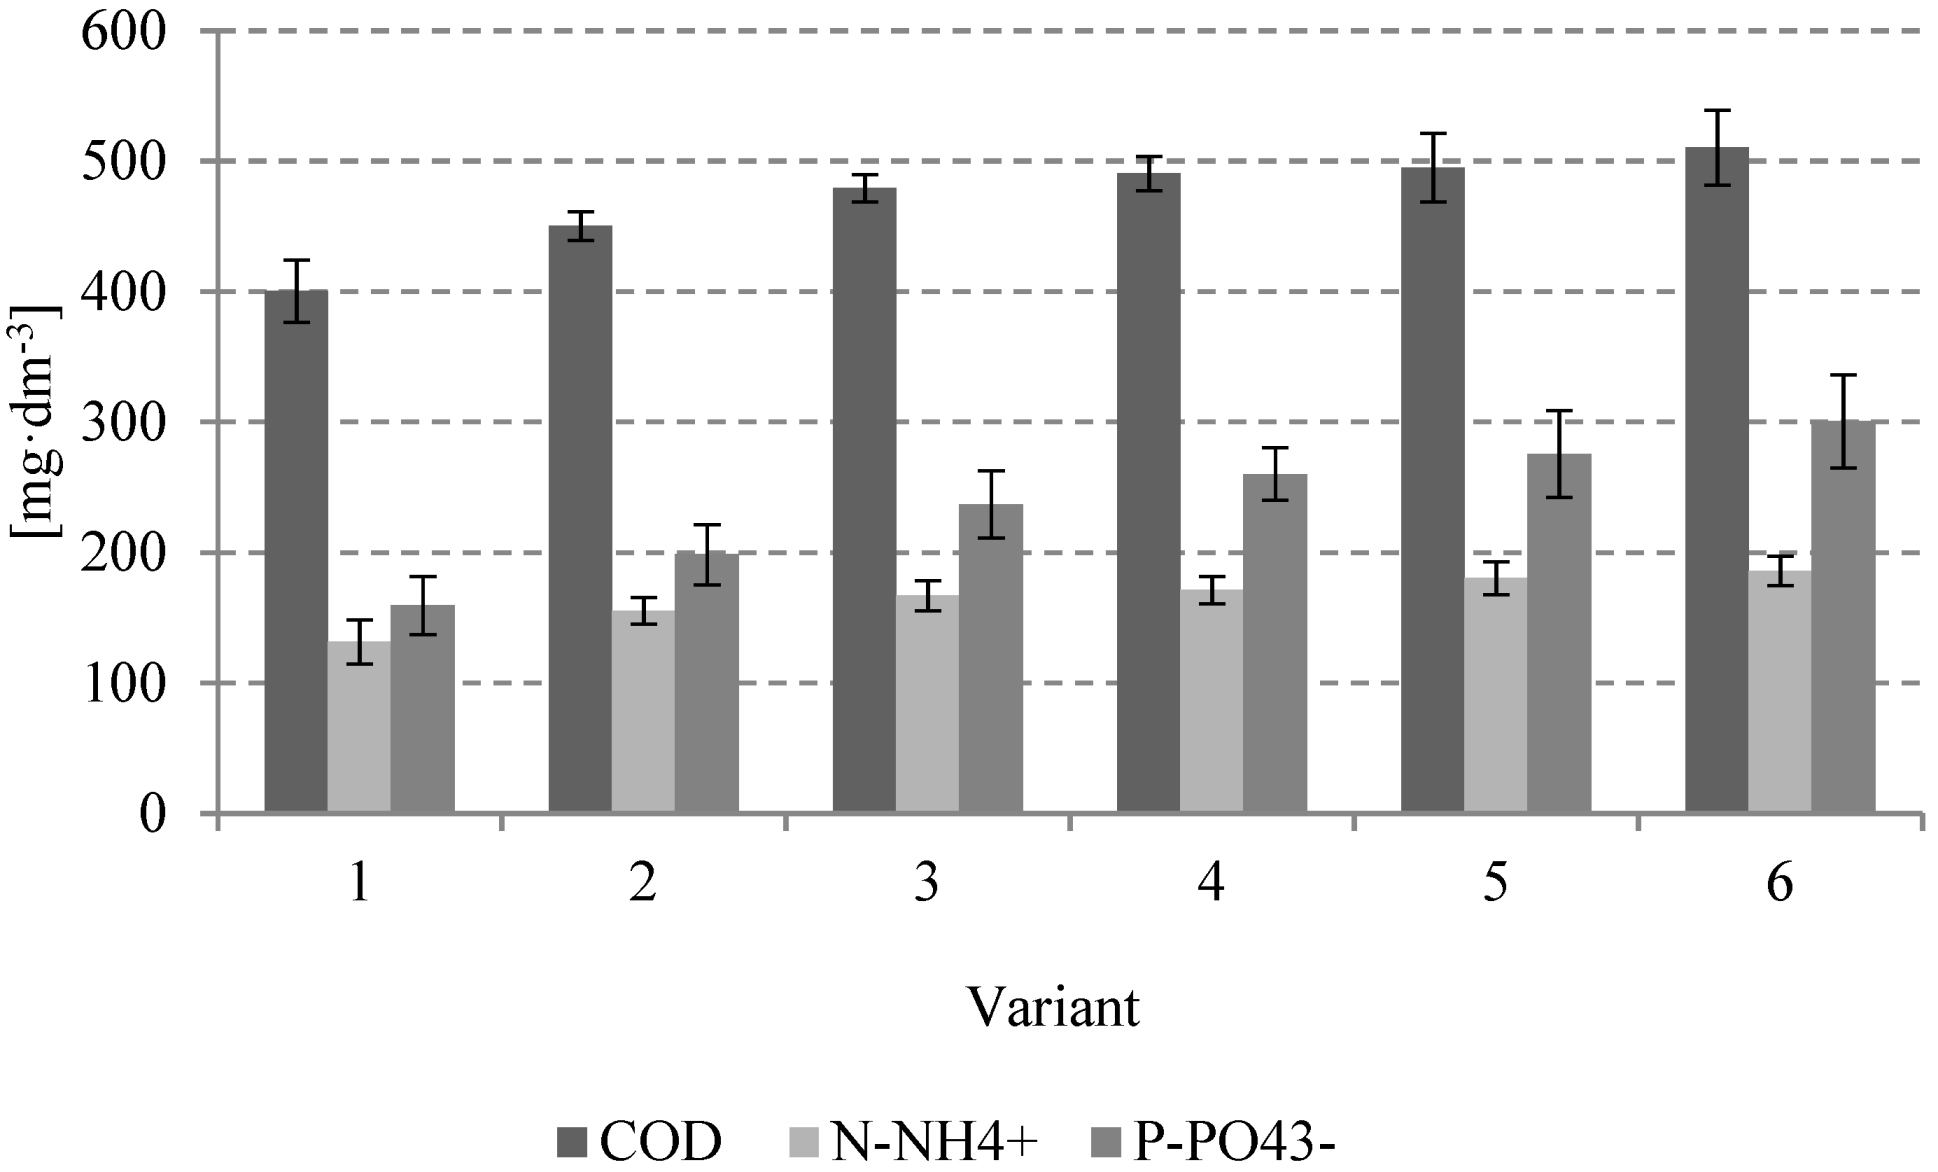
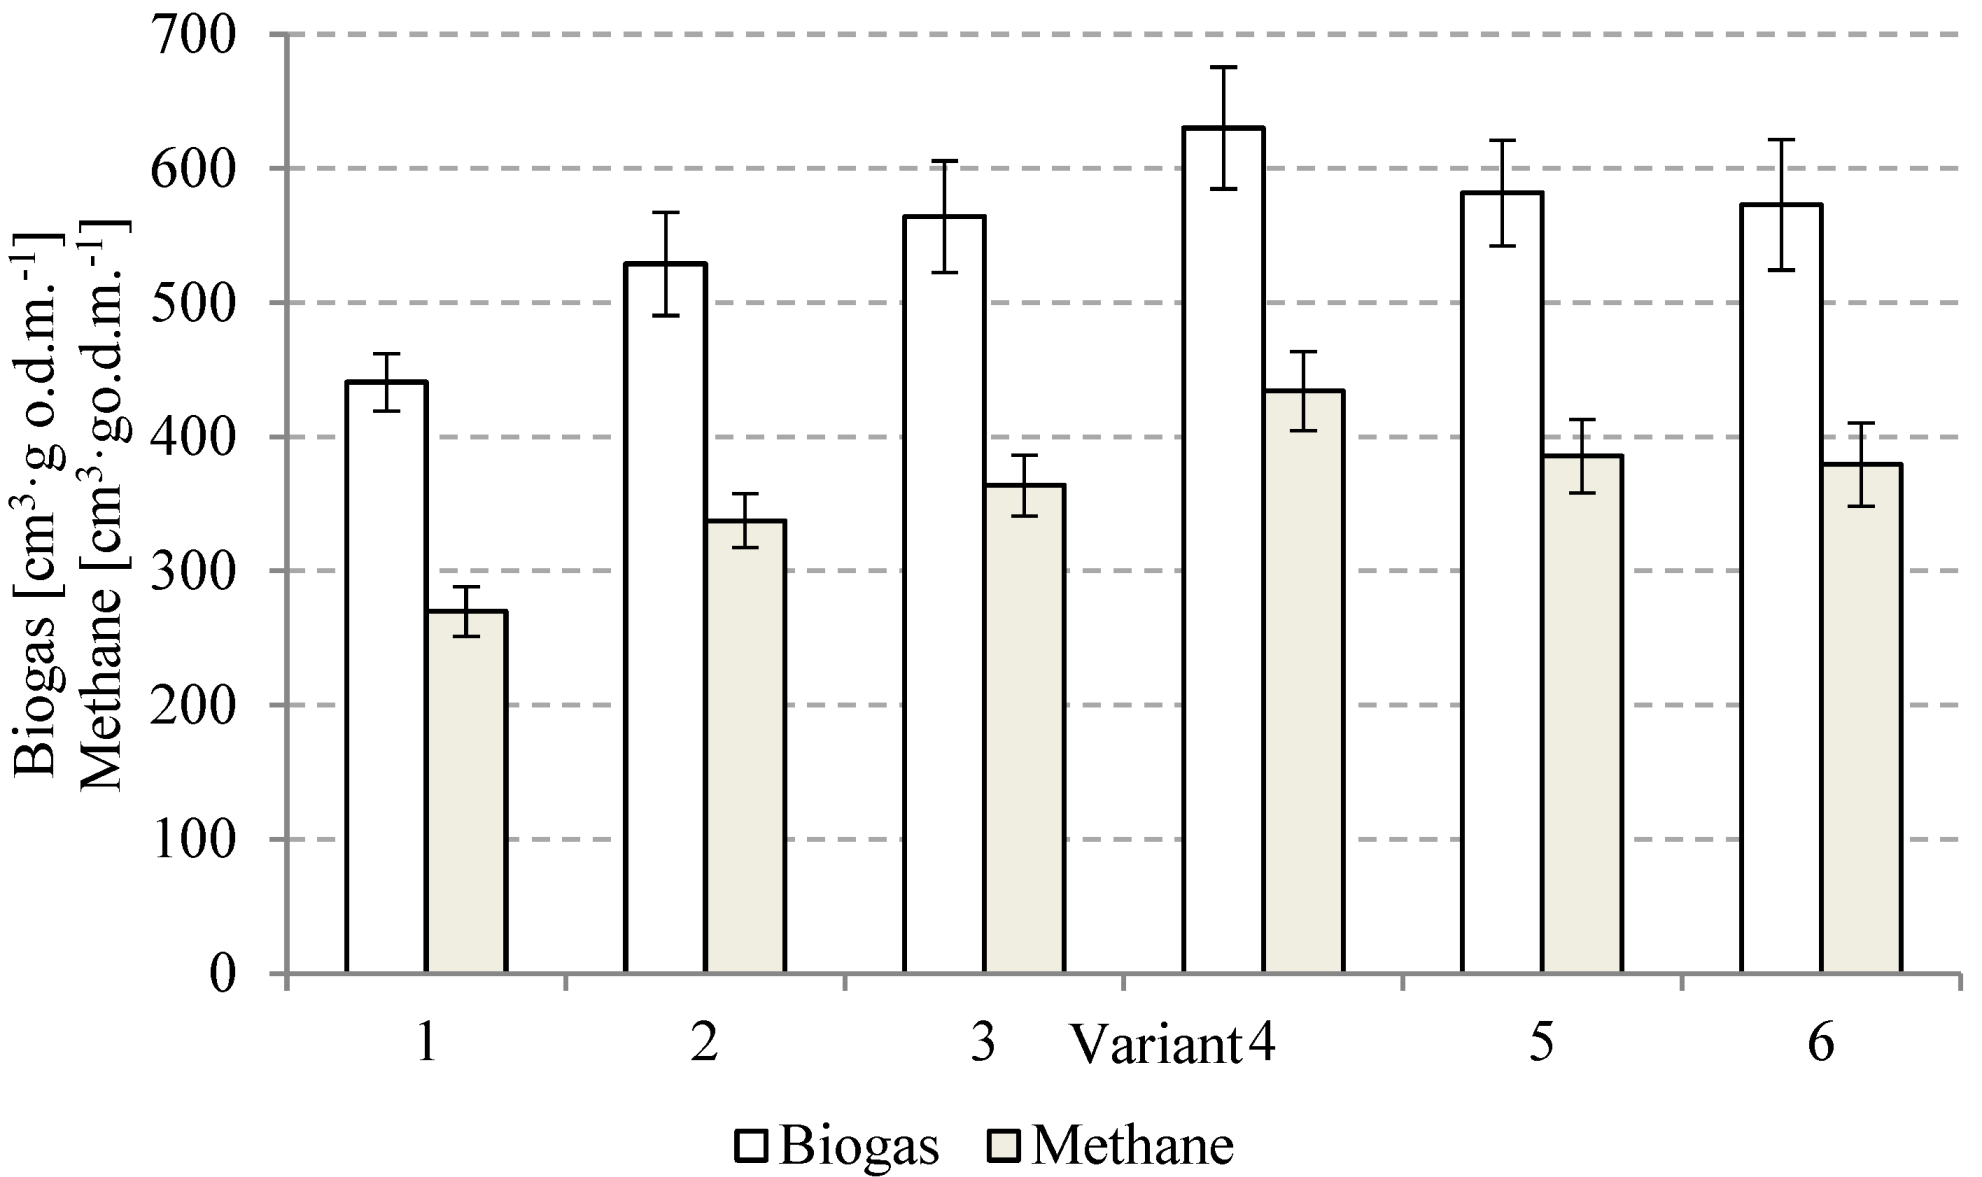
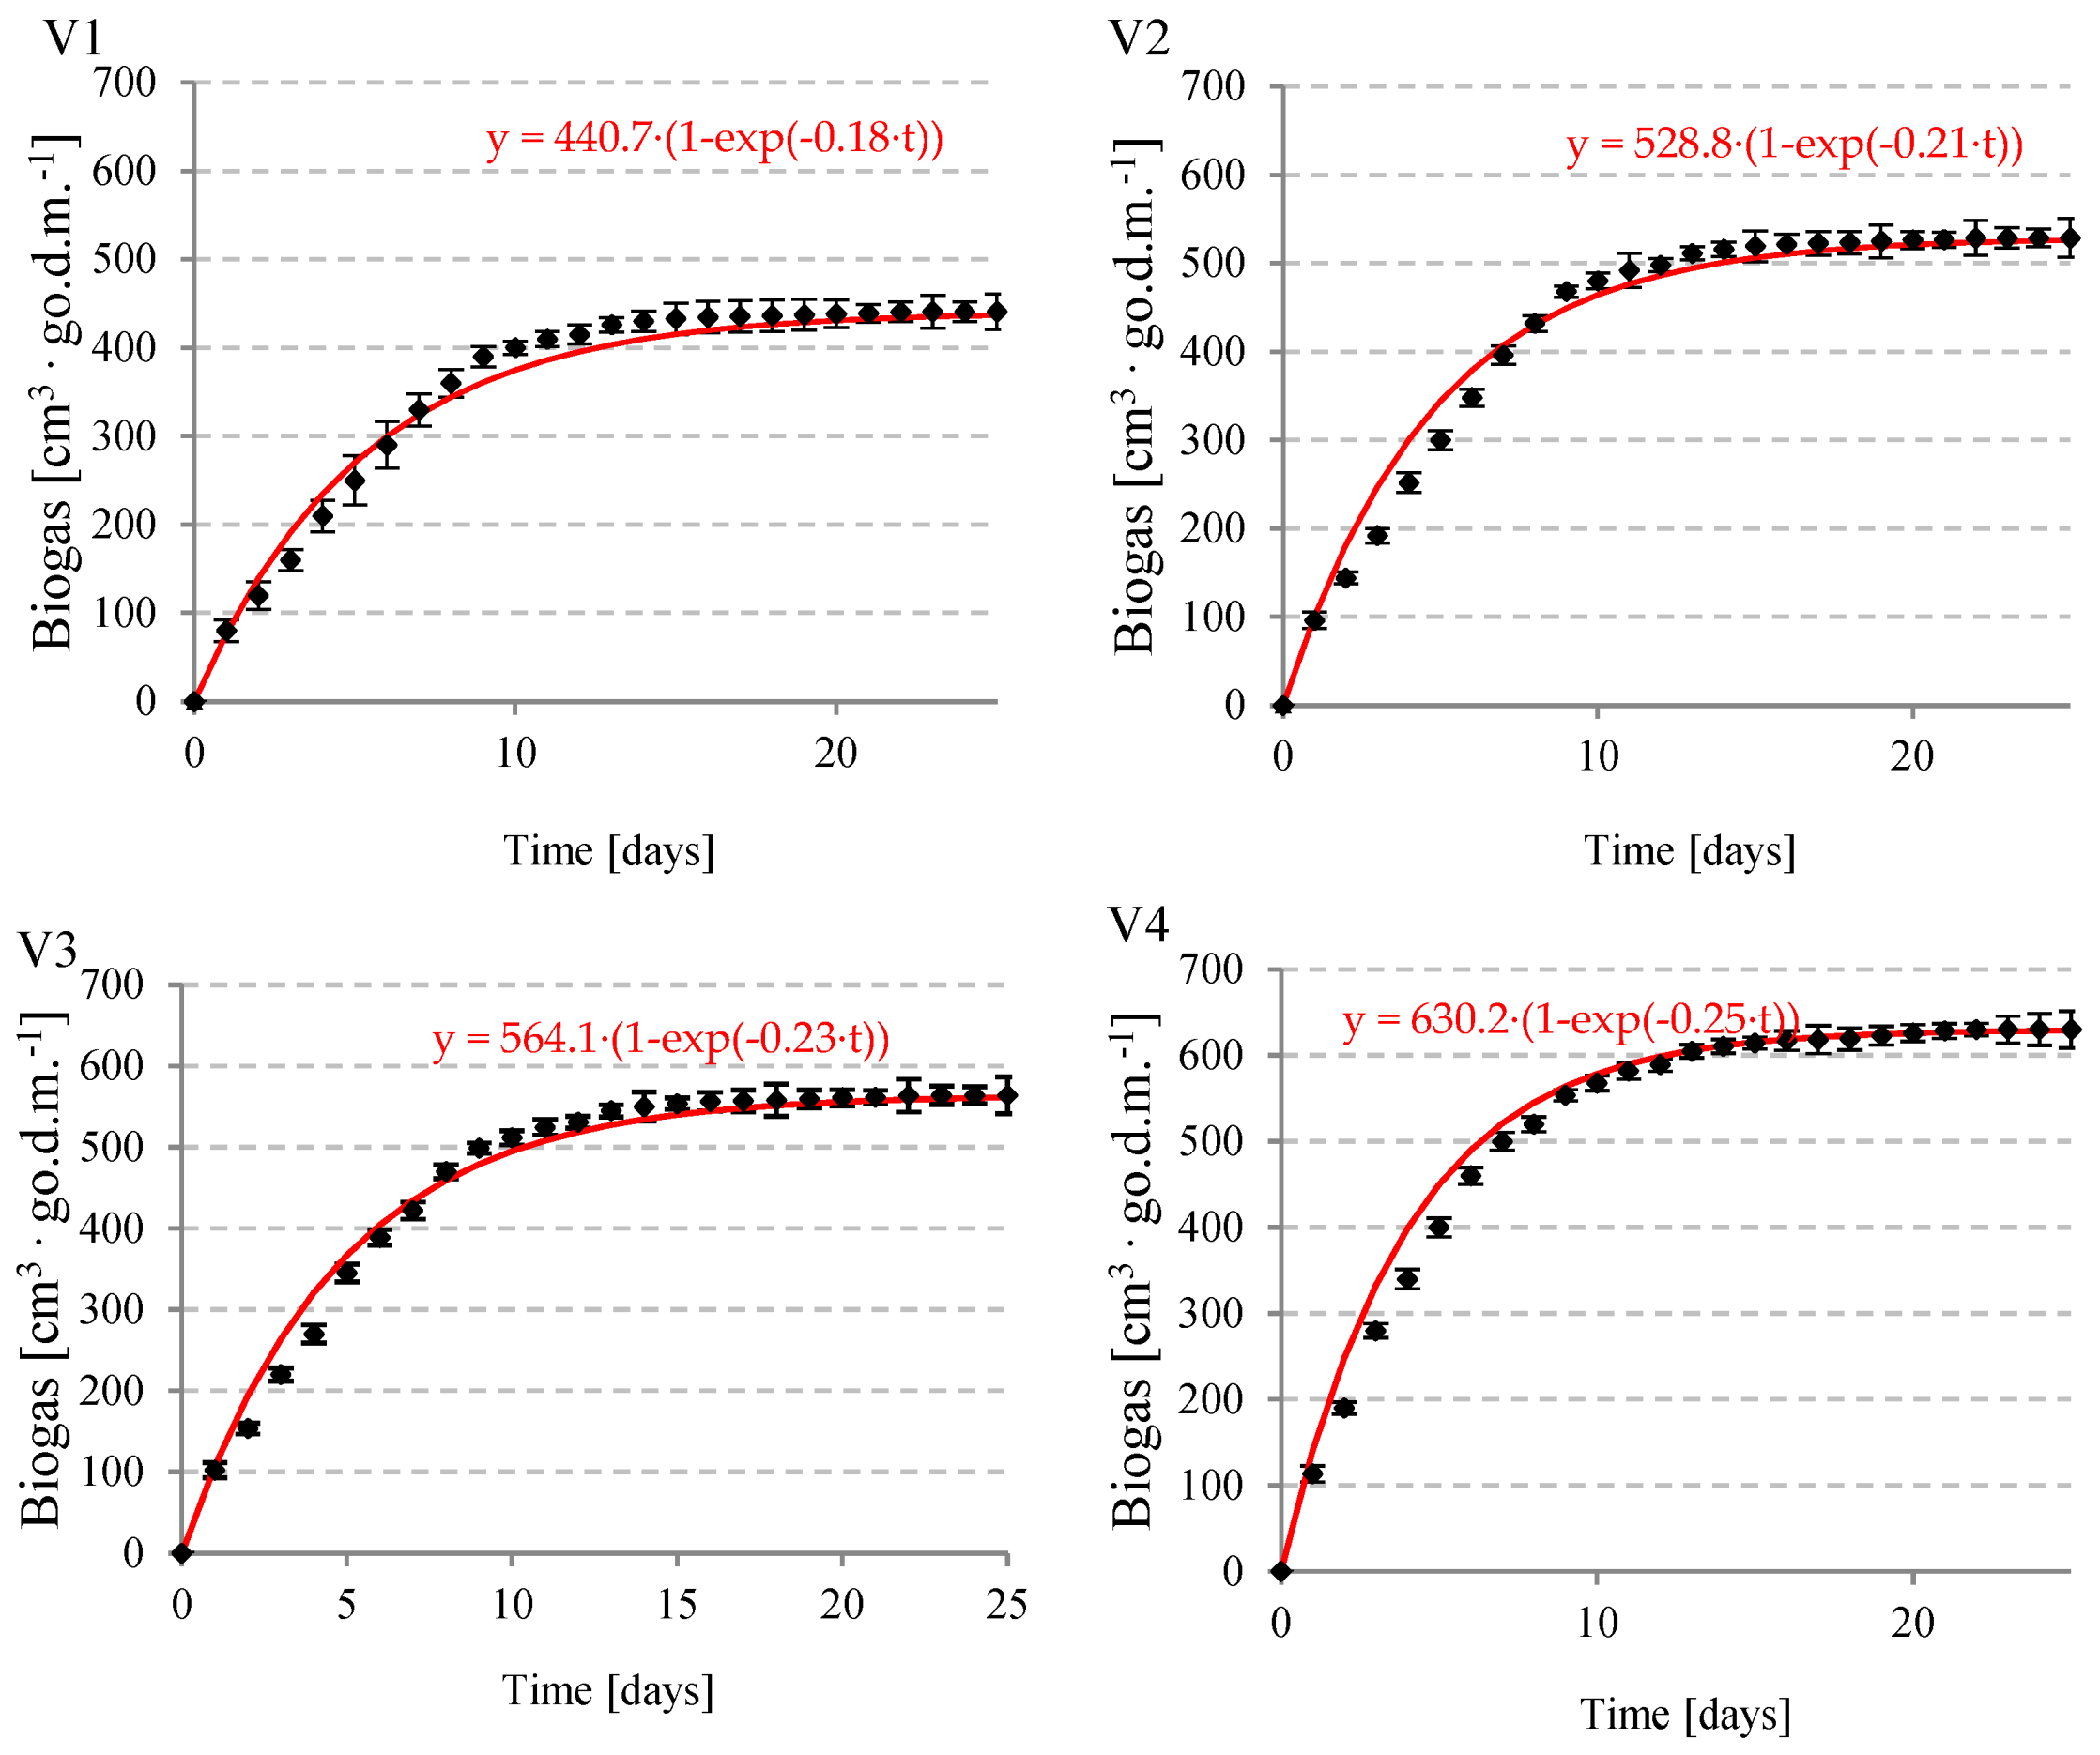
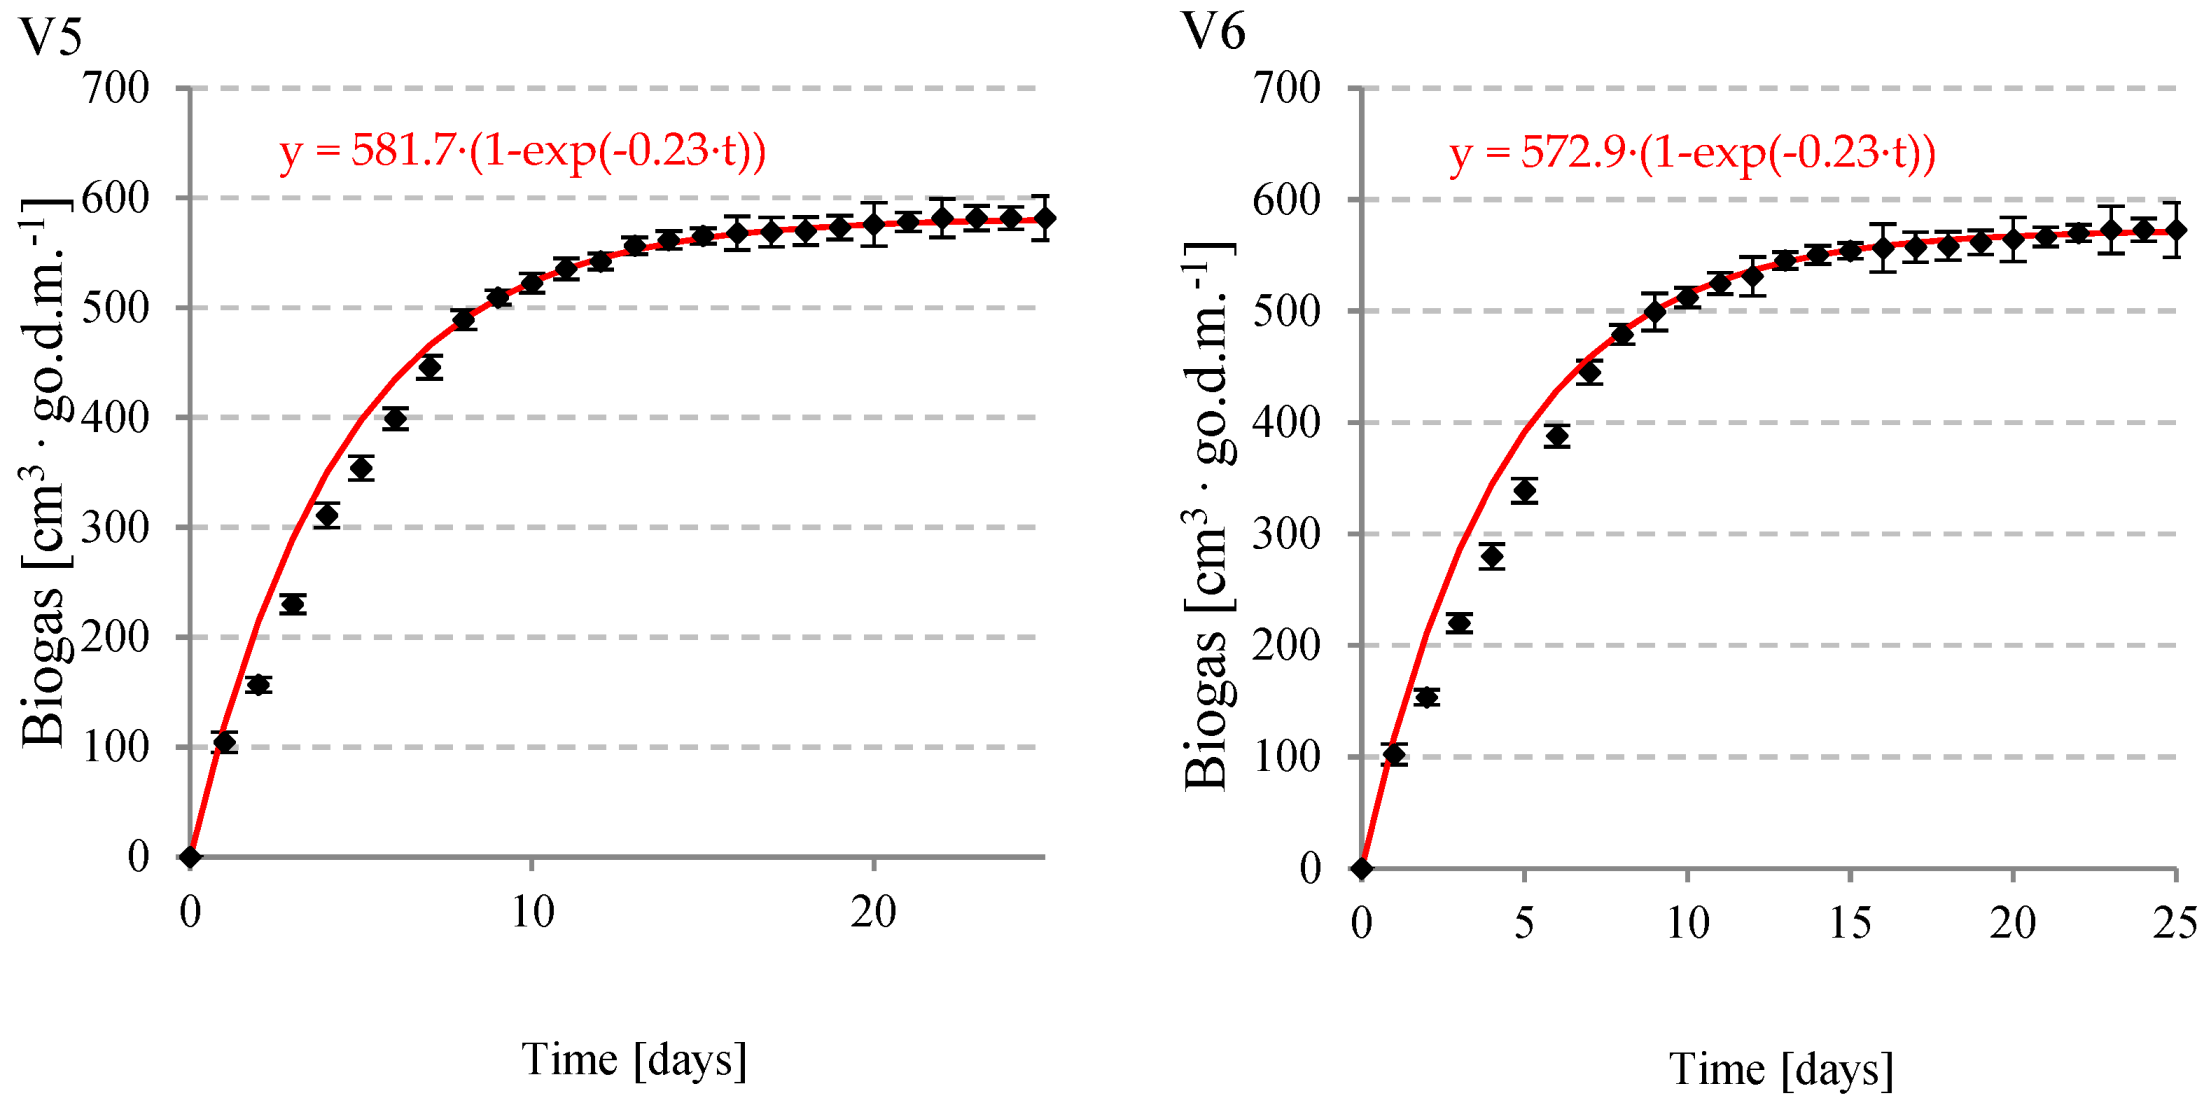
3. Results and Discussion

All experimental LTC-SCDO caused the release of organic matter to the liquid phase of DSS, as indicated by COD concentration control. Previous investigations have shown that the COD concentration increase is associated with the damage of sewage sludge floc structure and disintegration of single cells of microorganisms [44]. The present study showed that the COD concentration in the supernatant increased proportionally to the increasing SCDO/DSS volumetric ratio in variants 1–4. Increasing the SCDO/DSS ratio above 0.3 had no significant effect on the COD increase in the dissolved phase. The lowest COD values, fitting with the narrow range from 490.6 ± 12.9 to 510.5 ± 28.5 mg·dm−3, were determined in variants 4–6 (Figure 1). However, the differences noted were not statistically significant (p = 0.05). In variant 2, COD concentration in the supernatant increased by 12.4 ± 0.3%, i.e., from 400.5 ± 23.8 mg·dm−3 (variant 1) to 450.3 ± 25.6 mg·dm−3, whereas in variant 3, it reached 479.2 ± 10.5 mg·dm−3 (Figure 1).
Similar results were reported by Hu et al. (2011), who investigated the release of organic matter during the freezing/defrosting of excess municipal sewage sludge [45]. They obtained a COD concentration increase of 15%, which was comparable with that reported by Zhao et al. (2010) upon 5-min ultrasound disintegration [46] and heat treatment (100 °C for 30 min) of sludge [47]. Almost double increase in the concentration of dissolved COD was demonstrated by Stabnikova et al. (2008) in their study on the effect of the freezing/defrosting process on food waste [48], and by Örmeci and Vesilind (2001) in their research with sewage sludge from the North Durham Wastewater Treatment Facility, Durham, NC [49]. In turn, Machnicka et al. (2019) observed a dependency between SCDO dose and the amount of COD released to the supernatant. The SCDO disintegration at the waste-activated sludge (WAS) to SCDO volumetric ratio reaching 1:0.25 led to an increase in COD concentration from the initial value of 63 mgO2·dm−3 (crude sludge) to 205 mgO2·dm−3. Increasing the SCDO/WAS ratio to 1:1 increased COD concentration to 889 mg mgO2·dm−3 [39].
As claimed by Nowicka and Machnicka (2015), the damage of the microbial cell structure caused by SCDO leads to the release of enzymes from protoplasts of microorganisms, whose hydrolytic activity leads to the degradation of nitrogen and phosphorus organic compounds, thereby increasing concentrations of ammonia nitrogen and orthophosphates in the supernatant [44]. These changes were confirmed in the present study. In variant 2, the LTC-SCDO caused N-NH4+ concentration increase by 18.0 ± 6.4%, i.e., from 131.5 ± 16.7 mg·dm−3 (variant 1) to 155.2 ± 10.2 mg·dm−3, and P-PO43− concentration increase by 24.6 ± 2.7%, i.e., from 159.3 ± 22.4 mg·dm−3 (variant 1) to 198.5 ± 23.1 mg·dm−3 (Figure 1). The increase in SCDO dose also increased N-NH4+ and P-PO43− concentrations. In variant 6, the concentration of N-NH4+ increased by 41.4 ± 8.4%, compared to the control variant, and reached 185.9 ± 11.1 mg·dm−3, whereas that of P-PO43− increased by 88.7 ± 3.5% and reached 300.6 ± 35.9 mg·dm−3 (Figure 1).
Similar results were reported by Montusiewicz et al. (2010), who subjected mixed sewage sludge to the freezing/defrosting process. This pre-treatment resulted in N-NH4+ concentration increase in the supernatant by 39.26%, i.e., from 94.0 to 130.9 mg·dm−3, and resulted in an almost double increase in P-PO43− concentration from 86.4 to 185.2 mg·dm−3 [50]. Using the same conditioning method for municipal sewage sludge, Gao (2011) reported a 1.5-fold to 2.5-fold increase in P-PO43− concentration in the supernatant [51].
The methane fermentation of unconditioned DSS in variant 1 resulted in biogas yield at 440.7 ± 21.5 cm3·g o.d.m.−1 (Figure 2 and Figure 3) (r =79.3 cm3·d−1), and methane content of 61.2 ± 1.3% (Table 2). The highest biogas production, reaching 630.2 ± 45.5 cm3·g o.d.m.−1, was obtained in variant 4 (Figure 2 and Figure 3), at the production rate of r = 157.6 cm3·d−1 (Table 2) and methane content of 68.7 ± 1.5% (Table 2). An increase in biogas production compared to the control variant was 43.0 ± 3.2% on average. No significant changes in biogas production were observed in the other variants tested (Figure 2 and Figure 3). Variant 5 yielded 581.7 ± 39.4 cm3·g o.d.m.−1 of biogas (Figure 2 and Figure 3) with methane content of 66.3 ± 2.1% (Table 2), whereas in variant 6 the respective values reached 572.9 ± 48.7 cm3·g o.d.m.−1 (Figure 2 and Figure 3) and 66.2 ± 1.9% (Table 2).
In variants 1–4, a very strong positive correlation was observed between the concentrations of COD (Figure 4a), N-NH4+ (Figure 4b), and P-PO43− (Figure 4c) in the dissolved phase and biogas production (R2 = 0.946, R2 = 0.935, and R2 = 0.967, respectively). The higher SCDO doses tested had no significant effect on the final technological effects of the conditioning process considering concentrations of the monitored indicators in the dissolved phase and biogas production. Therefore, no correlation was observed (Figure 4). In turn, there was a correlated effect of COD and N-NH4+ concentrations on biogas (Figure 5a) and methane (Figure 5b) production. Similar conclusions were formulated by Nowicka et al. (2014), who used SCDO to disintegrate the excess municipal sewage sludge before MF. In their study, the most effective volumetric dose turned out to be the mixture with 30% of the thermally-disintegrated sludge, as it ensured biogas production was higher by 49% than in the control variant [52]. The improved MF efficiency upon the use of freezing/defrosting pre-treatment of food waste was reported by Stabnikova et al. (2008). They demonstrated that the effect of food waste freezing/defrosting pre-treatment before its anaerobic degradation in the hybrid anaerobic solid-liquid (HASL) system was comparable with the outcomes of food waste heat pre-treatment at a temperature of 150 °C for 1 h, which allowed for the two-fold shortening of the time needed to produce the same amount of methane compared to the anaerobic degradation of fresh food waste [48]. The effect of freezing/defrosting pre-treatment on MF efficiency was also confirmed by Meyer et al. (2017), who investigated its effect on the dehydration and anaerobic fermentation of sewage sludge from cellulose-paper factories. They achieved a unitary biogas yield from 111 to 310 cm3·g−1 chemical oxygen demand added [53].
To enable estimating biogas and methane production in the process of mesophilic fermentation aided by LTC-SCDO, a multi-regression method was employed to develop empirical equations. The amounts of biogas and methane produced were statistically significantly affected by COD and N-NH4+ concentrations in the dissolved phase and by SCDO/DSS ratio. The proposed biogas production model (3) is characterized by an estimation error of ±30.687 and reflects approximately 90.81% of the changes in the biogas production process (determination coefficient-R2 = 0.9081). The methane estimation model (4) reflects approximately 87.53% of the changes in the methane production process (R2 = 0.8753) with an estimation error of ±30.787.
BIOGAS = 4.931 · COD 6.514 · N NH 4 + 73.067 · SCDO / DSS 675.625
METHANE = 4.703 · COD 7.356 · N NH 4 + +   21.677 · SCDO / DSS 644.532
BIOGAS biogas   production   under   mesophilic   conditions   [ cm 3 · go . d . m . 1 ]
METHANE methane   production   under   mesophilic   conditions   [ cm 3 · go . d . m . 1 ]
COD concentration   of   COD   in   SCDO   supernatant [ mg · dm 3 ]
N NH 4 + concentration   of   N NH 4   in   the   supernatant   [ mg · dm 3 ]
SCDO DSS volumetric   ratio   of   SCDO   to   DSS   [ ]
The energetic analysis demonstrated that the positive unit energy balance achieved for 1.0 dm3 of DSS was a positive value in variants 2–4 (Figure 6). The highest efficiency of net energy production, reaching 32.3 ± 1.5 Wh/dm3DSS, was obtained in variant 4. The amount of energy produced in this variant was higher by over 13% than in the variant with the unconditioned sludge (Table 3). The negative energy balance was obtained in variants 5 and 6, wherein the energy production was lower by 20.6 ± 0.8% and 39.1 ± 0.6%, respectively, than in the control variant.

4. Conclusions

The present study demonstrated a proportional increase in COD concentration in the supernatant along with an increasing SCDO dose at the SCDO/DSS volumetric ratios between 0.1 and 0.3. Increasing SCDO dose above 0.3 had no significant effect on a COD concentration increase in the dissolved phase. The highest COD values, fitting in a narrow range from 490.6 ± 12.9 to 510.5 ± 28.5 mg·dm−3, were determined at SCDO/DSS ranging from 0.3 to 0.5. The LTC-SCDO caused the N-NH4+ concentration to increase from 155.2 ± 10.2 to 185.9 ± 11.1 mg·dm−3 and the P-PO43− concentration to increase from 198.5 ± 23.1 to 300.6 ± 35.9 mg·dm−3 in the dissolved phase.
The highest unitary amount of biogas, reaching 630.2 ± 45.5 cm3·g o.d.m.−1, was produced in the variant with SCDO/DSS ratio of 0.3. Methane content of the produced biogas was at 68.7 ± 1.5%. Increasing SCDO dose had no significant effect on changes in biogas and methane production. The efficiency of biogas production from unconditioned DSS was lower by 43.0 ± 3.2%.
A very strong positive correlation was observed between COD, N-NH4+, and P-PO43− concentrations in the dissolved phase and the amount of biogas produced at SCDO/DSS ranging from 0 to 0.3. The higher SCDO doses tested had no significant effect on the final technological effects of the conditioning process in terms of both concentrations of the monitored indicators in the dissolved phase and biogas production.
The implemented optimization procedures proved that the biogas and methane production efficiency can be estimated based on COD and N-NH4+ concentrations in the dissolved phase and SCDO/DSS volumetric ratio.
The energetic analysis demonstrated that the LTC-SCDO is an energetically viable technology. The highest efficiency of net energy production reached 32.3 ± 1.5 Wh/dm3DSS. The amount of energy produced using the above technology was over 13% higher than in the variant with unconditioned DSS.

Author Contributions

Conceptualization, J.K.; data curation, J.K.; formal analysis, J.K.; funding acquisition, J.K. and I.B.; investigation, J.K. and M.W.; methodology, J.K.; project administration, J.K.; resources, J.K. and M.W.; software, J.K.; supervision, J.K.; validation, J.K., I.B., and M.W.; visualization, J.K., I.B., and M.W.; writing—original draft, J.K., I.B., and M.W.; writing—review and editing, J.K., I.B., and M.W. All authors have read and agreed to the published version of the manuscript.

Funding

The research was carried out within the framework of project no. WZ/WBiIS/2/2019 at the Bialystok University of Technology and was financed from a research subsidy provided by the Minister of Science and Higher Education, Poland.

Institutional Review Board Statement

Not applicable.

Informed Consent Statement

Not applicable.

Data Availability Statement

Data is contained within the article.

Conflicts of Interest

The authors declare no conflict of interest.

References

  1. Dębowski, M.; Zieliński, M.; Kisielewska, M.; Kazimierowicz, J. Evaluation of Anaerobic Digestion of Dairy Wastewater in an Innovative Multi-Section Horizontal Flow Reactor. Energies 2020, 13, 2392. [Google Scholar] [CrossRef]
  2. Garg, S.; Rumjit, N.P.; Thomas, P.; Sikander; Lai, C.W.; George, P.J. Green Technologies for the Treatment and Utilisation of Dairy Product Wastes. In Sustainable Green Chemical Processes and Their Allied Applications; Nanotechnology in the Life Sciences; Inamuddin, I., Asiri, A., Eds.; Springer: Cham, Switzerland, 2020. [Google Scholar] [CrossRef]
  3. Tian, T.; Zhou, K.; Xuan, L.; Zhang, J.-X.; Li, Y.-S.; Liu, D.-F.; Yu, H.-Q. Exclusive microbially driven autotrophic iron-dependent denitrification in a reactor inoculated with activated sludge. Water Res. 2019. [Google Scholar] [CrossRef] [PubMed]
  4. Żyłka, R.; Dąbrowski, W.; Malinowski, P.; Karolinczak, B. Modeling of Electric Energy Consumption during Dairy Wastewater Treatment Plant Operation. Energies 2020, 13. [Google Scholar] [CrossRef]
  5. Goli, A.; Shamiri, A.; Khosroyar, S.; Talaiekhozani, A.; Sanaye, R.; Azizi, K. A Review on Different Aerobic and Anaerobic Treatment Methods in Dairy Industry Wastewater. J. Environ. Treat. Tech. 2019, 6, 113–141. [Google Scholar]
  6. Sabliy, L.; Kuzminskiy, Y.; Zhukova, V.; Kozar, M.; Sobczuk, H. New Approaches in Biological Wastewater Treatment Aimed at Removal of Organic Matter and Nutrients. Ecol. Chem. Eng. S 2019, 26, 331–343. [Google Scholar] [CrossRef] [Green Version]
  7. Ahmad, T.; Aadil, R.M.; Ahmed, H.; Rahman, U.; Soares, B.C.V.; Souza, S.L.Q.; Pimentel, T.C.; Scudino, H.; Guimarães, J.T.; Esmerino, E.A.; et al. Treatment and utilization of dairy industrial waste: A review. Trends Food Sci. Technol. 2019, 88, 361–372. [Google Scholar] [CrossRef]
  8. Flotats, X. Biogas: Perspectives of an Old Technology. In Biorefinery; Bastidas-Oyanedel, J.R., Schmidt, J., Eds.; Springer: Cham, Switzerland, 2019. [Google Scholar] [CrossRef]
  9. Markowski, M.; Bialobrzewski, I.; Zielinski, M.; Dębowski, M.; Krzemieniewski, M. Optimizing low-temperature biogas production from biomass by anaerobic digestion. Renew. Energy 2014, 69, 219–225. [Google Scholar] [CrossRef]
  10. Dębowski, M.; Zieliński, M. Technological Effectiveness of Sugar-Industry Effluent Methane Fermentation in a Fluidized Active Filling Reactor (FAF-R). Energies 2020, 13, 6626. [Google Scholar] [CrossRef]
  11. Di Capua, F.; Spasiano, D.; Giordano, A.; Adani, F.; Fratino, U.; Pirozzi, F.; Esposito, G. High-solid anaerobic digestion of sewage sludge: Challenges and opportunities. Appl. Energy 2020, 278. [Google Scholar] [CrossRef]
  12. Oladejo, J.; Shi, K.; Luo, X.; Yang, G.; Wu, T. A Review of Sludge-to-Energy Recovery Methods. Energies 2019, 12, 60. [Google Scholar] [CrossRef] [Green Version]
  13. Liu, B.; Jin, R.; Liu, G.; Gu, C.; Dong, B.; Zhou, J.; Xing, D. Effect on sludge disintegration by EDTA-enhanced thermal-alkaline treatment. Water Environ. Res. 2019. [Google Scholar] [CrossRef] [PubMed]
  14. Liu, X.; Xu, Q.; Wang, D.; Wu, Y.; Yang, Q.; Liu, Y.; Wang, Q.; Li, X.; Li, H.; Zeng, G.; et al. Unveiling the mechanisms of how cationic polyacrylamide affects short-chain fatty acids accumulation during long-term anaerobic fermentation of waste activated sludge. Water Res. 2019, 155, 142–151. [Google Scholar] [CrossRef]
  15. Liu, J.; Wei, Y.; Li, K.; Tong, J.; Wang, Y.; Jia, R. Microwave-acid pretreatment: A potential process for enhancing sludge dewaterability. Water Res. 2016, 90, 225–234. [Google Scholar] [CrossRef] [PubMed]
  16. Mancuso, G.; Langone, M.; Andreottola, G.; Bruni, L. Effects of hydrodynamic cavitation, low-level thermal and low-level alkaline pre-treatments on sludge solubilisation. Ultrason. Sonochem. 2019, 59, 104750. [Google Scholar] [CrossRef] [PubMed]
  17. Zhang, G.; Zhang, P.; Yang, J.; Chen, Y. Ultrasonic reduction of excess sludge from the activated sludge system. J. Hazard. Mater. 2007, 145, 515–519. [Google Scholar] [CrossRef] [PubMed]
  18. Nabi, M.; Zhang, G.; Li, F.; Zhang, P.; Wu, Y.; Tao, X.; Bao, S.; Wang, S.; Chen, N.; Ye, J.; et al. Enhancement of high pressure homogenization pretreatment on biogas production from sewage sludge: A review. Desalin. Water Treat. 2020, 175, 341–351. [Google Scholar] [CrossRef]
  19. Wett, B.; Phothilangka, P.; Eladawy, A. Systematic comparison of mechanical and thermal sludge disintegration technologies. Waste Manag. 2010, 30, 1057–1062. [Google Scholar] [CrossRef]
  20. Aylin Alagöz, B.; Yenigün, O.; Erdinçler, A. Ultrasound assisted biogas production from co-digestion of wastewater sludges and agricultural wastes: Comparison with microwave pre-treatment. Ultrason. Sonochem. 2018, 40, 193–200. [Google Scholar] [CrossRef]
  21. Zhou, Z.; Yang, Y.; Li, X. Effects of ultrasound pretreatment on the characteristic evolutions of drinking water treatment sludge and its impact on coagulation property of sludge recycling process. Ultrason. Sonochem. 2015, 27, 62–71. [Google Scholar] [CrossRef]
  22. Zieliński, M.; Dębowski, M.; Krzemieniewski, M.; Rusanowska, P.; Zielińska, M.; Cydzik-Kwiatkowska, A.; Głowacka-Gil, A. Application of an Innovative Ultrasound Disintegrator for Sewage Sludge Conditioning Before Methane Fermentation. J. Ecol. Eng. 2018, 19, 240–247. [Google Scholar] [CrossRef]
  23. Rani, R.U.; Kumar, S.A.; Kaliappan, S.; Yeom, I.; Banu, J.R. Impacts of microwave pretreatments on the semi-continuous anaerobic digestion of dairy waste activated sludge. Waste Manag. 2013, 33, 1119–1127. [Google Scholar] [CrossRef] [PubMed]
  24. Yi, W.G.; Lo, K.V.; Mavinic, D.S. Effects of microwave, ultrasonic and enzymatic treatment on chemical and physical properties of waste-activated sludge. J. Env. Sci. Health A 2014, 49, 203–209. [Google Scholar] [CrossRef] [PubMed]
  25. Ali, M.; Zhang, J.; Raga, R.; Lavagnolo, M.C.; Pivato, A.; Wang, X.; Zhang, Y.; Cossu, R.; Yue, D. Effectiveness of aerobic pretreatment of municipal solid waste for accelerating biogas generation during simulated landfilling. Front. Env. Sci. Eng. 2018, 12, 5. [Google Scholar] [CrossRef]
  26. Lü, F.; Wang, J.; Shao, L.; He, P. Enzyme disintegration with spatial resolution reveals different distributions of sludge extracellular polymer substances. Biotechnol. Biofuels 2016, 9, 29. [Google Scholar] [CrossRef] [PubMed] [Green Version]
  27. Gebreeyessus, G.D.; Jenicek, P. Thermophilic versus mesophilic anaerobic digestion of sewage sludge: A comparative review. Bioengineering 2016, 3, 15. [Google Scholar] [CrossRef]
  28. Silvestri, D.; Wacławek, S.; Gončuková, Z.; Padil, V.V.T.; Grübel, K.; Černík, M. A new method for assessment of the sludge disintegration degree with the use of differential centrifugal sedimentation. Environ. Technol. (UK) 2018, 1–8. [Google Scholar] [CrossRef]
  29. Parthiba Karthikeyan, O.; Trably, E.; Mehariya, S.; Bernet, N.; Wong, J.W.C.; Carrere, H. Pretreatment of food waste for methane and hydrogen recovery: A review. Bioresour. Technol. 2018, 249, 1025–1039. [Google Scholar] [CrossRef] [Green Version]
  30. Carbajo, J.B.; Petre, A.L.; Rosal, R.; Berná, A.; Letón, P.; García-Calvo, E.; Perdigón-Melón, J.A. Ozonation as pre-treatment of activated sludge process of a wastewater containing benzalkonium chloride and NiO nanoparticles. Chem. Eng. J. 2016, 283, 740–749. [Google Scholar] [CrossRef]
  31. Xu, Q.; Liu, X.; Fu, Y.; Li, Y.; Wang, D.; Wang, Q.; Liu, Y.; An, H.; Zhao, J.; Wu, Y.; et al. Feasibility of enhancing short-chain fatty acids production from waste activated sludge after free ammonia pretreatment: Role and significance of rhamnolipid. Bioresour. Technol. 2018, 267, 141–148. [Google Scholar] [CrossRef]
  32. Kim, C.; Ahn, J.-Y.; Kim, T.Y.; Shin, W.S.; Hwang, I. Activation of persulfate by nanosized zero-valent iron (NZVI): Mechanisms and transformation products of NZVI. Environ. Sci. Technol 2018, 52, 3625–3633. [Google Scholar] [CrossRef]
  33. Liu, X.; Xu, Q.; Wang, D.; Zhao, J.; Wu, Y.; Liu, Y.; Ni, B.J.; Wang, Q.; Zeng, G.; Li, X.; et al. Improved methane production from waste activated sludge by combining free ammonia with heat pretreatment: Performance, mechanisms and applications. Bioresour. Technol. 2018, 268, 230–236. [Google Scholar] [CrossRef] [PubMed]
  34. Pilli, S.; Yan, S.; Tyagi, R.D.; Surampalli, R.Y. Thermal pretreatment of sewage sludge to enhance anaerobic digestion: A review. Crit. Rev. Env. Sci. Technol. 2015, 45, 669–702. [Google Scholar] [CrossRef]
  35. Krzemieniewski, M.; Debowski, M.; Janczukowicz, W.; Pesta, J. Effect of Sludge Conditioning by Chemical Methods with Magnetic Field Application. Pol. J. Environ. Stud. 2003, 12, 595–605. [Google Scholar]
  36. Suschka, J.; Grübel, K. Low intensity surplus activated sludge pretreatment before anaerobic digestion. Arch. Environ. Prot. 2016, 43, 50–57. [Google Scholar] [CrossRef] [Green Version]
  37. Uma Rani, R.; Adish Kumar, S.; Kaliappan, S.; Yeom, I.T.; Banu, J.R. Enhancing the anaerobic digestion potential of dairy waste activated sludge by two step sono-alkalization pretreatment. Ultrason. Sonochem. 2014, 21, 1065–1074. [Google Scholar] [CrossRef]
  38. Jean, D.S.; Lee, D.J.; Chang, C.Y. Direct sludge freezing using dry ice. Adv. Environ. Res. 2001, 5, 145–150. [Google Scholar] [CrossRef]
  39. Machnicka, A.; Grübel, K.; Wacławek, S.; Sikora, K. Waste-activated sludge disruption by dry ice: Bench scale study and evaluation of heat phase transformations. Environ. Sci. Pollut. Res. 2019, 26, 26488–26499. [Google Scholar] [CrossRef] [Green Version]
  40. Bollag, D.H.; Edelstein, S.J. Protein Methods; Wiley & Liss: New York, NY, USA, 1992. [Google Scholar]
  41. Diak, J.; Örmeci, B.; Proux, C. Freeze—Thaw treatment of RBC sludge from a remote mining exploration facility in subarctic Canada. Water Sci. Technol. 2011, 63, 1309–1313. [Google Scholar] [CrossRef]
  42. Tuan, P.A.; Sillanpää, M. Migration of ions and organic matter during electro—Dewatering of anaerobic sludge. J. Hazard. Mater. 2010, 15, 54–61. [Google Scholar] [CrossRef]
  43. StatSoft Electronic Statistics Textbook. Copyright StatSoft, Inc., 1984–2011. Available online: https://www.statsoft.pl/textbook/stathome_stat.html?https%3A%2F%2Fwww.statsoft.pl%2Ftextbook%2Fadvisor.html (accessed on 1 December 2020).
  44. Nowicka, E.; Machnicka, A. Confirmation of effectiveness surplus activated sludge dry ice disruption by infrared wave analysis. In Proceedings of the 42nd International Conference of Slovak Society of Chemical Engineering, Tatranské matliare, Slovakia, 25–29 May 2015; Baza Wiedzy: Tatranské Matliare, Slovakia, 2015; pp. 531–551. [Google Scholar]
  45. Hu, K.; Jiang, J.Q.; Zhao, Q.L.; Lee, D.J.; Wang, K.; Qiu, W. Conditioning of wastewater sludge freezing and thawing: Role of curing. Water Res. 2011, 45, 5969–5976. [Google Scholar] [CrossRef]
  46. Zhao, Q.L.; Hu, K.; Miao, L.J.; Wang, K. Effect of Ultrasonic Treatment on Characteristics of Waste Activated Sludge. Bioinformatics and Biomedical Engineering (iCBBE). In Proceedings of the 4th International Conference, Chengdu, China, 18–20 June 2010; IEEE: Piscataway, NY, USA, 2010; pp. 1–4. [Google Scholar] [CrossRef]
  47. Bougrier, C.; Delgenès, J.P.; Carrère, H. Effects of thermal treatments on five different waste activated sludge samples solubilisation, physical properties and anaerobic digestion. Chem. Eng. J. 2008, 139, 236–244. [Google Scholar] [CrossRef]
  48. Stabnikova, O.; Liu, X.Y.; Wang, J.Y. Digestion of frozen/thawed food waste in the hybrid anaerobic solid–liquid system. Waste Manag. 2008, 28, 1654–1659. [Google Scholar] [CrossRef] [PubMed]
  49. Örmeci, B.; Vesilind, P.A. Effect of dissolved organic material and cations on freeze–thaw conditioning of activated and alum sludges. Water Res. 2001, 35, 4299–4306. [Google Scholar] [CrossRef]
  50. Montusiewicz, A.; Lebiocka, M.; Rozej, A.; Zacharska, E.; Pawlowski, L. Freezing/thawing effects on anaerobic digestion of mixed sewage sludge. Bioresour. Technol. 2010, 101, 3466–3473. [Google Scholar] [CrossRef]
  51. Gao, W. Freezing as a combined wastewater sludge pretreatment and conditioning method. Desalination 2011, 268, 170–173. [Google Scholar] [CrossRef]
  52. Nowicka, E.; Machnicka, A.; Grübel, K. Improving of anaerobic digestion by dry ice disintegration of surplus activated sludge. Proc. ECOpole 2014, 8, 239–247. [Google Scholar] [CrossRef]
  53. Meyer, T.; Chen, X.; Tran, H.N.; Allen, D.G.; Edwards, E.A. Natural Freezing-Thawing and Its Impact on Dewaterability and Anaerobic Digestibility of Biosludge. Environ. Eng. Sci. 2017, 34, 357–366. [Google Scholar] [CrossRef]
Figure 1. Changes in the concentrations of organic and biogenic compounds in DSS supernatant after solidified carbon dioxide (LTC−SCDO).
Energies 14 00150 g001
Figure 2. Effect of technological variant on biogas and methane production.
Energies 14 00150 g002
Figure 3. Course of biogas production in experimental variants.
Energies 14 00150 g003aEnergies 14 00150 g003b
Figure 4. Effect of concentrations of (a) chemical oxygen demand (COD), (b) N−NH4+, and (c) P−PO43− in the dissolved phase on biogas production.
Energies 14 00150 g004
Figure 5. Surface dependency between COD and N-NH4+ concentrations and (a) biogas production and (b) methane production.
Energies 14 00150 g005
Figure 6. Energy values obtained upon MF of DSS after LTC-SCDO.
Energies 14 00150 g006
Table 1. Characteristics of dairy sewage sludge (DSS) and anaerobic sludge used as the inoculum in the experiment.
IndicatorUnitExcess SludgeAnaerobic Sludge
pH-7.20 ± 0.97.36 ± 0.2
Dry matter (DM)[g·dm−3]18.3 ± 3.335.8 ± 3.2
Organic dry matter (o.d.m.)[g·dm−3]11.2 ± 1.525.0 ± 1.2
Mineral dry matter (m.d.m.)[g·dm−3]7.1 ± 1.110.8 ± 1.2
Chemical oxygen demand (COD)[mg·dm−3]4100.8 ± 126.477.5 ± 9.4
Total carbon (TC)[g TC·dm−3]781.4 ± 30.610.7 ± 0.5
Total nitrogen (TN)[g TN·dm−3]59.1 ± 8.61.1 ± 0.2
Carbon to nitrogen ratio (C/N)-13.2 ± 1.29.7 ± 0.7
Ammonia nitrogen (N-NH4+)[mg·dm−3]240.6 ± 20.9105.4 ± 12.6
Orthophosphates (PO43−)[mg·dm−3]295.8 ± 28.591.3 ± 10.5
Table 2. Biogas production rate (r), reaction rate constants (k), and methane content of biogas (CH4).
VariantrkCH4
[cm3·d−1][1·d−1][%]
179.30.1861.2 ± 1.3
2111.10.2163.8 ± 2.8
3129.70.2364.5 ± 1.7
4157.60.2568.7 ± 1.5
5133.80.2366.3 ± 2.1
6131.80.2366.2 ± 1.9
Table 3. Energetic analysis of methane fermentation (MF) of DSS after LTC-SCDO.
VariantSCDO/DSSρDSSMDSSVDSSρSCDOVSCDOMSCDOPSCDOYSCDOEsYmethaneYmethaneCVmethaneEoutEnoutEnet%
[-][kg·dm−3][kg][dm3][kg·dm−3][dm3][kg][kW][kg·h−1][Wh][dm3·kgo.d.m.−1][dm3·kg f.m.−1][kWh·dm−3][Wh][Wh][Wh]
101.031.0311.56001.65502703.0240.0091728.6 ± 1.5-28.6 ± 1.5-
20.10.10.1564.5 ± 0.33383.78635.8 ± 1.27.2 ± 0.331.2 ± 1.89.3 ± 1.1
30.20.20.3129.1 ± 0.93644.07738.5 ± 1.79.9 ± 0.229.4 ± 1.23.0 ± 1.0
40.30.30.46813.6 ± 1.14344.86145.9 ± 2.817.3 ± 1.332.3 ± 1.513.1 ± 1.1
50.40.40.62418.2 ± 0.83864.32340.8 ± 2.112.3 ± 0.622.7 ± 1.9−20.6 ± 0.8
60.50.50.7822.7 ± 1.33794.24540.1 ± 2.311.5 ± 0.817.4 ± 1.7−39.1 ± 0.6
SCDO/DSS—volumetric ratio of SCDO to DSS; ρDSS—specific density of DSS; MDSS—mass of DSS; VDSS—volume of DSS; ρSCDO—density of SCDO; VSCDO—volume of SCDO; MSCDO—mass of SCDO; PSCDO—SCDO generator power; YSCDO—SCDO generator yield; Es—specific energy input; Ymethane—methane content; CVmethane—methane calorific value; Eout—energy output; Enout—net energy output; Enet—net energy gain.
Publisher’s Note: MDPI stays neutral with regard to jurisdictional claims in published maps and institutional affiliations.

