Article

Inter-Comparison of Particle and Gaseous Pollutant Emissions of a Euro 4 Motorcycle at Two Laboratories

1
BOSMAL Automotive R&D Institute Ltd., 43300 Bielsko-Biala, Poland
2
Joint Research Centre (JRC), European Commission, 21027 Ispra, Italy
*
Author to whom correspondence should be addressed.
Submission received: 10 August 2021 / Revised: 11 October 2021 / Accepted: 2 December 2021 / Published: 3 December 2021
(This article belongs to the Special Issue Development of Electric Vehicles and Engine Emissions)

Abstract

:
The Euro 4 regulation, applicable since 2016 for L-category vehicles (i.e., two and three-wheelers, and mini cars) reduced the emission limits, but also introduced a new cycle, the WMTC (World Harmonized Motorcycle Test Cycle). The emission studies of Euro 4 motorcycles are limited, and most importantly there are no published studies comparing the results of different laboratories applying the new cycle. In this study we compared the particle and gaseous pollutants of one Euro 4 motorcycle measured in two laboratories in 2017 and 2020. The gaseous pollutant results had a variance (one standard deviation of the means) of 0.5% for CO2, 4–19% for CO, NOx, HC (hydrocarbons) and SPN (Solid Particle Number). The particulate matter mass results had higher variance of 50–60%. Additional tests with open configuration to mimic dilution at the tailpipe gave equivalent results to the closed configuration for the gaseous pollutants and SPN. The total particles (including volatiles) had significant differences between the two configurations, with the closed configuration giving higher results. The main conclusion of this study is that the new procedures have very good reproducibility, even for the SPN that is not regulated for L-category vehicles. However, the measurement of total particles needs attention due to the high sensitivity of volatile particles to the sampling conditions.

1. Introduction

Exhaust emissions from two- and three-wheeled vehicles (referred to as L-category vehicles in European Union (EU) legislation) have been controlled since 1999 (Euro 1) by means of Directive 97/24/EC. Directive 2002/51/EC and Directive 2003/77/EC introduced the Euro 2 (2003) and Euro 3 (2006) standards for motorcycles. The required test for Euro 3 included start with cold engine. In 2014, this cold start requirement was extended to mopeds. Directive 2006/72/EC introduced the possibility to type-approve Euro 3 vehicles according to the new cycle WMTC (World Harmonized Test Cycle) and the relevant limits given in the UNECE (United Nations Economic Commission for Europe) Global Technical Regulation (GTR 2). Regulation (EU) No 168/2013 and supplemental technical Regulation (EU) 134/2014 repealed all previous L-category legislation by implementing the Euro 4 (2016–2017) and Euro 5 (2020–2021) packages. The new regulations expanded the number of L-subcategories, introduced a new emission test cycle (WMTC), tightened the gaseous compounds emission limits, and introduced a particulate matter (PM) mass limit. The Euro 4 PM mass limit for compression ignition (CI) and CI/hybrid vehicles was set to 80 mg/km. The Euro 5 limit was extended to gasoline engines with direct fuel injection and was reduced to 4.5 mg/km (i.e., the same limit as for passenger cars). Studies assessing the emissions of L-category vehicles with the new cycle are limited [1,2,3,4]. Most importantly, there are no published studies that have assessed the comparability and reproducibility between different laboratories applying the new procedures to the same emissions source (i.e., L-category vehicle).
Mopeds (of engine displacement <50 cm3) and motorcycles accounted for 35 million vehicles in the EU-28 in 2018 [5]. In Europe in 2015, the share of households with a moped or motorcycle ranged between 10% and 25% [6]; these figures are higher in Asian cities [7,8]. Registrations of new motorcycles in the EU have increased in recent years, while registrations of mopeds decreased. Interestingly, the registration of motorcycles during the COVID-19 period increased 31% compared to previous years [9]. Even though mopeds and motorcycles make up a small percentage of total vehicle kilometers traveled, they have a disproportionate impact on air pollutant levels in urban areas. A study showed that even though L-category vehicles’ emissions of CO and NOx have declined from Euro 2 to Euro 4, they remained on average 2.3–11.1 times and 1.2–6.1 times higher than the average emissions of petrol-fueled passenger cars for CO and NOx, respectively [10]. The aforementioned measurements were performed via remote sensing and the emissions were fuel-based, thus the differences would be smaller on a distance-specific (as opposed to fuel-specific) basis.
The aim of this paper is to compare the emissions from a Euro 4 motorcycle tested at two laboratories following the procedures of the recently introduced test procedure for L-category vehicles’ (mainly the test cycle). Special attention is paid to the particle number emissions—which are not included in the new regulation—and their reproducibility, in order to assess the feasibility of introducing them in the future regulations.

2. Materials and Methods

2.1. Overview

The tests were conducted at BOSMAL Automotive Research and Development Institute (Bielsko-Biala, Poland) [11] and the Vehicle Emissions Laboratory (VELA 1) of the European Commission—Joint Research Centre (JRC) (Ispra, Italy) [12]. Both laboratories (BOSMAL and JRC) tested the same motorcycle with the same fuel and driver two times (in 2017 and 2020) following the procedures described in Regulation (EU) 2014/134. The same chassis dynamometer rooms were used in both “measurement campaigns” (series of tests) of 2017 and 2020. Table 1 gives an overview of the tests conducted. Details will follow, but some important points are:
  • During each campaign (2017 or 2020) the same fuel was used (i.e., the second laboratory measured with the fuel in the tank of the motorcycle). However, between the two campaigns the fuel was different (fulfilled the same specifications EN 228, but not from the same batch) (noted as #1 and #2 in Table 1). Some of the most important specifications of the fuels can be found in Table 2. The differences between them were small and they were within the EN 228 requirements.
  • During each measurement campaign (2017 or 2020) the same driver drove the test cycles at both laboratories. The test cycle is described in the regulation (details later) and was the same for both campaigns. However, between the two campaigns the drivers were different (noted as A and B in Table 1). Both were experienced at dynamometer driving and followed the test cycle without speed trace violations (i.e., they followed precisely the cycle on the monitor in front of them, without errors).
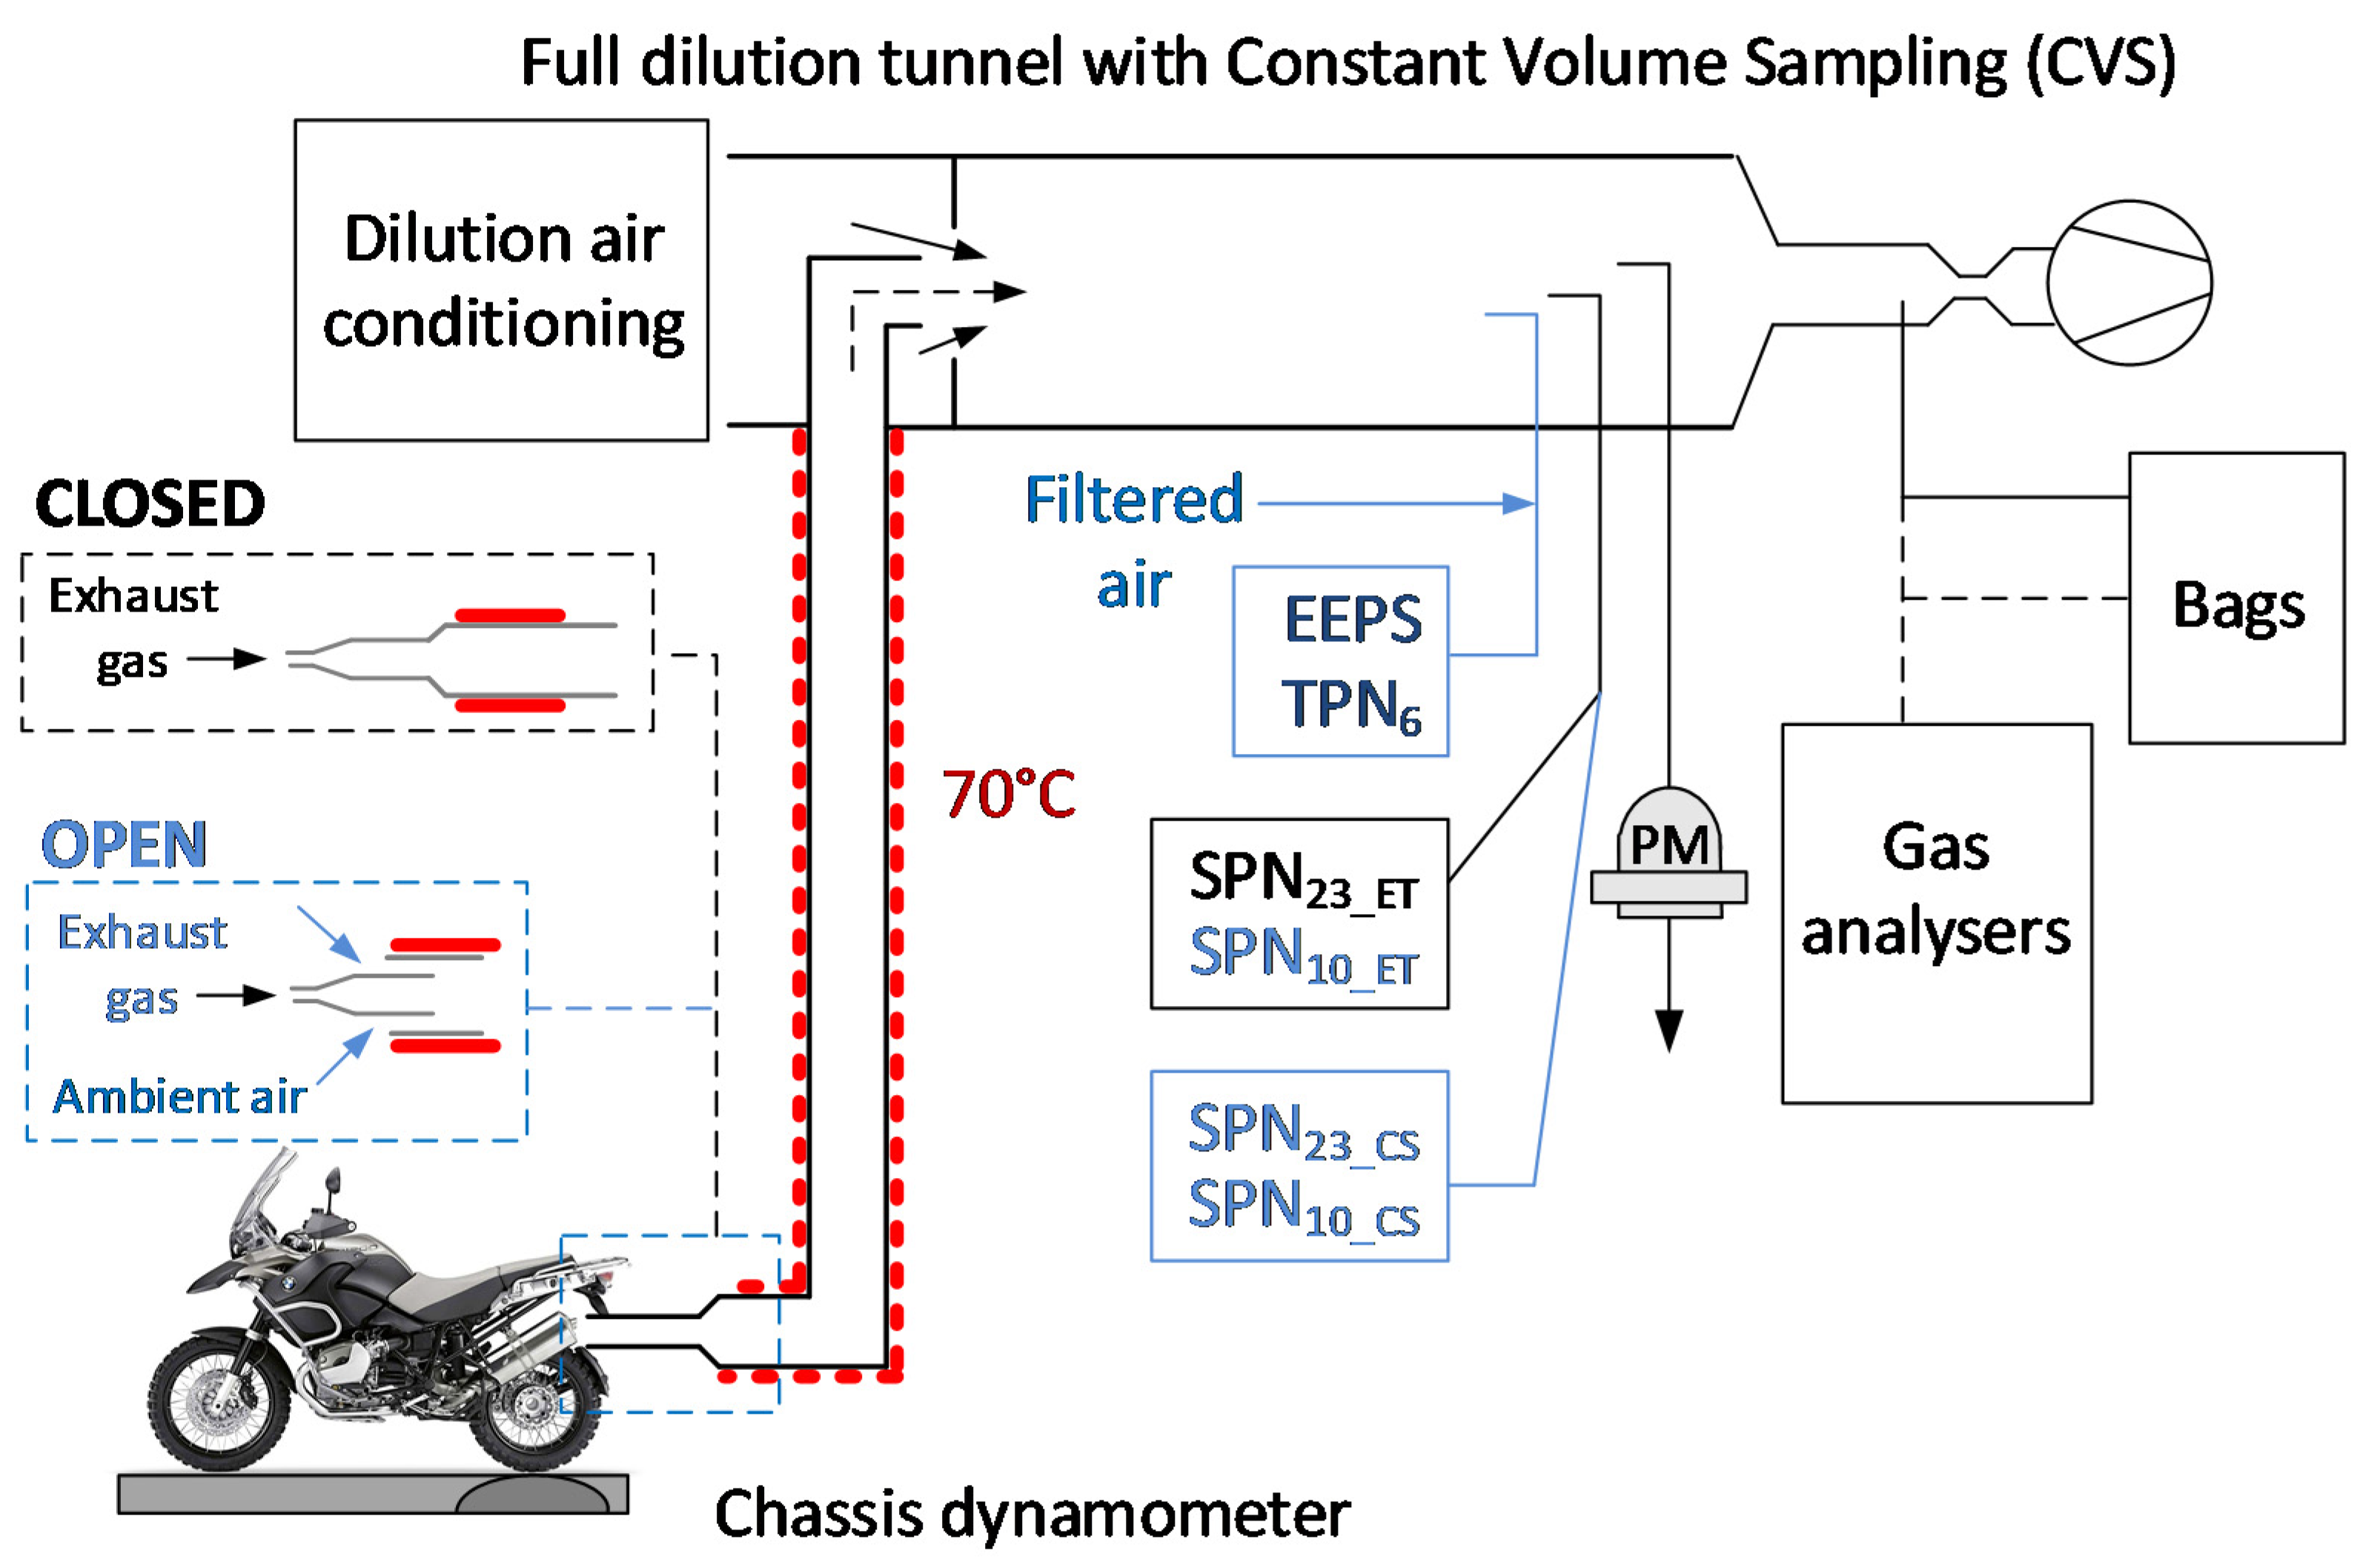
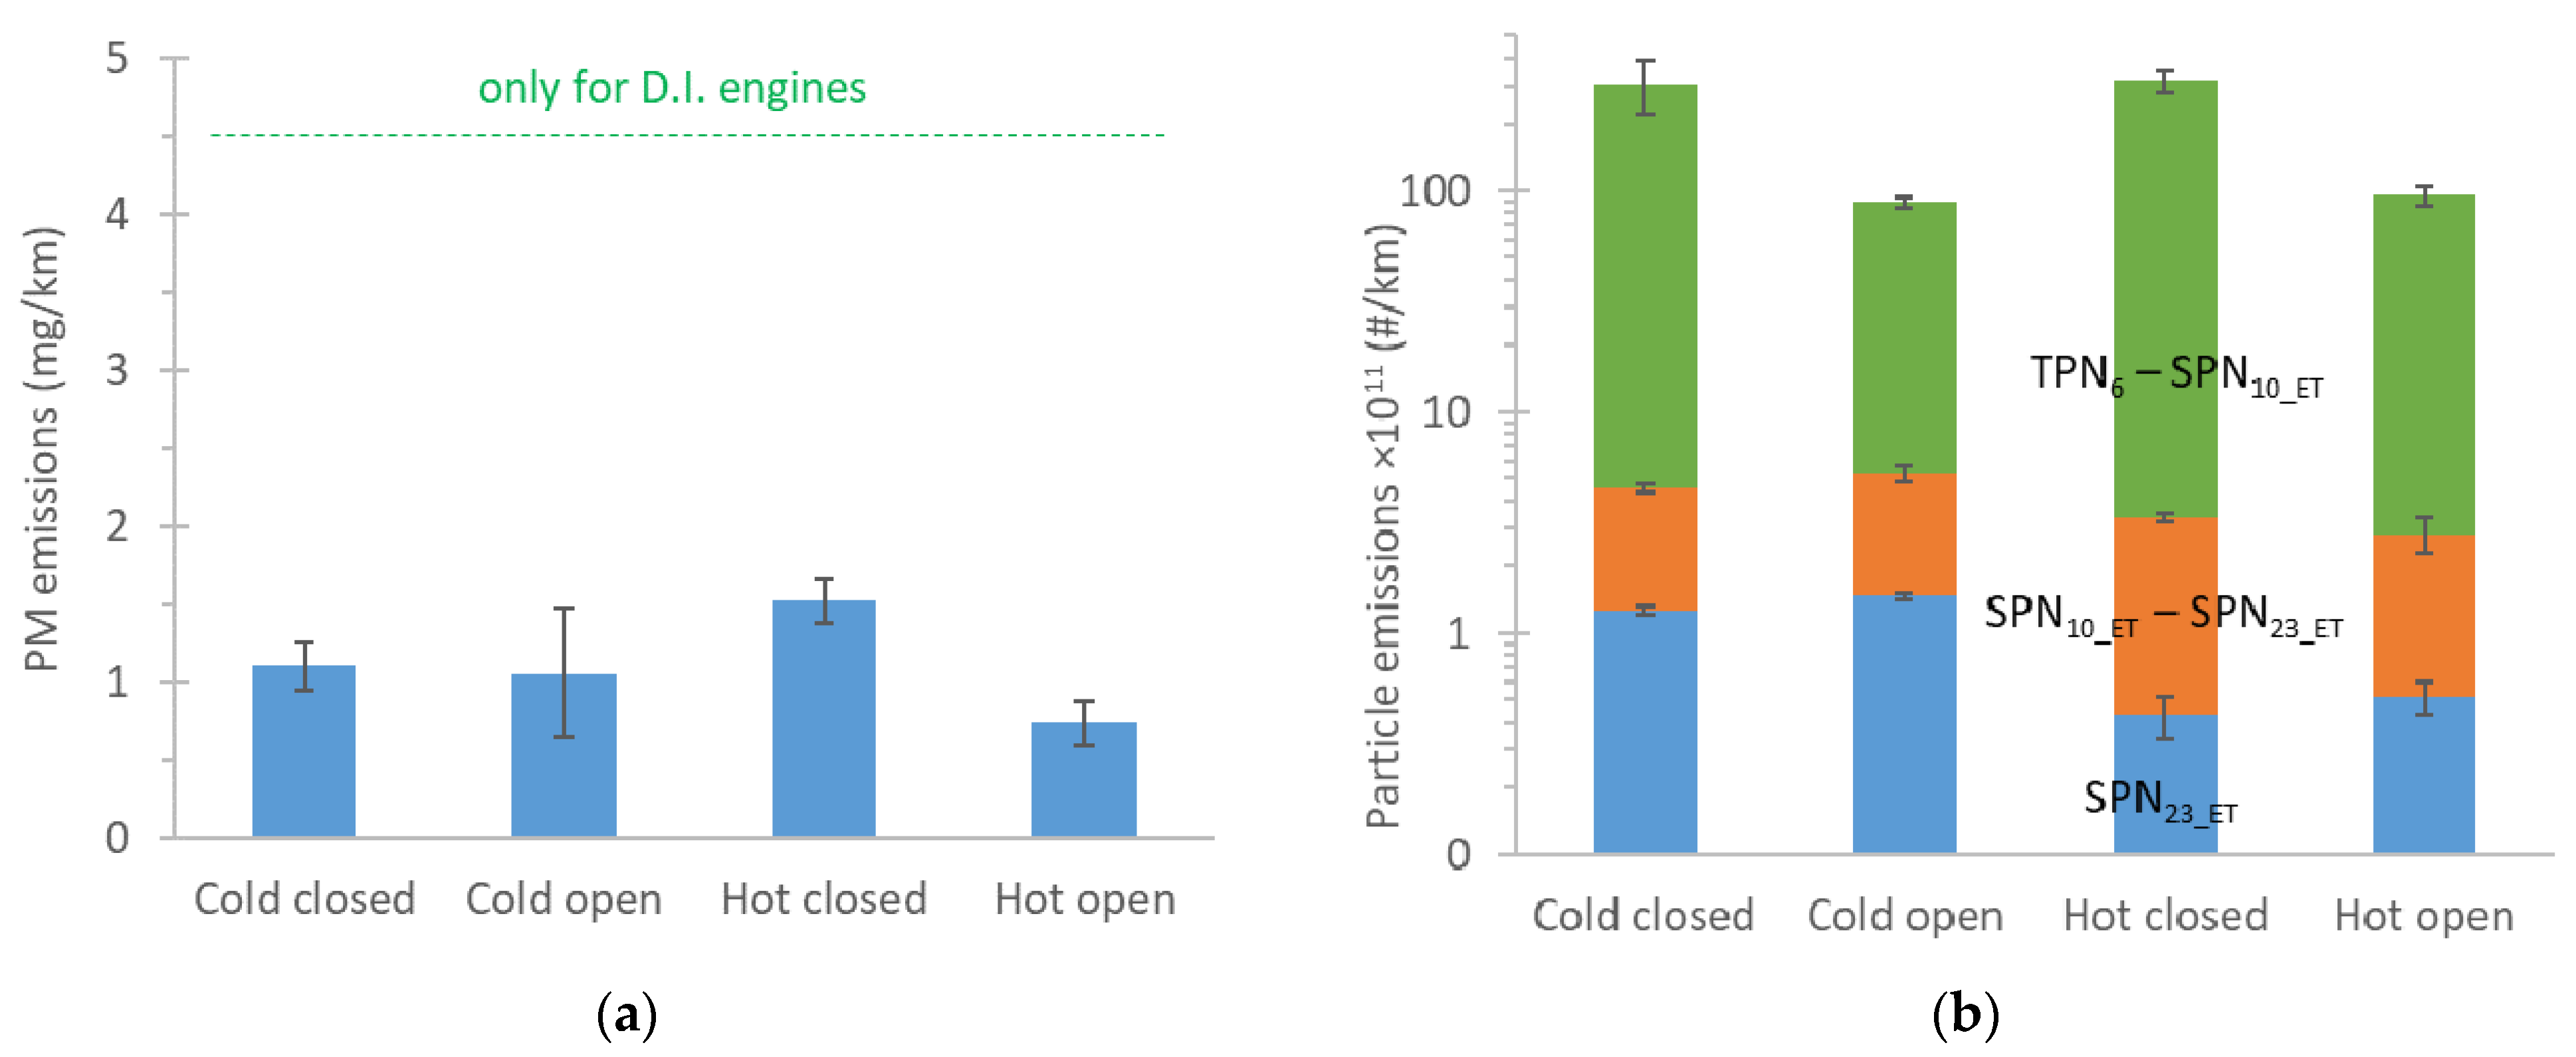
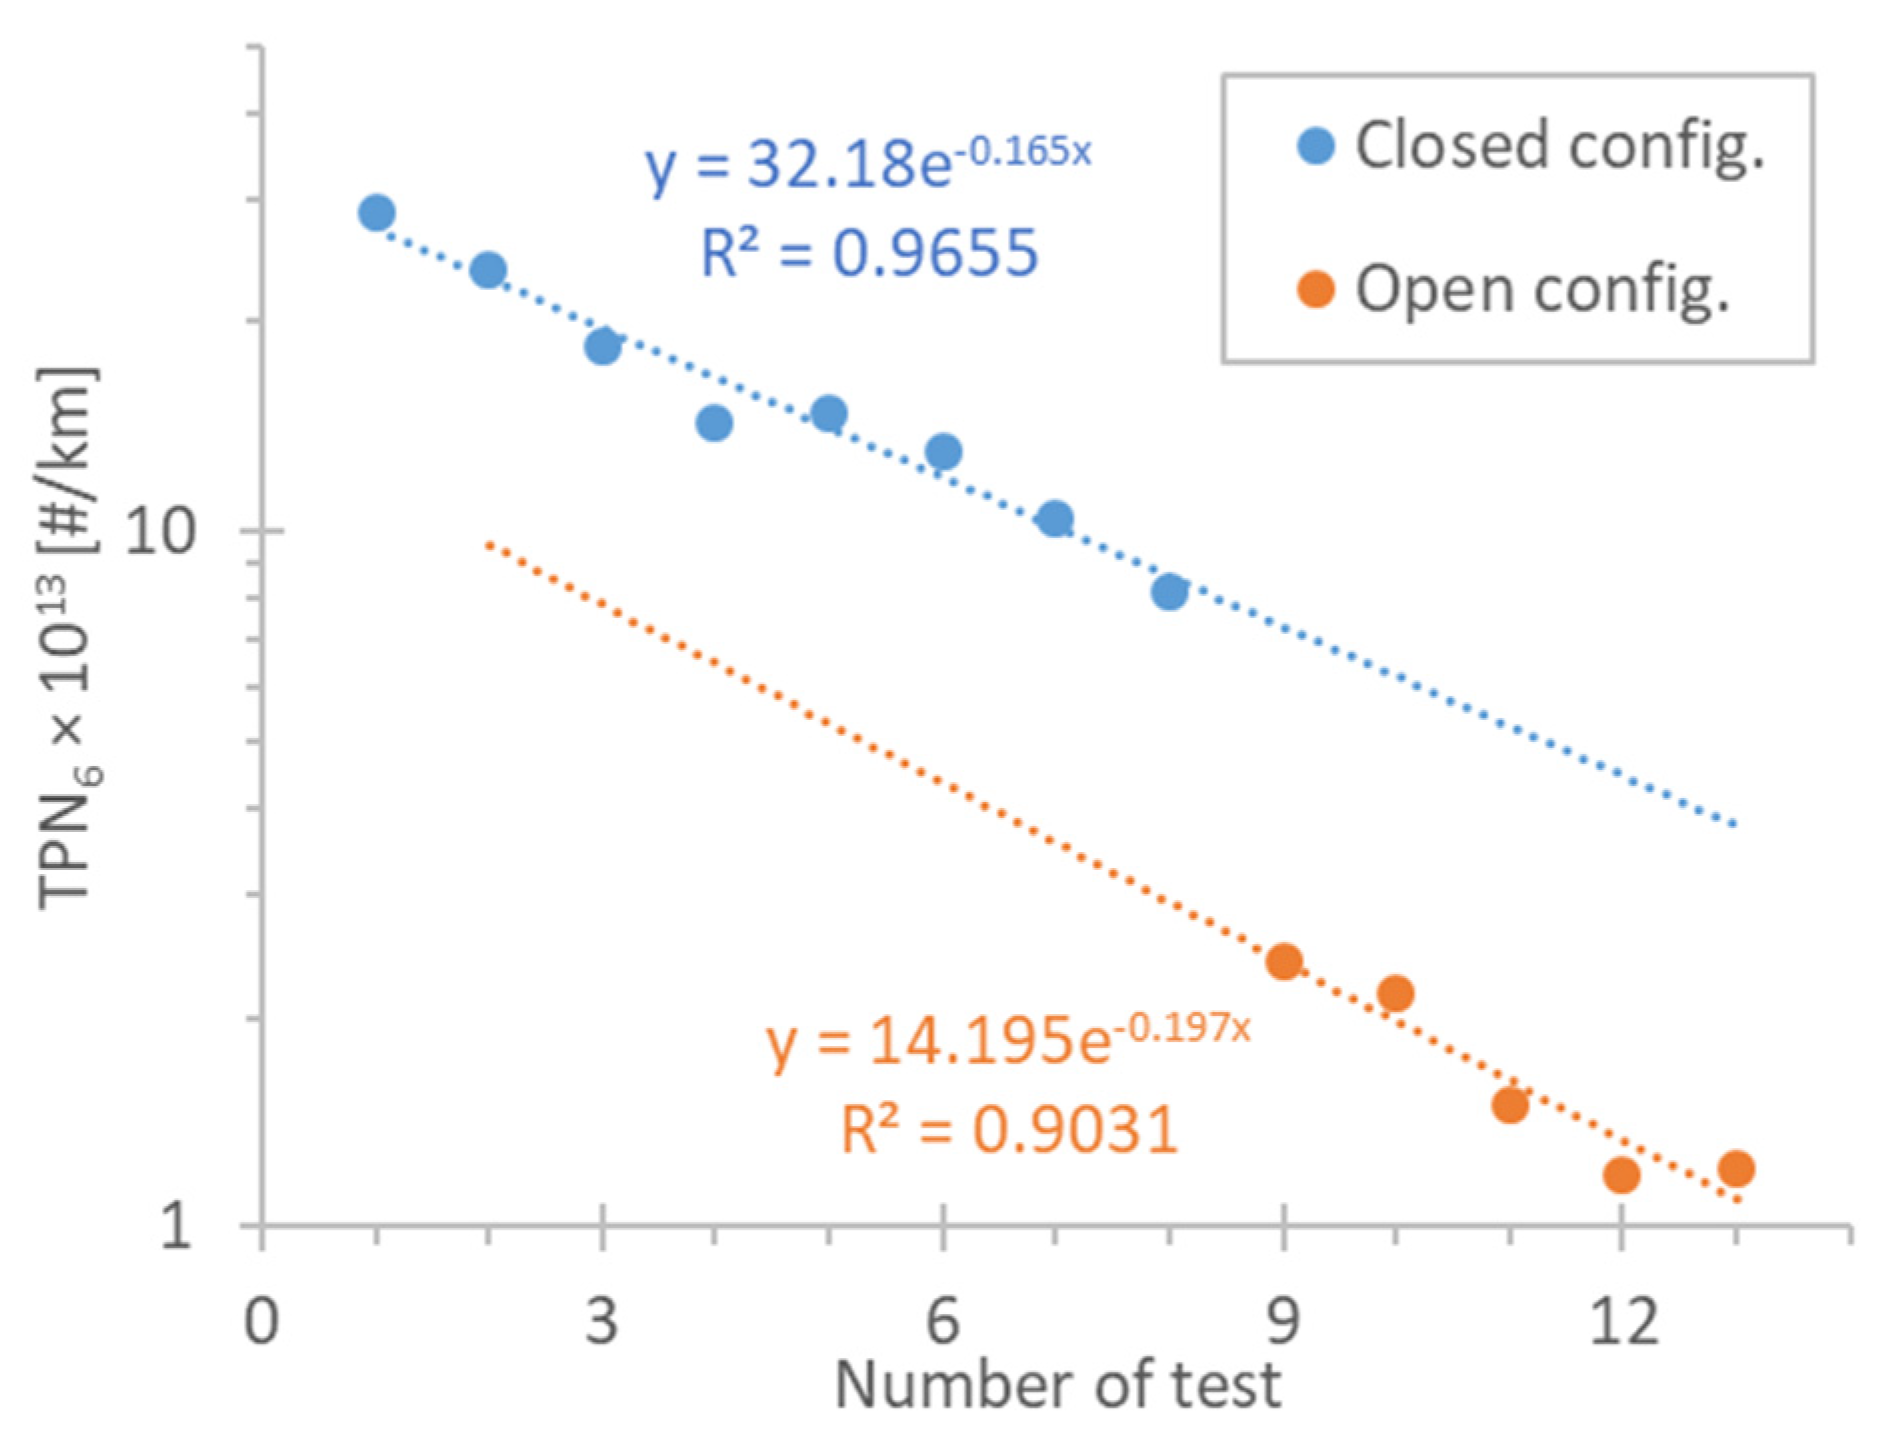
  • During the first campaign no particulate measurements were performed. Since particulates are sensitive to the emissions sampling/transfer setup, in the second campaign JRC assessed the impact of two configurations (open and closed sample transfer connections), which will be described in detail later.

2.2. Motorcycle

A 1.2 L Euro 4 motorcycle (Table 3) with 2645 km on the odometer at the first campaign in 2017 and 4520 km at the second campaign in 2020 was used. (Between the two campaigns, tests with different aftertreatment devices were conducted at BOSMAL; no long-term modifications were made to the motorcycle.) The motorcycle had a power/weight ratio >0.2 kW/kg and a maximum power >35 kW, so it was an L3e-A3 high performance motorcycle according to the designations in the legislation. It had a manual transmission, electronic fuel injection and a three-way catalyst. The unladen mass was 244 kg.

2.3. Experimental Setup

Figure 1 presents the setup at both of the laboratories, while Table 4 summarizes the instrumentation. Both laboratories had a Zoellner 48″ single roller chassis dynamometer (from AVL, Graz, Austria). Based on the motorcycle’s mass and the requirements of the legislation, an inertia setting of 330 kg was used for testing, with resistance to motion simulated using the default zero- and second-order curve values from the legislation (selected on the basis of mass in running order). The tests at BOSMAL were conducted at an ambient temperature range of 23–25 °C and relative humidity of 30–40%, while the JRC tests at a temperature range of 24–28 °C and relative humidity of 45–55%. Both laboratories were within the regulation specifications of 20–30 °C (there are no relative humidity requirements). The exhaust of the motorcycle was diluted in a full dilution tunnel with constant volume sampling (CVS). A CVS flow rate of 6 m3/min was used by JRC in 2017, 12 m3/min by BOSMAL in 2017, and 7.5 m3/min by both laboratories in 2020.
At JRC AMA i60 analyzers (from AVL, Graz, Austria) were used to measure gaseous pollutants from the dilution tunnel in real time, while at BOSMAL MEXA 7400 analyzers (from Horiba, Kyoto, Japan). According to the legislative procedure, a small and closely controlled portion of the diluted gas was collected in sample bags (one per phase). At the end of the cycle the same set of analyzers analyzed the bags for the gaseous pollutants (Figure 1). The principle of operation of the analyzers was: non-dispersive infrared detection for CO and CO2, chemiluminescence for NOx, and hot (191 °C) flame ionization detection for total hydrocarbons (THC) and methane (CH4). During the tests, depending on the concentration levels, the analyzers automatically were using the most appropriate calibration range. The uncertainty of the analyzers (2%) combined with the uncertainty of the dilution tunnel flow (around 2%) gives 3% for the gaseous pollutants. In practice, due to the contribution of other factors (e.g., linearity, calibration gas, background contribution) the total uncertainty is higher [13,14].
The PM mass was measured with 47 mm Teflon-coated glass-fiber Pallflex (Putnam, CT, USA) TX40H120-WW filters and a flow rate of 50 L/min (JRC) or 55 L/min (BOSMAL). The PM measurements were conducted only in the 2020 campaign and followed Regulation (EU) 2014/134.
An AVL particle counter (APC) 489 (AVL, Graz, Austria) [15] at JRC and a solid particle counting system (SPCS 2100) from Horiba [16] at BOSMAL, compliant with the light-duty vehicle regulations were connected to the dilution tunnel, but only for the 2020 campaign. The systems had a hot diluter at 150 °C, an evaporation tube at 350 °C, and a final secondary diluter using room-temperature filtered air. The applied particle number concentration reduction factor (PCRF) was 150 (15 × 10) at BOSMAL and 500 (50 × 10) at JRC. The PCRF was given in the calibration certificates of the instruments and combined the dilution and average particle losses at 30 nm, 50 nm and 100 nm, as required in the light-duty vehicles regulation. Downstream of the second dilution a TSI (Shoreview, MN, USA) model 3790 condensation particle counter (CPC) with 50% counting efficiency at 23 nm [17] was measuring the concentration of solid particles >23 (SPN23_ET). At JRC a 10 nm CPC 3771 (counting efficiency 65% at 10 nm) was connected in parallel to the 23 nm CPC in order to determine solid particles >10 nm (SPN10_ET) [18,19].
For sub-23 nm measurements, according to the latest Global Technical Regulation (GTR 15) for light-duty vehicles, a catalytic stripper is necessary for the removal of volatile particles [20,21]. Thus, a second APC from AVL with catalytic stripper [22] was connected to the JRC dilution tunnel having two AVL CPCs with 50% counting efficiency at 23 nm (SPN23_CS) and 65% efficiency at 10 nm, respectively (SPN10_CS). The specific counting efficiencies are defined in GTR 15 and were the same as the counters connected to the APC with evaporation tube. The objective was to compare the two APCs having an evaporation tube and a catalytic stripper, respectively.
For the measurement of total particles (i.e., solids and volatiles) (TPN6) an Engine Exhaust Particle Sizer (EEPS 3090) (model 3090 from TSI, Shoreview, MN, USA) [23] was connected to the JRC full dilution tunnel. A simple diluter (dilution ratios around 6:1) was connected upstream of the instrument to bring the concentrations to appropriate levels for the instrument. The EEPS measured particle size distributions from 5.6 to 560 nm. The principle was particles charging and then measurement of the particles’ current at the electrometers where the particles deposited. The fractal (soot) inversion algorithm was applied.
As particles are sensitive to the sampling and dilution conditions, at JRC, two sampling configurations were applied, both allowed in the L-category regulation: the closed and the open. In the closed configuration the whole exhaust gas arrives at the full dilution tunnel raw (undiluted). At the open configuration the transfer tube was left open around the motorcycle’s tailpipe, and a first dilution was taking place already there. The ambient air in the laboratory was filtered, in order to minimize the influence of contaminants on the results. The open configuration minimizes the effect of the CVS suction on the engine of mopeds or small motorcycles. Technical details on this approach and its advantages can be found elsewhere [24]. For the experiments performed in this study, the dilution was 3.9–4.5:1 for the urban phase, 3.1–3.3:1 for the rural phase and 2.0–2.2:1 for the motorway phase (see below).
The drivers followed the speed profile of the WMTC (World Harmonized Motorcycle Test Cycle) stage 2, class 3, sub-class 3-2. It consisted of three phases of 600 s each (total duration 1800 s) (see Figure A1a in the Appendix A): The urban phase commences with startup of the cold engine and has a mean driving speed of 24.3 km/h. The rural phase has mean speed of 54.5 km/h and the last motorway phase with mean speed of 94.2 km/h. The WMTC is based on actual driving patterns and is mandatory with Euro 4. It was however allowed (as an option for type approval in the range of exhaust emissions) for Euro 3 vehicles, since 2007. For the calculations of the cycle emissions, weighing factors apply for each phase: urban and motorway 25% each, rural 50%.
At each laboratory, after an initial pre-conditioning WMTC cycle, three repetitions of the cold start cycle and three repetitions of the hot start cycle were performed.

3. Results

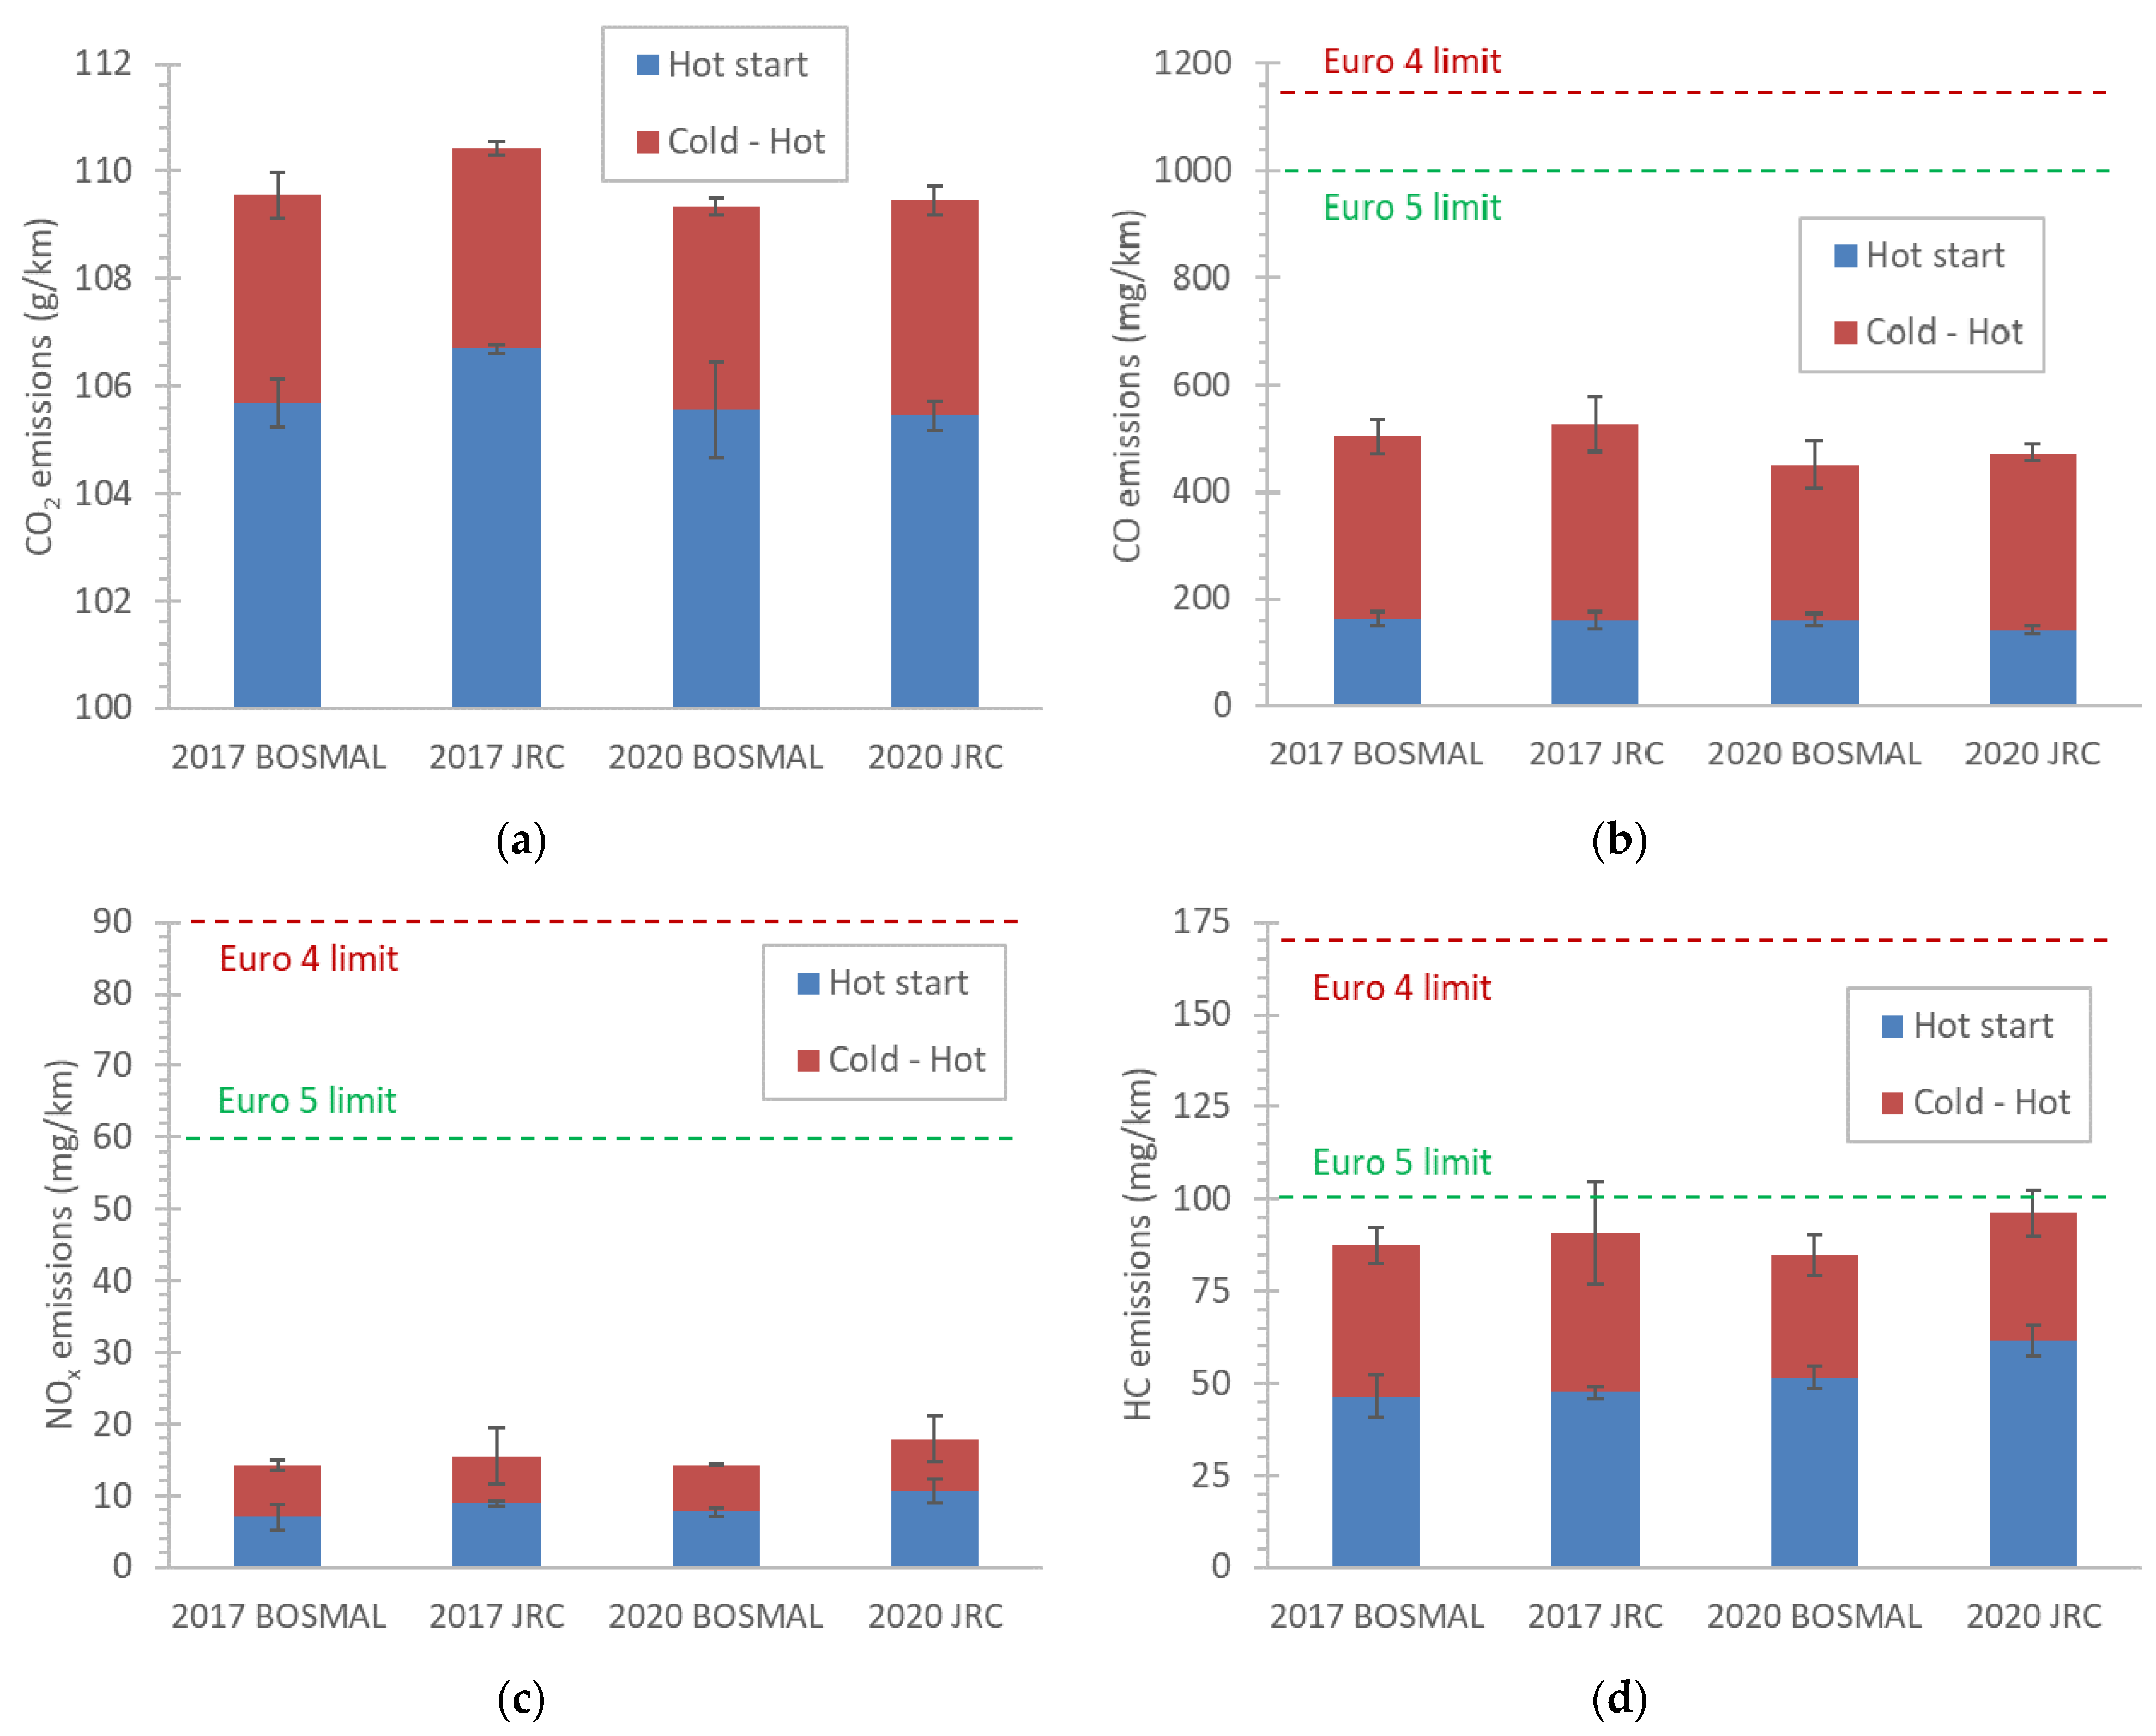
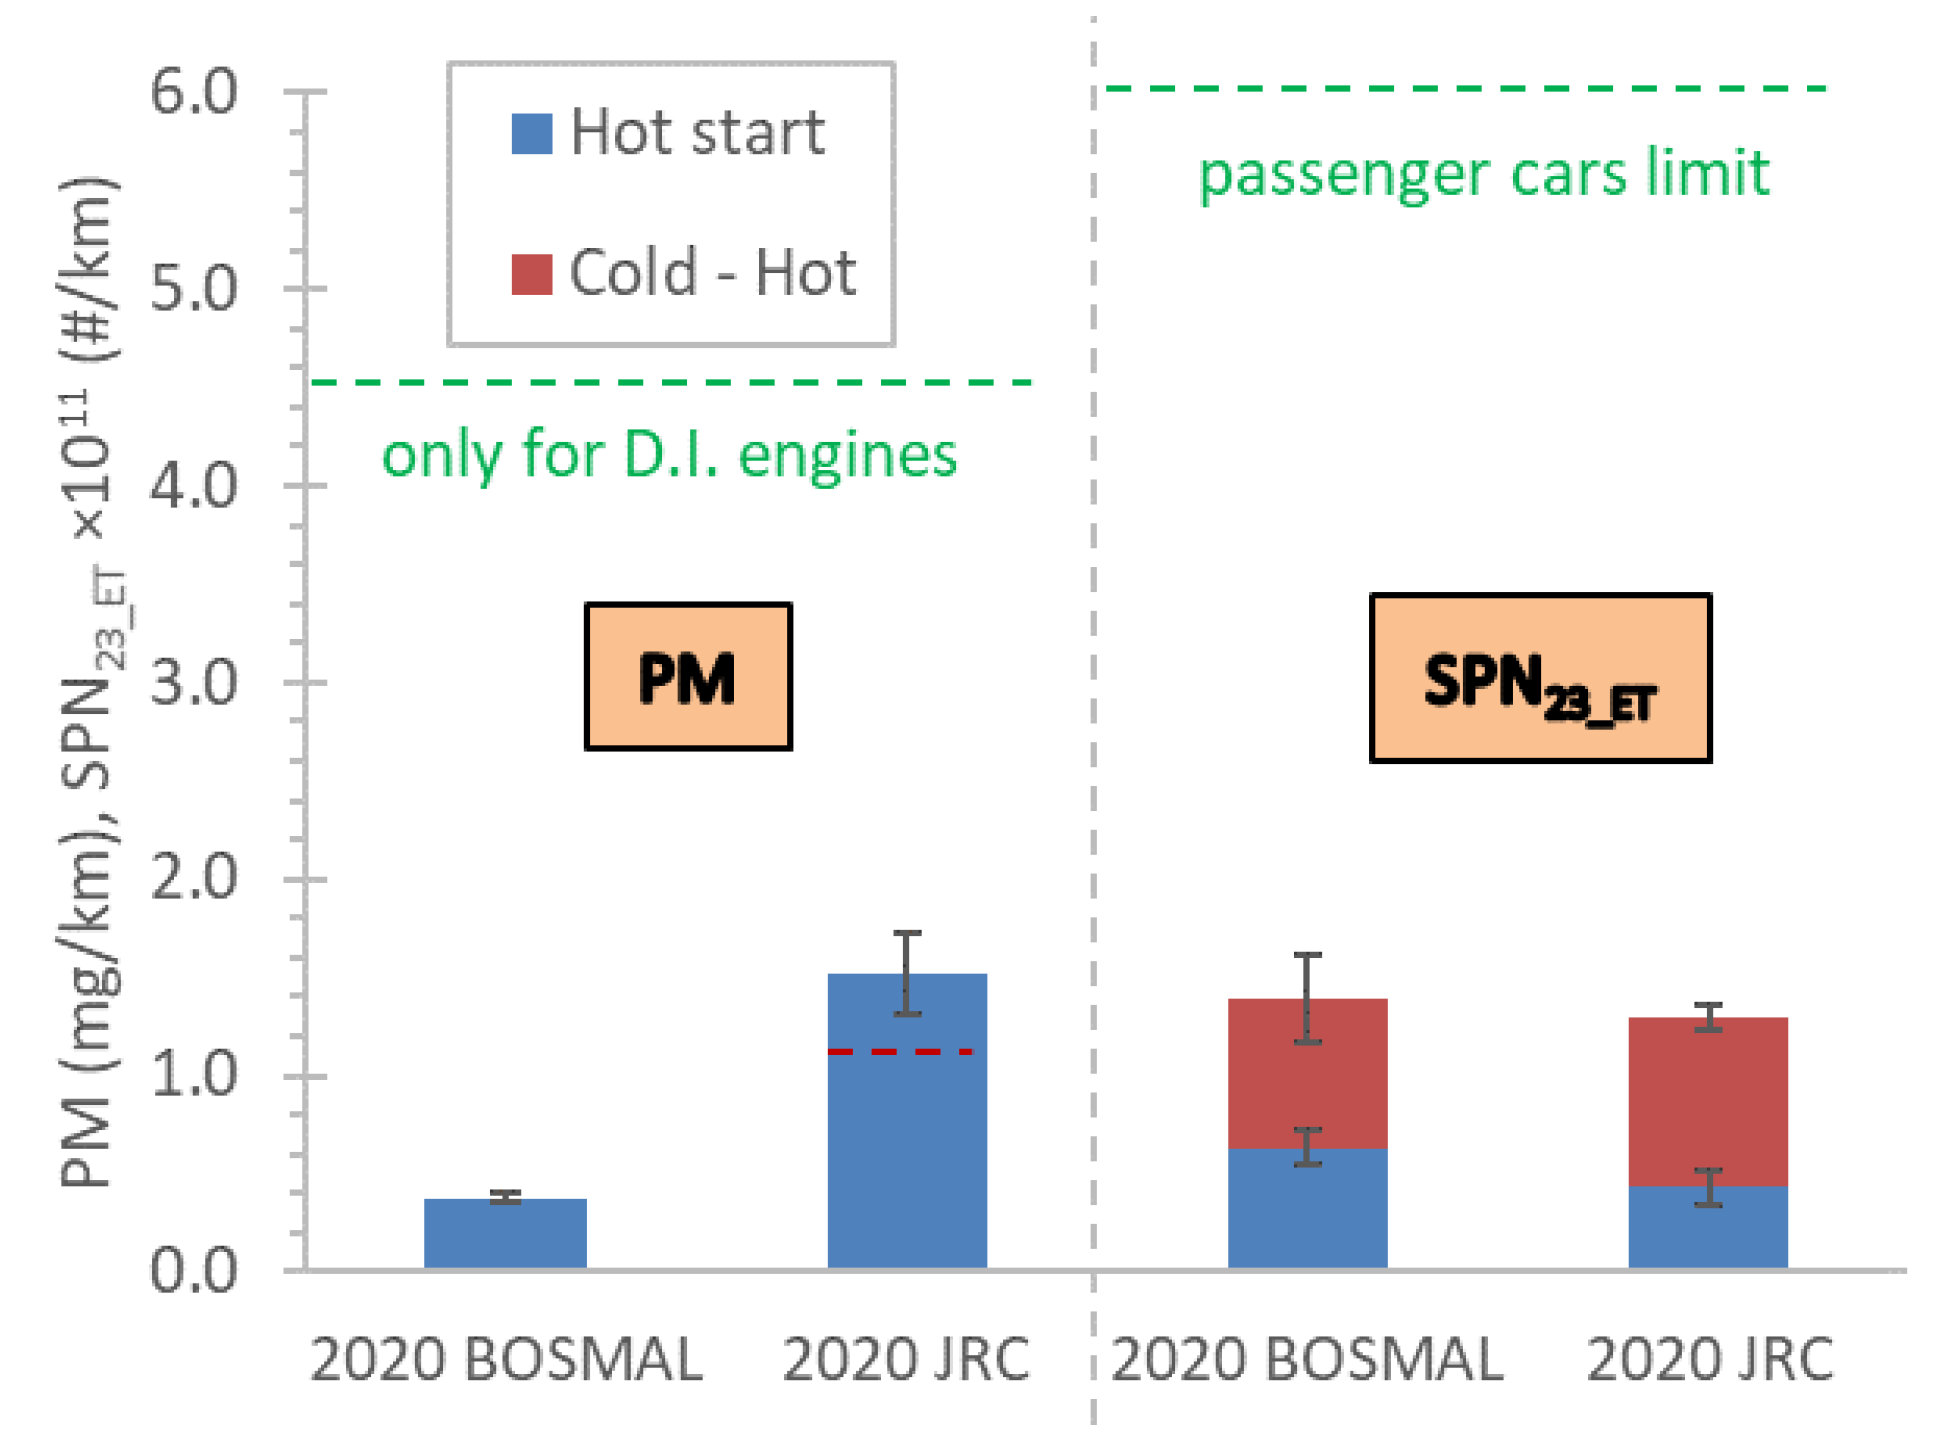
3.1. Laboratories’ Comparisons

Initially, the results of the laboratories will be compared. The integrated results will be presented in this section, while real time examples for gaseous pollutants are given in the Appendix. For particle number real time emissions will be discussed in the second part of this section, where particulate emissions will be presented in more details.
Figure 2 plots the results of the gaseous pollutants. Starting with CO2 (Figure 2a) the hot start WMTC emissions were around 106 g/km and the cold start WMTC around 110 g/km. The results of the two laboratories at the two years 2017 and 2020 were at the same levels with the exception of the hot start WMTC of JRC 2017 which was 1 g/km higher (<1% difference). This difference is still within the uncertainty of the measurements (3%, see Materials and Methods). The CO emissions were 160 mg/km (hot start) and 500 mg/km (cold start); more than half of the applicable Euro 4 emissions limit (Figure 2b), and all four results were close to each other. The NOx emissions were one sixth of the limit, with JRC having slightly higher values (15–20%), but with overlapping error bars (Figure 2c). The HC emissions were close to the Euro 5 limit (100 mg/km) but lower than the Euro 4 limit (Figure 2d). Results for all four cases were close to each other.
Figure 3 plots the PM mass and SPN23 emissions measured in 2020 at the two laboratories. The PM mass emissions measured at JRC (1.1 mg/km at cold start, 1.5 mg/km at hot start WMTC) were much higher than the emissions measured at BOSMAL (0.4 mg/km) (Figure 3). The emissions were much lower than the limit applicable to direct injection engines (4.5 mg/km only for Euro 5). The SPN23_ET emissions of both laboratories were at similar level (1.4 × 10¹¹ #/km), two to three times higher than the hot start emissions. The emissions were 4–5 times lower than the limit applicable to passenger cars (6 × 10¹¹ #/km). There is no SPN23 limit for motorcycles in the EU, nor in any other jurisdiction.
Table 5 summarizes the mean values of the four measurements in 2017 and 2020 (only two for PM and SPN23_ET both in 2020). The deviation is also given (expressed as one standard deviation of the mean, i.e., coefficient of variance). The cold start WMTC variability was small for CO2 (0.5%), 4–11% for CO, NOx, HC and SPN23_ET, but 50% for PM. For the hot start WMTC, the variability was higher for NOx (19%), HC (13.4%), and SPN23 (19%) because the emissions were lower. No difference was seen for CO2, CO and PM.

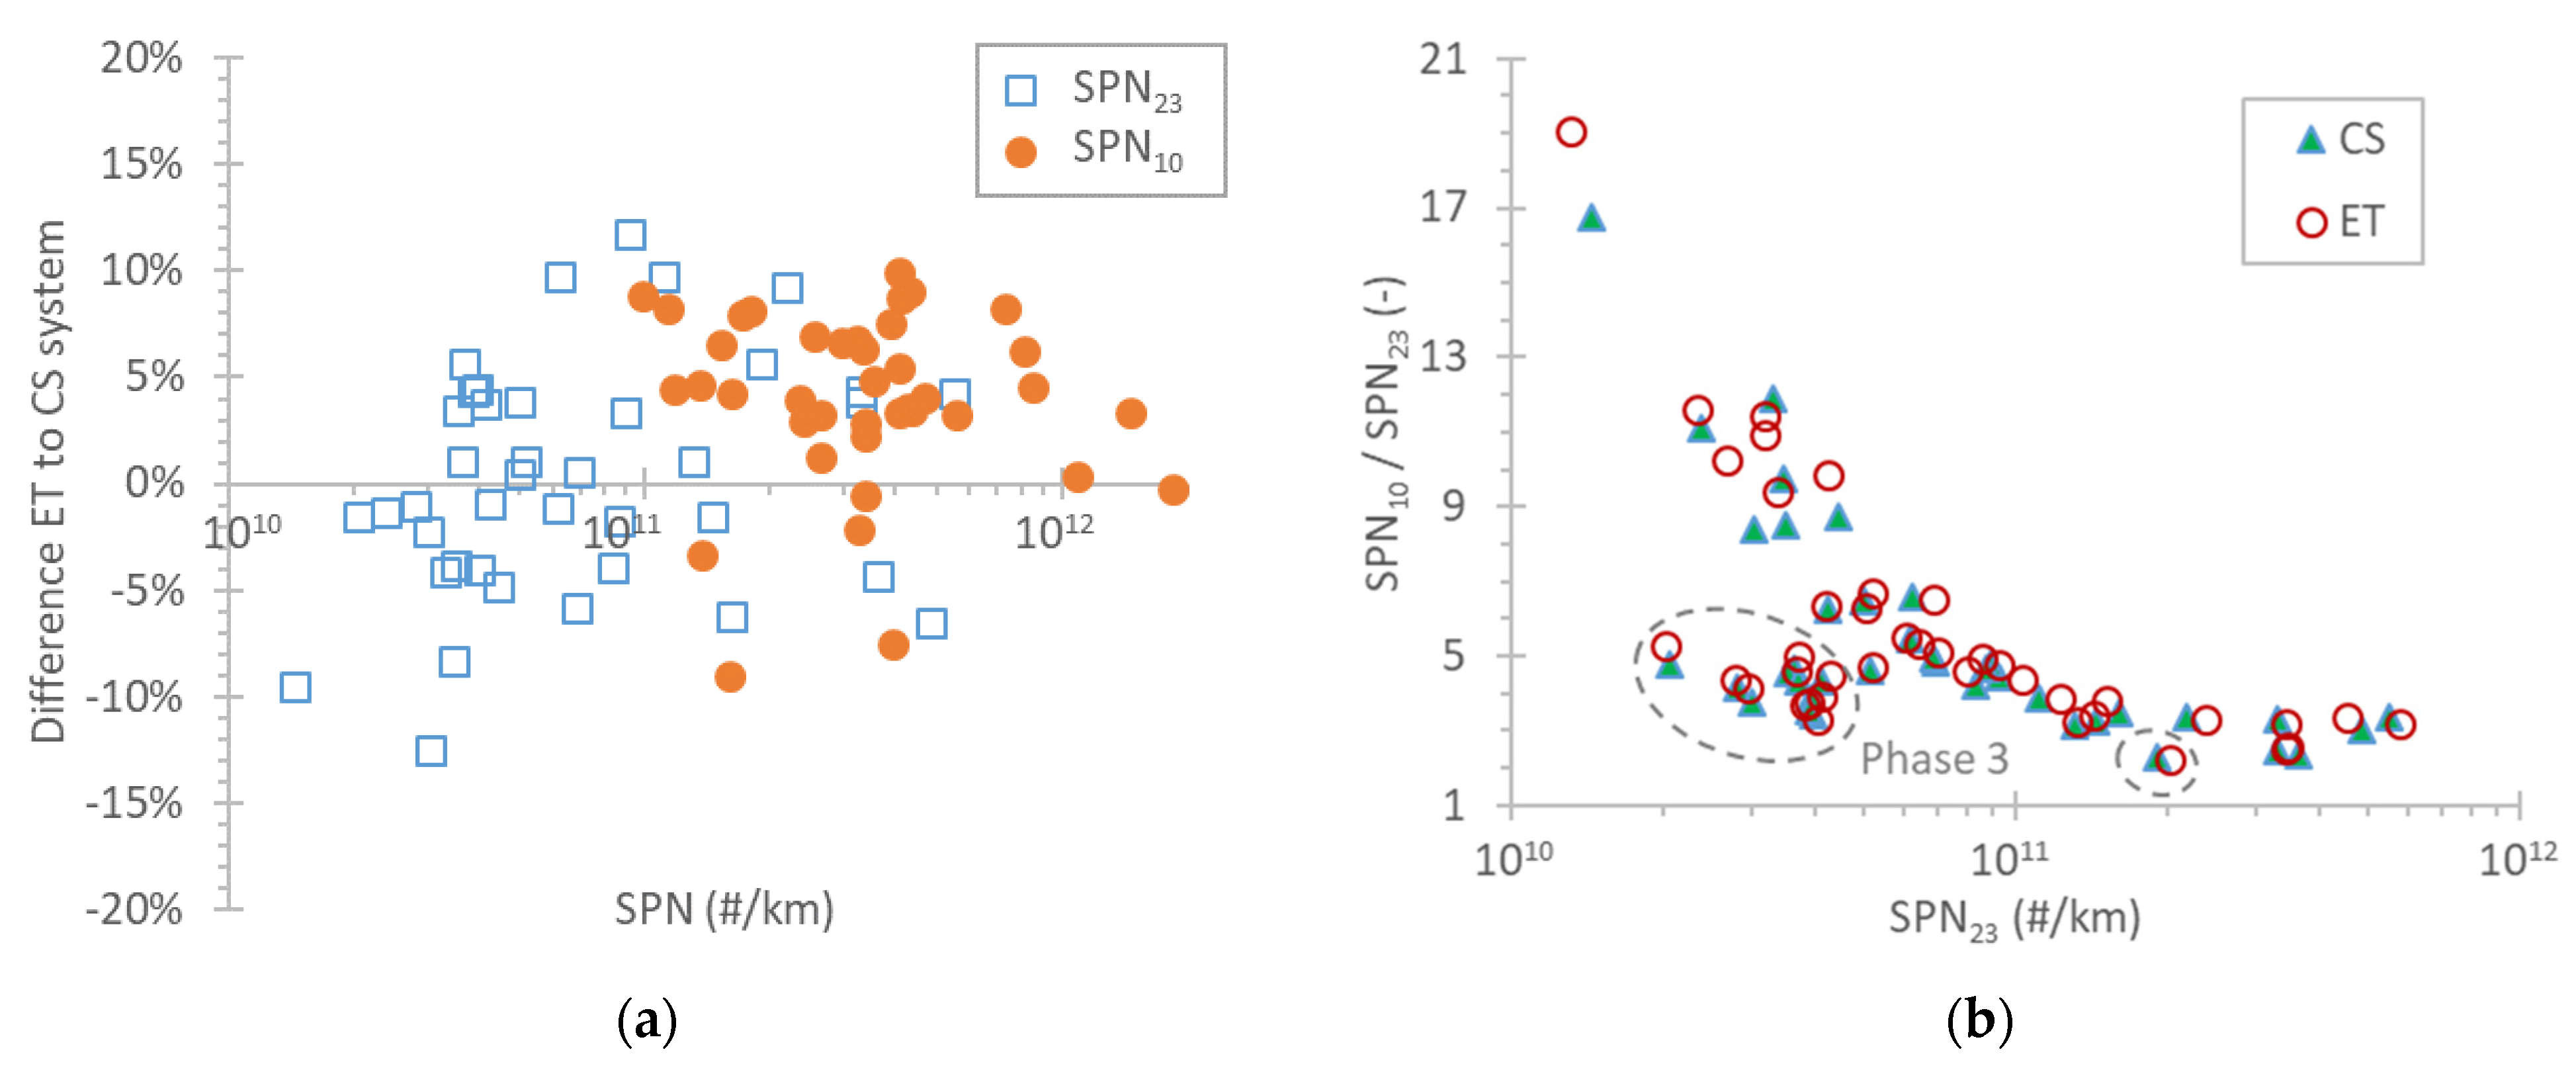
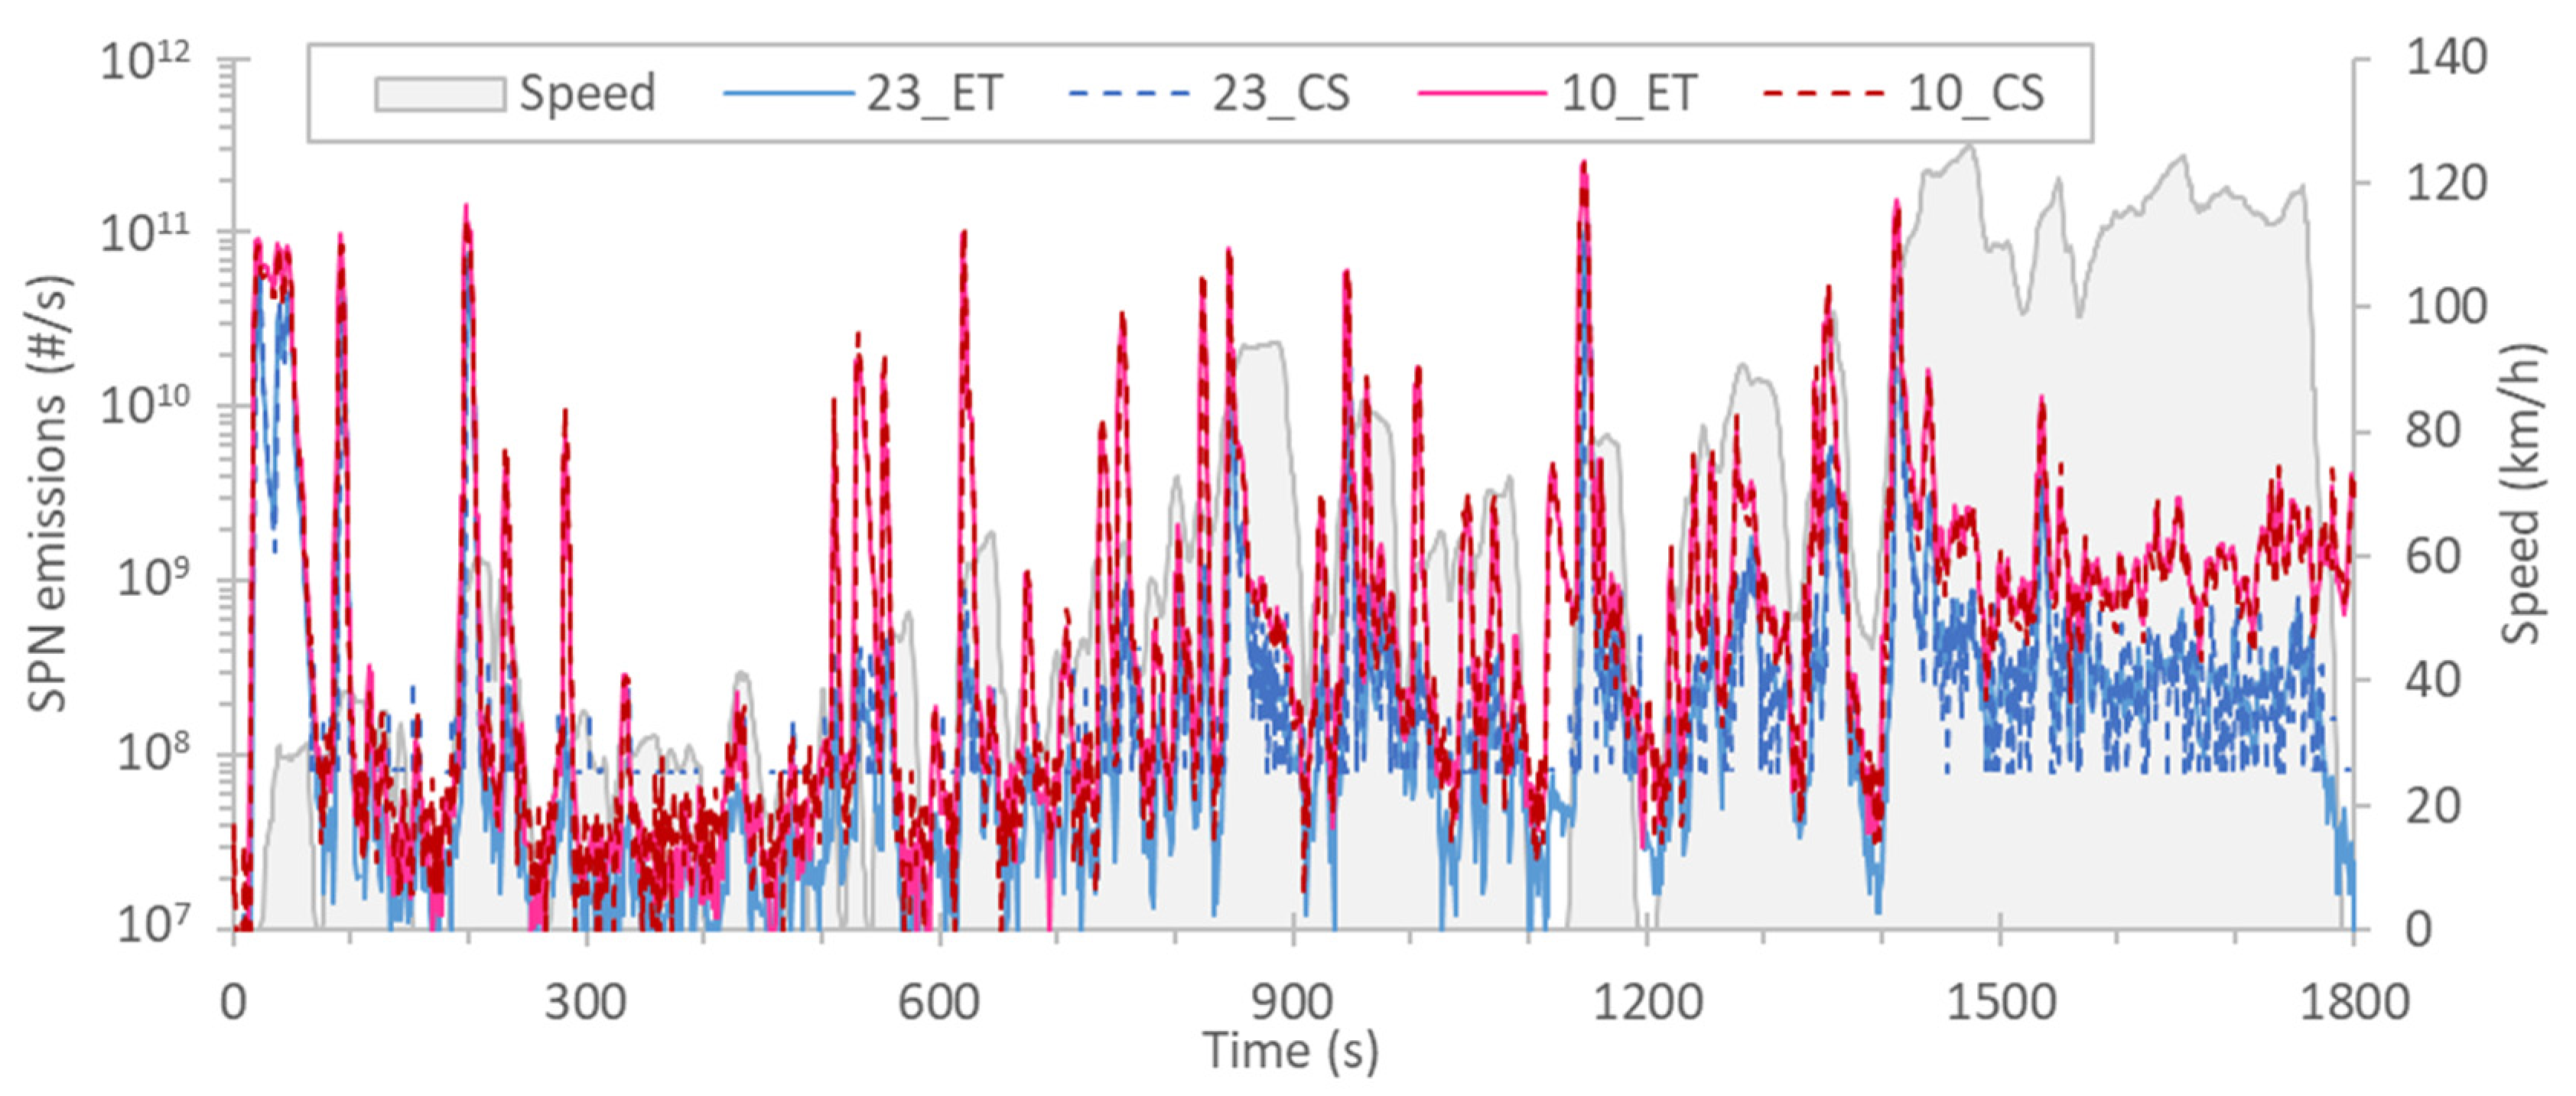
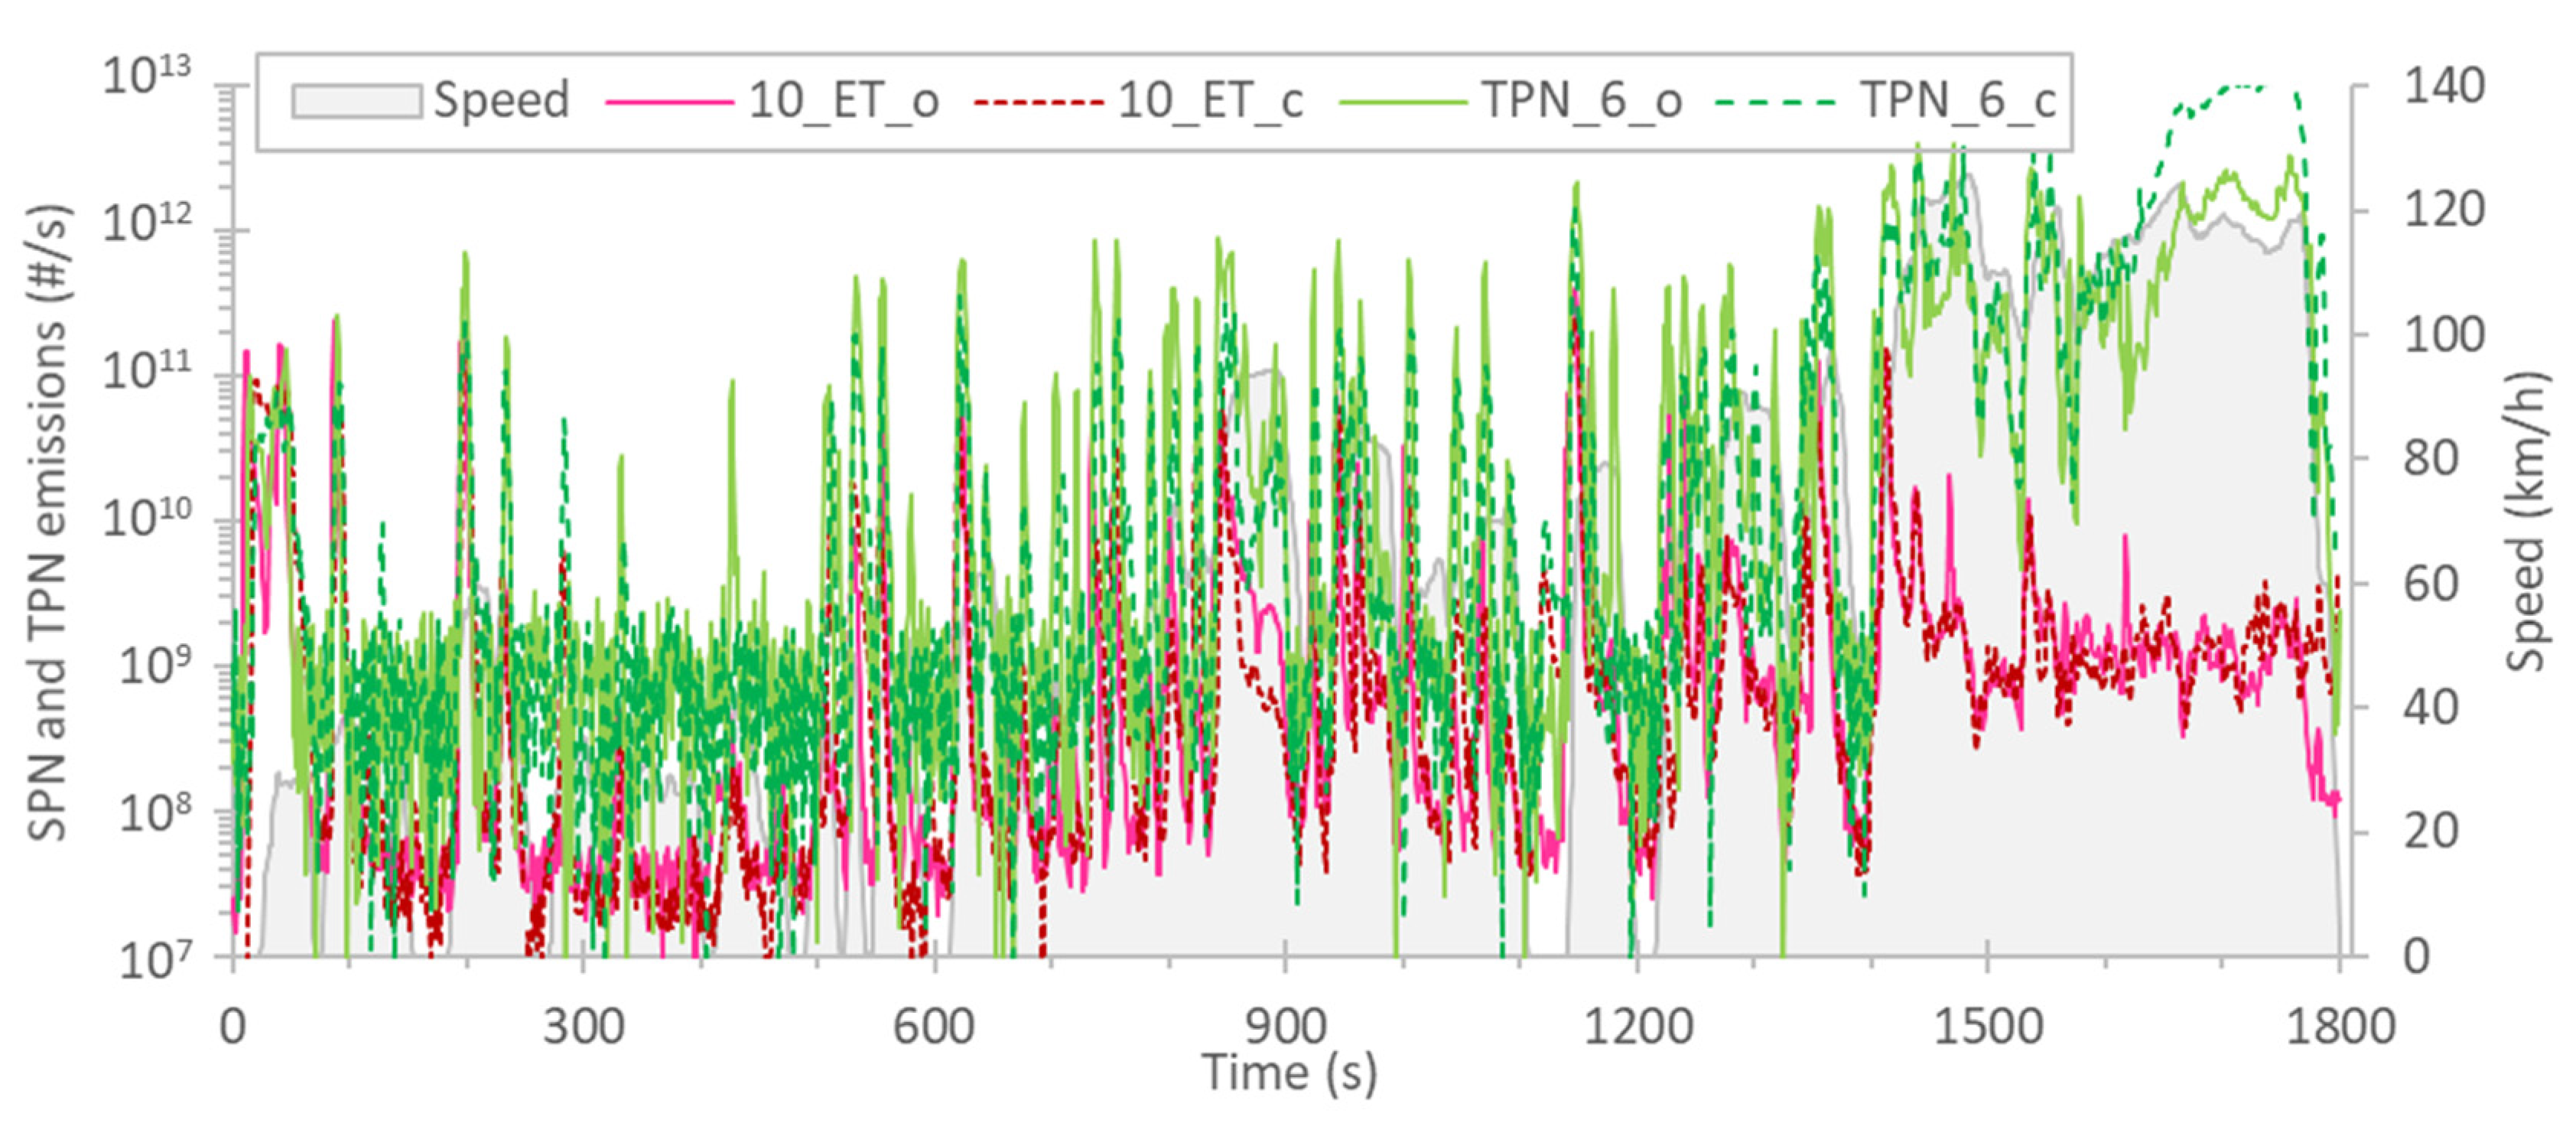
3.2. Particle Investigations

In this section the particulate emissions will be presented in more details. Initially the results with open and closed configurations will be presented. Then the systems with evaporation tube and catalytic stripper will compared.
Figure 4 compares the particulate emissions with open and closed configurations (see setup in Figure 1) for the cold start and hot start WMTC at JRC. The PM mass emissions (Figure 4a) were around 1 mg/km, with no difference for open and closed setups for the cold WMTC, but with higher emissions for the hot WMTC with closed configuration. Still, the levels were within the variability of the cold start tests.
Figure 4b compares SPN and TPN emissions with the two configurations. In general, the SPN23_ET and SPN10_ET emissions were at similar levels between open and closed configurations. The SPN23_ET cold start emissions were double the hot start emissions, but the cold and hot SPN10_ET emissions had a difference <20%, indicating that the solid particles were smaller at the hot cycle. The TPN6 emissions, which were similar for both cold and hot start cycles, were higher with the closed configurations (3.1 × 10¹³ #/km vs. 0.9 × 10¹³ #/km with the open configuration). The reason that TPN6 was the same for both cold and hot cycles for the same configuration is that these particles were appearing at high concentration at the third phase of the test cycle during high speed driving and exhaust gas temperatures. The particle concentrations at the first two phases of the cycle (including the cold start) were much lower and were not making any difference to the final emissions result.
Figure 5 compares the two systems with evaporation tube (ET) and catalytic stripper (CS) that were used at JRC in 2020. The results are plotted separately for 23 nm and 10 nm systems. The differences were within ±10% for the majority of the tests, without any particular trend in function of the concentration levels. This means that the two systems had similar results at both low and high concentrations, thereby confirming that they were linear and there were no particular cases where volatile artifacts would appear.
Figure 5b plots the ratio of SPN10/SPN23 separately for the systems with evaporation tube (ET) and catalytic stripper (CS). The ratio was around 2–3 for emission levels >1 × 10¹¹ #/km and exceeded 10 in many cases at low concentrations <4 × 10¹⁰ #/km. The ratio remained <5 even at low concentrations for the third phase (high speed) of WMTC. The ratios were similar for both ET and CS systems. Both Figure 5a,b confirm that the results of the two systems were equivalent.
Figure 6 plots real time SPN23 and SPN10 emissions with the two systems with evaporation tube (ET) and catalytic stripper (CS). Both signals followed the speed profile, i.e., spikes of emissions could be seen during accelerations. The difference between the CS and ET systems were negligible (e.g., compare blue lines 23_ET with 23_CS or red lines 10_ET with 10_CS). This means that ET and CS were equivalent in our results, as discussed previously. Differences between SPN10 and SPN23 (e.g., compare 23_ET with 10_ET) could be seen during cold start (e.g., around 50 s), during some of the accelerations (e.g., around 500–800 s), and during idle (e.g., around 1100 s), and at the last high speed phase of the cycle (1500–1800 s). The formation of sub-23 nm particles coincides with incomplete combustion. The presence of fuel-rich zones in the combustion chamber results in the formation of nascent soot cores or heavy molecular hydrocarbons in the sub-23 nm range. The level of 108 #/km corresponded to 1 #/cm3 at the CPC, which was approximately the background level of the dilution tunnel and the particle number system.
Figure 7 plots the SPN10 and TPN6 for the open and closed configurations. The SPN10 and TPN6 were close to each other until 1400 s, where the TPN6 increased orders of magnitude. This is the phase of the cycle with the high speed (and high exhaust gas temperature) (see Figure A1a in the Appendix A) which can result in volatile nucleation mode formation, as will be discussed in the Section 4. The TPN6 with open and closed configurations started to deviate at approximately 1600 s at the last phase of the cycle (see Discussion for explanations).
Even though the concentration of volatiles was very high, the ET with closed or open configuration did not deviate, confirming that there was no interference of the SPN measurement from volatiles for the ET case. If there would be interference of volatiles on SPN measurements, one would expect higher SPN measurements with the closed configuration (where the volatiles concentration was higher as the high TPN6 concentration revealed, and it would be more likely to break through the evaporation tube resulting in measurement artifact).
Figure 7 helps in better understanding of Figure 4b: the TPN6 concentration of the third phase of the cycle (after 1200 s) is much higher compared to the first two phases. It also shows where the difference between open and closed configurations comes from (last phase of the cycle with high speed and exhaust gas temperature).
Table 6 summarizes the JRC 2020 results with open and closed configurations, including gaseous pollutants. The agreement was good, in most cases within experimental uncertainty. The differences were around 0.5% for CO2, 5% for CO, 13–26% for NOx, 4–8% for HC, 20% for SPN. As mentioned before, the TPN6 emissions were much lower (70%) with open configuration.

4. Discussion

In this study the emissions of a Euro 4 motorcycle were measured in 2017 and 2020 by two laboratories. According to our knowledge, this is the first study to compare long term emissions of a motorcycle at two different test facilities. Even the comparability of laboratories for measurement of exhaust emissions from two-wheelers is not well studied: according to our knowledge, there is only one inter-laboratory study with two motorcycles that took place in Brazil [25]. Most importantly, there are no published studies comparing laboratories following the new procedure that was introduced in 2016 for L-category vehicles (i.e., two and three-wheelers, and mini cars) in the European Union (EU). This procedure is also described in the UNECE (United Nations Economic Commission for Europe) Global Technical Regulation (GTR 2) and thus may be introduced in the future in other regulations around the world. Although a full statistical analysis could not be performed on the basis of results obtained from only two laboratories, the variance (expressed as one standard deviation of the differences) of the cold start WMTC emissions was 0.5% for CO2, 7% for CO, 11% for NOx, and 6% for HC (as presented in Table 5). It was much higher for PM mass (50%), but low for SPN23_ET (4%). The hot start cycle, due to the lower emission levels, had higher variance for NOx (19%), HC (13%), and SPN23_ET (19%). The values were much lower than in the Brazilian inter-laboratory study, even though the emissions of this study were much lower. For example, for 30 mg/km NOx the reported variance was 43% in the Brazilian study vs. 11% at 15 mg/km and 19% at 8 mg/km in our study. The CO2 variance was 4.2% for 50–65 g/km, while in our study 0.5% for 105–110 g/km. It should be also recalled that the tests for the Brazilian inter-laboratory exercise were conducted with different drivers, which further increased the variance (see e.g., [3]). The emission levels of our study were similar with other Euro 4 or Euro 5 motorcycles reported in the literature, i.e., [3,24,26,27]. The significant contribution of cold start to the total emissions has also been reported by others [28,29]. Even though the WMTC is based on data from real driving pattern, more studies are necessary to confirm that there is no big gap between WMTC and on-road emissions [30]. For example, a study found that the WMTC gave similar results with a real world cycle, except for CO [31]. Another study also found high CO emissions on the road for a Euro 5 equivalent small motorcycle [32].
The emissions reported in this study were measured with approximately 5% ethanol content. In general, higher ethanol percentages or other alternative fuels result in lower emissions [33,34,35,36,37,38,39,40,41]. Even further reductions are expected with other combustion concepts [42] or hybridization [43]. Thus the emissions of future mopeds and motorcycles should be closely monitored.
One point that needs special attention is the measurement of particulate emissions. For L-category vehicles, only PM mass is regulated and only for direct injection engines (gasoline or diesel). Regarding particle number measurement, concerns have been raised many times about the feasibility of introducing particle limits in the L-category regulation [24,26,44]. One concern is that the lower size cut-off of 23 nm misses a significant portion of the emissions. In our study, the particles between 10 and 23 nm were 3–8 times higher than the particles >23 nm (summarized in Table 6: cold WMTC 4.5 vs. 1.3 × 10¹¹ #/km, hot WMTC 3.3 vs. 0.4 × 10¹¹ #/km). Similar values have also been reported in the literature [3,24,26,27]. Lowering the cut-off size to 10 nm would better cover the emitted particles’ size distribution, however there is a higher risk of artifacts. Such artifacts include the inefficient removal of the volatile particles in the SPN systems, or re-nucleation of the volatiles downstream of the thermal pre-treatment of the SPN system [45]. Here it was shown that a system with only an evaporation tube could remove the volatiles as efficiently as the system with a catalytic stripper, and both SPN23 and SPN10 measurements with evaporation tube or catalytic stripper were equivalent (see e.g., Figure 5 and Figure 6). The highest mass concentration estimated from the instrument connected at the dilution tunnel (EEPS), when the evaporation tube and catalytic stripper systems were measuring in parallel, was 0.8 mg/km (assumed density 0.8 g/cm3). This mass is lower, but close to the future requirement for particle number systems of volatile removal of 1 mg/m3. This mass could be efficiently removed by the SPN system with evaporation tube of our study (with PCRF dilution 500:1) since the evaporation tube and catalytic stripper results were equivalent. The ratio of the two systems remained the same for all tests, even though the mass estimated by EEPS was decreasing. Nevertheless, the catalytic stripper is obligatory in the proposed methodology of >10 nm particle measurements [20]. The mass calculated from the EEPS was around 0.4 mg/km; a value lower than the PM mass collected on the filter (up to 1.5 mg/km was measured in our tests).
The high PM mass measured at JRC compared to BOSMAL indicates that these volatiles partly originated from the tube between the motorcycle and the dilution tunnel. Indeed, there was a clear decreasing trend of the volatile concentration over time (Figure 8). The volatiles can be approximated by the number concentration that EEPS measured at the last phase of the cycle, where it deviated significantly from the rest of the instruments measuring solid particles. The volatile nucleation mode particles are typically formed when there is sulfuric acid or very high concentration of organics [46]. At high exhaust gas temperatures, the SO2 to SO3 conversion at the oxidation catalyst is favored [21]. Then, SO3 will form sulfuric acid as soon as the exhaust gas is cooled down in the dilution tunnel. Organics grow the sulfuric acid nuclei (which are of size ~1 nm) to a size which is within the measurement range of the instruments (>6 nm), or they can even nucleate if they are at very high concentrations [47]. Emissions from the third phase of the WMTC (last phase of the cycle) decreased from approximately (TPN6) 2.9 × 10¹⁴ #/km to 8.5 × 10¹³ #/km after seven cycles. Nevertheless, this decreasing trend cannot explain the differences between results obtained using the closed and open configurations: From 8.5 × 10¹³ #/km with closed configuration the emissions were 2.5 × 10¹³ #/km with open configuration and continued decreasing to 1.2 × 10¹³ #/km after four cycles (Figure 8). Even extrapolating the trends of closed and open configurations, a noteworthy difference between the two configurations still remained (Figure 8). The reason for the difference is that with the closed configuration during high speed driving the high exhaust gas temperature resulted in desorption of material from the tube connecting the motorcycle exhaust to the dilution tunnel. The desorbed material contributed to the growth (or formation) of the nucleation mode particles, as reflected in the results. In the open configuration, due to high dilution at that point, the exhaust gas temperature was lower and consequently less material was desorbed and consequently the final size of particles was smaller and/or fewer nucleation mode particles were formed. High concentration of nucleation mode particles due to desorption was reported in a dedicated study on the influence of the transfer line on particulate emissions [48]. Previous tests at JRC with another motorcycle found nucleation mode particles with the closed configuration, but not with the open configuration [3]. In that study, the nucleation mode with the closed configuration was on average around 6 × 10¹² #/km, i.e., at least 10 times lower than results presented in this paper. Thus, the measurement of total particles will not have good reproducibility as it depends on the dilution point (tailpipe or dilution tunnel) and contamination of the transfer tube from previous tests. As mentioned previously, these volatiles did not influence the measurement of the solid particles; even though the concentration of volatiles was high, the concentration of solids was comparable between open and closed configurations (Figure 4b), between evaporation tube and catalytic stripper (Figure 5), and between different laboratories (Figure 3). These results confirm that SPN23 or SPN10 methodologies are robust enough and could be introduced in the future motorcycle regulations. The necessity or not depends on the absolute emission levels of future motorcycles and their fleet share. To put the emission levels of the motorcycle of our study into perspective, the SPN23 emissions were 5 times lower than the current passenger cars emission limit of 6 × 10¹¹ #/km), but the SPN10 were 3 times higher than the proposed Euro 7 SPN10 limit for passenger cars of 1 × 10¹¹ #/km [49].

5. Conclusions

In this study the emissions of a Euro 4 motorcycle were measured at two laboratories in 2017 and 2020. The new procedure and test cycle WMTC (World Harmonized Motorcycle Test Cycle) were followed. The cold start emission levels (mean and variance of the four measurements at the two laboratories in 2017 and 2020) of the gaseous pollutants were 110 g/km (0.5%) for CO2, 490 mg/km (7%) for CO, 15.5 mg/km (11%) for NOx, and 90 mg/km (6%) for HC. The respective hot start emission values were 106 g/km (0.5%) for CO2, 160 mg/km (6%) for CO, 19 mg/km (19%) for NOx, and 52 mg/km (13%) for HC.
Additionally, the particulate matter (PM) mass and particle number emissions were measured, even though not applicable for this motorcycle. The PM mass emission levels were around 1 mg/km (50–60%) for both cold and hot start cycles. The solid particle number emissions >23 nm (SPN23) were 1.3 × 10¹¹ #/km (4%) at the cold start cycle and 2.5 times lower at the hot start but with 5 times higher variance. SPN10 were 3.5–8.0 times higher than SPN23, confirming that a large proportion of particles is not counted when applying the current methodology for passenger cars. Comparison of systems with evaporation tube or catalytic stripper gave similar results for both SPN23 and SPN10. Additional tests with open configuration to mimic dilution at the tailpipe gave equivalent results for the gaseous pollutants and the SPN, confirming that both configurations can be allowed in the regulation (as is currently the case). However, the total particles (i.e., including volatiles) had significant differences, with the closed configuration giving higher results confirming that the measurement of total particle number emissions is not suitable for introduction in the regulation.
The main conclusions of this study are: (i) the new legislative exhaust emissions test procedures had very good reproducibility for gaseous pollutants; (ii) the reproducibility of the filter PM method was not good due to the low levels measured and the influence of volatiles in one laboratory; (iii) the reproducibility of the SPN method, which is not currently regulated for L-category vehicles, was good, but not for the total particles (i.e., including volatiles); (iv) open and closed sampling configurations gave equivalent results for gaseous pollutants and SPN (observed differences were within experimental uncertainty); (v) the emissions of this motorcycle were half of the applicable limits (or lower).

Author Contributions

Conceptualization, P.B. and W.H.; methodology, W.H.; formal analysis, B.G. and W.H.; data curation, A.S., F.F. and D.L.; writing—original draft preparation, B.G.; writing—review and editing, W.H., P.B, and J.W. All authors have read and agreed to the published version of the manuscript.

Funding

This research received no external funding.

Institutional Review Board Statement

Not applicable.

Informed Consent Statement

Not applicable.

Data Availability Statement

Data available, upon request from the corresponding author.

Acknowledgments

The authors would like to acknowledge drivers M. Skowron (2017) and A. Dudek (2020).

Conflicts of Interest

The authors declare no conflict of interest. The opinions expressed in this manuscript are those of the authors and should in no way be considered to represent an official opinion of the European Commission. Mention of trade names or commercial products does not constitute endorsement or recommendation by the European Commission or the authors.

Appendix A

Figure A1 gives examples of real time emissions at the 2017 and 2020 campaigns at the two laboratories. The cycle profile (with the three phases) and the exhaust gas temperature is given in Figure A1a. There is a good agreement particularly for CO2 (Figure A1b), while for NOx (Figure A1c) different levels of spikes can be seen. The NOx emissions were slightly higher at JRC (Figure 2a of the main text).
Figure A1. Examples of real time emissions at the four measurement campaigns: (a) Exhaust gas temperature; (b) CO2; (c) NOx.
Energies 14 08101 g0a1

References

  1. Favre, C.; Bosteels, D.; May, J.; De Souza, I.; Beale, L.; Andersson, J. An Emissions Performance Evaluation of State-of-the-Art Motorcycles over Euro 3 and WMTC Drive Cycles; SAE International: Warrendale, PA, USA, 2009; no 2009-01–1841. [Google Scholar] [CrossRef]
  2. Fu, J.; Deng, B.; Liu, X.; Shu, J.; Xu, Y.; Liu, J. The experimental study on transient emissions and engine behaviors of a sporting motorcycle under world motorcycle test cycle. Energy 2020, 211, 118670. [Google Scholar] [CrossRef]
  3. Giechaskiel, B. Gaseous and particulate emissions of a Euro 4 motorcycle and effect of driving style and open or closed sampling configuration. Sustainability 2020, 12, 9122. [Google Scholar] [CrossRef]
  4. Hou, K.; Deng, B.; Chen, Y.; Ran, J.; Fu, J. For cleaner exhaust of a high performance motorcycle: A macroscopic comparative study of catalytic converters under world-wide motorcycle test cycle. J. Clean. Prod. 2021, 284, 124730. [Google Scholar] [CrossRef]
  5. ACEM Association Des Constructeurs Européens de Motocycles. Market Data. 2021. Available online: https://www.acem.eu/Market-Data (accessed on 2 December 2021).
  6. Dorocki, S. Changes in the market of two and three-wheeled motor vehicles in Europe at the beginning of the 21st Century. Entrep. Bus. Econ. Rev. 2018, 6, 175–193. [Google Scholar] [CrossRef]
  7. Tan, X.; Zeng, Y.; Gu, B.; Wang, Y.; Xu, B. Scenario analysis of urban road transportation energy demand and GHG emissions in China—A case study for Chongqing. Sustainability 2018, 10, 2033. [Google Scholar] [CrossRef] [Green Version]
  8. Iqbal, A.; Afroze, S.; Rahman, M. Vehicular PM emissions and urban public health sustainability: A probabilistic analysis for Dhaka City. Sustainability 2020, 12, 6284. [Google Scholar] [CrossRef]
  9. Surico, J. The pandemic kick-started an urban motorcycle boom. Are cities ready? Bloomberg. 27 October 2020. Available online: https://www.bloomberg.com/news/articles/2020-10-22/the-pandemic-has-kick-started-a-motorcycle-boom (accessed on 2 December 2021).
  10. TRUE: The real urban emissions initiative. Pollutant Emissions from Mopeds, Motorcycles, and Other L-Category Vehicles in Paris. Fact Sheet. September 2019. Available online: https://theicct.org/sites/default/files/TRUE%202.%20Paris%20L-cat%20Fact%20Sheet%20WEB%209.9.19.pdf (accessed on 2 December 2021).
  11. Bielaczyc, P.; Klimkiewicz, D.; Woodburn, J.; Szczotka, A. Exhaust emission testing methods—Bosmal’s legislative and development emission testing laboratories. Combust. Engines 2019, 58, 88–98. [Google Scholar] [CrossRef]
  12. Giechaskiel, B. Effect of sampling conditions on the Sub-23 Nm nonvolatile particle emissions measurements of a moped. Appl. Sci. 2019, 9, 3112. [Google Scholar] [CrossRef] [Green Version]
  13. Giechaskiel, B.; Clairotte, M.; Valverde-Morales, V.; Bonnel, P.; Kregar, Z.; Franco, V.; Dilara, P. Framework for the assessment of PEMS (Portable Emissions Measurement Systems) uncertainty. Environ. Res. 2018, 166, 251–260. [Google Scholar] [CrossRef]
  14. Bielaczyc, P.; Szczotka, A. Analysis of Uncertainty of the Emission Measurement of Gaseous Pollutants on Chassis Dynamometer; SAE International: Warrendale, PA, USA, 2007; no 2007-01–1324. [Google Scholar] [CrossRef]
  15. Giechaskiel, B.; Cresnoverh, M.; Jörgl, H.; Bergmann, A. Calibration and accuracy of a particle number measurement system. Meas. Sci. Technol. 2010, 21, 45102. [Google Scholar] [CrossRef]
  16. Wei, Q.; Akard, M.; Asano, I.; Rahman, M. Penetration calibration and verification for the solid particle counting system with polydisperse and monodisperse particles. SAE Int. J. Fuels Lubr. 2008, 1, 593–602. [Google Scholar] [CrossRef]
  17. Giechaskiel, B.; Wang, X.; Horn, H.-G.; Spielvogel, J.; Gerhart, C.; Southgate, J.; Jing, L.; Kasper, M.; Drossinos, Y.; Krasenbrink, A. Calibration of condensation particle counters for legislated vehicle number emission measurements. Aerosol Sci. Technol. 2009, 43, 1164–1173. [Google Scholar] [CrossRef]
  18. Wang, X.; Caldow, R.; Sem, G.J.; Hama, N.; Sakurai, H. Evaluation of a condensation particle counter for vehicle emission measurement: Experimental procedure and effects of calibration aerosol material. J. Aerosol Sci. 2010, 41, 306–318. [Google Scholar] [CrossRef]
  19. Takegawa, N.; Sakurai, H. Laboratory evaluation of a TSI condensation particle counter (Model 3771) under airborne measurement conditions. Aerosol Sci. Technol. 2011, 45, 272–283. [Google Scholar] [CrossRef]
  20. Lahde, T.; Giechaskiel, B.; Martini, G. Development of measurement methodology for Sub 23 Nm particle number (PN) Measurements. SAE Int. J. Adv. Curr. Pract. Mobil. 2020, 3, 551–560. [Google Scholar] [CrossRef]
  21. Giechaskiel, B.; Melas, A.D.; Lähde, T.; Martini, G. Non-volatile particle number emission measurements with catalytic strippers: A review. Vehicles 2020, 2, 19. [Google Scholar] [CrossRef]
  22. Amanatidis, S.; Ntziachristos, L.; Giechaskiel, B.; Katsaounis, D.; Samaras, Z.; Bergmann, A. Evaluation of an oxidation catalyst (“Catalytic Stripper”) in eliminating volatile material from combustion aerosol. J. Aerosol Sci. 2013, 57, 144–155. [Google Scholar] [CrossRef]
  23. Wang, X.; Grose, M.A.; Avenido, A.; Stolzenburg, M.R.; Caldow, R.; Osmondson, B.L.; Chow, J.C.; Watson, J.G. Improvement of engine exhaust particle sizer (EEPS) size distribution measurement—I. Algorithm and applications to compact-shape particles. J. Aerosol Sci. 2016, 92, 95–108. [Google Scholar] [CrossRef]
  24. Giechaskiel, B.; Zardini, A.A.; Lähde, T.; Perujo, A.; Kontses, A.; Ntziachristos, L. Particulate emissions of Euro 4 motorcycles and sampling considerations. Atmosphere 2019, 10, 421. [Google Scholar] [CrossRef] [Green Version]
  25. Silva, P.R.M.; Cunha, V.S.; de Carvalho Rocha, W.F.; Sarmanho, G.F.; Andrade, J.C.; Depieri, M. Use of proficiency testing schemes for motorcycle exhaust emissions laboratory: Brazilian experience. IET Sci. Meas. Technol. 2014, 8, 116–121. [Google Scholar] [CrossRef]
  26. Kontses, A.; Ntziachristos, L.; Zardini, A.A.; Papadopoulos, G.; Giechaskiel, B. Particulate emissions from L-category vehicles towards Euro 5. Environ. Res. 2020, 182, 109071. [Google Scholar] [CrossRef] [PubMed]
  27. Giechaskiel, B.; Melas, A. Emissions of a Euro 5 Motorcycle over the world harmonized motorcycle test cycle (WMTC). Combust. Engines 2021, 185, 21–25. [Google Scholar] [CrossRef]
  28. Yao, Y.-C.; Tsai, J.-H.; Ye, H.-F.; Chiang, H.-L. Comparison of exhaust emissions resulting from Cold- and Hot-start motorcycle driving modes. J. Air Waste Manag. Assoc. 2009, 59, 1339–1346. [Google Scholar] [CrossRef] [Green Version]
  29. Iodice, P.; Senatore, A. Exhaust emissions of new high-performance motorcycles in hot and cold conditions. Int. J. Environ. Sci. Technol. 2015, 12, 3133–3144. [Google Scholar] [CrossRef] [Green Version]
  30. Kumar, R.; Durai, B.K.; Saleh, W.; Boswell, C. Comparison and evaluation of emissions for different driving cycles of motorcycles: A note. Transp. Res. D Transp. Environ. 2011, 16, 61–64. [Google Scholar] [CrossRef]
  31. Rosenblatt, D.; Stokes, J.; Caffrey, C.; Brown, K.F. Effect of Driving Cycles on Emissions from On-Road Motorcycles; SAE International: Warrendale, PA, USA, 2020; no 2020-01–0377. [Google Scholar] [CrossRef]
  32. Yang, H.-H.; Dhital, N.B.; Cheruiyot, N.K.; Wang, L.-C.; Wang, S.-X. Effects of road grade on real-world tailpipe emissions of regulated gaseous pollutants and volatile organic compounds for a Euro 5 motorcycle. Atmos. Pollut. Res. 2021, 12, 101167. [Google Scholar] [CrossRef]
  33. Yao, Y.-C.; Tsai, J.-H.; Chiang, H.-L. Effects of ethanol-blended gasoline on air pollutant emissions from motorcycle. Sci. Total Environ. 2009, 407, 5257–5262. [Google Scholar] [CrossRef] [PubMed]
  34. Karavalakis, G.; Short, D.; Vu, D.; Villela, M.; Asa-Awuku, A.; Durbin, T.D. Evaluating the regulated emissions, air toxics, ultrafine particles, and black carbon from SI-PFI and SI-DI vehicles operating on different ethanol and iso-butanol blends. Fuel 2014, 128, 410–421. [Google Scholar] [CrossRef] [Green Version]
  35. Tesfa, B.; Gu, F.; Mishra, R.; Ball, A. Emission characteristics of a ci engine running with a range of biodiesel feedstocks. Energies 2014, 7, 334–350. [Google Scholar] [CrossRef]
  36. Niculescu, R.; Clenci, A.; Iorga-Siman, V. Review on the use of diesel–biodiesel–alcohol blends in compression ignition engines. Energies 2019, 12, 1194. [Google Scholar] [CrossRef] [Green Version]
  37. Li, G.; Bai, X.; Huo, S.; Huang, Z. Fast pyrolysis of lerdades for renewable biofuels. IET Renew. Power Gener. 2020, 14, 959–967. [Google Scholar] [CrossRef]
  38. Pérez, A.; Mateos, D.; García, C.; Caraveo, C.; Montero, G.; Coronado, M.; Valdez, B. Quantitative evaluation of the emissions of a transport engine operating with diesel-biodiesel. Energies 2020, 13, 3594. [Google Scholar] [CrossRef]
  39. Li, G.; Lu, Z.; Zhang, J.; Li, H.; Zhou, Y.; Mohammed Ibrahim Zayan, A.; Huang, Z. Life cycle assessment of biofuel production from microalgae cultivated in anaerobic digested wastewater. Int. J. Agric. Biol. Eng. 2020, 13, 241–246. [Google Scholar] [CrossRef] [Green Version]
  40. Mattarelli, E.; Rinaldini, C.; Savioli, T. Combustion analysis of a diesel engine running on different biodiesel blends. Energies 2015, 8, 3047–3057. [Google Scholar] [CrossRef] [Green Version]
  41. Wu, G.; Ge, J.C.; Choi, N.J. A comprehensive review of the application characteristics of biodiesel blends in diesel engines. Appl. Sci. 2020, 10, 8015. [Google Scholar] [CrossRef]
  42. Wu, Y.-Y.; Jang, C.-T. Combustion analysis of homogeneous charge compression ignition in a motorcycle engine using a dual-fuel with exhaust gas recirculation. Energies 2019, 12, 847. [Google Scholar] [CrossRef] [Green Version]
  43. Chen, P.-T.; Shen, D.-J.; Yang, C.-J.; Huang, K.D. Development of a hybrid electric motorcycle that accords energy efficiency and controllability via an inverse differential gear and power mode switching control. Appl. Sci. 2019, 9, 1787. [Google Scholar] [CrossRef] [Green Version]
  44. Giechaskiel, B.; Zardini, A.; Martini, G. Particle emission measurements from L-category vehicles. SAE Int. J. Engines 2015, 8, 2322–2337. [Google Scholar] [CrossRef]
  45. Giechaskiel, B.; Drossinos, Y. Theoretical investigation of volatile removal efficiency of particle number measurement systems. SAE Int. J. Engines 2010, 3, 1140–1151. [Google Scholar] [CrossRef]
  46. Vaaraslahti, K.; Virtanen, A.; Ristimäki, J.; Keskinen, J. Nucleation mode formation in heavy-duty diesel exhaust with and without a particulate filter. Environ. Sci. Technol. 2004, 38, 4884–4890. [Google Scholar] [CrossRef]
  47. Ristimäki, J.; Vaaraslahti, K.; Lappi, M.; Keskinen, J. Hydrocarbon condensation in heavy-duty diesel exhaust. Environ. Sci. Technol. 2007, 41, 6397–6402. [Google Scholar] [CrossRef]
  48. Yang, J.; Pham, L.; Johnson, K.C.; Durbin, T.D.; Karavalakis, G.; Kittelson, D.; Jung, H. Impacts of exhaust transfer system contamination on particulate matter measurements. Emiss. Control Sci. Technol. 2020, 6, 163–177. [Google Scholar] [CrossRef] [Green Version]
  49. Samaras, Z.; Andersson, J.; Aakko-Saksa, P.; Cuelenaere, R.; Mellios, G. Additional technical issues for Euro 7 (LDV) 2021. In Proceedings of the AGVES Meeting, Online, 27 October 2021; Available online: https://circabc.europa.eu/sd/a/fdd70a2d-b50a-4d0b-a92a-e64d41d0e947/CLOVE%20test%20limits%20AGVES%202020-10-27%20final%20vs2.pdf (accessed on 2 December 2021).
Figure 1. Experimental setup. The two configurations with open and closed transfer tube to the full dilution tunnel are shown in dashed lines. In blue are equipment used only at JRC 2020 campaign. CVS = Constant Volume Sampling; CS = catalytic stripper; EEPS = engine exhaust particle sizer; ET = evaporation tube; PM = particulate matter; SPN = solid particle number; TPN = total particle number.
Energies 14 08101 g001
Figure 2. Emissions of gaseous pollutants at the two laboratories (BOSMAL, JRC) at the two campaigns in 2017 and 2020 for cold start and hot start cycles: (a) CO2; (b) CO; (c) NOx; (d) HC (hydrocarbons). Dashed red lines show the Euro 4 limits applicable to this motorcycle, and green dashed lines the Euro 5.
Energies 14 08101 g002
Figure 3. Particulate matter (PM) mass and solid particle number >23 nm with the evaporation tube system (SPN23_ET) emissions.
Energies 14 08101 g003
Figure 4. Particulate emissions with open and closed configurations for cold start and hot start WMTCs: (a) Particulate matter (PM) mass for different configurations; (b) Solid (SPN) and total particle number (TPN) for various lower sizes (6, 10, 23 nm). For SPN the system with evaporation tube (ET) was used.
Energies 14 08101 g004
Figure 5. Comparisons of evaporation tube (ET) and catalytic stripper (CS) systems. Each point is a phase of the WMTC (see Figure A1 for cycle and its phases): (a) Differences of the two systems in function of emissions levels; (b) Ratio of SPN10/SPN23 for the two systems. SPN = solid particle number. WMTC = World Harmonized Test Cycle.
Energies 14 08101 g005
Figure 6. Real time solid particle number (SPN) emissions with the systems with evaporation tube (ET) and catalytic stripper (CS) from 23 nm or 10 nm.
Energies 14 08101 g006
Figure 7. Real time total particle number (TPN) or solid particle number (SPN) emissions with the open (o) and closed (c) configurations. ET = evaporation tube.
Energies 14 08101 g007
Figure 8. Total particle number >6 nm (TPN6) emissions of the third phase of the WMTC (World Harmonized Motorcycle Test Cycle) over consecutive tests.
Energies 14 08101 g008
Table 1. General overview of the measurement campaigns in 2017 and 2020. For the additional tests with “open configuration” setup, see Figure 1. “No PM, SPN23” means no measurements were taken for the specific pollutants.
Year/MonthLabFuelDriverCyclesComment
2017/02BOSMALEN 228 #1AWMTC cold & hotNo PM, SPN23
2017/03JRCEN 228 #1AWMTC cold & hotNo PM, SPN23
2020/10JRCEN 228 #2BWMTC cold & hot
2020/10JRCEN 228 #2BWMTC cold & hotOpen configuration
2020/11BOSMALEN 228 #2BWMTC cold & hot
PM = particulate matter; SPN = solid particle number; WMTC = world harmonized test cycle.
Table 2. EN 228-compliant fuel specifications.
PropertyLimits20172020
RON≥9595.095.4
MON≥8586.885.2
Density (at 15 °C) (kg/m3)720–775736.3740.0
Sulfur content (mg/kg)≤101.16.5
Maximum oxygen content2.7% (m/m)1.9%2.0%
Ethanol<12% (v/v)4.7%4.9%
m = mass; v = volume.
Table 3. Characteristics of the motorcycle.
ModelBMW R 1200 GS
Swept volume1170 cm3
Maximum engine power92 kW (7750 rpm)
AftertreatmentThree-way catalyst (TWC)
Mileage 2017 and 20202645 km and 4520 km
Emission levelEuro 4
Table 4. Overview of measurement instrumentation.
EquipmentBOSMALJRC
Chassis dynamometerAVL Zoellner 48″AVL Zoellner 48″
Gas analyzersHoriba MEXA 7400AVL AMA i60
Dilution tunnelHoriba CVS 7400 SCGM 308
Particle numberHoriba SPCS 2100AVL APC 489
Table 5. Mean values and variance (as standard deviation of means, i.e., coefficient of variance) of the (four) measurements in 2017 and 2020 with the two laboratories. For PM and SPN23 only two measurements were available (in 2020).
WMTCCO2
g/km
CO
mg/km
NOx
mg/km
HC
mg/km
PM
mg/km
SPN23_ET
#/km
Cold start109.748815.589.80.71.3 × 1011
0.5%6.9%11.1%5.5%50%4%
Hot start105.91578.551.71.00.5 × 1011
0.5%6.2%18.7%13.4%60%19%
PM = particulate matter; SPN = solid particle number.
Table 6. Differences between open and closed configurations.
WMTCCO2
g/km
CO
mg/km
NOx
mg/km
HC
mg/km
PM
mg/km
SPN23_ET
#/km
SPN10_ET
#/km
TPN6
#/km
Cold closed109.547318961.11.3 × 10114.5 × 1011305 × 1011
Cold open109.4492161011.11.5 × 10115.3 × 101189 × 1011
Difference−0.1%4.0%−13.0%4.6%−4.3%14.7%17.8%−71.0%
Hot closed105.514311621.520.4 × 10113.3 × 1011311 × 1011
Hot open104.81508560.670.5 × 10112.8 × 101195 × 1011
Difference−0.6%5.4%−26.4%−8.5%−56.2%21.0%−14.6%−69.6%
PM = particulate matter; SPN = solid particle number; TPN = total particle number.
Publisher’s Note: MDPI stays neutral with regard to jurisdictional claims in published maps and institutional affiliations.

